sst versus solvency ii comparison analysis - swissre.com · sst and solvency ii are equivalent but...
TRANSCRIPT
SST versus Solvency II –Comparison analysis29 April 2016

SST and Solvency II are equivalent but not equal
2
• Swiss Re Group has been operating under the Swiss Solvency Test (SST) since 2008. SST became legally binding for all Swiss insurance and reinsurance companies in 2011
• In 2015, the European Union recognised the Swiss insurance supervision system as the first regime to be fully equivalent with Solvency II
• Swiss Re supports Solvency II and benefits from extensive experience in risk modelling and economic valuation
• Both SST and Solvency II represent very similar risk-based, market consistent solvency regimes. Although the two solvency regimes are equivalent, they differ with respect to the applied methodology
• This presentation translates Swiss Re’s Group SST 2016 ratio into a comparable Group Solvency II ratio and highlights key methodological differences between the two regimes
• SST is a conservative economic solvency regime. Given our economic risk profile, Swiss Re’s comparable Group Solvency II ratio is estimated to be around 90 percentage points higher than the Group SST 2016 ratio
• The comparison is based on the Group’s consolidated economic balance sheet and risk profile, as well as the EU Solvency II requirements as implemented for our legal entities in Luxembourg. The comparison was produced on a best effort basis using Swiss Re's SST calculation for 2016

SST and Solvency II are both comprehensive, economic and risk-based solvency regimes:
SST and Solvency II have many similarities but also important differences
3
Economic balance sheetSolvency Ratio =
Available Capital
Market value of Assets
Market value of
Liabilities
Economic Equity
Required Capital
Regulatory Excess
Loss
Economic Equity = capital held to pay for large, unexpected losses
Swiss Re uses its proprietary internal model to determine required capital under SST and Solvency II as authorized by both FINMA and CAA1
Regulatory Excess = excess held above regulatory required capital
Profit
Probability
Available Capital
Required Capital
Several methodological differences between SST and Solvency II can lead to significant divergence of solvency ratios
Economic
Key methodological differences impacting economic balance sheet and/or solvency ratio:
1. Capital cost recognition2. Risk measure (1-year risk)3. Modelling differences4. Valuation (discounting)5. Eligibility of capital2
6. Deferred taxes
Swiss Re does not use long-term guarantee measures (eg, transitionals, volatility/matching adjustments) or deduction and aggregation method when calculating the comparison of Solvency II and SST on a Group basis.
Risk-based
1 Commissariat aux Assurances (CAA), Luxembourg regulator2 No impact as debt issued under SST either qualifies for available own funds, or would otherwise be structured to qualify under Solvency II

0%
50%
100%
150%
200%
250%
300%
350%
GroupSST 2016
ratio
Capital costrecognition
Risk measure(1-year risk)
Modellingdifferences
Valuation(discounting)
Eligibility ofcapital
Deferred taxes GroupSolvency II
ratio
Swiss Re’s Group Solvency II ratio is significantly higher than our SST 2016 ratio
4
312%
223%
Solvency ratio
assumed the same as SST 1
1 No impact as debt issued under SST either qualifies for available own funds, or would otherwise be structured to qualify under Solvency II
+38%pts
+42%pts
−10%pts− 18%pts
+37%pts
Difference between Swiss Re Group SST and comparable Solvency II ratio is estimated to be around 90%pts

5
Impact of capital cost recognition SST adds run-off capital costs to available and required capital, while Solvency II does not
5
Impact of capital costs on Solvency II balance sheet
Description of implications
• Run-off capital costs represent the cost that is needed to compensate for regulatory required capital during the run-off of the liabilities
• Under SST and Solvency II, run-off capital costs are part of insurance liabilities. However, under SST, they are added to available and required capital
Assets
Available Capital
Assets Liabilities(incl. capital
costs)
SST balance sheet
Required Capital
Regulatory Excess
Available Capital
Regulatory Excess
Required Capital
Liabilities(incl. capital
costs)
Run-off Capital Costs
Run-off Capital Costs
<
Impact from adjusting for difference in run-off capital costs under Solvency II
Available Capital + Run-off Capital CostsRequired Capital + Run-off Capital Costs
Available CapitalRequired Capital
1
1 Formula true as long as Available Capital > Required Capital
Not adding the run-off capital costs increases Swiss Re’s solvency ratio by 38%pts
6
LiabilitiesAssets
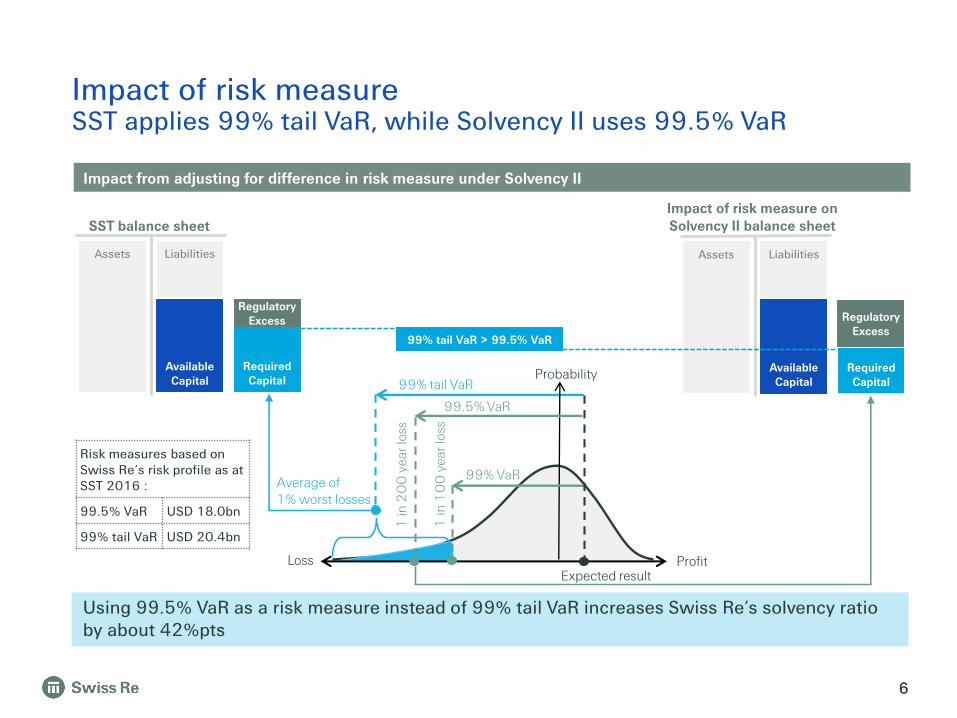
Impact of risk measure SST applies 99% tail VaR, while Solvency II uses 99.5% VaR
6
Assets Liabilities
Required Capital
Regulatory Excess
Available Capital
Regulatory Excess
Required Capital
SST balance sheetImpact of risk measure on Solvency II balance sheet
Available CapitalAvailable
Capital
99% tail VaR > 99.5% VaR
Risk measures based on Swiss Re’s risk profile as at SST 2016 :
99.5% VaR USD 18.0bn
99% tail VaR USD 20.4bn
Impact from adjusting for difference in risk measure under Solvency II
Expected result
1 in
20
0 y
ea
r lo
ss99% tail VaR
99% VaR
Probability
ProfitLoss
1 in
10
0 y
ea
r lo
ss
Average of 1% worst losses
99.5% VaR
Using 99.5% VaR as a risk measure instead of 99% tail VaR increases Swiss Re’s solvency ratio by about 42%pts

7
Impact of modelling differencesSome risks are modelled differently under Solvency II
7
Description of implications
• Run-off capital costs under SST are based on a different risk measure (tail VaR vs VaR) and a different, prescribed diversification calculation. Swiss Re’s SST Market Value Margin is smaller than the Solvency II Risk Margin
• Operational risk is not explicitly modelled under SST unlike under Solvency II and thus increases required capital
SST Solvency II
Available capitalRun-off capital costs
Market Value Margin:• Tail VaR• Group-level diversification
Risk Margin:• VaR• no Group-level diversification
Required capital
Required capital Operational risk Not explicitly quantified Quantified
Additional noteSwiss Re reflects sovereign credit risk in its internal model. This is consistent with the latest EIOPA opinion.
Under Solvency II, credit spread risk can be significantly dampened where the regulator allows application of deduction and aggregation method or long-term guarantee measures. However, Swiss Re has not included these measures for the purposes of this Group Solvency II comparison.
Based on Swiss Re’s current risk profile, the different treatment of modelled risks decreases Swiss Re’s solvency ratio by 10%pts
8
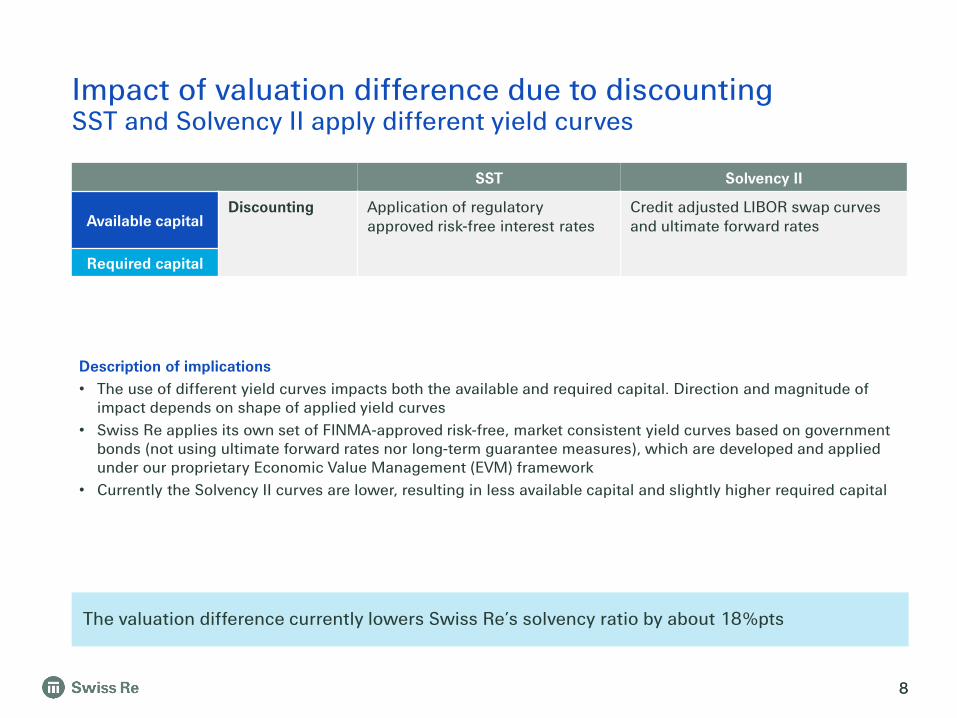
Impact of valuation difference due to discounting SST and Solvency II apply different yield curves
8
Description of implications
• The use of different yield curves impacts both the available and required capital. Direction and magnitude of impact depends on shape of applied yield curves
• Swiss Re applies its own set of FINMA-approved risk-free, market consistent yield curves based on government bonds (not using ultimate forward rates nor long-term guarantee measures), which are developed and applied under our proprietary Economic Value Management (EVM) framework
• Currently the Solvency II curves are lower, resulting in less available capital and slightly higher required capital
SST Solvency II
Available capitalDiscounting Application of regulatory
approved risk-free interest ratesCredit adjusted LIBOR swap curves and ultimate forward rates
Required capital
The valuation difference currently lowers Swiss Re’s solvency ratio by about 18%pts

9
Available Capital
Liabilities(incl. DTL)
Assets
Loss Absorbing Capacities of DTL1
Deferred Tax Liabilities (DTL) 1
Impact of deferred taxes SST is pre-tax, while Solvency II is post-tax
9
Assets Liabilities(excl. DTL)
Required Capital
Regulatory Excess Regulatory
Excess
Required Capital
SST balance sheetImpact of deferred taxes on Solvency II balance sheet
Description of implications
• Deferred tax liabilities represent taxes to be paid because of future profits that are already recognized in the economic balance sheet
• As SST is pre-tax, it does not take into account deferred taxes. Solvency II uses a post-tax view, whereby deferred taxes are part of the liabilities. This reduces available capital. At the same time, the loss absorbing capacity of deferred taxes reduces the Solvency II required capital
• In most cases the solvency ratio increases when including the tax effect, even though the impact on required capital is usually smaller than the impact on available capital
Available CapitalAvailable
Capital
1 Under Solvency II, regulators allow insurers to consider deferred tax liabilities (DTL) for loss absorption, but the recognition of deferred tax assets varies. Therefore, this presentation only looks at the impact of DTL
Impact from adjusting for the different treatment of tax under Solvency II
Applying a post-tax view increases Swiss Re’s solvency ratio by about 37%pts

• SST and Solvency II are both comprehensive, economic and risk-based solvency regimes. Although equivalent, the two regimes have important differences
• Due to differences in methodology, an SST ratio translates into a Solvency II ratio that can be significantly higher. For 2016, Swiss Re’s Group comparable Solvency II ratio is 312%, ie almost 90%pts higher than the Group 2016 SST ratio of 223%
• Swiss Re is very strongly capitalised under SST and Solvency II
• Swiss Re has been actively engaged in SST and Solvency II discussions and works closely with regulators and clients around the world in the development and convergence of economic solvency regimes
Conclusion
10

Appendix
11
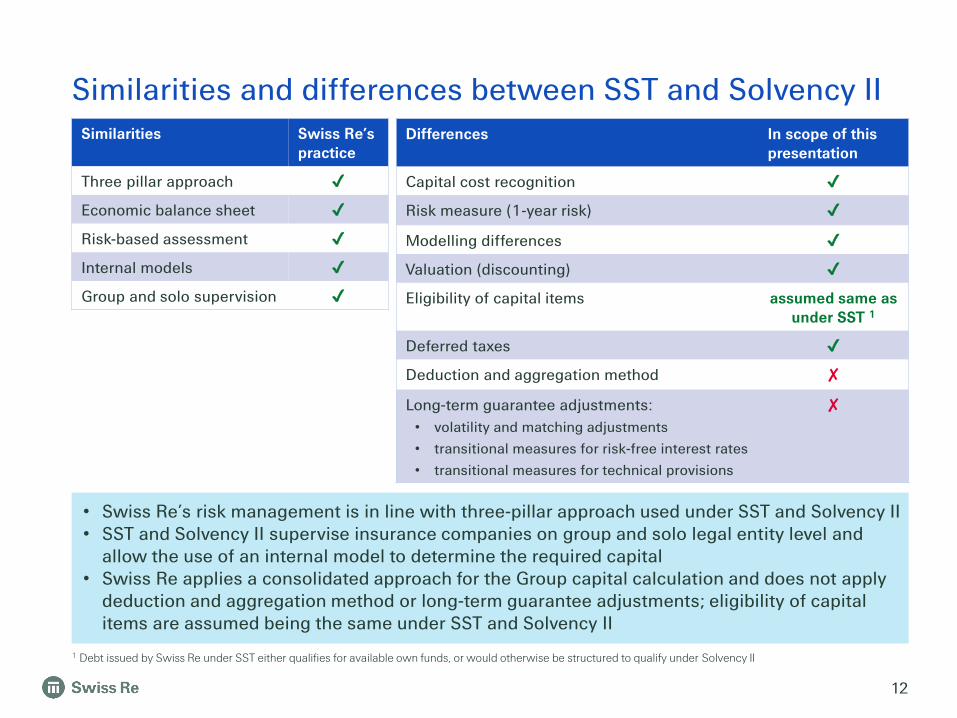
Similarities and differences between SST and Solvency II
12
Similarities Swiss Re’s practice
Three pillar approach ✔
Economic balance sheet ✔
Risk-based assessment ✔
Internal models ✔
Group and solo supervision ✔
Differences In scope of this presentation
Capital cost recognition ✔
Risk measure (1-year risk) ✔
Modelling differences ✔
Valuation (discounting) ✔
Eligibility of capital items assumed same as under SST 1
Deferred taxes ✔
Deduction and aggregation method ✘
Long-term guarantee adjustments:
• volatility and matching adjustments
• transitional measures for risk-free interest rates
• transitional measures for technical provisions
✘
• Swiss Re’s risk management is in line with three-pillar approach used under SST and Solvency II• SST and Solvency II supervise insurance companies on group and solo legal entity level and
allow the use of an internal model to determine the required capital• Swiss Re applies a consolidated approach for the Group capital calculation and does not apply
deduction and aggregation method or long-term guarantee adjustments; eligibility of capital items are assumed being the same under SST and Solvency II
1 Debt issued by Swiss Re under SST either qualifies for available own funds, or would otherwise be structured to qualify under Solvency II
Swiss Re uses the same internal model under SST and Solvency II
13
Swiss Re has extensive experience in risk modelling
• Swiss Re uses a central proprietary integrated risk model to measure the Group’s capital requirements, for defining risk tolerance, risk limits and liquidity stress tests
• Swiss Re’s internal model is also used for regulatory reporting under SST and Solvency II (in continental Europe); both the Swiss regulator (FINMA) and Luxembourg’s regulator (CAA) have provided regulatory approval
• The internal model enables a holistic assessment of Swiss Re’s risks in order to better understand and quantify risk dependencies and diversification effects
• Swiss Re’s internal model and parameters are continuously reviewed and updated to reflect changes in the risk environment and current best practice
Internal models are crucial for global re/insurers’ sound risk management and business steering
• Global assessment of risks (in contrast to standard formula) and effective measurement of diversification impact
• Incentives for effective risk management
• Thorough model governance and validation
• Systematic steering of the Group’s risk exposure
• Close and continuous risk dialogue with regulators through model approval

14
Property & Casualty Life & Health Financial market Credit
• Costing and reserving• Inflation• Man-made risks• Natural catastrophes
• Lethal pandemic• Longevity• Mortality trend
• Credit spread risk• Equity market risk• Interest rate risk• Foreign exchange risk• Real estate risk• Financial market inflation
• Credit default risk• Credit migration risk
USD 9.2 bn USD 7.5 bn USD 12.8 bn USD 4.0 bn
Simple sum USD 33.5 bn
Diversification effect – USD 13.1 bn
Group total risk SST 2016(based on one-year 99% tail VaR as of SST 2016)
USD 20.4 bn
Swiss Re uses the following four risk categories:
Swiss Re’s risk categorisation and limits of comparability
• Swiss Re’s internal risk model takes account of the accumulation and diversification between individual risks
• Diversification effect at category level represents the difference between the Group 99% tail VaR and the sum of standalone tail VaR in the individual risk categories
• Extent of diversification largely determined by the selected level of aggregation
99% tail VaR:
As the composition of risk categories impacts the diversification effect, comparability of the categories’ tail VaR amount among insurance companies is limited

Investor Relations contacts
Hotline E-mail+41 43 285 4444 [email protected]
Philippe Brahin Jutta Bopp Manfred Gasser+41 43 285 7212 +41 43 285 5877 +41 43 285 5516
Chris Menth Iunia Rauch-Chisacof+41 43 285 3878 +41 43 285 7844
Corporate calendar & contacts
Corporate calendar
201629 July Second Quarter 2016 Results Conference call3 November Third Quarter 2016 Results Conference call2 December Investors’ Day Zurich
201723 February Annual Results 2016 Conference call
15

Certain statements and illustrations contained herein are forward-looking. These statements (including as to plans objectives, targets and trends) and illustrations provide current expectations of future events based on certain assumptions and include any statement that does not directly relate to a historical fact or current fact.
Forward-looking statements typically are identified by words or phrases such as “anticipate“, “assume“, “believe“, “continue“, “estimate“, “expect“, “foresee“, “intend“, “may increase“ and “may fluctuate“ and similar expressions or by future or conditional verbs such as “will“, “should“, “would“ and “could“. These forward-looking statements involve known and unknown risks, uncertainties and other factors, which may cause Swiss Re’s actual results of operations, financial condition, solvency ratios, capital or liquidity positions or prospects to be materially different from any future results of operations, financial condition, solvency ratios, capital or liquidity positions or prospects expressed or implied by such statements or cause Swiss Re to not achieve its published targets. Such factors include, among others:
• further instability affecting the global financial system and developments related thereto;
• deterioration in global economic conditions;
• Swiss Re’s ability to maintain sufficient liquidity and access to capital markets, including sufficient liquidity to cover potential recapture of reinsurance agreements, early calls of debt or debt-like arrangements and collateral calls due to actual or perceived deterioration of Swiss Re’s financial strength or otherwise;
• the effect of market conditions, including the global equity and credit markets, and the level and volatility of equity prices, interest rates, credit spreads, currency values and other market indices, on Swiss Re’s investment assets;
• changes in Swiss Re’s investment result as a result of changes in its investment policy or the changed composition of its investment assets, and the impact of the timing of any such changes relative to changes in market conditions;
• uncertainties in valuing credit default swaps and other credit-related instruments;
• possible inability to realise amounts on sales of securities on Swiss Re’s balance sheet equivalent to their mark-to-market values recorded for accounting purposes;
• the outcome of tax audits, the ability to realise tax loss carryforwards and the ability to realise deferred tax assets (including by reason of the mix of earnings in a jurisdiction or deemed change of control), which could negatively impact future earnings;
• the possibility that Swiss Re’s hedging arrangements may not be effective;
• the lowering or loss of one of the financial strength or other ratings of one or more Swiss Re companies, and developments adversely affecting Swiss Re’s ability to achieve improved ratings;
• the cyclicality of the reinsurance industry;
• uncertainties in estimating reserves;
• uncertainties in estimating future claims for purposes of financial reporting, particularly with respect to large natural catastrophes, as significant uncertainties may be involved in estimating losses from such events and preliminary estimates may be subject to change as new information becomes available;
• the frequency, severity and development of insured claim events;
• acts of terrorism and acts of war;
• mortality, morbidity and longevity experience;
• policy renewal and lapse rates;
• extraordinary events affecting Swiss Re’s clients and other counterparties, such as bankruptcies, liquidations and other credit-related events;
• current, pending and future legislation and regulation affecting Swiss Re or its ceding companies, and the interpretation of legislation or regulations by regulators;
• legal actions or regulatory investigations or actions, including those in respect of industry requirements or business conduct rules of general applicability;
• changes in accounting standards;
• significant investments, acquisitions or dispositions, and any delays, unexpected costs or other issues experienced in connection with any such transactions;
• changing levels of competition; and
• operational factors, including the efficacy of risk management and other internal procedures in managing the foregoing risks.
These factors are not exhaustive. Swiss Re operates in a continually changing environment and new risks emerge continually. Readers are cautioned not to place undue reliance on forward-looking statements. Swiss Re undertakes no obligation to publicly revise or update any forward-looking statements, whether as a result of new information, future events or otherwise.
This communication is not intended to be a recommendation to buy, sell or hold securities and does not constitute an offer for the sale of, or the solicitation of an offer to buy, securities in any jurisdiction, including the United States. Any such offer will only be made by means of a prospectus or offering memorandum, and in compliance with applicable securities laws.
16
Cautionary note on forward-looking statements