st james building 79 oxford street manchester es adde… · · 2011-08-06st james building 79...
TRANSCRIPT
TTHC Ltd – the Traffic, Transport & Highway Consultancy
Manchester St James Building 79 Oxford Street Manchester M1 6EJ
www.tthc.co.uk / www.tthc.com
TTHC Ref: M10061-01TR Date: April 2011 © COPYRIGHT: The contents of this document must not be copied or reproduced in whole or in part without the
written consent of TTHC
PROPOSED FOODSTORE,
HAYLE
(Wm Morrison Supermarket plc)
SUPPLEMENTARY TRANSPORT REPORT
Liverpool Oriel Chambers No.14 Water Street Liverpool L2 8TD
Bristol Bristol Castlemead Lower Castle Street Bristol BS1 3AG
London 3rd Floor 1 Berkeley Street London W1J 8DJ
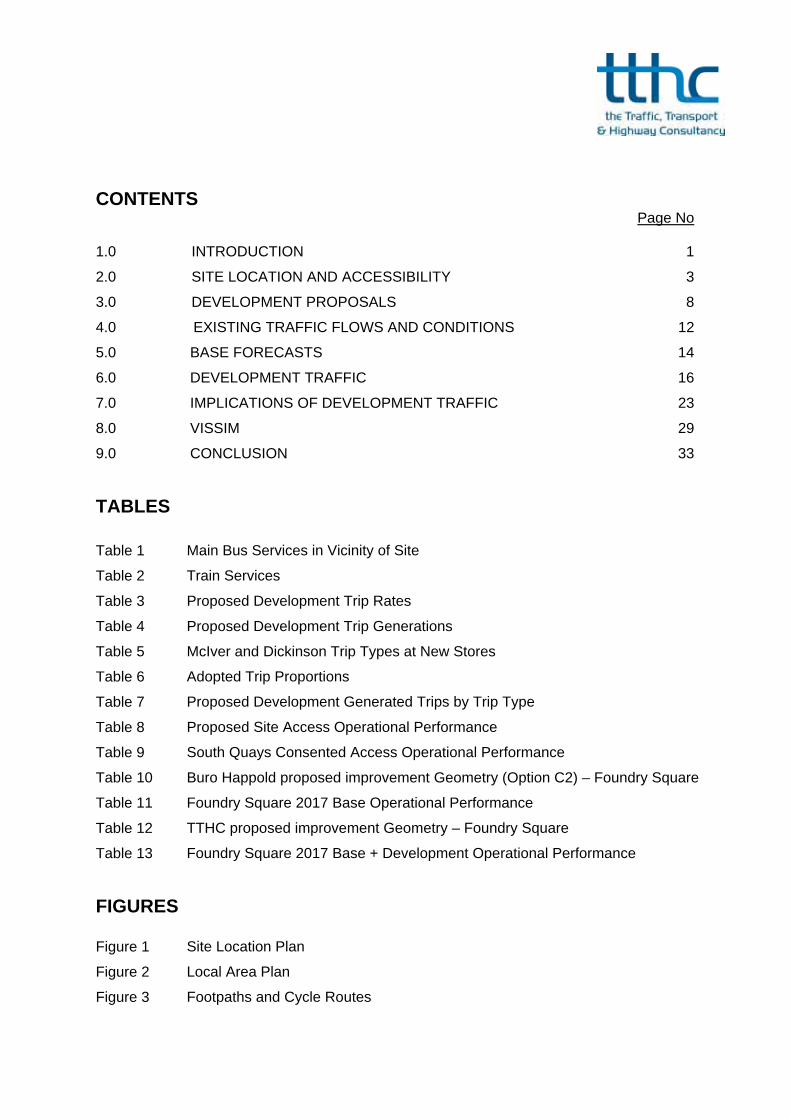
CONTENTS Page No 1.0 INTRODUCTION 1
2.0 SITE LOCATION AND ACCESSIBILITY 3
3.0 DEVELOPMENT PROPOSALS 8
4.0 EXISTING TRAFFIC FLOWS AND CONDITIONS 12
5.0 BASE FORECASTS 14
6.0 DEVELOPMENT TRAFFIC 16
7.0 IMPLICATIONS OF DEVELOPMENT TRAFFIC 23
8.0 VISSIM 29
9.0 CONCLUSION 33
TABLES
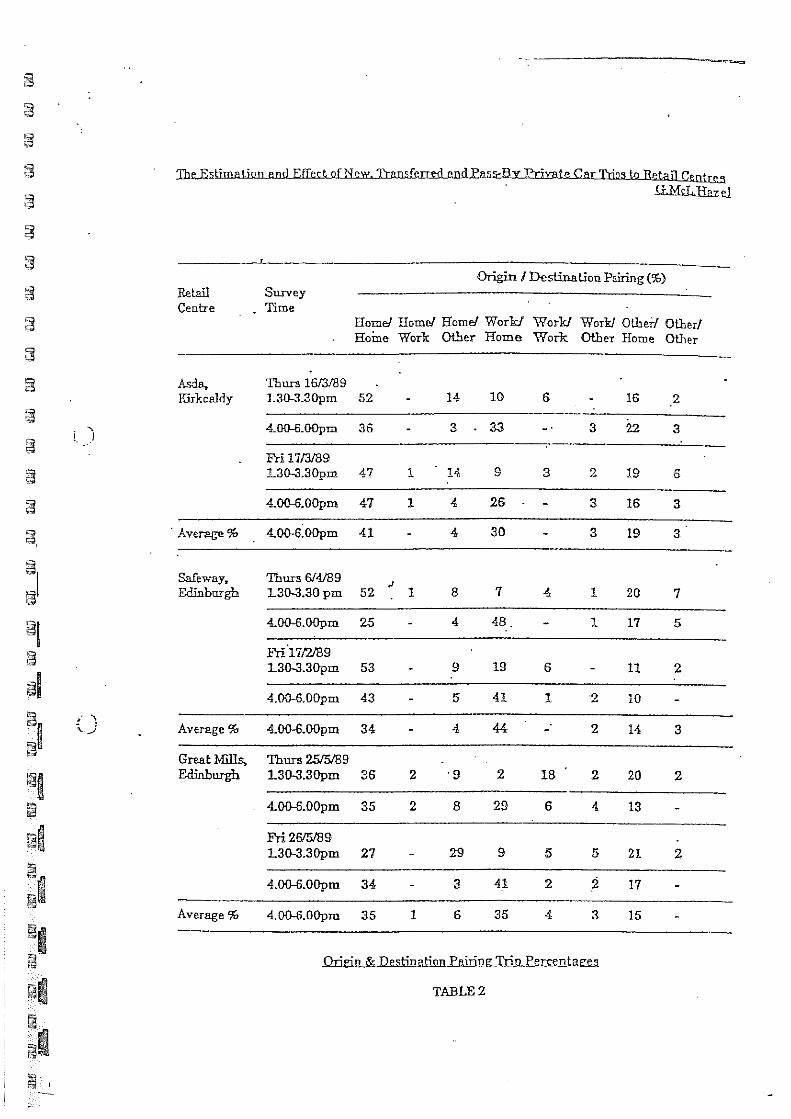
Table 1 Main Bus Services in Vicinity of Site
Table 2 Train Services
Table 3 Proposed Development Trip Rates
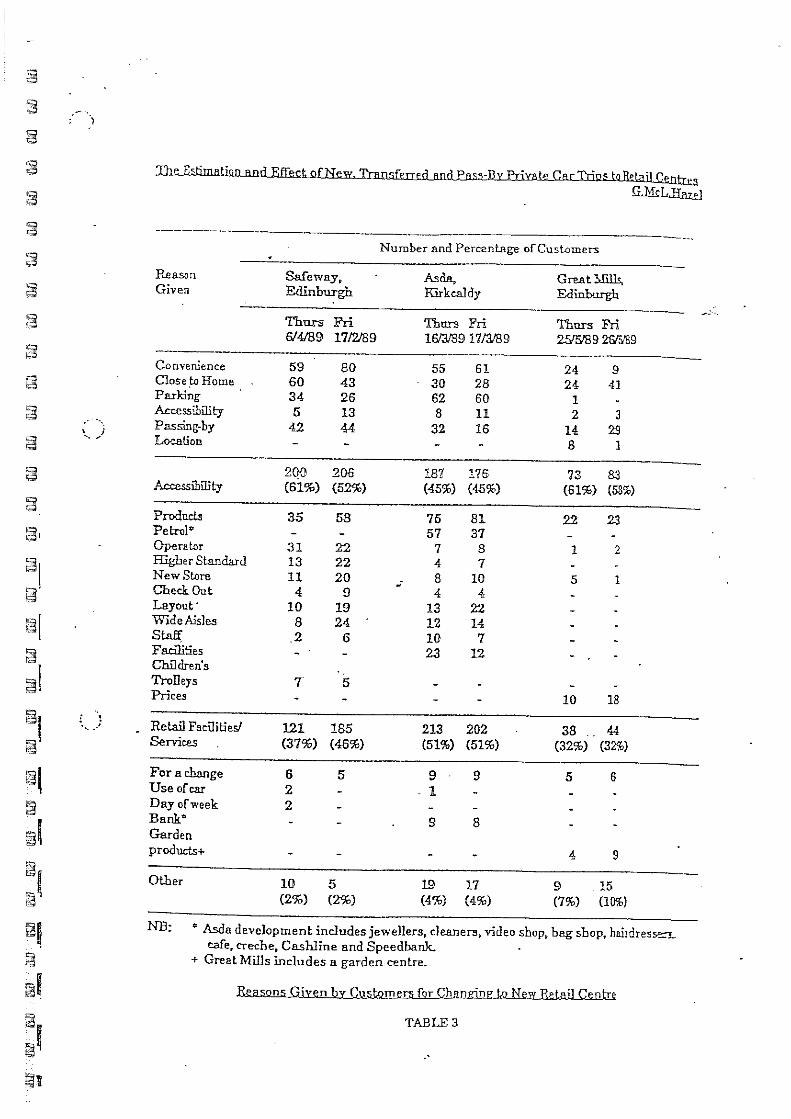
Table 4
Table 5
Proposed Development Trip Generations
McIver and Dickinson Trip Types at New Stores
Table 6 Adopted Trip Proportions
Table 7 Proposed Development Generated Trips by Trip Type
Table 8 Proposed Site Access Operational Performance
Table 9 South Quays Consented Access Operational Performance
Table 10
Table 11
Buro Happold proposed improvement Geometry (Option C2) – Foundry Square
Foundry Square 2017 Base Operational Performance
Table 12 TTHC proposed improvement Geometry – Foundry Square
Table 13 Foundry Square 2017 Base + Development Operational Performance
FIGURES
Figure 1 Site Location Plan
Figure 2 Local Area Plan
Figure 3 Footpaths and Cycle Routes
Figure 4 PPG13 Catchment Areas
Figure 5 Existing Bus Services
Figure 6 Enhanced Linkage Plan
Figure 7 Existing PM Peak Traffic Flows (Vehicles)
Figure 8 Existing PM Peak Traffic Flows (PCUs)
Figure 9 2017 Growth Flows PM Peak
Figure 10 Committed Development Flows
Figure 11 2017 Base Flows PM Peak
Figure 12 Total Proposed Development Flows
Figure 13 2017 Jewsons Flows
Figure 14 The Net Additional Trips
Figure 15 2017 Base + Development
APPENDICES
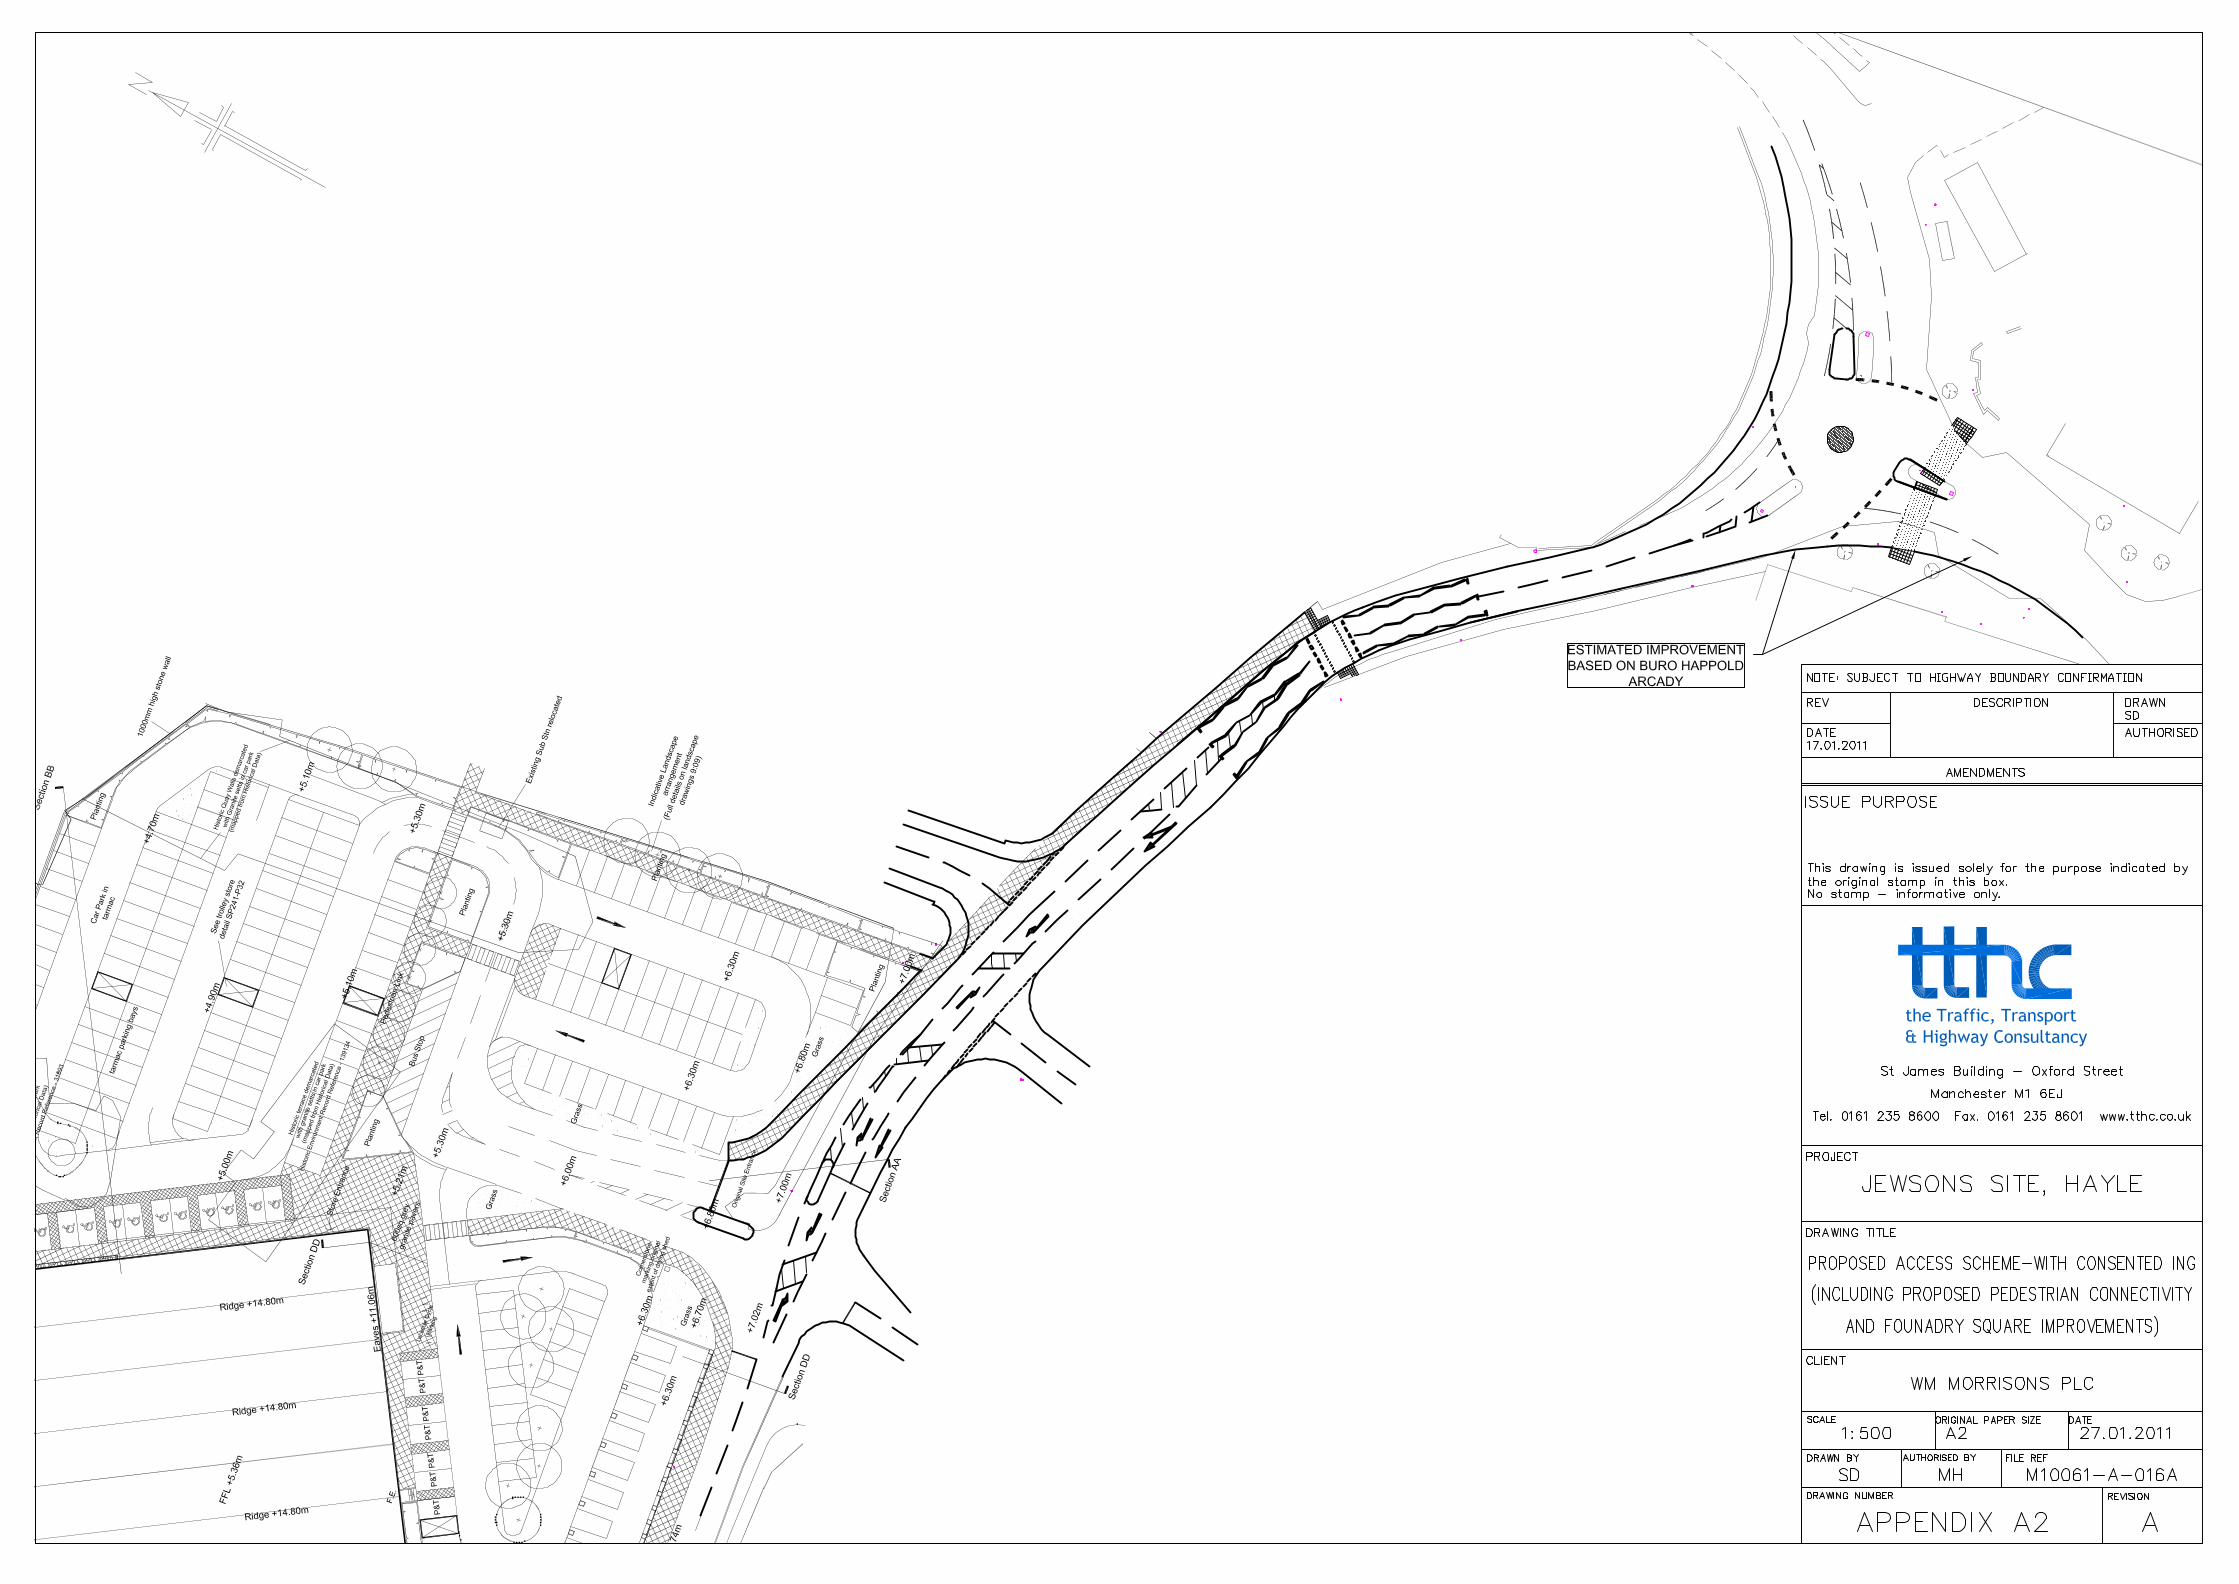
Appendix A Proposed Access and Highway Improvement Scheme Plans
Appendix B CCC count data – Foundry Square
Appendix C ADL HGV information at Foundry Square
Appendix D ADL count data – Jewson’s Access
Appendix E TRICS data
Appendix F McIver & Dickinson Research Report
Appendix G TTHC Gravity Model – New Trips
Appendix H Distribution of Transferred Trips for each Zone
Appendix I Proposed Development Flows for each Individual Trip Type
Appendix J Proposed Site Access LINSIG Output
Appendix K South Quays Consented PICADY Output
Appendix L Foundry Square mini-roundabout ARCADY Output
Appendix M VISSIM output
PROPOSED FOOD SUPERSTORE DEVELOPMENT HAYLE SUPPLEMENTARY TRANSPORT REPORT
APRIL 2011 Page 1 M10061-01 TR
1.0 INTRODUCTION
1.1 This Transport Report (TR) has been prepared by TTHC Ltd on behalf of Wm
Morrison Supermarkets plc (Morrisons) in connection with an outline planning
application on the existing Jewsons Builders Merchants site off Carnsew
Road, Hayle.
1.2 The application site (the ‘Site’), lies close to the western side of Hayle town
centre.
1.3 The application proposes a redevelopment of the Jewson builders merchants
for a new A1 food store unit of approximately 3,355m2 (36,115ft2) Gross Floor
Area (GFA) and 1,858m2 (20,000ft2) of Retail Floor area (RFA).
1.4 A planning application for a foodstore on this Site was submitted to Cornwall
County Council (CCC) in April 2010 (application reference: W1/10-0413).
Included in the submission was a Transport Assessment (TA) undertaken by
ADL Traffic Engineering Ltd on behalf of the Applicant, Actoris. An updated
TA was submitted by ADL in September 2010.
1.5 In November 2010, Morrisons requested TTHC to assist with the
development of the access scheme for the store. TTHC subsequently had
discussions and meetings with CCC regarding a revised access scheme and
the impact the proposed development will have on the surrounding network
with the consented development flows associated with the Hayle Harbour
Masterplan Development (ref: W1/08-0613). Technical notes and plans were
submitted to CCC to respond to the Council’s requests.
1.6 Following the decision to defer the application at the February Committee, a
further meeting was held on 1st March 2011 with CCC to discuss all
outstanding highway related issues. At this meeting, CCC said that in order to
be satisfied the foodstore proposals could operate in conjunction with the
consented development on the adjacent ING site they would like to see a
VISSIM microsimulation model of the proposals. CCC also requested further

PROPOSED FOOD SUPERSTORE DEVELOPMENT HAYLE SUPPLEMENTARY TRANSPORT REPORT
APRIL 2011 Page 2 M10061-01 TR
details of the pedestrian linkage proposals, specifically the width of the
footway improvements on the south side of Carnsew Road.
1.7 This particular report therefore pulls together the work undertaken by TTHC
and provides details of the TTHC assessments including the VISSIM work
and further information in respect of pedestrian linkage.
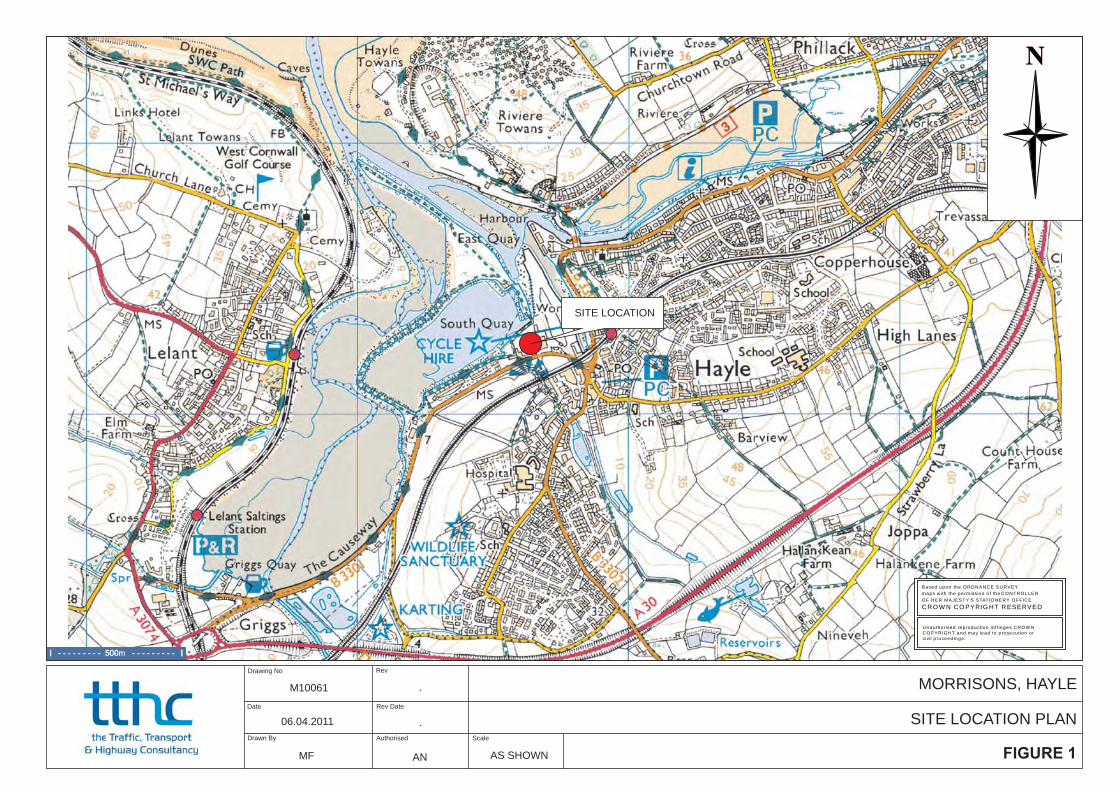
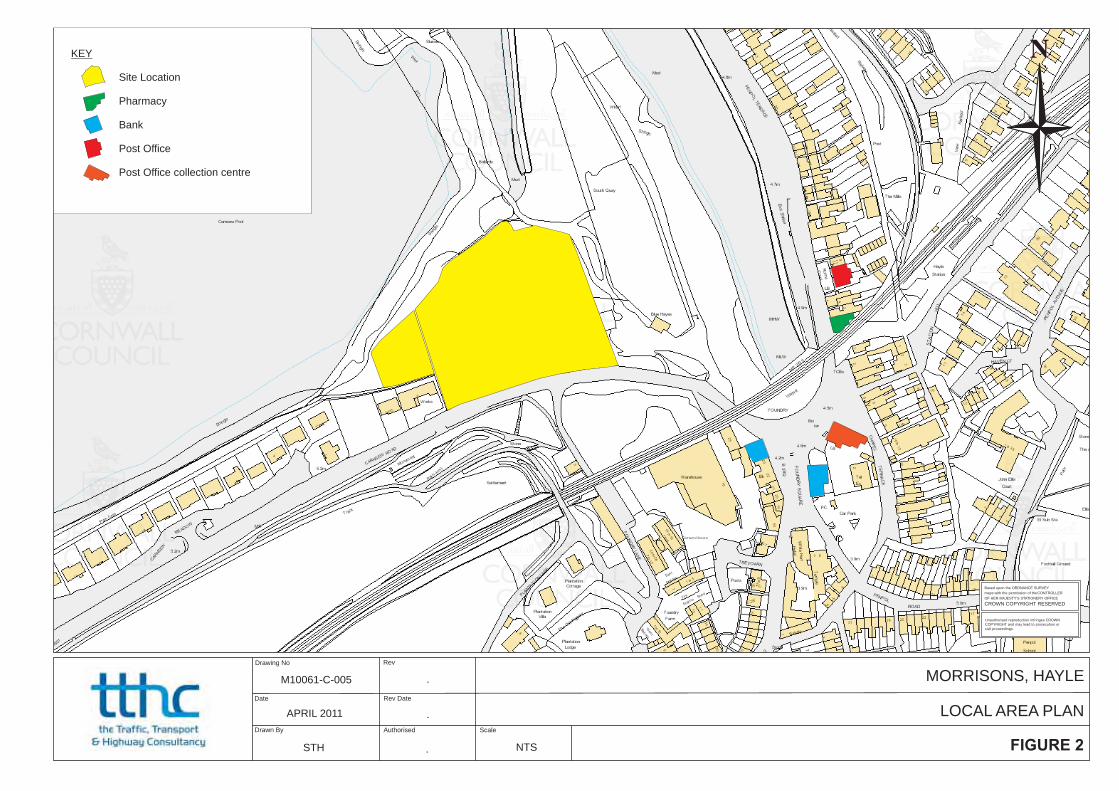
1.8 The location of the Site is indicated in Figure 1, and its local area is
presented in Figure 2.
1.9 The remainder of this report provides information under the following
headings:
Site Location and Accessibility;
Development Proposals;
Existing Traffic Flows and Conditions;
Base Forecasts;
Development Traffic;
Implications of Development Traffic and
VISSIM
1.10 We will commence with site location and its accessibility.
PROPOSED FOOD SUPERSTORE DEVELOPMENT HAYLE SUPPLEMENTARY TRANSPORT REPORT
APRIL 2011 Page 3 M10061-01 TR
2.0 SITE LOCATION AND ACCESSIBILITY
General Locality
2.1 The Site is located to the west of Hayle town centre, as indicated in Figure 1.
2.2 The Site is currently occupied by Jewsons builders merchant and comprises
both covered and open storage area for building materials. There are six
buildings in total - the building adjacent to Carnsew Road is listed. The
existing GFA of the Site is approximately 3,600sqm.
2.3 The Site is bounded to the north by the Hayle coastline and to the south by
B3301 Carnsew Road. To the west there are residential properties and to the
east there is land to be developed for the Hayle Harbour Scheme (ref: W1/08-
0613). This is referred to throughout this report as the ING consent.
2.4 The Site’s location adjacent to the Carnsew Road maximises the potential for
pass-by and linked trips, allowing shoppers to combine with other journey
purpose (such as work to home trip), and without any significant diversion
from the normal route. This is a key benefit of the proposed foodstore location
as many of its customers will be making journey past the store in any event,
which will help to meet Government objectives of minimising vehicle mileage.
Local Highway Network
2.5 Figure 1 shows the highway network surrounding the Site. Carnsew Road
provides access to the Site and is one of the main routes into the town centre.
The road is a single carriageway and serves a local distribution function. As
shown in Figure 1 the B3301 connects with the A30 on the periphery of Hayle
at Loggans Mill to the north and continues south to rejoin the A30 at St Erths
roundabout.

PROPOSED FOOD SUPERSTORE DEVELOPMENT HAYLE SUPPLEMENTARY TRANSPORT REPORT
APRIL 2011 Page 4 M10061-01 TR
2.6 Within the vicinity of the Site Carnsew Road is approximately 7m in width and
is subject to a 30mph speed limit. There is a footway and street lighting on
the northern side.
2.7 Opposite the Jewsons site is Foundry Lane. Foundry Lane is a narrow lane
approximately 5m in width. Foundry Lane connects Carnsew Road to B3302
Foundry Hill. The road is unsuitable for vehicles over 14’9” in height. At the
junction Foundry Lane / Carnsew Road there is currently poor visibility. Given
its constraints, Foundry Lane serves a local access road function and as such
is very lightly trafficked.
2.8 Approximately 150m to the east of the Site, Carnsew Road is crossed by the
railway and then connects with the B3301 Penpol Terrace at a three armed
mini-roundabout (Foundry Square). This junction is to be improved in
conjunction with the ING consent.
Existing Pedestrian and Cycle Links
2.9 While walk and cycle modal share for foodstore customers is generally small,
owing to the limitations of carrying heavy shopping, the application site is
surrounded by residential areas, and this particularly provides staff living in
these areas, with the opportunity to walk or cycle to the proposed store.
2.10 Along Carnsew Road within the vicinity of the Site there is a footway to the
northern side of the road. To the west, the footway serves residential
proprieties. Towards the east the surfaced footway ends at the entrance to
South Quays car park. From this point there is an unsurfaced pedestrian route
which continues on the northside of Carnsew Road adjacent to the railway
viaduct and through Isis gardens. A surfaced footway also continues on the
southern side of Carnsew Road which leads to Foundry Square, although at
present there is no formal crossing point.
2.11 At the Foundry Square junction there are refuge islands with dropped kerbs
which assist pedestrians to cross Foundry Hill and Penpol Terrace.
PROPOSED FOOD SUPERSTORE DEVELOPMENT HAYLE SUPPLEMENTARY TRANSPORT REPORT
APRIL 2011 Page 5 M10061-01 TR
2.12 There is a footway along the southern side of the road to the west of Foundry
Lane and to the west of the Site there is a Toucan crossing approximately 90
metres from the Jewsons access.
2.13 There are a number of public right of ways within the vicinity of the Site as
shown on the Definitive Map. Rights of Way and pedestrian crossing facilities
are shown in Figure 3.
2.14 With reference to PPG13, a walk distance of 2km and a cycle distance of 5km
are generally considered to be reasonable. Figure 4 indicates the 2km walk
catchment area, which shows that it covers the majority of Hayle and Lelant.
The 5km cycle catchment would also encompass areas as far as Carbis Bay
and parts of St.Ives.
2.15 National Cycle Route 3 (NCR3) passes the Site along Carnsew Road, which
runs from Lands End through to Hayle and on toward Truro. NCR3 is also
known as the “First and Last Trail” and is part of the Cornish Way route.
NCR3 is a mixture of off road, off carriage and on road route. The NCR3 route
is shown in Figure 3.
Public Transport Links
2.16 The Site is accessible by bus and rail modes of transport, which is particularly
important for staff access to the Site.
2.17 There are a number of bus routes within walking distance of the Site. Stops
are provided along Foundry Hill and Penpol Terrace and service from these
run between St.Ives, Penzance, Camborne and surrounding residential areas.
2.18 The bus routes, stops and rail stations are indicated in Figure 5. A summary
of bus services is provided in Table 1 below.

PROPOSED FOOD SUPERSTORE DEVELOPMENT HAYLE SUPPLEMENTARY TRANSPORT REPORT
APRIL 2011 Page 6 M10061-01 TR
Bus Service Summary Table
Serving Monday – Friday Saturday Sunday
0730-0930 1630-1830 Daily Daily Daily
14,14A St.Ives - Truro 2 (2) 2 (2) 16 (15) 15 (15) 5 (5)
18.18A,18B Penzance - Truro 4 (2) 3 (4) 18 (19) 17 (16) 6 (6)
19 Penzance–Camborne - (-) - (-) 2 (3) - (-) - (-)
515 Penzance – Gwithian 1 (2) 1 (-) 5 (5) 5 (5) - (-)
547 St.Ives – Newquay - (1) 2 (2) 10 (10) 10 (10) - (-)
X18 Penzance – Truro - (-) - (1) 4 (4) 4 (4) - (-)
TOTAL 7 (7) 8 (9) 55 (56) 51 (50) 11 (11)
Stated direction (reverse direction)
Table 1
2.19 In addition to the bus services, the Site is easily accessed by rail, as it lies
approximately 400 metres from Hayle train station. The pedestrian access to
the station is via a narrow road from B3301 Penpol Terrace close to the
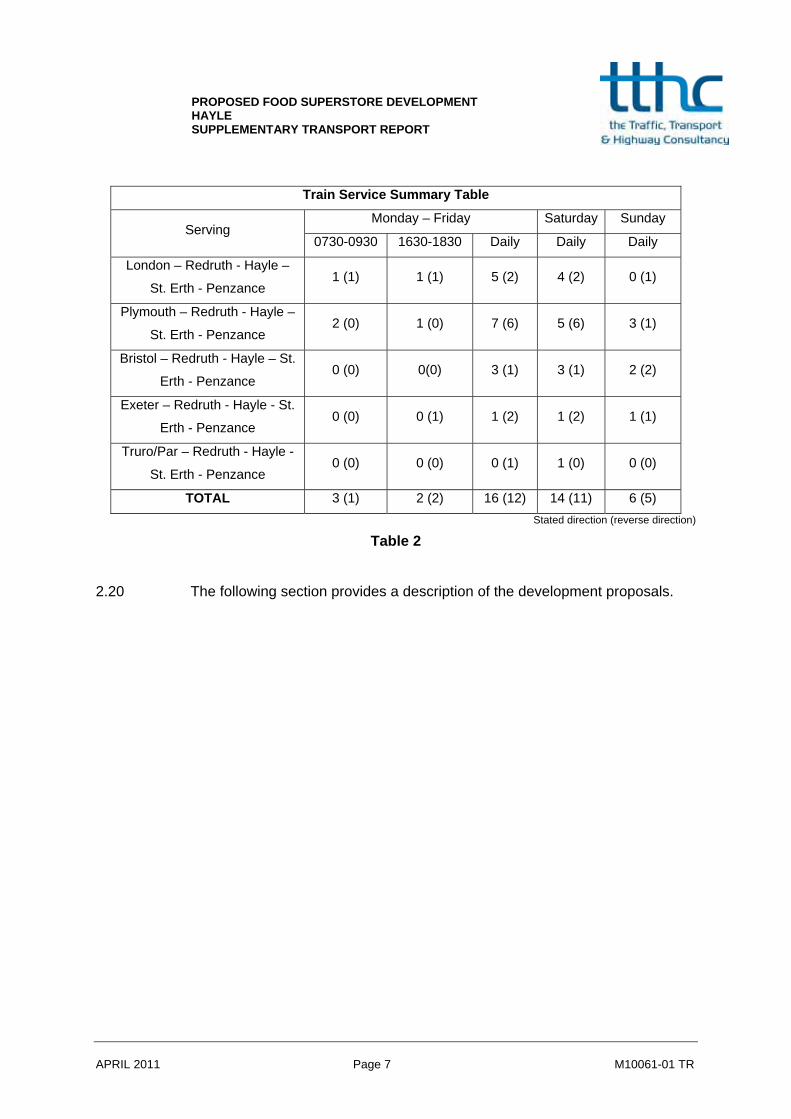
Foundry Square mini roundabout.
2.20 As shown in the table below, the local services available from Hayle train
station provide access to nearby towns including St. Erth (5mins), Camborne
(10mins), Penzance (15mins) and Redruth (16mins). There are also longer
distance services to Bristol, Exeter, Plymouth, Reading and London
Paddington throughout the day, although these are less relevant in respect of
this particular application.
PROPOSED FOOD SUPERSTORE DEVELOPMENT HAYLE SUPPLEMENTARY TRANSPORT REPORT
APRIL 2011 Page 7 M10061-01 TR
Train Service Summary Table
Serving Monday – Friday Saturday Sunday
0730-0930 1630-1830 Daily Daily Daily
London – Redruth - Hayle –
St. Erth - Penzance 1 (1) 1 (1) 5 (2) 4 (2) 0 (1)
Plymouth – Redruth - Hayle –
St. Erth - Penzance 2 (0) 1 (0) 7 (6) 5 (6) 3 (1)
Bristol – Redruth - Hayle – St.
Erth - Penzance 0 (0) 0(0) 3 (1) 3 (1) 2 (2)
Exeter – Redruth - Hayle - St.
Erth - Penzance 0 (0) 0 (1) 1 (2) 1 (2) 1 (1)
Truro/Par – Redruth - Hayle -
St. Erth - Penzance 0 (0) 0 (0) 0 (1) 1 (0) 0 (0)
TOTAL 3 (1) 2 (2) 16 (12) 14 (11) 6 (5)
Stated direction (reverse direction)
Table 2
2.20 The following section provides a description of the development proposals.
PROPOSED FOOD SUPERSTORE DEVELOPMENT HAYLE SUPPLEMENTARY TRANSPORT REPORT
APRIL 2011 Page 8 M10061-01 TR
DEVELOPMENT PROPOSALS
3.1 The proposed development is for a new food superstore. The foodstore will
have 3,355m2 GFA with 1,858m2 RFA with associated car parking and
servicing areas.
3.2 Of the six buildings currently on the Site five will be removed. The listed
building adjacent to Carnsew Road will be retained and used for car parking.
Vehicle Access
3.3 There are two vehicular accesses provided for the site off Carnsew Road both
of which are existing access positions.
3.4 In the original ADL access scheme the foodstore application proposed the
closure of the existing access to the builders yard opposite Foundry Lane and
creation of a new customer access via a roundabout on Carnsew Road which
was to include Foundry Lane.
3.5 As a consequence of the TTHC review of the access proposals an alternative
signal controlled junction scheme has been developed. The proposed signal
controlled access is shown on the plans contained with Appendix A.
3.6 The first plan shows the layout in the context of the existing highway network
and the second shows it in the context of the committed development access
arrangement on the South Quays site (part of the Hayle Harbour
development) – the ING consent. These proposed site access plans have
been submitted to CCC previously.
3.7 CCC have taken no issue with the access proposals other than expressing
the view that the required further information, namely VISSIM modelling, to be
assured that the proposals could operate without material detrimental impact
on the ING consented access operation.
PROPOSED FOOD SUPERSTORE DEVELOPMENT HAYLE SUPPLEMENTARY TRANSPORT REPORT
APRIL 2011 Page 9 M10061-01 TR
3.8 The service yard would have its own dedicated access, located in
approximately the same location as the present access to building No. 4
Carnsew Road, which is to the west of the Site. This service access would
comprise a simple priority junction and would be provided with visibility splays
of 2.4m by 90m in either direction, which conform to the requirements for a
road subject to a 30mph speed limit.
Parking
3.9 Parking will be provided in accordance with CCC standards and National
policy guidance. Standard, mobility, staff and parent and child spaces will be
provided.
3.10 CCC’s mobility impaired parking standard is a minimum of 5% of the number
of spaces. The number of disabled spaces will be provided in line with this
policy.
3.11 CCC standards for cycle parking is 4% of the car parking provision. Cycle
parking will be provide in line to this standard and the spaces will be
accommodated close to the building entrance. In addition to cycle parking
being provided there will also be spaces provided for motorcycles.
Pedestrian
3.12 Pedestrian walkways would be provided through the Site, providing links from
Carnsew Road to the store entrance.
3.13 In conjunction with the development, an improved pedestrian link to the town
centre is proposed along with a new pedestrian crossing. The crossing will be
located between the Site and Foundry Square at the point where the surfaced
footway on the north side of Carnsew Road ceases and then continues on the
south side. This particular section is the part which CCC had sought further
information on in respect of widths and hence it is shown in more detail on the
PROPOSED FOOD SUPERSTORE DEVELOPMENT HAYLE SUPPLEMENTARY TRANSPORT REPORT
APRIL 2011 Page 10 M10061-01 TR
plan presented in Appendix A3. As shown, it will comprise of a puffin
crossing with tactile paving.
3.14 The pedestrian link comprises improvements to existing footway along the
southern side of Carnsew Road from the proposed pedestrian crossing to
Foundry Square junction. The proposed scheme widens the footpath for most
of its length to 2 metres.
3.15 There is a local pinchpoint where the corner of John Harvey House sites
within the footway. At this point, the width would be 1.3m. However, this is no
more than a pinchpoint, similar to the effect of street furniture positioned in the
footway.
3.16 Department of Transport (DoT) Inclusive Mobility Guidance states that 2
metres will allow two wheelchairs to pass one another comfortably. It also
states that the absolute minimum width, where there is an obstacle, should be
1m clear width. This minimum is exceeded at the pinchpoint.
3.17 It is clear therefore, that the proposals will not only cater for general
pedestrian activity, they would also be suitable for providing a route which
would be entirely capable of accommodating the needs of those with mobility
impairment.
3.18 In addition to the proposals, there are also existing paths providing linkage
to/from the Site, including a well trodden route across the frontage of the ING
site which connects with Isis gardens.
3.19 The footpath network which would exist following the proposed improvements
is presented in the Enhanced Linkages Plan presented in Figure 6. As
shown, the Application Site would be well connected for pedestrians within
Hayle and would be served by suitable linkages with the town centre.

PROPOSED FOOD SUPERSTORE DEVELOPMENT HAYLE SUPPLEMENTARY TRANSPORT REPORT
APRIL 2011 Page 11 M10061-01 TR
Public Transport
3.20 Improvements relating to Public Transport were discussed with CCC prior to
TTHC’s involvement in the project and a package of measures are to be
secured through a Section 106 Agreement. The measures include the
provision of a new bus stop closer to the store.
3.21 Morrisons would also undertake to provide and implement their Travel Plan
which would seek to reduce reliance upon the private car and promote non-
car travel particularly amongst its staff.
PROPOSED FOOD SUPERSTORE DEVELOPMENT HAYLE SUPPLEMENTARY TRANSPORT REPORT
APRIL 2011 Page 12 M10061-01 TR
4.0 EXISTING TRAFFIC FLOWS AND CONDITIONS
4.1 In order to provide an assessment of the impact of the development
proposals, the existing traffic conditions must first be established.
Traffic Flows
4.2 It has previously been agreed with CCC that assessments of the Saturday
peak are not considered necessary as the weekday PM peak is the worst
case scenario.
4.3 CCC have requested that surveyed PM Peak Hour traffic flows from June
2006 should be used as the starting point for junction assessments, as it is
believed these are the highest flows from the various data sets available.
4.4 The traffic count undertaken in June 2006 was at the Foundry Square mini
roundabout junction. The survey included full turning movement counts at the
junction between the hours 0700-1900. A copy of the count data is provided in
Appendix B.
4.5 Analysis of the CCC survey data revealed that the PM peak hour at the
Foundry Square was 1700-1800 hours.
4.6 As shown in Appendix B the flows presented are presented in vehicles. HGV
information is presented but it is not split by hour. Therefore, in addition to the
count received from CCC, the count undertaken by ADL at Foundry Square in
2010 has been used to obtain HGV proportions for the PM peak period. The
HGV information is presented in Appendix C.
4.7 PM Peak Hour turning flows into and out of the existing Jewsons access and
Foundry Lane were surveyed in 2010 by ADL. The traffic flow data at this
location is presented in Appendix D. It should be noted that these are
existing counted flows and not the potential which the Site could achieve with
this particular landuse.
PROPOSED FOOD SUPERSTORE DEVELOPMENT HAYLE SUPPLEMENTARY TRANSPORT REPORT
APRIL 2011 Page 13 M10061-01 TR
4.8 The resulting PM peak hour surveyed vehicle flows are presented in Figure 7.
4.9 The peak hour flows are also provided as passenger car units (PCUs) in
Figure 8. The use of PCUs, where larger vehicles (heavy goods vehicles
(HGV’s) and buses) are assigned a PCU value of 2, takes account of the
greater impact that these larger vehicles have in respect of highway
operation.
PROPOSED FOOD SUPERSTORE DEVELOPMENT HAYLE SUPPLEMENTARY TRANSPORT REPORT
APRIL 2011 Page 14 M10061-01 TR
5.0 BASE FORECASTS
5.1 In order to consider the impact of development traffic, the ‘Base’ situation
must first be established.
5.2 At the request of CCC and in order to be consistent with other planning
applications recently submitted, the future year to be assessed has been
taken as 2017. This is slightly more onerous than the Guidelines on Transport
Assessment (GoTA) which suggest a future year for assessment of 5 years
after an Application is lodged.
5.3 The worst case PM Peak Hour traffic flows provided by CCC have therefore
been growthed to 2017 using TEMPRO growth. The resulting flows are
presented in Figure 9.
5.4 In addition to the addition of background traffic growth, future year
assessments have also take into account committed developments which are
capable of completion within the period examined. The committed
development to be included is the Hayle Harbour Masterplan development
(ref: W1/08-0613). The trip generations association with the development
have therefore been included. In combination with background traffic growth
the resulting Base Scenario is a robust starting position for the assessment of
the worst case PM Peak Hour
5.5 The trip generations of the consented development have been provided by
CCC from the Buro Happold Transport Assessment Update February 2009.
5.6 The committed development flows for assessment purposes in the PM peak
hours are presented in Figure 10.
5.7 The 2017 Base flows are produced by combining the existing surveyed flows,
growthed to 2017 (Figure 9), with the committed development flows (Figure
10). The resulting Base flows for the PM peak hour are presented in Figure
11. In order to appreciate the level of robustness applied to the starting point
PROPOSED FOOD SUPERSTORE DEVELOPMENT HAYLE SUPPLEMENTARY TRANSPORT REPORT
APRIL 2011 Page 15 M10061-01 TR
for assessment of the Morrisons foodstore scheme, it should be noted that
the 2017 PM Peak Hour Base Flows are upto 73% higher that the surveyed
flows which are also known to provide on onerous starting position.
PROPOSED FOOD SUPERSTORE DEVELOPMENT HAYLE SUPPLEMENTARY TRANSPORT REPORT
APRIL 2011 Page 16 M10061-01 TR
6.0 DEVELOPMENT TRAFFIC
Traffic Generation
6.1 The traffic implications of the proposed foodstore have been assessed against
that of the existing use on the Site. The traffic generating potential of the
proposed scheme is detailed below.
Proposed Foodstore
6.2 The traffic generation associated with the proposed foodstore has been
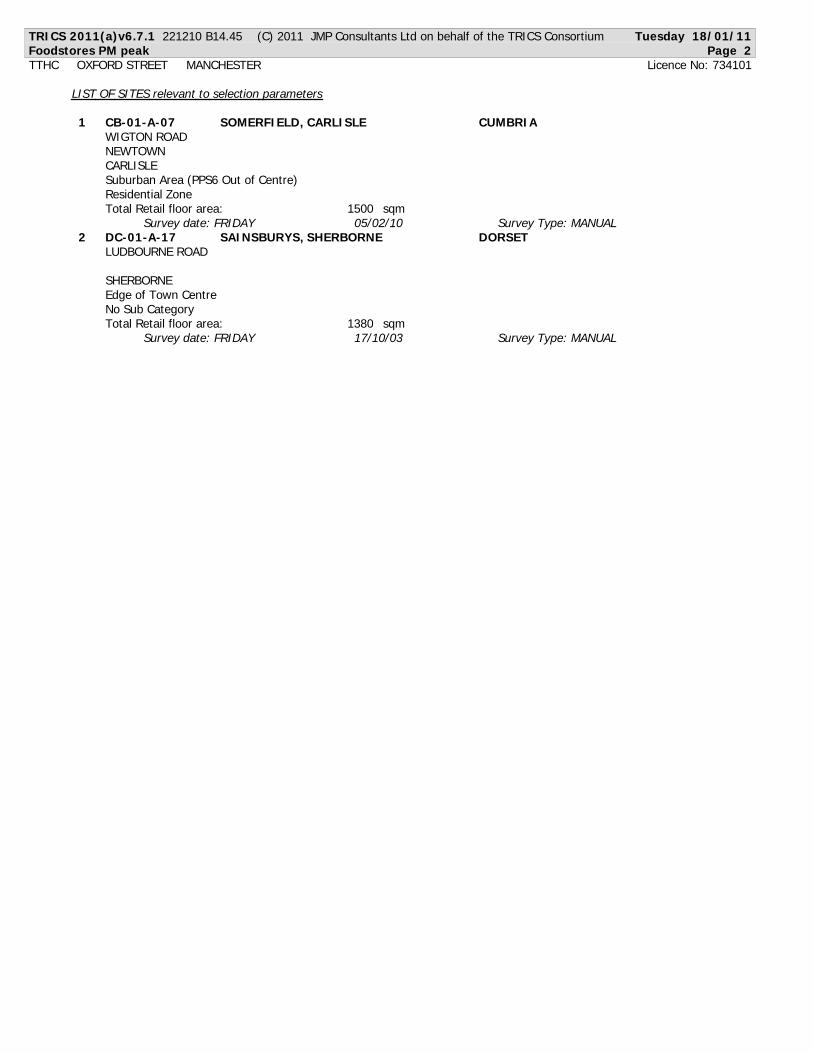
estimated based on data in the TRICS 2011(a) database. The TRICS output
is contained in Appendix E.
6.3 In order to obtain appropriate trip rates, the following TRICS site selection has
been adopted. Trip generation assessments have been based on store RFA
rates for a proposed store of 1,858 m2 RFA.
6.4 The selection criteria adopted are as follows:
RFA floorspace range 858m2 to 2,858m2;
Friday sites have been selected for the PM peak;
Exclude Greater London, Scotland, Ireland and Wales survey sites;
Excludes town centre sites;
Sites which have a petrol filling station are excluded; and
Only one survey per store so as not to bias the assessment.
6.5 The TRICS peak hours do not necessarily correspond with the highway peak
discussed in Section 4. However, in order to provide a robust assessment, the
trip rates employed for the proposed use are those from the highest
generating hour.
6.6 It should also be noted that there has been no allowance made for the lower
levels of parking provision which modern food superstores are required, to
PROPOSED FOOD SUPERSTORE DEVELOPMENT HAYLE SUPPLEMENTARY TRANSPORT REPORT
APRIL 2011 Page 17 M10061-01 TR
provide under National and Local Policy, which will potentially limit peak
activity.
6.7 The resulting trip generation rates for the proposed foodstore are as detailed
in Table 3 below. The trip rates are quoted as trips per 100m2 RFA.
Foodstore Trip Rates (Vehicles) – PM Peak Hour
Proposed foodstore (1,858m2)
RFA range 858m2 – 2,858m2
In Out Total
Rate (trips per 100m2) 11.609 11.726 22.335
Flow 216 218 434
Table 3
6.8 For assessment purposes, the calculated trip generations have been rounded
up as indicated in Table 4 below.
Proposed Foodstore Development Trips (Vehicles)
In Out Total
PM Peak Hour 218 218 436
Table 4
6.9 It is widely accepted that the majority of shopping trips to new retail stores are
already using the road network and that in transferring to a new store they
simply redistribute within the network. This is particularly the case in weekday
PM peak periods. Studies from Professor G McL Hazel and from McIver and
Dickenson, both of which are included in Appendix F, have split trips to retail
centres into categories based on their characteristics. These categories are
as follows:
PROPOSED FOOD SUPERSTORE DEVELOPMENT HAYLE SUPPLEMENTARY TRANSPORT REPORT
APRIL 2011 Page 18 M10061-01 TR
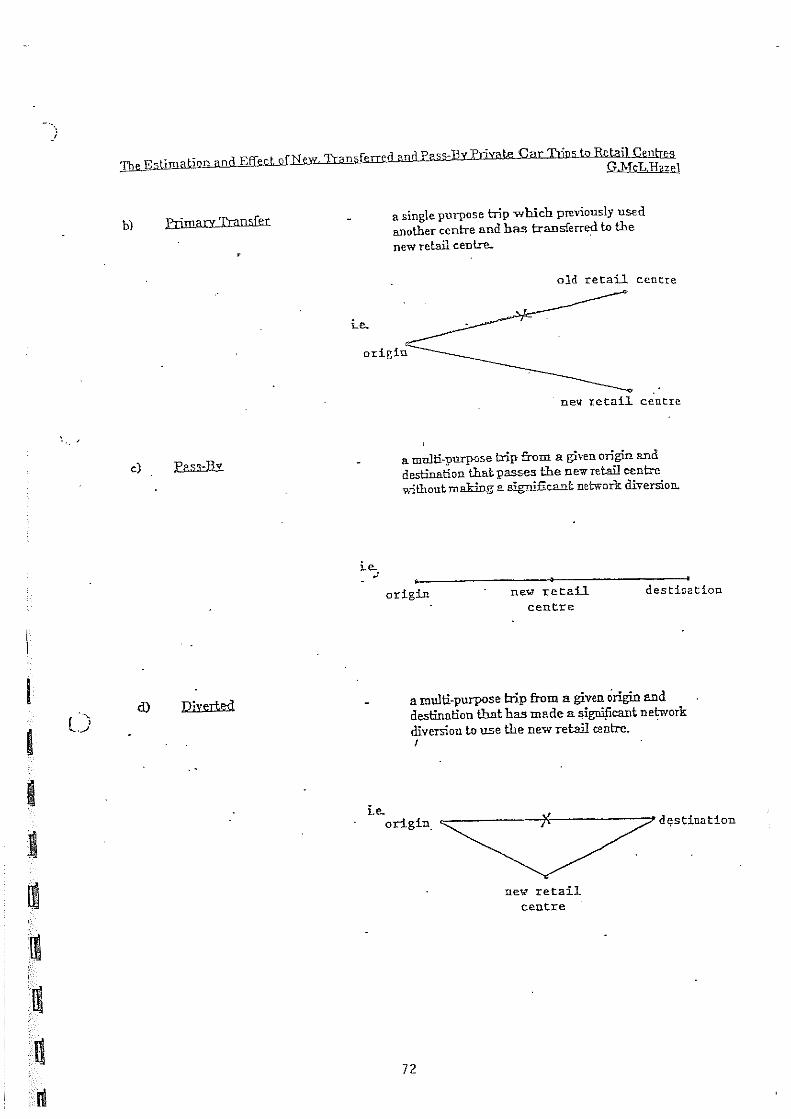
NEW: a new trip which had not been made before during the time period
of interest but would result from the opening of a new store and would
therefore be new to the network.
TRANSFERRED: a single purpose shopping trip which (prior to the new
store) had a trip end at a competing store but which would then transfer to
the new store upon opening.
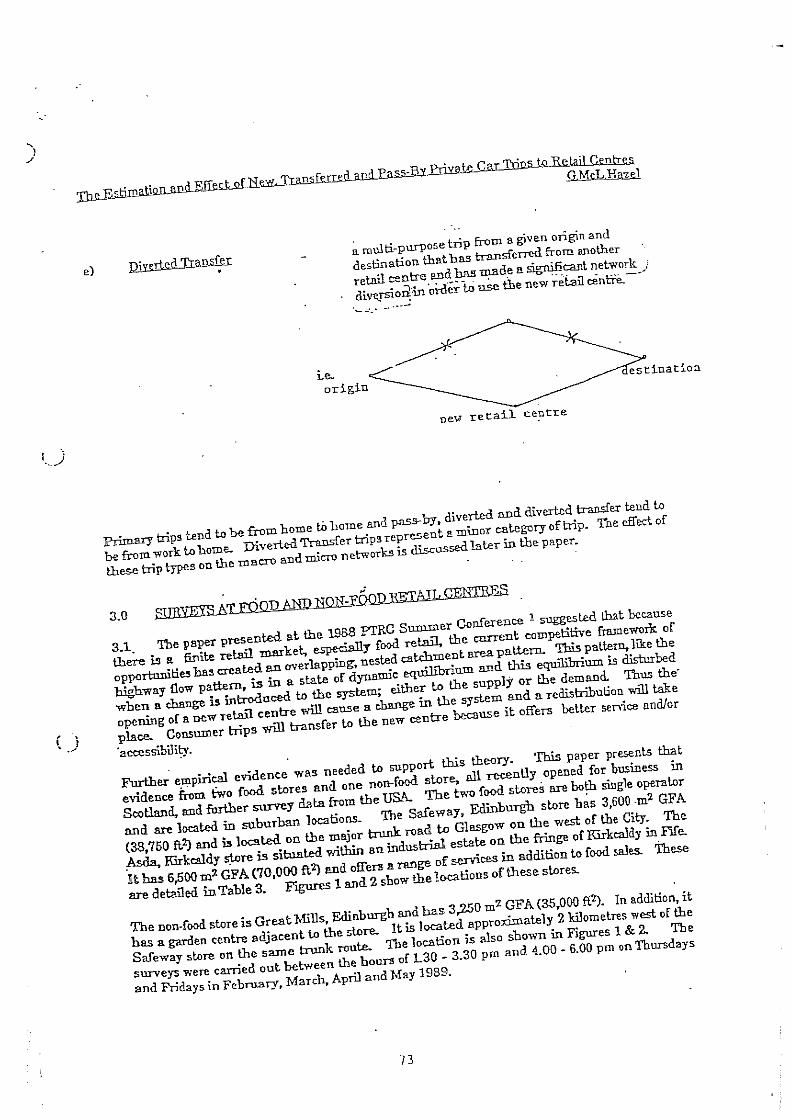
DIVERTED: a multi purpose trip which does not pass outside the
proposed store previously but which now diverts from its routes to make
an immediate visit to the proposed store.
PASS-BY: any trip which used to pass outside the Site of the store which
now makes an immediate visit to the store.
6.10 It should be noted that the studies actually suggest that in general the
proportion of ‘New’ shopping trips to new foodstores is zero or very close to
zero. The McIver and Dickinson research suggests that the proportions set
out in Table 5 are typical:
McIver and Dickinson Trip Types at New Stores
Trip Type Friday
Transferred 60%
Diverted 25%
Passby 15%
Table 5
6.11 However, in order to provide a robust assessment a proportion of 10% New
trips have been adopted with an adjustment to the Transferred proportion
accordingly. Based on the above research the proportions for each category
have been assumed to be as set out in Table 6 overleaf.
PROPOSED FOOD SUPERSTORE DEVELOPMENT HAYLE SUPPLEMENTARY TRANSPORT REPORT
APRIL 2011 Page 19 M10061-01 TR
Adopted Trip Proportions
Trip Type Friday
New 10%
Transferred 50%
Diverted 25%
Passby 15%
Table 6
6.12 As shown, the proposed store will be assessed on the basis that 10% of all
trips to and from the site will be ‘New’ to the local area. It has also been
assumed that 50% of trips on will be ‘Transferred’ trips (i.e. trips transferring
from other stores). 15% of trips will be ‘Passby’ trips (i.e. trips already
passing immediately adjacent to the Site along Carnsew Road). 25% will be
‘Diverted’ trips (i.e. trips making a slight diversion from their journey to access
the store: in this case trips which are travelling to / from Foundry Hill to / from
B3301 Penpol Terrace.
6.13 The total store related trips shown in Table 6 have thus been split into the
adopted trip types as shown in Table 7 below.
Proposed (1,858 sqm) Food Store Generated Trips by Trip Type
Total Number of Trips
Friday PM Peak Hour
Trip Type In Out Total
New 22 22 44
Transferred 109 109 218
Diverted 55 55 110
Pass-by 33 33 66
Total 219 219 438
Table 7

PROPOSED FOOD SUPERSTORE DEVELOPMENT HAYLE SUPPLEMENTARY TRANSPORT REPORT
APRIL 2011 Page 20 M10061-01 TR
6.14 The ‘Passby’ trips will only impact on the Carnsew Road Site access junction.
‘New’ trips will create additional movements on the surrounding highway
network. The ‘Transferred’ and ‘Diverted’ trips will create some new
additional movements on local roads but will also redistribute some of the
existing traffic movements.
6.15 In particular, the distribution analysis, which is discussed in more detail later,
indicates that some of the traffic transferring from other stores relates to
current home based trips from Hayle travelling to stores in Penzance, St.Ives
and Camborne. With a new store in Hayle, many shoppers who are currently
passing the Site along Carnsew Road would instead switch to the new store,
which would obviously be closer for them. Not only are these trips, which
currently pass immediately adjacent to the Site, effectively the same as
‘Passby’ trips, they would be removed from the surrounding junctions.
Trip Distribution
Proposed Development
6.16 In order to provide an indication of the likely distribution of ‘New’ trips
associated with the proposed store, a Primary Catchment Area (PCA) has
been produced by TTHC.
6.17 The PCA for home based shopping trips, is based on a TTHC 10 minute drive
time from the proposed store and is shown in Appendix G.
6.18 Within this PCA, it would be expected that new trips at the Site access would
be split approximately 80%/20%, with the majority routing from Hayle town
centre. The previous ADL TA submitted to CCC also assumed a split at the
Site access of 80/20 based on the information provided by R.Trewthey of
CCC.
PROPOSED FOOD SUPERSTORE DEVELOPMENT HAYLE SUPPLEMENTARY TRANSPORT REPORT
APRIL 2011 Page 21 M10061-01 TR
6.19 At the meeting on the 1st March 2011, CCC requested the distribution of the
transfer trips to be based on the method and data used in the recent
Sainsburys application submitted to CCC (planning ref: PA10/04297).
6.20 From the Sainsburys model the catchment area is divided into 8 zones based
on postcodes. The model is based on population from the GVA Grimley 2007
retail study and a trip distance factor to the foostores.
6.21 The transfer of trips from other foodstores results in trips which are
completely new within the highway area of interest. However, owing to the
location of the proposed store, a large proportion of these trips from Hayle are
seen to be currently routeing along Carnsew Road to travel to other
foodstores. The proposed Morrisons store would result in shorter journeys,
with the removal of a number of trips which currently travel along Carnsew
Road.
6.22 The flows for the existing and proposed ‘Transferred’ trips for each zone area
are shown in Appendix H. The net effect of the existing transfer trips and the
proposed transferred trips are shown in Appendix I.
6.23 ‘Pass-by’ trips are taken as trips passing along Carnsew Road past the Site
access junction ‘Pass-by’ trips taken from each direction are in proportion to
the northbound/southbound flow split at the junction. These trips are simply
deducted from the straight ahead movement, instead turning into the Site,
and again back out to continue in the original direction.
6.24 ‘Diverted’ trips are those routeing close to, but not passing, the Site i.e. from
the north along B3301 Penpol Terrace, and from the south from B3302
Foundry Hill. This results in a redistribution of traffic at the mini roundabout
junction with traffic turning towards the proposed foodstore, and then
travelling back out towards the mini-roundabout to continue in the original
direction.

PROPOSED FOOD SUPERSTORE DEVELOPMENT HAYLE SUPPLEMENTARY TRANSPORT REPORT
APRIL 2011 Page 22 M10061-01 TR
6.25 The resulting development trips for each of the four trip components for the
PM peak are presented in Appendix I. The total proposed development flows
for the PM peak are shown in Figure 12.
6.26 By comparison with the proposed development flow (Figure 12) with those of
the existing flows for the site shown in Figure 13 (Jewsons flows growthed to
2017) the actual net change in traffic flows over the existing are indicated in
Figure 14.
6.27 The 2017 With Development Flows are the 2017 Base flows except the
existing Site flows shown in Figure 13 are replaced with the proposed
development flows (as detailed in Figure 12). The resulting With
Development Flows are indicated in Figure 15.
6.28 Having described the changes in traffic arising from the proposed foodstore
development, we will now discuss the operational implications of these
proposals.
PROPOSED FOOD SUPERSTORE DEVELOPMENT HAYLE SUPPLEMENTARY TRANSPORT REPORT
APRIL 2011 Page 23 M10061-01 TR
7.0 IMPLICATIONS OF DEVELOPMENT TRAFFIC
Operational Assessment
Proposed Site Access
7.1 The proposed signal controlled access junction for the Jewson Site
redevelopment scheme is shown on the plans in Appendix A. The first plan
shows the layout in the context of the existing highway network and the
second shows it in the context of the committed development access
arrangements on the South Quays site – the ING consent.
7.2 TTHC had previously presented CCC with tests of the access based on a
cycle time of 36 seconds. This is a low cycle time but not the lowest the
junction is capable of operating at. However, the advantage of a low cycle
time is that there will be a quick turnover of signal stages and a greater
number of intergreens which in turn will lead to a greater number of ‘gap
opportunities’ for traffic turning into or out of the Site and the consented ING
South Quays development.
7.3 Close to traffic signals vehicle platoons and gaps are more defined, making
turning into and out of side nearby roads easier for drivers to judge. In
addition to the periods generated by the intergreens, other gap opportunities
would also exist as long as the movements at the signals are not operating at
saturation levels (eg 100%).
7.4 A low cycle time test also has the advantage of the westbound right turn lane
operating more independently from the ahead lane, thereby removing the
need to test the double inclusion of this traffic within the LINSIG.
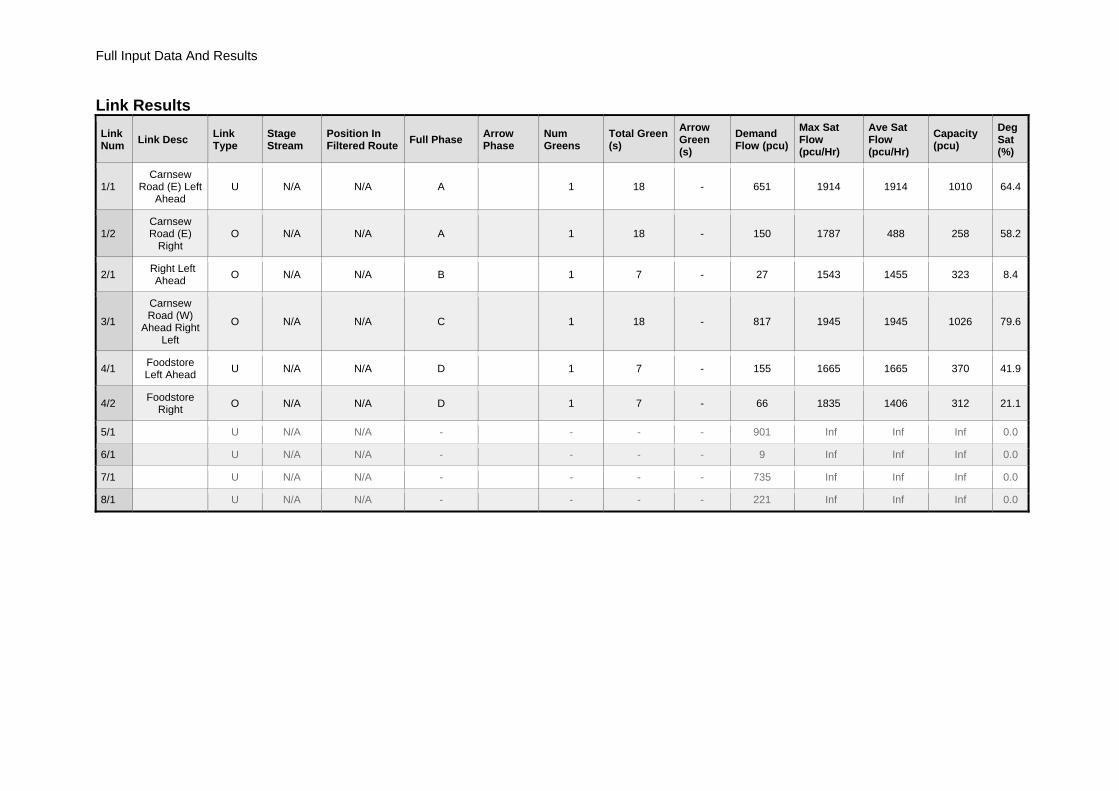
7.5 The results of the proposed junction are presented in Table 8 below, the
LINSIG output is provided in Appendix J.
PROPOSED FOOD SUPERSTORE DEVELOPMENT HAYLE SUPPLEMENTARY TRANSPORT REPORT
APRIL 2011 Page 24 M10061-01 TR
Proposed Signal Controlled Site Access Junction LINSIG Results
2017 Base + Development PM Peak Hour
Link
Arm
Results
DoS (%) Queue
1/1 Carnsew Road (WB) left and Ahead 64.4 5
1/2 Carnsew Road (WB) Right 58.2 1
2/1 Southern arm all movements 8.4 1
3/1 Carnsew Road (EB) all movements 79.6 9
4/1 Site access - left and ahead 41.9 2
4/2 Site access – right 21.1 1
Cycle Time 36 seconds
Practical Reserve Capacity (Low Cycle Time) 13.1%
Table 8
7.6 As shown, with a low cycle time of just 36 seconds, the junction would
continue to operate well within capacity. A 36 second cycle time would result
in 100 cycles per hour which in turn would mean 100 intergreens of 6
seconds per hour. It should be noted that the right turn out of the ING access
is 96 vehicles, which would be 1 per cycle on average. The right turn in is
133, which would be 1-2 per cycle average.
7.7 Furthermore, it should also be noted that the through movements at the signal
controlled junction would be operating well within capacity (between 64% and
80%) and, as such, there would be other gaps within the natural flow of traffic.
South Quays consented access
7.8 As shown on the second plan in Appendix A the consented scheme access
for ING / South Quays is a priority junction. The operational performance of
the consented junction has been undertaken using PICADY.
7.9 The PICADY outputs are shown in Appendix K. These are summarised in
Table 9 below.

PROPOSED FOOD SUPERSTORE DEVELOPMENT HAYLE SUPPLEMENTARY TRANSPORT REPORT
APRIL 2011 Page 25 M10061-01 TR
South Quays / ING Consented Access
2017 Assessment
Turning Movement Base Base +
Development
RFC QUEUE RFC QUEUE
Foundry Yard to Carnsew Road (WB) 0.040 0 0.044 0
Foundry Yard to Carnsew Road (EB) 0.168 1 0.222 1
Carnsew Road (E) to South Quays 0.345 1 0.370 1
South Quays to Carnsew Road (EB) 0.638 2 1.081 14
South Quays to Carnsew Road (WB) 0.714 2 1.040 8
Carnsew Road (W) to Foundry Yard 0.023 0 0.025 0
Table 9
7.10 The results above suggest that the additional traffic generated by the
proposed development would result in queuing on the ING access during the
worst case PM peak hour. However, the PICADY tests are not able to take
account of the positive effects on ‘gaps’ in the main road traffic past this
access as referred to earlier and hence these results are expected to be
much improved in practice. This will be returned to later.
7.11 In any event, given the robust nature of the worst case traffic flow volumes,
this is unlikely to occur in practice even without improvement to the quality of
gaps in traffic.
Foundry Square
7.12 In testing the implications of the proposed Foodstore on the Foundary Square
junction, the improved junction parameters from the consented development
associated with the Hayle Harbour Masterplan (Buro Happold Technical Note,
using the C2 improvement as requested by CCC) have been adopted. This
improved geometry has been combined with the Base flows shown in Figure
9.
PROPOSED FOOD SUPERSTORE DEVELOPMENT HAYLE SUPPLEMENTARY TRANSPORT REPORT
APRIL 2011 Page 26 M10061-01 TR
7.13 The operational performance of the consented junction has been tested using
ARCADY.
7.14 The improved geometry adopted by Buro Happold, which forms the Base
position is presented in Table 10 below. As shown, this assumes an
increased flare on Penpol Terrace and both entry width and flare
improvements on the other two arms.
Foundry Square – Buro Happold proposed improvement Geometry (Option C2)
ARM V (m) E (m) LM (m) VM (m) A (m) K(m)
A - Penpol Terrace 4.8 7.4 16.0 3.25 10.0 7.5
B - Foundry Hill 4.2 7.5 27.0 3.4 11.0 7.0
C - Carnsew Road 3.0 7.0 20 3.0 12.0 10.5
Table 10
7.15 The results of the Base flows are presented in Table 11 below and the
ARCADY output provided in Appendix L.
Foundry Square 2017 Base
ARCADY Results
ARM RFC Queue
A 0.964 15
B 0.674 2
C 1.005 24
Table 11
7.16 As shown, in the Base Scenario using the worst case PM peak flows, the
junction would be expected to operate around its ultimate capacity. However,
the purpose of this test is to provide a comparison with the results of the
proposals arising from the redevelopment of the Jewson Site.
7.17 In order to mitigate the implications of the proposed foodstore scheme for the
Jewson Site, TTHC has examined what further improvements might be
PROPOSED FOOD SUPERSTORE DEVELOPMENT HAYLE SUPPLEMENTARY TRANSPORT REPORT
APRIL 2011 Page 27 M10061-01 TR
needed. These are presented in Table 12 below. The proposed layout is
shown in Appendix L.
Foundry Square – TTHC proposed improvement Geometry
ARM V (m) E (m) LM (m) VM (m) A (m) K(m)
A - Penpol Terrace 4.8 9.5 25.0 3.25 10.0 7.5
B - Foundry Hill 4.2 7.5 27.0 3.4 11.0 7.0
C - Carnsew Road 3.0 8.7 20 3.0 12.0 10.5
Table 12
7.18 As shown in the table above, increases in entry width (Penpol Terrace and
Carnsew Road) and the flare (Penpol Terrace) are proposed (the C2
improvements at Foundary Hill would be unaltered).
7.19 With respect to the Carnsew Road approach improvements, TTHC has been
mindful of the likely approach speeds to ensure a suitable visibility envelope
is maintained particularly in respect of the left turn movement.
7.20 The ARCADY tests for the 2017 Base + Development flows against the
geometry set out in Table 12 are presented in Table 13 below with ARCADY
output provided in Appendix L.
Foundry Square
2017 Base + Development
ARCADY Results
ARM RFC Queue
A 0.819 4
B 0.718 3
C 0.996 23
Table 13
7.21 These results should be compared with those presented in Table 13 for the
Base scenario.
PROPOSED FOOD SUPERSTORE DEVELOPMENT HAYLE SUPPLEMENTARY TRANSPORT REPORT
APRIL 2011 Page 28 M10061-01 TR
7.22 As shown, the proposed junction improvements would result in the Base +
Development Scenario operating better than the Base scenario, with arm A
being significantly improved.
7.23 Therefore, the additional improvements presented in Table 12 would provide
suitable mitigation with respect to the traffic implications of the proposed
foodstore redevelopment at the Jewson Site.

PROPOSED FOOD SUPERSTORE DEVELOPMENT HAYLE SUPPLEMENTARY TRANSPORT REPORT
APRIL 2011 Page 29 M10061-01 TR
8.0 VISSIM TRANSPORT MODEL
8.1 In response to a request from CCC, a VISSIM model has been developed to
assist in understanding how the ‘gaps’ created by the proposed signals for the
Morrisons store would improve the results suggested by the standard
PICADY analysis.
8.2 VISSIM is a microscopic, time-step and behaviour-based simulation model.
The assessment of the network has been carried out using the VISSIM
software developed by PTV. The model has also been constructed in
conjunction with the input of PTV and in accordance with best practice.
8.3 The geometry of the simulation has been set up to recreate the proposed
geometry as closely as possible. The simulation runs for 90 minutes from
1645 to 1815 which includes ‘warm-up’ and ‘cool-down’ periods of 15 minutes
either side of the peak hour.
8.4 The vehicular traffic flows used for the assessment are equivalent to the PCU
peak hours shown in Figure 11 (2017 Base) and Figure 15 (2017 Base +
Development). The vehicle flows used are presented in Appendix M. For the
15 minutes either side of the peak hour the flows are based on the peak hour
but are reduced by 15%.
8.5 Below is a summary of the inputs to create the Base model.
An area of assessment of the site access and Carnsew Road as far as
and including Foundry Square.
The simulation resolution is the number of times the vehicle’s position will
be calculated within one simulated second. The value entered into the
model can range between 1 and 10. Based on the TfL document (Traffic
Modelling Guidelines, version 3.0) the simulation resolution should be set
to the default value of 5 steps per simulation second.
The random seed is the initial ‘seed’ value specified at the start of the
simulation run. Using different random seed changes the profile of the
PROPOSED FOOD SUPERSTORE DEVELOPMENT HAYLE SUPPLEMENTARY TRANSPORT REPORT
APRIL 2011 Page 30 M10061-01 TR
traffic arriving which can in turn therefore can alter the results. With
results based on a single seed value there is the potential to randomly
bias the overall result. According to TfL guidance an acceptable method
of reducing potential bias is to use a minimum of five seed values. The
model for each scenario has been run five times using seed numbers 1 -
5, and averaging the results.
For the traffic flows there are two vehicle compositions, cars and HGVs.
For each vehicle composition the default vehicle types have been
selected. The default target speed for each vehicle composition is 50km/h
(32mph).
The routeing of the car and HGV flows have been created for each origin
to destination (7 zones in total). Most of the moments within the area of
assessment cordon are known but those that aren’t have been based on
the Furness procedure. The Furness process generates traffic moments
between each origin and destination by balancing inflow and outflow totals
iteratively until equilibrium is reached.
8.6 For the Base plus Development scenario the same model has been used as
in the Base scenario with additional elements to represent the proposed
highway improvements. Below is a summary of the changes made to the
Base model.
The proposed site access is a signalised junction. The junction will
operate on a cycle time of 36 seconds. The signal timings for this junction
have been taken from the LINSIG output as shown in AppendixJK.
As part of the proposed scheme a new pedestrian crossing is proposed
along B3301 Carnsew Road to the east of the Site. Based on the
proposed development and the consented South Quays development it
has been estimated that there would be approximately 100 pedestrians
each hour in each direction with a default speed of 5km/h. The proposed
pedestrian crossing has been modelled with a cycle time of 60 seconds
and, in order to provide a robust assessment, has not been to the
proposed signalised site junction.
PROPOSED FOOD SUPERSTORE DEVELOPMENT HAYLE SUPPLEMENTARY TRANSPORT REPORT
APRIL 2011 Page 31 M10061-01 TR
Some tests have included Keep Clear markings as suggested by CCC at
the meeting on 1st March.
8.7 It should be noted that, as described in Section 7 of this report, at the Foundry
Square mini roundabout there are improvements to mitigate the implications
of the proposed foodstore scheme. The VISSIM software is not able to reflect
the same level of details as ARCADY with respect to changes in widths at
stoplines, and so, therefore, as a worst case assessment, the same geometry
as that used at the Foundry Square in the Base situation has been adopted
for the Base + Development Scenario.
8.8 The VISSIM output is contained in Appendix M. Queues have been
measured at two locations, the exit from South Quays on Carnsew Road and
also the exit from the proposed foodstore onto Carnsew Road. In accordance
with best practice, each scenario has been tested 5 times and an average
has been taken from the output for the length of queues. The output for the
queues is in metres and has been divided by 6 to show the queue lengths in
PCUs. Summary queue graphs are presented in Appendix M.
8.9 The results show that in the Base situation the queues at the exit from South
Quays / ING would peak at 9 pcus and for around 10 minutes within the peak
period.
8.10 In the Base + Development, without Keep Clear markings at the junction, the
queue would peak to 21 pcus but would only exceed 10 pcus for around ¾hr
during the worst case period and with queues quickly dispersing at the end of
the worst case peak hour. Given the robust nature of the flows which have
been adopted for testing purposes, but which are unlikely to be achieved in
practice, these results do not suggest the proposals would result in
unacceptable consequences for ING.
8.11 By modelling the network with Keep Clear markings either in the westbound
direction or both directions along Carnsew Road, the Base plus Development
scenario would result in a peak queue 4 pcus which is a slight improvement
on the Base results.
PROPOSED FOOD SUPERSTORE DEVELOPMENT HAYLE SUPPLEMENTARY TRANSPORT REPORT
APRIL 2011 Page 32 M10061-01 TR
8.12 For the exit at the proposed foodstore the results show there would be no
queuing problems. The highest queue along the exit in the Base +
Development is 1 pcu.
8.13 As indicated earlier, there may be further scope for improvement with the
VISSIM model, such as linkage of the pedestrian crossing to the access
signals or different signal timings to generate further ‘gaps’. However, the
results suggest that the foodstore proposals would not have a significant
detrimental impact on the performance of the ING access.
8.14 Copies of all the VISSIM input/output files are attached in Appendix M. CCC
will also be provided with the VISSIM model files in order to carry out their
own tests.
PROPOSED FOOD SUPERSTORE DEVELOPMENT HAYLE SUPPLEMENTARY TRANSPORT REPORT
APRIL 2011 Page 33 M10061-01 TR
9.0 SUMMARY AND CONCLUSIONS
9.1 This Supplementary Transport Report has examined the transport related
impact of the proposal for a new food superstore situated on the existing
Jewson site on Carnsew Road. It relates to an outline application for a
foodstore of 3,355m2 GFA with 1,858m2 RFA.
9.2 In conjunction with the development, an improved pedestrian link to the town
centre and pedestrian crossing are proposed along Carnsew Road. The
pedestrian link comprises improvements to the existing footway on the
southern side of Carnsew Road to a width of 2m for all but a pinchpoint along
its length.
9.3 The operational analysis of the proposals using ARCADY, PICADY, LINSIG
and VISSIM models show the traffic from the proposed foodstore can readily
be accommodated on the surrounding highway network. At Foundry Square,
the mini-roundabout improvements which are proposed will improve on the
Base situation and the proposals would not result in unacceptable conditions
for the consented ING scheme.
9.4 It is therefore concluded that there are no transport related issues which
would prevent granting of planning permission.

FIGURES
Based upon the ORDNANCE SURVEY
maps with the perm ission o f the CONTROLLER
OF HER MAJESTY 'S STATIONERY OFFICE
C R O W N C O PYR IG H T R ESERVED
Unauthorised reproduction in fringes CROW N
COPYRIGHT and may lead to prosecu tion or
civil p roceed ings.
NN
SITE LOCATION
Drawing No
Date
Drawn By
Rev
Rev Date
Authorised Scale
MORRISONS, HAYLE
SITE LOCATION PLAN
FIGURE 1
M10061
06.04.2011
MF
.
.
AN AS SHOWN
Based upon the ORDNANCE SURVEY
maps with the permission of theCONTROLLER
OF HER MAJESTY'S STATIONERY OFFICE
CROWN COPYRIGHT RESERVED
Unauthorised reproduction infringes CROWN
COPYRIGHT and may lead to prosecution or
civil proceedings.
NN
Drawing No
Date
Drawn By
Rev
Rev Date
Authorised Scale
MORRISONS, HAYLE
LOCAL AREA PLAN
FIGURE 2
M10061-C-005
APRIL 2011
STH
.
.
. NTS
KEY
Site Location
Pharmacy
Bank
Post Office
Post Office collection centre
Drawing No
Date
Drawn By
Rev
Rev Date
Authorised Scale
MORRISONS, HAYLE
EXISTING FOOTPATHS AND CYCLE ROUTES
FIGURE 3
M10061-C-002
APRIL 2011
GB
.
.
MWI NTS
KEY:
Site Location
Footpath
Bridleway
Byway
On road cycle route(Source: ccc website)
Off road cycle route(Source: ccc website)
Existing Path(Source: sustrans)
Toucan Crossing
Pedestrian Crossing
NN

Drawing No
Date
Drawn By
Rev
Rev Date
Authorised Scale
MORRISONS, HAYLE
PPG13 CATCHMENT AREAS
FIGURE 4
M10061
08.04.2011
MF
.
.
MW AS SHOWN
Based upon the ORDNANCE SURVEY
maps with the perm ission o f the CONTROLLER
OF HER MAJESTY 'S STATIONERY OFFICE
C R O W N C O PYR IG H T R ESERVED
Unauthorised reproduction in fringes CROW N
COPYRIGHT and may lead to prosecu tion or
civil p roceed ings.
NNKEY
SITE LOCATION
2km ISOCHRONE
5km ISOCHRONE

Drawing No
Date
Drawn By
Rev
Rev Date
Authorised Scale
MORRISONS, HAYLE
EXISTING BUS SERVICES
FIGURE 5
M10061
14.04.2011
MF
.
.
MW AS SHOWN
B a se d u p o n th e O R D N A N C E S U R V E Y
m a p s w ith th e p e rm iss io n o f th e C O N T R O L L E R
O F H E R M A JE S T Y 'S S TAT IO N E R Y O F F IC E
C R O W N C O P Y R IG H T R E S E R V E D
U n a u th o r ise d re p ro d u c t io n in fr in g e s C R O W N
C O P Y R IG H T a n d m a y le a d to p ro se cu t io n o r
c iv i l p ro ce e d in g s .
KEY
SITE LOCATION
BUS STOP
Drawing No
Date
Drawn By
Rev
Rev Date
Authorised Scale
MORRISONS, HAYLE
ENHANCED LINKAGES PLAN
FIGURE 6
M10061-C-004
APRIL 2011
GB
.
.
MWI NTS
KEY:
Site Location
Proposed pedestriancrossing
ProposedNew/Enhancedpedestrian route
Existing Footpath
Bridleway
Byway
Existing Toucan Crossing
Existing PedestrianCrossing
Other existing paths
NN
PENPOL TERRACE
PROPOSED FOODSTORE SOUTH QUAYS 243 301 6
5 1 134
541 561 4107 1517 151
CARNSEW ROAD 0
6408 4151
17 0 7
172 318 1FOUNDRY LANE
FOUNDRY HILL
Vehicles
M10061-E-006 MORRISONS, HAYLE
EXISTING COUNT - PM PEAK (VEHICLES)MARCH 2011
FIGURE 7
PENPOL TERRACE
PROPOSED FOODSTORE SOUTH QUAYS 253 303 6
5 1 144
552 573 4197 1547 154
CARNSEW ROAD 0
6419 426
117 0 7
173 324 1FOUNDRY LANE
FOUNDRY HILL
PCUs
M10061-E-007 MORRISONS, HAYLE
EXISTING COUNT - PM PEAK (PCUs)MARCH 2011
FIGURE 8

PENPOL TERRACE
PROPOSED FOODSTORE SOUTH QUAYS 285 341 7
6 1 165
622 645 4728 174
CARNSEW ROAD 0
7472 4801
19 0 8
195 365 1FOUNDRY LANE
FOUNDRY HILL
Growth factor (2006 - 2017) PCUs1.1264
M10061 - E - 008 MORRISONS, HAYLE
2017 'GROWTH' FLOWS - PM PEAK (PCUs)March 2011
FIGURE 9

PENPOL TERRACE
PROPOSED FOODSTORE SOUTH QUAYS 233 20
96 20463
152 79 28810 28
CARNSEW ROAD
133209 97
2216 33
18 20FOUNDRY LANE
FOUNDRY HILL
Based on Buro Happold TA update 2009 - revision 02
M10061-E-009 MORRISONS, HAYLE
COMMITTED DEVELOPMENT - PM PEAK
FIGURE 10
MARCH 2011
PENPOL TERRACE
PROPOSED FOODSTORE SOUTH QUAYS 518 361 7
6 1 16 96 2045 63
774 724 7608 10 2028 10 202
CARNSEW ROAD 0
7 133681 577
1 2219 0 8 16 0 33
213 385 1FOUNDRY LANE
FOUNDRY HILL
PCUs
M10061-E-010 MORRISONS, HAYLE
2017 BASE - PM PEAK (PCUs)MARCH 2011
FIGURE 11
PM PEAK
PENPOL TERRACE
PROPOSED FOODSTORE SOUTH QUAYS 67 -37
66 0 155 0 071 0-36 119 680 520 52
CARNSEW ROAD
150 0-31 1190
0 0 0
53 -38FOUNDRY LANE
FOUNDRY HILL
M10061-E-011 MORRISONS, HAYLE
TOTAL DEVELOPMENT FLOWS PM PEAKMARCH 2011
FIGURE 12

PM PEAK
PENPOL TERRACE
PROPOSED FOODSTORE SOUTH QUAYS 5
6 1 165
16 1155
CARNSEW ROAD
77
2FOUNDRY LANE
FOUNDRY HILL
M10061-E-012 MORRISONS, HAYLE
JEWSONS FLOWS - PM PEAKMARCH 2011
FIGURE 13
PM PEAK
PENPOL TERRACE
PROPOSED FOODSTORE SOUTH QUAYS 62 -37
60 -1 139 0 066 0-36 103 570 47
CARNSEW ROAD
143 0-31 1120
0 0 0
51 -38FOUNDRY LANE
FOUNDRY HILL
M10061-E-013 MORRISONS, HAYLE
NET ADDITONAL TRIPSMARCH 2011
FIGURE 14
PM PEAK
PENPOL TERRACE
PROPOSED FOODSTORE SOUTH QUAYS 580 324 7
66 0 155 96 20471 63738 827 817
8 10 249CARNSEW ROAD 0
150 133650 6891 22
19 0 8 16 0 33
264 347 1FOUNDRY LANE
FOUNDRY HILL
(PCUs)
M10061-E-014 MORRISONS, HAYLE
2017 BASE + DEVELOPMENT FLOWS PM PEAKMARCH 2011
FIGURE 15

APPENDIX A


APPENDIX B
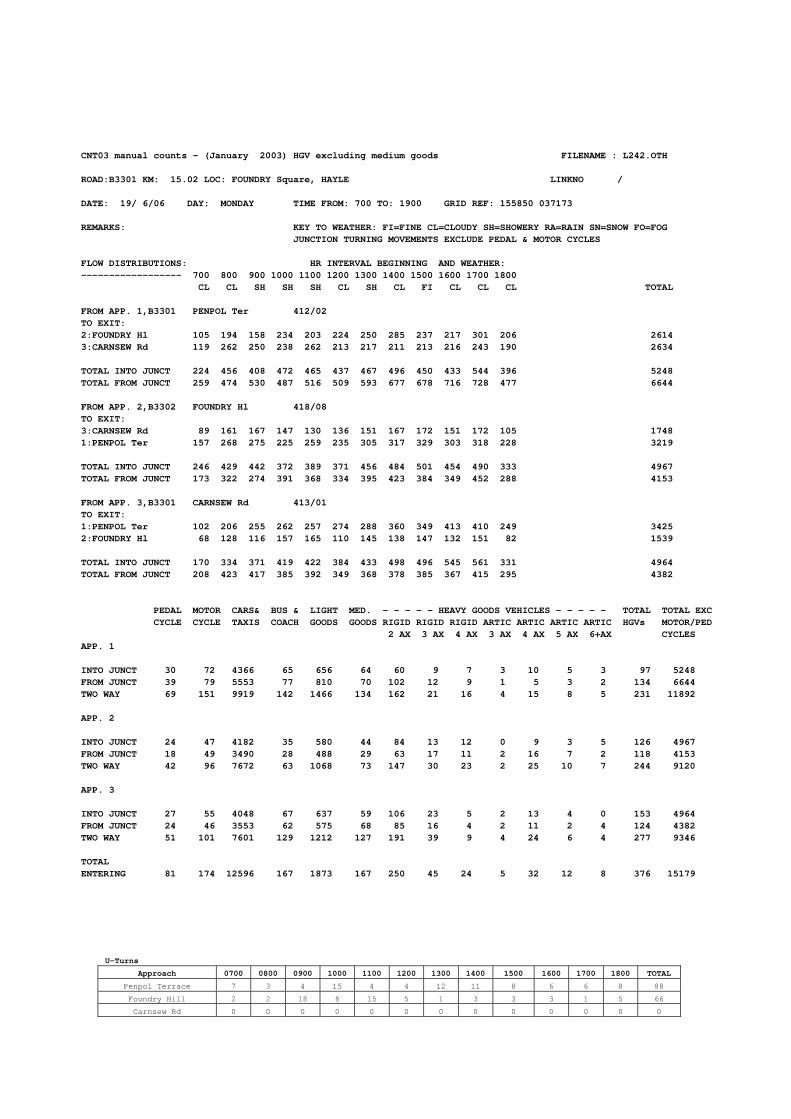
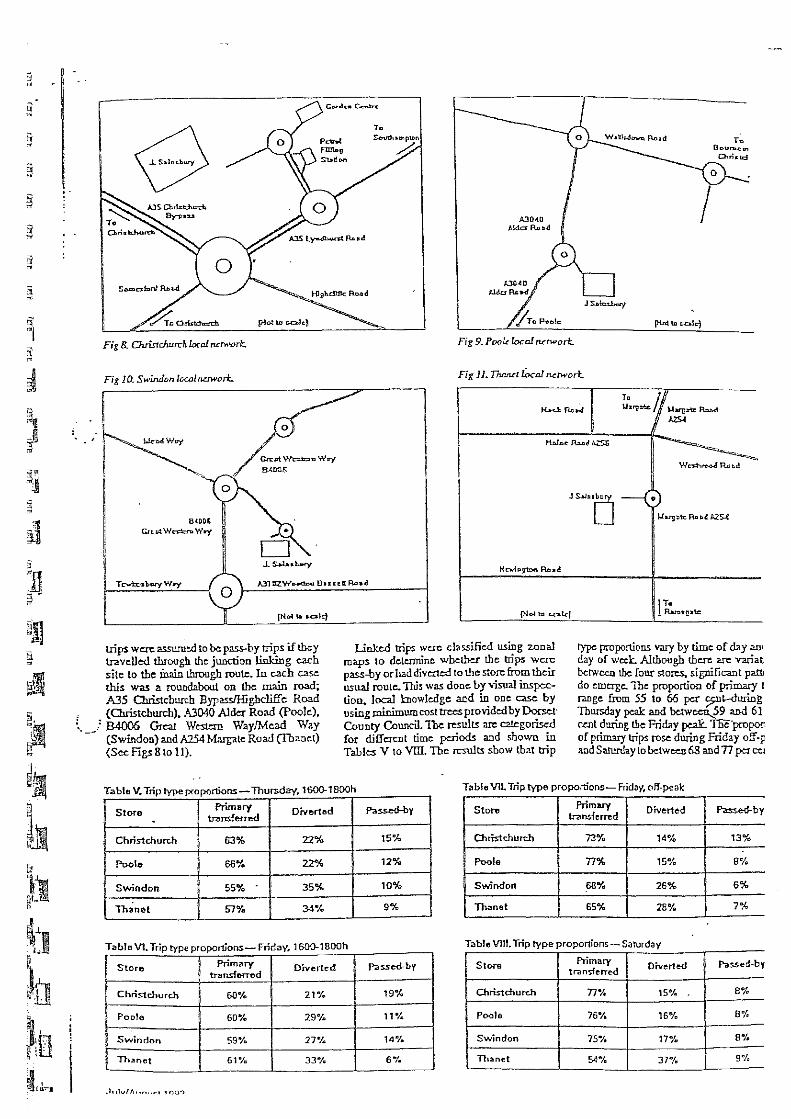
CNT03 manual counts - (January 2003) HGV excluding medium goods FILENAME : L242.OTH ROAD:B3301 KM: 15.02 LOC: FOUNDRY Square, HAYLE LINKNO / DATE: 19/ 6/06 DAY: MONDAY TIME FROM: 700 TO: 1900 GRID REF: 155850 037173 REMARKS: KEY TO WEATHER: FI=FINE CL=CLOUDY SH=SHOWERY RA=RAIN SN=SNOW FO=FOG JUNCTION TURNING MOVEMENTS EXCLUDE PEDAL & MOTOR CYCLES FLOW DISTRIBUTIONS: HR INTERVAL BEGINNING AND WEATHER: ------------------ 700 800 900 1000 1100 1200 1300 1400 1500 1600 1700 1800 CL CL SH SH SH CL SH CL FI CL CL CL TOTAL FROM APP. 1,B3301 PENPOL Ter 412/02 TO EXIT: 2:FOUNDRY Hl 105 194 158 234 203 224 250 285 237 217 301 206 2614 3:CARNSEW Rd 119 262 250 238 262 213 217 211 213 216 243 190 2634 TOTAL INTO JUNCT 224 456 408 472 465 437 467 496 450 433 544 396 5248 TOTAL FROM JUNCT 259 474 530 487 516 509 593 677 678 716 728 477 6644 FROM APP. 2,B3302 FOUNDRY Hl 418/08 TO EXIT: 3:CARNSEW Rd 89 161 167 147 130 136 151 167 172 151 172 105 1748 1:PENPOL Ter 157 268 275 225 259 235 305 317 329 303 318 228 3219 TOTAL INTO JUNCT 246 429 442 372 389 371 456 484 501 454 490 333 4967 TOTAL FROM JUNCT 173 322 274 391 368 334 395 423 384 349 452 288 4153 FROM APP. 3,B3301 CARNSEW Rd 413/01 TO EXIT: 1:PENPOL Ter 102 206 255 262 257 274 288 360 349 413 410 249 3425 2:FOUNDRY Hl 68 128 116 157 165 110 145 138 147 132 151 82 1539 TOTAL INTO JUNCT 170 334 371 419 422 384 433 498 496 545 561 331 4964 TOTAL FROM JUNCT 208 423 417 385 392 349 368 378 385 367 415 295 4382 PEDAL MOTOR CARS& BUS & LIGHT MED. - - - - - HEAVY GOODS VEHICLES - - - - - TOTAL TOTAL EXC CYCLE CYCLE TAXIS COACH GOODS GOODS RIGID RIGID RIGID ARTIC ARTIC ARTIC ARTIC HGVs MOTOR/PED 2 AX 3 AX 4 AX 3 AX 4 AX 5 AX 6+AX CYCLES APP. 1 INTO JUNCT 30 72 4366 65 656 64 60 9 7 3 10 5 3 97 5248 FROM JUNCT 39 79 5553 77 810 70 102 12 9 1 5 3 2 134 6644 TWO WAY 69 151 9919 142 1466 134 162 21 16 4 15 8 5 231 11892 APP. 2 INTO JUNCT 24 47 4182 35 580 44 84 13 12 0 9 3 5 126 4967 FROM JUNCT 18 49 3490 28 488 29 63 17 11 2 16 7 2 118 4153 TWO WAY 42 96 7672 63 1068 73 147 30 23 2 25 10 7 244 9120 APP. 3 INTO JUNCT 27 55 4048 67 637 59 106 23 5 2 13 4 0 153 4964 FROM JUNCT 24 46 3553 62 575 68 85 16 4 2 11 2 4 124 4382 TWO WAY 51 101 7601 129 1212 127 191 39 9 4 24 6 4 277 9346 TOTAL ENTERING 81 174 12596 167 1873 167 250 45 24 5 32 12 8 376 15179
U-Turns
Approach 0700 0800 0900 1000 1100 1200 1300 1400 1500 1600 1700 1800 TOTAL
Penpol Terrace 7 3 4 15 4 4 12 11 8 6 6 8 88
Foundry Hill 2 2 18 8 15 5 1 3 3 3 1 5 66
Carnsew Rd 0 0 0 0 0 0 0 0 0 0 0 0 0

APPENDIX C
PM PEAK
PENPOL TERRACE
PROPOSED FOODSTORE SOUTH QUAYS 4.1% 0.7%
2.1%2.1%
CARNSEW ROAD
0.6% 2.0%FOUNDRY LANE
FOUNDRY HILL
Peak hour 1630 -1730
Survey 23rd April 2010
M10061-E-019 MORRISONS, HAYLE
PERCENTAGE HGVs AT FOUNDRY SQUAREMARCH 2011
APPENDIX C
APPENDIX D
PENPOL TERRACE
PROPOSED FOODSTORE SOUTH QUAYS
5 1 134
7CARNSEW ROAD
6
117 0 7
FOUNDRY LANE
FOUNDRY HILL
Peak hour 1630 -1730
Vehicles
M10061-E-020 MORRISONS, HAYLE
ADL SURVEY DATA - JEWSONS ACCESSMARCH 2011
APPENDIX D

APPENDIX E
TRICS 2011(a)v6.7.1 221210 B14.45 (C) 2011 JMP Consultants Ltd on behalf of the TRICS Consortium Tuesday 18/01/11
Foodstores PM peak Page 1
TTHC OXFORD STREET MANCHESTER Licence No: 734101
TRIP RATE CALCULATION SELECTION PARAMETERS:
Land Use : 01 - RETAIL
Category : A - FOOD SUPERSTORE
VEHICLES
Selected regions and areas:
03 SOUTH WEST
DC DORSET 1 days
09 NORTH
CB CUMBRIA 1 days
Filtering Stage 2 selection:
Parameter: Retail floor area
Range: 1380 to 1500 (units: sqm)
Public Transport Provision:
Selection by: Include all surveys
Date Range: 01/01/02 to 08/07/10
Selected survey days:
Friday 2 days
Selected survey types:
Manual count 2 days
Directional ATC Count 0 days
Selected Locations:
Edge of Town Centre 1
Suburban Area (PPS6 Out of Centre) 1
Selected Location Sub Categories:
Residential Zone 1
No Sub Category 1
TRICS 2011(a)v6.7.1 221210 B14.45 (C) 2011 JMP Consultants Ltd on behalf of the TRICS Consortium Tuesday 18/01/11
Foodstores PM peak Page 2
TTHC OXFORD STREET MANCHESTER Licence No: 734101
LIST OF SITES relevant to selection parameters
1 CB-01-A-07 SOMERFIELD, CARLISLE CUMBRIA
WIGTON ROAD
NEWTOWN
CARLISLE
Suburban Area (PPS6 Out of Centre)
Residential Zone
Total Retail floor area: 1 5 0 0 sqm
Survey date: FRIDAY 05/02/10 Survey Type: MANUAL
2 DC-01-A-17 SAINSBURYS, SHERBORNE DORSET
LUDBOURNE ROAD
SHERBORNE
Edge of Town Centre
No Sub Category
Total Retail floor area: 1 3 8 0 sqm
Survey date: FRIDAY 17/10/03 Survey Type: MANUAL
TRICS 2011(a)v6.7.1 221210 B14.45 (C) 2011 JMP Consultants Ltd on behalf of the TRICS Consortium Tuesday 18/01/11
Foodstores PM peak Page 3
TTHC OXFORD STREET MANCHESTER Licence No: 734101
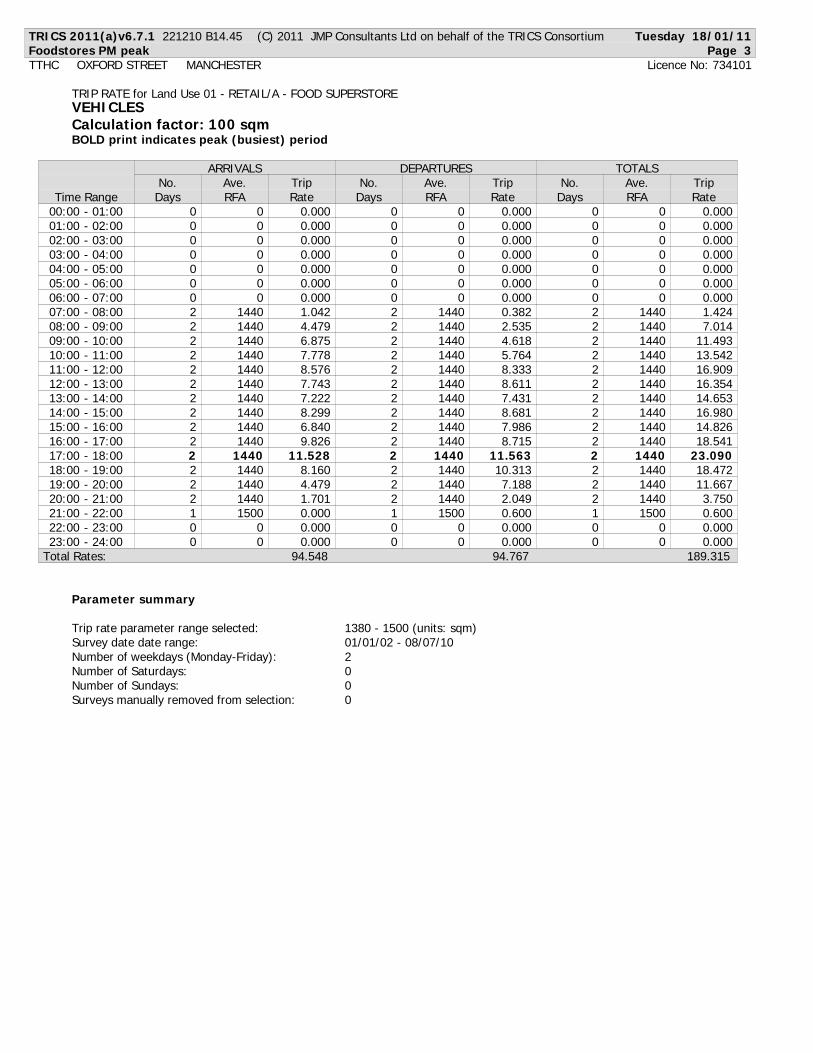
TRIP RATE for Land Use 01 - RETAIL/A - FOOD SUPERSTORE
VEHICLES
Calculation factor: 100 sqm
BOLD print indicates peak (busiest) period
ARRIVALS DEPARTURES TOTALS
No. Ave. Trip No. Ave. Trip No. Ave. Trip
Time Range Days RFA Rate Days RFA Rate Days RFA Rate
0 0 0.000 0 0 0.000 0 0 0.00000:00 - 01:00
0 0 0.000 0 0 0.000 0 0 0.00001:00 - 02:00
0 0 0.000 0 0 0.000 0 0 0.00002:00 - 03:00
0 0 0.000 0 0 0.000 0 0 0.00003:00 - 04:00
0 0 0.000 0 0 0.000 0 0 0.00004:00 - 05:00
0 0 0.000 0 0 0.000 0 0 0.00005:00 - 06:00
0 0 0.000 0 0 0.000 0 0 0.00006:00 - 07:00
2 1440 1.042 2 1440 0.382 2 1440 1.42407:00 - 08:00
2 1440 4.479 2 1440 2.535 2 1440 7.01408:00 - 09:00
2 1440 6.875 2 1440 4.618 2 1440 11.49309:00 - 10:00
2 1440 7.778 2 1440 5.764 2 1440 13.54210:00 - 11:00
2 1440 8.576 2 1440 8.333 2 1440 16.90911:00 - 12:00
2 1440 7.743 2 1440 8.611 2 1440 16.35412:00 - 13:00
2 1440 7.222 2 1440 7.431 2 1440 14.65313:00 - 14:00
2 1440 8.299 2 1440 8.681 2 1440 16.98014:00 - 15:00
2 1440 6.840 2 1440 7.986 2 1440 14.82615:00 - 16:00
2 1440 9.826 2 1440 8.715 2 1440 18.54116:00 - 17:00
2 1440 11.528 2 1440 11.563 2 1440 23.09017:00 - 18:00
2 1440 8.160 2 1440 10.313 2 1440 18.47218:00 - 19:00
2 1440 4.479 2 1440 7.188 2 1440 11.66719:00 - 20:00
2 1440 1.701 2 1440 2.049 2 1440 3.75020:00 - 21:00
1 1500 0.000 1 1500 0.600 1 1500 0.60021:00 - 22:00
0 0 0.000 0 0 0.000 0 0 0.00022:00 - 23:00
0 0 0.000 0 0 0.000 0 0 0.00023:00 - 24:00
Total Rates: 9 4.548 9 4.767 189.315
Parameter summary
Trip rate parameter range selected: 1380 - 1500 (units: sqm)
Survey date date range: 01/01/02 - 08/07/10
Number of weekdays (Monday-Friday): 2
Number of Saturdays: 0
Number of Sundays: 0
Surveys manually removed from selection: 0

TRICS 2011(a)v6.7.1 221210 B14.45 (C) 2011 JMP Consultants Ltd on behalf of the TRICS Consortium Tuesday 18/01/11
Page 1
TTHC OXFORD STREET MANCHESTER Licence No: 734101
RANK ORDER for Land Use 01 - RETAIL/A - FOOD SUPERSTORE
VEHICLES
Ranking Type: TOTALS Time Range: 17:00-18:00
Under 6 Surveys Included, 15th/85th Percentile Not Highlighted
Median Values
Arrivals: 11.609
Departures: 11.726
Totals: 23.335
Trip Rate (Sorted by Totals) Travel
Rank Site-Ref Description Area RFA Day Date Arrivals Departures Totals Plan
1 DC-01-A-17 SAINSBURYS, SHERBORNE DORSET 1380 Fri 17/10/03 13.551 15.652 29.203
2 CB-01-A-07 SOMERFIELD, CARLISLE CUMBRIA 1500 Fri 05/02/10 9.667 7.800 17.467

APPENDIX F


APPENDIX G

© 1988–2009 Microsoft Corporation and/or its suppliers. All rights reserved. http://www.microsoft.com/uk/mappoint/ © 1984-2009 Tele Atlas. All rights reserved. Data Source © 2009 Tele Atlas N.V. This product in cludes mapping data licenced from Ordnance Survey® with the permission of the Controller of Her Majesty’s Stationery Office. ©Crown copyright and/or database right 2008. All rights reserved.Licence number 100025324. ©2009 NAVTEQ. All ri ghts reserved. NAVTEQ ON BOARD is a registered trademark of NAVTEQ.
0 km 2 4 6 8Drawing No
Date
Drawn By
Rev
Rev Date
Authorised Scale
MORRISONS, HAYLE
PRIMARY CATCHMENT AREA
APPENDIX G
M10061-C-001
JAN 2011
GB
.
.
MWI .
KEY
SITE
MORRISONS
TESCO
10 MINUTE CATCHMENTAREA
0km 2 4 6 8 10
NN

APPENDIX H

PENPOL TERRACE PENPOL TERRACE PENPOL TERRACE
PROPOSED FOODSTORE SOUTH QUAYS PROPOSED FOODSTORE SOUTH QUAYS 0.3 PROPOSED FOODSTORE SOUTH QUAYS 9 10
0.3 0.3 0.3 17 17 98
CARNSEW ROAD CARNSEW ROAD CARNSEW ROAD 0
0.3 0.3 17 17
8 10FOUNDRY LANE FOUNDRY LANE FOUNDRY LANE
FOUNDRY HILL FOUNDRY HILL FOUNDRY HILLNO ROUTEING FOR ZONE 7 WITHIN THE LOCAL AREA
ZONE 1 ZONE 2 ZONE 3
PENPOL TERRACE PENPOL TERRACE PENPOL TERRACE
PROPOSED FOODSTORE SOUTH QUAYS 0.1 PROPOSED FOODSTORE SOUTH QUAYS PROPOSED FOODSTORE SOUTH QUAYS
CARNSEW ROAD CARNSEW ROAD CARNSEW ROAD
0.1FOUNDRY LANE FOUNDRY LANE FOUNDRY LANE
FOUNDRY HILL FOUNDRY HILL FOUNDRY HILL
ZONE 4 ZONE 5 ZONE 6
NO ROUTEING FOR ZONE 7 WITHIN THE LOCAL AREANO ROUTEING FOR ZONE 7 WITHIN THE LOCAL AREA
PENPOL TERRACE PENPOL TERRACE PENPOL TERRACE
PROPOSED FOODSTORE SOUTH QUAYS PROPOSED FOODSTORE SOUTH QUAYS PROPOSED FOODSTORE SOUTH QUAYS 9 10
17 17 98
CARNSEW ROAD CARNSEW ROAD CARNSEW ROAD
17 17
8 10FOUNDRY LANE FOUNDRY LANE FOUNDRY LANE
FOUNDRY HILL FOUNDRY HILL FOUNDRY HILL
ZONE 7 ZONE 8 TOTAL EXISTING TRANSFER
NO ROUTEING FOR ZONE 7 WITHIN THE LOCAL AREANO ROUTEING FOR ZONE 7 WITHIN THE LOCAL AREA
MORRISONS, HAYLE
March 2010 TRANSFER TRIPS - EXISTING STORE ASSIGNMENT BY ZONES - PM PEAK
MWi APPENDIX H1

PENPOL TERRACE PENPOL TERRACE PENPOL TERRACE
PROPOSED FOODSTORE SOUTH QUAYS PROPOSED FOODSTORE SOUTH QUAYS PROPOSED FOODSTORE SOUTH QUAYS 34
4 10 3 544 10 34 10 3
54 3420
CARNSEW ROAD CARNSEW ROAD CARNSEW ROAD
5454
20FOUNDRY LANE FOUNDRY LANE FOUNDRY LANE
FOUNDRY HILL FOUNDRY HILL FOUNDRY HILL
ZONE 1 ZONE 1 ZONE 3
PENPOL TERRACE PENPOL TERRACE PENPOL TERRACE
PROPOSED FOODSTORE SOUTH QUAYS PROPOSED FOODSTORE SOUTH QUAYS 1 PROPOSED FOODSTORE SOUTH QUAYS
5 5 15 3 15 15 1
5 3 15 2
CARNSEW ROAD CARNSEW ROAD CARNSEW ROAD
5 35 3
5 2FOUNDRY LANE FOUNDRY LANE FOUNDRY LANE
FOUNDRY HILL FOUNDRY HILL FOUNDRY HILL
ZONE 4 ZONE 5 ZONE 6
PENPOL TERRACE PENPOL TERRACE PENPOL TERRACE
PROPOSED FOODSTORE SOUTH QUAYS PROPOSED FOODSTORE SOUTH QUAYS PROPOSED FOODSTORE SOUTH QUAYS 35 0
1 10 48 6310 48
1 63 351 28
CARNSEW ROAD CARNSEW ROAD CARNSEW ROAD
1 631 631 0 63
0
1 28 0FOUNDRY LANE FOUNDRY LANE FOUNDRY LANE
FOUNDRY HILL FOUNDRY HILL FOUNDRY HILL
ZONE 7 ZONE 8 TOTAL PROPOSED TRANSFER
MORRISONS, HAYLE
March 2010 TRANSFER TRIPS - PROPOSED STORE ASSIGNMENT BY ZONES - PM PEAK
MWi APPENDIX H2
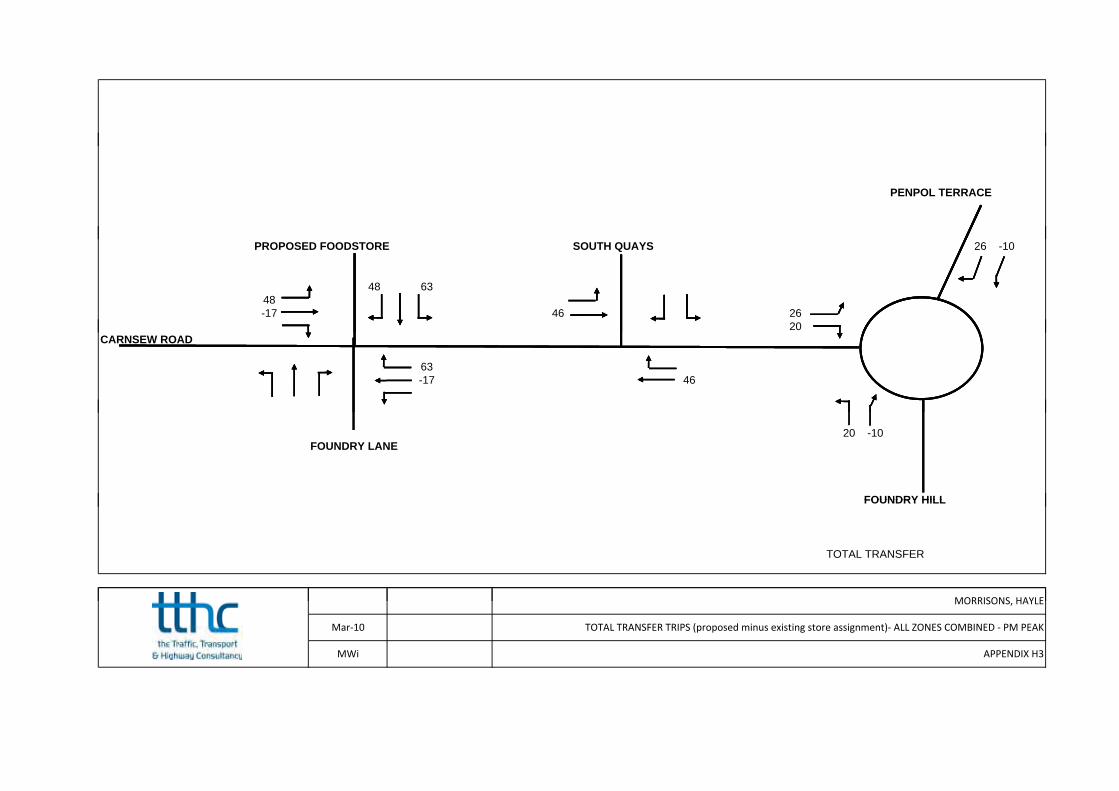
PENPOL TERRACE
PROPOSED FOODSTORE SOUTH QUAYS 26 -10
48 6348-17 46 26
20CARNSEW ROAD
63-17 46
20 -10FOUNDRY LANE
FOUNDRY HILLFOUNDRY HILL
TOTAL TRANSFER
Mar‐10
MWi
TOTAL TRANSFER TRIPS (proposed minus existing store assignment)‐ ALL ZONES COMBINED ‐ PM PEAK
MORRISONS, HAYLE
APPENDIX H3

APPENDIX I
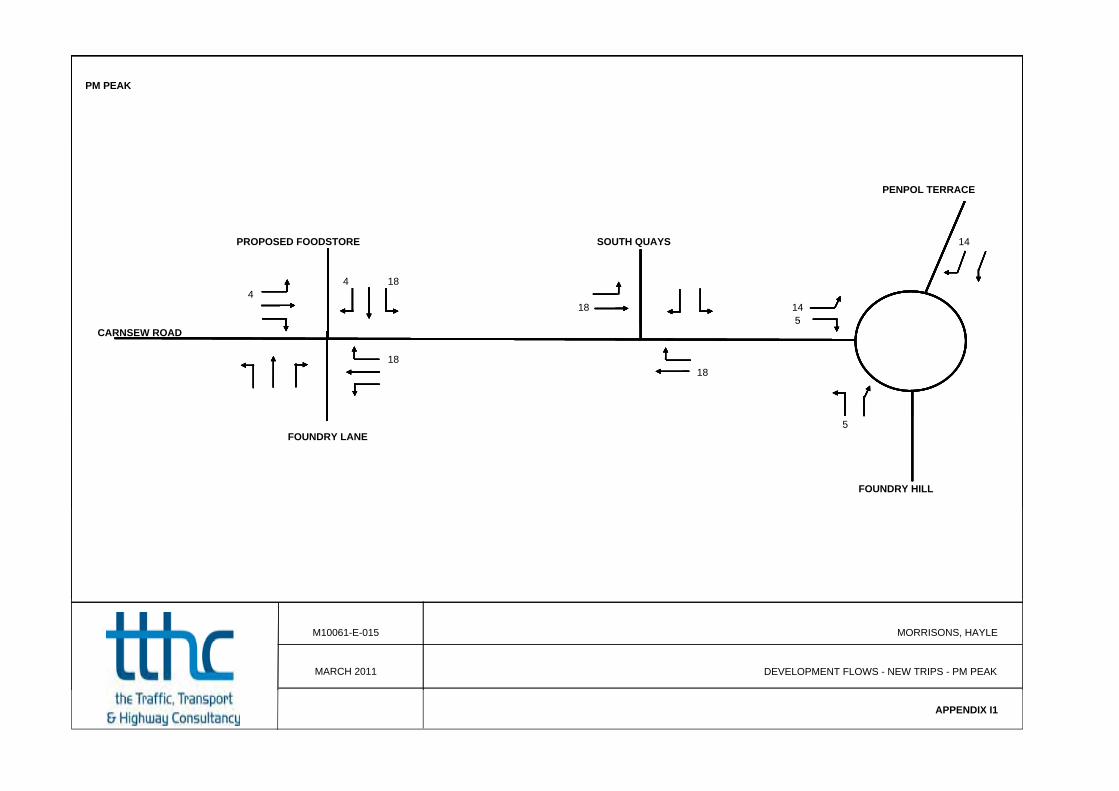
PM PEAK
PENPOL TERRACE
PROPOSED FOODSTORE SOUTH QUAYS 14
4 184
18 1455
CARNSEW ROAD
1818
5FOUNDRY LANE
FOUNDRY HILL
M10061-E-015 MORRISONS, HAYLE
DEVELOPMENT FLOWS - NEW TRIPS - PM PEAKMARCH 2011
APPENDIX I1

PM PEAK
PENPOL TERRACE
PROPOSED FOODSTORE SOUTH QUAYS 26 -10
48 6348-17 46 26
2020CARNSEW ROAD
63-17 46
20 -10FOUNDRY LANE
FOUNDRY HILL
M10061-E-016 MORRISONS, HAYLE
DEVELOPMENT FLOWS - TRANSFERRED TRIPS - PM PEAKMARCH 2011
APPENDIX I2
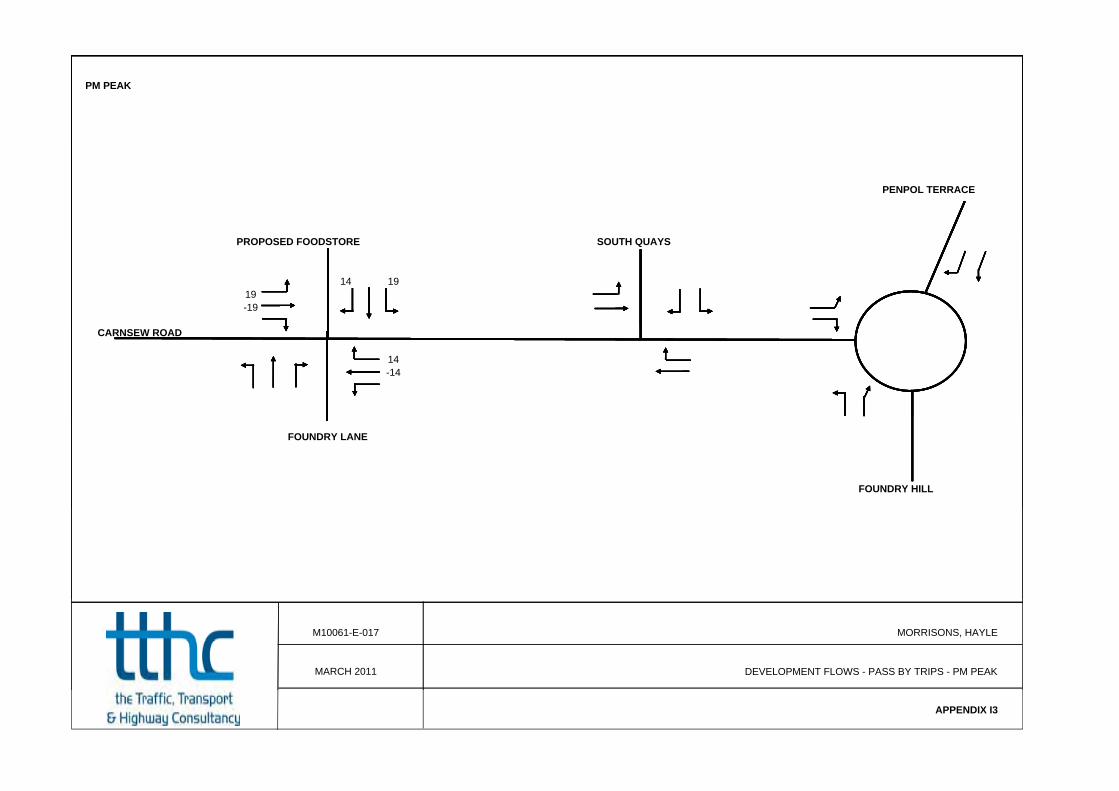
PM PEAK
PENPOL TERRACE
PROPOSED FOODSTORE SOUTH QUAYS
14 1919-19
CARNSEW ROAD
14-14
FOUNDRY LANE
FOUNDRY HILL
M10061-E-017 MORRISONS, HAYLE
DEVELOPMENT FLOWS - PASS BY TRIPS - PM PEAKMARCH 2011
APPENDIX I3

PM PEAK
PENPOL TERRACE
PROPOSED FOODSTORE SOUTH QUAYS 27 -27
55
55 282727
CARNSEW ROAD
5555
28 -28FOUNDRY LANE
FOUNDRY HILL
M10061-E-018 MORRISONS, HAYLE
DEVELOPMENT FLOWS - DIVERTED TRIPS - PM PEAKMARCH 2011
APPENIDX I4

APPENDIX J
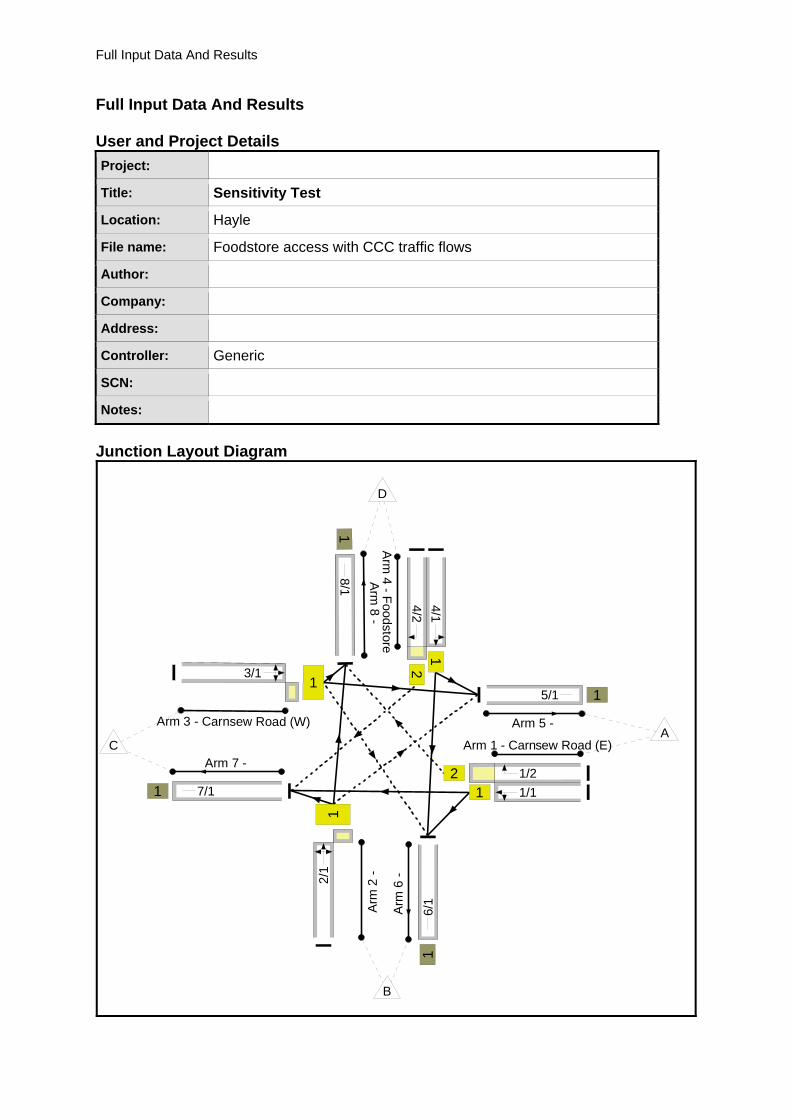
Full Input Data And Results
Full Input Data And Results User and Project Details
Project:
Title: Sensitivity Test
Location: Hayle
File name: Foodstore access with CCC traffic flows
Author:
Company:
Address:
Controller: Generic
SCN:
Notes:
Junction Layout Diagram
Arm 1 - Carnsew Road (E)
12
1/1
1/2
Arm
2 -
12/
1
Arm 3 - Carnsew Road (W)
13/1
Arm
4 - F
oodstor e
12
4/1
4/2
Arm 5 -
15/1
Arm
6 -
16/
1
Arm 7 -
1 7/1
Arm
8 -
18 /1
A
B
C
D
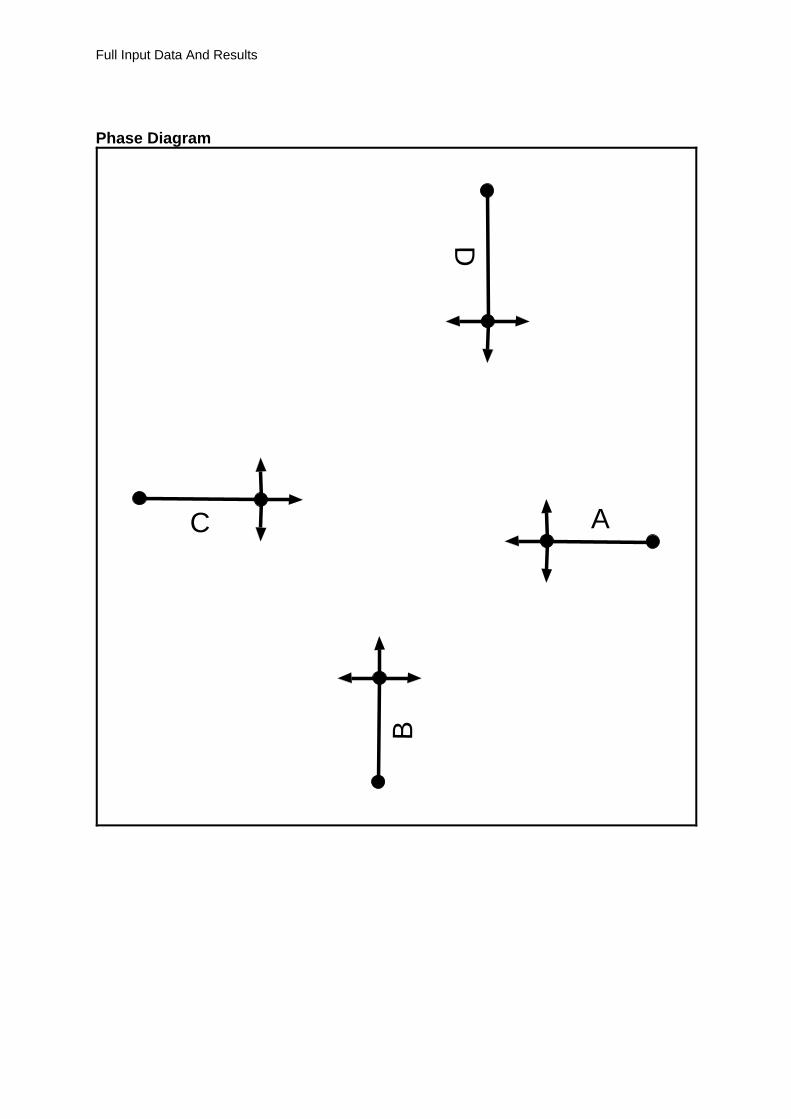
Full Input Data And Results
Phase Diagram
A
B
C
D

Full Input Data And Results
Phase Intergreens Matrix
Starting Phase
Terminating Phase
A B C D
A - 6 - 5
B 5 - 5 -
C - 5 - 6
D 5 - 5 -
Phase Input Data
Phase Name Phase type Assoc Phase Street Min Cont Min
A Traffic 7 7
B Traffic 7 7
C Traffic 7 7
D Traffic 7 7
Link Input Data
Arm/ Link
Link Name Link Type
Num Lanes
PhasesStart Disp.
End Disp.
1/1 Carnsew Road (E) Left Ahead U 1 A 2 3
1/2 Carnsew Road (E) Right O 1 A 2 3
2/1 Right Left Ahead O 1 B 2 3
3/1 Carnsew Road (W) Ahead Right
Left O 1 C 2 3
4/1 Foodstore Left Ahead U 1 D 2 3
4/2 Foodstore Right O 1 D 2 3
5/1 U 1 2 3
6/1 U 1 2 3
7/1 U 1 2 3
8/1 U 1 2 3

Full Input Data And Results
Give-Way Link Input Data
Arm/ Link
Link Name Movement Max Flow
when Giving Way (PCU/Hr)
Opposing Link
Opp. Link
Coeff.
Opp. Mvmnts.
Right Turn Storage (PCU)
Non-Blocking Storage (PCU)
RTF
Right Turn
Move up time (s)
Max Turns in Intergreen
(PCU)
1/2 Carnsew Road
(E) Right 1/2 to 8/1 1440 3/1 1.09 3/1 2.00 - 0.50 2 2.00
2/1 Right Left
Ahead 2/1 to 5/1 1440 4/1 1.09 4/1 1.00 1.00 0.50 1 2.00
3/1 Carnsew Road
(W) Ahead Right Left
3/1 to 6/1 1440 1/1 1.09 1/1 1.00 1.00 0.50 1 2.00
4/2 Foodstore
Right 4/2 to 7/1 1440 2/1 1.09 2/1 1.00 - 0.50 1 2.00
Full Input Data And Results
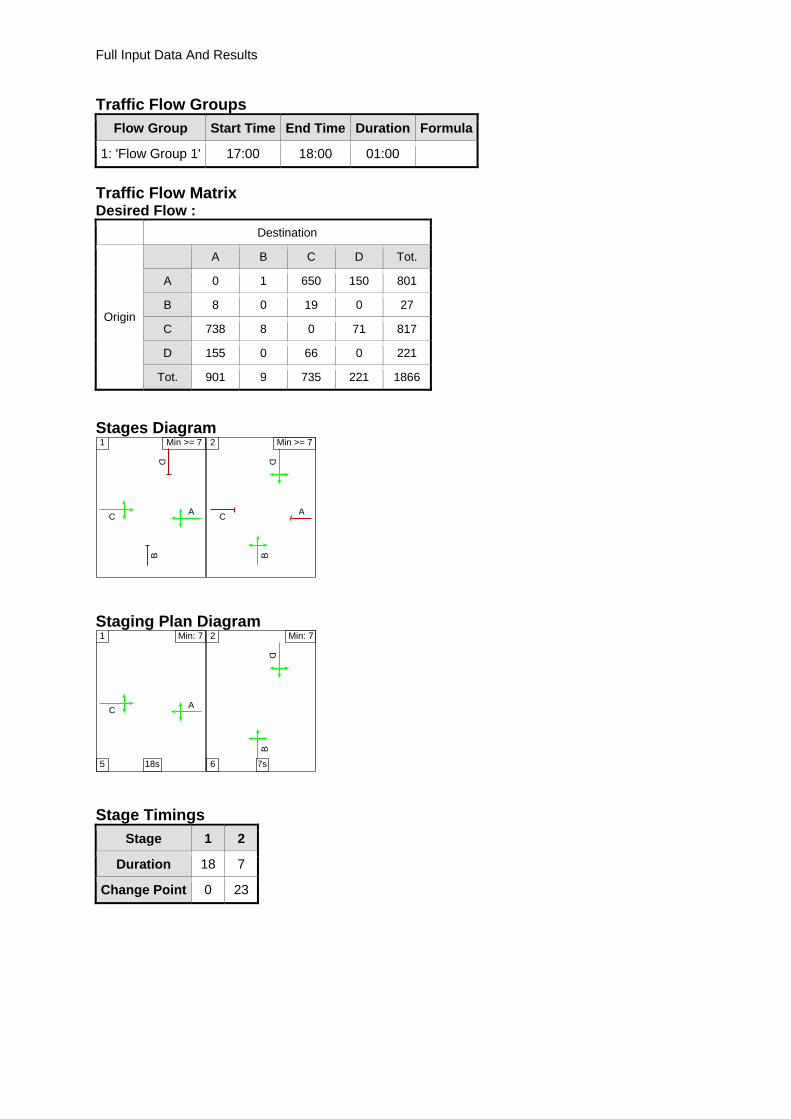
Traffic Flow Groups
Flow Group Start Time End Time Duration Formula
1: 'Flow Group 1' 17:00 18:00 01:00
Traffic Flow Matrix Desired Flow :
Destination
Origin
A B C D Tot.
A 0 1 650 150 801
B 8 0 19 0 27
C 738 8 0 71 817
D 155 0 66 0 221
Tot. 901 9 735 221 1866
Stages Diagram
A
B
C
D
1 Min >= 7
A
B
CD
2 Min >= 7
Staging Plan Diagram
AC
1 Min: 7
5 18s
B
D
2 Min: 7
6 7s Stage Timings
Stage 1 2
Duration 18 7
Change Point 0 23
Full Input Data And Results
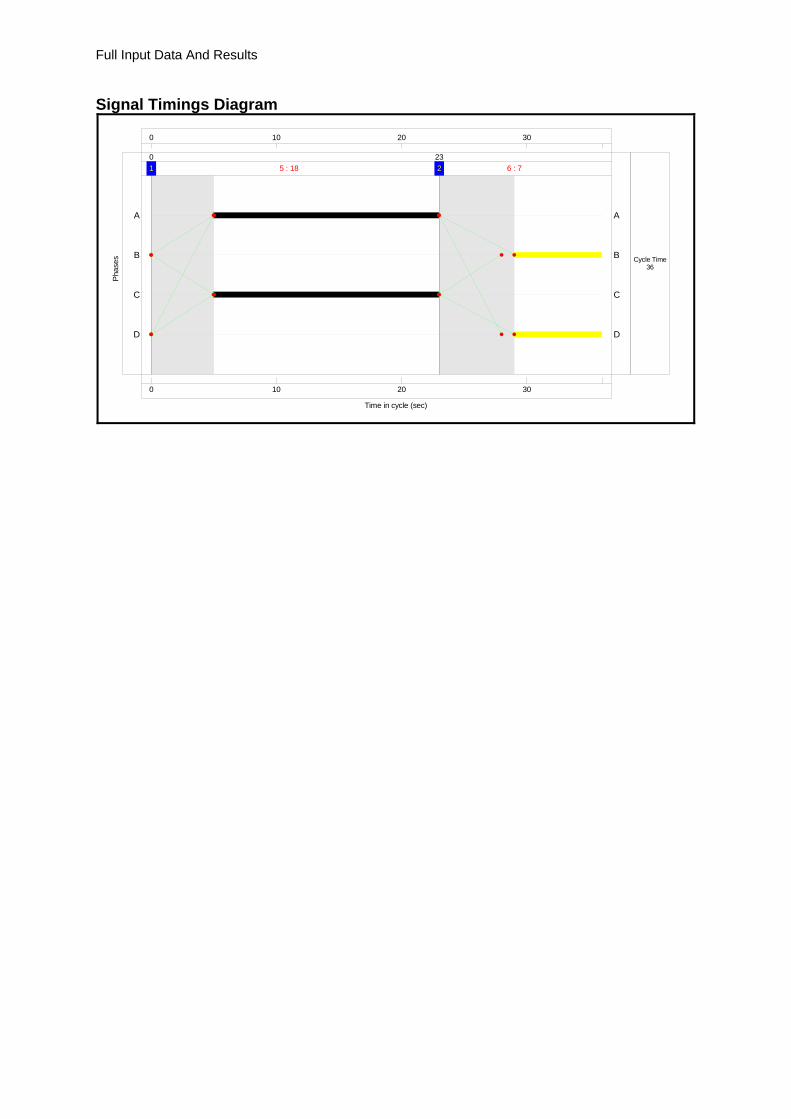
Signal Timings Diagram
0
0
10
10
20
20
30
30
Time in cycle (sec)
Pha
ses
1 5 : 18
0
2 6 : 7
23
D D
C C
B B
A A
Cycle Time36
Full Input Data And Results
Link Results
Link Num
Link Desc Link Type
Stage Stream
Position In Filtered Route
Full Phase Arrow Phase
Num Greens
Total Green (s)
Arrow Green (s)
Demand Flow (pcu)
Max Sat Flow (pcu/Hr)
Ave Sat Flow (pcu/Hr)
Capacity (pcu)
Deg Sat (%)
1/1 Carnsew
Road (E) Left Ahead
U N/A N/A A 1 18 - 651 1914 1914 1010 64.4
1/2 Carnsew Road (E)
Right O N/A N/A A 1 18 - 150 1787 488 258 58.2
2/1 Right Left
Ahead O N/A N/A B 1 7 - 27 1543 1455 323 8.4
3/1
Carnsew Road (W)
Ahead Right Left
O N/A N/A C 1 18 - 817 1945 1945 1026 79.6
4/1 Foodstore Left Ahead
U N/A N/A D 1 7 - 155 1665 1665 370 41.9
4/2 Foodstore
Right O N/A N/A D 1 7 - 66 1835 1406 312 21.1
5/1 U N/A N/A - - - - 901 Inf Inf Inf 0.0
6/1 U N/A N/A - - - - 9 Inf Inf Inf 0.0
7/1 U N/A N/A - - - - 735 Inf Inf Inf 0.0
8/1 U N/A N/A - - - - 221 Inf Inf Inf 0.0

Full Input Data And Results
Link Num
Entering (pcu)
Leaving (pcu)
Turners In Gaps (pcu)
Turners When Unopposed (pcu)
Turners In Intergreen (pcu)
Uniform Delay (pcuHr)
Rand + Oversat Delay (pcuHr)
Storage Area Uniform Delay (pcuHr)
Total Delay (pcuHr)
Av. Delay Per Veh (s/pcu)
Max. Back of Uniform Queue (pcu)
Rand + Oversat Queue (pcu)
Mean Max Queue (pcu)
1/1 651 651 - - - 1.1 0.9 - 2.0 11.1 4.5 0.9 5.4
1/2 150 150 96 0 54 0.2 0.7 0.5 1.4 32.7 0.8 0.7 1.4
2/1 27 27 8 0 0 0.1 0.0 0.0 0.1 18.4 0.2 0.0 0.3
3/1 817 817 8 0 0 1.6 1.9 0.0 3.5 15.4 6.6 1.9 8.5
4/1 155 155 - - - 0.5 0.4 - 0.9 20.4 1.3 0.4 1.7
4/2 66 66 66 0 0 0.2 0.1 0.0 0.4 19.9 0.5 0.1 0.7
5/1 901 901 - - - 0.0 0.0 - 0.0 0.0 0.0 0.0 0.0
6/1 9 9 - - - 0.0 0.0 - 0.0 0.0 0.0 0.0 0.0
7/1 735 735 - - - 0.0 0.0 - 0.0 0.0 0.0 0.0 0.0
8/1 221 221 - - - 0.0 0.0 - 0.0 0.0 0.0 0.0 0.0
PRC for Signalled Links (%): 13.1 Total Delay for Signalled Links (pcuHr): 8.24 PRC Over All Links (%): 13.1 Total Delay Over All Links(pcuHr): 8.24 Cycle Time (s): 36

APPENDIX K
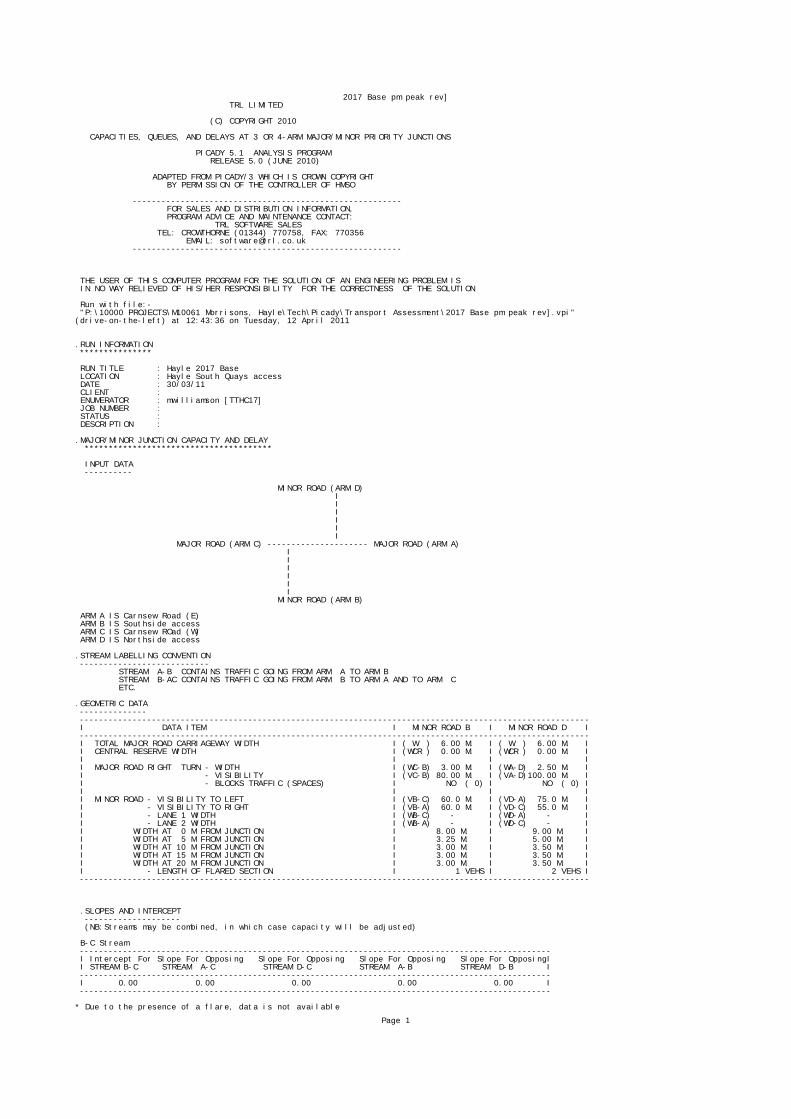
2017 Base pm peak rev] TRL LIMITED (C) COPYRIGHT 2010 CAPACITIES, QUEUES, AND DELAYS AT 3 OR 4-ARM MAJOR/MINOR PRIORITY JUNCTIONS PICADY 5.1 ANALYSIS PROGRAM RELEASE 5.0 (JUNE 2010) ADAPTED FROM PICADY/3 WHICH IS CROWN COPYRIGHT BY PERMISSION OF THE CONTROLLER OF HMSO -------------------------------------------------------- FOR SALES AND DISTRIBUTION INFORMATION, PROGRAM ADVICE AND MAINTENANCE CONTACT: TRL SOFTWARE SALES TEL: CROWTHORNE (01344) 770758, FAX: 770356 EMAIL: [email protected] -------------------------------------------------------- THE USER OF THIS COMPUTER PROGRAM FOR THE SOLUTION OF AN ENGINEERING PROBLEM IS IN NO WAY RELIEVED OF HIS/HER RESPONSIBILITY FOR THE CORRECTNESS OF THE SOLUTION Run with file:- "P:\10000 PROJECTS\M10061 Morrisons, Hayle\Tech\Picady\Transport Assessment\2017 Base pm peak rev].vpi"(drive-on-the-left) at 12:43:36 on Tuesday, 12 April 2011 .RUN INFORMATION *************** RUN TITLE : Hayle 2017 Base LOCATION : Hayle South Quays access DATE : 30/03/11 CLIENT : ENUMERATOR : mwilliamson [TTHC17] JOB NUMBER : STATUS : DESCRIPTION : .MAJOR/MINOR JUNCTION CAPACITY AND DELAY *************************************** INPUT DATA ---------- MINOR ROAD (ARM D) I I I I I I MAJOR ROAD (ARM C) --------------------- MAJOR ROAD (ARM A) I I I I I I MINOR ROAD (ARM B) ARM A IS Carnsew Road (E) ARM B IS Southside access ARM C IS Carnsew ROad (W) ARM D IS Northside access .STREAM LABELLING CONVENTION --------------------------- STREAM A-B CONTAINS TRAFFIC GOING FROM ARM A TO ARM B STREAM B-AC CONTAINS TRAFFIC GOING FROM ARM B TO ARM A AND TO ARM C ETC. .GEOMETRIC DATA -------------- ---------------------------------------------------------------------------------------------------------- I DATA ITEM I MINOR ROAD B I MINOR ROAD D I ---------------------------------------------------------------------------------------------------------- I TOTAL MAJOR ROAD CARRIAGEWAY WIDTH I ( W ) 6.00 M. I ( W ) 6.00 M. I I CENTRAL RESERVE WIDTH I (WCR ) 0.00 M. I (WCR ) 0.00 M. I I I I I I MAJOR ROAD RIGHT TURN - WIDTH I (WC-B) 3.00 M. I (WA-D) 2.50 M. I I - VISIBILITY I (VC-B) 80.00 M. I (VA-D)100.00 M. I I - BLOCKS TRAFFIC (SPACES) I NO ( 0) I NO ( 0) I I I I I I MINOR ROAD - VISIBILITY TO LEFT I (VB-C) 60.0 M. I (VD-A) 75.0 M. I I - VISIBILITY TO RIGHT I (VB-A) 60.0 M. I (VD-C) 55.0 M. I I - LANE 1 WIDTH I (WB-C) - I (WD-A) - I I - LANE 2 WIDTH I (WB-A) - I (WD-C) - I I WIDTH AT 0 M FROM JUNCTION I 8.00 M. I 9.00 M. I I WIDTH AT 5 M FROM JUNCTION I 3.25 M. I 5.00 M. I I WIDTH AT 10 M FROM JUNCTION I 3.00 M. I 3.50 M. I I WIDTH AT 15 M FROM JUNCTION I 3.00 M. I 3.50 M. I I WIDTH AT 20 M FROM JUNCTION I 3.00 M. I 3.50 M. I I - LENGTH OF FLARED SECTION I 1 VEHS I 2 VEHS I ---------------------------------------------------------------------------------------------------------- .SLOPES AND INTERCEPT -------------------- (NB:Streams may be combined, in which case capacity will be adjusted) B-C Stream -------------------------------------------------------------------------------------------------- I Intercept For Slope For Opposing Slope For Opposing Slope For Opposing Slope For OpposingI I STREAM B-C STREAM A-C STREAM D-C STREAM A-B STREAM D-B I -------------------------------------------------------------------------------------------------- I 0.00 0.00 0.00 0.00 0.00 I -------------------------------------------------------------------------------------------------- * Due to the presence of a flare, data is not available
Page 1
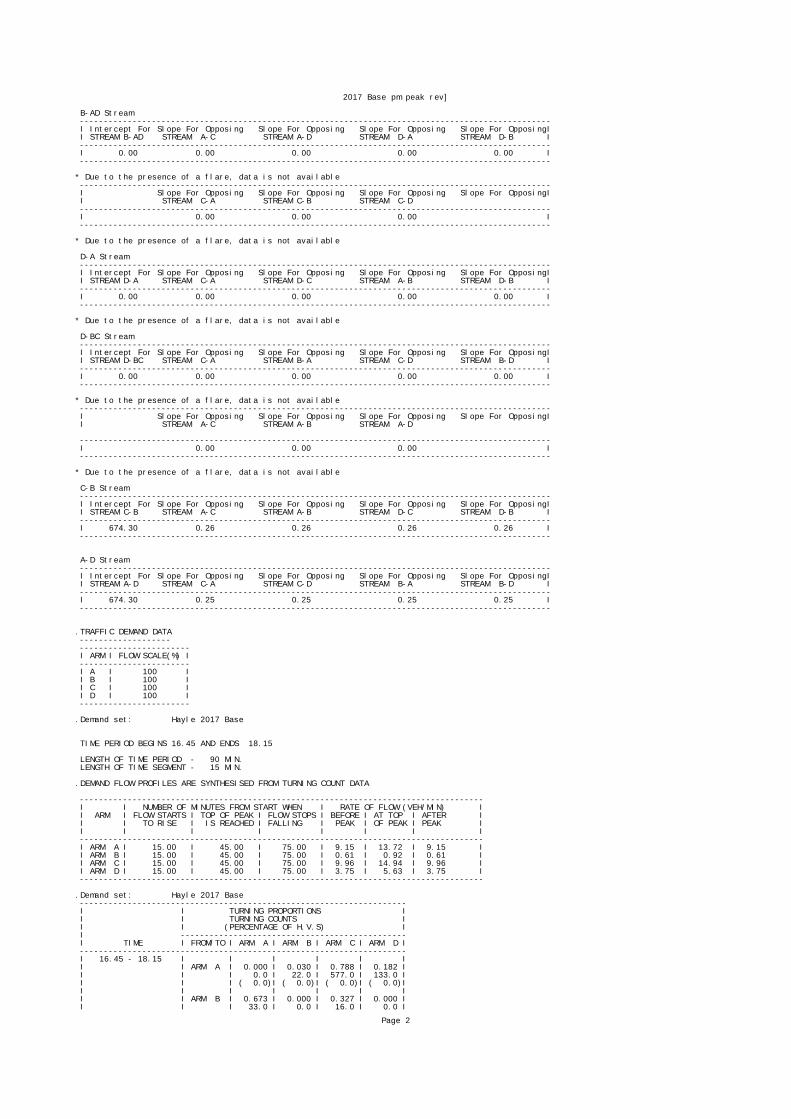
2017 Base pm peak rev] B-AD Stream -------------------------------------------------------------------------------------------------- I Intercept For Slope For Opposing Slope For Opposing Slope For Opposing Slope For OpposingI I STREAM B-AD STREAM A-C STREAM A-D STREAM D-A STREAM D-B I -------------------------------------------------------------------------------------------------- I 0.00 0.00 0.00 0.00 0.00 I -------------------------------------------------------------------------------------------------- * Due to the presence of a flare, data is not available -------------------------------------------------------------------------------------------------- I Slope For Opposing Slope For Opposing Slope For Opposing Slope For OpposingI I STREAM C-A STREAM C-B STREAM C-D -------------------------------------------------------------------------------------------------- I 0.00 0.00 0.00 I -------------------------------------------------------------------------------------------------- * Due to the presence of a flare, data is not available D-A Stream -------------------------------------------------------------------------------------------------- I Intercept For Slope For Opposing Slope For Opposing Slope For Opposing Slope For OpposingI I STREAM D-A STREAM C-A STREAM D-C STREAM A-B STREAM D-B I -------------------------------------------------------------------------------------------------- I 0.00 0.00 0.00 0.00 0.00 I -------------------------------------------------------------------------------------------------- * Due to the presence of a flare, data is not available D-BC Stream -------------------------------------------------------------------------------------------------- I Intercept For Slope For Opposing Slope For Opposing Slope For Opposing Slope For OpposingI I STREAM D-BC STREAM C-A STREAM B-A STREAM C-D STREAM B-D I -------------------------------------------------------------------------------------------------- I 0.00 0.00 0.00 0.00 0.00 I -------------------------------------------------------------------------------------------------- * Due to the presence of a flare, data is not available -------------------------------------------------------------------------------------------------- I Slope For Opposing Slope For Opposing Slope For Opposing Slope For OpposingI I STREAM A-C STREAM A-B STREAM A-D -------------------------------------------------------------------------------------------------- I 0.00 0.00 0.00 I -------------------------------------------------------------------------------------------------- * Due to the presence of a flare, data is not available C-B Stream -------------------------------------------------------------------------------------------------- I Intercept For Slope For Opposing Slope For Opposing Slope For Opposing Slope For OpposingI I STREAM C-B STREAM A-C STREAM A-B STREAM D-C STREAM D-B I -------------------------------------------------------------------------------------------------- I 674.30 0.26 0.26 0.26 0.26 I -------------------------------------------------------------------------------------------------- A-D Stream -------------------------------------------------------------------------------------------------- I Intercept For Slope For Opposing Slope For Opposing Slope For Opposing Slope For OpposingI I STREAM A-D STREAM C-A STREAM C-D STREAM B-A STREAM B-D I -------------------------------------------------------------------------------------------------- I 674.30 0.25 0.25 0.25 0.25 I -------------------------------------------------------------------------------------------------- .TRAFFIC DEMAND DATA ------------------- ----------------------- I ARM I FLOW SCALE(%) I ----------------------- I A I 100 I I B I 100 I I C I 100 I I D I 100 I ----------------------- .Demand set: Hayle 2017 Base TIME PERIOD BEGINS 16.45 AND ENDS 18.15 LENGTH OF TIME PERIOD - 90 MIN. LENGTH OF TIME SEGMENT - 15 MIN. .DEMAND FLOW PROFILES ARE SYNTHESISED FROM TURNING COUNT DATA ------------------------------------------------------------------------------------ I I NUMBER OF MINUTES FROM START WHEN I RATE OF FLOW (VEH/MIN) I I ARM I FLOW STARTS I TOP OF PEAK I FLOW STOPS I BEFORE I AT TOP I AFTER I I I TO RISE I IS REACHED I FALLING I PEAK I OF PEAK I PEAK I I I I I I I I I ------------------------------------------------------------------------------------ I ARM A I 15.00 I 45.00 I 75.00 I 9.15 I 13.72 I 9.15 I I ARM B I 15.00 I 45.00 I 75.00 I 0.61 I 0.92 I 0.61 I I ARM C I 15.00 I 45.00 I 75.00 I 9.96 I 14.94 I 9.96 I I ARM D I 15.00 I 45.00 I 75.00 I 3.75 I 5.63 I 3.75 I ------------------------------------------------------------------------------------ .Demand set: Hayle 2017 Base -------------------------------------------------------------------- I I TURNING PROPORTIONS I I I TURNING COUNTS I I I (PERCENTAGE OF H.V.S) I I ----------------------------------------------- I TIME I FROM/TO I ARM A I ARM B I ARM C I ARM D I -------------------------------------------------------------------- I 16.45 - 18.15 I I I I I I I I ARM A I 0.000 I 0.030 I 0.788 I 0.182 I I I I 0.0 I 22.0 I 577.0 I 133.0 I I I I ( 0.0)I ( 0.0)I ( 0.0)I ( 0.0)I I I I I I I I I I ARM B I 0.673 I 0.000 I 0.327 I 0.000 I I I I 33.0 I 0.0 I 16.0 I 0.0 I
Page 2

2017 Base pm peak rev] I I I ( 0.0)I ( 0.0)I ( 0.0)I ( 0.0)I I I I I I I I I I ARM C I 0.908 I 0.013 I 0.000 I 0.079 I I I I 724.0 I 10.0 I 0.0 I 63.0 I I I I ( 0.0)I ( 0.0)I ( 0.0)I ( 0.0)I I I I I I I I I I ARM D I 0.680 I 0.000 I 0.320 I 0.000 I I I I 204.0 I 0.0 I 96.0 I 0.0 I I I I ( 0.0)I ( 0.0)I ( 0.0)I ( 0.0)I I I I I I I I -------------------------------------------------------------------- TURNING PROPORTIONS ARE CALCULATED FROM TURNING COUNT DATA . QUEUE AND DELAY INFORMATION FOR EACH 15 MIN TIME SEGMENT -------------------------------------------------------- FOR COMBINED DEMAND SETS AND FOR TIME PERIOD 1.------------------------------------------------------------------------------------------------------------------ I TIME DEMAND CAPACITY DEMAND/ PEDESTRIAN START END DELAY GEOMETRIC DELAY AVERAGE DELAY I I (VEH/MIN) (VEH/MIN) CAPACITY FLOW QUEUE QUEUE (VEH.MIN/ (VEH.MIN/ PER ARRIVING I I (RFC) (PEDS/MIN) (VEHS) (VEHS) TIME SEGMENT) TIME SEGMENT) VEHICLE (MIN) I I 16.45-17.00 I I B-C 0.20 8.66 0.023 0.00 0.02 0.3 0.12 I I B-AD 0.41 5.39 0.077 0.00 0.08 1.2 0.20 I I A-B 0.28 I I A-C 7.24 I I A-D 1.67 8.27 0.202 0.00 0.25 3.6 0.15 I I D-A 2.56 8.84 0.290 0.00 0.40 5.7 0.16 I I D-BC 1.20 4.60 0.262 0.00 0.35 4.8 0.29 I I C-D 0.79 I I C-A 9.08 I I C-B 0.13 8.96 0.014 0.00 0.01 0.2 0.11 I I I.------------------------------------------------------------------------------------------------------------------ .------------------------------------------------------------------------------------------------------------------ I TIME DEMAND CAPACITY DEMAND/ PEDESTRIAN START END DELAY GEOMETRIC DELAY AVERAGE DELAY I I (VEH/MIN) (VEH/MIN) CAPACITY FLOW QUEUE QUEUE (VEH.MIN/ (VEH.MIN/ PER ARRIVING I I (RFC) (PEDS/MIN) (VEHS) (VEHS) TIME SEGMENT) TIME SEGMENT) VEHICLE (MIN) I I 17.00-17.15 I I B-C 0.24 8.17 0.029 0.02 0.03 0.4 0.13 I I B-AD 0.49 4.65 0.106 0.08 0.12 1.7 0.24 I I A-B 0.33 I I A-C 8.65 I I A-D 1.99 7.77 0.257 0.25 0.34 4.9 0.17 I I D-A 3.06 8.08 0.379 0.40 0.60 8.6 0.20 I I D-BC 1.44 3.75 0.384 0.35 0.60 8.3 0.43 I I C-D 0.94 I I C-A 10.85 I I C-B 0.15 8.51 0.018 0.01 0.02 0.3 0.12 I I I.------------------------------------------------------------------------------------------------------------------ .------------------------------------------------------------------------------------------------------------------ I TIME DEMAND CAPACITY DEMAND/ PEDESTRIAN START END DELAY GEOMETRIC DELAY AVERAGE DELAY I I (VEH/MIN) (VEH/MIN) CAPACITY FLOW QUEUE QUEUE (VEH.MIN/ (VEH.MIN/ PER ARRIVING I I (RFC) (PEDS/MIN) (VEHS) (VEHS) TIME SEGMENT) TIME SEGMENT) VEHICLE (MIN) I I 17.15-17.30 I I B-C 0.29 7.45 0.039 0.03 0.04 0.6 0.14 I I B-AD 0.61 3.62 0.167 0.12 0.20 2.8 0.33 I I A-B 0.40 I I A-C 10.59 I I A-D 2.44 7.07 0.345 0.34 0.52 7.4 0.21 I I D-A 3.74 6.14 0.609 0.60 1.46 19.8 0.40 I I D-BC 1.76 2.50 0.704 0.60 1.91 23.3 1.11 I I C-D 1.16 I I C-A 13.29 I I C-B 0.18 7.90 0.023 0.02 0.02 0.3 0.13 I I I.------------------------------------------------------------------------------------------------------------------ .------------------------------------------------------------------------------------------------------------------ I TIME DEMAND CAPACITY DEMAND/ PEDESTRIAN START END DELAY GEOMETRIC DELAY AVERAGE DELAY I I (VEH/MIN) (VEH/MIN) CAPACITY FLOW QUEUE QUEUE (VEH.MIN/ (VEH.MIN/ PER ARRIVING I I (RFC) (PEDS/MIN) (VEHS) (VEHS) TIME SEGMENT) TIME SEGMENT) VEHICLE (MIN) I I 17.30-17.45 I I B-C 0.29 7.42 0.040 0.04 0.04 0.6 0.14 I I B-AD 0.61 3.60 0.168 0.20 0.20 3.0 0.33 I I A-B 0.40 I I A-C 10.59 I I A-D 2.44 7.07 0.345 0.52 0.52 7.8 0.22 I I D-A 3.74 5.87 0.638 1.46 1.66 24.0 0.46 I I D-BC 1.76 2.47 0.714 1.91 2.15 30.8 1.32 I I C-D 1.16 I I C-A 13.29 I I C-B 0.18 7.87 0.023 0.02 0.02 0.4 0.13 I I I.------------------------------------------------------------------------------------------------------------------ .------------------------------------------------------------------------------------------------------------------ I TIME DEMAND CAPACITY DEMAND/ PEDESTRIAN START END DELAY GEOMETRIC DELAY AVERAGE DELAY I I (VEH/MIN) (VEH/MIN) CAPACITY FLOW QUEUE QUEUE (VEH.MIN/ (VEH.MIN/ PER ARRIVING I I (RFC) (PEDS/MIN) (VEHS) (VEHS) TIME SEGMENT) TIME SEGMENT) VEHICLE (MIN) I I 17.45-18.00 I I B-C 0.24 8.13 0.029 0.04 0.03 0.5 0.13 I I B-AD 0.49 4.62 0.107 0.20 0.12 1.9 0.24 I I A-B 0.33 I I A-C 8.65 I I A-D 1.99 7.77 0.257 0.52 0.35 5.5 0.17 I I D-A 3.06 7.97 0.384 1.66 0.64 10.3 0.21 I I D-BC 1.44 3.73 0.386 2.15 0.66 11.6 0.47 I I C-D 0.94 I I C-A 10.85 I I C-B 0.15 8.48 0.018 0.02 0.02 0.3 0.12 I I I.------------------------------------------------------------------------------------------------------------------ .------------------------------------------------------------------------------------------------------------------ I TIME DEMAND CAPACITY DEMAND/ PEDESTRIAN START END DELAY GEOMETRIC DELAY AVERAGE DELAY I I (VEH/MIN) (VEH/MIN) CAPACITY FLOW QUEUE QUEUE (VEH.MIN/ (VEH.MIN/ PER ARRIVING I I (RFC) (PEDS/MIN) (VEHS) (VEHS) TIME SEGMENT) TIME SEGMENT) VEHICLE (MIN) I I 18.00-18.15 I I B-C 0.20 8.65 0.023 0.03 0.02 0.4 0.12 I I B-AD 0.41 5.38 0.077 0.12 0.08 1.3 0.20 I
Page 3
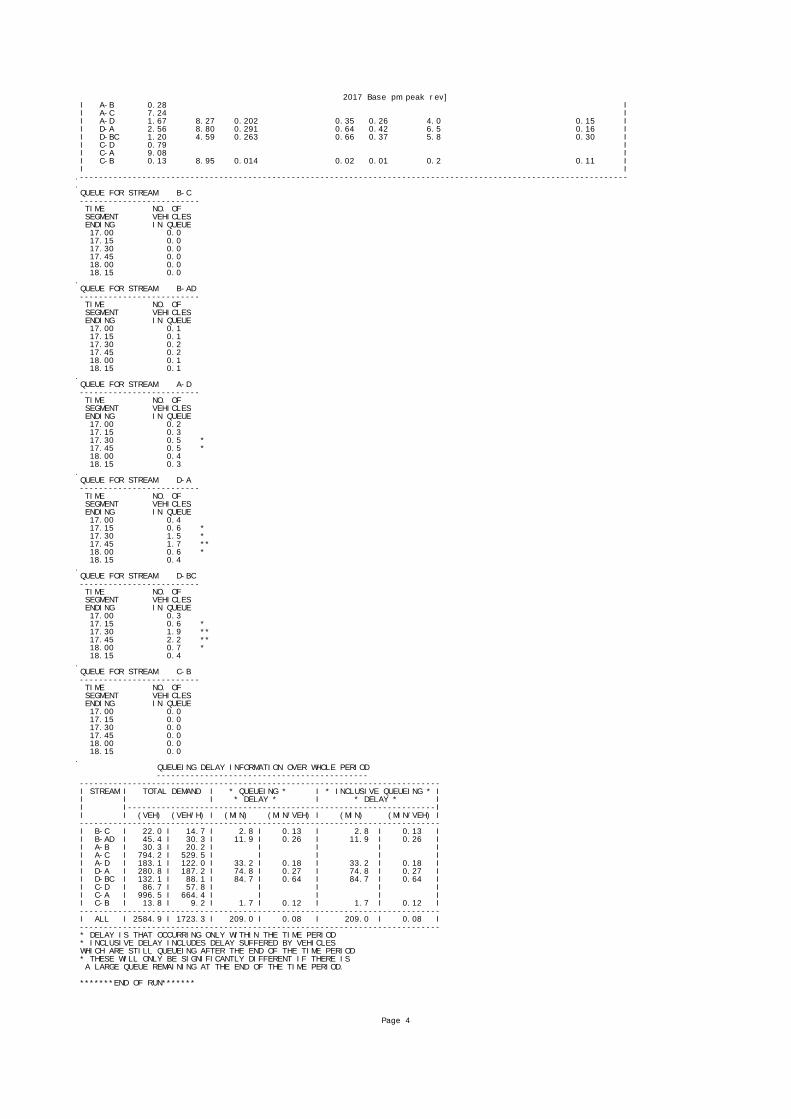
2017 Base pm peak rev] I A-B 0.28 I I A-C 7.24 I I A-D 1.67 8.27 0.202 0.35 0.26 4.0 0.15 I I D-A 2.56 8.80 0.291 0.64 0.42 6.5 0.16 I I D-BC 1.20 4.59 0.263 0.66 0.37 5.8 0.30 I I C-D 0.79 I I C-A 9.08 I I C-B 0.13 8.95 0.014 0.02 0.01 0.2 0.11 I I I.------------------------------------------------------------------------------------------------------------------. QUEUE FOR STREAM B-C ------------------------- TIME NO. OF SEGMENT VEHICLES ENDING IN QUEUE 17.00 0.0 17.15 0.0 17.30 0.0 17.45 0.0 18.00 0.0 18.15 0.0. QUEUE FOR STREAM B-AD ------------------------- TIME NO. OF SEGMENT VEHICLES ENDING IN QUEUE 17.00 0.1 17.15 0.1 17.30 0.2 17.45 0.2 18.00 0.1 18.15 0.1. QUEUE FOR STREAM A-D ------------------------- TIME NO. OF SEGMENT VEHICLES ENDING IN QUEUE 17.00 0.2 17.15 0.3 17.30 0.5 * 17.45 0.5 * 18.00 0.4 18.15 0.3. QUEUE FOR STREAM D-A ------------------------- TIME NO. OF SEGMENT VEHICLES ENDING IN QUEUE 17.00 0.4 17.15 0.6 * 17.30 1.5 * 17.45 1.7 ** 18.00 0.6 * 18.15 0.4. QUEUE FOR STREAM D-BC ------------------------- TIME NO. OF SEGMENT VEHICLES ENDING IN QUEUE 17.00 0.3 17.15 0.6 * 17.30 1.9 ** 17.45 2.2 ** 18.00 0.7 * 18.15 0.4. QUEUE FOR STREAM C-B ------------------------- TIME NO. OF SEGMENT VEHICLES ENDING IN QUEUE 17.00 0.0 17.15 0.0 17.30 0.0 17.45 0.0 18.00 0.0 18.15 0.0. QUEUEING DELAY INFORMATION OVER WHOLE PERIOD -------------------------------------------- --------------------------------------------------------------------------- I STREAM I TOTAL DEMAND I * QUEUEING * I * INCLUSIVE QUEUEING * I I I I * DELAY * I * DELAY * I I I----------------------------------------------------------------I I I (VEH) (VEH/H) I (MIN) (MIN/VEH) I (MIN) (MIN/VEH) I --------------------------------------------------------------------------- I B-C I 22.0 I 14.7 I 2.8 I 0.13 I 2.8 I 0.13 I I B-AD I 45.4 I 30.3 I 11.9 I 0.26 I 11.9 I 0.26 I I A-B I 30.3 I 20.2 I I I I I I A-C I 794.2 I 529.5 I I I I I I A-D I 183.1 I 122.0 I 33.2 I 0.18 I 33.2 I 0.18 I I D-A I 280.8 I 187.2 I 74.8 I 0.27 I 74.8 I 0.27 I I D-BC I 132.1 I 88.1 I 84.7 I 0.64 I 84.7 I 0.64 I I C-D I 86.7 I 57.8 I I I I I I C-A I 996.5 I 664.4 I I I I I I C-B I 13.8 I 9.2 I 1.7 I 0.12 I 1.7 I 0.12 I --------------------------------------------------------------------------- I ALL I 2584.9 I 1723.3 I 209.0 I 0.08 I 209.0 I 0.08 I --------------------------------------------------------------------------- * DELAY IS THAT OCCURRING ONLY WITHIN THE TIME PERIOD * INCLUSIVE DELAY INCLUDES DELAY SUFFERED BY VEHICLES WHICH ARE STILL QUEUEING AFTER THE END OF THE TIME PERIOD * THESE WILL ONLY BE SIGNIFICANTLY DIFFERENT IF THERE IS A LARGE QUEUE REMAINING AT THE END OF THE TIME PERIOD. *******END OF RUN*******
Page 4
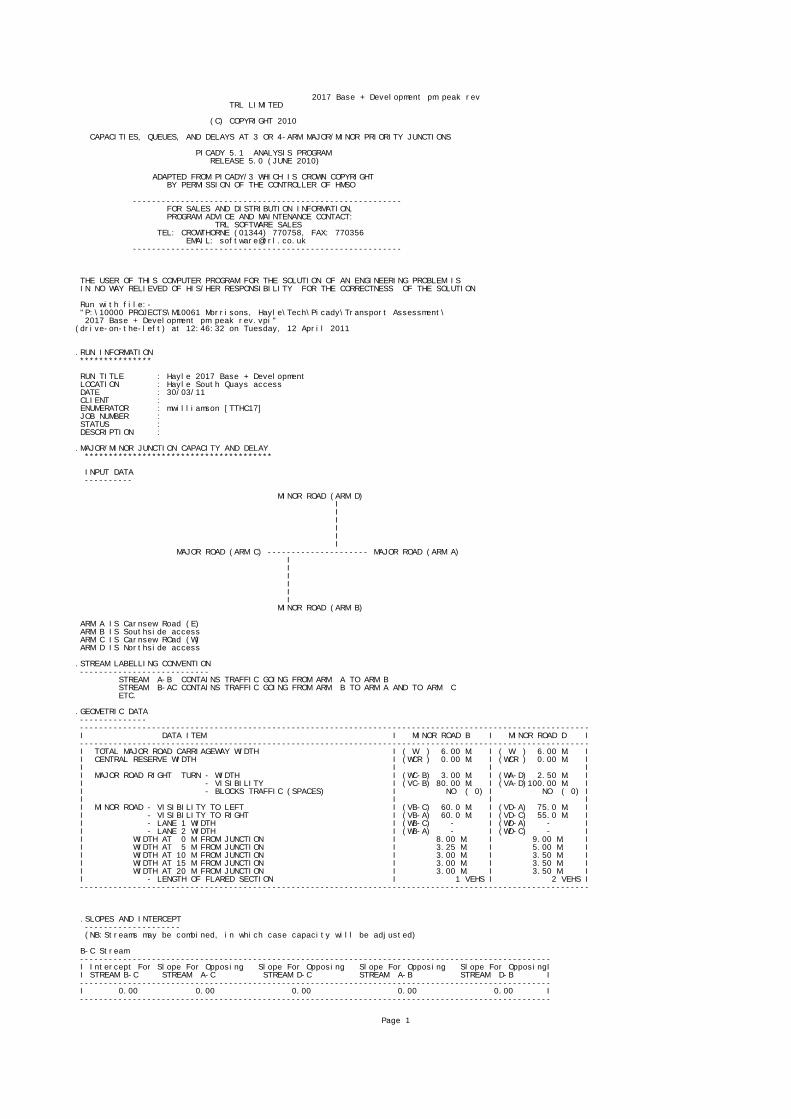
2017 Base + Development pm peak rev TRL LIMITED (C) COPYRIGHT 2010 CAPACITIES, QUEUES, AND DELAYS AT 3 OR 4-ARM MAJOR/MINOR PRIORITY JUNCTIONS PICADY 5.1 ANALYSIS PROGRAM RELEASE 5.0 (JUNE 2010) ADAPTED FROM PICADY/3 WHICH IS CROWN COPYRIGHT BY PERMISSION OF THE CONTROLLER OF HMSO -------------------------------------------------------- FOR SALES AND DISTRIBUTION INFORMATION, PROGRAM ADVICE AND MAINTENANCE CONTACT: TRL SOFTWARE SALES TEL: CROWTHORNE (01344) 770758, FAX: 770356 EMAIL: [email protected] -------------------------------------------------------- THE USER OF THIS COMPUTER PROGRAM FOR THE SOLUTION OF AN ENGINEERING PROBLEM IS IN NO WAY RELIEVED OF HIS/HER RESPONSIBILITY FOR THE CORRECTNESS OF THE SOLUTION Run with file:- "P:\10000 PROJECTS\M10061 Morrisons, Hayle\Tech\Picady\Transport Assessment\ 2017 Base + Development pm peak rev.vpi"(drive-on-the-left) at 12:46:32 on Tuesday, 12 April 2011 .RUN INFORMATION *************** RUN TITLE : Hayle 2017 Base + Development LOCATION : Hayle South Quays access DATE : 30/03/11 CLIENT : ENUMERATOR : mwilliamson [TTHC17] JOB NUMBER : STATUS : DESCRIPTION : .MAJOR/MINOR JUNCTION CAPACITY AND DELAY *************************************** INPUT DATA ---------- MINOR ROAD (ARM D) I I I I I I MAJOR ROAD (ARM C) --------------------- MAJOR ROAD (ARM A) I I I I I I MINOR ROAD (ARM B) ARM A IS Carnsew Road (E) ARM B IS Southside access ARM C IS Carnsew ROad (W) ARM D IS Northside access .STREAM LABELLING CONVENTION --------------------------- STREAM A-B CONTAINS TRAFFIC GOING FROM ARM A TO ARM B STREAM B-AC CONTAINS TRAFFIC GOING FROM ARM B TO ARM A AND TO ARM C ETC. .GEOMETRIC DATA -------------- ---------------------------------------------------------------------------------------------------------- I DATA ITEM I MINOR ROAD B I MINOR ROAD D I ---------------------------------------------------------------------------------------------------------- I TOTAL MAJOR ROAD CARRIAGEWAY WIDTH I ( W ) 6.00 M. I ( W ) 6.00 M. I I CENTRAL RESERVE WIDTH I (WCR ) 0.00 M. I (WCR ) 0.00 M. I I I I I I MAJOR ROAD RIGHT TURN - WIDTH I (WC-B) 3.00 M. I (WA-D) 2.50 M. I I - VISIBILITY I (VC-B) 80.00 M. I (VA-D)100.00 M. I I - BLOCKS TRAFFIC (SPACES) I NO ( 0) I NO ( 0) I I I I I I MINOR ROAD - VISIBILITY TO LEFT I (VB-C) 60.0 M. I (VD-A) 75.0 M. I I - VISIBILITY TO RIGHT I (VB-A) 60.0 M. I (VD-C) 55.0 M. I I - LANE 1 WIDTH I (WB-C) - I (WD-A) - I I - LANE 2 WIDTH I (WB-A) - I (WD-C) - I I WIDTH AT 0 M FROM JUNCTION I 8.00 M. I 9.00 M. I I WIDTH AT 5 M FROM JUNCTION I 3.25 M. I 5.00 M. I I WIDTH AT 10 M FROM JUNCTION I 3.00 M. I 3.50 M. I I WIDTH AT 15 M FROM JUNCTION I 3.00 M. I 3.50 M. I I WIDTH AT 20 M FROM JUNCTION I 3.00 M. I 3.50 M. I I - LENGTH OF FLARED SECTION I 1 VEHS I 2 VEHS I ---------------------------------------------------------------------------------------------------------- .SLOPES AND INTERCEPT -------------------- (NB:Streams may be combined, in which case capacity will be adjusted) B-C Stream -------------------------------------------------------------------------------------------------- I Intercept For Slope For Opposing Slope For Opposing Slope For Opposing Slope For OpposingI I STREAM B-C STREAM A-C STREAM D-C STREAM A-B STREAM D-B I -------------------------------------------------------------------------------------------------- I 0.00 0.00 0.00 0.00 0.00 I --------------------------------------------------------------------------------------------------
Page 1

2017 Base + Development pm peak rev* Due to the presence of a flare, data is not available B-AD Stream -------------------------------------------------------------------------------------------------- I Intercept For Slope For Opposing Slope For Opposing Slope For Opposing Slope For OpposingI I STREAM B-AD STREAM A-C STREAM A-D STREAM D-A STREAM D-B I -------------------------------------------------------------------------------------------------- I 0.00 0.00 0.00 0.00 0.00 I -------------------------------------------------------------------------------------------------- * Due to the presence of a flare, data is not available -------------------------------------------------------------------------------------------------- I Slope For Opposing Slope For Opposing Slope For Opposing Slope For OpposingI I STREAM C-A STREAM C-B STREAM C-D -------------------------------------------------------------------------------------------------- I 0.00 0.00 0.00 I -------------------------------------------------------------------------------------------------- * Due to the presence of a flare, data is not available D-A Stream -------------------------------------------------------------------------------------------------- I Intercept For Slope For Opposing Slope For Opposing Slope For Opposing Slope For OpposingI I STREAM D-A STREAM C-A STREAM D-C STREAM A-B STREAM D-B I -------------------------------------------------------------------------------------------------- I 0.00 0.00 0.00 0.00 0.00 I -------------------------------------------------------------------------------------------------- * Due to the presence of a flare, data is not available D-BC Stream -------------------------------------------------------------------------------------------------- I Intercept For Slope For Opposing Slope For Opposing Slope For Opposing Slope For OpposingI I STREAM D-BC STREAM C-A STREAM B-A STREAM C-D STREAM B-D I -------------------------------------------------------------------------------------------------- I 0.00 0.00 0.00 0.00 0.00 I -------------------------------------------------------------------------------------------------- * Due to the presence of a flare, data is not available -------------------------------------------------------------------------------------------------- I Slope For Opposing Slope For Opposing Slope For Opposing Slope For OpposingI I STREAM A-C STREAM A-B STREAM A-D -------------------------------------------------------------------------------------------------- I 0.00 0.00 0.00 I -------------------------------------------------------------------------------------------------- * Due to the presence of a flare, data is not available C-B Stream -------------------------------------------------------------------------------------------------- I Intercept For Slope For Opposing Slope For Opposing Slope For Opposing Slope For OpposingI I STREAM C-B STREAM A-C STREAM A-B STREAM D-C STREAM D-B I -------------------------------------------------------------------------------------------------- I 674.30 0.26 0.26 0.26 0.26 I -------------------------------------------------------------------------------------------------- A-D Stream -------------------------------------------------------------------------------------------------- I Intercept For Slope For Opposing Slope For Opposing Slope For Opposing Slope For OpposingI I STREAM A-D STREAM C-A STREAM C-D STREAM B-A STREAM B-D I -------------------------------------------------------------------------------------------------- I 674.30 0.25 0.25 0.25 0.25 I -------------------------------------------------------------------------------------------------- .TRAFFIC DEMAND DATA ------------------- ----------------------- I ARM I FLOW SCALE(%) I ----------------------- I A I 100 I I B I 100 I I C I 100 I I D I 100 I ----------------------- .Demand set: Hayle 2017 Base + Development TIME PERIOD BEGINS 16.45 AND ENDS 18.15 LENGTH OF TIME PERIOD - 90 MIN. LENGTH OF TIME SEGMENT - 15 MIN. .DEMAND FLOW PROFILES ARE SYNTHESISED FROM TURNING COUNT DATA ------------------------------------------------------------------------------------ I I NUMBER OF MINUTES FROM START WHEN I RATE OF FLOW (VEH/MIN) I I ARM I FLOW STARTS I TOP OF PEAK I FLOW STOPS I BEFORE I AT TOP I AFTER I I I TO RISE I IS REACHED I FALLING I PEAK I OF PEAK I PEAK I I I I I I I I I ------------------------------------------------------------------------------------ I ARM A I 15.00 I 45.00 I 75.00 I 10.55 I 15.83 I 10.55 I I ARM B I 15.00 I 45.00 I 75.00 I 0.61 I 0.92 I 0.61 I I ARM C I 15.00 I 45.00 I 75.00 I 11.25 I 16.88 I 11.25 I I ARM D I 15.00 I 45.00 I 75.00 I 3.75 I 5.63 I 3.75 I ------------------------------------------------------------------------------------ .Demand set: Hayle 2017 Base + Development -------------------------------------------------------------------- I I TURNING PROPORTIONS I I I TURNING COUNTS I I I (PERCENTAGE OF H.V.S) I I ----------------------------------------------- I TIME I FROM/TO I ARM A I ARM B I ARM C I ARM D I -------------------------------------------------------------------- I 16.45 - 18.15 I I I I I I I I ARM A I 0.000 I 0.026 I 0.816 I 0.158 I I I I 0.0 I 22.0 I 689.0 I 133.0 I I I I ( 0.0)I ( 0.0)I ( 0.0)I ( 0.0)I I I I I I I I I I ARM B I 0.673 I 0.000 I 0.327 I 0.000 I
Page 2
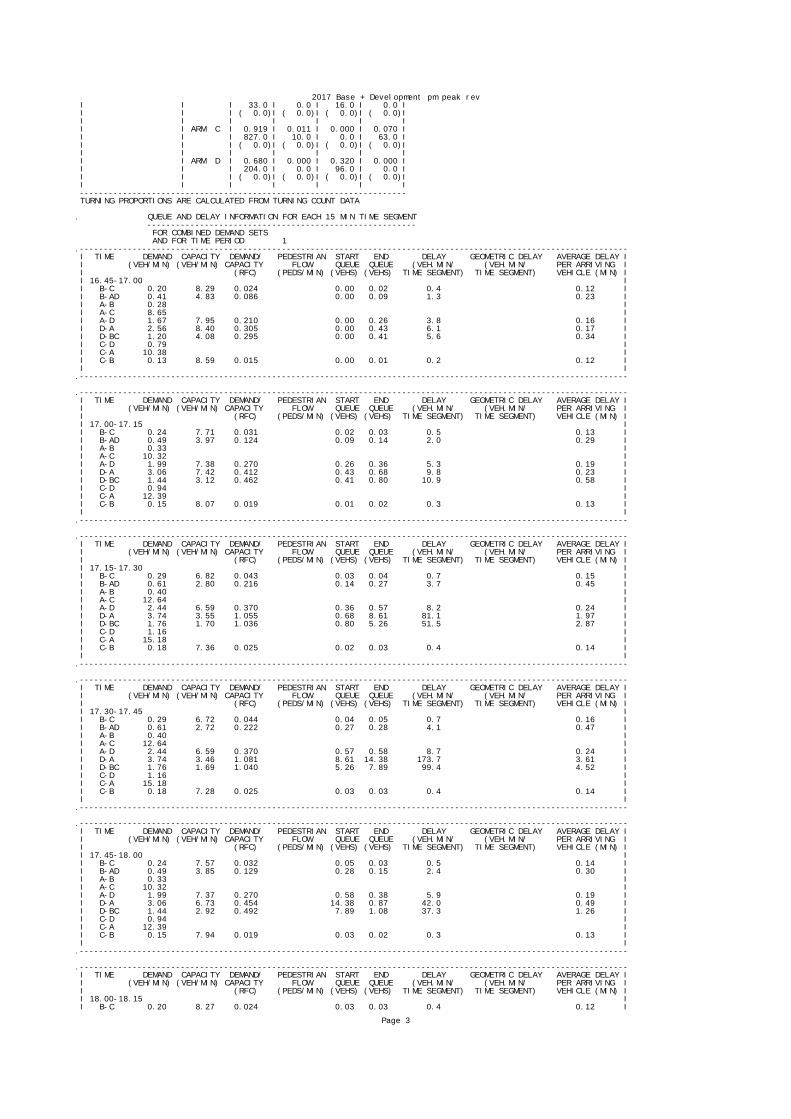
2017 Base + Development pm peak rev I I I 33.0 I 0.0 I 16.0 I 0.0 I I I I ( 0.0)I ( 0.0)I ( 0.0)I ( 0.0)I I I I I I I I I I ARM C I 0.919 I 0.011 I 0.000 I 0.070 I I I I 827.0 I 10.0 I 0.0 I 63.0 I I I I ( 0.0)I ( 0.0)I ( 0.0)I ( 0.0)I I I I I I I I I I ARM D I 0.680 I 0.000 I 0.320 I 0.000 I I I I 204.0 I 0.0 I 96.0 I 0.0 I I I I ( 0.0)I ( 0.0)I ( 0.0)I ( 0.0)I I I I I I I I -------------------------------------------------------------------- TURNING PROPORTIONS ARE CALCULATED FROM TURNING COUNT DATA . QUEUE AND DELAY INFORMATION FOR EACH 15 MIN TIME SEGMENT -------------------------------------------------------- FOR COMBINED DEMAND SETS AND FOR TIME PERIOD 1.------------------------------------------------------------------------------------------------------------------ I TIME DEMAND CAPACITY DEMAND/ PEDESTRIAN START END DELAY GEOMETRIC DELAY AVERAGE DELAY I I (VEH/MIN) (VEH/MIN) CAPACITY FLOW QUEUE QUEUE (VEH.MIN/ (VEH.MIN/ PER ARRIVING I I (RFC) (PEDS/MIN) (VEHS) (VEHS) TIME SEGMENT) TIME SEGMENT) VEHICLE (MIN) I I 16.45-17.00 I I B-C 0.20 8.29 0.024 0.00 0.02 0.4 0.12 I I B-AD 0.41 4.83 0.086 0.00 0.09 1.3 0.23 I I A-B 0.28 I I A-C 8.65 I I A-D 1.67 7.95 0.210 0.00 0.26 3.8 0.16 I I D-A 2.56 8.40 0.305 0.00 0.43 6.1 0.17 I I D-BC 1.20 4.08 0.295 0.00 0.41 5.6 0.34 I I C-D 0.79 I I C-A 10.38 I I C-B 0.13 8.59 0.015 0.00 0.01 0.2 0.12 I I I.------------------------------------------------------------------------------------------------------------------ .------------------------------------------------------------------------------------------------------------------ I TIME DEMAND CAPACITY DEMAND/ PEDESTRIAN START END DELAY GEOMETRIC DELAY AVERAGE DELAY I I (VEH/MIN) (VEH/MIN) CAPACITY FLOW QUEUE QUEUE (VEH.MIN/ (VEH.MIN/ PER ARRIVING I I (RFC) (PEDS/MIN) (VEHS) (VEHS) TIME SEGMENT) TIME SEGMENT) VEHICLE (MIN) I I 17.00-17.15 I I B-C 0.24 7.71 0.031 0.02 0.03 0.5 0.13 I I B-AD 0.49 3.97 0.124 0.09 0.14 2.0 0.29 I I A-B 0.33 I I A-C 10.32 I I A-D 1.99 7.38 0.270 0.26 0.36 5.3 0.19 I I D-A 3.06 7.42 0.412 0.43 0.68 9.8 0.23 I I D-BC 1.44 3.12 0.462 0.41 0.80 10.9 0.58 I I C-D 0.94 I I C-A 12.39 I I C-B 0.15 8.07 0.019 0.01 0.02 0.3 0.13 I I I.------------------------------------------------------------------------------------------------------------------ .------------------------------------------------------------------------------------------------------------------ I TIME DEMAND CAPACITY DEMAND/ PEDESTRIAN START END DELAY GEOMETRIC DELAY AVERAGE DELAY I I (VEH/MIN) (VEH/MIN) CAPACITY FLOW QUEUE QUEUE (VEH.MIN/ (VEH.MIN/ PER ARRIVING I I (RFC) (PEDS/MIN) (VEHS) (VEHS) TIME SEGMENT) TIME SEGMENT) VEHICLE (MIN) I I 17.15-17.30 I I B-C 0.29 6.82 0.043 0.03 0.04 0.7 0.15 I I B-AD 0.61 2.80 0.216 0.14 0.27 3.7 0.45 I I A-B 0.40 I I A-C 12.64 I I A-D 2.44 6.59 0.370 0.36 0.57 8.2 0.24 I I D-A 3.74 3.55 1.055 0.68 8.61 81.1 1.97 I I D-BC 1.76 1.70 1.036 0.80 5.26 51.5 2.87 I I C-D 1.16 I I C-A 15.18 I I C-B 0.18 7.36 0.025 0.02 0.03 0.4 0.14 I I I.------------------------------------------------------------------------------------------------------------------ .------------------------------------------------------------------------------------------------------------------ I TIME DEMAND CAPACITY DEMAND/ PEDESTRIAN START END DELAY GEOMETRIC DELAY AVERAGE DELAY I I (VEH/MIN) (VEH/MIN) CAPACITY FLOW QUEUE QUEUE (VEH.MIN/ (VEH.MIN/ PER ARRIVING I I (RFC) (PEDS/MIN) (VEHS) (VEHS) TIME SEGMENT) TIME SEGMENT) VEHICLE (MIN) I I 17.30-17.45 I I B-C 0.29 6.72 0.044 0.04 0.05 0.7 0.16 I I B-AD 0.61 2.72 0.222 0.27 0.28 4.1 0.47 I I A-B 0.40 I I A-C 12.64 I I A-D 2.44 6.59 0.370 0.57 0.58 8.7 0.24 I I D-A 3.74 3.46 1.081 8.61 14.38 173.7 3.61 I I D-BC 1.76 1.69 1.040 5.26 7.89 99.4 4.52 I I C-D 1.16 I I C-A 15.18 I I C-B 0.18 7.28 0.025 0.03 0.03 0.4 0.14 I I I.------------------------------------------------------------------------------------------------------------------ .------------------------------------------------------------------------------------------------------------------ I TIME DEMAND CAPACITY DEMAND/ PEDESTRIAN START END DELAY GEOMETRIC DELAY AVERAGE DELAY I I (VEH/MIN) (VEH/MIN) CAPACITY FLOW QUEUE QUEUE (VEH.MIN/ (VEH.MIN/ PER ARRIVING I I (RFC) (PEDS/MIN) (VEHS) (VEHS) TIME SEGMENT) TIME SEGMENT) VEHICLE (MIN) I I 17.45-18.00 I I B-C 0.24 7.57 0.032 0.05 0.03 0.5 0.14 I I B-AD 0.49 3.85 0.129 0.28 0.15 2.4 0.30 I I A-B 0.33 I I A-C 10.32 I I A-D 1.99 7.37 0.270 0.58 0.38 5.9 0.19 I I D-A 3.06 6.73 0.454 14.38 0.87 42.0 0.49 I I D-BC 1.44 2.92 0.492 7.89 1.08 37.3 1.26 I I C-D 0.94 I I C-A 12.39 I I C-B 0.15 7.94 0.019 0.03 0.02 0.3 0.13 I I I.------------------------------------------------------------------------------------------------------------------ .------------------------------------------------------------------------------------------------------------------ I TIME DEMAND CAPACITY DEMAND/ PEDESTRIAN START END DELAY GEOMETRIC DELAY AVERAGE DELAY I I (VEH/MIN) (VEH/MIN) CAPACITY FLOW QUEUE QUEUE (VEH.MIN/ (VEH.MIN/ PER ARRIVING I I (RFC) (PEDS/MIN) (VEHS) (VEHS) TIME SEGMENT) TIME SEGMENT) VEHICLE (MIN) I I 18.00-18.15 I I B-C 0.20 8.27 0.024 0.03 0.03 0.4 0.12 I
Page 3
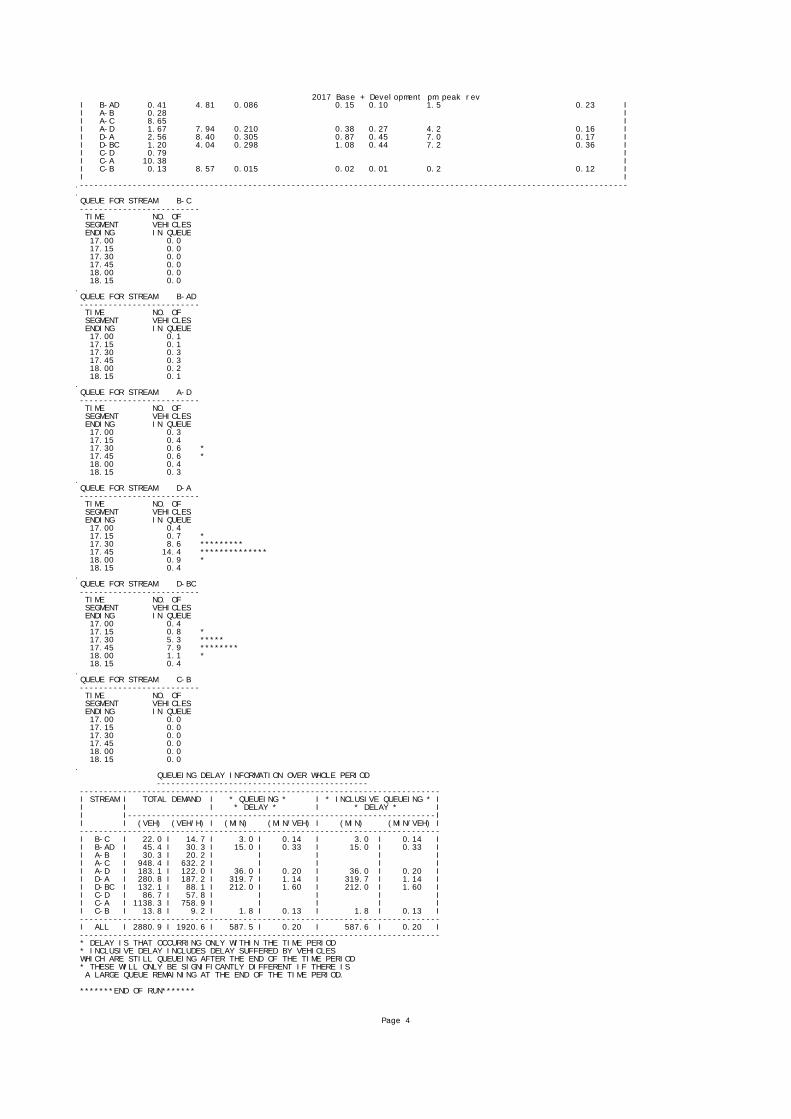
2017 Base + Development pm peak rev I B-AD 0.41 4.81 0.086 0.15 0.10 1.5 0.23 I I A-B 0.28 I I A-C 8.65 I I A-D 1.67 7.94 0.210 0.38 0.27 4.2 0.16 I I D-A 2.56 8.40 0.305 0.87 0.45 7.0 0.17 I I D-BC 1.20 4.04 0.298 1.08 0.44 7.2 0.36 I I C-D 0.79 I I C-A 10.38 I I C-B 0.13 8.57 0.015 0.02 0.01 0.2 0.12 I I I.------------------------------------------------------------------------------------------------------------------. QUEUE FOR STREAM B-C ------------------------- TIME NO. OF SEGMENT VEHICLES ENDING IN QUEUE 17.00 0.0 17.15 0.0 17.30 0.0 17.45 0.0 18.00 0.0 18.15 0.0. QUEUE FOR STREAM B-AD ------------------------- TIME NO. OF SEGMENT VEHICLES ENDING IN QUEUE 17.00 0.1 17.15 0.1 17.30 0.3 17.45 0.3 18.00 0.2 18.15 0.1. QUEUE FOR STREAM A-D ------------------------- TIME NO. OF SEGMENT VEHICLES ENDING IN QUEUE 17.00 0.3 17.15 0.4 17.30 0.6 * 17.45 0.6 * 18.00 0.4 18.15 0.3. QUEUE FOR STREAM D-A ------------------------- TIME NO. OF SEGMENT VEHICLES ENDING IN QUEUE 17.00 0.4 17.15 0.7 * 17.30 8.6 ********* 17.45 14.4 ************** 18.00 0.9 * 18.15 0.4. QUEUE FOR STREAM D-BC ------------------------- TIME NO. OF SEGMENT VEHICLES ENDING IN QUEUE 17.00 0.4 17.15 0.8 * 17.30 5.3 ***** 17.45 7.9 ******** 18.00 1.1 * 18.15 0.4. QUEUE FOR STREAM C-B ------------------------- TIME NO. OF SEGMENT VEHICLES ENDING IN QUEUE 17.00 0.0 17.15 0.0 17.30 0.0 17.45 0.0 18.00 0.0 18.15 0.0. QUEUEING DELAY INFORMATION OVER WHOLE PERIOD -------------------------------------------- --------------------------------------------------------------------------- I STREAM I TOTAL DEMAND I * QUEUEING * I * INCLUSIVE QUEUEING * I I I I * DELAY * I * DELAY * I I I----------------------------------------------------------------I I I (VEH) (VEH/H) I (MIN) (MIN/VEH) I (MIN) (MIN/VEH) I --------------------------------------------------------------------------- I B-C I 22.0 I 14.7 I 3.0 I 0.14 I 3.0 I 0.14 I I B-AD I 45.4 I 30.3 I 15.0 I 0.33 I 15.0 I 0.33 I I A-B I 30.3 I 20.2 I I I I I I A-C I 948.4 I 632.2 I I I I I I A-D I 183.1 I 122.0 I 36.0 I 0.20 I 36.0 I 0.20 I I D-A I 280.8 I 187.2 I 319.7 I 1.14 I 319.7 I 1.14 I I D-BC I 132.1 I 88.1 I 212.0 I 1.60 I 212.0 I 1.60 I I C-D I 86.7 I 57.8 I I I I I I C-A I 1138.3 I 758.9 I I I I I I C-B I 13.8 I 9.2 I 1.8 I 0.13 I 1.8 I 0.13 I --------------------------------------------------------------------------- I ALL I 2880.9 I 1920.6 I 587.5 I 0.20 I 587.6 I 0.20 I --------------------------------------------------------------------------- * DELAY IS THAT OCCURRING ONLY WITHIN THE TIME PERIOD * INCLUSIVE DELAY INCLUDES DELAY SUFFERED BY VEHICLES WHICH ARE STILL QUEUEING AFTER THE END OF THE TIME PERIOD * THESE WILL ONLY BE SIGNIFICANTLY DIFFERENT IF THERE IS A LARGE QUEUE REMAINING AT THE END OF THE TIME PERIOD. *******END OF RUN*******
Page 4
APPENDIX L
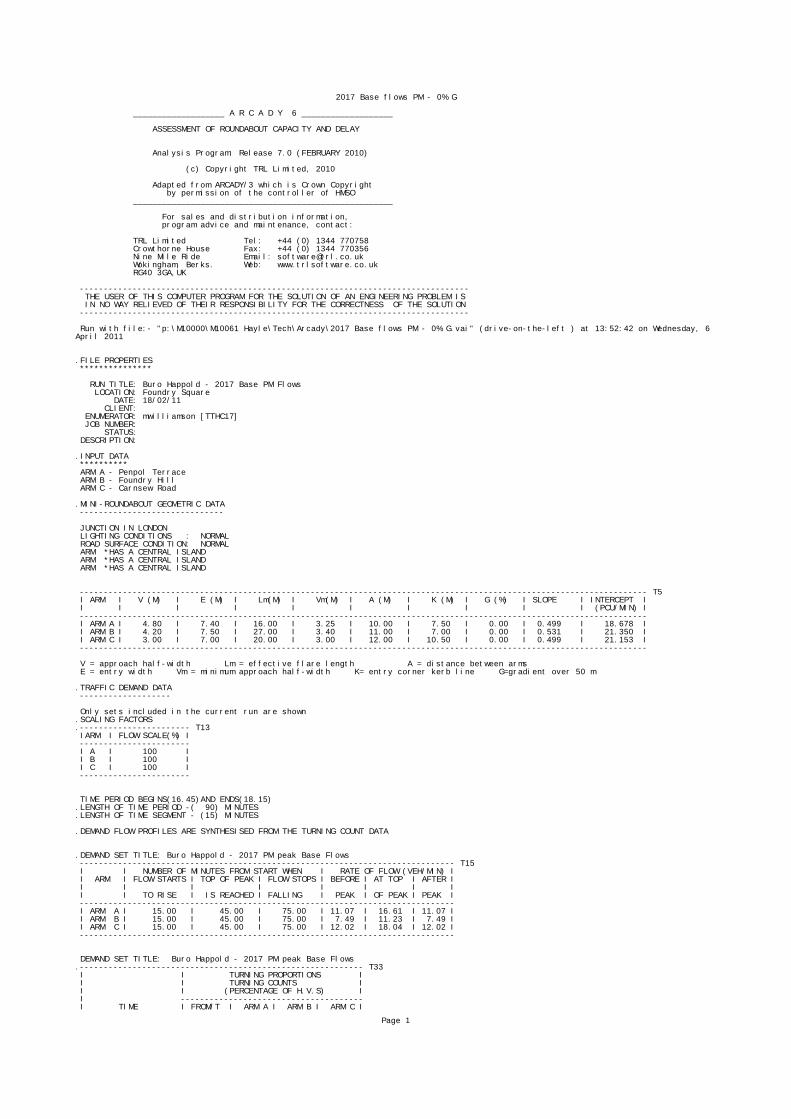
2017 Base flows PM - 0% G ___________________ A R C A D Y 6 ___________________ ASSESSMENT OF ROUNDABOUT CAPACITY AND DELAY Analysis Program: Release 7.0 (FEBRUARY 2010) (c) Copyright TRL Limited, 2010 Adapted from ARCADY/3 which is Crown Copyright by permission of the controller of HMSO ______________________________________________________ For sales and distribution information, program advice and maintenance, contact: TRL Limited Tel: +44 (0) 1344 770758 Crowthorne House Fax: +44 (0) 1344 770356 Nine Mile Ride Email: [email protected] Wokingham, Berks. Web: www.trlsoftware.co.uk RG40 3GA,UK --------------------------------------------------------------------------------- THE USER OF THIS COMPUTER PROGRAM FOR THE SOLUTION OF AN ENGINEERING PROBLEM IS IN NO WAY RELIEVED OF THEIR RESPONSIBILITY FOR THE CORRECTNESS OF THE SOLUTION --------------------------------------------------------------------------------- Run with file:- "p:\M10000\M10061 Hayle\Tech\Arcady\2017 Base flows PM - 0% G.vai" (drive-on-the-left ) at 13:52:42 on Wednesday, 6 April 2011 .FILE PROPERTIES *************** RUN TITLE: Buro Happold - 2017 Base PM Flows LOCATION: Foundry Square DATE: 18/02/11 CLIENT: ENUMERATOR: mwilliamson [TTHC17] JOB NUMBER: STATUS: DESCRIPTION: .INPUT DATA ********** ARM A - Penpol Terrace ARM B - Foundry Hill ARM C - Carnsew Road .MINI-ROUNDABOUT GEOMETRIC DATA ------------------------------ JUNCTION IN LONDON LIGHTING CONDITIONS : NORMAL ROAD SURFACE CONDITION: NORMAL ARM *HAS A CENTRAL ISLAND ARM *HAS A CENTRAL ISLAND ARM *HAS A CENTRAL ISLAND ---------------------------------------------------------------------------------------------------------------------- T5 I ARM I V (M) I E (M) I Lm(M) I Vm(M) I A (M) I K (M) I G (%) I SLOPE I INTERCEPT I I I I I I I I I I I (PCU/MIN) I ---------------------------------------------------------------------------------------------------------------------- I ARM A I 4.80 I 7.40 I 16.00 I 3.25 I 10.00 I 7.50 I 0.00 I 0.499 I 18.678 I I ARM B I 4.20 I 7.50 I 27.00 I 3.40 I 11.00 I 7.00 I 0.00 I 0.531 I 21.350 I I ARM C I 3.00 I 7.00 I 20.00 I 3.00 I 12.00 I 10.50 I 0.00 I 0.499 I 21.153 I ---------------------------------------------------------------------------------------------------------------------- V = approach half-width Lm = effective flare length A = distance between arms E = entry width Vm = minimum approach half-width K= entry corner kerb line G=gradient over 50 m .TRAFFIC DEMAND DATA ------------------- Only sets included in the current run are shown.SCALING FACTORS.----------------------- T13 IARM I FLOW SCALE(%) I ----------------------- I A I 100 I I B I 100 I I C I 100 I ----------------------- TIME PERIOD BEGINS(16.45)AND ENDS(18.15).LENGTH OF TIME PERIOD -( 90) MINUTES.LENGTH OF TIME SEGMENT - (15) MINUTES .DEMAND FLOW PROFILES ARE SYNTHESISED FROM THE TURNING COUNT DATA .DEMAND SET TITLE: Buro Happold - 2017 PM peak Base Flows ------------------------------------------------------------------------------ T15 I I NUMBER OF MINUTES FROM START WHEN I RATE OF FLOW (VEH/MIN) I I ARM I FLOW STARTS I TOP OF PEAK I FLOW STOPS I BEFORE I AT TOP I AFTER I I I I I I I I I I I TO RISE I IS REACHED I FALLING I PEAK I OF PEAK I PEAK I ------------------------------------------------------------------------------ I ARM A I 15.00 I 45.00 I 75.00 I 11.07 I 16.61 I 11.07 I I ARM B I 15.00 I 45.00 I 75.00 I 7.49 I 11.23 I 7.49 I I ARM C I 15.00 I 45.00 I 75.00 I 12.02 I 18.04 I 12.02 I ------------------------------------------------------------------------------ DEMAND SET TITLE: Buro Happold - 2017 PM peak Base Flows.----------------------------------------------------------- T33 I I TURNING PROPORTIONS I I I TURNING COUNTS I I I (PERCENTAGE OF H.V.S) I I -------------------------------------- I TIME I FROM/T I ARM A I ARM B I ARM C I
Page 1

2017 Base flows PM - 0% G ----------------------------------------------------------- I 16.45 - 18.15 I I I I I I I ARM A I 0.008 I 0.407 I 0.585 I I I I 7.0 I 361.0 I 518.0 I I I I ( 0.0)I ( 0.0)I ( 0.0)I I I I I I I I I ARM B I 0.643 I 0.002 I 0.356 I I I I 385.0 I 1.0 I 213.0 I I I I ( 0.0)I ( 0.0)I ( 0.0)I I I I I I I I I ARM C I 0.790 I 0.210 I 0.000 I I I I 760.0 I 202.0 I 0.0 I I I I ( 0.0)I ( 0.0)I ( 0.0)I I I I I I I ----------------------------------------------------------- . QUEUE AND DELAY INFORMATION FOR EACH 15 MIN TIME SEGMENT --------------------------------------------------------.------------------------------------------------------------------------------------------------------------------ T70 I TIME DEMAND CAPACITY DEMAND/ PEDESTRIAN START END DELAY AVERAGE DELAY I I (VEH/MIN) (VEH/MIN) CAPACITY FLOW QUEUE QUEUE (VEH.MIN/ PER ARRIVING I I (RFC) (PEDS/MIN) (VEHS) (VEHS) TIME SEGMENT) VEHICLE (MIN) I - - I 16.45-17.00 I I ARM A 11.12 17.42 0.638 - - - 0.0 1.7 23.9 - 0.153 I I ARM B 7.52 17.89 0.420 - - - 0.0 0.7 10.3 - 0.096 I I ARM C 12.07 18.71 0.645 - - - 0.0 1.8 24.7 - 0.146 I I I ------------------------------------------------------------------------------------------------------------------.------------------------------------------------------------------------------------------------------------------ I TIME DEMAND CAPACITY DEMAND/ PEDESTRIAN START END DELAY AVERAGE DELAY I I (VEH/MIN) (VEH/MIN) CAPACITY FLOW QUEUE QUEUE (VEH.MIN/ PER ARRIVING I I (RFC) (PEDS/MIN) (VEHS) (VEHS) TIME SEGMENT) VEHICLE (MIN) I - - I 17.00-17.15 I I ARM A 13.27 17.17 0.773 - - - 1.7 3.2 43.6 - 0.244 I I ARM B 8.97 17.21 0.522 - - - 0.7 1.1 15.5 - 0.121 I I ARM C 14.41 18.22 0.791 - - - 1.8 3.5 47.7 - 0.248 I I I ------------------------------------------------------------------------------------------------------------------.------------------------------------------------------------------------------------------------------------------ I TIME DEMAND CAPACITY DEMAND/ PEDESTRIAN START END DELAY AVERAGE DELAY I I (VEH/MIN) (VEH/MIN) CAPACITY FLOW QUEUE QUEUE (VEH.MIN/ PER ARRIVING I I (RFC) (PEDS/MIN) (VEHS) (VEHS) TIME SEGMENT) VEHICLE (MIN) I - - I 17.15-17.30 I I ARM A 16.26 16.91 0.961 - - - 3.2 11.4 126.9 - 0.644 I I ARM B 10.99 16.41 0.670 - - - 1.1 2.0 27.5 - 0.181 I I ARM C 17.65 17.58 1.004 - - - 3.5 16.9 172.5 - 0.812 I I I ------------------------------------------------------------------------------------------------------------------.------------------------------------------------------------------------------------------------------------------ I TIME DEMAND CAPACITY DEMAND/ PEDESTRIAN START END DELAY AVERAGE DELAY I I (VEH/MIN) (VEH/MIN) CAPACITY FLOW QUEUE QUEUE (VEH.MIN/ PER ARRIVING I I (RFC) (PEDS/MIN) (VEHS) (VEHS) TIME SEGMENT) VEHICLE (MIN) I - - I 17.30-17.45 I I ARM A 16.26 16.87 0.964 - - - 11.4 14.5 196.0 - 0.938 I I ARM B 10.99 16.30 0.674 - - - 2.0 2.0 30.0 - 0.188 I I ARM C 17.65 17.56 1.005 - - - 16.9 24.2 311.1 - 1.366 I I I ------------------------------------------------------------------------------------------------------------------.------------------------------------------------------------------------------------------------------------------ I TIME DEMAND CAPACITY DEMAND/ PEDESTRIAN START END DELAY AVERAGE DELAY I I (VEH/MIN) (VEH/MIN) CAPACITY FLOW QUEUE QUEUE (VEH.MIN/ PER ARRIVING I I (RFC) (PEDS/MIN) (VEHS) (VEHS) TIME SEGMENT) VEHICLE (MIN) I - - I 17.45-18.00 I I ARM A 13.27 17.02 0.780 - - - 14.5 3.8 82.2 - 0.390 I I ARM B 8.97 16.95 0.529 - - - 2.0 1.1 18.0 - 0.127 I I ARM C 14.41 18.19 0.792 - - - 24.2 4.2 132.0 - 0.561 I I I ------------------------------------------------------------------------------------------------------------------.------------------------------------------------------------------------------------------------------------------ I TIME DEMAND CAPACITY DEMAND/ PEDESTRIAN START END DELAY AVERAGE DELAY I I (VEH/MIN) (VEH/MIN) CAPACITY FLOW QUEUE QUEUE (VEH.MIN/ PER ARRIVING I I (RFC) (PEDS/MIN) (VEHS) (VEHS) TIME SEGMENT) VEHICLE (MIN) I - - I 18.00-18.15 I I ARM A 11.12 17.39 0.639 - - - 3.8 1.8 29.3 - 0.166 I I ARM B 7.52 17.81 0.422 - - - 1.1 0.7 11.4 - 0.098 I I ARM C 12.07 18.68 0.646 - - - 4.2 1.9 30.3 - 0.158 I I I ------------------------------------------------------------------------------------------------------------------ .QUEUE AT ARM A -------------- TIME SEGMENT NO. OF ENDING VEHICLES IN QUEUE 17.00 1.7 ** 17.15 3.2 *** 17.30 11.4 *********** 17.45 14.5 ************** 18.00 3.8 **** 18.15 1.8 ** .QUEUE AT ARM B -------------- TIME SEGMENT NO. OF ENDING VEHICLES IN QUEUE 17.00 0.7 * 17.15 1.1 * 17.30 2.0 ** 17.45 2.0 ** 18.00 1.1 *
Page 2
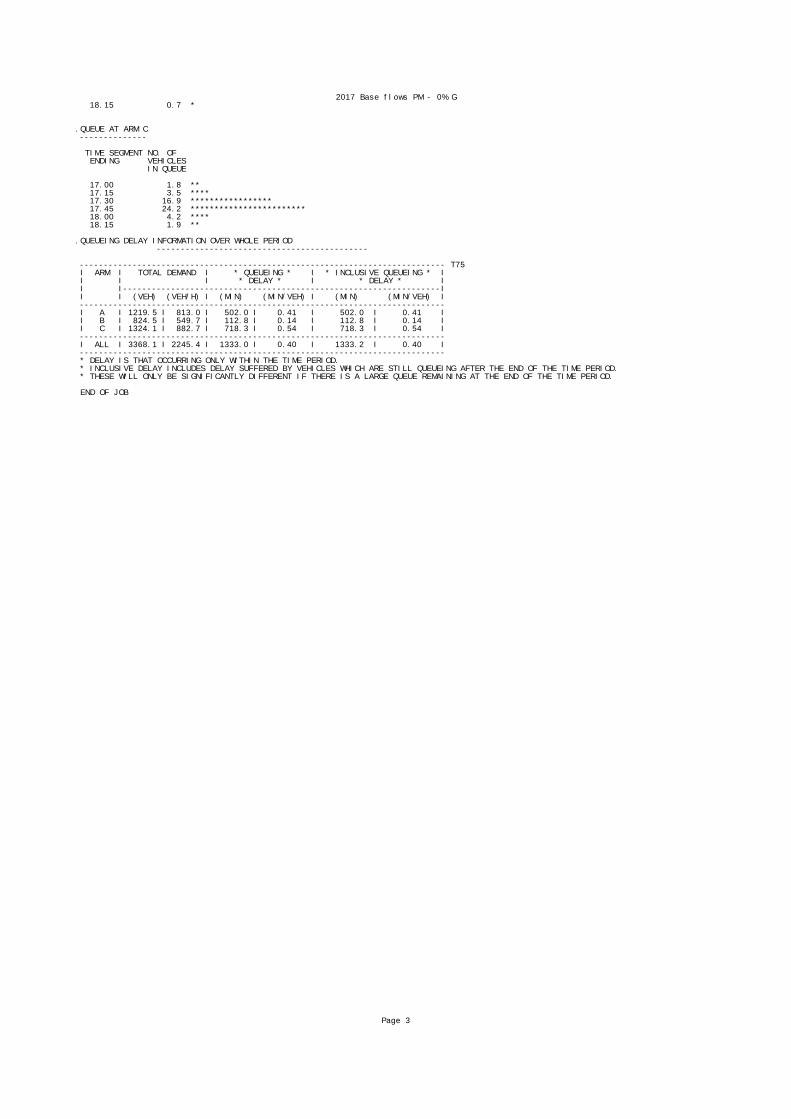
2017 Base flows PM - 0% G 18.15 0.7 * .QUEUE AT ARM C -------------- TIME SEGMENT NO. OF ENDING VEHICLES IN QUEUE 17.00 1.8 ** 17.15 3.5 **** 17.30 16.9 ***************** 17.45 24.2 ************************ 18.00 4.2 **** 18.15 1.9 ** .QUEUEING DELAY INFORMATION OVER WHOLE PERIOD -------------------------------------------- ---------------------------------------------------------------------------- T75 I ARM I TOTAL DEMAND I * QUEUEING * I * INCLUSIVE QUEUEING * I I I I * DELAY * I * DELAY * I I I------------------------------------------------------------------I I I (VEH) (VEH/H) I (MIN) (MIN/VEH) I (MIN) (MIN/VEH) I ---------------------------------------------------------------------------- I A I 1219.5 I 813.0 I 502.0 I 0.41 I 502.0 I 0.41 I I B I 824.5 I 549.7 I 112.8 I 0.14 I 112.8 I 0.14 I I C I 1324.1 I 882.7 I 718.3 I 0.54 I 718.3 I 0.54 I ---------------------------------------------------------------------------- I ALL I 3368.1 I 2245.4 I 1333.0 I 0.40 I 1333.2 I 0.40 I ---------------------------------------------------------------------------- * DELAY IS THAT OCCURRING ONLY WITHIN THE TIME PERIOD. * INCLUSIVE DELAY INCLUDES DELAY SUFFERED BY VEHICLES WHICH ARE STILL QUEUEING AFTER THE END OF THE TIME PERIOD. * THESE WILL ONLY BE SIGNIFICANTLY DIFFERENT IF THERE IS A LARGE QUEUE REMAINING AT THE END OF THE TIME PERIOD. END OF JOB
Page 3
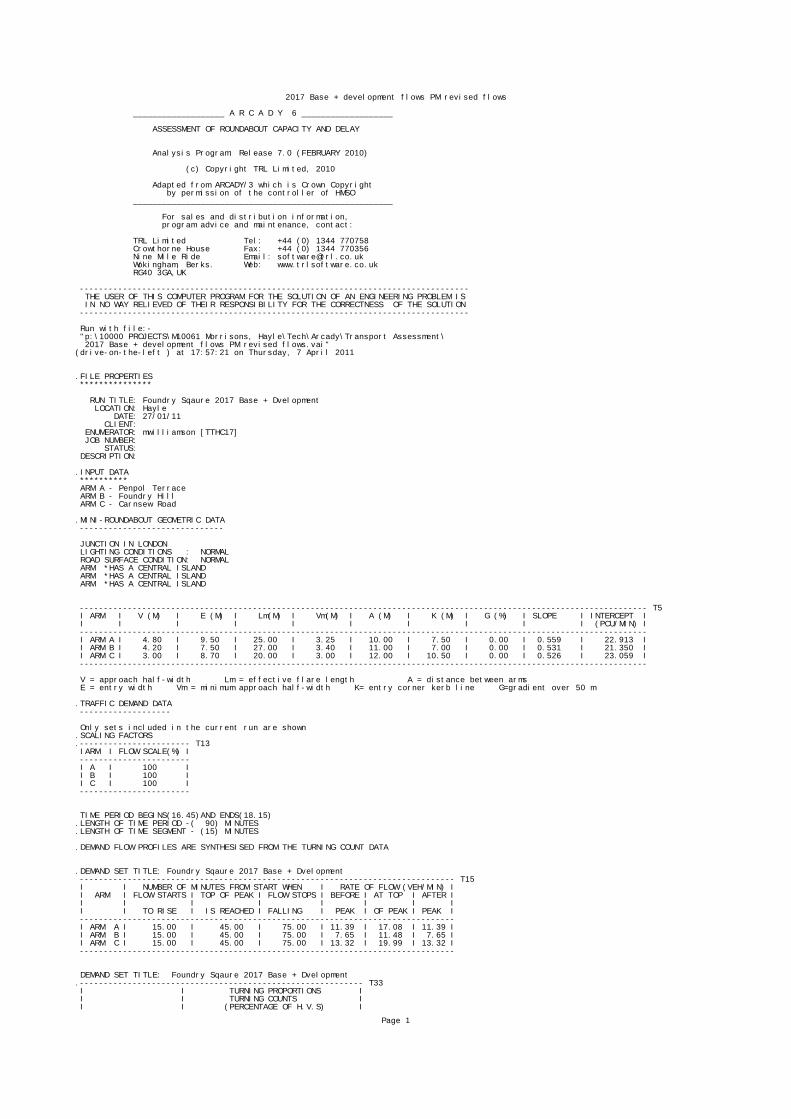
2017 Base + development flows PM revised flows ___________________ A R C A D Y 6 ___________________ ASSESSMENT OF ROUNDABOUT CAPACITY AND DELAY Analysis Program: Release 7.0 (FEBRUARY 2010) (c) Copyright TRL Limited, 2010 Adapted from ARCADY/3 which is Crown Copyright by permission of the controller of HMSO ______________________________________________________ For sales and distribution information, program advice and maintenance, contact: TRL Limited Tel: +44 (0) 1344 770758 Crowthorne House Fax: +44 (0) 1344 770356 Nine Mile Ride Email: [email protected] Wokingham, Berks. Web: www.trlsoftware.co.uk RG40 3GA,UK --------------------------------------------------------------------------------- THE USER OF THIS COMPUTER PROGRAM FOR THE SOLUTION OF AN ENGINEERING PROBLEM IS IN NO WAY RELIEVED OF THEIR RESPONSIBILITY FOR THE CORRECTNESS OF THE SOLUTION --------------------------------------------------------------------------------- Run with file:- "p:\10000 PROJECTS\M10061 Morrisons, Hayle\Tech\Arcady\Transport Assessment\ 2017 Base + development flows PM revised flows.vai"(drive-on-the-left ) at 17:57:21 on Thursday, 7 April 2011 .FILE PROPERTIES *************** RUN TITLE: Foundry Sqaure 2017 Base + Dvelopment LOCATION: Hayle DATE: 27/01/11 CLIENT: ENUMERATOR: mwilliamson [TTHC17] JOB NUMBER: STATUS: DESCRIPTION: .INPUT DATA ********** ARM A - Penpol Terrace ARM B - Foundry Hill ARM C - Carnsew Road .MINI-ROUNDABOUT GEOMETRIC DATA ------------------------------ JUNCTION IN LONDON LIGHTING CONDITIONS : NORMAL ROAD SURFACE CONDITION: NORMAL ARM *HAS A CENTRAL ISLAND ARM *HAS A CENTRAL ISLAND ARM *HAS A CENTRAL ISLAND ---------------------------------------------------------------------------------------------------------------------- T5 I ARM I V (M) I E (M) I Lm(M) I Vm(M) I A (M) I K (M) I G (%) I SLOPE I INTERCEPT I I I I I I I I I I I (PCU/MIN) I ---------------------------------------------------------------------------------------------------------------------- I ARM A I 4.80 I 9.50 I 25.00 I 3.25 I 10.00 I 7.50 I 0.00 I 0.559 I 22.913 I I ARM B I 4.20 I 7.50 I 27.00 I 3.40 I 11.00 I 7.00 I 0.00 I 0.531 I 21.350 I I ARM C I 3.00 I 8.70 I 20.00 I 3.00 I 12.00 I 10.50 I 0.00 I 0.526 I 23.059 I ---------------------------------------------------------------------------------------------------------------------- V = approach half-width Lm = effective flare length A = distance between arms E = entry width Vm = minimum approach half-width K= entry corner kerb line G=gradient over 50 m .TRAFFIC DEMAND DATA ------------------- Only sets included in the current run are shown.SCALING FACTORS.----------------------- T13 IARM I FLOW SCALE(%) I ----------------------- I A I 100 I I B I 100 I I C I 100 I ----------------------- TIME PERIOD BEGINS(16.45)AND ENDS(18.15).LENGTH OF TIME PERIOD -( 90) MINUTES.LENGTH OF TIME SEGMENT - (15) MINUTES .DEMAND FLOW PROFILES ARE SYNTHESISED FROM THE TURNING COUNT DATA .DEMAND SET TITLE: Foundry Sqaure 2017 Base + Dvelopment ------------------------------------------------------------------------------ T15 I I NUMBER OF MINUTES FROM START WHEN I RATE OF FLOW (VEH/MIN) I I ARM I FLOW STARTS I TOP OF PEAK I FLOW STOPS I BEFORE I AT TOP I AFTER I I I I I I I I I I I TO RISE I IS REACHED I FALLING I PEAK I OF PEAK I PEAK I ------------------------------------------------------------------------------ I ARM A I 15.00 I 45.00 I 75.00 I 11.39 I 17.08 I 11.39 I I ARM B I 15.00 I 45.00 I 75.00 I 7.65 I 11.48 I 7.65 I I ARM C I 15.00 I 45.00 I 75.00 I 13.32 I 19.99 I 13.32 I ------------------------------------------------------------------------------ DEMAND SET TITLE: Foundry Sqaure 2017 Base + Dvelopment.----------------------------------------------------------- T33 I I TURNING PROPORTIONS I I I TURNING COUNTS I I I (PERCENTAGE OF H.V.S) I
Page 1
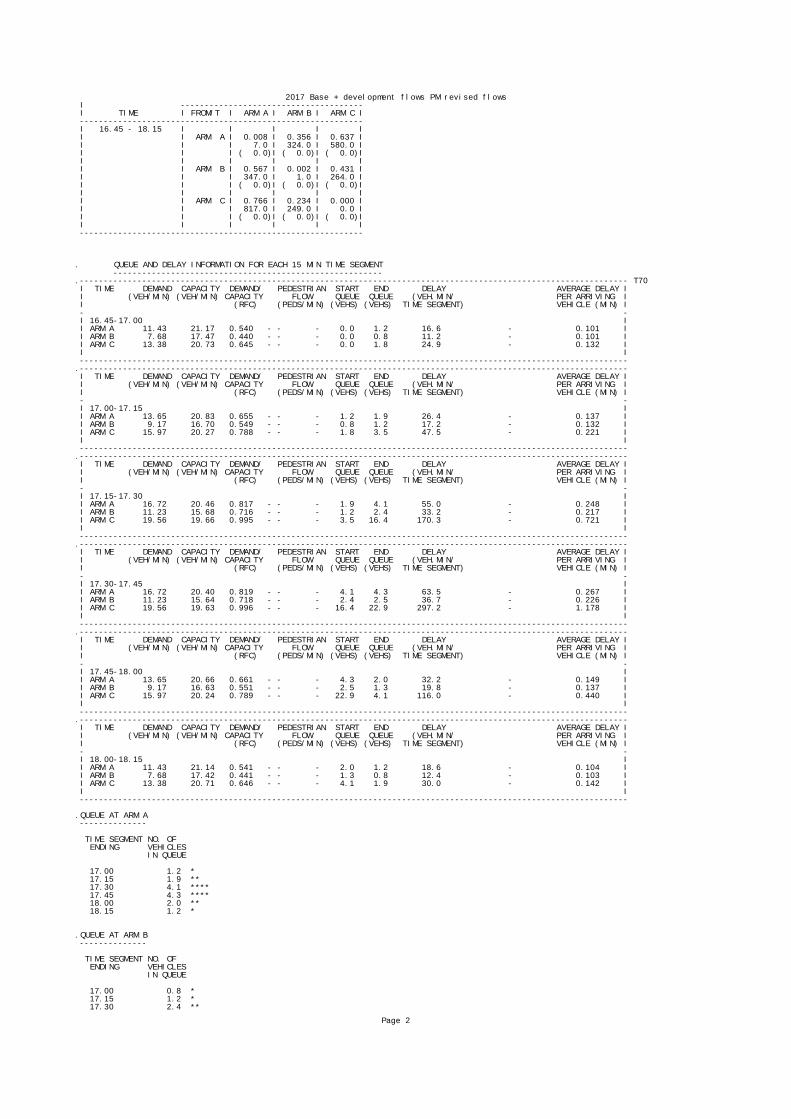
2017 Base + development flows PM revised flows I -------------------------------------- I TIME I FROM/T I ARM A I ARM B I ARM C I ----------------------------------------------------------- I 16.45 - 18.15 I I I I I I I ARM A I 0.008 I 0.356 I 0.637 I I I I 7.0 I 324.0 I 580.0 I I I I ( 0.0)I ( 0.0)I ( 0.0)I I I I I I I I I ARM B I 0.567 I 0.002 I 0.431 I I I I 347.0 I 1.0 I 264.0 I I I I ( 0.0)I ( 0.0)I ( 0.0)I I I I I I I I I ARM C I 0.766 I 0.234 I 0.000 I I I I 817.0 I 249.0 I 0.0 I I I I ( 0.0)I ( 0.0)I ( 0.0)I I I I I I I ----------------------------------------------------------- . QUEUE AND DELAY INFORMATION FOR EACH 15 MIN TIME SEGMENT --------------------------------------------------------.------------------------------------------------------------------------------------------------------------------ T70 I TIME DEMAND CAPACITY DEMAND/ PEDESTRIAN START END DELAY AVERAGE DELAY I I (VEH/MIN) (VEH/MIN) CAPACITY FLOW QUEUE QUEUE (VEH.MIN/ PER ARRIVING I I (RFC) (PEDS/MIN) (VEHS) (VEHS) TIME SEGMENT) VEHICLE (MIN) I - - I 16.45-17.00 I I ARM A 11.43 21.17 0.540 - - - 0.0 1.2 16.6 - 0.101 I I ARM B 7.68 17.47 0.440 - - - 0.0 0.8 11.2 - 0.101 I I ARM C 13.38 20.73 0.645 - - - 0.0 1.8 24.9 - 0.132 I I I ------------------------------------------------------------------------------------------------------------------.------------------------------------------------------------------------------------------------------------------ I TIME DEMAND CAPACITY DEMAND/ PEDESTRIAN START END DELAY AVERAGE DELAY I I (VEH/MIN) (VEH/MIN) CAPACITY FLOW QUEUE QUEUE (VEH.MIN/ PER ARRIVING I I (RFC) (PEDS/MIN) (VEHS) (VEHS) TIME SEGMENT) VEHICLE (MIN) I - - I 17.00-17.15 I I ARM A 13.65 20.83 0.655 - - - 1.2 1.9 26.4 - 0.137 I I ARM B 9.17 16.70 0.549 - - - 0.8 1.2 17.2 - 0.132 I I ARM C 15.97 20.27 0.788 - - - 1.8 3.5 47.5 - 0.221 I I I ------------------------------------------------------------------------------------------------------------------.------------------------------------------------------------------------------------------------------------------ I TIME DEMAND CAPACITY DEMAND/ PEDESTRIAN START END DELAY AVERAGE DELAY I I (VEH/MIN) (VEH/MIN) CAPACITY FLOW QUEUE QUEUE (VEH.MIN/ PER ARRIVING I I (RFC) (PEDS/MIN) (VEHS) (VEHS) TIME SEGMENT) VEHICLE (MIN) I - - I 17.15-17.30 I I ARM A 16.72 20.46 0.817 - - - 1.9 4.1 55.0 - 0.248 I I ARM B 11.23 15.68 0.716 - - - 1.2 2.4 33.2 - 0.217 I I ARM C 19.56 19.66 0.995 - - - 3.5 16.4 170.3 - 0.721 I I I ------------------------------------------------------------------------------------------------------------------.------------------------------------------------------------------------------------------------------------------ I TIME DEMAND CAPACITY DEMAND/ PEDESTRIAN START END DELAY AVERAGE DELAY I I (VEH/MIN) (VEH/MIN) CAPACITY FLOW QUEUE QUEUE (VEH.MIN/ PER ARRIVING I I (RFC) (PEDS/MIN) (VEHS) (VEHS) TIME SEGMENT) VEHICLE (MIN) I - - I 17.30-17.45 I I ARM A 16.72 20.40 0.819 - - - 4.1 4.3 63.5 - 0.267 I I ARM B 11.23 15.64 0.718 - - - 2.4 2.5 36.7 - 0.226 I I ARM C 19.56 19.63 0.996 - - - 16.4 22.9 297.2 - 1.178 I I I ------------------------------------------------------------------------------------------------------------------.------------------------------------------------------------------------------------------------------------------ I TIME DEMAND CAPACITY DEMAND/ PEDESTRIAN START END DELAY AVERAGE DELAY I I (VEH/MIN) (VEH/MIN) CAPACITY FLOW QUEUE QUEUE (VEH.MIN/ PER ARRIVING I I (RFC) (PEDS/MIN) (VEHS) (VEHS) TIME SEGMENT) VEHICLE (MIN) I - - I 17.45-18.00 I I ARM A 13.65 20.66 0.661 - - - 4.3 2.0 32.2 - 0.149 I I ARM B 9.17 16.63 0.551 - - - 2.5 1.3 19.8 - 0.137 I I ARM C 15.97 20.24 0.789 - - - 22.9 4.1 116.0 - 0.440 I I I ------------------------------------------------------------------------------------------------------------------.------------------------------------------------------------------------------------------------------------------ I TIME DEMAND CAPACITY DEMAND/ PEDESTRIAN START END DELAY AVERAGE DELAY I I (VEH/MIN) (VEH/MIN) CAPACITY FLOW QUEUE QUEUE (VEH.MIN/ PER ARRIVING I I (RFC) (PEDS/MIN) (VEHS) (VEHS) TIME SEGMENT) VEHICLE (MIN) I - - I 18.00-18.15 I I ARM A 11.43 21.14 0.541 - - - 2.0 1.2 18.6 - 0.104 I I ARM B 7.68 17.42 0.441 - - - 1.3 0.8 12.4 - 0.103 I I ARM C 13.38 20.71 0.646 - - - 4.1 1.9 30.0 - 0.142 I I I ------------------------------------------------------------------------------------------------------------------ .QUEUE AT ARM A -------------- TIME SEGMENT NO. OF ENDING VEHICLES IN QUEUE 17.00 1.2 * 17.15 1.9 ** 17.30 4.1 **** 17.45 4.3 **** 18.00 2.0 ** 18.15 1.2 * .QUEUE AT ARM B -------------- TIME SEGMENT NO. OF ENDING VEHICLES IN QUEUE 17.00 0.8 * 17.15 1.2 * 17.30 2.4 **
Page 2
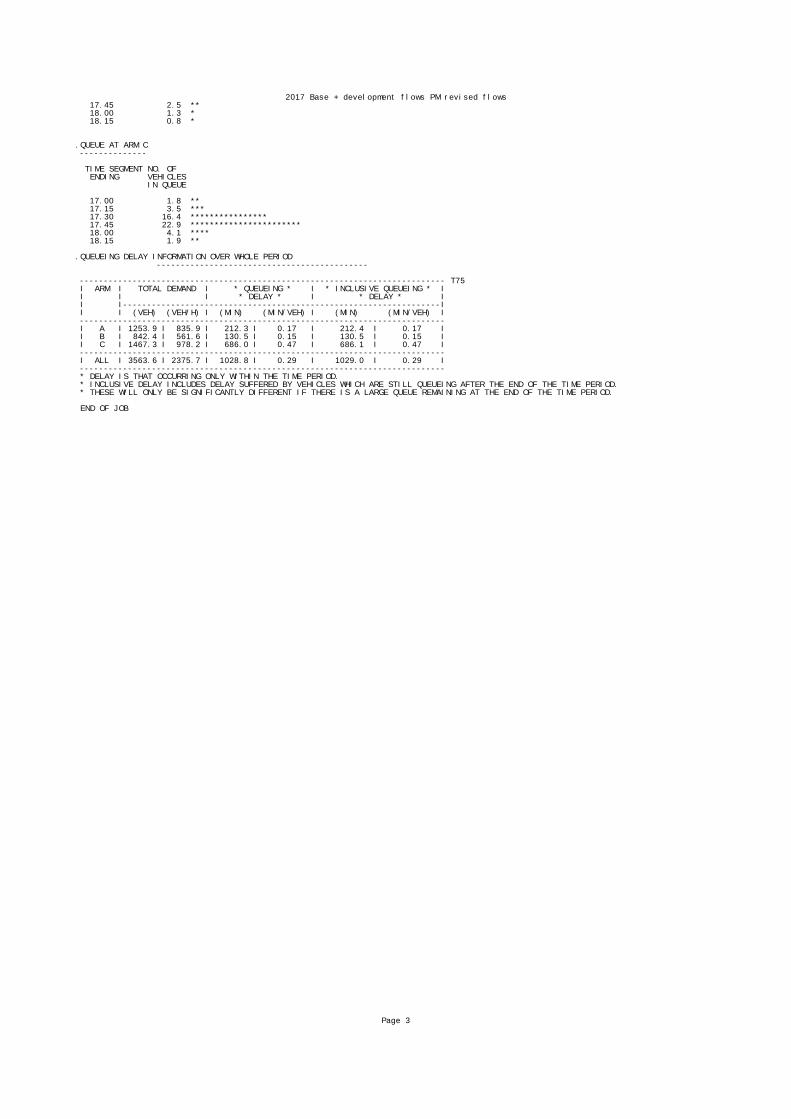
2017 Base + development flows PM revised flows 17.45 2.5 ** 18.00 1.3 * 18.15 0.8 * .QUEUE AT ARM C -------------- TIME SEGMENT NO. OF ENDING VEHICLES IN QUEUE 17.00 1.8 ** 17.15 3.5 *** 17.30 16.4 **************** 17.45 22.9 *********************** 18.00 4.1 **** 18.15 1.9 ** .QUEUEING DELAY INFORMATION OVER WHOLE PERIOD -------------------------------------------- ---------------------------------------------------------------------------- T75 I ARM I TOTAL DEMAND I * QUEUEING * I * INCLUSIVE QUEUEING * I I I I * DELAY * I * DELAY * I I I------------------------------------------------------------------I I I (VEH) (VEH/H) I (MIN) (MIN/VEH) I (MIN) (MIN/VEH) I ---------------------------------------------------------------------------- I A I 1253.9 I 835.9 I 212.3 I 0.17 I 212.4 I 0.17 I I B I 842.4 I 561.6 I 130.5 I 0.15 I 130.5 I 0.15 I I C I 1467.3 I 978.2 I 686.0 I 0.47 I 686.1 I 0.47 I ---------------------------------------------------------------------------- I ALL I 3563.6 I 2375.7 I 1028.8 I 0.29 I 1029.0 I 0.29 I ---------------------------------------------------------------------------- * DELAY IS THAT OCCURRING ONLY WITHIN THE TIME PERIOD. * INCLUSIVE DELAY INCLUDES DELAY SUFFERED BY VEHICLES WHICH ARE STILL QUEUEING AFTER THE END OF THE TIME PERIOD. * THESE WILL ONLY BE SIGNIFICANTLY DIFFERENT IF THERE IS A LARGE QUEUE REMAINING AT THE END OF THE TIME PERIOD. END OF JOB
Page 3

APPENDIX M

VISSIM
Traffic Flows
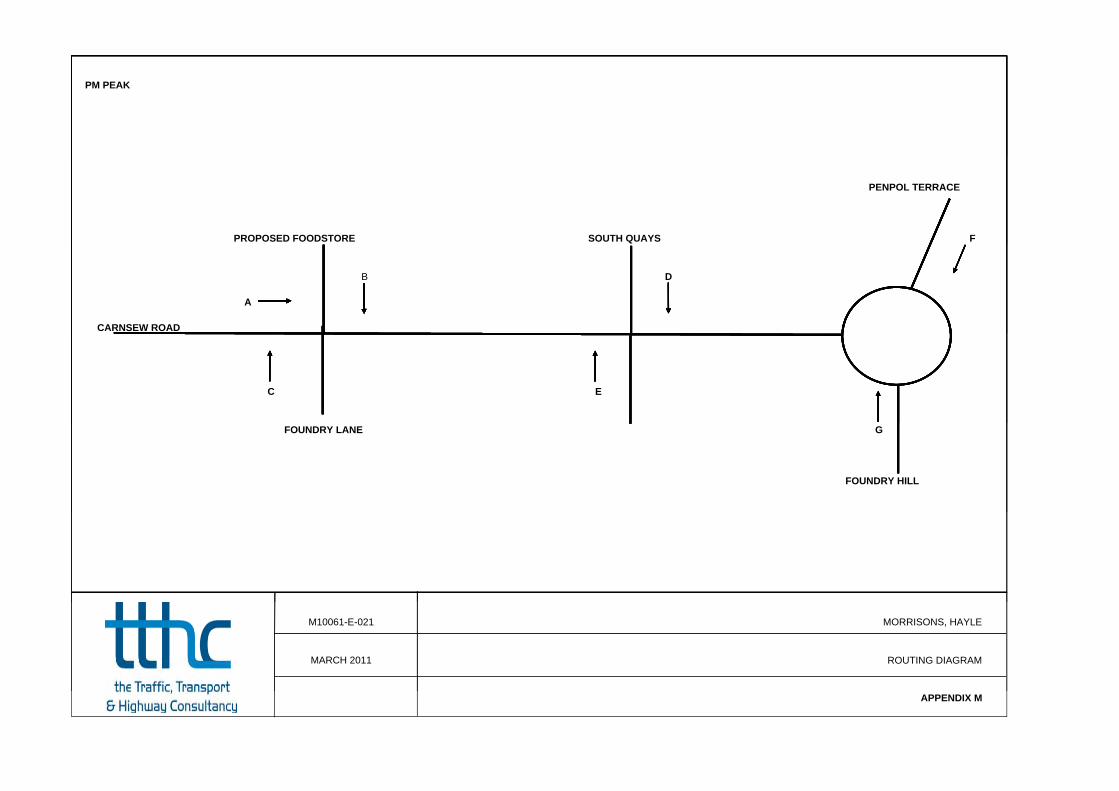
PM PEAK
PENPOL TERRACE
PROPOSED FOODSTORE SOUTH QUAYS F
B D
A
CARNSEW ROAD
C E
FOUNDRY LANE G
FOUNDRY HILL
M10061-E-021 MORRISONS, HAYLE
ROUTING DIAGRAMMARCH 2011
APPENDIX M

2017 Base
LIGHTSA B C D E F G Row total
A 0 5 8 63 10 566 111 763B 6 0 1 0 0 13 1 21C 19 0 0 0 0 7 1 27D 96 0 0 0 0 128 76 300E 16 0 0 0 0 26 7 49F 393 4 1 83 14 7 357 860G 151 3 0 50 8 371 1 583
Col total 681 12 10 196 32 1118 554 2603
HGVsA B C D E F G Row total
A 0 0 0 0 0 9 3 12B 0 0 0 0 0 1 0 1C 0 0 0 0 0 0 0 0D 0 0 0 0 0 0 0 0E 0 0 0 0 0 0 0 0F 11 0 0 0 0 0 2 13G 1 0 0 0 0 7 0 8
Col total 12 0 0 0 0 17 5 34
TOTAL VEHICLESA B C D E F G Row total
A 0 5 8 63 10 575 114 775B 6 0 1 0 0 14 1 22C 19 0 0 0 0 7 1 27D 96 0 0 0 0 128 76 300E 16 0 0 0 0 26 7 49F 404 4 1 83 14 7 359 873G 152 3 0 50 8 378 1 591
Col total 693 12 10 196 32 1135 559 2637
PCUsA B C D E F G Row total
A 0 5 8 63 10 584 117 787B 6 0 1 0 0 15 1 23C 19 0 0 0 0 7 1 27D 96 0 0 0 0 128 76 300E 16 0 0 0 0 26 7 49F 415 4 1 83 14 7 361 886G 153 3 0 50 8 385 1 599
Col total 705 12 10 196 32 1152 564 2671
Destination
Origin
Destination
Origin
Origin
Destination
Destination
Origin

2017 Base + Development
LIGHTSA B C D E F G Row total
A 0 71 8 63 10 481 158 792B 66 0 0 0 0 128 27 221C 19 0 0 0 0 5 3 27D 96 0 0 0 0 152 52 300E 16 0 0 0 0 30 3 49F 371 77 1 97 13 7 320 885G 144 73 0 36 9 333 1 596
Col total 711 221 9 196 32 1137 564 2870
HGVsA B C D E F G Row total
A 0 0 0 0 0 10 3 13B 0 0 0 0 0 0 0 0C 0 0 0 0 0 0 0 0D 0 0 0 0 0 0 0 0E 0 0 0 0 0 0 0 0F 11 0 0 0 0 0 2 13G 1 0 0 0 0 7 0 8
Col total 12 0 0 0 0 17 5 34
TOTAL VEHICLESA B C D E F G Row total
A 0 71 8 63 10 491 161 805B 66 0 0 0 0 128 27 221C 19 0 0 0 0 5 3 27D 96 0 0 0 0 152 52 300E 16 0 0 0 0 30 3 49F 382 77 1 97 13 7 322 898G 145 73 0 36 9 340 1 604
Col total 723 221 9 196 32 1154 569 2904
PCUsA B C D E F G Row total
A 0 71 8 63 10 501 164 818B 66 0 0 0 0 128 27 221C 19 0 0 0 0 5 3 27D 96 0 0 0 0 152 52 300E 16 0 0 0 0 30 3 49F 393 77 1 97 13 7 324 911G 146 73 0 36 9 347 1 612
Col total 735 221 9 196 32 1171 574 2938
Destination
Origin
Origin
Destination
Destination
Origin
Destination
Origin
VISSIM Output

10
15
20
25
South Quays exit - queue length (PCUs)
Base
Base plus Dev, no KC
Base plus Dev, westbound KC
Base plus Dev, both KC
0
5
10
15
20
25
16:45 17:00 17:15 17:30 17:45 18:00 18:15
South Quays exit - queue length (PCUs)
Base
Base plus Dev, no KC
Base plus Dev, westbound KC
Base plus Dev, both KC
Appendix M
VISSIM Output
Base Scenario

29_1.stz
Queue Length Record
File: P:\10000 PROJECTS\M10061 Morrisons, Hayle\Tech\VISSIM\29.inpComment: Base Date: 12 April 2011 12:15:41VISSIM: 5.30-04 [27495]
Queue Counter 41: Link 20 At 37.082 mQueue Counter 42: Link 7 At 132.550 m
Avg.: average queue length [m] within time intervalMax.: maximum queue length [m] within time intervalStop: number of stops within queue
Time; Avg.; max;Stop; Avg.; max;Stop; No.:; 41; 41; 41; 42; 42; 42; 300; 0; 0; 0; 0; 0; 0; 600; 0; 0; 0; 0; 9; 1; 900; 0; 0; 0; 0; 0; 0; 1200; 0; 0; 0; 0; 10; 1; 1500; 0; 0; 0; 0; 15; 3; 1800; 0; 0; 0; 0; 8; 1; 2100; 0; 0; 0; 0; 8; 1; 2400; 0; 0; 0; 42; 93; 19; 2700; 0; 0; 0; 111; 137; 20; 3000; 0; 0; 0; 117; 134; 43; 3300; 0; 0; 0; 74; 137; 46; 3600; 0; 0; 0; 6; 40; 7; 3900; 0; 0; 0; 99; 137; 17; 4200; 0; 0; 0; 94; 137; 52; 4500; 0; 0; 0; 25; 97; 17; 4800; 0; 0; 0; 1; 21; 4; 5100; 0; 0; 0; 2; 29; 3; 5400; 0; 0; 0; 6; 28; 6;
Page 1
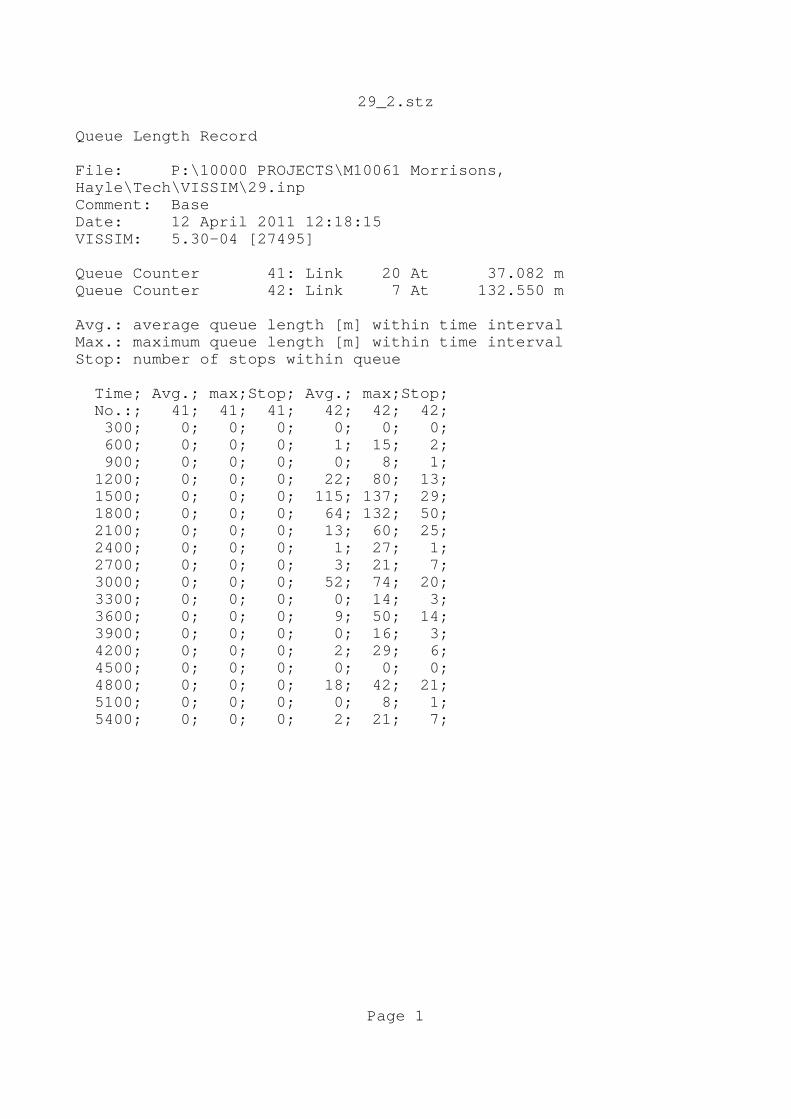
29_2.stz
Queue Length Record
File: P:\10000 PROJECTS\M10061 Morrisons, Hayle\Tech\VISSIM\29.inpComment: Base Date: 12 April 2011 12:18:15VISSIM: 5.30-04 [27495]
Queue Counter 41: Link 20 At 37.082 mQueue Counter 42: Link 7 At 132.550 m
Avg.: average queue length [m] within time intervalMax.: maximum queue length [m] within time intervalStop: number of stops within queue
Time; Avg.; max;Stop; Avg.; max;Stop; No.:; 41; 41; 41; 42; 42; 42; 300; 0; 0; 0; 0; 0; 0; 600; 0; 0; 0; 1; 15; 2; 900; 0; 0; 0; 0; 8; 1; 1200; 0; 0; 0; 22; 80; 13; 1500; 0; 0; 0; 115; 137; 29; 1800; 0; 0; 0; 64; 132; 50; 2100; 0; 0; 0; 13; 60; 25; 2400; 0; 0; 0; 1; 27; 1; 2700; 0; 0; 0; 3; 21; 7; 3000; 0; 0; 0; 52; 74; 20; 3300; 0; 0; 0; 0; 14; 3; 3600; 0; 0; 0; 9; 50; 14; 3900; 0; 0; 0; 0; 16; 3; 4200; 0; 0; 0; 2; 29; 6; 4500; 0; 0; 0; 0; 0; 0; 4800; 0; 0; 0; 18; 42; 21; 5100; 0; 0; 0; 0; 8; 1; 5400; 0; 0; 0; 2; 21; 7;
Page 1

29_3.stz
Queue Length Record
File: P:\10000 PROJECTS\M10061 Morrisons, Hayle\Tech\VISSIM\29.inpComment: Base Date: 12 April 2011 12:21:46VISSIM: 5.30-04 [27495]
Queue Counter 41: Link 20 At 37.082 mQueue Counter 42: Link 7 At 132.550 m
Avg.: average queue length [m] within time intervalMax.: maximum queue length [m] within time intervalStop: number of stops within queue
Time; Avg.; max;Stop; Avg.; max;Stop; No.:; 41; 41; 41; 42; 42; 42; 300; 0; 0; 0; 1; 14; 2; 600; 0; 0; 0; 0; 0; 0; 900; 0; 0; 0; 0; 0; 0; 1200; 0; 0; 0; 0; 0; 0; 1500; 0; 0; 0; 0; 9; 1; 1800; 0; 0; 0; 0; 0; 0; 2100; 0; 0; 0; 2; 19; 8; 2400; 0; 0; 0; 2; 17; 5; 2700; 0; 0; 0; 2; 29; 7; 3000; 0; 0; 0; 0; 14; 2; 3300; 0; 0; 0; 0; 16; 3; 3600; 0; 0; 0; 60; 110; 31; 3900; 0; 0; 0; 16; 75; 26; 4200; 0; 0; 0; 37; 61; 38; 4500; 0; 0; 0; 21; 117; 14; 4800; 0; 0; 0; 0; 8; 1; 5100; 0; 0; 0; 0; 14; 2; 5400; 0; 0; 0; 0; 0; 0;
Page 1

29_4.stz
Queue Length Record
File: P:\10000 PROJECTS\M10061 Morrisons, Hayle\Tech\VISSIM\29.inpComment: Base Date: 12 April 2011 12:25:09VISSIM: 5.30-04 [27495]
Queue Counter 41: Link 20 At 37.082 mQueue Counter 42: Link 7 At 132.550 m
Avg.: average queue length [m] within time intervalMax.: maximum queue length [m] within time intervalStop: number of stops within queue
Time; Avg.; max;Stop; Avg.; max;Stop; No.:; 41; 41; 41; 42; 42; 42; 300; 0; 0; 0; 0; 0; 0; 600; 0; 0; 0; 4; 21; 5; 900; 0; 0; 0; 0; 14; 2; 1200; 0; 0; 0; 6; 36; 6; 1500; 0; 0; 0; 6; 42; 8; 1800; 0; 0; 0; 7; 39; 10; 2100; 0; 0; 0; 1; 27; 6; 2400; 0; 0; 0; 8; 48; 18; 2700; 0; 0; 0; 43; 93; 28; 3000; 0; 0; 0; 5; 26; 11; 3300; 0; 0; 0; 0; 9; 1; 3600; 0; 0; 0; 4; 43; 8; 3900; 0; 0; 0; 17; 38; 17; 4200; 0; 0; 0; 64; 137; 33; 4500; 0; 0; 0; 31; 84; 36; 4800; 0; 0; 0; 0; 9; 2; 5100; 0; 0; 0; 2; 15; 7; 5400; 0; 0; 0; 0; 0; 0;
Page 1
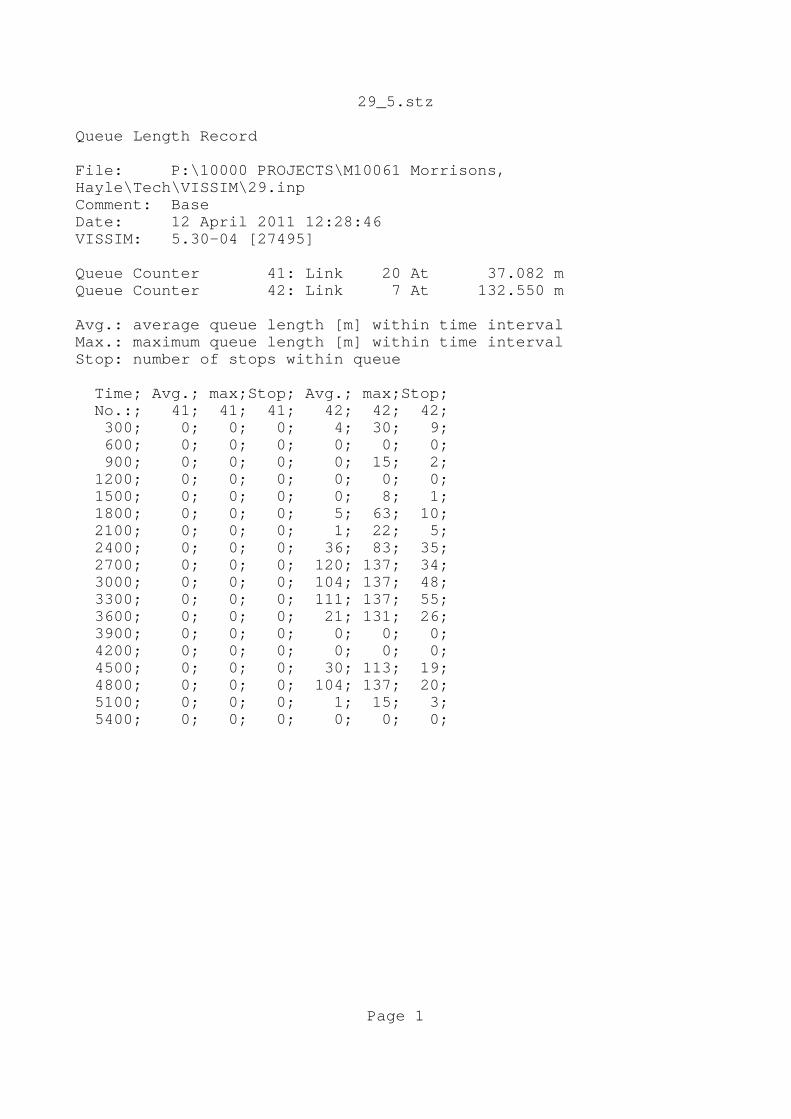
29_5.stz
Queue Length Record
File: P:\10000 PROJECTS\M10061 Morrisons, Hayle\Tech\VISSIM\29.inpComment: Base Date: 12 April 2011 12:28:46VISSIM: 5.30-04 [27495]
Queue Counter 41: Link 20 At 37.082 mQueue Counter 42: Link 7 At 132.550 m
Avg.: average queue length [m] within time intervalMax.: maximum queue length [m] within time intervalStop: number of stops within queue
Time; Avg.; max;Stop; Avg.; max;Stop; No.:; 41; 41; 41; 42; 42; 42; 300; 0; 0; 0; 4; 30; 9; 600; 0; 0; 0; 0; 0; 0; 900; 0; 0; 0; 0; 15; 2; 1200; 0; 0; 0; 0; 0; 0; 1500; 0; 0; 0; 0; 8; 1; 1800; 0; 0; 0; 5; 63; 10; 2100; 0; 0; 0; 1; 22; 5; 2400; 0; 0; 0; 36; 83; 35; 2700; 0; 0; 0; 120; 137; 34; 3000; 0; 0; 0; 104; 137; 48; 3300; 0; 0; 0; 111; 137; 55; 3600; 0; 0; 0; 21; 131; 26; 3900; 0; 0; 0; 0; 0; 0; 4200; 0; 0; 0; 0; 0; 0; 4500; 0; 0; 0; 30; 113; 19; 4800; 0; 0; 0; 104; 137; 20; 5100; 0; 0; 0; 1; 15; 3; 5400; 0; 0; 0; 0; 0; 0;
Page 1

Appendix M
VISSIM Output
Base plus Development

30_1.stz
Queue Length Record
File: P:\10000 PROJECTS\M10061 Morrisons, Hayle\Tech\VISSIM\30.inpComment: Base Dev, no keep clearsDate: 12 April 2011 12:54:12VISSIM: 5.30-04 [27495]
Queue Counter 41: Link 20 At 37.082 mQueue Counter 42: Link 7 At 132.550 m
Avg.: average queue length [m] within time intervalMax.: maximum queue length [m] within time intervalStop: number of stops within queue
Time; Avg.; max;Stop; Avg.; max;Stop; No.:; 41; 41; 41; 42; 42; 42; 300; 2; 17; 8; 0; 8; 1; 600; 0; 12; 5; 0; 0; 0; 900; 3; 20; 8; 1; 19; 2; 1200; 1; 17; 5; 25; 73; 16; 1500; 1; 18; 9; 43; 82; 41; 1800; 1; 17; 5; 60; 137; 52; 2100; 5; 25; 14; 68; 109; 59; 2400; 1; 31; 9; 100; 131; 43; 2700; 3; 18; 15; 24; 111; 26; 3000; 2; 12; 10; 46; 88; 46; 3300; 1; 12; 4; 107; 137; 26; 3600; 2; 26; 5; 129; 137; 26; 3900; 3; 25; 8; 132; 137; 22; 4200; 8; 30; 18; 131; 137; 18; 4500; 0; 17; 4; 129; 137; 25; 4800; 1; 12; 8; 33; 126; 26; 5100; 2; 30; 6; 21; 57; 24; 5400; 1; 12; 6; 9; 53; 9;
Page 1

30_2.stz
Queue Length Record
File: P:\10000 PROJECTS\M10061 Morrisons, Hayle\Tech\VISSIM\30.inpComment: Base Dev, no keep clearsDate: 12 April 2011 12:59:02VISSIM: 5.30-04 [27495]
Queue Counter 41: Link 20 At 37.082 mQueue Counter 42: Link 7 At 132.550 m
Avg.: average queue length [m] within time intervalMax.: maximum queue length [m] within time intervalStop: number of stops within queue
Time; Avg.; max;Stop; Avg.; max;Stop; No.:; 41; 41; 41; 42; 42; 42; 300; 2; 17; 6; 0; 0; 0; 600; 1; 11; 2; 0; 0; 0; 900; 1; 19; 9; 0; 0; 0; 1200; 4; 30; 16; 8; 39; 13; 1500; 2; 16; 10; 36; 67; 42; 1800; 3; 24; 11; 80; 108; 35; 2100; 0; 11; 6; 107; 137; 64; 2400; 1; 17; 6; 129; 137; 19; 2700; 1; 12; 8; 113; 137; 64; 3000; 2; 17; 9; 71; 137; 58; 3300; 0; 11; 6; 70; 137; 41; 3600; 3; 30; 13; 117; 137; 60; 3900; 3; 22; 12; 99; 137; 45; 4200; 3; 26; 10; 101; 137; 76; 4500; 0; 12; 2; 86; 137; 37; 4800; 0; 12; 4; 112; 137; 51; 5100; 0; 10; 2; 18; 102; 18; 5400; 1; 23; 10; 1; 20; 8;
Page 1
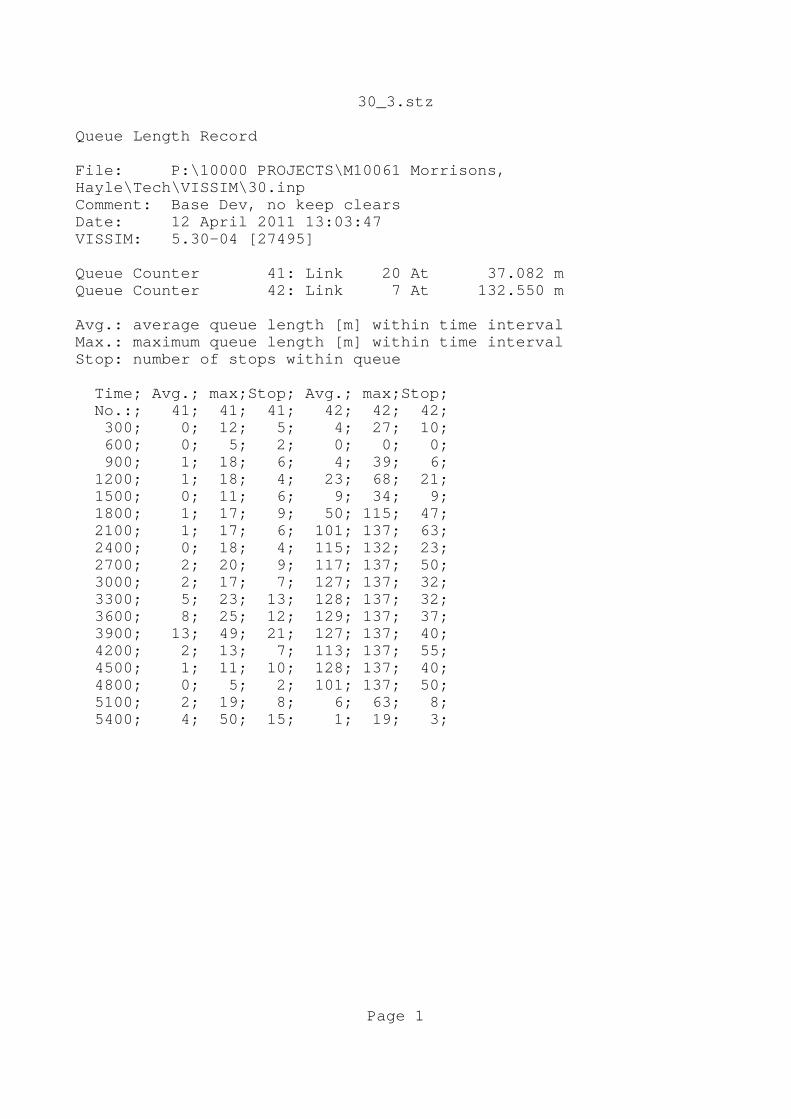
30_3.stz
Queue Length Record
File: P:\10000 PROJECTS\M10061 Morrisons, Hayle\Tech\VISSIM\30.inpComment: Base Dev, no keep clearsDate: 12 April 2011 13:03:47VISSIM: 5.30-04 [27495]
Queue Counter 41: Link 20 At 37.082 mQueue Counter 42: Link 7 At 132.550 m
Avg.: average queue length [m] within time intervalMax.: maximum queue length [m] within time intervalStop: number of stops within queue
Time; Avg.; max;Stop; Avg.; max;Stop; No.:; 41; 41; 41; 42; 42; 42; 300; 0; 12; 5; 4; 27; 10; 600; 0; 5; 2; 0; 0; 0; 900; 1; 18; 6; 4; 39; 6; 1200; 1; 18; 4; 23; 68; 21; 1500; 0; 11; 6; 9; 34; 9; 1800; 1; 17; 9; 50; 115; 47; 2100; 1; 17; 6; 101; 137; 63; 2400; 0; 18; 4; 115; 132; 23; 2700; 2; 20; 9; 117; 137; 50; 3000; 2; 17; 7; 127; 137; 32; 3300; 5; 23; 13; 128; 137; 32; 3600; 8; 25; 12; 129; 137; 37; 3900; 13; 49; 21; 127; 137; 40; 4200; 2; 13; 7; 113; 137; 55; 4500; 1; 11; 10; 128; 137; 40; 4800; 0; 5; 2; 101; 137; 50; 5100; 2; 19; 8; 6; 63; 8; 5400; 4; 50; 15; 1; 19; 3;
Page 1

30_4.stz
Queue Length Record
File: P:\10000 PROJECTS\M10061 Morrisons, Hayle\Tech\VISSIM\30.inpComment: Base Dev, no keep clearsDate: 12 April 2011 13:08:32VISSIM: 5.30-04 [27495]
Queue Counter 41: Link 20 At 37.082 mQueue Counter 42: Link 7 At 132.550 m
Avg.: average queue length [m] within time intervalMax.: maximum queue length [m] within time intervalStop: number of stops within queue
Time; Avg.; max;Stop; Avg.; max;Stop; No.:; 41; 41; 41; 42; 42; 42; 300; 1; 18; 5; 1; 22; 3; 600; 1; 11; 8; 2; 20; 2; 900; 1; 17; 7; 2; 13; 5; 1200; 2; 19; 10; 0; 13; 2; 1500; 1; 16; 6; 4; 27; 8; 1800; 5; 31; 15; 5; 28; 9; 2100; 1; 11; 7; 41; 87; 26; 2400; 0; 13; 7; 111; 131; 48; 2700; 1; 18; 5; 119; 137; 64; 3000; 2; 24; 7; 113; 135; 46; 3300; 0; 10; 1; 130; 137; 27; 3600; 4; 25; 13; 128; 137; 30; 3900; 4; 39; 12; 128; 137; 38; 4200; 1; 12; 6; 120; 137; 52; 4500; 2; 16; 9; 128; 137; 44; 4800; 2; 23; 9; 85; 137; 53; 5100; 1; 11; 5; 15; 52; 25; 5400; 0; 12; 3; 0; 0; 0;
Page 1

30_5.stz
Queue Length Record
File: P:\10000 PROJECTS\M10061 Morrisons, Hayle\Tech\VISSIM\30.inpComment: Base Dev, no keep clearsDate: 12 April 2011 13:13:23VISSIM: 5.30-04 [27495]
Queue Counter 41: Link 20 At 37.082 mQueue Counter 42: Link 7 At 132.550 m
Avg.: average queue length [m] within time intervalMax.: maximum queue length [m] within time intervalStop: number of stops within queue
Time; Avg.; max;Stop; Avg.; max;Stop; No.:; 41; 41; 41; 42; 42; 42; 300; 0; 11; 5; 1; 15; 3; 600; 3; 24; 10; 0; 0; 0; 900; 0; 11; 7; 0; 8; 1; 1200; 2; 17; 6; 2; 20; 6; 1500; 0; 5; 3; 2; 28; 10; 1800; 2; 19; 8; 8; 56; 19; 2100; 3; 18; 12; 16; 46; 20; 2400; 7; 31; 17; 67; 123; 59; 2700; 1; 24; 3; 130; 137; 48; 3000; 1; 12; 6; 119; 137; 52; 3300; 2; 18; 9; 123; 137; 21; 3600; 1; 25; 9; 120; 137; 52; 3900; 7; 24; 14; 126; 137; 48; 4200; 3; 24; 7; 129; 137; 45; 4500; 1; 18; 7; 125; 137; 55; 4800; 1; 12; 8; 50; 131; 33; 5100; 1; 11; 6; 4; 33; 11; 5400; 2; 25; 7; 3; 32; 5;
Page 1
Appendix M
VISSIM Output
Base plus Development
with Keep Clear marking for westbound traffic
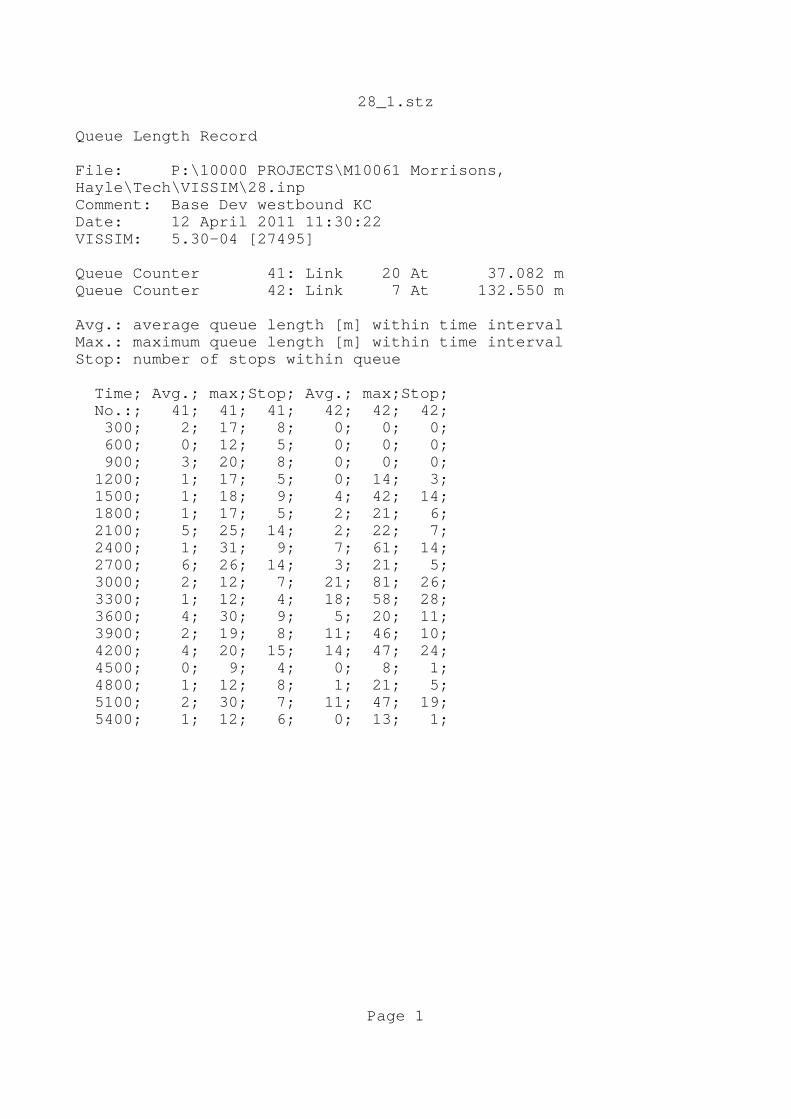
28_1.stz
Queue Length Record
File: P:\10000 PROJECTS\M10061 Morrisons, Hayle\Tech\VISSIM\28.inpComment: Base Dev westbound KCDate: 12 April 2011 11:30:22VISSIM: 5.30-04 [27495]
Queue Counter 41: Link 20 At 37.082 mQueue Counter 42: Link 7 At 132.550 m
Avg.: average queue length [m] within time intervalMax.: maximum queue length [m] within time intervalStop: number of stops within queue
Time; Avg.; max;Stop; Avg.; max;Stop; No.:; 41; 41; 41; 42; 42; 42; 300; 2; 17; 8; 0; 0; 0; 600; 0; 12; 5; 0; 0; 0; 900; 3; 20; 8; 0; 0; 0; 1200; 1; 17; 5; 0; 14; 3; 1500; 1; 18; 9; 4; 42; 14; 1800; 1; 17; 5; 2; 21; 6; 2100; 5; 25; 14; 2; 22; 7; 2400; 1; 31; 9; 7; 61; 14; 2700; 6; 26; 14; 3; 21; 5; 3000; 2; 12; 7; 21; 81; 26; 3300; 1; 12; 4; 18; 58; 28; 3600; 4; 30; 9; 5; 20; 11; 3900; 2; 19; 8; 11; 46; 10; 4200; 4; 20; 15; 14; 47; 24; 4500; 0; 9; 4; 0; 8; 1; 4800; 1; 12; 8; 1; 21; 5; 5100; 2; 30; 7; 11; 47; 19; 5400; 1; 12; 6; 0; 13; 1;
Page 1
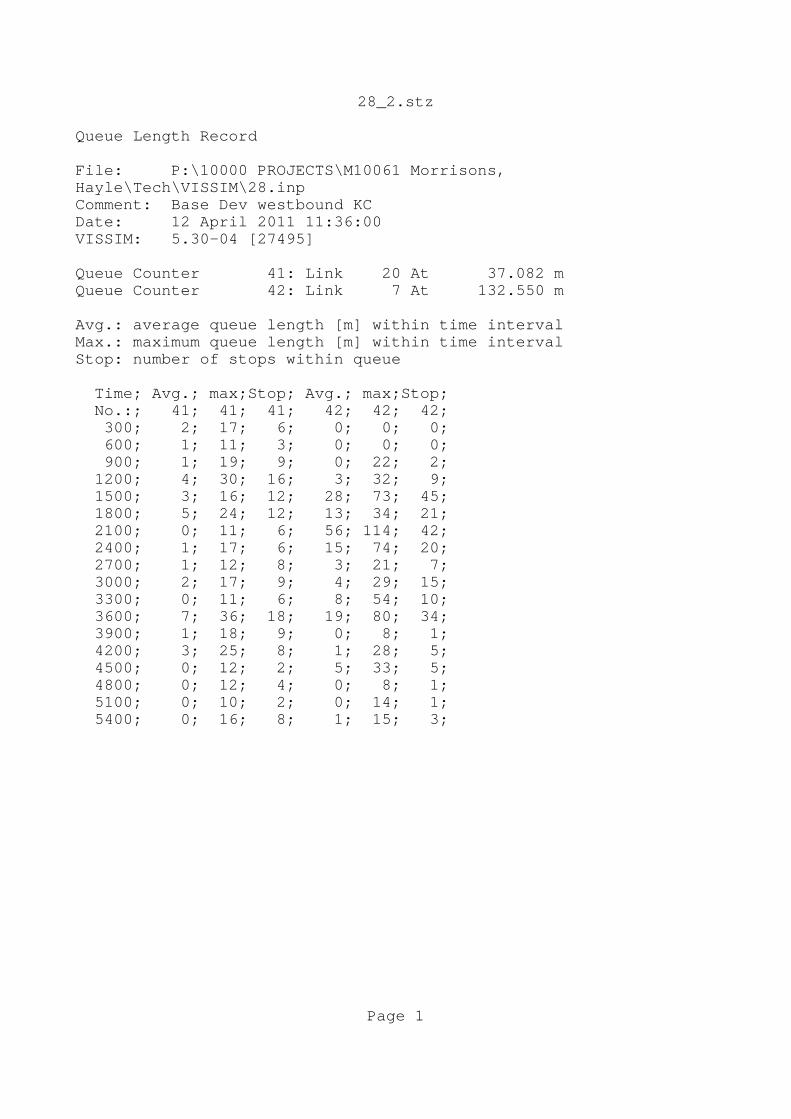
28_2.stz
Queue Length Record
File: P:\10000 PROJECTS\M10061 Morrisons, Hayle\Tech\VISSIM\28.inpComment: Base Dev westbound KCDate: 12 April 2011 11:36:00VISSIM: 5.30-04 [27495]
Queue Counter 41: Link 20 At 37.082 mQueue Counter 42: Link 7 At 132.550 m
Avg.: average queue length [m] within time intervalMax.: maximum queue length [m] within time intervalStop: number of stops within queue
Time; Avg.; max;Stop; Avg.; max;Stop; No.:; 41; 41; 41; 42; 42; 42; 300; 2; 17; 6; 0; 0; 0; 600; 1; 11; 3; 0; 0; 0; 900; 1; 19; 9; 0; 22; 2; 1200; 4; 30; 16; 3; 32; 9; 1500; 3; 16; 12; 28; 73; 45; 1800; 5; 24; 12; 13; 34; 21; 2100; 0; 11; 6; 56; 114; 42; 2400; 1; 17; 6; 15; 74; 20; 2700; 1; 12; 8; 3; 21; 7; 3000; 2; 17; 9; 4; 29; 15; 3300; 0; 11; 6; 8; 54; 10; 3600; 7; 36; 18; 19; 80; 34; 3900; 1; 18; 9; 0; 8; 1; 4200; 3; 25; 8; 1; 28; 5; 4500; 0; 12; 2; 5; 33; 5; 4800; 0; 12; 4; 0; 8; 1; 5100; 0; 10; 2; 0; 14; 1; 5400; 0; 16; 8; 1; 15; 3;
Page 1
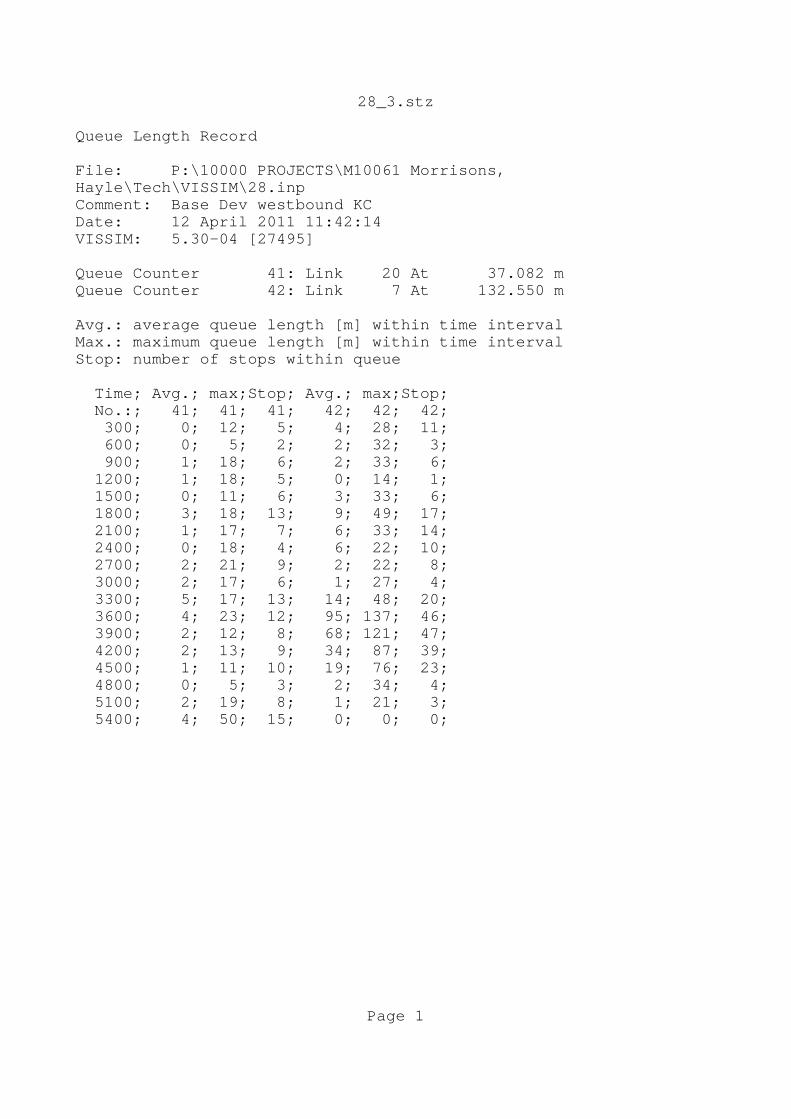
28_3.stz
Queue Length Record
File: P:\10000 PROJECTS\M10061 Morrisons, Hayle\Tech\VISSIM\28.inpComment: Base Dev westbound KCDate: 12 April 2011 11:42:14VISSIM: 5.30-04 [27495]
Queue Counter 41: Link 20 At 37.082 mQueue Counter 42: Link 7 At 132.550 m
Avg.: average queue length [m] within time intervalMax.: maximum queue length [m] within time intervalStop: number of stops within queue
Time; Avg.; max;Stop; Avg.; max;Stop; No.:; 41; 41; 41; 42; 42; 42; 300; 0; 12; 5; 4; 28; 11; 600; 0; 5; 2; 2; 32; 3; 900; 1; 18; 6; 2; 33; 6; 1200; 1; 18; 5; 0; 14; 1; 1500; 0; 11; 6; 3; 33; 6; 1800; 3; 18; 13; 9; 49; 17; 2100; 1; 17; 7; 6; 33; 14; 2400; 0; 18; 4; 6; 22; 10; 2700; 2; 21; 9; 2; 22; 8; 3000; 2; 17; 6; 1; 27; 4; 3300; 5; 17; 13; 14; 48; 20; 3600; 4; 23; 12; 95; 137; 46; 3900; 2; 12; 8; 68; 121; 47; 4200; 2; 13; 9; 34; 87; 39; 4500; 1; 11; 10; 19; 76; 23; 4800; 0; 5; 3; 2; 34; 4; 5100; 2; 19; 8; 1; 21; 3; 5400; 4; 50; 15; 0; 0; 0;
Page 1

28_4.stz
Queue Length Record
File: P:\10000 PROJECTS\M10061 Morrisons, Hayle\Tech\VISSIM\28.inpComment: Base Dev westbound KCDate: 12 April 2011 11:44:08VISSIM: 5.30-04 [27495]
Queue Counter 41: Link 20 At 37.082 mQueue Counter 42: Link 7 At 132.550 m
Avg.: average queue length [m] within time intervalMax.: maximum queue length [m] within time intervalStop: number of stops within queue
Time; Avg.; max;Stop; Avg.; max;Stop; No.:; 41; 41; 41; 42; 42; 42; 300; 1; 18; 5; 0; 14; 2; 600; 1; 11; 8; 1; 20; 2; 900; 1; 17; 7; 6; 34; 10; 1200; 5; 24; 15; 3; 21; 8; 1500; 1; 16; 6; 7; 28; 15; 1800; 6; 31; 16; 7; 33; 11; 2100; 1; 11; 7; 45; 92; 33; 2400; 1; 13; 8; 13; 55; 38; 2700; 1; 18; 6; 12; 37; 21; 3000; 2; 25; 7; 5; 29; 9; 3300; 0; 10; 1; 9; 42; 22; 3600; 3; 25; 14; 11; 46; 23; 3900; 8; 58; 18; 22; 54; 20; 4200; 1; 12; 6; 5; 34; 13; 4500; 2; 16; 8; 44; 63; 42; 4800; 1; 18; 8; 12; 55; 15; 5100; 1; 11; 5; 1; 20; 5; 5400; 1; 18; 4; 0; 13; 2;
Page 1

28_5.stz
Queue Length Record
File: P:\10000 PROJECTS\M10061 Morrisons, Hayle\Tech\VISSIM\28.inpComment: Base Dev westbound KCDate: 12 April 2011 11:45:58VISSIM: 5.30-04 [27495]
Queue Counter 41: Link 20 At 37.082 mQueue Counter 42: Link 7 At 132.550 m
Avg.: average queue length [m] within time intervalMax.: maximum queue length [m] within time intervalStop: number of stops within queue
Time; Avg.; max;Stop; Avg.; max;Stop; No.:; 41; 41; 41; 42; 42; 42; 300; 0; 11; 4; 1; 15; 4; 600; 3; 24; 10; 0; 14; 3; 900; 0; 11; 7; 0; 0; 0; 1200; 2; 17; 6; 3; 33; 13; 1500; 1; 10; 3; 3; 35; 8; 1800; 2; 19; 7; 2; 35; 10; 2100; 4; 23; 13; 12; 46; 18; 2400; 7; 30; 19; 22; 69; 37; 2700; 1; 24; 3; 16; 52; 31; 3000; 1; 11; 5; 3; 22; 5; 3300; 3; 12; 11; 23; 68; 24; 3600; 1; 18; 9; 37; 92; 36; 3900; 2; 18; 12; 21; 81; 20; 4200; 2; 18; 7; 7; 40; 10; 4500; 1; 18; 8; 1; 15; 5; 4800; 1; 12; 8; 2; 20; 4; 5100; 1; 11; 6; 0; 0; 0; 5400; 2; 25; 6; 1; 25; 6;
Page 1
Appendix M
VISSIM Output
Base plus Development
with Keep Clear markings in both directions

27_1.stz
Queue Length Record
File: P:\10000 PROJECTS\M10061 Morrisons, Hayle\Tech\VISSIM\27.inpComment: Base Dev both KCsDate: 12 April 2011 10:57:14VISSIM: 5.30-04 [27495]
Queue Counter 41: Link 20 At 37.082 mQueue Counter 42: Link 7 At 132.550 m
Avg.: average queue length [m] within time intervalMax.: maximum queue length [m] within time intervalStop: number of stops within queue
Time; Avg.; max;Stop; Avg.; max;Stop; No.:; 41; 41; 41; 42; 42; 42; 300; 2; 17; 8; 0; 0; 0; 600; 0; 12; 5; 0; 0; 0; 900; 3; 20; 8; 0; 0; 0; 1200; 1; 17; 5; 1; 19; 3; 1500; 1; 18; 9; 3; 29; 13; 1800; 2; 17; 5; 1; 21; 7; 2100; 5; 25; 14; 5; 35; 13; 2400; 1; 31; 9; 3; 54; 9; 2700; 3; 18; 14; 4; 35; 6; 3000; 1; 12; 6; 5; 29; 10; 3300; 0; 11; 4; 27; 80; 31; 3600; 5; 36; 9; 40; 107; 25; 3900; 2; 19; 8; 9; 40; 14; 4200; 3; 20; 17; 1; 14; 2; 4500; 0; 9; 4; 0; 0; 0; 4800; 1; 12; 7; 1; 14; 3; 5100; 2; 30; 7; 3; 35; 6; 5400; 1; 12; 6; 0; 10; 1;
Page 1
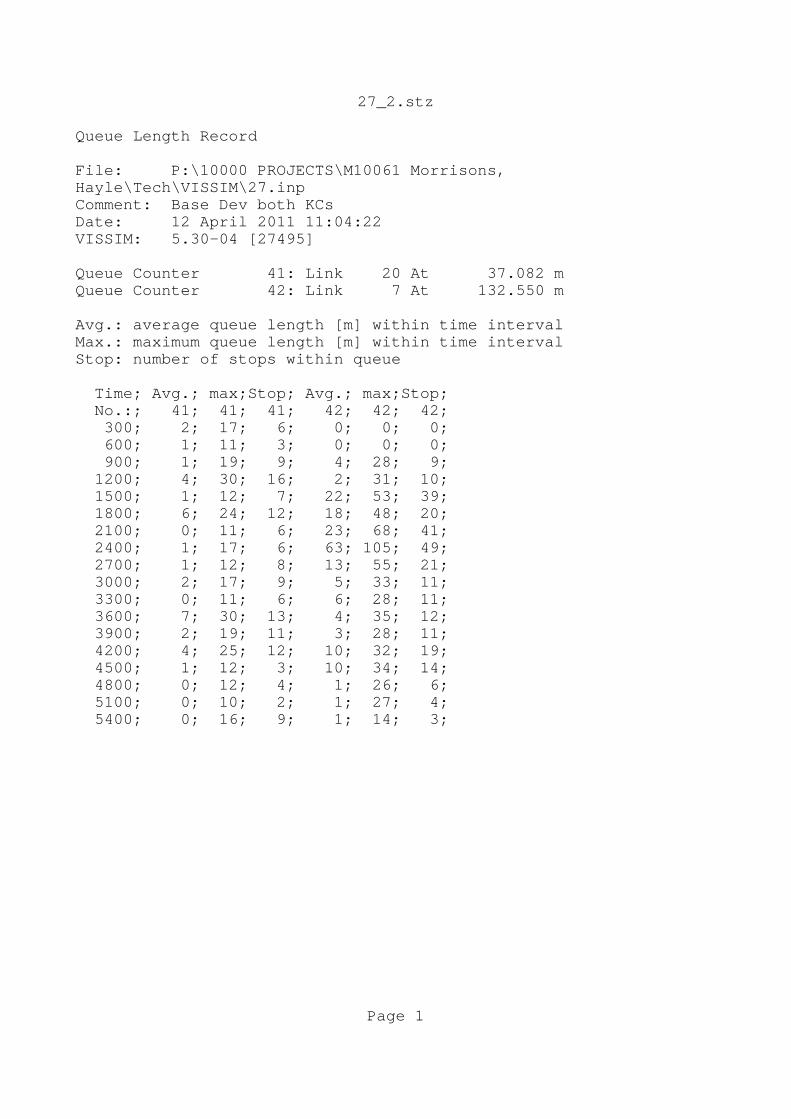
27_2.stz
Queue Length Record
File: P:\10000 PROJECTS\M10061 Morrisons, Hayle\Tech\VISSIM\27.inpComment: Base Dev both KCsDate: 12 April 2011 11:04:22VISSIM: 5.30-04 [27495]
Queue Counter 41: Link 20 At 37.082 mQueue Counter 42: Link 7 At 132.550 m
Avg.: average queue length [m] within time intervalMax.: maximum queue length [m] within time intervalStop: number of stops within queue
Time; Avg.; max;Stop; Avg.; max;Stop; No.:; 41; 41; 41; 42; 42; 42; 300; 2; 17; 6; 0; 0; 0; 600; 1; 11; 3; 0; 0; 0; 900; 1; 19; 9; 4; 28; 9; 1200; 4; 30; 16; 2; 31; 10; 1500; 1; 12; 7; 22; 53; 39; 1800; 6; 24; 12; 18; 48; 20; 2100; 0; 11; 6; 23; 68; 41; 2400; 1; 17; 6; 63; 105; 49; 2700; 1; 12; 8; 13; 55; 21; 3000; 2; 17; 9; 5; 33; 11; 3300; 0; 11; 6; 6; 28; 11; 3600; 7; 30; 13; 4; 35; 12; 3900; 2; 19; 11; 3; 28; 11; 4200; 4; 25; 12; 10; 32; 19; 4500; 1; 12; 3; 10; 34; 14; 4800; 0; 12; 4; 1; 26; 6; 5100; 0; 10; 2; 1; 27; 4; 5400; 0; 16; 9; 1; 14; 3;
Page 1

27_3.stz
Queue Length Record
File: P:\10000 PROJECTS\M10061 Morrisons, Hayle\Tech\VISSIM\27.inpComment: Base Dev both KCsDate: 12 April 2011 11:13:24VISSIM: 5.30-04 [27495]
Queue Counter 41: Link 20 At 37.082 mQueue Counter 42: Link 7 At 132.550 m
Avg.: average queue length [m] within time intervalMax.: maximum queue length [m] within time intervalStop: number of stops within queue
Time; Avg.; max;Stop; Avg.; max;Stop; No.:; 41; 41; 41; 42; 42; 42; 300; 0; 11; 5; 2; 26; 6; 600; 0; 5; 2; 0; 0; 0; 900; 1; 18; 6; 0; 15; 1; 1200; 1; 18; 4; 0; 16; 3; 1500; 1; 11; 7; 1; 21; 4; 1800; 3; 18; 10; 6; 35; 12; 2100; 1; 18; 6; 17; 68; 31; 2400; 0; 18; 4; 4; 21; 8; 2700; 2; 21; 9; 17; 57; 30; 3000; 2; 17; 7; 4; 54; 11; 3300; 3; 18; 12; 46; 90; 52; 3600; 5; 24; 14; 51; 131; 39; 3900; 0; 12; 8; 13; 53; 29; 4200; 2; 13; 7; 2; 22; 6; 4500; 1; 11; 12; 7; 41; 20; 4800; 0; 5; 2; 0; 0; 0; 5100; 2; 19; 8; 0; 20; 3; 5400; 4; 50; 15; 0; 14; 3;
Page 1

27_4.stz
Queue Length Record
File: P:\10000 PROJECTS\M10061 Morrisons, Hayle\Tech\VISSIM\27.inpComment: Base Dev both KCsDate: 12 April 2011 11:19:47VISSIM: 5.30-04 [27495]
Queue Counter 41: Link 20 At 37.082 mQueue Counter 42: Link 7 At 132.550 m
Avg.: average queue length [m] within time intervalMax.: maximum queue length [m] within time intervalStop: number of stops within queue
Time; Avg.; max;Stop; Avg.; max;Stop; No.:; 41; 41; 41; 42; 42; 42; 300; 1; 18; 6; 0; 14; 3; 600; 1; 11; 8; 1; 20; 2; 900; 1; 17; 7; 3; 26; 8; 1200; 4; 24; 10; 0; 14; 2; 1500; 1; 16; 6; 3; 21; 9; 1800; 7; 32; 15; 4; 27; 9; 2100; 1; 11; 7; 18; 61; 32; 2400; 1; 13; 8; 8; 48; 23; 2700; 1; 18; 5; 2; 25; 8; 3000; 2; 25; 6; 4; 30; 9; 3300; 0; 10; 1; 18; 62; 25; 3600; 3; 25; 13; 3; 27; 9; 3900; 4; 41; 11; 3; 21; 5; 4200; 1; 12; 6; 11; 55; 28; 4500; 2; 16; 7; 12; 41; 17; 4800; 1; 18; 8; 0; 0; 0; 5100; 1; 11; 5; 0; 14; 5; 5400; 0; 12; 3; 0; 13; 1;
Page 1

27_5.stz
Queue Length Record
File: P:\10000 PROJECTS\M10061 Morrisons, Hayle\Tech\VISSIM\27.inpComment: Base Dev both KCsDate: 12 April 2011 11:24:38VISSIM: 5.30-04 [27495]
Queue Counter 41: Link 20 At 37.082 mQueue Counter 42: Link 7 At 132.550 m
Avg.: average queue length [m] within time intervalMax.: maximum queue length [m] within time intervalStop: number of stops within queue
Time; Avg.; max;Stop; Avg.; max;Stop; No.:; 41; 41; 41; 42; 42; 42; 300; 0; 11; 3; 1; 22; 6; 600; 2; 23; 10; 0; 0; 0; 900; 0; 11; 7; 0; 8; 1; 1200; 2; 17; 6; 0; 15; 3; 1500; 0; 5; 3; 1; 20; 3; 1800; 2; 19; 7; 1; 22; 8; 2100; 7; 29; 18; 14; 46; 22; 2400; 9; 37; 22; 24; 47; 39; 2700; 1; 24; 4; 61; 110; 40; 3000; 1; 12; 5; 2; 28; 5; 3300; 3; 18; 13; 12; 47; 17; 3600; 1; 25; 9; 3; 26; 13; 3900; 2; 18; 13; 43; 116; 35; 4200; 1; 17; 4; 1; 14; 4; 4500; 1; 18; 7; 4; 26; 11; 4800; 1; 12; 7; 4; 20; 3; 5100; 1; 11; 6; 4; 40; 7; 5400; 2; 25; 5; 10; 53; 12;
Page 1