st. vincent and the grenadines reeffix exercise. vincent and the grenadines reeffix exercise...
TRANSCRIPT

St. Vincent and the Grenadines ReefFix Exercise
Economic Valuation of Goods and Services Derived from Coral Reefs in the Tobago Cays
Marine Park

ii
TABLE OF CONTENTS
INTRODUCTION ........................................................................................................................................ 1
PROJECT DESCRIPTION & BACKGROUND .................................................................................................... 1 REEFFIX EXERCISE ..................................................................................................................................... 1 TOBAGO CAYS EXERCISE ........................................................................................................................... 2 Workshop............................................................................................................................................... 2
STUDY SITE DESCRIPTION & BACKGROUND.................................................................................. 3
HISTORY ..................................................................................................................................................... 4 MANAGEMENT, LEGISLATION AND ENFORCEMENT .................................................................................... 4 ECOSYSTEM HEALTH .................................................................................................................................. 5 TOURISM..................................................................................................................................................... 6 FISHERIES ................................................................................................................................................... 7
METHODOLOGY ....................................................................................................................................... 8
WORLD RESOURCE INSTITUTE (WRI) VALUATION METHODOLOGIES ........................................................ 8 Tourism and Recreation (Non-consumptive Use Value) ....................................................................... 9 Fisheries (Consumptive Use Value) .................................................................................................... 10
VALUE TRANSFER: SPATIAL DISTRIBUTION OF ECOSYSTEM SERVICE VALUES ........................................ 11
ECONOMIC VALUATION RESULTS AND DISCUSSION ................................................................ 12
TOURISM................................................................................................................................................... 12 Accommodation Sector........................................................................................................................ 13 Visitor Reef Use ..............................................................................................................................................13 Leakages..........................................................................................................................................................13
MPA Revenue ...................................................................................................................................... 14 Marine Recreation............................................................................................................................... 14 Diving..............................................................................................................................................................15 Snorkelling ......................................................................................................................................................15
Local Use Valuation............................................................................................................................ 16 FISHERIES ................................................................................................................................................. 16 Fisheries Profile .................................................................................................................................. 16 Commercial Fisheries Analysis........................................................................................................... 17 Calculating from Official Landings Data ........................................................................................................17 Calculating from Fisher Surveys .....................................................................................................................17 Calculating from Reef Abundance ..................................................................................................................17
Commercial Fisheries Results............................................................................................................. 18 Fisher Operating Costs ....................................................................................................................... 19 Fish Cleaning and Processing ............................................................................................................ 20 Local Use Valuation............................................................................................................................ 20
ECOSYSTEM SERVICE VALUES: VALUE TRANSFER METHODOLOGY ......................................................... 21
COMPARISON OF THE VALUATION METHODOLOGIES & RESULTS..................................... 22
COMPARISON OF THE THREE METHODOLOGIES ........................................................................................ 22 COMPARISON TO OTHER SITES ................................................................................................................. 24
LESSONS LEARNED FROM THE DATA COLLECTION PHASE; IDENTIFICATION OF DATA
GAPS............................................................................................................................................................ 25
TOURISM................................................................................................................................................... 25 FISHERIES ................................................................................................................................................. 25 ECOSYSTEM SERVICE VALUES: VALUE TRANSFER METHODOLOGY ......................................................... 26
FURTHER RESEARCH............................................................................................................................ 26
CONCLUSION ........................................................................................................................................... 27

iii
REFERENCES............................................................................................................................................ 28
APPENDIX I: MARSIS GIS HABITAT MAP OF THE TOBAGO CAYS MARINE PARK
(BALDWIN 2009) ....................................................................................................................................... 31
APPENDIX IIA: LIST OF REFERENCES FOR DATA SOURCES (WRI TOURISM AND
RECREATION TOOL).............................................................................................................................. 32
APPENDIX IIB: LIST OF REFERENCES FOR DATA SOURCES (WRI FISHERIES TOOL) ..... 36
APPENDIX III: AGENDA FOR TOBAGO CAYS REEFFIX WORKSHOP (JANUARY 11-12, 2010)
...................................................................................................................................................................... 39
LIST OF TABLES
TABLE 1. SUMMARY OF TOTAL ECONOMIC IMPACT OF REEF-RELATED TOURISM AND RECREATION IN THE TCMP.................................................................................................................................................. 12
TABLE 2. VARIATIONS IN ACCOMMODATION REVENUES WITH A CURRENT LEAKAGE RATE OF 75% (2ND COLUMN) AND A PROJECTED LEAKAGE RATE OF 85% (3RD COLUMN). VALUES IN US DOLLARS............ 14
TABLE 3. FEE STRUCTURE FOR ENTRY AND USE OF THE TOBAGO CAYS MARINE PARK (VALUES ROUNDED OFF IN US DOLLARS)................................................................................................................................... 14
TABLE 4. ESTIMATED ANNUAL REVENUE EARNED FROM SCUBA DIVING ON REEFS IN THE TCMP (VALUES IN US DOLLARS) ....................................................................................................................................... 15
TABLE 5. ESTIMATED ANNUAL REVENUE EARNED FROM SNORKELLING IN THE TOBAGO CAYS (VALUES IN $US) .................................................................................................................................................... 16
TABLE 6. SUMMARY OF TOTAL ECONOMIC IMPACT OF REEF-RELATED FISHERIES AROUND THE TOBAGO CAYS MARINE PARK BASED ON DATA FROM OFFICIAL LANDING SITES .......................................................... 19
TABLE 7. ECOSYSTEM SERVICE VALUES BY COVER TYPE FOR THE TOBAGO CAYS MARINE PARK .............. 21
TABLE 8. SUMMARY OF THE STRENGTHS AND WEAKNESSES OF THE WRI ECONOMIC VALUATION METHODOLOGIES (FISHERIES, TOURISM AND RECREATION)................................................................ 23
TABLE 9. SUMMARY OF THE STRENGTHS AND WEAKNESSES OF THE VALUE TRANSFER METHODOLOGY (TROY AND WILSON 2006) .............................................................................................................................. 23
LIST OF FIGURES
FIGURE 1. MAP OF THE GRENADINE ISLANDS HIGHLIGHTING THE APPROXIMATE LOCATION OF THE CASE STUDY SITE (ADAPTED FROM SUSGREN 2005) ....................................................................................... 3
FIGURE 2. MAP OUTLINING DESIGNATED ZONES WITHIN THE TOBAGO CAYS (TCMP 2010) ........................... 4
FIGURE 3. BIOMASS OF HERBIVORES AND CARNIVORES AT HORSESHOE REEF. (DESCHAMPS 2000)................ 6
FIGURE 4. EXAMPLE OF A WATERTAXI OPERATING IN THE SOUTHERN GRENADINES ....................................... 7
FIGURE 5. COMPONENTS OF THE TOTAL ECONOMIC VALUE (TEV) THAT ARE DERIVED FROM CORAL REEFS (WRI 2009)............................................................................................................................................ 9
FIGURE 6. SENSITIVITY ANALYSIS OF ACCOMMODATION REVENUE WITH A 10% VARIATION IN THE ESTIMATED NUMBER OF VISITORS FROM NEIGHBOURING ISLANDS WHO USE THE TCMP BEACHES AND/OR REEFS (OCCUPANCY RATE = 55%)........................................................................................... 13
FIGURE 7. COMPARISON OF ANNUAL COMMERCIAL FISHING (GROSS) REVENUE BASED ON CALCULATIONS FROM LANDINGS, FISHER SURVEYS (N=18) AND REEF ABUNDANCE. VALUES IN US DOLLARS ............. 18
FIGURE 9. COMPARISON OF THE RESULTS FROM THE THREE METHODOLOGIES USED IN THIS STUDY .............. 22
FIGURE 10. COMPARISON OF THE REEFFIX RESULTS FROM FOUR COUNTRIES HIGHLIGHTING THE DIFFERENCES BETWEEN THE RESULTS OF WRI AND VALUE TRANSFER METHODOLOGY ............................................ 24

1
INTRODUCTION
Project Description & Background
The Inter-American Biodiversity Information Network (IABIN) is a web based forum that seeks to promote greater use and sharing of existing biodiversity information in order to improve decision-making and education amongst countries of the Western Hemisphere (Department of Sustainable Development 2009). At the Summit of the Americas on Sustainable Development in 1996, (convened by the OAS in Santa Cruz de la Sierra, Bolivia) IABIN was officially mandated to promote sustainable development and the conservation and sustainable use of biological diversity in the Americas. This is to be accomplished by improving the management of and access to biological information. IABIN has 5 Thematic Networks, (i) Species-Specimens, (ii) Ecosystems, (iii) Protected Areas, (iv) Pollinators, and (v) Invasive Species, as well as a metadata catalogue. The vision for IABIN is to become a data distribution system for technical and scientific information where providers control and maintain the source data. The main output for IABIN is to strengthen coastal management frameworks and develop a climate change adaptation plan for coral reefs and mangroves. More specifically:
1) Improved ecosystem valuation technical capacity of individual Caribbean countries to collect and manage their protected areas data in a way that meets their specific needs and context;
2) Improved individual country's protected areas data management systems based on output from case study sites;
3) Centralized data management system for the Caribbean region (drawing from protected areas databases where they exist or from other sources of protected areas information) which serves as a regional node for input to the Americas Database on Protected Areas and the World Database on Protected Areas (WDPA);
4) Capacity building activities in Integrated Coastal Zone Management (ICZM).
(Department of Sustainable Development 2009)
ReefFix Exercise
As a component of IABIN, ReefFix falls under the ICZM Capacity Building Program (output 4). This exercise, supported by the government of Chile is an ICZM tool that trains participating countries in ecosystem valuation methodologies and management techniques in order to better enable them to conserve marine ecosystems and the associated watersheds. ReefFix was recently used to assist the IABIN Caribbean Protected Areas Database Initiative (CPADI) through implementation of its activities in Jamaica, Dominican Republic, Bahamas, and Haiti. This exercise aims to:
• Support education and training efforts and model demonstration programmes aimed
at improving the management and conservation of coastal and marine resources;
• Educate the public about the ecological goods and services provided by coastal and
marine ecosystems;
• Improve the understanding of the status and trends of coastal and marine resources;
2
• Support implementation of the International Coral Reef Initiative (ICRI) at the
national and regional levels;
• Strengthen monitoring of coastal and marine resources, while supporting the
Intergovernmental Oceanographic Commission (IOC) Global Coral Reef Monitoring
Network;
• Support ongoing efforts to develop and implement ICZM plans and marine protected
areas.
(Department of Sustainable Development 2009)
Tobago Cays Exercise
Presenting resource management in the context of economics is a vital step to bridging the gap between scientific research and national policy making. This is imperative for a country such as St. Vincent and more so its Southern Grenadine islands where they are almost totally dependant on reef-related fisheries and tourism. The Tobago Cays Marine Park (TCMP) was selected as the case study site for the ReefFix exercise and the results are outlined in this report. The exercise was conducted over the months of September 2009 to January 2010 with the assistance of the many agencies listed in the report. With a greater understanding of the economic impact of the Tobago Cays Marine Park (TCMP) managers can better influence more proactive and sustainable decision making within the country and thereby aid in the preservation of the resource and ultimately the livelihoods of present and future generations.
Workshop
The results were presented to stakeholders during a two day workshop on January 11-12th 2010 (Appendix III) with discussions as to how the tools can be used to improve resource valuation and more importantly, conservation and management of marine resources within the country. In the afternoon participants had an opportunity to give brief presentations on some of the current activities of their organisations which was followed by questions and dialogue. During the field trip to TCMP on the second day, many of the participants were briefly educated on the day to day management activities of the park and the current areas of concern. These include pollution and yacht without holding tanks, invasive species and the cleaning of vessels in the park, operating costs and the establishment of a base in the park. Many of the participants expressed interest in ReefFix and discussions arose on its applicability to future valuation studies. It was noted that sustainability and carrying capacity could be a potential issue for the TCMP and research should be conducted in this regard. One of the main concerns with ReefFix however was the accuracy of the methodologies and questions were raised as to what would be the best economic valuation tool for St. Vincent and the Grenadines in terms of accuracy of results and cost of implementation.

3
Study Site Description & Background The Grenadines (Figure 1) are geologically older than St. Vincent and are situated on an extensive shallow bank where three-quarters lie in less than 50 m of water (ECLAC 2004). This creates ideal conditions for the formation of productive seagrass beds, mangroves and coral reefs. The Tobago Cays are located in the Southern Vincentian Grenadines about 50 kilometres south of the island of St. Vincent. The marine park (Figure 2) encompasses an area of 14 km2 (Pena 2006) and includes 5 uninhabited islands (Petit Rameau, Petit Bateau, Jamesby, Baradal and Petit Tabac) and the inhabited island of Mayreau (~250 residents).
Figure 1. Map of the Grenadine Islands highlighting the approximate location of the case study site
(Adapted from SusGren 2005)
Boundary
BARBADOS
GRENADA
ST. VINCENT
THE GRENADINES
ST. LUCIA
MARTINIQUE
TOBAGO
VENEZUELA
TRINIDAD
60
10
15
o
o
o
CARIBBEAN
SEA
ATLANTIC
OCEAN
BARBADOS
GRENADA
ST. VINCENT
THE GRENADINES
ST. LUCIA
MARTINIQUE
TOBAGO
VENEZUELA
TRINIDAD
60
10
15
o
o
o
CARIBBEAN
SEA
ATLANTIC
OCEAN

4
Figure 2. Map outlining designated zones within the Tobago Cays (TCMP 2010)
History
The Tobago Cays Marine Conservation Area was established in 1987 with a focus on managing fisheries resources (Pena 2006). As time passed it was later reclassified as the Tobago Cays Marine Park (TCMP) with tourism becoming the new focus. Over the years the park has changed ownership on numerous occasions however around 10 years ago, conflict arose after there was information about the possible sale of lands to a private company to develop part of the Tobago Cays (Caribbean Compass 2004). This proposal was met with much public outcry and was consequently denied. Currently the Grenadines are in the application process to become an United Nations Educational, Scientific and Cultural Organization (UNESCO) World Heritage Site.
Management, Legislation and Enforcement
Numerous management plans were drafted for the Tobago Cays however the 2007-2009 management plan proved to be the only recent document with significant implementation. An updated version of the management plan is currently in progress (TCMP 2010). During a recent MPA management effectiveness study (Pena 2006), the goals and objectives of the marine park were developed. The goal of the TCMP is “To protect, conserve and sustainably utilise the natural resources of the Tobago Cays for future
use”. The objectives are as follows:
• working with other relevant agencies using the media to promote the marine park as a
tourist resort and attraction
• ensuring that the park is managed along commercial lines
• protect the biodiversity of the park

5
• to conserve the marine resources
• public awareness and stakeholder participation
• public education
• to protect sustainable livelihoods Pena 2006
The Marine Parks Act, 1997 and the Marine Parks (Tobago Cays) Regulations, 1998 allow for the establishment of the Marine Park Board which administers the activities of the TCMP (Pena 2006). The Tobago Cays has an appointed park manager with a multi-stakeholder board including individuals from the government and civil society. The board is responsible for reporting to the Prime Minister’s Office on its activities and controlling the operations of the park including staff recruitment, enforcement and the development of workplans and budgets (Pena 2006). Section 6 of the Marine Parks Act, 1997 outlines the activities that are restricted within the park (Mattai & Mahon 2006). These include fishing in the no-take zone, removing objects or damaging equipment including buoys and “damaging the growth of flora and fauna”. Pollution of air and sea by omission or negligence and unapproved commercial activities also incur the penalty of no less than EC$5000 (US$1912) or a year in prison. The TCMP rangers patrol the Cays to monitor activities within the park and are responsible for the enforcement of the above legislation. However limited resources in previous years inhibited their surveillance capabilities (Pena 2006) and there were numerous reports of illegal fishing and unreported entries. Nevertheless these activities have significantly abated over the years (TCMP 2010) and park rules are now better enforced. The Grenadines lie in the jurisdiction of the countries of St. Vincent and Grenada with the Tobago Cays positioned at approximately 11km from the Grenada boundary. This adds to the complexity of management as fishers of both nationalities utilise the reefs surrounding the park.
Ecosystem Health
All of the three major marine ecosystems are present within the Tobago Cays. Mangroves are located on the eastern side of Petit Rameau and large areas of seagrass beds lie in the centre lagoon sheltered by bank-barrier reefs to the east. The Horseshoe reef provides vital protection from incoming wave action from the open Atlantic and is the major reef complex within the Tobago Cays. It is also one of the longest bank-barrier reefs in the Southern Grenadines (Deschamps 2000). Until the past 15-20 years, the Tobago Cays has received little scientific attention and the first major attempt to quantitatively assess the reefs was in 1995 (Pena 2006). Pollution from yachts and physical damage from vessels have been cited as the major negative anthropogenic factors affecting reef health in the Tobago Cays (Deschamps 2000, Pena 2006). Storm damage and coral disease were also listed as other detrimental causes. Surveys (Reef CheckTM) indicate varying levels of hard coral cover ranging from low to reasonable which during the study period appeared to be decreasing over time at certain

6
sites (Pena 2006). In other studies (Atlantic and Gulf Rapid Reef Assessment) low densities of commercially viable species were observed and attributed to overfishing (Figure 3) (Deschamps 2000).
Figure 3. Biomass of herbivores and carnivores at Horseshoe Reef. (Deschamps 2000)
Tourism
As the 2008 “7th Most Spectacular Island Paradise” (The Travel Channel), "2009 Honeymoon Destination" (Travel Weekly's 2009 Silver Magellan Awards), 2006 “Caribbean Diving Island of the Year” and 2009 “Best Sailing & Yachting Island of the Year" (Caribbean Travel Awards), St. Vincent and the Grenadines have been a prime attraction to visitors from all around the world (SVG Tourism Authority 2009a). The Tobago Cays is a central hub for yachting tourism in the Southern Caribbean and it is estimated that 84% of yachters visiting the Vincentian Grenadines make a stopover in the Tobago Cays (ECLAC 2004). Some of the major attracting factors of the Cays besides its picturesque landscape are the favourable mooring conditions provided by outer reefs and its location below the major hurricane belt. The area is also the port of call for around three small cruise ships each with a capacity of around 500-600 passengers (TCMP 2009). As a result, the Tobago Cays contribute significantly to the St. Vincent tourism conomy with over 50,00 annual visitors to the park (TCMP 2009). This contribution is even more significant to the livelihoods of the residents of the islands of Mayreau and Union Island where tourism is the main source of income (Simmons and McConney 2005). Watertaxiing, food and beverage sales, souvenirs, equipment rentals, dive and snorkel trips and charter cruises are some of the income-generating opportunities that the Grenadine residents take advantage of. Fishers also benefit by selling their catch directly to yachts at a rate higher than they receive on shore. This informal sector contributes significantly to tourism in the Grenadines. For those not entering by yacht, water taxis (Figure 4) are the preferred means of travel into the Tobago

7
Cays. These operators are usually made up of individuals who convert traditional fishing boats into the tour boats (Jardine and Straker 2003). These are also the preferred mode of transport for cruise ship passengers from ships docked off Mayreau (TCMP 2009). In the Southern Grenadines the watertaxis have organised themselves into associations which allows for better advocacy and increases access to capital such as government loans (Simmons and McConney 2005). With such a high dependence on tourism, the conservation of the natural resources of the Tobago Cays is imperative, especially for an area where poverty is a recognised national problem (Simmons and McConney 2005).
Figure 4. Example of a watertaxi operating in the Southern Grenadines
Fisheries
The marine ecosystems within the TCMP provide significant nursery habitat for commercially viable species and likely contribute to the fisheries in the surrounding reefs. These surrounding reefs are frequented by fishers from Mayreau and the neighbouring islands of Canouan and Union Island. They are also visited less frequently by fishers from as far north as Bequia and south as Petit Martinique (Gill 2006). The Tobago Cays itself was the location of a traditional fishing camp which acted as a base of operations for many years. Fishers note the area as a reliable site for the harvesting of sea turtles however would not allude to whether or not this practice continues to the present day. Legitimate fishing is permitted for locals along the western corridor of the park however there have been some reports of occasional illegal fishing within the park though significantly less than when the park was first introduced (TCMP 2010). Based on FAO data (1999), the national fishing industry contributes to approximately 2% of the country’s annual Gross Domestic Product (GDP) (FAO 2002). This figure is disproportionately weighted to the main island of St. Vincent where the majority of landings occur. The industry in the Grenadines consists almost entirely of small scale artisianal fishers who use small vessels (less than 32 ft) and between 25-100 horsepower (Simmons and McConney 2005). As the Grenadine fishery is multi-gear and multi-species (Simmons and McConney 2005), various fish groups are landed at each site ranging from lobsters and conch to small inshore pelagics (jacks, robins). Conch and lobster attract higher prices and average around EC$13 (US$4.97) with lobster as the most profitable species (Gill 2006). The majority of fish landed in the Grenadines are demersals and these have an average price of EC$8 (US$3.10) for sale on shore and US$1.20 per pound on the trading vessels which takes the majority of demersal fish in the

8
region to Martinique (Gill 2006). As a result, the shallow-shelf demersals (“reef fish”) are the most exploited species group and this has been validated by reef surveys (Deschamps 2000). Poverty amongst the people of St. Vincent and the Grenadines has been a significant issue with the results of a survey in 1996 revealing that 37.6% of the population are living in poverty (Simmons and McConney 2005). With limited land availability and low rainfall, agriculture is not a viable industry in the Grenadines and fishing was the major source of income on many islands before the tourism boom of the late 20th century. Despite the current reliance on the tourism sector, the effective management of the fishing industry is essential for the sustaining of livelihoods and poverty alleviation in the southern Grenadines.
Methodology One of the major objectives of this exercise is to demonstrate the application of various economic valuation techniques in St.Vincent and the Grenadines. ReefFix employs the use of three methodologies, two developed by the World Resources Institute and one using a direct value transfer method.
World Resource Institute (WRI) Valuation Methodologies
Coral reef valuation involves the estimation of the economic benefits that are gained from the presence of reefs and can be derived from examining the use and non-use value (Figure 5). Less tangible benefits such as indirect use from shoreline protection and non-use/existence value are much more difficult to quantify as non-market forces determine their values. The WRI Valuation Tools only account for estimates of revenues that are generated from the direct use of coral reefs, and hence value is based on current market prices. As a result, the methodology will underestimate the overall value of goods and services provided by coral reefs, as it focuses solely on consumptive use from fishing and non-consumptive use associated with tourism and recreation. Although non-market values such as consumer surplus can be affixed to the market values, none such data were available during the time of this study. Multipliers were also unavailable during the study period. Data were gathered through information received from the Tobago Cays Marine Park Office, Fisheries Division, St. Vincent and the Grenadines Tourism Authority (SVGTA), and the St. Vincent and the Grenadines Hotel and Tourism Association (SVGHTA). This comprised of a combination of statistical data and information based on expert opinion. Where possible, additional data were garnered from external sources to fill the necessary information gaps. The full list of data sources can be found in Appendix IIa and IIb. To account for errors in the data and the assumptions made in the study, the sensitivity analysis was often employed using a range of + 20% (for most values) as used in similar valuation studies (Burke et al. 2008, Cooper et al. 2009).

9
Figure 5. Components of the Total Economic Value (TEV) that are derived from coral reefs (WRI
2009)
Tourism and Recreation (Non-consumptive Use Value)
The tourism data were compiled and analysed using the World Resources Institute’s (WRI) Coral Reef Valuation Tool (v2.0): A Tool to Guide the Economic Valuation of Goods and Services from Coral Reefs (Tourism and Recreation Component). This creates an estimation of the direct economic impacts from the reef-based accommodation and recreation (snorkelling, diving, coralline beach use) sectors using existing data. As data were limited, assumptions were made in the analysis so that the necessary data requirements for the tool could be met. Some of the major assumptions were:
• Accommodation (use of park): The study only considered accommodations on the
Vincentian islands in close proximity to the park. According to the SVGHTA 85%-
90% of “land-based” visitors (visitors occupying any type of paid accommodation) to
the islands use the reef/beach at least once during their stay. This value coincided
with the figures given from the TCMP staff who believed that 85-95% of visitors in
Union Island, Palm Island and Mayreau visit the Tobago Cays at least once.
However, they also stated that persons who stay in Canouan and Petit St. Vincent
(which make up the majority of this group) are reported to visit the park less
frequently (40-50%). As a results, a +10% variation was used in the sensitivity
analysis (39-59%) so as to account for errors in the assumption.
• Accommodation (occupancy rates): Based on limited data on occupancy rates
obtained from the SVGTA, occupancy could be as low as 1.4% in some properties
and as high as 82% in others (January-February 2009). This information was based
primarily on hotels located on the St. Vincent “mainland” and not the Grenadine
islands. Expert opinion was therefore necessary for occupancy rates for the entire
country and an estimated national average of 55% was derived and used for
properties where no data were available (SVGHTA 2009). To account for the wide

10
range in occupancy rates and possible error, a +20% variation was used in the
sensitivity analysis (35-75%).
• Diving: Grenadines Dive is said to be the only major dive operator permitted to
conduct business within the Tobago Cays (TCMP 2009) therefore all the information
used in the valuation was derived from that dive shop. The average single tank dive
costs US$65 and includes equipment. For equipment rental only, the cost is US$60.
The valuation tool requires a separate equipment rental price however, as rental is
vastly subsided when purchased with a dive trip, inputting a separate rental cost
would create an overestimation of revenue if it is added onto the dive price. To
simplify the process, the assumption was made that all persons engaged in diving
within the Tobago Cays do so through the Grenadines Dive (as it is discouraged to do
so otherwise), and rented equipment.
Fisheries (Consumptive Use Value)
Similarly, fisheries data were compiled and analysed using the other WRI’s Coral Reef Valuation Tool (v2.1): A Tool to Guide the Economic Valuation of Goods and Services from Coral Reefs (Fisheries Component). This section focuses on the contributions to the economy derived from reef-associated fishing as well as other added value (e.g. local fishing for enjoyment and consumption). No known multipliers were available and therefore were not used in the study. As data were also limited for this component, major assumptions were made regarding the data. These include:
• Commercial and Local Fishing: The total number of persons in the area engaged in
fishing as an occupation, for consumption or as a past-time was unclear therefore
estimates were used based on 2006 surveys (Gill 2006) and local expert opinion
(TCMP 2009).
• Commercial Fisheries. The tool allows for three ways to calculate commercial
fisheries value. Each of these involved major assumptions to produce an estimate of
annual revenue.
o Estimate by landings data: There is no fishing allowed in the majority of the
park however it can be assumed that the reef species and habitats within the
park are providing supporting services to the surrounding reefs in the
Southern Grenadines. Therefore for the purpose of the analysis, all landings
data in Zone 7 (Canouan, Union Island, Petite Martinique) will be included in
the analysis. The only official landings data that were available for the years
2006-2008 were from one island (Union Island). To fill the missing data,
estimates of landings at the other official landing sites (Canouan, Petite
Martinique) were created using data from 1999-2002 (Jardine and Straker
2003). It is likely that trading vessels account for most of reef fish landings in
the area however no landings data were available for the trading vessels in the
south. Therefore it was assumed that trading vessel landings in the south were
equivalent to those in the Northern Grenadines. A conversion factor was
added to account for the lower prices paid by the vessels so that it would be

11
comparable to landings in the markets. There was no differentiation of
species landed and all of these values include offshore pelagic data (tunas,
dolphinfish, etc.) where it is assumed that these species spend part of their life
cycle on reefs. All of these assumptions may create and overestimation of the
TCMP contribution to the fishery however its input can not be ignored.
o Estimate by reef abundance: In order to effectively compare the estimated
landings data in Zone 7 to the estimated reef abundance, all nearshore reefs
within the Zone were included in the reef abundance calculation bringing the
total reef area to approximately 29km2. It must be noted however that only the
deeper reefs within the TCMP were included as the other deep reefs were not
visible by satellite imagery. This calculation will therefore be based on an
underestimation of the reef area.
o Estimate from fisher interviews: Data were available on estimated daily
landings and trips per week from 17 full time and 1 part time fishers in Zone 7
(Vincentian only) from a study in 2006 (Gill 2006). As this study requires
annual data, the number of weeks fished per year were estimated at 48 for full
time and 32 for part time fishers (in relation to the lobster season) unless
specified otherwise.
Value Transfer: Spatial Distribution of Ecosystem Service Values
The third methodology utilises a “benefits transfer” technique that uses calculated values from “heavily-studied” reefs in other areas and applying them to the similar sites (Department of Sustainable Development 2009). For the purposes of this study, land cover will be classified into a unique typology developed by Troy, Austin and Matthew A. Wilson in “Practical challenges and opportunities in linking GIS and value transfer” (Ecological Economics 60 (2006)435-449). Categories of land cover types include coral reef environs, mangroves, beaches, freshwater herbaceous swamp grasslands and coastal forests (Table 7). This method, unlike the WRI Valuation Tool, includes indirect use values such as shoreline protection. Terrestrial area values for the TCMP were derived from Google EarthTM satellite imagery (2005) where the desired land cover types were outlined and exported into ArcMap 9.2 in order to calculate surface area. Select marine data were derived from the Marine Resource and Space-use Information System (MarSIS) GIS database developed by Ms. Kimberly Baldwin (PhD candidate). The MarSIS project seeks to aid marine space use planning and management in the Grenadines by gathering information on marine space use such as critical habitats, representative marine ecosystems, areas of high aesthetic value and cultural importance, fishing grounds and marine-based tourism, areas of highest human threat and space use conflict (CERMES 2006). The MarSIS surface area values were identified through site surveys of the bottom habitats and include deeper reefs that can not be correctly defined by Google EarthTM satellite photographs.
12
Economic Valuation Results and Discussion
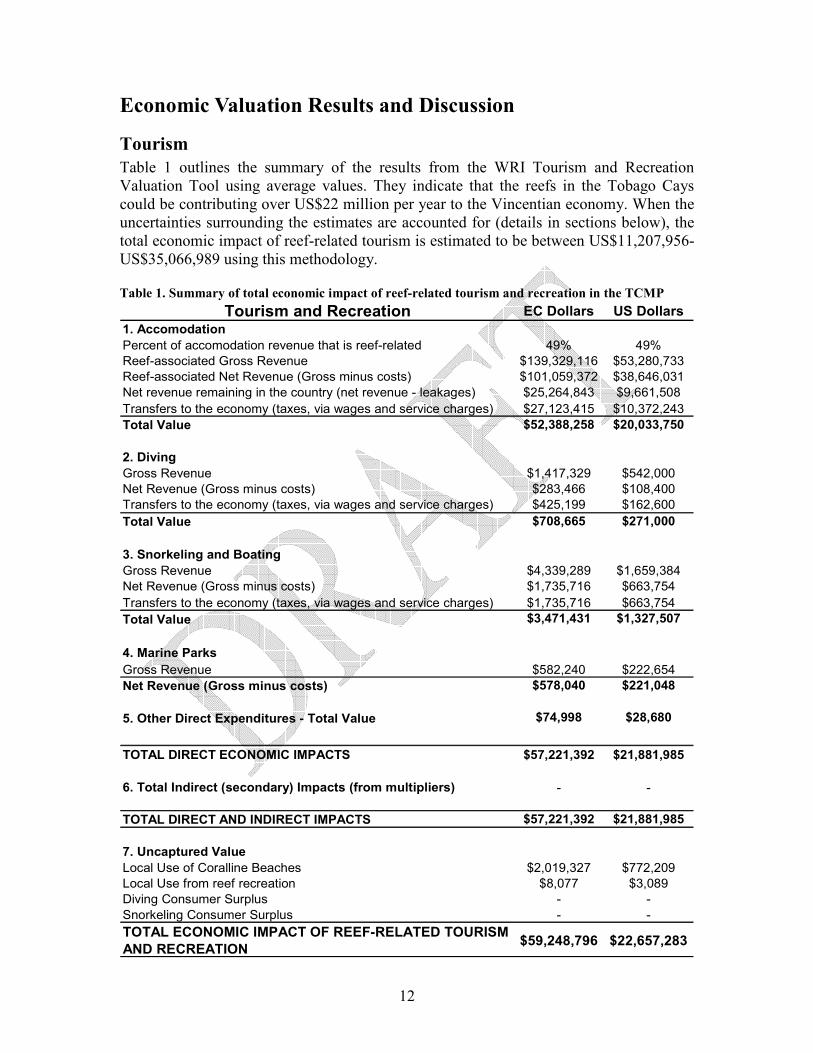
Tourism
Table 1 outlines the summary of the results from the WRI Tourism and Recreation Valuation Tool using average values. They indicate that the reefs in the Tobago Cays could be contributing over US$22 million per year to the Vincentian economy. When the uncertainties surrounding the estimates are accounted for (details in sections below), the total economic impact of reef-related tourism is estimated to be between US$11,207,956- US$35,066,989 using this methodology. Table 1. Summary of total economic impact of reef-related tourism and recreation in the TCMP
Tourism and Recreation EC Dollars US Dollars
1. Accomodation
Percent of accomodation revenue that is reef-related 49% 49%
Reef-associated Gross Revenue $139,329,116 $53,280,733
Reef-associated Net Revenue (Gross minus costs) $101,059,372 $38,646,031
Net revenue remaining in the country (net revenue - leakages) $25,264,843 $9,661,508
Transfers to the economy (taxes, via wages and service charges) $27,123,415 $10,372,243
Total Value $52,388,258 $20,033,750
2. Diving
Gross Revenue $1,417,329 $542,000
Net Revenue (Gross minus costs) $283,466 $108,400
Transfers to the economy (taxes, via wages and service charges) $425,199 $162,600
Total Value $708,665 $271,000
3. Snorkeling and Boating
Gross Revenue $4,339,289 $1,659,384
Net Revenue (Gross minus costs) $1,735,716 $663,754
Transfers to the economy (taxes, via wages and service charges) $1,735,716 $663,754
Total Value $3,471,431 $1,327,507
4. Marine Parks
Gross Revenue $582,240 $222,654
Net Revenue (Gross minus costs) $578,040 $221,048
5. Other Direct Expenditures - Total Value $74,998 $28,680
TOTAL DIRECT ECONOMIC IMPACTS $57,221,392 $21,881,985
6. Total Indirect (secondary) Impacts (from multipliers) - -
TOTAL DIRECT AND INDIRECT IMPACTS $57,221,392 $21,881,985
7. Uncaptured Value
Local Use of Coralline Beaches $2,019,327 $772,209
Local Use from reef recreation $8,077 $3,089
Diving Consumer Surplus - -
Snorkeling Consumer Surplus - -
TOTAL ECONOMIC IMPACT OF REEF-RELATED TOURISM
AND RECREATION$59,248,796 $22,657,283

13
Accommodation Sector
Data were available for a total of 21 accommodations in the islands surrounding the park comprising of hotels, guest houses and apartments. Room rates ranged from US$42.50 to US$2737.50 per night. The total reef-related accommodation value is approximately US$10,505,523 to US$32,383,185 per year. This range is based on a +10% variation in percent of tourists using the reef or coralline beaches (39-59%) and a + 20% range in occupancy rates (35%-75%).
Visitor Reef Use
It is unclear whether or not the estimates of “land-based” visitors (using accommodation on surrounding islands) to the TCMP are precise. A 10% increase in TCMP reef and coralline beach usage will translate into an increase of US$4,104,327 in gross annual revenue (at an average occupancy rate) per year and a US$1,979,359 increase in net revenue remaining in the country (Figure 6). More investigations would need to be conducted to get more accurate values.
Economic Valuation of Coral Reefs from Tourist
Accomodation: Current and Projected Revenues
and Transfers
$9,661,508$11,640,867
$10,372,243
$12,497,211
$0
$5,000,000
$10,000,000
$15,000,000
$20,000,000
$25,000,000
$30,000,000
Current Average Projected Average
US Dollars
TransfersWithin theEconomy
NetRevenueRemainingin Country
Figure 6. Sensitivity analysis of accommodation revenue with a 10% variation in the estimated
number of visitors from neighbouring islands who use the TCMP beaches and/or reefs (occupancy
rate = 55%)
Leakages
Another possible underestimation is the leakage rate (75%). Leakages are a significant problem in the Caribbean where most of the properties are foreign-owned and the large portion of some materials (food, toiletries, linens) used by guests are imported (Tourism Global Inc. 2006). The tool however defines leakages as the percent of rooms that are not owned by locals, expecting the profits to be used in external markets. According to the SVGHTA, the leakage rate could be as high as 85% due to the exceptionally small
49% 59%
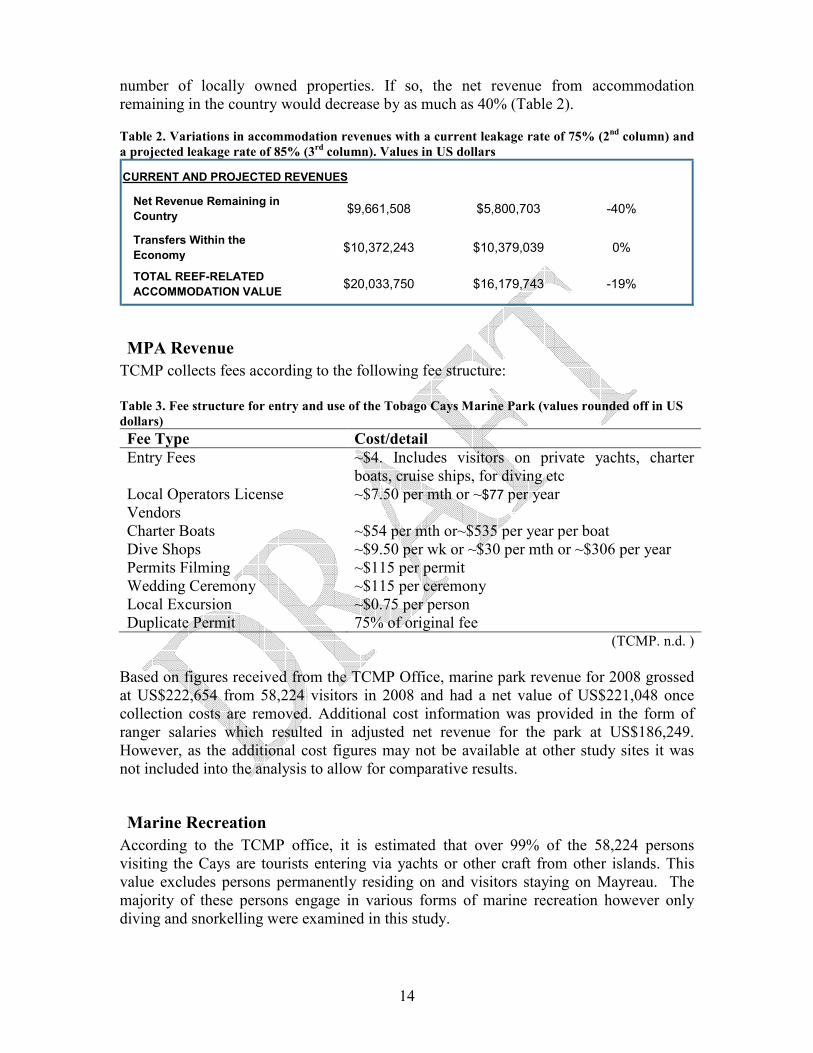
14
number of locally owned properties. If so, the net revenue from accommodation remaining in the country would decrease by as much as 40% (Table 2).
Table 2. Variations in accommodation revenues with a current leakage rate of 75% (2nd column) and
a projected leakage rate of 85% (3rd column). Values in US dollars
CURRENT AND PROJECTED REVENUES
Net Revenue Remaining in
Country$9,661,508 $5,800,703 -40%
Transfers Within the
Economy$10,372,243 $10,379,039 0%
TOTAL REEF-RELATED
ACCOMMODATION VALUE$20,033,750 $16,179,743 -19%
MPA Revenue
TCMP collects fees according to the following fee structure: Table 3. Fee structure for entry and use of the Tobago Cays Marine Park (values rounded off in US
dollars)
Fee Type Cost/detail
Entry Fees ~$4. Includes visitors on private yachts, charter boats, cruise ships, for diving etc
Local Operators License Vendors
~$7.50 per mth or ~$77 per year
Charter Boats ~$54 per mth or~$535 per year per boat Dive Shops ~$9.50 per wk or ~$30 per mth or ~$306 per year Permits Filming ~$115 per permit Wedding Ceremony ~$115 per ceremony Local Excursion ~$0.75 per person Duplicate Permit 75% of original fee
(TCMP. n.d. ) Based on figures received from the TCMP Office, marine park revenue for 2008 grossed at US$222,654 from 58,224 visitors in 2008 and had a net value of US$221,048 once collection costs are removed. Additional cost information was provided in the form of ranger salaries which resulted in adjusted net revenue for the park at US$186,249. However, as the additional cost figures may not be available at other study sites it was not included into the analysis to allow for comparative results.
Marine Recreation
According to the TCMP office, it is estimated that over 99% of the 58,224 persons visiting the Cays are tourists entering via yachts or other craft from other islands. This value excludes persons permanently residing on and visitors staying on Mayreau. The majority of these persons engage in various forms of marine recreation however only diving and snorkelling were examined in this study.

15
Diving
The gross revenue generated from diving was estimated at US$542,000 per year (Table 4) with the government receiving an estimated US$54,200 in tax revenue. The dive shop stated that non-labour operating costs were extremely high (70% of gross income) as much of the profits earned is allocated to insurance, operating costs (i.e. fuel) and boat and equipment maintenance (US$379,400). Table 4. Estimated annual revenue earned from scuba diving on reefs in the TCMP (values in US
dollars)
Number of Dives Taken:
At All-Inclusive Resorts 437
At Other Resorts 8297
a. Gross Dive Revenue
TOTAL $542,000
b. Dive Costs
Total Wages $54,200
Non-Labor Operating Costs $379,400
NET REVENUE $108,400
Transfers within the Economy
Transfers to employees:
Total Wages $54,200
Service Charges $54,200
Transfers to the Government:
Taxes $54,200
TOTAL DIVING VALUATION (net revenues plus transfers ) $271,000
All-Inclusive Resort Revenue Attributable to Diving: $28,384
Total Valuation of Coral Reefs from Diving
Snorkelling
Snorkelling is more popular and generates around five times as much income as diving (Table 1). According to the TCMP office, 95% of visitors to the Tobago Cays are said to snorkel. Yachters snorkel approximately twice per day usually from their own craft and the day tour/hotel guests usually snorkel only once, employing the services of a boat operator. The net revenue generated from snorkelling was estimated at US$663,754 with the same amount being allocated to non-labour operating costs (i.e. fuel, food for patrons and maintenance costs). The average snorkel trip costs US$50 which includes snorkelling gear and lunch and therefore no additional equipment costs was considered in the analysis. The boat operators who offer snorkelling range from small watertaxi operators to organised charter boats. It was not clear how many independent operators there are in the area and how many include taxes in their costs (and pay taxes) or request a service
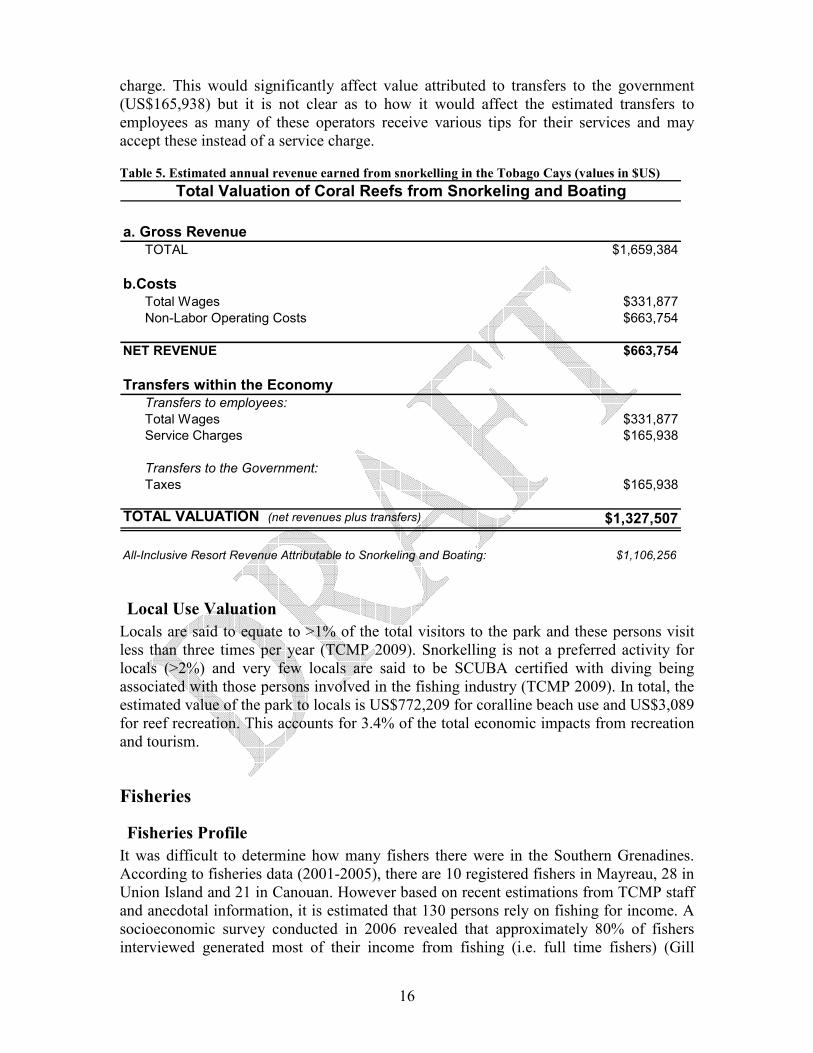
16
charge. This would significantly affect value attributed to transfers to the government (US$165,938) but it is not clear as to how it would affect the estimated transfers to employees as many of these operators receive various tips for their services and may accept these instead of a service charge.
Table 5. Estimated annual revenue earned from snorkelling in the Tobago Cays (values in $US)
a. Gross RevenueTOTAL $1,659,384
b.CostsTotal Wages $331,877
Non-Labor Operating Costs $663,754
NET REVENUE $663,754
Transfers within the EconomyTransfers to employees:
Total Wages $331,877Service Charges $165,938
Transfers to the Government:
Taxes $165,938
TOTAL VALUATION (net revenues plus transfers) $1,327,507
All-Inclusive Resort Revenue Attributable to Snorkeling and Boating: $1,106,256
Total Valuation of Coral Reefs from Snorkeling and Boating
Local Use Valuation
Locals are said to equate to >1% of the total visitors to the park and these persons visit less than three times per year (TCMP 2009). Snorkelling is not a preferred activity for locals (>2%) and very few locals are said to be SCUBA certified with diving being associated with those persons involved in the fishing industry (TCMP 2009). In total, the estimated value of the park to locals is US$772,209 for coralline beach use and US$3,089 for reef recreation. This accounts for 3.4% of the total economic impacts from recreation and tourism.
Fisheries
Fisheries Profile
It was difficult to determine how many fishers there were in the Southern Grenadines. According to fisheries data (2001-2005), there are 10 registered fishers in Mayreau, 28 in Union Island and 21 in Canouan. However based on recent estimations from TCMP staff and anecdotal information, it is estimated that 130 persons rely on fishing for income. A socioeconomic survey conducted in 2006 revealed that approximately 80% of fishers interviewed generated most of their income from fishing (i.e. full time fishers) (Gill

17
2006). Therefore the ratio of 104 full-time to 26 part-time fishers was inputted into the tool (4:1). There are 6-7 total landing sites in the study area with only four official sites (Union Island, Canouan, Trading Vessels and Petite Martinique). Unofficial landing sites can be found on each of the neighbouring islands, excluding the private islands of Petit St. Vincent and Palm Island. According to persons working in the area, fish are sold unprocessed to the buyers and customers are responsible for cleaning their own fish. There was mention of a small smoked fish operation on Union Island however there was no information available on the scale of operations and to whether or not it was still active so it was not included in the analysis. Otherwise no fish processing operations was reported at the site.
Commercial Fisheries Analysis
Calculating from Official Landings Data
Based on the estimates from official landings data for 2006-2008 (see Methodology section for calculations and assumptions), the annual gross revenue from commercial fishing was US$714,036–US$1,071,053 using a + 20% range in the sensitivity analysis to account for uncertainty in the data.
Calculating from Fisher Surveys
Calculating from information gathered in 2006 from 17 full time and 1 part time fisher (Gill 2006) an estimated US$6,600,330- US$8,250,412 in gross revenue is earned by fishers in the Grenadines each year. This range consists of the calculated value and a -20% value (-20% to 0%) as the results are over eight times higher than all of the other results and likely to be an overestimation.
Calculating from Reef Abundance
One of the calculations within the tool estimates fish abundance based on reef area. Using the 1335.7 hectares (13.4 km2) of reef within the Tobago Cays, annual gross revenue was estimated at US$51,951 –US$258,845 from an average price of US$3.82 ($EC10) per pound. As most of the fish would be derived on the reefs surrounding the Cays this value is thus more than likely an underestimation of the potential revenue. The calculation was then repeated with the estimated nearshore reef area of the Southern Grenadines1 which generated the significantly larger values of US$113,893– US$569,465 per year. Figure 7 shows a comparison between the three calculated gross revenues in US Dollars.
1 Approximately 29km of nearshore reef surrounding Canouan, Mayreau, Tobago Cays, Union Island, Palm Island, Petit St. Vincent and Petite Martinique (only the deep reefs within the park included)

18
$0
$1,000,000
$2,000,000
$3,000,000
$4,000,000
$5,000,000
$6,000,000
$7,000,000
$8,000,000
$9,000,000
Fish Landings Surveyed Fishers
(n=18)
Reef Abundance
Source Data
US Dollars High Estimate
Low Estimate
Figure 7. Comparison of annual commercial fishing (gross) revenue based on calculations from
landings, fisher surveys (n=18) and reef abundance. Values in US Dollars
Commercial Fisheries Results As the latter two methods appear to be under and over-estimations of the landings around the Tobago Cays, calculations based on official landings data were selected and the results are outlined in Table 6. Based on a + 20% variation in catch, the estimated economic impact of the TCMP reefs to the fishing industry is between US$466,801 and US$980,282 per year.

19
Table 6. Summary of Total Economic Impact of reef-related fisheries around the Tobago Cays
Marine Park based on data from official landing sites
1. Commercial Fisheries (from estimated landings data) In EC Dollars: In US Dollars:
Gross Revenue $2,736,713 $1,046,544
Net Revenue $1,231,521 $470,945
Transfers to the economy (Wages) $684,178 $261,636
Total Commercial Fishing Value $1,915,699 $732,581
2. Fish Processing and Cleaning
Gross Revenue from Processing $0 $0
Net Revenue from Processing Sale $0 $0
Transfers to the economy (Wages) $0 $0
Total Revenue from Cleaning Fish $0 $0
Total Fish Processing and Cleaning Value $0 $0
3. Local Fishing
Value of Local Fish Sale $551,424 $210,870
Value of Local Fish Consumption $41,357 $15,815
Value of Local Fish Enjoyment $2,326 $889
Total Local (non-commercial) Fishing Value $595,107 $227,574
Total Direct Economic Impacts (including local use) $2,492,888 $953,303
4. Indirect (Secondary) Economic Impacts
Indirect Effects Harvesting Multiplier $0 $0
Indirect Effects Processing Multiplier $0 $0Indirect Effects Overall Fisheries Multiplier $0 $0
TOTAL ECONOMIC IMPACT OF FISHERIES $2,492,888 $953,303
Fisher Operating Costs Another factor that will affect the accuracy of the calculation is the value given for non-labour operating costs. Fishers often complain that fuel is one of the most significant operating cost and that price increases can severely threaten their livelihood and the profitability of fishing. Interviews in 2006 revealed that fishers believed that fuel may account for as much as 50% of costs (Gill 2006) whereas the default values for the valuation tool lie at 10%. Given the recent increase in fuel prices, a value of 40% for non-labour operating costs was used in the analysis. Figures 8 show the net revenue and total costs with non-labour operating costs of 40% and 60%.

20
Fish Cleaning and Processing
Other than the mentioned smoked fish operation, no other value addition activities appear to be taking place. A significant proportion of fish is exported to Martinique via trading vessels (Gill 2006) and it is unclear whether or not processing is carried out on the vessels or on shore in Martinique. There are also no designated fish cleaners at the landing sites.
Local Use Valuation
This section required the use of default values for the following components:
• Average catch per trip (sale, consumption)
• Average annual days in activity (sale, consumption, enjoyment)
• Average time spent fishing (enjoyment)
Expert opinion was used to determine the percentage of locals involved in fishing for sale, consumption and enjoyment. Those who fish for enjoyment are mainly in the <25 age group and those in the older demographics mainly fish for occasional sale and/or consumption. Using the values of 4%, 1% and 0.25% respectively, the total value of local fishing was EC$595,107 (US$227,574) per year.
Figure 8. Variations in net revenue with an estimate of 40% and 60%of gross revenue paid to non-
labour operating costs. Values based on estimations from official landings data
Economic Valuation of Coral Reefs from
Commercial Fisheries: Current and Projected Costs
and Revenues
$1,517,102$1,750,503
$816,901$583,501
$0
$500,000
$1,000,000
$1,500,000
$2,000,000
$2,500,000
Current Projected
US Dollars
Net
Revenues
Total Costs
40% 60%

21
Ecosystem Type $/ha/yr
Total
Hectares* Total Contribution
Beach $88,000 8.7 $767,174
Coastal & Riperian Forest 1826 165.6 $302,312
Grassland/pasture 118 1.0 $116
Freshwater Herbaceous
Swamp* $72,787 5.4 $390,300
Near shore aquatic habitat
(seagrass*) $16,283 365.2 $5,946,552
Coral Reef environ* $100,000 1335.7 $133,569,406
Mangrove* $37,500 4.3 $162,749
TOTAL TCMP Ecosystem Service Value $141,138,608
Ecosystem Service Values: Value Transfer Methodology
Appendix I shows the MarSIS GIS map of the Tobago Cays indentifying the various marine habitats within the park. Using this data combined with the terrestrial values, the results indicate that the Tobago Cays Marine Park could be contributing over US$141 million to the Vincentian economy each year (Table 7); a value significantly higher than the WRI results. Not all land cover types had lower and upper conversion factors and thus no ranges were calculated. Table 7. Ecosystem Service Values by Cover Type for the Tobago Cays Marine Park
*Source: (Baldwin 2009 )
Coral reefs appear to be the major contributor to the economic value of the Tobago Cays, accounting for 95% of the overall value. The 365.2 hectares of seagrass beds mainly situated in the centre lagoon of the Tobago Cays (categorised under “nearshore aquatic habitat”) is the next most valuable resource (4.2%). The small beaches that are scattered throughout the Cays contribute around US$ ¾ million to the economy each year and the small area of mangroves (Appendix I) which are located on the island of Petit Rameau also make a notable contribution.

22
Comparison of the Valuation Methodologies & Results
Comparison of the Three Methodologies
The combined WRI Fisheries and Tourism estimates of the economic impact totalled around US$23.6 million in annual revenue which is dwarfed by the US$141 million derived from the Value Transfer methodology (Figure 9). With coral reefs as the main contributor to the Value Transfer total, indirect use values such as coastal protection services that are not accounted in the WRI methods could be the main factor in the disparity.
$0
$20,000,000
$40,000,000
$60,000,000
$80,000,000
$100,000,000
$120,000,000
$140,000,000
$160,000,000
WRI Coral Reef Valuation
Total
Value Transfer Methodology
Evaluation Methodology
US Dollars
ValueTransfer
Fisheries
Tourism
Figure 9. Comparison of the results from the three methodologies used in this study
The differences in data requirements, analysis and presentation of results all contribute to the many differences in the strengths and weaknesses of each tool (Tables 8&9). The WRI tool requires variable amounts of revenue and use data which can be continuously modified and updated with a sensitivity analysis in cases of uncertainty. However, shoreline protection is not accounted for in the results and in cases such as the Tobago Cays, reefs are providing essential protection services that would likely cause the park to not function in its absence. Another short coming of the WRI methodology is that significant effort is needed by the data collector to liaise with and acquire data from several sources. Data acquisition from multiple departments can be an onerous task and many times the quality of data is variable. The Value Transfer methodology however may not require external assistance as most of the data should be available via the internet with ubiquitous mapping software such as Google EarthTM. This method however usually involves static data which would not account for natural and anthropogenic changes to ecological features such as beach transformation or deforestation. Also the

23
quality of the satellite imagery or aerial photographs varies from site to site. Another weakness to the methodology is the fact that the values attributed to each land cover type were not developed in the Caribbean and its applicability to the region has not been thoroughly tested. It also may require knowledge of mapping software (e.g. ArcMap, Coral Point) which may be lacking in the organisations that are seeking to carry out the valuation. Table 8. Summary of the strengths and weaknesses of the WRI Economic Valuation Methodologies
(Fisheries, Tourism and Recreation)
Strengths Weaknesses
Facilities dynamic data (allows updating and expansion)
Data gaps increases reliance on expert opinion
Detailed and allows for categorisation of results
Requires full cooperation of relevant agencies and is dependent on the quality of their data
When new data is added, outputs of results & corrections are generated instantaneously
Errors are magnified with some calculations (e.g. fisher surveys)
Sensitivity analysis to account for potential errors in the data
Can encourage overconfidence in results if warnings about data quality are ignored
Accounts for often overlooked value of local use
Currently no valuation of economic impact of cruise ships and shoreline protection
Some level of adaptability: can be applied to sites where data availability is basic or exhaustive
Results are not visual and not as easy to communicate as the Value Transfer method
More data improves applicability of results (site-specific)
Table 9. Summary of the strengths and weaknesses of the Value Transfer Methodology (Troy and
Wilson 2006)
Strengths Weaknesses
Availability of data source (Google Earth TM)
Dependent on quality of aerial/satellite data (if absent requires intensive ground-truthing)
Rapid results
Results are static
Results are visual (maps) and can be easily communicated
Requires knowledge of mapping software (not ubiquitous)
No extensive data collection required from multiple agencies
Economic values not developed in the Caribbean

24
Comparison to Other Sites
The WRI Fisheries and Tourism value for the Tobago Cays reefs are approximately 1/6 of the results for the Montego Bay Marine Park in Jamaica and about 1/3 of value of the Dominican Republic study site (Figure 10). The differences in value could be attributed to the variations in the size of the study area, number of fishers and visitors, occupied rooms and the local population. The Tobago Cays also stood out as one of the few areas where a functioning fee collection system was generating significant amount of revenue for the park. On the other hand the results from the Value Transfer methodology reveals that the services provided by the ecosystems within the TCMP contribute three times as much as the Montego Bay Marine Park and about six times as much as the Moriah Harbour Cay, Bahamas. The disparity in these values could be attributed to the large amount of deep reef area that was identified within the Tobago Cays through on-site mapping (Baldwin 2009). This data might not have been available in the other sites where only nearshore reefs could be identified using satellite imagery.
$0.00
$20,000,000.00
$40,000,000.00
$60,000,000.00
$80,000,000.00
$100,000,000.00
$120,000,000.00
$140,000,000.00
$160,000,000.00
Tobago Cays
SVG (140 ha)
Montego Bay
Jamaica (1530
ha)
Dominican
Republic
(80800 ha)
Moriah
Harbour Cay
Bahamas
(5439 ha)
Case Study Site
US Dollars
WRI Coral ReefValuation Total
Value TransferMethodology
Figure 10. Comparison of the ReefFix results from four countries highlighting the differences
between the results of WRI and Value Transfer methodology
25
Lessons Learned From the Data Collection Phase;
Identification of Data Gaps Assuming that the accuracy of the tools are reasonably equivalent, the contrasting data requirements and techniques of the WRI and the Troy/Wilson (2006) methodologies increase the versatility of ReefFix allowing it to be applied to areas with varying levels of data resources and target audiences. Although the tools appear to have demonstrated a fairly reasonable representation of the economic impacts of the Tobago Cays resources, some gaps in the data and analysis were identified. Much of the data were derived from expert opinion as opposed to primary data and sensitivity analysis was used extensively to reduce error. Listed below are some of the important lessons to be considered before conducting a similar exercise.
Tourism
Occupancy and Room Rates: Only partial data were available on occupancy. When average values are attributed to large hotels with very high room rates the resulting value might be considerably erroneous. Persons relying on average occupancy rates should also rely heavily on the sensitivity analysis and not use a single estimate. Cruise Tourism: The model did not incorporate cruise tourism which appears to contribute significantly to the revenue generated in the park. However some of this might have been captured in vending sales and a portion of the snorkelling and diving activities. This undervaluation should be acknowledged when interpreting results. Recreation: Snorkelling and diving appears to be the most common form of recreation on coral reefs. However other activities such as glass-bottom boat tours, vending, sport-fishing and surfing (kite, wind or otherwise) are common and where possible this revenue should be included in the analysis.
Fisheries
Number of Fishers: As with many sites around the Caribbean, the fisheries in the Grenadines are open access with numerous unofficial landing sites making it very difficult to estimate the number of fishers operating around the study site. Persons should consult official data and combine it with information from various key informants to determine a good estimate of the number of persons involved commercially and otherwise. Limited Landings Data: The Commercial Fisheries Valuation may have been severely misrepresented due to limited data collection in the Southern Grenadines. The high landings values in this study that were derived from fisher interviews are more likely due to the following factors:
1. Calculations based on estimates of the number of days and number of weeks
fished per year. When fishers were asked how many days per week they fish answers would usually be based on a week of full operations, not accounting for days
26
missed due to environmental conditions, equipment malfunction or health. The number of weeks fished was also estimated and this value can increase the exaggerations as these vary greatly between fishers.
2. Estimates given by fishers on average catch. It was recognised that fishers usually are not able to communicate what their “average catch” is. These values can then be biased towards recent experiences or just be a median value between a “good fishing day” and a “bad fishing day”.
3. Disproportional number of full time to part time fishers and small sample size. The catch effort of part-time fishers in the area can vary drastically especially where fishers move in and out of the fishery regularly (Jardine and Straker 2003). Many of these fishers only enter the fishery during a few months of the year (e.g. lobster season). A larger sample size would also serve to reduce inaccuracy in the results.
Reef Abundance Areas Fished: The life history of commercial fish species is often complex and includes a variety of unique habitats. Therefore the estimation of the reef area that supports a fishery and the abundance of species that dependant on it will involve many assumptions. Also deeper reefs which are often heavily fished can not be easily detected by satellite imagery and an underestimation should be expected.
The combination of limited data from one official landing site, low estimates based on reef abundance and extrapolations based on daily catch create a wide variety of results that may all be poor estimations. Persons relying on any of these calculations must recognise the associated errors that can emerge from the limited data and therefore should apply a wide range in the sensitivity analysis.
Ecosystem Service Values: Value Transfer Methodology
Shoreline Protection: An assessment of the economic benefits of shoreline protection in the Tobago Cays would reveal a unique value not due to important coastal infrastructure but due to the fact that all tourism activities would be virtually impossible in the absence of the Horseshoe reef and the other windward reefs. Therefore it can be assumed that the ecosystem service value of the reefs in the Tobago Cays is much higher than the estimated US$100,000/ha/year. Satellite Imagery: Using satellite imagery to identify land cover types is advantageous as the data has been made the ubiquitous through services such as Google Earth TM. It must be noted however that some difficulty will occur when attempting to isolate various features due to the quality of the image (e.g. low resolution, high cloud cover) and the transient nature of some land cover types (e.g. beach width).
Further Research Some of the values outlined in the report do not account for the indirect use values (e.g. sand production) and non-use values (existence value) which are extremely important but difficult to quantify (WRI 2009). Therefore, in-depth investigations in the direct and indirect use value of the reefs in the Tobago Cays would reveal a value that may more resemble the amount given in the Value Transfer method. Other possible avenues for further research in St. Vincent and the Grenadines include:

27
• fill necessary data gaps to reduce the number of assumptions (e.g. fish landings,
occupancy rates)
• quantification and inclusion of other revenue generating activities (glass bottom
boats, wind-surfing, etc.) within the park
• expansion of study to the entire Grenadines
• assessment of the regulating services provided (shoreline protection value)
• stock assessment of the nearshore fishery
• preliminary research into the carrying capacity of the TCMP
• maintenance of the MarSIS database
• Total Economic Valuation of the Grenadine coastal areas
In the Caribbean where the capacity of management agencies is limited, ReefFix appears to be a beneficial tool for managers however more comparative research is needed to assess the accuracy of the methodologies. It must also be noted that the study does not attempt to evaluate sustainable use levels and/or carrying capacity which could be an important factor to ensure the continual provision of ecological services and maintenance of the economic benefits derived from natural resources.
Conclusion One of the identified hindrances to effective coastal management in the region is insufficient political will which has been attributed to a lack of environmental awareness amongst policy makers. With current threats such as land-based pollution and climate change resulting in widespread loss of live coral around the Caribbean, the need for coral reefs to be factored into decision making is ever more critical. The ReefFix methodology has with it the potential to effectively communicate the benefits of marine ecosystems to a public that relates more readily to economic value than to conservation data and theory. This tool provides cost-effective systems to analyse and create economic output that can be presented both numerically and graphically. However users should always be aware of the limitations and proceed cautiously recognising the lack of precision that is often encountered in the advancing field of environmental economics. Using ranges of values is recommended for the methods used in this study. To further develop ReefFix as an effective management tool, its accuracy should be validated and calibrated through supporting high quality primary valuation studies at multiple study sites around the Caribbean.
28
References Baldwin, K. 2009. (in lit.). A Marine Space-Use Information System for the Grenadine Islands: A Basis for Collaborative Planning and Management. PhD Dissertation. Centre for Resource Management and Environmental Studies (CERMES), University of the West Indies, Cave Hill Campus, Barbados. Burke, L., Greenhalgh, S., Prager, D. and E. Cooper. 2008. Coastal Capital: The Economic Contribution of Coral Reefs in Tobago and St. Lucia. WRI Working Paper. World Resources Institute, Washington DC. 66pp. Available online at http://www.wri.org/publications. Central Intelligence Agency (CIA). 2009. CIA World Factbook: St. Vincent and the Grenadines. <https://www.cia.gov/library/publications/the-world-factbook/geos/vc. html>. Central Intelligence Agency, Langley, Washington, USA. Accessed on 28 December 2009. Centre for Resource Management and Environmental Studies (CERMES). 2006. Sustainable Grenadines Project: Associated Projects: Marine Resource and Space Use Information System (MarSIS). <http://www.cavehill.uwi.edu/cermes/Associated_ Projects.html#>. Centre for Resource Management and Environmental Studies (CERMES), University of the West Indies, Cave Hill Campus, Barbados. Accessed on 2nd January 2009. Caribbean Compass. 2004. The Tobago Cays in Crisis. Deck View From Ti Kanot by Chris Doyle. January 2004. <http://www.caribbeancompass.com/cayscrisis.htm>. Accessed on 29th December 2009. Caribbean Tourism Organization. n.d. 2007 Country Statistics. <http://www. onecaribbean.org/statistics/2007stats/default.aspx>. Caribbean Tourism Organization, Bridgetown, Barbados. Accessed on 28 December 2009. Cooper, E., Burke, L., and N. Bood. 2009. Coastal Capital: Belize. The Economic Contribution of Belize’s Coral Reefs and Mangroves. WRI Working Paper. World Resources Institute, Washington DC, USA. 53pp. Available online at http://www.wri.org/publications. Department of Sustainable Development. 2009. ReefFix: An ICZM Coral Reef Restoration, Watershed Management and Capacity Building Demonstration Project for the Caribbean. <http://www.oas.org/dsd/IABIN/Component1/ReefFix/ReefFix.htm>. Organization of American States & Inter-American Biodiversity Information Network (IABIN). Washington DC, USA. Accessed on 28 December 2009. Deschamps, A. 2000. Characterization of Modern Reefs Using the Atlantic and Gulf Rapid Reef Assessment (AGRRA) Protocol and Digitized Aerial Photographs, Tobago Cays Marine Park, St. Vincent and the Grenadines. MSc thesis, Ottawa-Carleton Geoscience Centre and University of Ottawa. 196 pp.

29
Economic Commission for Latin America and the Caribbean (ECLAC). 2004. Yachting in the Eastern Caribbean. Economic Commission for Latin America and the Caribbean (ECLAC) Technical Report LC/CAR/R.75. 286 pp. Food and Agriculture Organisation (FAO). 2002. Fishery and Aquaculture Country Profiles: St. Vincent and the Grenadines. <http://www.fao.org/fi/fcp/en/VCT/ profile.htm>. Accessed 28 December 2009. Gill, D. 2006. Socioeconomic Profile of Fisheries in the Grenadines. MSc Research Paper. Centre for Resource Management and Environmental Studies (CERMES), University of the West Indies, Cave Hill Campus, Barbados. 80 pp. Jardine, C. and L. Straker. 2003. Fisheries Data Information Document, St. Vincent and the Grenadines. Fisheries Division, Ministry of Agriculture, Forestry and Fisheries, Kingstown, St. Vincent and the Grenadines. 52pp. Mattai, I. D. and R. Mahon. 2006. Review and Interpretation of Environmental and Sustainable Development Legislation for the Grenadines Islands. Centre for Resource Management and Environmental Studies (CERMES), University of the West Indies, Cave Hill Campus, Barbados. CERMES Technical Report No. 15. 94pp. Pena, M. 2006. Report on Evaluating Management Effectiveness at the Tobago Cays Marine Park (TCMP), St. Vincent and the Grenadines. CERMES Regional Project on Enhancing Management Effectiveness at Three Marine Protected Areas in St. Vincent and the Grenadines, Jamaica and Belize. Centre for Resource Management and Environmental Studies. University of the West Indies, Cave Hill Campus, Barbados. Technical Report No. 5. 69 pp. Population Division of the Department of Economic and Social Affairs of the United Nations Secretariat. 2008. World Population Prospects: The 2008 Revision. <http://esa.un.org/unpp>. Accessed on December 28, 2009 . St. Vincent and the Grenadines Hotel and Tourism Association (SVGHTA). 2009. Personal Communication. St. Vincent and the Grenadines Hotel and Tourism Association Kingstown, St. Vincent and the Grenadines. December 2009. St. Vincent and the Grenadines Tourism Authority (SVGTA). 2009. Tourism and Travel Awards: Discover St. Vincent and the Grenadines. <http://discoversvg.com /index.php/en/about-svg/awards>. St. Vincent and the Grenadines Tourism Authority, Kingstown, St. Vincent and the Grenadines. Accessed on 14 January 2010. Simmons, B. and P. McConney. 2006. Tobago Cays Marine Park: Are the Conditions for Successful Co-Management likely to be met? Centre for Resource Management and Environmental Studies (CERMES), University of the West Indies, Cave Hill Campus, Barbados. CERMES Technical Report No. 6. 54pp.

30
Sustainable Grenadines Project (SusGren). 2005. Sustainable Integrated Development and Biodiversity Conservation in the Grenadine Islands - Overview . Sustainable Grenadines Project, Clifton, Union Island, St. Vincent and the Grenadines. 7p. Tobago Cays Marine Park (TCMP). 2009. Personal Communication. Tobago Cays Marine Park Office, Clifton, Union Island, St. Vincent and the Grenadines. November-December 2009. Tobago Cays Marine Park (TCMP). 2010. Personal Communication. Tobago Cays Marine Park Office, Clifton, Union Island, St. Vincent and the Grenadines. January 2010. Tobago Cays Marine Park (TCMP). n.d. Tobago Cays Collection of Park User Fee <http://www.tobagocays.com/fees.html>. Accessed on 28 December 2009. Tourism Global Inc. 2006. The Caribbean Accommodation Sector as a Consumer of Locally Produced Goods and Services and Contributor to Government Revenues. Prepared by Tourism Global Inc. on behalf of the Caribbean Hotel and Tourism Association, Coral Gables, Florida. Troy, A. and M.A. Wilson. 2006. Mapping Ecosystem Services: Practical Challenges and Opportunities in Linking GIS and Value Transfer. Ecological Economics 60 (2006): 435-449. Universal Currency Converter. 2009. <https://www.xe.com/ucc>. Accessed on 28 December 2009. World Resources Institute. 2009. Value of Coral Reefs & Mangroves in the Caribbean Economic Valuation Methodology V3.0. World Resources Institute, Washington DC, USA. January 2009.

31
Appendix I: MarSIS G
IS H
abitat Map of the Tobago Cays Marine Park (Baldwin 2009)

32
Appendix IIa: List of Referen
ces for Data Sources (WRI Tourism
and Recreation Tool)
Coral Reef Valuation Tool: Tourism
1. Accommodation Component
• Average hourly hotel wage
varies with position starting around
EC $600 for 8 hrs (US $4.78 per
hour)
SVGHTA 2009
• Hours worked per week per employee
48 (8 hrs daily for 6 days)
SVGHTA 2009
• Employees per room
0.5 employees on average
SVGHTA 2009
• Non-labour operating costs as a percentage of gross
accommodation revenue
25%
default from tool
• Tax rate
15% Value Added Tax on
accommodation and 15% on all other
non-accommodation goods and
services
SVGHTA 2009
• Service charge
10%
SVGHTA 2009
• Leakage estimate
75%-85%
SVGHTA 2009
• Average room rate for accommodation sector as a whole
US $70
SVGHTA 2009
• Average occupancy rate for accommodation sector as a
whole
55%
SVGHTA 2009
• Average number of rooms for accommodation sector as a
whole
1,778 rooms approximately in the
entire SVG
SVGHTA 2009
• Number of accommodations in study area
21 accommodations – a mix of
resorts, guesthouses, etc
SVGHTA 2009
• Percent of visitors using reef
40-50% & 85-95% (dependant on
location)
TCMP 2009
Data
Data Source

33
2. Diving Component
• Total annual visitors to study site
58,224
TCMP 2009
• Percentage of visitors diving
~ 5%
TCMP 2009
• Average number of dives per diver
Yachters do 1 or 2 dives per visit;
hotel guests do 4-5 dives per 3 day
stay. Divers are mainly hotel guests
TCMP 2009
• Average price of dive
US $65.00
TCMP 2009
• Number of dive certification
< 20 Resort/Refresher courses
annually; seldom do other
certifications
TCMP 2009
• Price per dive certification
Resort or Discover Course US
$150.00; Refresher Course US
$120.00 (avg US $135)
TCMP 2009
• Proportion of dives taken at all-inclusive resorts
< 5% of all dives
TCMP 2009
• Average price per dive of equipment rental
US $60 for full SCUBA Kit
TCMP 2009
• Proportion of all dives with equipment rental
95% of all dives include equipment
rental
TCMP 2009
• Percent of gross revenue for labour costs in diving
~10% of gross revenue goes to labour
cost
TCMP 2009
• Percent of gross revenue for other costs in diving
~ 70% of gross revenue go towards
insurance, boat and equipment
maintenance
TCMP 2009
• Tax rate in diving
10% tax on taxable items
TCMP 2009
• Service charge in diving
10% service charge at all inclusive
resorts
TCMP 2009

34
3. Snorkel and Boating Component
• Total annual visitors to study site
58,224
TCMP 2009
• Percentage of visitors snorkeling
~ 95%
TCMP 2009
• Average number of snorkel trips per snorkeler
Yachters snorkel ~ twice per day
while in the park; Day tour/hotel
visitor typically have one snorkel trip
TCMP 2009
• Average price of snorkel trip
US $50.00 per person typically
includes lunch
TCMP 2009
• Proportion of snorkel trips taken at all-inclusive resorts
~ 40% of snorkelers come from all-
inclusive resorts
TCMP 2009
• Average price per snorkel trip of equipment rental
Equipment is usually included in the
overall price; ~ US $20.00 per
snorkel set
TCMP 2009
• Proportion of all snorkel trips with equipment rental
~ 80% of snorkel trip includes
equipment rentals
TCMP 2009
• Percent of gross revenue for labour costs in snorkeling
~ 20% of gross revenue covers labour
costs
TCMP 2009
• Percent of gross revenue for other costs in snorkeling
~ 40% of gross revenue covers fuel,
food and maintenance costs
TCMP 2009
4. Marine Park Component
• Fees collected (visitor, marine vessel, or other)
US $222,653.92
TCMP 2009
• Any taxes collected if applicable
0TCMP 2009
• Collection costs if applicable
US $1,606.12
TCMP 2009

35
5. Local Use Valuation
• Population of study area
4,308
Sustainable Grenadines Project 2005
• Average hourly wage
~ EC $6.25 per hour (US $2.39)
TCMP & SVGHTA (2009)
• Percentage of local population visiting coralline beaches for
pleasure
>75% of population visits the beach
or reef for pleasure
TCMP 2009
• Average number of visits per person per year (to coralline
beaches and for reef recreation)
~ 25 visits to a beach per year
TCMP 2009
• Average duration of visit (to coralline beaches and to reefs
for recreation)
~ 4 hours per visit
TCMP 2009
• Population of defined site
4,308
Sustainable Grenadines Project 2005
• Population Growth Rate
0.1%
Population Division of the Department of Economic and Social
Affairs 2008
6. Additional Inform
ation
• MPA area
14 km2
Pena 2006
• Exchange Rate
EC $2.62- US $1.00
Universal Currency Converter 2009
• GDP
US $1.072 billion
Central Intelligence Agency World Factbook 2008
• GDP/capita
US $10,200
• Average length of stay
12.3 Days
CTO 2007

36
Appendix IIb: List of Referen
ces for Data Sources (WRI Fisheries Tool)
A. Commercial Fisheries Valuation
Data
Data Source
Data Source
1. Fish landings approach
a. Year data collected
1994-2002,2006-
2008
Fisheries Division 2009
Jardine & Straker 2003
b. Species/species group
aggregated data
Fisheries Division 2009
Jardine & Straker 2003
c. Sales price for each species/species group per unit weight at
each landing site (kg/pound/metric ton)
aggregated dataFisheries Division 2009 (shellfish price is
average of conch and lobster)
Jardine & Straker 2003
d. Weight (kg/pound/metric ton) of each species of fish caught
at each landing site
aggregated data
Fisheries Division 2009
Jardine & Straker 2003
2. Individual fishermen
a. Year data collected
2006
b. Number of full-time and part-time fishermen
130
Gill 2006
TCMP 2009
c. Employment status of surveyed fishermen (full or part time)
Ratio 4:1
Gill 2006
d. Species caught
aggregated data
Gill 2006
e. Average weight (kg/pound) catch/week by species
aggregated data
Gill 2006
f. Number of weeks of year fishermen fish
aggregated data
Gill 2006
g. Sales price of each species/species group per unit weight
(kg/pound/metric ton)
aggregated data
Gill 2006
3. Reef extent
a. Area of reef
13.35 km2/ 29
km2
Baldwin 2009 (in lit.)
Google EarthTM
b. Average annual reef productivity (fish catch per unit area of
reef) – default values available in tool
default from tool
c. Average price of fish caught on reef
EC $10.00 (US
$3.82)
Fisheries Division 2009

37
B. Fish Processing Valuation
• Year data collected
No data of fish
processing
TCMP 2009
• Purchaser
• Species/species group processed
• Weight of purchased fish
• Purchase price for each species by unit weight
• Sale price for each species by unit weight
C. Fish Cleaning
1. Using W
eight Calculations Approach
a. Percent of fish catch (kg/pound/metric ton) cleaned
0%
TCMP 2009
b. Average value added per weight unit (kg/pound/metric ton)
of fish cleaned
2. Using Cleaners by Landing Site Approach
a. Number of cleaners at each landing site selected
0TCMP 2009
b. Average number of days worked by cleaners at each landing
site per year
c. Average number of hours per day worked by cleaners at each
landing site
d. Average revenue per hour received from fish cleaning at each
landing site
D. Local Fishing
• Population of defined site
4,308
Sustainable Grenadines Project 2005
• Population Growth Rate
0.1%
Population Division of the Department of
Economic and Social Affairs 2008
• Percent of population fishing for sale, for consumption, for
enjoyment
4%, 1% and 0.25%
respectively
TCMP 2009

38
• Average weight catch per trip for those engaging in local
fishing for sale and consumption
20 lb
defaults from tool
• Sale price/value of average unit weight of catch for those
engaging in local fishing for sale/consumption
EC $8.00 (US
$3.05)
Fisheries Division 2009
• Average hourly wage for the population
EC $6.25 (US
$2.39)
TCMP 2009
SVGHTA 2009
• Average time spent fishing per day for those in the population
engaging in local fishing for enjoyment
3 hours
defaults from tool
• Average annual days people at the site engage in local fishing
for sale,consumption, or enjoyment
20, 12 and 12 days
respectively
defaults from tool
E. Additional Data
• Exchange Rate
EC $2.62- US
$1.00
Universal Currency Converter 2009
• GDP
US $1.072 billion
Central Intelligence Agency World
Factbook 2008
• GDP/capita
US $10,200
Central Intelligence Agency World
Factbook 2008
• Annual GDP from Fisheries sector
2% of total GDPFood and Agriculture Organisation 2002

39
Appendix III: Agenda for Tobago Cays ReefFix Workshop
(January 11-12, 2010)
Tobago Cays Marine Park
OAS IABIN REEfFix /Government of St Vincent and the Grenadines
Workshop Agenda -- Fisheries Division Conference Room in Kingstown
January 11-12, 2010 Related websites:
ReefFix: An ICZM Coral Reef Restoration, Watershed Management and Capacity Building Demonstration Project for the Caribbean Read more... http://www.oas.org/dsd/IABIN/Component1/ReefFix/ReefFix.htm
Monday January 11
8:30 am Opening Remarks Focal Point IABIN Edmund Jackson Coordinator Environmental Services, Ministry of Health and the Environment and Ms. Melene Glynn, OAS Representative
9:00 Mr. Andrew Roache, Chairman of Tobago Keys Marine Park: The history of the Tobago Cays Protected Seascape
9:30 Richard Huber -- IABIN and the Thematic Networks -- IABIN’s Marine Classification Standard -- The ETN Marine Ecosystem Standard Format MPAGlobal the development of the Caribbean Protected Areas Database Initiative – CPADI -- MPAGlobal Database
Payments for Ecological Services in the Americas Hemisphere Ecosystem Valuation Methodologies Results of the Jamaica, DR, and Grenada Workshops
10:30 Break 10:45 David Gill – Presentation of 3 Valuation methodologies for Tobago Cays
Protected Seascape (and environs). Facilitated discussion to discuss cost recovery in marine parks: Hotel bed tax vs entrée fee
12:30 Lunch 2-6:00 Review of Marine Projects in the SVG -- Speakers are asked to make a 10
minute PPT presentation on the marine activities within their organization:
Ms. Lucine Edwards Fisheries Division Mr. Anthony Bowman Physical Planning Mr. FitzGerald Providence Forestry Mr. Andrew Wilson National Parks Ms. Camille Soleyn Min. Tourism Ms. Vera Ann Brereton SVG Hotel and Tourism Association Mr. Martin Barriteau Sustainable Grenadines Project Ms. Susan Singh Renton Caribbean Regional Fisheries Mechanism
Secretariat Mr. Ottis Joslyn CPACC

40
Tuesday January 12 -- Field Trip – 9 am –3:30 pm -- Tour Tobago Cays Marine
Park
Demonstrating tourism impacts, coastal zone management (e.g. sewage treatment plant), reef health. TCMP staff introduces sites, showing key features and areas of concern. Discussion looking at the problems that may decrease economic productivity and sustainability, what are the root causes, identify possible solutions, current projects addressing these issues, barriers to implementation & how Reeffix can help achieve the objectives.