sta 291 - lecture 111 sta 291 lecture 11 describing quantitative data – measures of central...
TRANSCRIPT
STA 291 - Lecture 11 1
STA 291Lecture 11
• Describing Quantitative Data– Measures of Central Location
Examples of mean and median
– Review of Chapter 5. using the probability rules
• You need a Calculator for the exam, but no laptop, no cellphone, no blackberry, no iphone, etc (anything that can transmitting wireless signal is not allowed)
• Location: Memorial Hall,• Time: Tuesday 5-7pm.
• Talk to me if you have a conflict.
STA 291 - Lecture 11 2
• A Formula sheet, with probability rules and sample mean etc will be available.
• Memorial Hall
STA 291 - Lecture 11 3
• Feb. 23 5-7pm
• Covers up to mean and median of a sample (beginning of chapter 6). But not any measure of spread (i.e. standard deviation, inter-quartile range etc)
Chapter 1-5, 6(first 3 sections) + 23(first 5 sections)
STA 291 - Lecture 11 4
STA 291 - Lecture 11 5
Summarizing Data Numerically
• Center of the data– Mean (average)– Median– Mode (…will not cover)
• Spread of the data– Variance, Standard deviation– Inter-quartile range– Range
STA 291 - Lecture 11 6
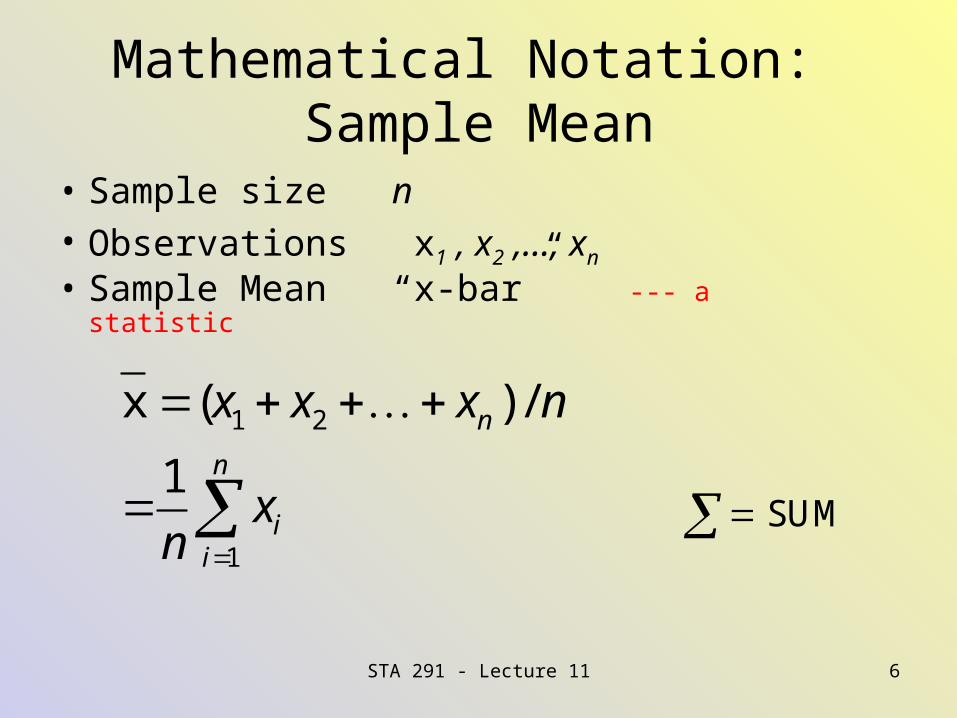
Mathematical Notation: Sample Mean
• Sample size n• Observations x1 , x2 ,…, xn
• Sample Mean “x-bar” --- a statistic
SUM
1 2
1
x ( ) /
1n
n
ii
x x x n
xn
STA 291 - Lecture 11 7
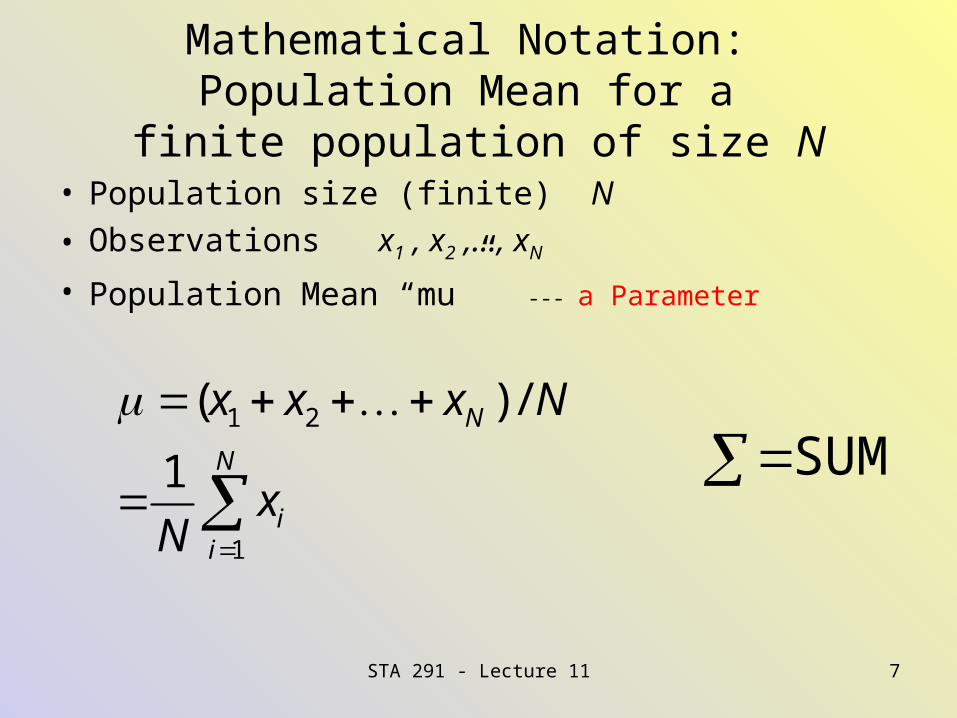
Mathematical Notation: Population Mean for a
finite population of size N• Population size (finite) N
• Observations x1 , x2 ,…, xN
• Population Mean “mu” --- a Parameter
SUM 1 2
1
( ) /
1N
N
ii
x x x N
xN
Infinite populations
• Imagine the population mean for an infinite population.
• Also denoted by mu or
• Cannot compute it (since infinite population size) but such a number exist in the limit.
• Carry the same information.
STA 291 - Lecture 11 8
Infinite population
• When the population consists of values that can be ordered
• Median for a population also make sense: it is the number in the middle….half of the population values will be below, half will be above.
STA 291 - Lecture 11 9

STA 291 - Lecture 11 10
Mean
• If the distribution is highly skewed, then the mean is not representative of a typical observation
• Example:
Monthly income for five persons
1,000 2,000 3,000 4,000 100,000
• Average monthly income: = 22,000
• Not representative of a typical observation.
• Median = 3000
STA 291 - Lecture 11 11
STA 291 - Lecture 11 12
Median
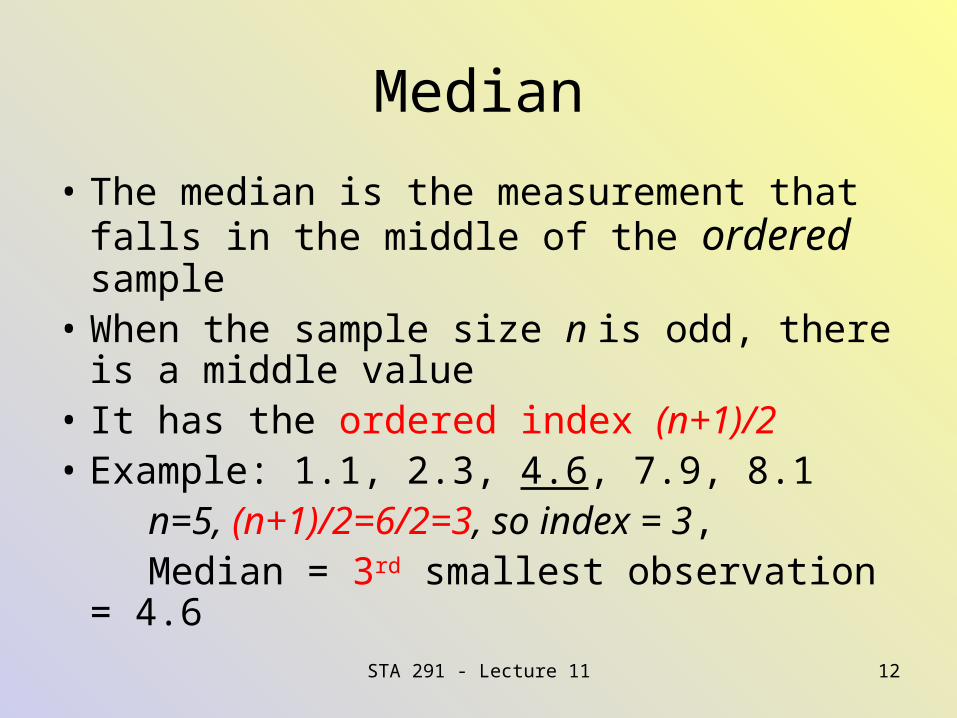
• The median is the measurement that falls in the middle of the ordered sample
• When the sample size n is odd, there is a middle value
• It has the ordered index (n+1)/2• Example: 1.1, 2.3, 4.6, 7.9, 8.1 n=5, (n+1)/2=6/2=3, so index = 3, Median = 3rd smallest observation = 4.6
STA 291 - Lecture 11 13
Median
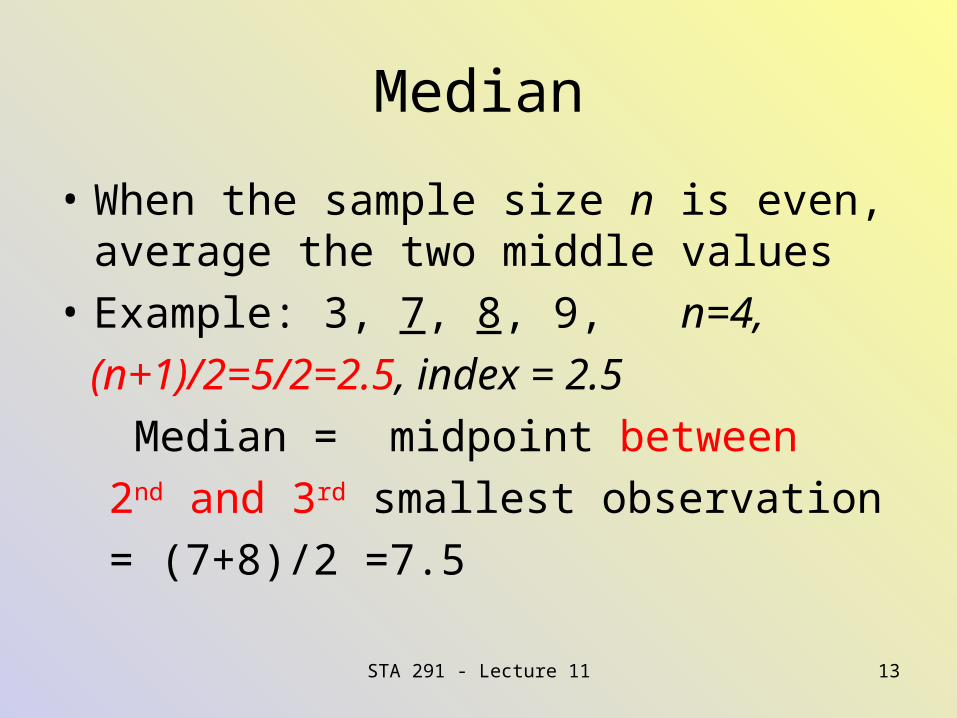
• When the sample size n is even, average the two middle values
• Example: 3, 7, 8, 9, n=4,
(n+1)/2=5/2=2.5, index = 2.5
Median = midpoint between
2nd and 3rd smallest observation
= (7+8)/2 =7.5
STA 291 - Lecture 11 14
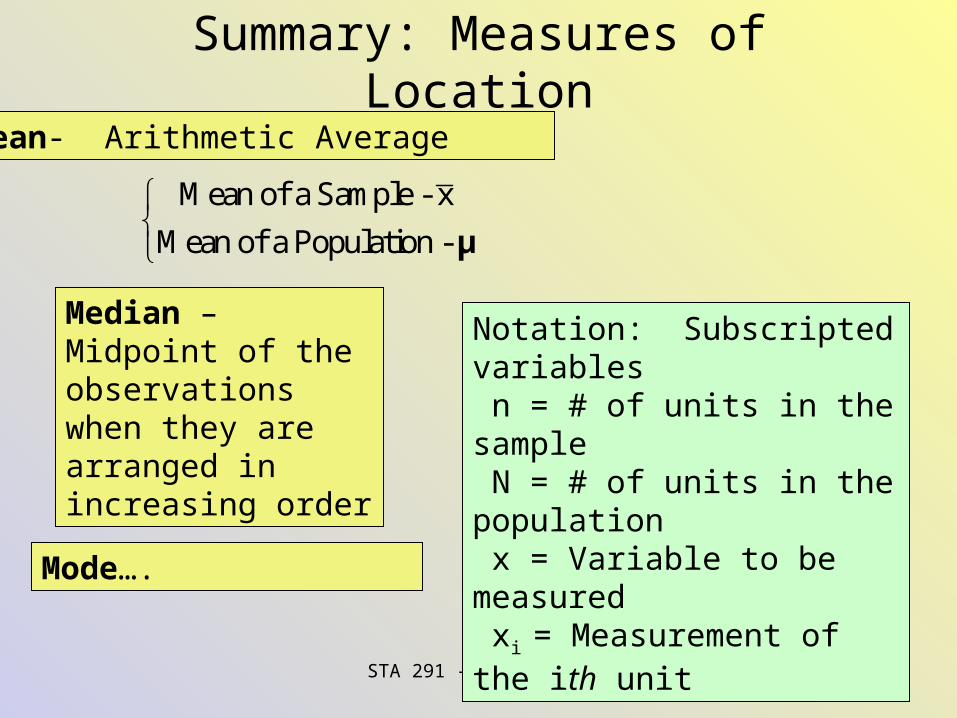
Summary: Measures of Location
Mean- Arithmetic Average
Mean of a Sample - x
Mean of a Population -
μ
Median – Midpoint of the observations when they are arranged in increasing order
Mode….
Notation: Subscripted variables n = # of units in the sample N = # of units in the population x = Variable to be measured xi = Measurement of the ith unit
STA 291 - Lecture 11 15
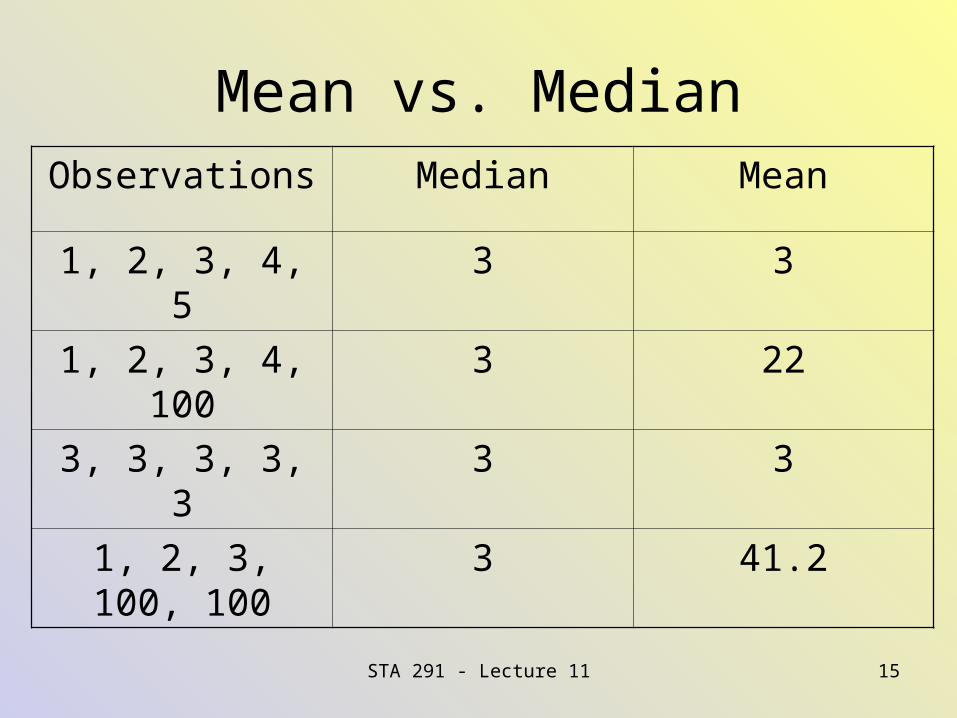
Mean vs. MedianObservations Median Mean
1, 2, 3, 4, 5 3 3
1, 2, 3, 4, 100 3 22
3, 3, 3, 3, 3 3 3
1, 2, 3, 100, 100 3 41.2
STA 291 - Lecture 11 16
Mean vs. Median
• If the distribution is symmetric, then Mean=Median
• If the distribution is skewed, then the mean lies more toward the direction of skew
• Mean and Median Online Applet

Example
• the sample consist of 5 numbers, 3.6, 4.4, 5.9, 2.1, and the last number is over 10.
(some time we write it as 10+)
• Median = 4.4
• Can we find the mean here? NoSTA 291 - Lecture 11 17
STA 291 - Lecture 11 18
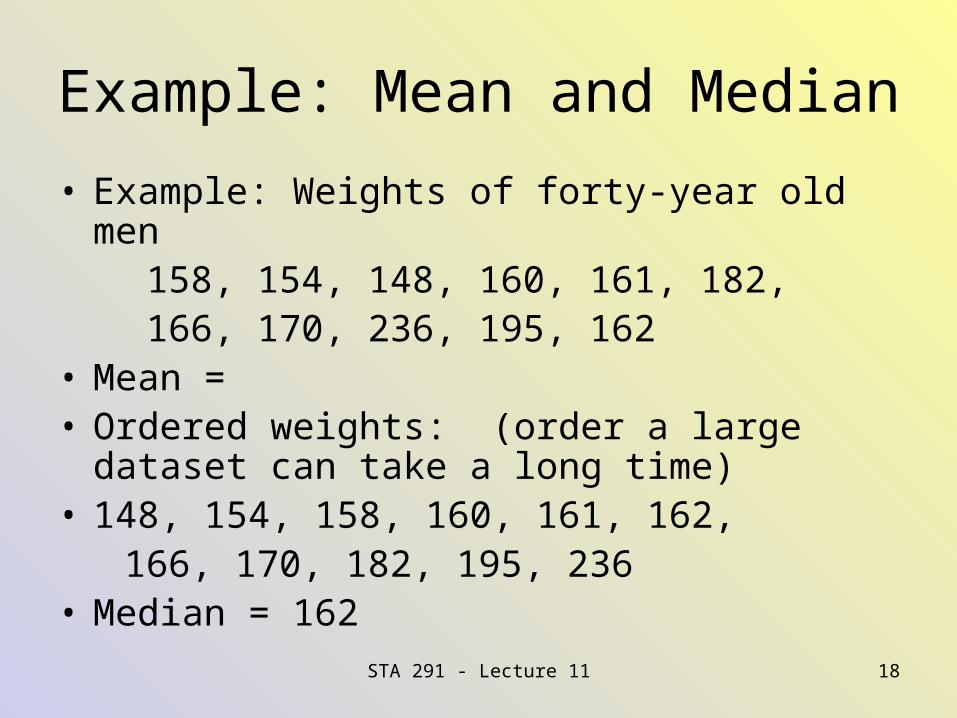
Example: Mean and Median
• Example: Weights of forty-year old men 158, 154, 148, 160, 161, 182, 166, 170, 236, 195, 162• Mean = • Ordered weights: (order a large dataset can
take a long time)• 148, 154, 158, 160, 161, 162, 166, 170, 182, 195, 236• Median = 162
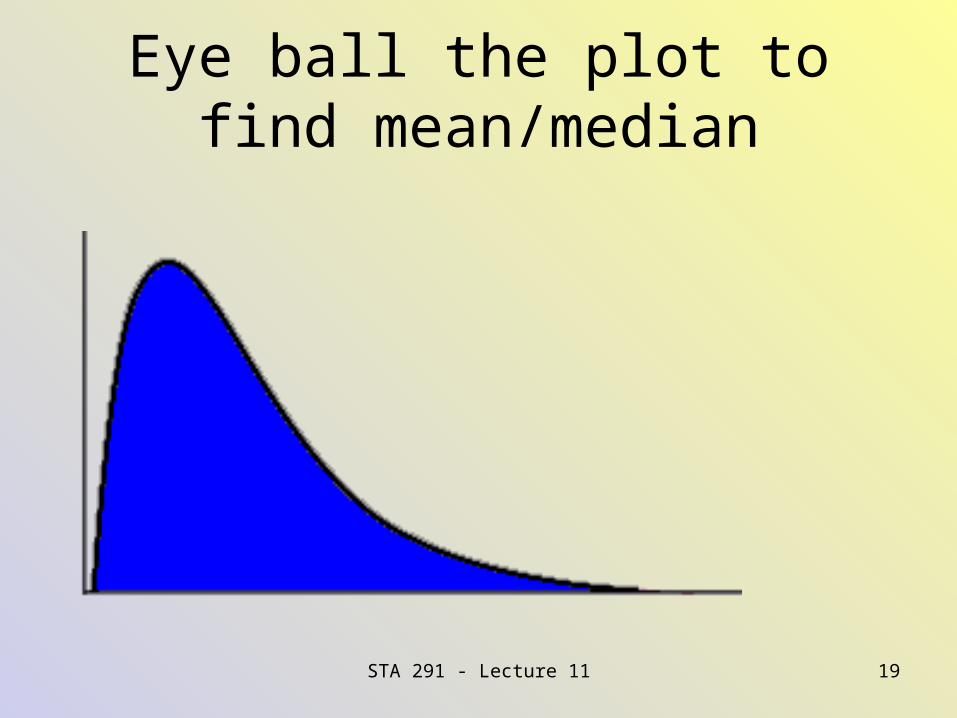
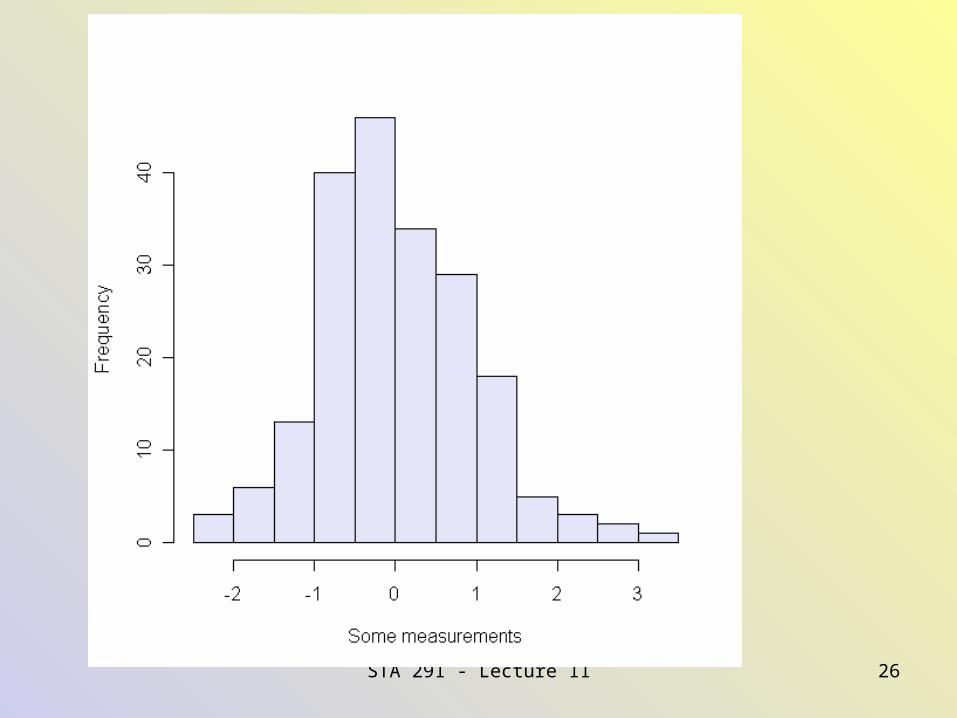
Eye ball the plot to find mean/median
STA 291 - Lecture 11 19
• Extreme valued observations pulls mean,
but not on median.
For data with a symmetric histogram, mean=median.
STA 291 - Lecture 11 20
STA 291 - Lecture 11 21
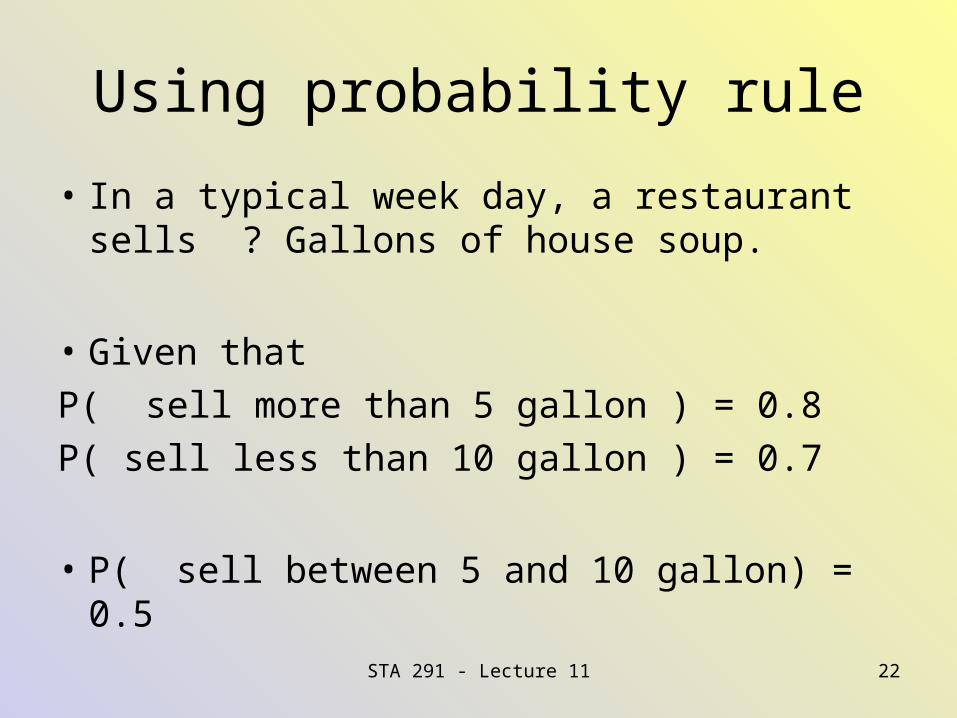
Using probability rule
• In a typical week day, a restaurant sells ? Gallons of house soup.
• Given that
P( sell more than 5 gallon ) = 0.8
P( sell less than 10 gallon ) = 0.7
• P( sell between 5 and 10 gallon) = 0.5 STA 291 - Lecture 11 22
STA 291 - Lecture 11 23
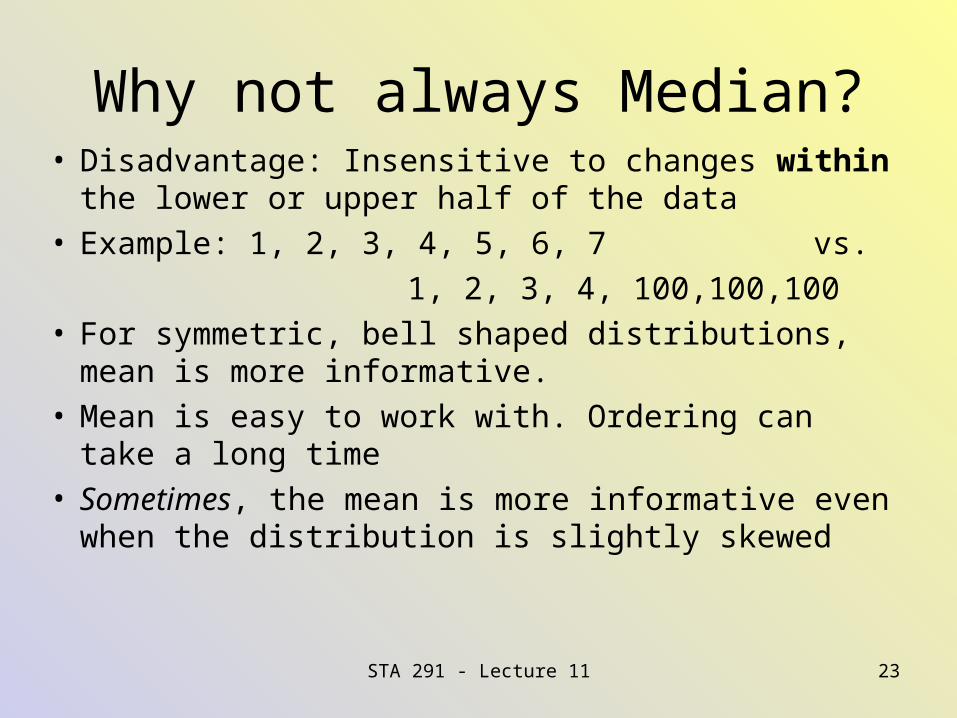
Why not always Median?• Disadvantage: Insensitive to changes within the
lower or upper half of the data• Example: 1, 2, 3, 4, 5, 6, 7 vs.
1, 2, 3, 4, 100,100,100• For symmetric, bell shaped distributions, mean is
more informative. • Mean is easy to work with. Ordering can take a
long time• Sometimes, the mean is more informative even
when the distribution is slightly skewed
STA 291 - Lecture 11 24
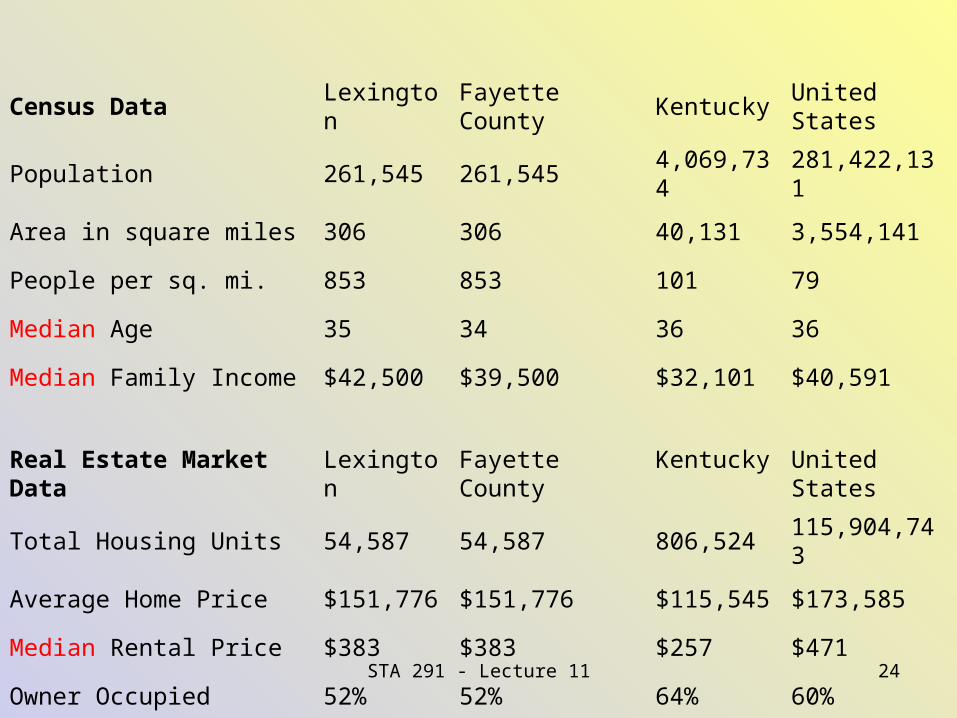
Census Data Lexington Fayette County Kentucky United States
Population 261,545 261,545 4,069,734 281,422,131
Area in square miles 306 306 40,131 3,554,141
People per sq. mi. 853 853 101 79
Median Age 35 34 36 36
Median Family Income $42,500 $39,500 $32,101 $40,591
Real Estate Market Data Lexington Fayette County Kentucky United States
Total Housing Units 54,587 54,587 806,524 115,904,743
Average Home Price $151,776 $151,776 $115,545 $173,585
Median Rental Price $383 $383 $257 $471
Owner Occupied 52% 52% 64% 60%
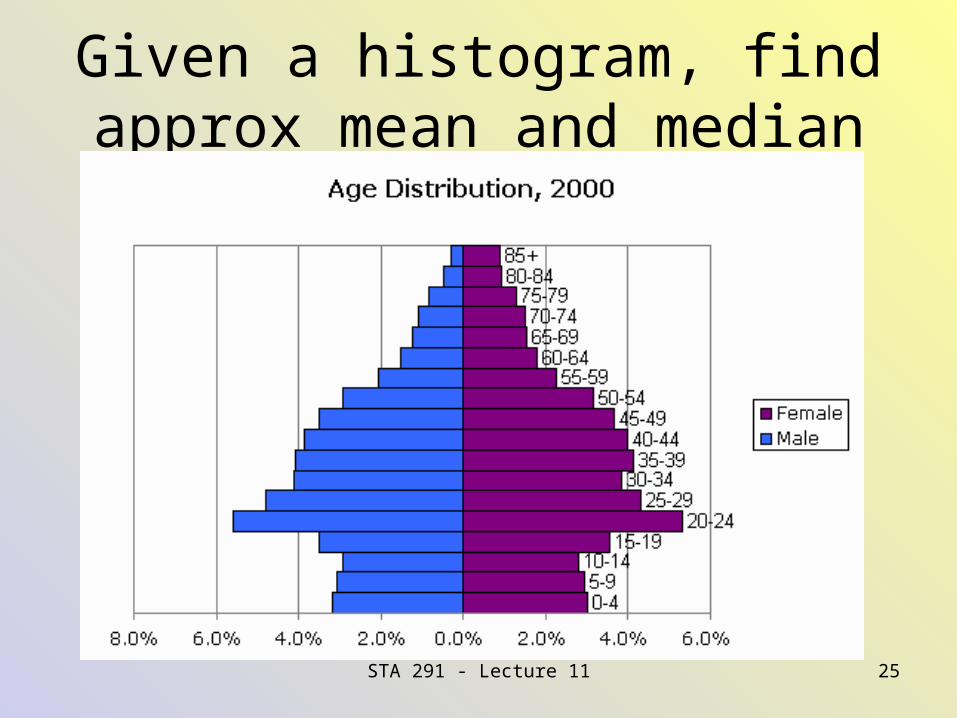
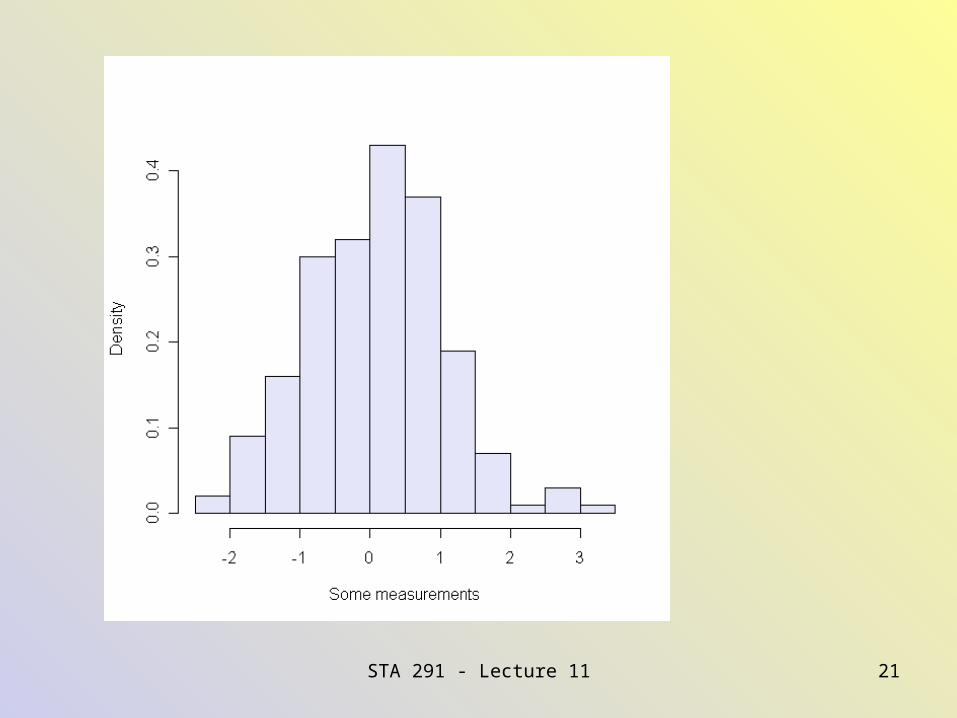
Given a histogram, find approx mean and median
STA 291 - Lecture 11 25
STA 291 - Lecture 11 26
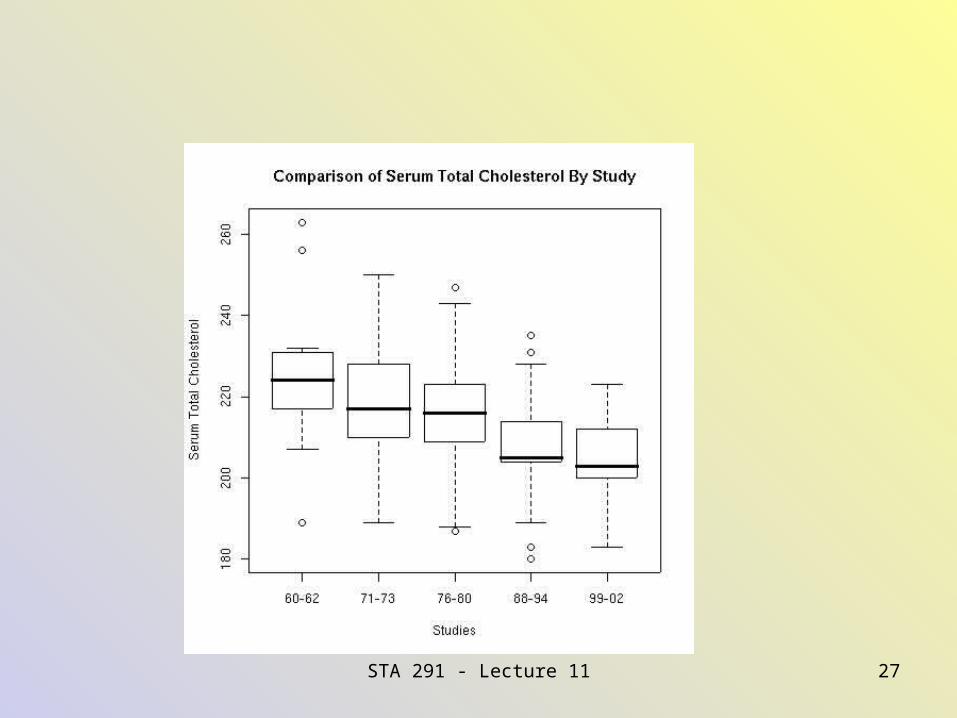
STA 291 - Lecture 11 27
STA 291 - Lecture 11 28
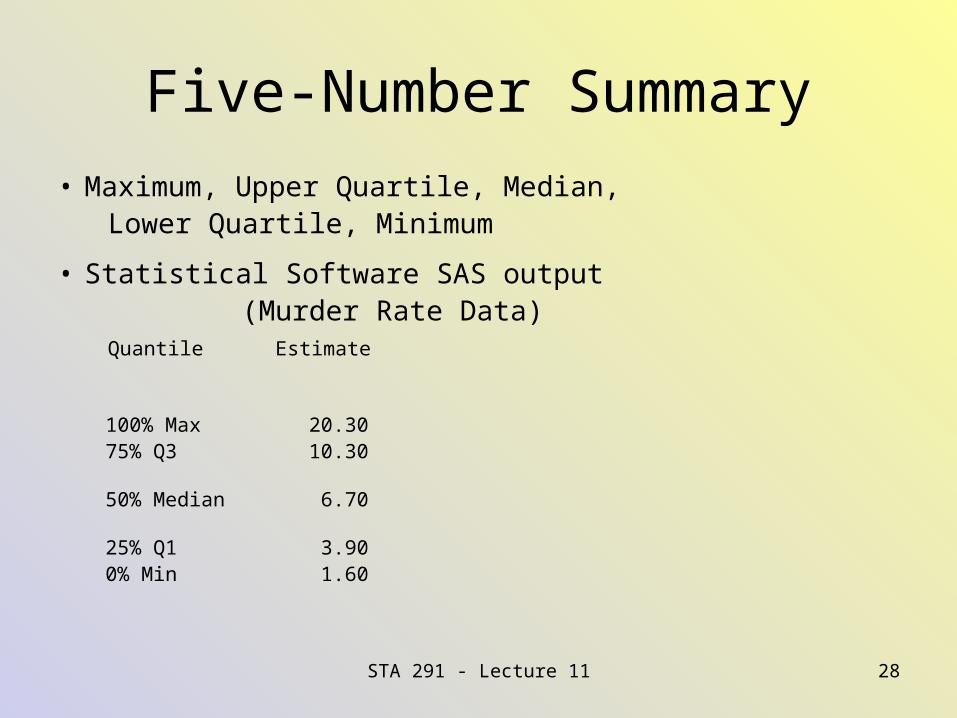
Five-Number Summary
• Maximum, Upper Quartile, Median, Lower Quartile, Minimum
• Statistical Software SAS output (Murder Rate Data) Quantile Estimate
100% Max 20.30 75% Q3 10.30
50% Median 6.70
25% Q1 3.90 0% Min 1.60
STA 291 - Lecture 11 29
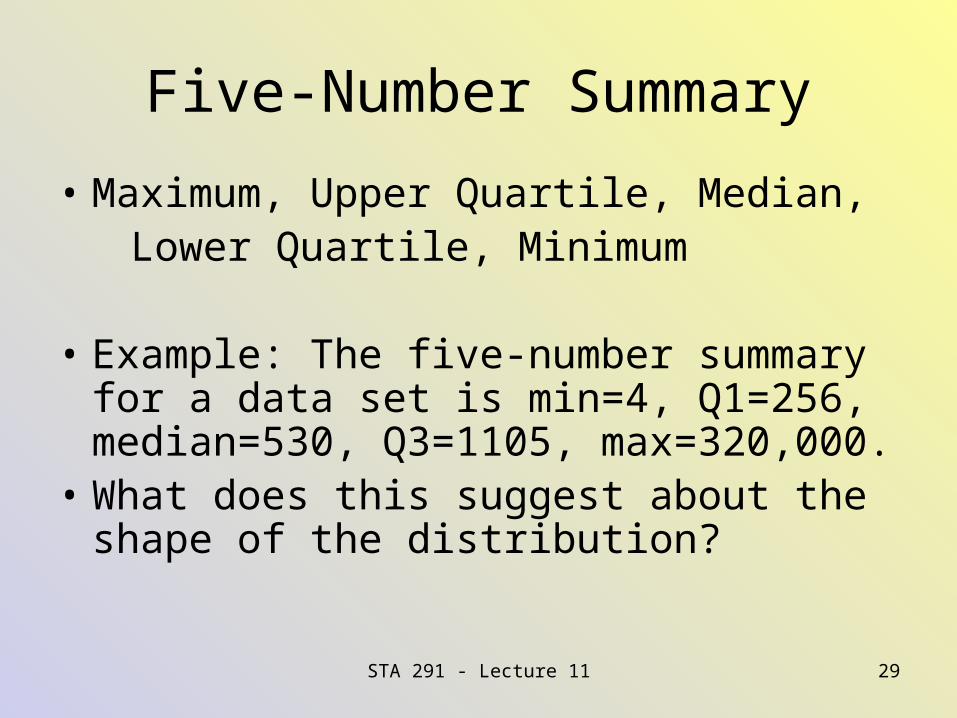
Five-Number Summary
• Maximum, Upper Quartile, Median, Lower Quartile, Minimum
• Example: The five-number summary for a data set is min=4, Q1=256, median=530, Q3=1105, max=320,000.
• What does this suggest about the shape of the distribution?
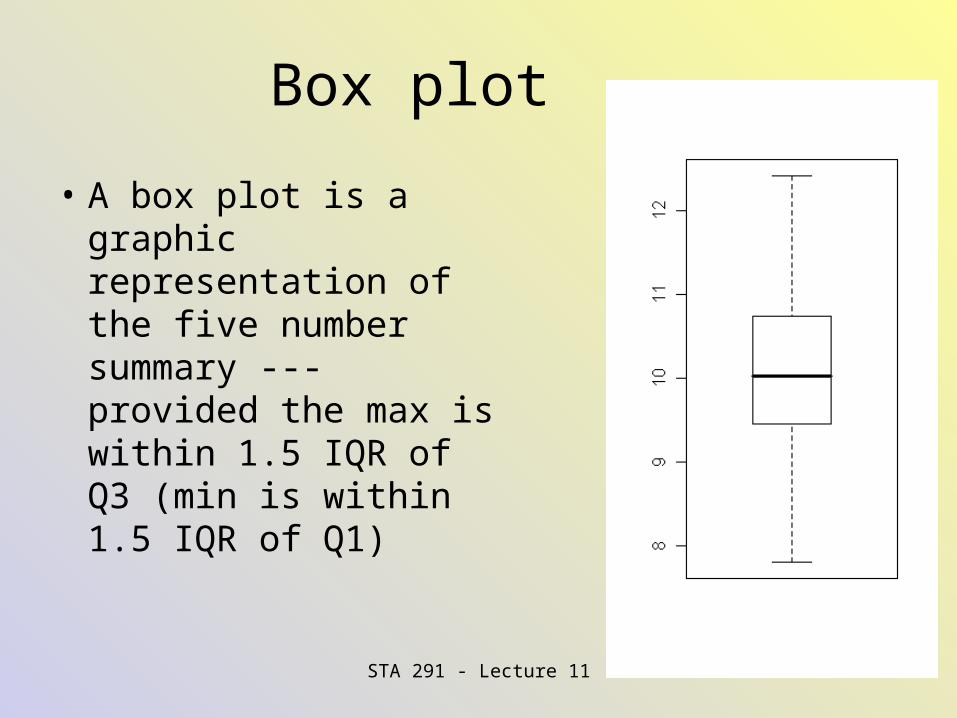
Box plot
• A box plot is a graphic representation of the five number summary --- provided the max is within 1.5 IQR of Q3 (min is within 1.5 IQR of Q1)
STA 291 - Lecture 11 30
STA 291 - Lecture 11 31
Attendance Survey Question• On a 4”x6” index card
– write down your name and section number
– Question:
Pick one: Mean or Median
_______ is a measure more resistant to extreme valued observations in the sample.