stabbed in the back: does sabotage follow mandated political … · 2018-09-15 · dep. variable :...
TRANSCRIPT

Introduction Background Empirical analysis Conclusions +
Stabbed in the back:Does sabotage follow mandated political
representation?
Victoire GirardLEO, Orleans University
Think development Think WIDER 2018
Stabbed in the back. Victoire Girard

Introduction Background Empirical analysis Conclusions +
Motivation
Sabotage could undermine the benefit of affirmative action
Affirmative action
• Widespread
• A solution to persistent inequalities ?
• Problem : affirmative action is controversial
Concern : that there is some sabotage
• Induces an absolute losses for all agents
• But a relative gain for at least one of the agents
Stabbed in the back. Victoire Girard

Introduction Background Empirical analysis Conclusions +
Affirmative action may trigger sabotage
Indeed such sabotage appears in
• theory(Brown and Chowdhury 2017)
• games during lab or lab in the field experiments(Banerjee et al. 2017 ; Fallucchi and Quercia 2016 ; Gangadha-ran et al. 2016 ; Leibbrandt et al. 2015)
• horse races(Brown and Chowdhury 2017)
Stabbed in the back. Victoire Girard

Introduction Background Empirical analysis Conclusions +
This paper
QuestionDoes ’real world’ sabotage take place after affirmative action ?
ContextNationwide
• policy of caste-based electoral quotas
• administrative data on caste-based crimes
• survey data on caste-based discrimination
ResultsConsistent with sabotage taking place
Stabbed in the back. Victoire Girard

Introduction Background Empirical analysis Conclusions +
Contributions
• Risk of a “one size fits all”gender and caste quotas yield opposite results (Iyer et al. 2012)
• Confirm possibility that quotas trigger sabotageincluding in real life
• Combining administrative and household datacaste-based murders reflect untouchability practices
Stabbed in the back. Victoire Girard

Introduction Background Empirical analysis Conclusions +
Outline
1 Introduction
2 Background
3 Empirical analysis
4 Conclusions
Stabbed in the back. Victoire Girard

Introduction Background Empirical analysis Conclusions +
Caste in India
Castes are persistent
• Hereditary, segregated, thus some persistenceOver 74% households are opposed to between jati weeding (Ba-nerjee et al 2014)
• Thousands of jatis capured in 4 administrative groups(SC ST OBC OC)
• Over 220 million members of the Scheduled Castes
Castes are a source of inequalities and discrimination
• 29% hh of the SC are below poverty line, 12% OC
• 50% villages restrict SC hh access to water (Shah et al. 2006)
• 44.5% of the SC hh in the Hindi belt face caste-based restrictionto movement (Girard 2018)
Stabbed in the back. Victoire Girard

Introduction Background Empirical analysis Conclusions +
Caste based electoral quotas
Quotas in local political councils
• Quotas size mirror caste size in the state population
• Constitutional in 1993 but staggered implementation :- before 1992 : 4 states- between 1993 & 1995 : 8 states- after 1995 : 5 states
• Quotas rotate- rotate across villages at each election- rotation is an administrative decision
• Quotas are visible
Stabbed in the back. Victoire Girard

Introduction Background Empirical analysis Conclusions +
Outline
1 Introduction
2 Background
3 Empirical analysis
4 Conclusions
Stabbed in the back. Victoire Girard

Introduction Background Empirical analysis Conclusions +
Proxying for sabotage with administrative data
Crime data (police records)
• State level, 1992 to 2013
• Condition to record : low caste victim + high caste perpetrator
• A measure of caste-based violence : evolves with- changes in relative wealth (Sharma 2015)- sharing some water sources (Bros & Couttenier 2015)
• Data tells about perpetrating, reporting and recording
• Separate record of penal code and special crimes (link to un-touchability practices), murders, rape, etc.
Stabbed in the back. Victoire Girard

Introduction Background Empirical analysis Conclusions +
Empirical model for the administrative data :Exploit the staggered implementation of electoral quotas
ln(crimest/100, 000SCst) = α1post quotast+α′2Xst+FEs+FEt+εst
(1)
post quotast = dummy with value one from the year of the firstelection with quotas onwardsXst = literacy, GDP per capita and its square, ratio of low caste tohigh caste population and ratio square, urbanizationFEs & FEt = state & year fixed effectsεst = standard error (state cluster)
Stabbed in the back. Victoire Girard

Introduction Background Empirical analysis Conclusions +
Special crimes and murders increase after quotas(1) (2) (3) (4)
special penal murders rape
post quota 1.357** -0.749 0.274** 0.0552(0.566) (0.728) (0.0967) (0.0992)
Observations 334 354 305 337R-squared 0.766 0.601 0.859 0.916
Standard errors clustered by state in parentheses. All spe-cifications include state and year fixed effects and the ba-seline set of controls (literacy rates, real per capita GDPand its square, SC to non-SC share of the population andits square, urbanization). ∗ ∗ ∗p < 0.01, ∗ ∗ p < 0.05,∗p < 0.10, +p < 0.15.
Results robust to varying the control set, cluster bootstrap,omitting years or States one by one.
Stabbed in the back. Victoire Girard

Introduction Background Empirical analysis Conclusions +
Interpretation : Results are consistent with some sabotage
Special crimes increase by approx. 300% : open channelsConsistent with empowerment, or sabotage (or interpretation)
Murders increase by 32% : consistent with sabotage
• murders suffer from lowest declaration bias
• results inconsistent with mis-record
• results inconsistent with general increase in violence
• Consistent with qualitative evidenceEx : “In the village of Melavalavu, Madurai district Tamil Nadu,
following the election of a Dalit to the village council presidency,
members of a higher-caste group murdered six Dalits in June 1997,
including the elected council president [...]” Narula (1999)
Stabbed in the back. Victoire Girard

Introduction Background Empirical analysis Conclusions +
Proxying for sabotage with household survey data
IHDS 2012
• nationally representative, here restricted to rural sample
• on attitudes and perceptions
• by household members of both the SC and non SC
Stabbed in the back. Victoire Girard
Introduction Background Empirical analysis Conclusions +
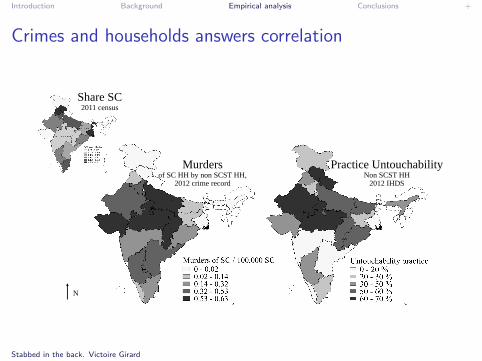
Crimes and households answers correlation
Share SC2011 census
Murdersof SC HH by non SCST HH,
2012 crime record
Practice UntouchabilityNon SCST HH
2012 IHDS
N
Stabbed in the back. Victoire Girard

Introduction Background Empirical analysis Conclusions +
Empirical model for the household survey :Exploit the rotation of SC quotas
Yiv = βc1quota SCv + βc2′Xi + βc3
′Xv + FEdistrict + εst (2)
Yiv = outcome(s) of interest for households i of caste c living invillage v.quota SCv = a dummy equal to 1 in villages where the head of thelocal political council is a member of the SCs elected on a castequota.Xi and Xv = household and village controls, including the share ofSC housheolds in the villageFEdistrict = district fixed effectsεst = standard error (village cluster)
Stabbed in the back. Victoire Girard
Introduction Background Empirical analysis Conclusions +
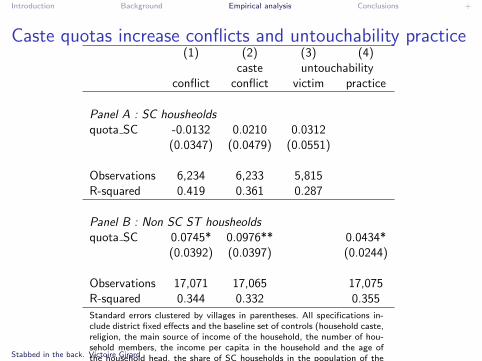
Caste quotas increase conflicts and untouchability practice(1) (2) (3) (4)
caste untouchabilityconflict conflict victim practice
Panel A : SC housheoldsquota SC -0.0132 0.0210 0.0312
(0.0347) (0.0479) (0.0551)
Observations 6,234 6,233 5,815R-squared 0.419 0.361 0.287
Panel B : Non SC ST housheoldsquota SC 0.0745* 0.0976** 0.0434*
(0.0392) (0.0397) (0.0244)
Observations 17,071 17,065 17,075R-squared 0.344 0.332 0.355
Standard errors clustered by villages in parentheses. All specifications in-clude district fixed effects and the baseline set of controls (household caste,religion, the main source of income of the household, the number of hou-sehold members, the income per capita in the household and the age ofthe household head, the share of SC households in the population of thevillage and the square of this share, and whether the head of the localpolitical council is a woman elected after a gender quota). *** p<0.01, **p<0.05, *p<0.1, +p<0.15.
Stabbed in the back. Victoire Girard

Introduction Background Empirical analysis Conclusions +
Caste quotas leave general trust unchanged(1) (2) (3) (4)
Dep. Variable : Trust in Politicians Panchayat Police Justice
Panel A : SC householdsquota SC 0.0274 -0.0112 -0.0440+ 0.0163
(0.0423) (0.0242) (0.0288) (0.0139)
Observations 6,222 6,222 6,22 6,207R-squared 0.253 0.218 0.225 0.125
Panel B : Non SC ST householdsquota SC -0.0327 -0.0230 -0.00439 -0.00385
(0.0290) (0.0215) (0.0171) (0.00925)
Observations 17,063 17,048 17,051 17,01R-squared 0.166 0.149 0.132 0.140
Standard errors clustered by villages in parentheses. All specifications include district fixed effectsand the baseline set of controls (household caste, religion, the main source of income of thehousehold, the number of household members, the income per capita in the household and theage of the household head, the share of SC households in the population of the village and thesquare of this share, and whether the head of the local political council is a woman elected aftera gender quota). *** p<0.01, ** p<0.05, *p<0.1, +p<0.15.Stabbed in the back. Victoire Girard

Introduction Background Empirical analysis Conclusions +
Caste quotas leave general crimes unchanged(1) (2) (3) (4)
Dep. variable : Theft Break-in Attack Eve teasing
Panel A : SC households samplequota SC 0.00576 0.00852 0.00381 -0.0137
(0.0101) (0.00870) (0.00719) (0.0271)
Observations 6,234 6,234 6,234 6,232R-squared 0.130 0.096 0.126 0.203
Panel B : Non-SC ST households samplequota SC -0.0162 -0.000783 0.00336 -0.00730
(0.0114) (0.00398) (0.00976) (0.0261)
Observations 17,08 17,079 17,079 17,063R-squared 0.065 0.043 0.057 0.209
Standard errors clustered by villages in parentheses. All specifications include district fixed effectsand the baseline set of controls (household caste, religion, the main source of income of thehousehold, the number of household members, the income per capita in the household and theage of the household head, the share of SC households in the population of the village and thesquare of this share, and whether the head of the local political council is a woman elected aftera gender quota). *** p<0.01, ** p<0.05, *p<0.1, +p<0.15.Stabbed in the back. Victoire Girard

Introduction Background Empirical analysis Conclusions +
Note : the backlash is independent of the way quotas areimplemented
Crimes are unaffected by implementation modalities of thequotas
• Moment of election
• Size of quotas
• Exclusive special courts
The increase in murders comes from quotas implementationitself
Stabbed in the back. Victoire Girard

Introduction Background Empirical analysis Conclusions +
Outline
1 Introduction
2 Background
3 Empirical analysis
4 Conclusions
Stabbed in the back. Victoire Girard

Introduction Background Empirical analysis Conclusions +
Conclusions
This study : SC quotas
• increase murders of members of the SCs
• increase the declaration of untouchablity practices by membersof the non SC ST
We can not straightforwardly extend to castes theempowerment conclusion of Iyer et al 2012
Affirmative action is at risk of being undermined by sabotage
Stabbed in the back. Victoire Girard

Introduction Background Empirical analysis Conclusions +
OpeningAffirmative action can be a powerful redistributive andempowerment tool
• minority leader : public goods funding, and access(resp. Besley et al., 2004 ; Iyer et al 2012)+ a role model
• minority members : solidarity, aspirations, feeling of legitimacy(resp. Dunning, 2010 ; Beaman et al 2012 ; Iyer et al 2012)
• majority members : update in stereotypes, in the social norm(resp. Beaman et al 2009 ; Girard 2018)in line with contact theory (Allport 1954)
Future work• We need to keep in mind that affirmative action may also have
unintended spillovers• Open question : how to design affirmative action to reduce risk
of backlashStabbed in the back. Victoire Girard

Introduction Background Empirical analysis Conclusions +
Thank you !
Stabbed in the back. Victoire Girard

Introduction Background Empirical analysis Conclusions +
Discussion
Stabbed in the back. Victoire Girard

Introduction Background Empirical analysis Conclusions +
The staggered implementation of caste quotas
Year of first election with reservation for SC Number of states
1962 11981 11991 11992 11993 11994 11995 61996 12001 22006 12007 1Total 17
Stabbed in the back. Victoire Girard

Introduction Background Empirical analysis Conclusions +
Descriptive stats[back]
Mean SD Min Max
Total 16.1 15.6 0 76.6SLL 5.13 6.03 0 32.4IPC 10.9 12.9 0 65.5Murder 0.26 0.26 0 1.18Rape 1.40 1.63 0 8.34SC to higher castes ratio 0.22 0.09 0.08 0.48Rural population (%) 0.67 0.20 0.17 1Litterate population (%) 0.64 0.15 0.33 1Farming population (%) 0.15 0.05 0 0.29per capita real GDP 2.27 1.10 0.42 6.15police strength 158 103 8.37 730Share SC seats GE 0.15 0.07 0 0.31
Stabbed in the back. Victoire Girard

Introduction Background Empirical analysis Conclusions +
The correlation between crimes and households answersmurder SLL Untouchability
average in 2012 average in 2012 Practice victim
murder mean 1.0000(1992-2013)murder 2012 0.9203 1.0000
(0.0000)
SLL mean 0.3655 0.4326 1.0000(1992-2013) (0.1238) (0.0643)
SLL 2012 -0.1735 -0.1728 0.5934 1.0000(0.4775) (0.4793) (0.0074)
untouch. 0.5271 0.4435 0.2554 0.1439 1.0000practice (0.0204) (0.0572) (0.2914) (0.5568)
untouch. 0.6452 0.6040 0.3437 0.2477 0.1209 1.0000victim (0.0029) (0.0062) (0.1496) (0.3066) (0.5648)
Stabbed in the back. Victoire Girard

Introduction Background Empirical analysis Conclusions +
First overview : crime rates seem higher after SC quotas3 years before difference 3 years following P > |z |
SC quotas SC quotas
Total 15.2 < 17.2 +(0.60 (0.90)
Special crime 4.57 < 6.06 *(0.23) (0.63)
Penal code crime 10.6 11.2(0.74) (0.37)
Murder 0.22 < 0.29 **(0.008) (0.02)
Rape 1.27 < 1.46 *(0.003) (0.08)
The table displays means and standard errors (in parentheses). For each crime category andyear to the date of reservation, I compute the national average of crime rates (per 100,000 SCpopulation, or SC women in the case of rapes). The year of implementation of the quota isincluded in the sample of the “3 years following SC quotas” (and this year differs across states).I use a 3-year threshold because the crime statistics start in 1992 and most states implementedSC quotas in 1995. P > |z | tells, for each sample, the p-values of the test that the differencebetween years just before or just after the implementation of the SC quotas is zero. ∗∗∗p < 0.01,∗ ∗ p < 0.05, ∗p < 0.1, +p < 0.15.
Stabbed in the back. Victoire Girard

Introduction Background Empirical analysis Conclusions +
The increase in caste murders after caste quotas isindependent of controls
(1) (2) (3) (4) (5)Dep. Var : ln (murders/100,000 low caste)
post quota 0.221** 0.274** 0.283*** 0.265** 0.274**(0.103) (0.0967) (0.0901) (0.0954) (0.0987)
Obs 305 305 305 305 305R2 0.855 0.859 0.859 0.861 0.859Controls : none add to (1) add to (2) add to (2) add to (2)
demogr. BSP vote ln(inc. SC) p(encounter)
& eco. % state and around shared
controls elections ln(inc. NSCST) water source
Standard errors clustered by state in parentheses. All specifications include state and year fixed effectsand the baseline set of controls (literacy rates, real per capita GDP and its square, SC to non-SC shareof the population and its square, urbanization). *** p<0.01, ** p<0.05, *p<0.1, +p<0.15.
Stabbed in the back. Victoire Girard
Introduction Background Empirical analysis Conclusions +
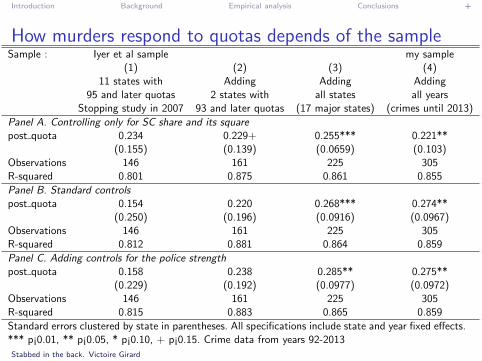
How murders respond to quotas depends of the sampleSample : Iyer et al sample my sample
(1) (2) (3) (4)11 states with Adding Adding Adding
95 and later quotas 2 states with all states all yearsStopping study in 2007 93 and later quotas (17 major states) (crimes until 2013)
Panel A. Controlling only for SC share and its squarepost quota 0.234 0.229+ 0.255*** 0.221**
(0.155) (0.139) (0.0659) (0.103)Observations 146 161 225 305R-squared 0.801 0.875 0.861 0.855
Panel B. Standard controlspost quota 0.154 0.220 0.268*** 0.274**
(0.250) (0.196) (0.0916) (0.0967)Observations 146 161 225 305R-squared 0.812 0.881 0.864 0.859
Panel C. Adding controls for the police strengthpost quota 0.158 0.238 0.285** 0.275**
(0.229) (0.192) (0.0977) (0.0972)Observations 146 161 225 305R-squared 0.815 0.883 0.865 0.859
Standard errors clustered by state in parentheses. All specifications include state and year fixed effects.*** p¡0.01, ** p¡0.05, * p¡0.10, + p¡0.15. Crime data from years 92-2013
Stabbed in the back. Victoire Girard

Introduction Background Empirical analysis Conclusions +
Elections do not exacerbate violence
(1) (2) (3) (4) (5)total special penal murders rape
post quota 0.0101 1.432** -0.752 0.250** 0.0369(0.345) (0.589) (0.743) (0.106) (0.101)
election 0.382 0.655* -0.548 -0.209 0.472***(0.265) (0.354) (0.873) (0.471) (0.102)
post quota -0.368 -0.814** 0.500 0.244 -0.396****election (0.286) (0.339) (0.802) (0.466) (0.0934)
Observations 357 334 354 305 337R-squared 0.891 0.768 0.602 0.859 0.917
Standard errors clustered by state in parentheses. All specificationsinclude state and year fixed effects and the baseline set of controls(literacy rates, real per capita GDP and its square, SC to non-SCshare of the population and its square, urbanization). ∗ ∗ ∗p < 0.01,∗ ∗ p < 0.05, ∗p < 0.10, +p < 0.15.
Stabbed in the back. Victoire Girard

Introduction Background Empirical analysis Conclusions +
Variations in quota size do not exacerbate violence(1) (2) (3) (4) (5)
total special penal murders rape
post quota 2.590 -4.393 12.83 0.339 -0.0282* share SC (2.347) (3.818) (9.097) (0.812) (1.140)post quota -0.366 2.001** -2.565 0.224* 0.0594
(0.563) (0.860) (1.832) (0.114) (0.205)
Observations 357 334 354 305 337R-squared 0.892 0.769 0.615 0.859 0.916
Standard errors clustered by state in parentheses. All specificationsinclude state and year fixed effects and the baseline set of controls(literacy rates, real per capita GDP and its square, SC to non-SCshare of the population and its square, urbanization). ∗ ∗ ∗p < 0.01,∗ ∗ p < 0.05, ∗p < 0.10, +p < 0.15.
Same is true of the variation of the number of seats for memebrsof the SCs in the state and national assembliesHowever all are small magnitude variations
Stabbed in the back. Victoire Girard

Introduction Background Empirical analysis Conclusions +
Dedicated judiciary system does not affect results
(1) (2) (3) (4) (5)total special penal murders rape
post quota -0.485 1.570** -2.537+ 0.349** 0.126(0.379) (0.630) (1.561) (0.120) (0.181)
post quota 0.829* -0.305 3.053+ -0.108 -0.108* special court (0.460) (0.638) (1.868) (0.102) (0.202)
Observations 357 334 354 305 337R-squared 0.895 0.767 0.633 0.859 0.917
Standard errors clustered by state in parentheses. All specificationsinclude state and year fixed effects and the baseline set of controls(literacy rates, real per capita GDP and its square, SC to non-SCshare of the population and its square, urbanization). ∗ ∗ ∗p < 0.01,∗ ∗ p < 0.05, ∗p < 0.10, +p < 0.15.
Stabbed in the back. Victoire Girard