stadiums report
TRANSCRIPT
8/7/2019 Stadiums Report
http://slidepdf.com/reader/full/stadiums-report 1/26
-1-
The Heartland InstitutePolicy Study No. 13February 23, 1987
IS THERE AN ECONOMIC RATIONALEFOR SUBSIDIZING SPORTS STADIUMS?
by Robert A. Baade
I. Introduction
Controversy shadows sports in the United States. Sports are so deeply woven into the
fabric of our culture that disputations about them are inevitable. Sports are leisure; sports arebusiness; sports are religion.
The multiple personalities of sports are nowhere more visible than in the many municipalstadium debates taking place throughout the country. City leaders from Miami to San Franciscohave summoned sound eocnomic management as their star witness in defending plans to subsidize
the renovation or construction of stadiums. Can this witness stand up to a stiff cross-examination?The purpose of this paper is to determine if subsidizing sports facilities makes economic
sense for municipalities.
This analysis begins with an assessment of the history and future prospects for privatelyfinanced and managed sports facilities. Can private interests derive from a sports facility benefits
sufficient to cover their costs? What does recent history tell us about private ownership of thesefacilities? What do current plans for new stadiums and arenas imply about the likelihood of private
ownership in the future? Part II of this paper provides some answers to these questions.
In Part III, the author challenges the prevailing notion that sports produce significant
economic benefits for municipalities, and offers instead two alternative hypotheses to explain howsports affect an economy. He first proposes that, in the short term, local spending by sports fansand visiting personnel does not represent an increase in spending on leisure activity, but rather
may be merely a diversion of leisure dollars from other activities.
The author proposes a similar hypothesis with respect to the long-term economic impact
of sports. Those who argue that stadium development can serve as a catalyst for urban renewal
8/7/2019 Stadiums Report
http://slidepdf.com/reader/full/stadiums-report 2/26
Dean Bai, “Comparison of Privately and Publicly Owned Sports Stadiums and Arenas,” Heartland Policy1
Study No. 6 (Chicago, IL: The Heartland Institute, August 19, 1985), page 2.
Ibid., page 6.2
-2-
see a link between professional sports and the ability of a municipality to attract new business orfoster a “big-league” expansionist attitude among businesses already in the area. The author
suggests, however, that any long-term economic “growth” prompted by sports stadiums may notbe growth at all, but merely a realignment of economic development in the service sector of theeconomy.
In Parts IV and V, the author finds statistical evidence to support both new hypotheses. Asummary and concluding remarks constitute Part VI of the paper.
II. Ownership of Arenas and Stadiums:
A Recent History and Future Prospects
A. Public funding of sports facilities prior to the 1970s.
Arenas and stadiums will be privately constructed and operated if the benefits
appropriable by private owners exceed costs incurred in constructing and operating thosefacilities. Data compiled since 1953 on arenas utilized by professional hockey and basketballteams, and on stadiums utilized by professional football and baseball teams, offer de facto
evidence that profitable private construction and operation of these sports facilities is difficult.
Of the thirty-eight arenas used by National Basketball Association (NBA) teams and/or
National Hockey League (NHL) teams since 1953, only eight were privately owned. Of the fifty-1
eight stadiums used by major league baseball teams and/or National Football League (NFL) teams
since 1953, “seventeen are (or in the case of facilities no longer in existence, were) privatelyowned; thirty-three are (were) publicly owned; two are owned by universities; two began asprivate sites and were sold to public agencies; and two were publicly owned but were sold toprivate interests. It was not possible to trace the lineage of two of the stadiums because they are
no longer standing.” If we count the two university stadiums as publicly owned, and exclude the2
two with untraceable histories, then of the ninety-four facilities used by professional football,baseball, hockey, and basketball teams since 1953, approximately 71 percent are publicly owned.
It cannot be concluded from this fact that stadiums and arenas do not generate sufficient benefitsto excite much private interest, but the evidence certainly supports that hypothesis.
Data on private and public financing of stadiums between 1960 and 1987 offer more
compelling evidence on the ability or unwillingness of private interests to invest in sports facilities.Of the total number of new baseball/multi-purpose stadiums constructed since 1960, only two
8/7/2019 Stadiums Report
http://slidepdf.com/reader/full/stadiums-report 3/26
Roger Lowenstein, “Miami Dolphins’ Owner Builds a Stadium with Private Financing and Fancy3
Seating,” Wall Street Journal, November 15, 1985, page 25.
“Sports Stadiums: How They’re Built, How They’re Faring,” Chicago Tribune, January 22, 1978, section4
3, page 2.
Martin Gottlieb, “Trump Cleared to Build Domed Sports Stadium,” New York Times, December 5, 1985.5
-3-
(Dodger Stadium, Los Angeles, California, 1962; and Sullivan Stadium, Foxboro, Massachusetts,1971) have been financed entirely by private capital.3
During the 1960s and 1970s, the public sector was the key player in stadium construction,a situation that developed for two reasons. First, it was difficult for the private sector to secure
the large amounts of capital necessary in the early stages of stadium construction. Second, it waseasy for the private owners of sports teams to secure public funding for stadiums, using asleverage a city’s fear of losing the sports franchise or its desire to adopt one.
B. The rise of private financing in the 1970s and 1980s.
In the late 1970s and early 1980s, public sector financial backing for stadiumsbecame less reliable. The urban fiscal crisis beginning in the 1970s is in large part responsible for
this development. The public sector has tightened its purse strings and, perhaps not coincidentally,has witnessed an increase in private financial involvement. A growing number of private and
public partnerships have been formed to build and operate stadiums.
The Meadowlands Complex in East Rutherford, New Jersey, and Texas Stadium in Irving,
Texas, are two among many facilities built in the 1970s with funds secured in part through privatebond issues. Private financing early in the history of Texas Stadium was secured through a rathernovel means: season ticket-holders were required to purchase bonds to get their seats. For
example, a $1,000 bond purchase would guarantee a season ticket-holder a seat somewherebetween the 35-yard-lines.4
In the 1980s, the public-private partnership has become more commonplace, and theprivate sector is emerging as the star player on the team. Baltimore might still have the Colts if
not for the public-private economic alliance that built the Indianapolis Hoosier dome to corralthem. A substantial portion of the $82 million that built the Hoosier Dome came from privatesources, including a $25 million grant from Indianapolis’ Lilly Endowment.
Nowhere have public and private forces been more integrated in the stadium quest than inNew York. “I don’t think there’s another deal like this in the country,” noted Vincent Tese, thechairman of New York’s State Urban Development Corporation. In a December 4, 1985,
proclamation, New York State and New York City authorized Donald J. Trump to build a $286million domed stadium in New York. The private and public developers in this project will be5

8/7/2019 Stadiums Report
http://slidepdf.com/reader/full/stadiums-report 4/26
Ibid.6
Lowenstein, op cit.7
-4-
roughly equal partners until 2011, when the city and state share of operating income will fall to 25percent of net operating income.
What makes the New York project so intriguing is the private developer’s plan forrecouping his initial financial outlay. Trump intends to sell 23,000 seats for an average of $12,000;
to lease 15,000 seats for an average of $2,400; and to lease 221 luxury boxes on an annual basisfor $60,000 each. If expectations are met, the sale of seats alone will generate $2766
million—only $10 million less than the stadium’s projected cost of $286 million.
The New York idea for stadium financing could revolutionize stadium economics andsports, and pass the sports promotion industry back to private entrepreneurs. The NFL Miami
Dolphins are building the first privately financed and operated facility to be constructed since1971; if all the luxury boxes and club seats can be leased the Dolphins could earn $16.5 million ayear, which is $500,000 more than each NFL team grosses annually from television revenues.7
C. Decision making is influenced by positive stadium externalities.
How has the private sector been able to assume a responsibility for financing
stadium construction that was ostensibly beyond its grasp not long ago? There are at least twoexplanations. First, stadium financing may have been within private reach all along. Subsidizationby the public sector of stadium construction is one rendition of an old saw: Do not spend your
private funds when the government will financially accommodate your private ambition. It is quiteplausible that the private sector has not often invested in stadium construction simply because ithas not needed to.
Second, a decrease in public funds has compelled the private sector to fashion strategies
for capturing revenues and profits that result from stadium activities, but that in the past have notbeen appropriated by stadium owners and operators. These benefits (and costs, as well), whichresult from private economic activity but are not appropriable by the entrepreneurs initiating theactivity, are “external” to that private activity. Pollution is an example of a negative externality: a
cost for which a private concern may be responsible, but in the absence of coercion or a sense of social responsibility is not influential in private decision making. In the case of stadiums, theargument for public subsidization is based on the supposed existence of positive externalities.
Since the private stadium developer presumably cannot capture all the economic benefits inducedby stadium activities, he requires public financial support to ensure profits commensurate with thesum of the internal and external benefits the stadium activity creates.
Today there is widespread disagreement about the magnitude of external stadium benefits.
Recently, official public estimates of those external benefits have been greeted with growing
8/7/2019 Stadiums Report
http://slidepdf.com/reader/full/stadiums-report 5/26
Ibid.8
John Helgar, “More Cities Plan domed Stadiums, But Returns May Prove to be Small,” Wall Street 9
Journal, May 17, 1984, page 33.
-5-
taxpayer skepticism. The failure of stadium-related referenda in Cleveland, Miami, and Addison(Illinois) are recent manifestations of taxpayer resistance.
The decline in public financial support for stadium construction has been offset in someinstances by entrepreneurs who recognize the contribution stadium activity may make to their
businesses. Miami’s Dolphin Stadium is one example of an entrepreneur’s willingness to subsidizeprivate stadium activity, believing that his business is likely to grow as a result of its construction.The firm that owns the land on which the stadium is to be built currently leases the 160-acre
stadium site to the Dolphins for one dollar a year.8
D. The public sector’s record.
Experience indicates that it is difficult for the public sector to efficiently build and
operate stadiums. The mismanagement of stadium projects in public hands—the New OrleansSuperdome and Pontiac Silverdome are noteworthy examples—has galvanized taxpayer resistance
to such projects. Louisiana taxpayers have been enlisted to finance Superdome deficits of $3 to $5million annually, and the Silverdome has similarly drained government treasuries. Taxpayers inPontiac and across the state of Michigan have paid more than $11 million since 1976 for stadium
operating deficits.9
Why has the public sector faced these problems? Any answer to this question must
consider construction costs as influenced by both industry conditions and civic ambition.Furthermore, it must take into account what impact the rush of municipalities to the sports-dollarlure has had on overall market conditions for sports facilities and teams.
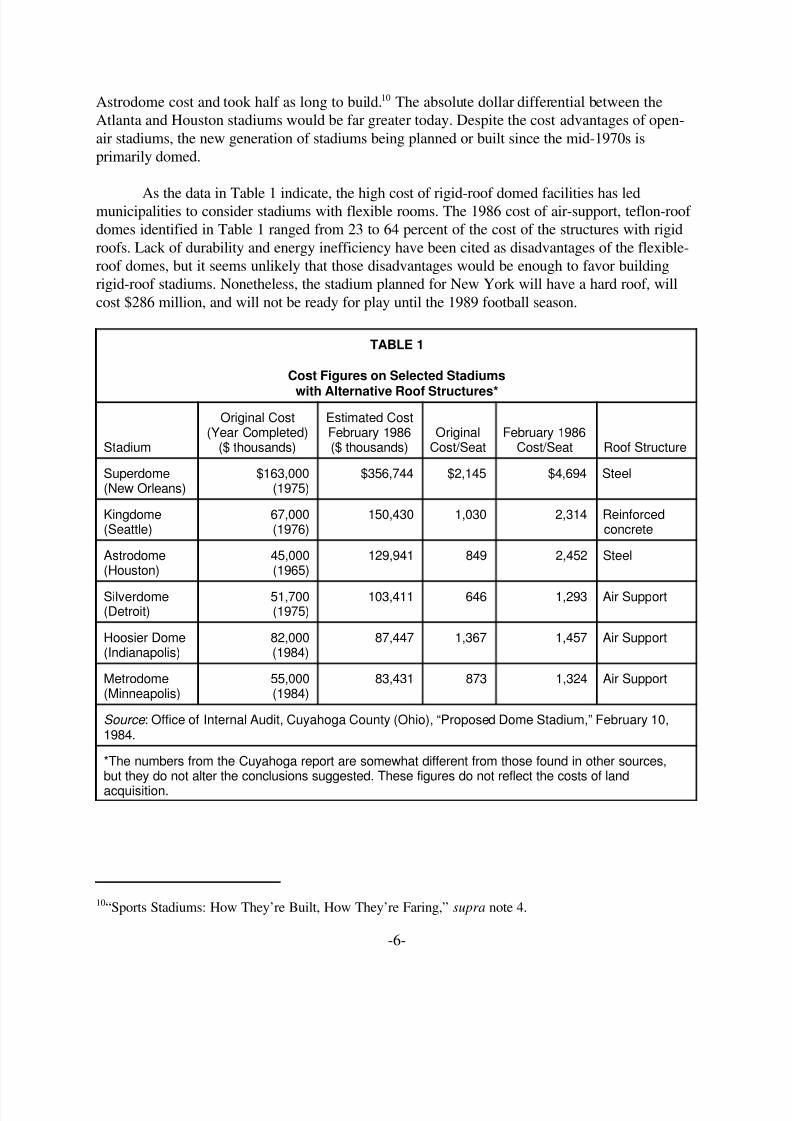
In Table 1, information is provided for six stadiums with regard to their roof structures,
original costs of production, equivalent February 1986 costs of production (based on aconstruction cost index), costs per seat when the stadiums were built, and costs per seat if thestadiums were built in February 1986. As the figures indicate, current stadium construction costsare enormous. Furthermore, the rate of increase in construction costs exceeds the overall rate of
inflation. Increases in the construction cost index have been approximately 70 percent and 90percent greater than increases for the consumer and wholesale price indices respectively for the1965 to February 1986 period.
In addition, the type of facility currently in vogue has contributed significantly to stadiumfinancing problems. Today, the fashion in stadiums comes domed, and domes increase stadium
costs substantially. Consider this tale of two stadiums built in 1965. Atlanta’s open-air stadiumtook $18 million ad one year to construct; it cost approximately 40 percent of what the Houston
8/7/2019 Stadiums Report
http://slidepdf.com/reader/full/stadiums-report 6/26
“Sports Stadiums: How They’re Built, How They’re Faring,” supra note 4.10
-6-
Astrodome cost and took half as long to build. The absolute dollar differential between the10
Atlanta and Houston stadiums would be far greater today. Despite the cost advantages of open-
air stadiums, the new generation of stadiums being planned or built since the mid-1970s isprimarily domed.
As the data in Table 1 indicate, the high cost of rigid-roof domed facilities has ledmunicipalities to consider stadiums with flexible rooms. The 1986 cost of air-support, teflon-roof domes identified in Table 1 ranged from 23 to 64 percent of the cost of the structures with rigid
roofs. Lack of durability and energy inefficiency have been cited as disadvantages of the flexible-roof domes, but it seems unlikely that those disadvantages would be enough to favor buildingrigid-roof stadiums. Nonetheless, the stadium planned for New York will have a hard roof, will
cost $286 million, and will not be ready for play until the 1989 football season.
TABLE 1
Cost Figures on Selected Stadiums
with Alternative Roof Structures*
Stadium ($ thousands) ($ thousands) Cost/Seat Cost/Seat Roof Structure
Original Cost Estimated Cost(Year Completed) February 1986 Original February 1986
Superdome $163,000 $356,744 $2,145 $4,694 Steel(New Orleans) (1975)
Kingdome 67,000 150,430 1,030 2,314 Reinforced(Seattle) (1976) concrete
Astrodome 45,000 129,941 849 2,452 Steel(Houston) (1965)
Silverdome 51,700 103,411 646 1,293 Air Support(Detroit) (1975)
Hoosier Dome 82,000 87,447 1,367 1,457 Air Support(Indianapolis) (1984)
Metrodome 55,000 83,431 873 1,324 Air Support(Minneapolis) (1984)
Source : Office of Internal Audit, Cuyahoga County (Ohio), “Proposed Dome Stadium,” February 10,1984.
*The numbers from the Cuyahoga report are somewhat different from those found in other sources,but they do not alter the conclusions suggested. These figures do not reflect the costs of landacquisition.
8/7/2019 Stadiums Report
http://slidepdf.com/reader/full/stadiums-report 7/26
J.D. Reed, “Louisiana Purchase: Superdome in New Orleans,” Sports Illustrated , July 22, 1974, pages11
66-72.
“Stadium Mania,” Business Week , May 14, 1984, page 142.12
-7-
In the nation’s third largest city, all the early plans submitted for a new, multi-purposeChicago stadium include hard-roofed domes, and all had cost estimates of over $200 million.
Chicago developers have since tempered their plans, but it could be argued that the newgeneration of stadium builders has generally emphasized the elaborate over the cost-efficientprecisely at a time when most municipalities are financially strapped.
Climate is, of course, more easily controlled in a domed stadium, and for that reasondomed facilities may be likely to attract more frequent near-capacity crowds than do open-air
stadiums. In addition, domed stadiums can host conventions and exhibitions, while open-airstadiums are less likely to attract such nonsport events. Yet, while purveyors of domed stadiumsoffer these and other arguments in support of their elaborate plans, the significance of ego in
building the new generation of domed stadiums cannot be overlooked. Perhaps ho one has offereda more honest assessment of the New Orleans Superdome than did Moon Landrieu, the Mayor of New Orleans, during its construction. Landrieu noted, “the Superdome is an exercise of optimism.
A statement of faith. It is the very building of it that is important, not how much it is used or itseconomics.”11
Not all political officials are as forthright as Landrieu, whose honesty was forced in part by
mounting evidence that the Superdome was not grounded in economic rationality. Taxpayers are
becoming more skeptical about stadium economics, and market conditions are changing in
a way that even further diminishes their economic justification.
Like cats chasing their tails, cities unable to resist the stadium promise of prestige and
money are rushing to secure the sports teams they hope will provide the economic justificationthey seek. Today there are more sports stadiums than teams. Nearly a dozen cities in the UnitedStates and Canada are urging the major baseball leagues to expand. In addition, Buffalo, Denver,
Indianapolis, Nashville, New Orleans, Phoenix, St. Petersburg, Tampa, Washington, Vancouver,
and many other cities are putting pressure on cities that are engaged in lease negotiations withcurrent major league tenants. It is not a market that favors the buyers of professional sports
teams.
As the competition for teams intensifies, cities are embarking on ever-riskier financialcourses. Again, a city’s image of itself appears to be a primary motivating force. For example,Minnesota Governor Rudy Perpich is making professional sports a centerpiece in his efforts to
revitalize the state’s economy. Th head of Perpich’s task force on revitalization, Merlin E.Dewing, reflected on the prospect of losing the Minnesota Twins baseball team, noting: “It’salmost worse for a city’s image to lose a major league team than to have never had one at all.” 12
8/7/2019 Stadiums Report
http://slidepdf.com/reader/full/stadiums-report 8/26
“Development: Super Headache,” Newsweek , April 29, 1974, pages 82-84.13
Dean Baim, supra note 1, pages 4 an d 6.1414
“Time to Weight Private Operation of Kingdome,” Seattle Times, December 8, 1985.15
-8-
In the current climate, it would be difficult to imagine a riskier strategy than building astadium to attract professional sports teams. Yet municipalities believe that a stadium is necessary
to secure a professional sports franchise. This belief has been reinforced by the commissioners of professional sports leagues who, seeking to maximize incomes for the teams they represent, wantassurances with regard to skybox, concession, and general revenues.
Fundamental to the profitable operation of a stadium is its utilization. The greater thenumber of near-capacity events the stadium attracts, the more revenue there is to apply to stadium
fixed costs. As more stadiums bid for events that will utilize the stadium near its capacity, the lesslikely it is that stadium authorities will be able to exact terms that will allow for profitableoperation. Furthermore, since stadiums newly constructed since 1960 have been done so primarily
with public funds, the ability and willingness of public authorities to secure events takes onincreasingly greater significance. The Houston Astrodome, for example, is a modestly pricedstadium by today’s standards, yet it must be booked 150 days a year to operate profitable.13
Reviewing utilization rates for private and public arenas and stadiums, Dean Baim found
public arenas were utilized 197 days a year, compared to 254 days for private arenas, and publicstadiums were utilized 105 days annually compared to 115 days for private stadiums. Private14
incentives do seem to correlate with greater arena and stadium use. Recognizing this, some
municipalities have sought to replace public sports facility management wit private. For example,even though the Seattle Kingdome is one of the few publicly managed stadiums operating in theblack, a recent editorial in the Seattle Times argued: “The timing is right for the county to take an
objective look at whether taxpayers and tenants are best served by public or private operation of the Kingdome.”15
Even if all arenas and stadiums were privately managed, the fundamental problem of toomany facilities chasing too few events would remain. However, the leverage teams have in
shopping for the best municipal deal may be decreased as a consequence of greater privateownership and/or management of sports facilities. Team loyalty is to a large extent defined in
dollars and cents; a private sports facility, since it is likely to be owned by the franchise itself,
is less likely to be abandoned simply because a stadium will not be easily sold to another party.To the extent that private ownership and management could lead to a reduction in the number of
teams shopping for a new host city, the relative bargaining position of stadium sellers wouldimprove with greater reliance placed on the private sector for stadium construction and operation.
8/7/2019 Stadiums Report
http://slidepdf.com/reader/full/stadiums-report 9/26
“New Relationships Between Other Sports Teams and Their Respective Cities,” Chicago Metropolitan16
Planning Council Stadium Task Force Supplement, January/February 1986, page S-1.
Robert Billings, “In Toronto, the Costs Have Gone Up But a Stadium Has Not,” Chicago Sun-Timews,17
January 5, 1986, page 9.
Chicago Metropolitan Planning Council Stadium Task Force Supplement, supra note 16, page S-3.18
Ibid., page S-2.19
-9-
E. Examples of municipal largesse.
At the present time, owners of professional sports franchises are making liberal useof the market power they possess. From Toronto to New Orleans, sports teams are capitalizingon the emphasis city officials have placed on image. Consider the following examples of municipal
largesse by cities confronted with the prospect of losing a team.
! New Orleans. The Louisiana state government voted to turn over to the NFL Saints allSuperdome revenues related to Saints football except for a 5 percent rental fee based on gate
receipts. The Saints estimate this arrangement, coupled with the abolition of the state’s 4percent amusement tax, will add $2.5 million annually to the team’s treasury.16
! Toronto. Mayor Eggleton indicated that a secret clause in the deal that brought the Blue Jaysbaseball team to Toronto specifies that if plans for a domed stadium fall through, the city ispledged to build a second tier of at least 10,000 seats on the present ballpark. The cost of the
addition is estimated at $50 million, and taxpayers will assume that burden. If Toronto does
not comply, they risk losing their baseball team.17
! Philadelphia (National League baseball Phillies). The city has agreed to phase out by 1992the current per-ticket use charge, which is thirty cents per ticket; has committed to give thePhillies $1 million for a new outfield scoreboard; has agreed to take over the Phillies’ debt
service payments ($745,000 annually through 1992) on the Panavision scoreboard and to paythe Phillies back $1.5 million in past payments the team has made on the board; and willpermit the Phillies to build twenty-three “baseball only” suites in the stadium, with the team
retaining 60 percent of the related revenues. The Phillies estimate that the lease revisions willresult in a $2.5 million revenue reallocation from the city to the Phillies.18
! Philadelphia (NFL Eagles). To get the Eagles to sign a ten-year lease, the city has agreed toconstruct fifty to eighty skyboxes at no cost to the Eagles, and the team will retain allrevenues from the lease of these boxes. The city also will be spending $500,000 to constructand furnish additional field boxes, the revenue from which is appropriated by the Eagles.
Other provisions of the new city agreement with the Eagles relate to practice and trainingfacilities, deferral of Eagles’ rent payments until September 1994, and city responsibilities for
game-day security. The total cost to the City of Philadelphia has been estimated at $30million.19
8/7/2019 Stadiums Report
http://slidepdf.com/reader/full/stadiums-report 10/26
Ibid., page S-5.20
Ibid., page S-6.21
John McCarron, “Sox Throw Developers Knuckleball,” Chicago Tribune, January 19, 1986, page 1.22
-10-
! Seattle. The city has agreed to give the American League baseball Mariners free rent and willpick up all game-day expenses for the 1985-87 period. In addition, the Mariners will beentitled to 40 percent of the revenue on all new baseball suites beginning in 1990. The
Mariners estimate that these provisions and others will result in an increase in net revenues of $20 million over the next twelve years. The Mariners have secured the right to cancel the lease
in the event they do not draw at least 1.4 million fans per year during the 1986-88 period.20
There have been unconfirmed reports that Indianapolis, in an attempt to induce the Marinersto move, is offering a more attractive package that would include a guaranteed attendance of two million.
! Baltimore. The American League baseball Orioles and the city have structured a rental feebased on a 50-50 profit-sharing plan. If the Orioles make a profit, the city and team share the
profits on a 50-50 basis. If the Orioles do not make a profit, then no rent is due the city.21
! Chicago. In early negotiations with stadium developers, the American League baseball WhiteSox issued a list of twelve minimum requirements, prompting one of the developers to
comment: “They (White Sox) want all the benefits of ownership and none of the liabilities.”White Sox owners proposed that the Sox pay no rent and keep virtually all income from ticket
sales, concessions, parking, and in-stadium display advertisements. The only money left todevelopers, and remaining to finance the construction of the ballpark, would be skybox andluxury seat lease revenues. It is doubtful that the White Sox demands could have reached22
such heights in the absence of very lucrative offers from other municipalities.
F. Plans for sports facility construction and renovation.
In a market that appears to offer so little in the way of potential profits for
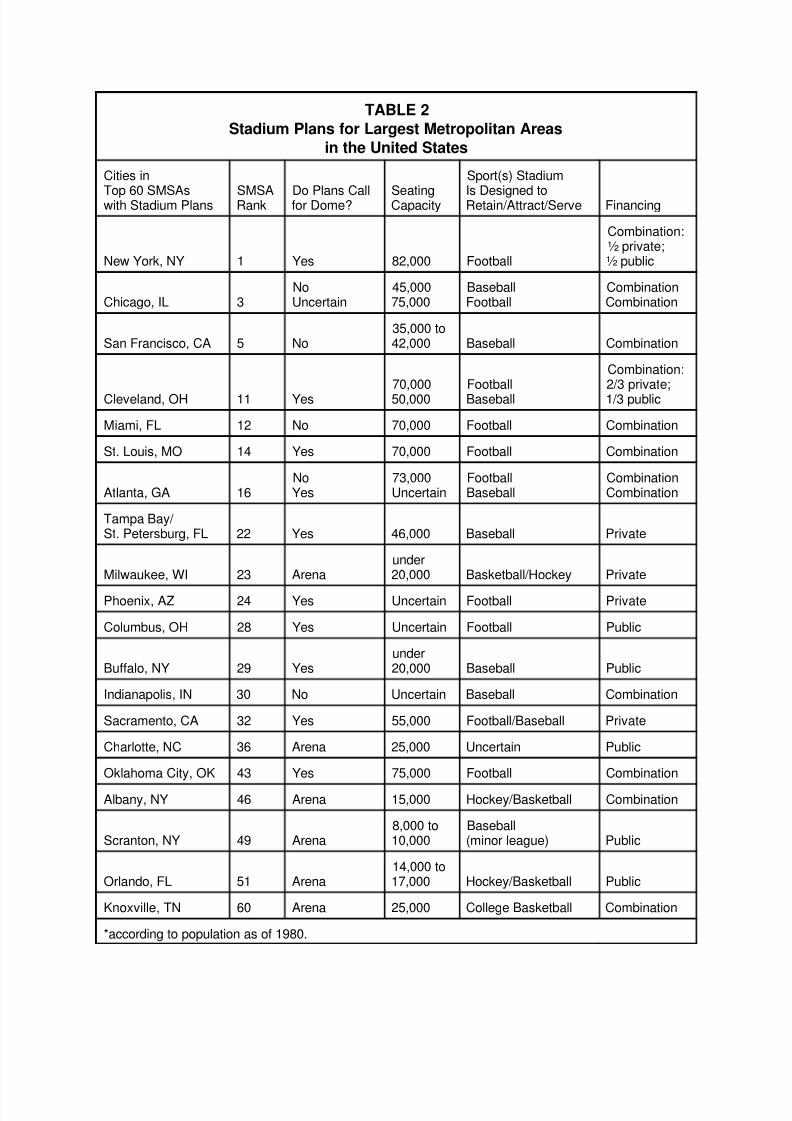
suppliers, it would be expected that the quantity of stadiums supplied would decrease. That wouldbe true of municipalities were economically motivated. However, the data assembled in Table 2below suggest that, despite claims made by city officials wooing sports teams, economics may not
be a primary motivation.
Cities do not appear to be discouraged by market conditions that have eroded the potential
for profitably operating a sports facility. One-third of the sixty largest standard metropolitanstatistical areas (SMSAs) have plans for new stadiums. Of course, planning does not guaranteeconstruction, but the extent of planning indicates an optimism that belies market conditions.
8/7/2019 Stadiums Report
http://slidepdf.com/reader/full/stadiums-report 11/26
Robert Baade, Linda Dunn, and Chris Hilden, “Stadium Planning Evaluation Questionnaire,” Lake23
Forest College, Lake Forest, Illinois, March 1, 1986.
-11-
In a survey conducted under the author’s direction, city planners were asked, “Do youbelieve that stadium construction or renovation can be justified on economic grounds?” Sixty
percent of those building stadiums answered “yes,” while only three of the twenty answered “no.”Two city planners indicated they were “not sure,” while one said he felt uncomfortable answeringthe question. In a market in which professional sports team suitors already outnumber23
professional sports teams by a substantial amount, new stadiums seem destined only to intensifyintercity competition for teams and to diminish further the prospect that cities can profit frombuilding a stadium.
Secondly, seven SMSAs ranking in the top twenty according to population have stadiumplans, and all of them already have at least one stadium. Two top-twenty cities, Atlanta and
Chicago, are seriously considering construction of two stadiums. Furthermore, the surveyindicated that official sin five of the top-twenty cities believe new stadium construction is essentialto retain or reacquire at least one professional sports franchise they currently host or recently
hosted. In the case of New York, stadium construction is contingent on bringing an NFL franchiseback to the city. Only in Miami did circumstances suggest that the new stadium was not part of a
defensive city action. After three referenda failed to produce public support for a new stadium, asnoted earlier, the owner of the NFL Miami Dolphins decided to build his own.
Thirdly, the data indicated that stadium plans in the top twenty SMSAs may be designedprimarily to frustrate the ambitions of those cities ranking between twenty-first and fortieth inpopulation. Eight cities in this latter group are planning sports facilities, and of these only
Milwaukee is building to retain a team. However, even Milwaukee is reportedly planning to usethe new arena as part of a strategy to attract an NHL club. In this group of eight cities, onlyCharlotte has not articulated a desire to host a team. The six cities other than Milwaukee and
Charlotte in this group are each seeking professional baseball or football teams, although NewYork State support for a stadium in Buffalo of only 20,000 seats will likely dissuade any team
from locating there. This group of eight also exhibited a greater interest in financing the projectsexclusively through private sources than did either the first twenty or the third twenty cities.
Finally, only five cities of those ranking between forty-first and sixtieth in population have
stadium plans. Only one in this group, Oklahoma City, has plans for a large, domed stadium. Theother four cities in this group planned to build arenas, many of which will also serve as conventioncenters. Interestingly facility plans by this group specified a reliance on public funding greater than
that indicated by either the first or second twenty cities.
8/7/2019 Stadiums Report
http://slidepdf.com/reader/full/stadiums-report 12/26
TABLE 2
Stadium Plans for Largest Metropolitan Areas
in the United States
Cities in Sport(s) Stadium
Top 60 SMSAs SMSA Do Plans Call Seating Is Designed towith Stadium Plans Rank for Dome? Capacity Retain/Attract/Serve Financing
New York, NY 1 Yes 82,000 Football ½ public
Combination:½ private;
Chicago, IL 3 Uncertain 75,000 Football CombinationNo 45,000 Baseball Combination
San Francisco, CA 5 No 42,000 Baseball Combination35,000 to
Cleveland, OH 11 Yes 50,000 Baseball 1/3 public70,000 Football 2/3 private;
Combination:
Miami, FL 12 No 70,000 Football Combination
St. Louis, MO 14 Yes 70,000 Football Combination
Atlanta, GA 16 Yes Uncertain Baseball CombinationNo 73,000 Football Combination
Tampa Bay/ St. Petersburg, FL 22 Yes 46,000 Baseball Private
Milwaukee, WI 23 Arena 20,000 Basketball/Hockey Privateunder
Phoenix, AZ 24 Yes Uncertain Football Private
Columbus, OH 28 Yes Uncertain Football Public
Buffalo, NY 29 Yes 20,000 Baseball Publicunder
Indianapolis, IN 30 No Uncertain Baseball Combination
Sacramento, CA 32 Yes 55,000 Football/Baseball Private
Charlotte, NC 36 Arena 25,000 Uncertain Public
Oklahoma City, OK 43 Yes 75,000 Football Combination
Albany, NY 46 Arena 15,000 Hockey/Basketball Combination
Scranton, NY 49 Arena 10,000 (minor league) Public8,000 to Baseball
Orlando, FL 51 Arena 17,000 Hockey/Basketball Public14,000 to
Knoxville, TN 60 Arena 25,000 College Basketball Combination
*according to population as of 1980.
8/7/2019 Stadiums Report
http://slidepdf.com/reader/full/stadiums-report 13/26
Edward B. Shils, “Report to the Philadelphia Professional Sports Consortium On Its Contribution to the24
Economy of Philadelphia,” mimeograph, January 18, 1985.
Greater Pittsburgh Chamber of Commerce, “Chamber Study Shows Pirate’s Economic Impact is $3325
Million—Up $12 Million Since 1976,” mimeograph, June 17, 1980.
Hal Lancaster, “Tale of Two Cities: Why Football Mesmerizes Baltimore, Indianapolis,” Wall Street 26
Journal, January 21, 1986, page 23.
-13-
III. A New Perspective on the Economic Effects of Sports
Supporters of stadium construction invariably emphasize the economic activity that
directly and indirectly emanates from the presence of a sports facility and events it hosts. Inparticular, stadium proponents assert that a city’s economy will benefit substantially if a
professional sports franchise can be secured as a stadium tenant. For example, a recent study by aUniversity of Pennsylvania researcher estimated that Philadelphia’s professional sports teamscontributed more than $500 million to the city’s economy in 1983. In another study, $33 million24
in economic activity in Pittsburgh in 1979 was found attributable to the baseball Pirates.25
Not all researchers agree that professional sports have a substantial impact on a city’seconomy. For example, a Baltimore researcher, appraising the economic impact the NFL Colts
had on Baltimore before bolting for the greener pastures of Indianapolis, estimated the team’soverall impact on the economy at approximately $200,000.26
The significant differences in these estimates can be explained, in part, by the advocacy
role for Philadelphia professional sports played by the Philadelphia study; the Baltimore study canbe viewed as a predictable reaction to the Colts’ rejection of that city. The two studies do,however, contain meaningfully different perspectives on how economies work . Because the publicstatements of city officials and stadium proponents appear to rely so heavily on economic
rationales, it is particularly important to consider the shortcomings of studies that purport to findsuch justifications for investment in sports.
Edward Shils’ Philadelphia study is, for two reasons, overly optimistic in its portrayal of the economic impact of sports. First, Shils assumes that spending on sports franchises reflects anincrease in aggregate consumer demand; presumably, such spending would not have occurred in
the absence of sports. That assumption, however, is questionable. The statistical analysis
summarized in Part IV lends strong support to a different hypothesis: that sports spending
simply diverts dollars from other leisure activities.
It is not difficult to understand why such diversion might occur. The leisure budget of afamily or an individual is limited, in terms of both money and time. It seems likely, then, that a
dollar spent at the Spectrum in Philadelphia may well be a dollar less spent at a movie theater inBucks County. Indeed, it is entirely plausible that sports spending may produce more than adollar-for-dollar reduction in spending on other leisure activities. A father’s attendance at a sports
event (or his merely watching that event on the home television set) consumes several hours of his
8/7/2019 Stadiums Report
http://slidepdf.com/reader/full/stadiums-report 14/26
-14-
personal leisure time budget. When the head of the household is a sports buff, the time and moneyspent on family leisure activities may decline.
The second reason for Shils’ false optimism is his failure to systematically consider thelong-term impact of stadiums and professional sports on a city’s economy. The establishment of
stadiums and professional sports in a city alters its economic landscape. An emphasis on sportswill encourage a development character in a city different than that identified for the larger regionof which that city is a part. This different economic character needs to be identified and evaluated.
It cannot be assumed that a city’s long-term interest is served by economic developmentinfluenced by sports.
In Part V below, the author again finds support for a hypothesis different from that offered
by city officials and stadium proponents: that any long-term economic development prompted
by sports will be in the service sector of the economy. Much of this development may merelyreflect a diversion from manufacturing or from the service sector in other parts of the region,
rather than true growth. Stadium construction or renovation may create construction
(manufacturing sector) employment in the short term, but in the long term the employmentassociated with sports events is clearly in the service sector: food, beverage, and souvenir
vendors, security personnel, neighborhood restaurants and hotels. While the nation’s economy asa whole may be moving in the direction of the service sector, a city that affirmatively pursues thatdevelopmental trend may find that its economy compares poorly to the rest of its region.
IV. Short-Term Effects of Sports Facilities and Teams
Does statistical analysis lend support to the hypothesis that spending on sports merelydiverts spending from other leisure activities (the short-term economic impact of sports)? The
author has used a statistical method known as regression analysis to examine the impact sportsstadiums and teams have on SMSA (Standard Metropolitan Statistical Area) income and retailsales. The statistical support for the author’s findings appears in the Appendix.
It is important to keep in mind that statistical analysis has its limitations; the results of astatistical analysis do not “prove”or “disprove”anything, but merely lend support to or cast doubt
on a hypothesis. Economic activity does not take place in a vacuum, but rather is the result of decision making on the part of many individuals whose purposes and methods cannot becompletely accounted for by statistical analysis.
In the regressions performed for this study, the existence of a sports franchise (baseball orfootball) or a stadium (new or renovated) are the “independent” variables. Each of these variables
is assigned a value of 0 (if no franchise or stadium exists) or 1 (if a franchise or stadium doesexist). These independent variables are said to have a statistically significant impact on the“dependent” variable (in the first regression below, SMSA income is the dependent variable) if it
is found that a change in the value of an independent variable results in a greater-than-zero
change in the value of the dependent variable.

8/7/2019 Stadiums Report
http://slidepdf.com/reader/full/stadiums-report 15/26
-15-
Regressions were run for nine cities (Cincinnati, Denver, Detroit, Kansas City, NewOrleans, Pittsburgh, San Diego, Seattle, and Tampa Bay—representing each of the major regions
defined by the Bureau of the Census) for data from 1965 through 1983. SMSA income statisticswere regressed on independent variables that capture the character of the city’s economy beforeand after the establishment of sports stadiums and teams.
The results of this first level of analysis were ambiguous. In Cincinnati, Denver, Detroit,and Seattle, the construction of a new stadium or rehabilitation of an old stadium did have a
statistically significant positive impact on SMSA income. In Cincinnati, however, the positiveimpact of the stadium was offset by a statistically significant negative impact associated withprofessional football. This finding is enigmatic, and it is even more puzzling in light of the fact that
the result was not repeated for any other city. This finding may be explained by the hypothesispresented earlier: that every dollar spent on professional football in Cincinnati induces more than adollar reduction in spending on other leisure activities.
For the remaining five cities in the analysis, stadium construction or renovation and the
securing of a professional football or baseball team failed to exert a significant influence on SMSAincome.
While the results yielded through this first regression were ambiguous, a secondregression—which used SMSA income as a fraction of regional income as the dependent
variable—produced a consistently surprising result. In seven of the nine cities analyzed,
stadium renovation or construction, or a city’s adoption of a professional football or
baseball team, was followed by a reduction in that city’s share of regional income.
The importance of considering the impact of stadiums and sports teams from a regional
perspective cannot be overstated. The construction or renovation of a stadium, or the presence of
a professional sports franchise, might well have a positive effect on the economy in the stadium’simmediate neighborhood. But at what cost to the rest of the city or to the region as a whole?
Perhaps a new restaurant will open up on the vicinity of a new sports stadium; it is, however, justas likely that an established restaurant fifteen blocks away will close its doors as a result. Is this
what stadium proponents consider “economic growth”?
The skeptic may argue that the stadium and/or professional sports variables inadvertently
capture the effect of general urban malaise on urban incomes. A population variable was,however, included in each regression in an effort to capture the impact of urban economiccontraction on city income. In this respect, the results of a third regression offer even stronger
support for the hypothesis that stadiums and professional sports have a negative impact on SMSAeconomic development relative t the region.
One would expect that a city’s income as a fraction of regional income (the “incomevariable”) would be significantly and directly correlated with changes in the city’s population as afraction of regional population (the “population variable”). In the regressions performed here, the
stadium and/or professional sports variables remained significantly correlated with the incomevariable even in the presence of the population variable. Such a result lends strength to the
8/7/2019 Stadiums Report
http://slidepdf.com/reader/full/stadiums-report 16/26
-16-
argument that professional sports and stadiums exert an impact on city incomes independent of
urban malaise.
The results of this third regression confirm the thesis that stadiums and professional sportsinduce a reduction in SMSA income as a percent of regional income. In five of the nine cities,
stadiums and professional sports had a significant negative impact; in the remaining four cities, thestadium and professional sports variables failed to exert a significant impact, positive or negative,
on city incomes. In no instance did a positive, significant correlation surface among
stadiums, professional sports, and city income as a fraction of regional income.
If individual SMSA statistics are pooled (“aggregated”), do stadiums and professional
sports in general affect city income? Aggregated regressions were performed based on the threeregressions discussed above. In addition, retail sales statistics in total and as a percentage of regional retail sales were considered as dependent variables in the new, aggregated regressions.
The set of SMSAs analyzed in the aggregated regressions includes Atlanta, Buffalo,
Cincinnati, Denver, Miami, New Orleans, San Diego, Seattle, and Tampa Bay. This set differsfrom that analyzed above. In Detroit, Kansas City, and Pittsburgh (those cities appearing in thefirst data set but excluded from the second), stadium construction/renovation or the adoption of amajor league franchise occurred prior to the first year for which retail sales data area available.
For that reason, it is not possible to examine statistically what impact the stadium or team mayhave had on the retail sales of these cities. Retail sales data for the selected SMSAs were availablefor the years 1967, 1972, 1977, and 1982.
The aggregated regressions yielded results similar to those found in the analysis of
individual SMSAs. Stadium construction or renovation may exert a positive influence on
SMSA income, but the positive stadium effect is offset by the negative influence on city
income induced by the presence of a professional baseball team. As one might expect, thesame pattern emerges in an analysis of the relationship between city retail sales and the stadium
and professional baseball variables. Professional football does not have a statistically
significant impact on either city income or retail sales; this result was expected since only
eight “home games” are scheduled for professional football teams during the regular season. Inprofessional baseball, on the other hand, there are eighty-one games hosted by a major league cityduring the regular season.
Finally, the stadium variable was not found to have a significant effect on SMSA incomeas a fraction of regional income; the same insignificant result was found for the stadium variable’s
impact on city retail sales as a fraction of regional retail sales. The professional baseball variabledid exert a negative impact on city income as a fraction of regional income, but this result is likelyto occur randomly 20 percent of the time. Similarly, the professional football variable exerted a
positive impact on city retail sales as a fraction of regional retail sales, but such a result is alsolikely to occur randomly 20 percent of the time.
In summary, Shils’ contention that professional sports contribute mightily to a city’seconomy is questionable. In four out of nine cities surveyed, the stadium variable, which
8/7/2019 Stadiums Report
http://slidepdf.com/reader/full/stadiums-report 17/26
Ibid.27
-17-
presumably captures the economic multiplier triggered by professional sports, exercised asignificant impact on a city’s income. However, in the case of Cincinnati, the economic benefit
associated with the stadium was more than negated by the significantly negative impact exerted by
the professional football variable. In five cities the stadium variable proved insignificant.
Furthermore, the stadium or a professional sports variable consistently correlated with a
decline in a sports-minded city’s fraction of regional income.
V. Long-Term Effects of Sports Facilities and Teams
Proponents of publicly built sports facilities argue that stadiums and professional sports
bring business to a community. The immediate impact exerted by stadiums and sports wasanalyzed in Part IV of this paper, and was found generally to be insignificant.
But the impact of stadiums and professional sports is thought by some to go beyond the
immediate impact already analyzed; they are seen as magnets for other businesses. A recent NewYork Times article noted the potential benefits stadium enthusiasts define. “Supporters of a domed
stadium in downtown (Buffalo) say that in addition to promoting civic pride and tourism, it wouldalso create construction jobs and attract many other jobs to the area, which has the state’s highestunemployment rate.” Do stadiums function as economic catalysts? In this section of the paper,27
the author finds statistical support for his hypothesis that stadiums and sports facilities merelydivert economic development from the manufacturing sector to the service sector of a city’seconomy.
Eight cities—Buffalo, Cincinnati, Denver, Miami, New Orleans, San Diego, Seattle, andTampa Bay—were selected for analysis in this part of the study. Cities in the data set were
selected on the basis of data availability and the timing of stadium construction or team adoption.Data for the years 1965 through 1978 were used, and construction or adoption had to occur
between those years for meaningful statistical analysis. For each SMSA an attempt was made todetermine if the presence of a renovated or new stadium or a professional sports franchise had astatistically significant impact on one of three dependent variables: (1) SMSA manufacturing
employment as a percentage of the region; (2) manufacturing value added as a percentage of theregion; or (3) capital formation in the manufacturing sector as a percentage of regional capitalformation. Again, statistical support for the conclusions outlined below is presented in the
Appendix.
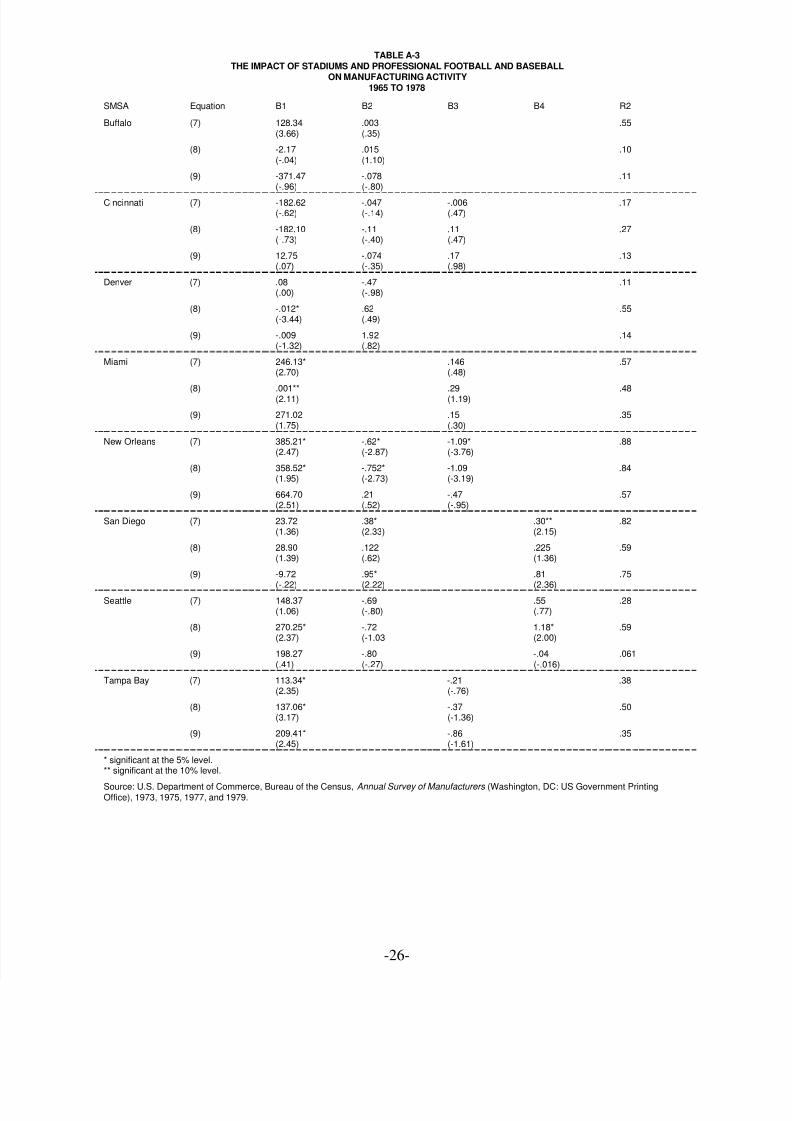
The results of the statistical analysis lend strong support to the author’s secondhypothesis, that stadiums and professional sports tend to divert economic development toward theservice sector. Only in a region where several cities are pursuing similar developmental paths didthe stadium and professional sports variables have a significant positive impact.
8/7/2019 Stadiums Report
http://slidepdf.com/reader/full/stadiums-report 18/26
-18-
Many West Coast cities built stadiums and attracted teams in the 1960s, suggesting thatthe region as a whole was moving toward a service economy. In the regressions performed here,
only in the cases of San Diego and Seattle was there a significant positive correlation between anyof the independent variables representing manufacturing activity and the stadium and sportsvariables. San Diego’s renovation of its stadium and its marriage to the baseball Padres both
appeared to induce capital formation and increase the city’s share of regional employment in themanufacturing sector. In Seattle, the presence of the baseball mariners appeared to contributepositively to the city’s share of regional manufacturing value added.
the only other significant correlation occurred in New Orleans, where employment andvalue added as a percentage of the region declined after the Superdome was built and after the
football Saints took up residence. It is possible that the completion of the nation’s largest, mostexpensive domed stadium eliminated a significant number of construction jobs, and activity itdiverted from the manufacturing sector. In the case of Saints football, it could be that activity has
been diverted from the manufacturing sector to the service sector. This result conforms tofindings presented earlier.
VI. Summary and Conclusions
The sports stadium is perhaps the icon of twentieth century America. Whetherconstructing cathedrals in the Middle Ages or superdomes in modern cities in the United States,
financing icons was and is an issue. Stadiums in the United States have a mixed history of privateand public sponsorship reflecting changing perceptions of the economic soundness of suchprojects. Despite questionable economics, stadiums have a past and a future. Sports are so
intimately woven into the fabric of our culture that it seems inconceivable that stadiums will notbe constructed in which to showcase our social jewels. Yet the rationale offered in defense of public subsidization of stadiums is decidedly economic. The findings of this study do not,
however, consistently support an economic rationale.
During the 1960s and early 1970s the private sector all but deserted the stadium scene.
Such a widespread retreat suggests that the stadium benefits appropriable by the private sectorwere insufficient to cover costs, or that the private sector had discovered how accommodating thepublic sector could be in subsidizing stadiums for its sports teams. Popular belief in the benefits
associated with stadiums and the sports they host has produced an intense municipal competitionfor a sports presence. As a result, stadiums have expanded in scale, grandeur, and cost, while the
competition for teams has whittled away at the benefits municipalities could hope to derive fromthem. Despite this, a third of the sixty largest municipalities in the United States are building orplanning to build stadiums, and almost all believe their plans are economically justifiable.
The results of this study suggest that the economic “growth” spurred by sports franchisesor stadiums is not likely to be true growth at all, but merely “realignment.” Jobs are not created,
but diverted from the manufacturing economy to the service economy, or from higher-skilled tolower-skilled (and lower-paid) occupations. Similarly, spending on sports activities may only
8/7/2019 Stadiums Report
http://slidepdf.com/reader/full/stadiums-report 19/26
-19-
divert spending from other leisure activities, and new business start-ups in the neighborhood of astadium may be negated by business failures in other areas of the city.
Contrary to the claims of city officials, this study has found that sports and stadiumsfrequently had no significant positive impact on a city’s economy and, in a regional context, may
actually contribute to a reduction in a sports-minded city’s share of regional income. The resultspresented here suggest that it must not be assumed that subsidization of sports or stadiums
by the public sector is economically sound. It remains to be seen if the private sector by tappinginto potential revenue streams (the sale or leasing of luxury stadium space or integration of the
stadium into larger development schemes) can appropriate benefits sufficient to justify massiveinvestments in teams and their facilities.
# # #
Robert A. Baade is the James D. Vail Associate Professor of Economics at Lake Forest College,
Illinois. During 1985 and 1986 he served as chairman of the Chicago Metropolitan PlanningCouncil’s Committee to Determine Costs and Benefits of a New Sports Stadium in Chicago.
Published by The heartland Institute as the thirteenth in a series of in-depth studies concerningimportant issues in the Midwest. Nothing in a Heartland Policy Study should be construed as
necessarily reflecting the views of The Heartland Institute or as an attempt to aid or hinder thepassage of any legislation.
Copyright 1986 by The Heartland Institute.
8/7/2019 Stadiums Report
http://slidepdf.com/reader/full/stadiums-report 20/26
-20-
APPENDIX
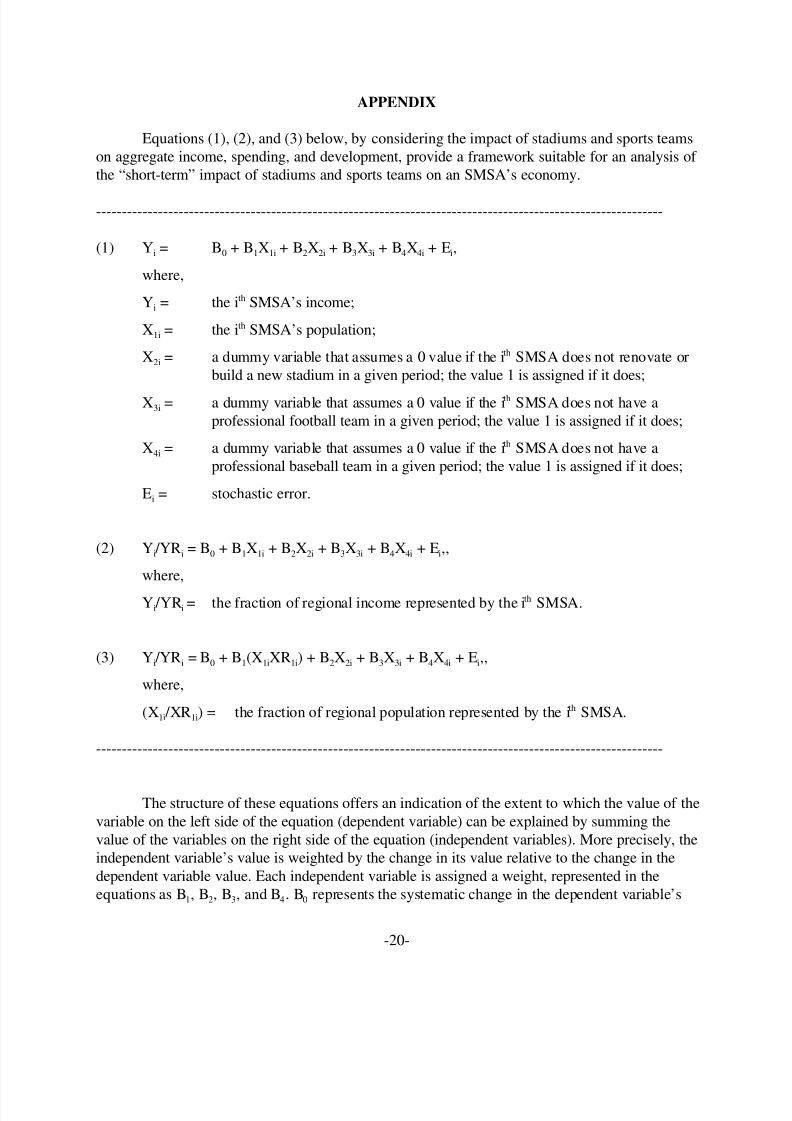
Equations (1), (2), and (3) below, by considering the impact of stadiums and sports teamson aggregate income, spending, and development, provide a framework suitable for an analysis of the “short-term” impact of stadiums and sports teams on an SMSA’s economy.
--------------------------------------------------------------------------------------------------------------
(1) Y = B + B X + B X + B X + B X + E ,i 0 1 1i 2 2i 3 3i 4 4i i
where,
Y = the i SMSA’s income;ith
X = the i SMSA’s population;1ith
X = a dummy variable that assumes a 0 value if the i SMSA does not renovate or2ith
build a new stadium in a given period; the value 1 is assigned if it does;
X = a dummy variable that assumes a 0 value if the i SMSA does not have a3ith
professional football team in a given period; the value 1 is assigned if it does;
X = a dummy variable that assumes a 0 value if the i SMSA does not have a4ith
professional baseball team in a given period; the value 1 is assigned if it does;
E = stochastic error.i
(2) Y /YR = B + B X + B X + B X + B X + E ,,i i 0 1 1i 2 2i 3 3i 4 4i i
where,
Y /YR = the fraction of regional income represented by the i SMSA.i ith
(3) Y /YR = B + B (X XR ) + B X + B X + B X + E ,,i i 0 1 1i 1i 2 2i 3 3i 4 4i i
where,
(X /XR ) = the fraction of regional population represented by the i SMSA.1i 1ith
--------------------------------------------------------------------------------------------------------------
The structure of these equations offers an indication of the extent to which the value of the
variable on the left side of the equation (dependent variable) can be explained by summing thevalue of the variables on the right side of the equation (independent variables). More precisely, theindependent variable’s value is weighted by the change in its value relative to the change in the
dependent variable value. Each independent variable is assigned a weight, represented in theequations as B , B , B , and B . B represents the systematic change in the dependent variable’s1 2 3 4 0
8/7/2019 Stadiums Report
http://slidepdf.com/reader/full/stadiums-report 21/26
-21-
value explained by all the independent variables included in the equation.
A value for the dependent variable is first predicted by adding the appropriately weightedindependent variable values to B . The difference between the predicted and actual value for the0
dependent variable is the random or stochastic error, represented by E . In Table A-1, the Ri2
indicates the fraction of the variation in the dependent variable’s value “explained” by eachequation. If R equals one, then all the variation in the dependent variable’s value is explained by2
changes in the value of the dependent variables weighted and summed.
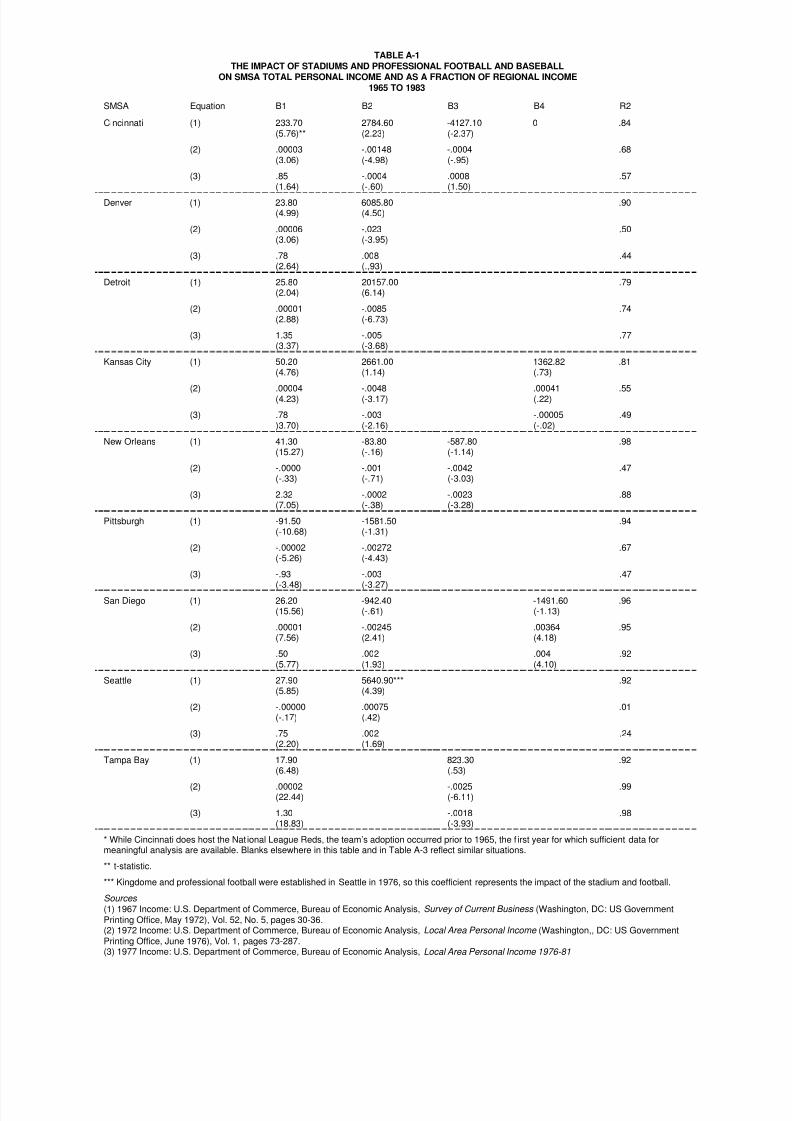
In the regression analysis performed to get the results presented in Table A-1, SMSAincome statistics were regressed on independent variables that capture the character of the city’s
economy before and after the establishment of sports stadiums and teams. Regressions were runfor nine cities representing each of the major regions defined by the Bureau of the Census for datafrom 1965 through 1983. The results of the analysis are recorded in Table A-1.
8/7/2019 Stadiums Report
http://slidepdf.com/reader/full/stadiums-report 22/26
TABLE A-1THE IMPACT OF STADIUMS AND PROFESSIONAL FOOTBALL AND BASEBALL
ON SMSA TOTAL PERSONAL INCOME AND AS A FRACTION OF REGIONAL INCOME1965 TO 1983
SMSA Equation B1 B2 B3 B4 R2
Cincinnati (1) 233.70 2784.60 -4127.10 0 .84(5.76)** (2.23) (-2.37)
(2) .00003 -.00148 -.0004 .68(3.06) (-4.98) (-.95)
(3) .85 -.0004 .0008 .57(1.64) (-.60) (1.50)
Denver (1) 23.80 6085.80 .90(4.99) (4.50)
(2) .00006 -.023 .50(3.06) (-3.95)
(3) .78 .008 .44(2.64) (.,93)
Detroit (1) 25.80 20157.00 .79(2.04) (6.14)
(2) .00001 -.0085 .74(2.88) (-6.73)
(3) 1.35 -.005 .77(3.37) (-3.68)
Kansas City (1) 50.20 2661.00 1362.82 .81(4.76) (1.14) (.73)
(2) .00004 -.0048 .00041 .55(4.23) (-3.17) (.22)
(3) .78 -.003 -.00005 .49)3.70) (-2.16) (-.02)
New Orleans (1) 41.30 -83.80 -587.80 .98(15.27) (-.16) (-1.14)
(2) -.0000 -.001 -.0042 .47(-.33) (-.71) (-3.03)
(3) 2.32 -.0002 -.0023 .88(7.05) (-.38) (-3.28)
Pittsburgh (1) -91.50 -1581.50 .94(-10.68) (-1.31)
(2) -.00002 -.00272 .67(-5.26) (-4.43)
(3) -.93 -.003 .47
(-3.48) (-3.27)San Diego (1) 26.20 -942.40 -1491.60 .96
(15.56) (-.61) (-1.13)
(2) .00001 -.00245 .00364 .95(7.56) (2.41) (4.18)
(3) .50 .002 .004 .92(5.77) (1.93) (4.10)
Seattle (1) 27.90 5640.90*** .92(5.85) (4.39)
(2) -.00000 .00075 .01(-.17) (.42)
(3) .75 .002 .24(2.20) (1.69)
Tampa Bay (1) 17.90 823.30 .92(6.48) (.53)
(2) .00002 -.0025 .99(22.44) (-6.11)
(3) 1.30 -.0018 .98(18.83) (-3.93)
* While Cincinnati does host the Nat ional League Reds, the team’s adoption occurred prior to 1965, the f irst year for which sufficient data formeaningful analysis are available. Blanks elsewhere in this table and in Table A-3 reflect similar situations.
** t-statistic.
*** Kingdome and professional football were established in Seattle in 1976, so this coefficient represents the impact of the stadium and football.
Sources (1) 1967 Income: U.S. Department of Commerce, Bureau of Economic Analysis, Survey of Current Business (Washington, DC: US GovernmentPrinting Office, May 1972), Vol. 52, No. 5, pages 30-36.(2) 1972 Income: U.S. Department of Commerce, Bureau of Economic Analysis, Local Area Personal Income (Washington,, DC: US GovernmentPrinting Office, June 1976), Vol. 1, pages 73-287.(3) 1977 Income: U.S. Department of Commerce, Bureau of Economic Analysis, Local Area Personal Income 1976-81
8/7/2019 Stadiums Report
http://slidepdf.com/reader/full/stadiums-report 23/26
-23-
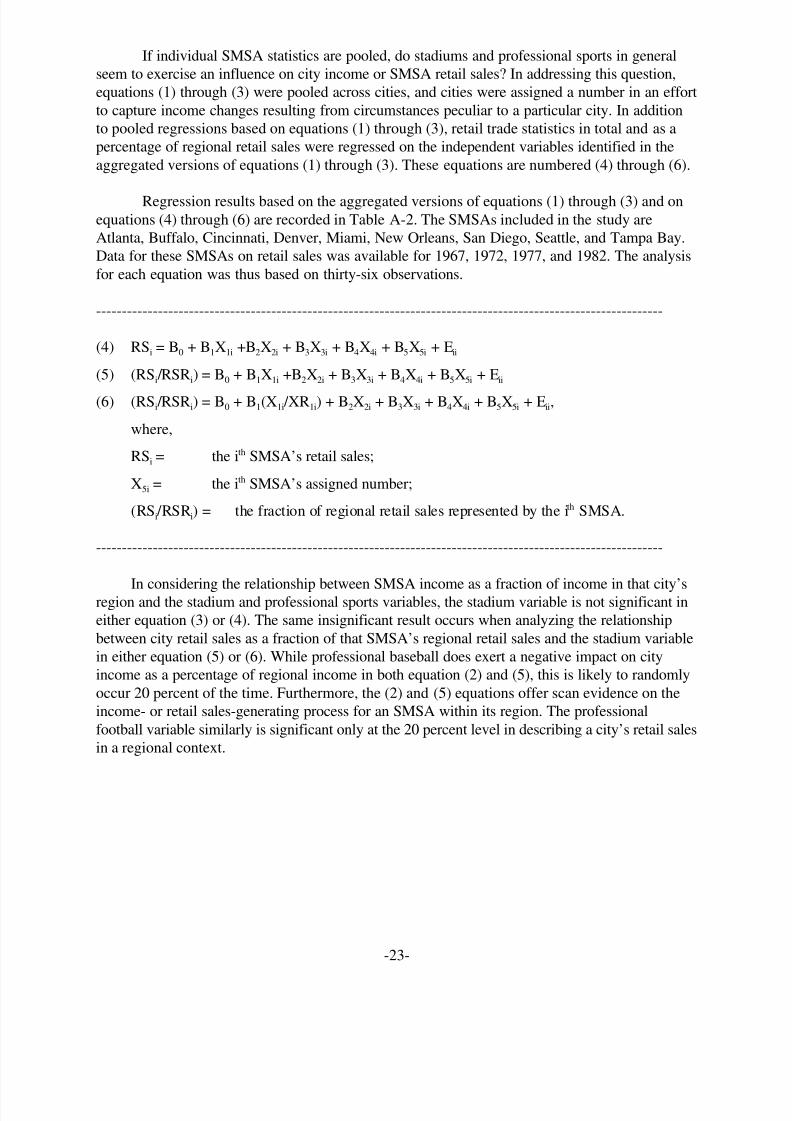
If individual SMSA statistics are pooled, do stadiums and professional sports in generalseem to exercise an influence on city income or SMSA retail sales? In addressing this question,equations (1) through (3) were pooled across cities, and cities were assigned a number in an effort
to capture income changes resulting from circumstances peculiar to a particular city. In additionto pooled regressions based on equations (1) through (3), retail trade statistics in total and as apercentage of regional retail sales were regressed on the independent variables identified in the
aggregated versions of equations (1) through (3). These equations are numbered (4) through (6).
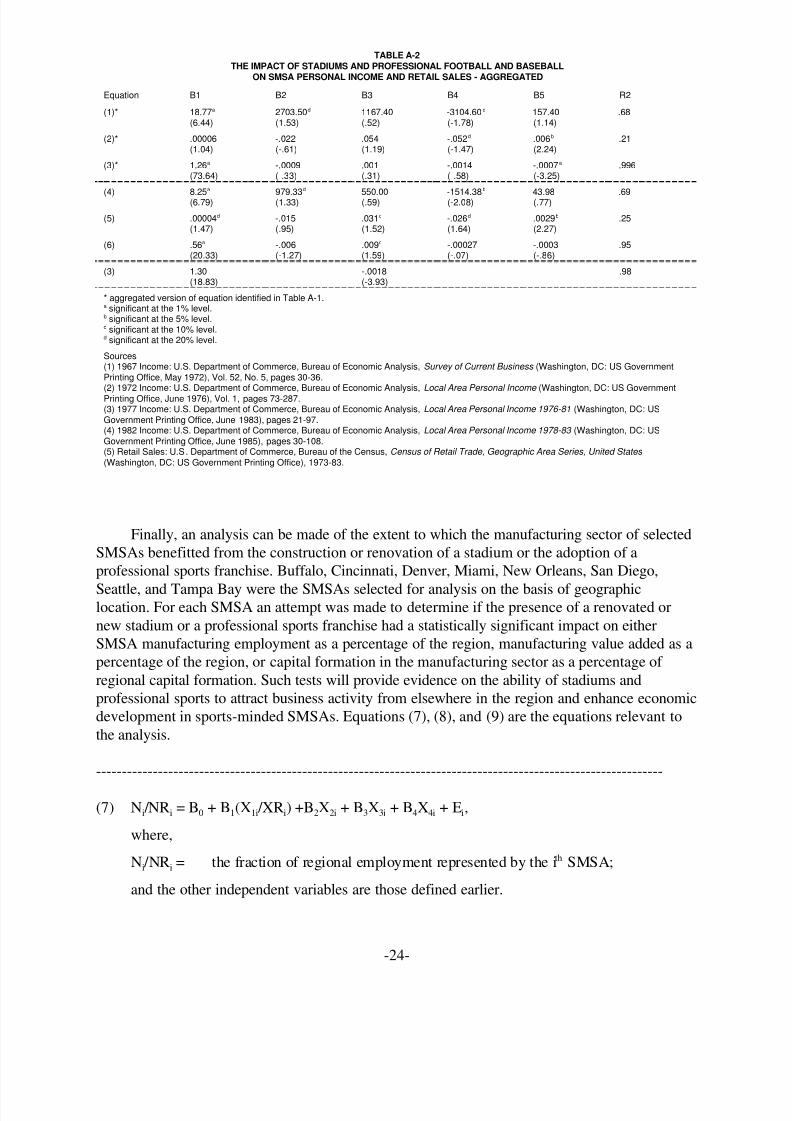
Regression results based on the aggregated versions of equations (1) through (3) and onequations (4) through (6) are recorded in Table A-2. The SMSAs included in the study areAtlanta, Buffalo, Cincinnati, Denver, Miami, New Orleans, San Diego, Seattle, and Tampa Bay.Data for these SMSAs on retail sales was available for 1967, 1972, 1977, and 1982. The analysis
for each equation was thus based on thirty-six observations.
--------------------------------------------------------------------------------------------------------------
(4) RS = B + B X +B X + B X + B X + B X + Ei 0 1 1i 2 2i 3 3i 4 4i 5 5i ii
(5) (RS /RSR ) = B + B X +B X + B X + B X + B X + Ei i 0 1 1i 2 2i 3 3i 4 4i 5 5i ii
(6) (RS /RSR ) = B + B (X /XR ) + B X + B X + B X + B X + E ,i i 0 1 1i 1i 2 2i 3 3i 4 4i 5 5i ii
where,
RS = the i SMSA’s retail sales;ith
X = the i SMSA’s assigned number;5ith
(RS /RSR) = the fraction of regional retail sales represented by the i SMSA.i ith
--------------------------------------------------------------------------------------------------------------
In considering the relationship between SMSA income as a fraction of income in that city’sregion and the stadium and professional sports variables, the stadium variable is not significant ineither equation (3) or (4). The same insignificant result occurs when analyzing the relationship
between city retail sales as a fraction of that SMSA’s regional retail sales and the stadium variablein either equation (5) or (6). While professional baseball does exert a negative impact on cityincome as a percentage of regional income in both equation (2) and (5), this is likely to randomly
occur 20 percent of the time. Furthermore, the (2) and (5) equations offer scan evidence on theincome- or retail sales-generating process for an SMSA within its region. The professional
football variable similarly is significant only at the 20 percent level in describing a city’s retail salesin a regional context.
8/7/2019 Stadiums Report
http://slidepdf.com/reader/full/stadiums-report 24/26
-24-
TABLE A-2THE IMPACT OF STADIUMS AND PROFESSIONAL FOOTBALL AND BASEBALL
ON SMSA PERSONAL INCOME AND RETAIL SALES - AGGREGATED
Equation B1 B2 B3 B4 B5 R2
(1)* 18.77 2703.50 1167.40 -3104.60 157.40 .68a
(6.44) (1.53) (.52) (-1.78) (1.14)
d c
(2)* .00006 -.022 .054 -.052 .006 .21(1.04) (-.61) (1.19) (-1.47) (2.24)
d b
(3)* 1.26 -.0009 .001 -.0014 -.0007 .996a
(73.64) (-.33) (.31) (-.58) (-3.25)
a
(4) 8.25 979.33 550.00 -1514.38 43.98 .69
a
(6.79) (1.33) (.59) (-2.08) (.77)
d b
(5) .00004 -.015 .031 -.026 .0029 .25d
(1.47) (.95) (1.52) (1.64) (2.27)
d d b
(6) .56 -.006 .009 -.00027 -.0003 .95a
(20.33) (-1.27) (1.59) (-.07) (-.86)
d
(3) 1.30 -.0018 .98(18.83) (-3.93)
* aggregated version of equation identified in Table A-1.significant at the 1% level.a
significant at the 5% level.b
significant at the 10% level.c
significant at the 20% level.d
Sources(1) 1967 Income: U.S. Department of Commerce, Bureau of Economic Analysis, Survey of Current Business (Washington, DC: US GovernmentPrinting Office, May 1972), Vol. 52, No. 5, pages 30-36.(2) 1972 Income: U.S. Department of Commerce, Bureau of Economic Analysis, Local Area Personal Income (Washington, DC: US GovernmentPrinting Office, June 1976), Vol. 1, pages 73-287.(3) 1977 Income: U.S. Department of Commerce, Bureau of Economic Analysis, Local Area Personal Income 1976-81 (Washington, DC: USGovernment Printing Office, June 1983), pages 21-97.(4) 1982 Income: U.S. Department of Commerce, Bureau of Economic Analysis, Local Area Personal Income 1978-83 (Washington, DC: USGovernment Printing Office, June 1985), pages 30-108.(5) Retail Sales: U.S. Department of Commerce, Bureau of the Census, Census of Retail Trade, Geographic Area Series, United States (Washington, DC: US Government Printing Office), 1973-83.
Finally, an analysis can be made of the extent to which the manufacturing sector of selectedSMSAs benefitted from the construction or renovation of a stadium or the adoption of aprofessional sports franchise. Buffalo, Cincinnati, Denver, Miami, New Orleans, San Diego,
Seattle, and Tampa Bay were the SMSAs selected for analysis on the basis of geographiclocation. For each SMSA an attempt was made to determine if the presence of a renovated or
new stadium or a professional sports franchise had a statistically significant impact on eitherSMSA manufacturing employment as a percentage of the region, manufacturing value added as apercentage of the region, or capital formation in the manufacturing sector as a percentage of
regional capital formation. Such tests will provide evidence on the ability of stadiums andprofessional sports to attract business activity from elsewhere in the region and enhance economicdevelopment in sports-minded SMSAs. Equations (7), (8), and (9) are the equations relevant to
the analysis.
--------------------------------------------------------------------------------------------------------------
(7) N /NR = B + B (X /XR ) +B X + B X + B X + E ,i i 0 1 1i i 2 2i 3 3i 4 4i i
where,
N /NR = the fraction of regional employment represented by the i SMSA;i ith
and the other independent variables are those defined earlier.

8/7/2019 Stadiums Report
http://slidepdf.com/reader/full/stadiums-report 25/26
-25-
(8) VA /VAR = B + B (X /XR ) +B X + B X + B X + Ei i 0 1 1i i 2 2i 3 3i 4 4i i
(9) dK/dKR = B + B (X /XR ) +B X + B X + B X + E .i 0 1 1i i 2 2i 3 3i 4 4i i
--------------------------------------------------------------------------------------------------------------
Regressions based on equations (7) through (9) were performed for each of the eight cities
for 1965 through 1978. The results are recorded in Table A-3.
8/7/2019 Stadiums Report
http://slidepdf.com/reader/full/stadiums-report 26/26
TABLE A-3THE IMPACT OF STADIUMS AND PROFESSIONAL FOOTBALL AND BASEBALL
ON MANUFACTURING ACTIVITY1965 TO 1978
SMSA Equation B1 B2 B3 B4 R2
Buffalo (7) 128.34 .003 .55(3.66) (.35)
(8) -2.17 .015 .10(-.04) (1.10)
(9) -371.47 -.078 .11(-.96) (-.80)
Cincinnati (7) -182.62 -.047 -.006 .17(-.62) (-.14) (.47)
(8) -182.10 -.11 .11 .27(-.73) (-.40) (.47)
(9) 12.75 -.074 .17 .13(.07) (-.35) (.98)
Denver (7) .08 -.47 .11(.00) (-.98)
(8) -.012* .62 .55(-3.44) (.49)
(9) -.009 1.92 .14(-1.32) (.82)
Miami (7) 246.13* .146 .57(2.70) (.48)
(8) .001** .29 .48(2.11) (1.19)
(9) 271.02 .15 .35(1.75) (.30)
New Orleans (7) 385.21* -.62* -1.09* .88(2.47) (-2.87) (-3.76)
(8) 358.52* -.752* -1.09 .84(1.95) (-2.73) (-3.19)
(9) 664.70 .21 -.47 .57(2.51) (.52) (-.95)
San Diego (7) 23.72 .38* .30** .82(1.36) (2.33) (2.15)
(8) 28.90 .122 .225 .59(1.39) (.62) (1.36)
(9) -9.72 .95* .81 .75
(-.22) (2.22) (2.36)Seattle (7) 148.37 -.69 .55 .28
(1.06) (-.80) (.77)
(8) 270.25* -.72 1.18* .59(2.37) (-1.03 (2.00)
(9) 198.27 -.80 -.04 .061(.41) (-.27) (-.016)
Tampa Bay (7) 113.34* -.21 .38(2.35) (-.76)
(8) 137.06* -.37 .50(3.17) (-1.36)
(9) 209.41* -.86 .35(2.45) (-1.61)
* significant at the 5% level.** significant at the 10% level.
Source: U.S. Department of Commerce, Bureau of the Census, Annual Survey of Manufacturers (Washington, DC: US Government PrintingOffice), 1973, 1975, 1977, and 1979.