staff absence analysis report - los angeles unified...
TRANSCRIPT

STAFF ABSENCE ANALYSIS REPORT User’s Guide – Site Administrators
1

Outline I. Introduction II. Getting Started III. Basics IV. Exporting
2

Welcome • Promoting excellent attendance is one of the District’s highest
priorities • This Guide will assist you in extracting attendance data for your
location • Information can be used to identify absence patterns and other
attendance issues • It will help you make informed decisions about providing
supportive assistance and guidance to your staff, designating Family and Medical Leave Act (FMLA) as appropriate, following through with appropriate progressive discipline and most importantly, recognizing excellent employee attendance
3

LAUSD Board of Education Expectations • Employees maintain regular attendance and avoid absenteeism; • Employees work every hour they are assigned; • Employees to be at their work stations on time every working day; • Employees comply with legal restrictions, LAUSD policy and
procedures, and respective collective bargaining rules regarding reporting of absence and providing appropriate documentation;
• Supervisors explain and insist upon regular attendance, maintain accurate records, monitor employee attendance, provide performance feedback and enforce all employee attendance policies and standards through employee evaluations and discipline processes;
• The District will make every attempt to avoid scheduling activities that contribute to staff absenteeism.
4

The Report Your ultimate goal is to produce an Excel report that provides absence and attendance data for a given set of employees over a specific period of time. The final report will look like this, perhaps with more or fewer columns.
5

Security Access Form Fill in the SAP Security Access Form which can be found at http://notebook.lausd.net/portal/page?_pageid=33,201462&_dad=ptl
6

Security Role Selection
• Choose the role as indicated
• If this role isn’t an option select any role that doesn’t require justification
7

Final Confirmation
Confirm selection and print
8

Finalize Form and Submit • On the copy of the form next to the Selected Roles write
in BH161; if you selected “any role” just cross that out • Get Manager Approval (Endorsement Section of Form) • Fax to (213) 241-8020 for processing which takes about
4-5 business days
9

Getting Started Log onto BASE Portal; Click on Reports
10

Reports Tab All BW reports have been moved to the Reports tab. Reports will be organized by module or process; click on School
11

BW Security Roles Users will see tabs, folders, reports based on their security roles; click on Attendance
12

Basics
• Variable Entry • Key Figures • Free Characteristics • Analysis Area • Context Menu • Print
13

Variable Entry – Starting Point
14
• Variable Entry Screen allows users to enter filter criteria prior to running report.
• Selection criteria can usually be typed in or selected by clicking on the selection button
• Note: Calendar Month/Year Section Required
• Hint: if typing in filter values, separate multiple entries with a semi-colon (;)

Variable Entry Continued
• In most cases, Cost Center or Fund Center is prepopulated based on your assigned Cost Center.
• You must enter Calendar Month/Year Selection by typing in month/year or click on selection button (see next page for how to use Selection Button)
• To verify filter selection click on
• To run report click on
15

Calendar Month/Year Selection Button Clicking on the Selection Button for Calendar Month/Year takes you to this screen You add or remove any combination of month/year
16

Default Layout
• Key Figures • Free
Characteristics • Analysis Area
17
From the Variable Entry screen you clicked on OK to run your report. The Default Layout looks like this.

Build Report by Modifying Default Layout In order to build the report you want, you can modify the default layout by adding or deleting data values You can modify the Default Layout by:
• Adding or deleting Key Figures • Adding or deleting Free Characteristics
You can modify Key Figures and Free Characteristics by:
• Context Menu • Drag and Drop
All of these will be covered in the next pages
18

Context Menu • Right clicking on any Key
Figure or Free Characteristic provides ability to: • Go Back • Filter • Change Drilldown • Sort
19

Context Menu - Back
• Back can be used to go Back One Navigation Step or Back to Start
• Back One Navigation Step removes the last “action”
• Back to Start returns the report to the original, default layout
20
Right clicking on any Key Figure or Free Characteristic to go back.

Context Menu - Filter Right clicking on any Key Figure or Free Characteristic located in blue area on left side of screen provides 3 options: Select Filter Value: Adds another filter on report data Remove Filter Value: If a filter value has already been selected, Remove Filter Value will remove all filter values for that field. Variable Screen: Opens Variable Entry Page for changing variable filter criteria
21

22
Context Menu – Change Drilldown Choose Drilldown by Horizontal (Columns) /Vertical (Rows) to add a field from Free Characteristics to the Analysis Area

Context menu – change drilldown
• Swap can be used to swap one field with another
23
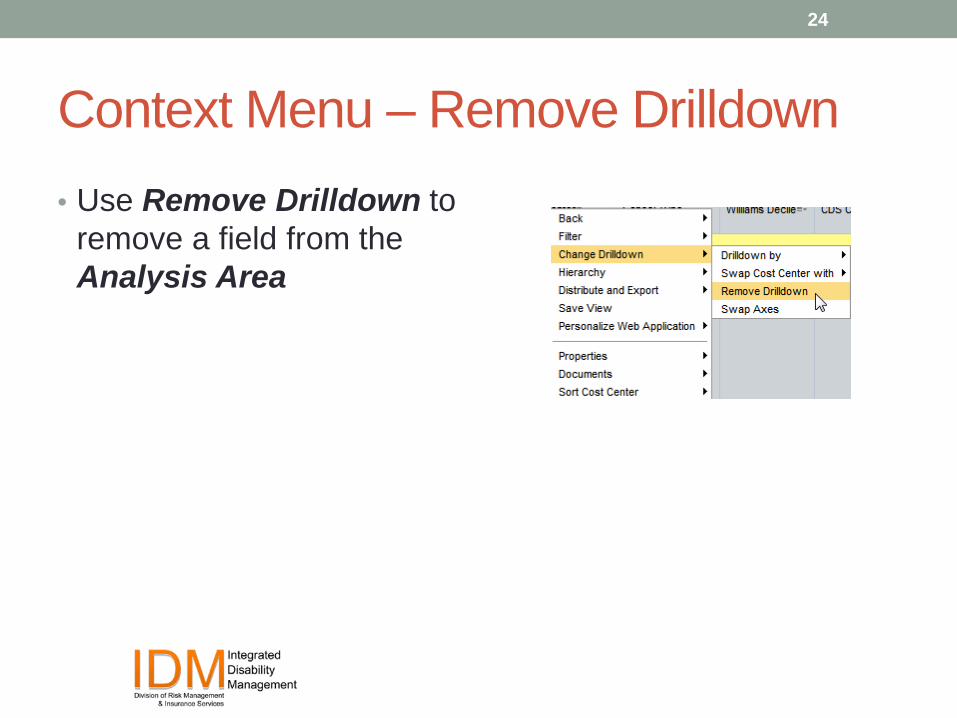
Context Menu – Remove Drilldown • Use Remove Drilldown to
remove a field from the Analysis Area
24

Key Figures • Key figures are arranged in
columns across the page
• Go to other pages to see additional columns.
• Select only those fields that are useful to you. This will allow you to see important fields on the first page.
25

Filter Key Figures
All fields in the lift blue column can be filtered. • Right click on the field to be filtered. • To Filter Variables, click on Select
Filter Value. • To Remove Filter Value, click on
Remove Filter Value. • Clicking on Variable Screen takes
you back to the first screen
26

Select Values • Select Values allows users to select
single values or multiple values. Users can also change the order of values.
• Select Key Figure by clicking on the field.
• Add field by click on Add button
• Remove field by clicking on Remove button
• To change order highlight field and click button to move up or down.
• To finish, click on OK button
27

Free Characteristics • Free Characteristics
are additional fields that can be added to the Analysis Area (rows/columns)
• Free Characteristics are additional fields that can be filtered on (regardless of whether they are in the Analysis Area or not)
28

Analysis Area
• The Analysis Area represents the report data
• The Analysis Area is defaulted to a layout that is pre-defined by Absence Management
• The Analysis Area can be changed by dragging and dropping fields, filtering, sorting, etc.
29

Analysis Area – Drag & Drop Fields
30
Add or delete Fields from Free Characteristics by Drag & Drop You can also sort Fields from high to low or low to high

Printing
• Print using Print Version
• Print using Excel Export (Preferred Option)
31

Export to Microsoft Excel
32
Click on Export to Microsoft Excel
Click on Open or Save

Excel Report
33
When you open the Excel document you will see the following warning. Click Yes.
The unformatted Excel Report looks like this. Rename the file and save as an Excel Workbook in the location of your choice.

Support For additional support: • Check out our website at disabilitymanagment.lausd.net or • Call our main line to leave a message (213) 241-3954
34