staff health: it’s all about me! - pima county, arizona · staff health: it’s all about me! ......
TRANSCRIPT

“Funded in part by the Bureau of Women’s and Children’s Health as made available through the Arizona Department of Health Services. This project
is supported by funds from the Department of Health and Human Services (DHHS), Health Resources and Services Administration, Maternal and Child
Health Bureau, under grant number 93.994”
Staff Health: It’s All About Me!
Child Care Staff Health A Report to Arizona Department of Health Services Bureau of Women’s and Children’s Health Prepared by Pima County Health Department Public Health Nursing Child Care Health Consultation Program

Staff Health: It’s All About Me!
Rethinking Quality in Child Care
“It is our contention that good physical and mental health is a precur-sor to any measure of quality in early childhood educational pro-grams – not only physical and mental health of the children enrolled, but as importantly, the health of adults who care for, teach, and nur-ture them each day.” Rene Gratz and Anne Claffey -1996
The thought that the health and safety of staff members has an impact on
and consequences for child care programming is not new. As Rene Gratz,
and Anne Claffey noted in 1996: “Quality child care is dependent upon a
quality workforce. The empirical investigation of adult health in child care
is important documentation on which to frame training, policies, and pro-
cedures for both center-based and family home care. It is our contention
that good physical and mental health is a precursor to any measure of
quality in early childhood educational programs – not only physical and
mental health of the children enrolled, but as importantly, the health of
adults who care for, teach, and nurture them each day.” (Gratz R, Claffey
A. Adult health in child care: health status, behaviors, and concerns of
teachers, directors, and family care providers. Early Childhood Research
Quarterly 1996)
Foreword
“What do we know about the health status of child care staff?
It was the juxtaposition of three events that led to the question, “What
do we know about the health status and health concerns of the staff that
care for children in Pima County child care programs, and in the next
year what can Pima County Health Department Child Care Health Con-
sultants do to improve the health status of child care staff.
The first heads-up was the inability of state level agencies to provide in-
formation that would help to address the question. While able to report
knowledgeably about the educational status of child care providers, in-
formation regarding staff age, lifestyle issues, and health concerns was
not available.
Special thanks to Babs Johnson,
epidemiologist, muse and mentor
for her assistance in making sense
of the data.

Building Adult Capabilities to Improve
Child Outcomes: A Theory of Change
WEB SOLUTIONS
http://developingchild.harvard.edu/
resources/multimedia/videos/
theory_of_change/
Giving from an Empty Sack
Many caregivers are being asked to “give
from an empty sack.” That is they are
asked to nurture, support and teach chil-
dren healthy habits when their own lives
are chaotic, under-resourced, and do not
reflect healthy habits or the good health
required to manage a busy room full of
active, inquisitive minds.
Second was a short five minute video “Building Adult Capabilities to Im-
prove Child Outcomes: A Theory of Change” produced by the Center on
the Developing Child at Harvard University which describes the need to
focus on building the capabilities of all adults in a child’s life and strength-
ening the communities that together form the environment of relation-
ships essential to children's lifelong learning, health, and behavior. This
added to a growing awareness that the current focus solely on children’s
needs did not acknowledge that caregivers’ unmet needs remain a barrier
to moving quality child care forward in Arizona. Many caregivers are be-
ing asked to “give from an empty sack.” That is they are asked to nurture,
support and teach children healthy habits when their own lives are cha-
otic, under-resourced, and do not reflect healthy habits or possess the
health required to manage a busy room full of active, inquisitive minds. in
Third was inclusion of preconception health activities in the Title V-
funded Early Childhood contract between Arizona Department of Health
Services and Pima County Health Department. Each year Arizona babies
are born prematurely and with a low birth weight and some have major
birth defects. The percentage of Arizona women giving birth who suffer
pregnancy complications is not greatly improving. Yet women who could
become pregnant continue to smoke and drink alcohol, do not eat a
healthy diet or take folic acid supplements. Many are obese and have
unaddressed pre-existing conditions which can negatively effect their
health and that of their baby-to-be.
In 2002 it was estimated that there were more than 1.4 million child care
providers caring for 12 million children across the nation and 97% of
those child care providers were women in their childbearing years—
generally considered to be 18-44 years of age inclusive. As a group the
Pima County CCHCs began to ask obvious questions: “Are women in their
childbearing years (18-44 years of age) represented in significant numbers
in the child care staff in Pima County?
If they are, should preconception health messages for staff including daily
folic acid intake, maintaining a healthy weight, healthy foods and physical
activity, healthy lifestyles, and stress reduction be a part of child care
health consultant visits? What are the personal health risks that provid-
ers of all ages assume by virtue of working in the child care setting?” Last
but not least, we asked “What are the staff health and safety risks that
might be addressed by Child Care Health Consultants as they provide ser-
vices to child care programs? ”
Kathleen M. Ford, RN-BC, CCNC
Nurse Manager
Child Care Health Consultation Program
Staff Health: It’s All About Me!
http://developingchild.harvard.edu/
resources/multimedia/videos/
theory_of_change/

0 10 20 30 40 50 60 70 80 90
Self-Reported Health Status (good - excellent)(2012)
Pap Smear (past 3 years)
Have you been told you have High Blood Pressure
Mammography (past year)
Influenza Vaccinations in the Elderly (age 65+)
Have you been told you have Diabetes?
Obesity (BMI >30)
Routine checkup within last year (2013)
No Health Insurance
Fruit and Vegetable Consumption (>5 per day) 2009
Cigarrette Use (current)
Alcohol Abuse: Binge Drinking
Currently have Asthma
Have you ever been told you have depression
Diabetes
Percent
Executive Summary
PCSHS
National
Arizona
Pima

1
The Pima County Child Care Staff Health Survey
The survey results that follow are a snapshot of child care staff self‐reported health status and concerns
between April and November of 2014. The written surveys were completed at gatherings where a CCHC
was present to provide information or training. All staff in a child care program was eligible to complete
the survey despite their assigned role (cook, caregiver, administrative staff, etc.). The categories of
questions included were selected to determine topics which might be addressed by a public health‐
oriented child care health consultant through the traditional service models of consultation, training,
and referral to resources. This process should not be construed as research, rather as a narrowly‐
focused assessment and call to action for addressing the issue of child care staff health going forward.
A few questions were purely demographic. Some questions were taken from or modeled after
Pregnancy Risk Assessment Monitoring System (PRAMS) http://www.cdc.gov/prams surveys, and CDC’s
Behavioral Risk Factor Surveillance System (BRFSS) http://www.cdc.gov/brfss/about/index.htm. Other
questions reflect the Power Me A2Z Life Plan http://www.powermea2z.org and the CDC’s “Show Your
Love” campaign materials http://www.cdc.gov/preconception/showyourlove/ which have been selected
for distribution by the Arizona Preconception Health Alliance. The training module Promoting the
Health and Safety of Child Care Staff, version 3, from The National Training Institute for Child Care
Health Consultants, Department of Maternal and Child Health, The University of North Carolina at
Chapel Hill; 2013, significantly influenced the selection of topics included in this survey.
Secondary data used to provide context to survey results was in the most part extracted from the Center
for Disease Control and Prevention’s Chronic Disease Indicators, a set of surveillance indicators
developed by consensus among CDC, the Council of State and Territorial Epidemiologists (CSTE), and the
National Association of Chronic Disease Directors (NACDD). http://www.cdc.gov/cdi/index.html .
Additional Arizona data was abstracted from the Arizona State Health Assessment‐2013 released by
Arizona Department of Health Services (http://www.azdhs.gov/documents/director/managing‐
excellence‐program/az‐state‐health‐assessment.pdf ).
All surveys were administered by qualified Child Care Health Consultants and survey respondents
received a single movie ticket voucher for use in a local theater to show appreciation for their
willingness to share their information. No identifying information was collected, surveys remain
anonymous.
Results will be shared with Arizona Department of Health Services Bureau of Women’s and Children’s Health, the Arizona Preconception Health Alliance and others with an interest in supporting child care staff health as an integral part of promoting quality child care.
Many additional questions could have been included. Race and ethnicity were not asked, oral health concerns were not addressed, occupational exposure to toxic chemicals was not investigated. . .and the list goes on. There will be ongoing opportunities to learn more about the health and safety needs of child care staff as time goes by. Child care is here to stay!

2
Who Participated in the Survey?
While this survey targeted child care providers in center‐based settings, three participants indicated
they provide care in child care homes. One hundred eleven (111) of those center‐based respondents
(62%) indicated they were participants in Arizona’s Quality Improvement and Rating System program
called Quality First. Fifteen individuals did not complete the demographics questions.
Twelve (5.8%) of those completing the survey indicated they were not women, 194 indicated they were
female. The field of early childhood is overwhelmingly female with only about 5‐6% of child care
providers being male. (US Department of Labor)
0
50
100
150
200
190 3
Center Home
Not QF 79 1
Quality First 111 2
Number
Who Participated in the Survey"No response" removed
3
Age
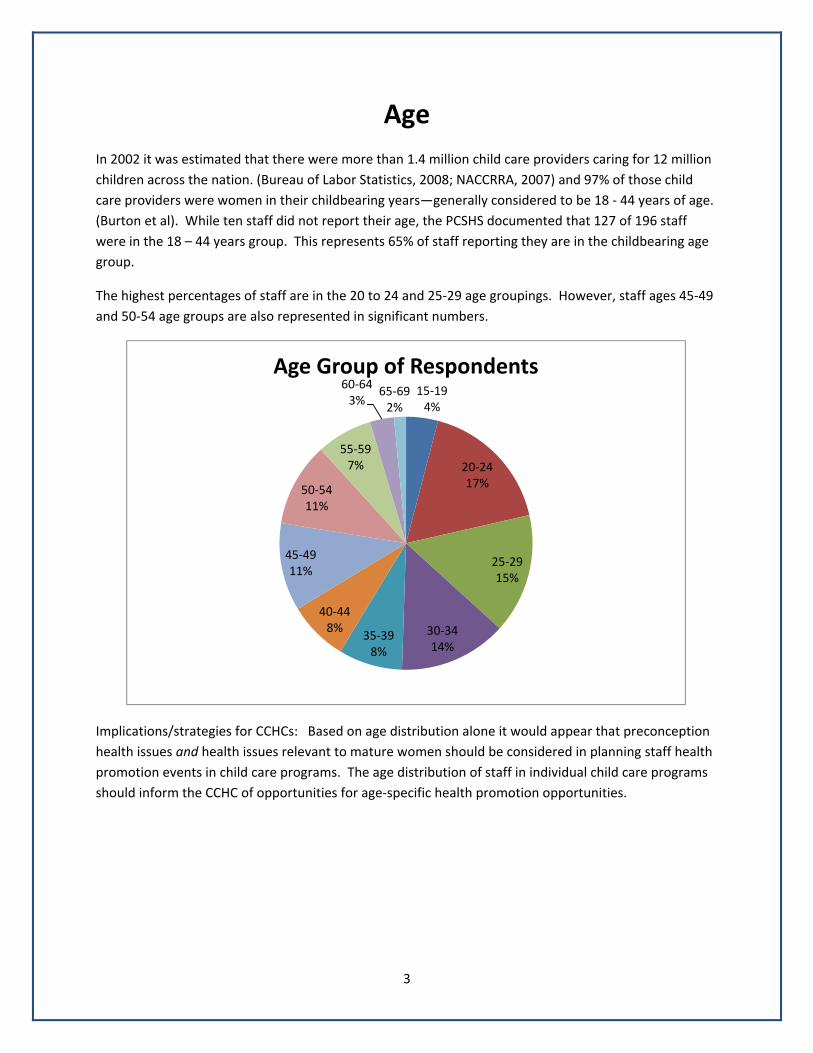
In 2002 it was estimated that there were more than 1.4 million child care providers caring for 12 million
children across the nation. (Bureau of Labor Statistics, 2008; NACCRRA, 2007) and 97% of those child
care providers were women in their childbearing years—generally considered to be 18 ‐ 44 years of age.
(Burton et al). While ten staff did not report their age, the PCSHS documented that 127 of 196 staff
were in the 18 – 44 years group. This represents 65% of staff reporting they are in the childbearing age
group.
The highest percentages of staff are in the 20 to 24 and 25‐29 age groupings. However, staff ages 45‐49
and 50‐54 age groups are also represented in significant numbers.
Implications/strategies for CCHCs: Based on age distribution alone it would appear that preconception
health issues and health issues relevant to mature women should be considered in planning staff health
promotion events in child care programs. The age distribution of staff in individual child care programs
should inform the CCHC of opportunities for age‐specific health promotion opportunities.
15‐194%
20‐2417%
25‐2915%
30‐3414%
35‐398%
40‐448%
45‐4911%
50‐5411%
55‐597%
60‐643%
65‐692%
Age Group of Respondents

4
Body Mass Index
Overweight and obesity contribute to numerous adverse health conditions including Type 2 diabetes,
hypertension, heart disease, stroke, a variety of cancers, and infertility.
Obesity is also associated with many unfavorable perinatal health outcomes including neural tube
defects, labor and delivery complications, fetal and neonatal death, and maternal complications such as
gestational diabetes and preeclampsia. While health risks are better established for obese persons (BMI
of 30 or more), overweight (BMI 25‐29.9) is a predictor of subsequent obesity. (PRAMS)
The rate of obesity in Arizona is up from 20.3 percent in 2004 and from 10.6 percent in 1990. Arizona
now has the 34th highest adult obesity rate in the nation, according to The State of Obesity: Better
Policies for a Healthier America, Robert Wood Johnson Foundation (http://stateofobesity.org/). In 2013
Arizona's adult obesity rate was 26.8 percent.
For the PCSHS height and weight data was collected by trained CCHCs following approved procedures
for 58.7% of respondents using calibrated scales and medical stadiometers. The survey administration
venue or event was not always appropriate for weighing/measuring and in some cases participants
refused to be weighed and measured but were willing to complete the rest of the survey.
26.8
22.6
30.3
26.7
18.9
50
1.5
30.6
37.4
25.2
0 10 20 30 40 50 60
All Arizonan's
65+
45‐64
26‐44
18‐25
Percent of Obesity in Arizona by Age group
All PCSHS
65+*
45‐64
26‐44
18‐25
Percent of Pima County Staff Health Survey by Age group
Percent of Obesity by Age Group: Arizona 2013, PCSHS 2014
*65+ in the PCSHS data too small for comparison with Arizona data*65+ in the PCSHS data too small for comparison with Arizona data

5
The child care staff participating in this survey show significantly higher rates of obesity (defined as a
BMI of 30 and above) than other all Arizona adults.
When responding to the question “Do you ever wonder if you weigh too little or too much?” 59.7% of
all respondents said “Yes, too much” although results indicated that 69% of participants fall into the
combined overweight and obese categories. This is consistent with studies which show many Americans
fail to accurately identify themselves as overweight and underestimate their risk for obesity‐related
diseases. (Darlow)
Some difficulty with the question itself was noted by a respondent who laughed and said, “No, I do not
wonder‐‐I know!”
5%
26%
19%
50%
BMI Category of all PCSHS Participants
Low
Healthy
Overweight
Obese
0.00
10.00
20.00
30.00
40.00
50.00
60.00
low healthy overweight obese
<18.5 18.6‐24.9 25‐29.9 30+
BMI
BMI Percentages Women by Age Group
18‐44
others
all

6
Implications/strategies for CCHCs: All individuals should know their current BMI number and how it
compares to a desirable BMI range. Those within the desirable range can be counseled regarding
maintaining a healthy weight. Overweight and obese individuals with a BMI of 25 or greater should be
counseled about their own health risks as well as those that may occur related to pregnancy.
Overweight and obese individuals should be encouraged to discuss their BMI with their health care
provider and be provided with strategies to achieve a healthier weight, especially prior to any future
pregnancies. Targeting overweight and obesity as part of a worksite wellness initiative can create an
atmosphere of mutual support which may not exist in the staff’s home.

7
Self‐Rated Health
Participants were asked to rate their own health status. This question was borrowed from the
Behavioral Risk Factor Surveillance System (BRFSS). Self‐rated health (SRH) status is a simple measure of
health‐related quality of life that has also been related to general happiness and life satisfaction. SRH is
recognized as an indicator of a population's overall well‐being as lower ratings of subjective health
status have consistently been associated with increased mortality, incident adverse health events,
health care utilization, and illness severity, even after medical risk factors have been accounted for.
(Hennessy)
In the 1996 Gratz survey, more than 85% of the child care staff rated their health as either good or
excellent. (Gratz) In a 2004 workforce study in New Zealand, 92% of child care staff participants rated
their health as good or excellent. (McGrath)
Both in Arizona and in the nation in 2012, roughly 81.9% of women reported their health to be good or
excellent using data from Behavioral Risk Factor Surveys.
66
68
70
72
74
76
78
80
82
84
86
US‐2013 AZ‐2013 PCSHS‐2014
Percent
Percent of Individuals Self Reporting Overall Health as Good or Excellent
US‐2013
AZ‐2013
PCSHS‐2014

8
Education and income are recognized modifiers of self‐rated health. In 2014 in Arizona the average
annual income for all residents was $37,895 ($32,807 in Pima County). The average income of a child
care center caregiver was $20,660 (Child Care Aware). Family child care providers are usually paid less.
In the PCSHS survey 73% of child care staff said their health was good or excellent. This is lower than the
84% of all Arizona women and may reflect income‐influenced expectations.
“New evidence about the ways in which stress and economic insecurity challenge teachers’ capacity to
provide developmentally supportive care and education is lending scientific support to the claim that
child well‐being depends on adult well‐being not only at home but in out‐of‐home settings. And, serious
0102030405060708090
100
Percent
Arizona
Arizona Education and Income 2014
Excellent 15%
Good58%
Fair25%
Poor 2%
Self‐Rated Health all PCSHS Participants

9
debate at the federal level, echoed in virtually every state, is underway about the vital importance of
improving the quality of early education, and the most productive strategies for ensuring that young
children’s critical early experiences will promote, not undermine, their lifelong learning and healthy
development.” (Worthy Work, STILL Unlivable Wages: The Early Childhood Workforce 25 Years after the
National Child Care Staffing Study by Marcy Whitebook, Deborah Phillips, and Carollee Howes
http://www.irle.berkeley.edu/cscce/2014/report‐worthy‐work‐still‐unlivable‐wages/
Implications/strategies for CCHCs: The National Training Institute for Child Care Health Consultants in
their training module Building Consultation Skills, provides a reminder that “the CCHC is often in an ideal
position to advocate around health and safety issues based on their level of involvement and
intersection with families, child care staff, young children and community providers.” The CCHC often
has the opportunity to inform the public regarding the critical role of child care in the life of the
community. Speaking at community events, meeting with businesses leaders, legislators, and others to
remind the community of the vital role of the child care provider can help support efforts to provide
higher learning opportunities for child care staff, make child care affordable, safe and healthy for
children and a responsible workplace which pays a livable wage for child care staff.

10
Planning for Pregnancy
Unplanned pregnancy rates in the U.S. have remained essentially unchanged for decades. About half
the pregnancies in the United States are unplanned. Unintended pregnancies are associated with delayed
prenatal care, and an elevated risk of adverse social, economic, and health outcomes for the mother and the child.
(PRAMS)
Participants were asked if they planned to become pregnant in the next 2 years. Three indicated they
were pregnant at the time of completing the survey and were included in the 26 of 18‐44 year olds
answering yes. “No” answers were provided by 84% of all participants.
Implications/strategies for CCHCs: CCHCs providing education on nutrition, physical activity, stress
management and access to care during their activities with child care staff have teachable moments to
address the concepts related to having a health pregnancy and baby whether or not the childbearing‐
age woman is pregnant or contemplating becoming pregnant. Encouraging good nutrition, the daily use
of a multivitamin with 400 mcg of folic acid, recommended physical activity, choosing a tobacco and
substance‐free lifestyle and regular health visits and screenings are topics which can be introduced into
staff health‐related discussions. As nearly 85% of the survey respondents indicated they were not
planning to become pregnant in the next 2 years, a resource list for low‐cost family planning services for
the program’s resource files might be considered. (Moos)
0.0
20.0
40.0
60.0
80.0
100.0
120.0
18 ‐ 44 all others
Percent
Female by Age Group
PCSHS Respondents Planning a Pregnancy within the Next 2 Years
Yes
No

11
Chronic Disease Chronic diseases are responsible for 7 of 10 deaths each year, and treating people with chronic diseases
accounts for 86% of our nation’s health care costs. (CDC) Child care staff are predisposed to the same
chronic diseases as their age peers. However, they work long hours, may not have access to healthy
foods due to limited time throughout the day or low income.
The PCSHS gathered information on three specific chronic health conditions which can be improved
through awareness, education, and referral to appropriate resources for treatment. The question asked
was “Have you ever been told by a doctor nurse that you have. . .” There was also an opportunity to
capture other conditions to assure that health challenges deemed important by respondents were not
overlooked. The written‐in responses included cardiac conditions, anemia, irregular menses,
fibromyalgia, high cholesterol, thyroid deficiency, arthritis, and hepatitis C disease.
Some chronic conditions greatly impact pregnancy—both the health of the mother and the infant. In
the PCSHS 28 (13.6%) of women in the childbearing age group indicated they plan to become pregnant
in the next two years. Three indicated they were pregnant at the time they completed the survey.
24.80%
15.50%
13.10%
17.40%
High Blood Pressure
Asthma
Diabetes
Other
PCSHS‐Chronic Diseaseall Age Groups

12
Implications/Strategies for the CCHC: Chronic diseases can lead to a decline in the overall health of child
care staff, contribute to an increase in health‐related expenses for both staff and the employer, and lead
to lower productivity and days of work missed. The CCHC can discuss the benefits of health promotion
in the workplace with owners and directors reminding them that the workplace should be a place
protecting the safety and well‐being of staff and provide them with opportunities for better long‐term
health. Strategies to facilitate staff health can include time for exercise during the day or before or after
work, providing an area to prepare and eat healthful meals and snacks, offering healthful food options in
vending machines. Community groups may offer free or low‐cost activities such as health education and
coaching, weight management programs, medical screenings, on‐site fitness programs, and more.
Advocating with public and private health‐related/wellness organizations for the inclusion of child care
staff in ongoing health promotion activities, such as worksite depression screening, diabetes screening,
healthy eating initiatives, immunization outreach, and smoking cessation programs can bring attention
to the needs of child care staff.
The CCHC may find inspiration by reviewing the CDC’s Worksite Health Score Card
http://www.cdc.gov/dhdsp/pubs/worksite_scorecard.htm. Health promotion programs that include
both individual risk reduction programs and workplace supports for healthy behaviors can reduce the
development or impact of chronic diseases.
0.010.020.030.040.050.060.070.080.0
Percent
Self‐Reported Chronic Disease by Age Group
All
18‐44
Others

13
Hypertension
Blood pressure is the force of blood pushing against the walls of arteries, which carry blood from the
heart to other parts of the body. Blood pressure normally rises and falls throughout the day. But if it
stays high for a long time, it can damage the heart and lead to health problems. High blood pressure
raises the risk for heart disease and stroke, which are leading causes of death in the United States.
Elevated blood pressure may be a freestanding condition or may exist with other conditions such as
obesity, diabetes.
Pregnancies among women with chronic high blood pressure can lead to preeclampsia (a pregnancy
complication characterized by high blood pressure and signs of damage to other organ systems, often
the kidneys), damage to the central nervous system, and kidney damage. Potential life threatening
conditions related to chronic hypertension during pregnancy include preterm delivery, intrauterine
growth retardation, placental abruption, and fetal death.
Hypertension rates in the general population 18 and over in the United States stand at 29.9%; for
females only that rate is 27.1%. In Arizona the general population hypertension rate is 29.2%; for
females only the rate is 26.8. The PCSHS rate was 24.8%
Rates of hypertension in the childbearing age group are 12.6 for the nation, 16.9% in Arizona and 15%
for the PCSHS respondents. In 2013, national data estimate that 12.6% of women of this age group had
hypertension. This number has increased over the last 10 years as the number of pregnancies among
women aged 35 years and older has increased.
The PCSHS rates are based on self‐reported hypertension‐‐there was no confirmation by screening or a
valid health care provider report. Based on studies comparing self‐reports with clinical data, validity for
responses to this question is deemed to be moderate as self‐reported hypertension status may result in
an underestimate of true hypertension prevalence. (Nelson)

14
Implications/strategies for CCHCs: Scheduling time to include blood pressure screenings for child care
staff would create opportunities to discuss the importance of maintaining or achieving normal blood
pressure and making appropriate referrals for serial screenings or health care provider follow‐up.
Standardized policies and protocols for the agency, consistent with current recommendations of the
American Medical Association’s and American Heart Association guidelines are recommended to allow
for aggregation of data with other partners who may be engaged in similar screening projects.
Some Arizona counties are participating in the Million Hearts® national initiative that has set an
ambitious goal to prevention 1 million heart attacks and strokes by 2017. Million Hearts® brings
together existing efforts and new programs to improve health across communities and help Americans
live longer, healthier, more productive lives. Find more information at
http://millionhearts.hhs.gov/index.html.
0.0% 5.0% 10.0% 15.0% 20.0% 25.0% 30.0%
US‐Total
AZ‐Total
PCSHS‐Total
US‐18‐44 women
AZ‐18‐44 women
PCSHS‐18‐44 women
Percent
Individuals Reporting Hypertention

15
Diabetes
Diabetes is the sixth leading cause of death in the United States, and can result in serious health
complications including heart disease, blindness, kidney failure, and leg amputations.
Gestational diabetes (diabetes during pregnancy) can cause serious problems for both mothers and
babies. Control of diabetes before and during pregnancy reduces the risk of congenital malformations,
pregnancy loss, and perinatal mortality, all diabetic women of childbearing age should receive
information the importance of diabetes control.
Diabetes often impacts other conditions such as obesity, depression, diet and physical activity.
Respondents completing the PCSHS self‐reported that they had been told they have diabetes. There
was no confirmation required from a health care provider. However, CDC indicates that self‐reported
diabetes data from BRFSS has consistently provided high reliability and moderate validity results.
Implications/strategies for CCHCs: Providing referrals to resources which provide blood glucose
screenings in the community would create opportunities for child care staff to determine if they might
be at risk diabetes. The CCHC can build an awareness of the importance of maintaining or achieving
normal blood glucose and make appropriate referrals for health care provider follow‐up. Supporting
0.0% 2.0% 4.0% 6.0% 8.0% 10.0% 12.0% 14.0%
US‐Total
AZ‐Total
PCSHS‐Total
US‐18‐44 women
AZ‐18‐44 women
PCSHS‐18‐44 women‐2014
Percent
Women 18‐44 and Total Population that have been told they have Diabetes

16
worksite wellness related to healthy weight, nutrition and physical activity may also be a role for the
CCHC. Management of individuals with high and low blood sugar might also be included in trainings on
emergency procedures. All diabetic women of reproductive age should be made aware of the
importance of diabetes control before becoming pregnant and between pregnancies.

17
Asthma
Asthma is a chronic disease that affects the airways in the lungs. During an asthma attack, airways
become inflamed, making it hard to breathe. Asthma attacks can be mild, moderate, or serious — and
even life threatening. Asthma is a serious health and economic concern in the United States. Asthma
costs the United States $56 billion each year and it is responsible for 14.2 million missed days of work.
For about 30% of women with asthma, the severity of the disease worsens during pregnancy. While
outcomes of pregnancy in which the woman’s asthma is mild or well‐controlled are usually good, severe
and poorly controlled asthma during pregnancy may be associated with an increased likelihood of
premature delivery, the need for cesarean delivery, preeclampsia, growth restriction, other perinatal
complications, and maternal morbidity and mortality. Furthermore, subsequent pregnancies tend to
follow a course similar as the first pregnancy with respect to status of asthma severity. (Schatz)
0.0% 2.0% 4.0% 6.0% 8.0% 10.0% 12.0% 14.0%
US‐Total
AZ‐Total
PCSHS‐Total
US‐18‐44 women
AZ‐18‐44 women
PCSHS‐18‐44 women‐2014
Percent
Women 18‐44 and Total Population that have been told they have Asthma

18
Triggers for asthma attacks in the child care environment can include chronic low level exposure to
hazardous art materials including solvents, fixatives, powdered paints and clay, permanent markers,
allergens such as mold and mildew, and dust.
Implications/Strategies for the CCHC: The CCHC can provide information regarding what controlled
asthma looks like and assure that individuals with asthma have access to medical care and resources to
fill their asthma medications. Assist the program to review art supplies and substitute products which
are less irritating to the lungs. Water‐based paints can replace paints containing lead, and permanent
markers, can be replaced with non‐toxic markers. Wet, rather than powdered clays, eliminate exposure
to silica which is easily inhaled and harmful to the lungs. (Using Art Materials Safely. Daniel Smith, Inc.,
2002 http://www.danielsmith.com/content‐‐id‐83 ). Prevent mold and mildew with regular cleaning and
sanitizing of the environment and airing out the facility daily.
Yes16%
No84%
Asthma: all Participants PCSHS
Yes14%
No86%
Asthma PCSHS Women 18‐44

19
Health Care Coverage
In order to achieve optimal health all women need access to preventive health care services at all
times, especially during or shortly before pregnancy. Consistent access to care is especially critical
for women of reproductive age with chronic medical conditions such as diabetes or hypertension.
Lack of health care coverage has been widely associated with decreased use of preventive health
services, delay in seeking medical care, and poor health status. Data from the 2013 indicated that
nationally 20.1% of women aged 18 to 64 and 18.2% of women aged 25‐44 had no usual source of
care. Arizona rates are higher with 25.1% of adult women 18‐64 and 22.3% of Arizona women ages
18‐44 having no insurance coverage. These rates are of concern given the need for routine
gynecological visits where preconception health promotion might occur.
72
73
74
75
76
77
78
79
80
US‐2013 AZ‐2013 PCSHS‐2014
Percent
Percent Women 18‐44 with Health Insurance
US‐2013
AZ‐2013
PCSHS‐2014
Yes75%
No22%
Does not know3%
PCSHS All ParticipantsWith Health Insurance

20
While BRFSS studies indicate a high degree of validity for self‐reported health insurance data although
reliability studies are lacking, it cannot be ruled out that some respondents might interpret “health care
coverage” to include health care available to them despite lacking insurance (e.g. through free clinics or
emergency room care that they cannot and do not pay for).
Of the 45 individuals who indicated they did not have health insurance, 33 indicated they had not
applied for coverage under the Affordable Care Act (Obama care) and 12 had applied for coverage (10
by telephone and 2 “in‐person”).
Implications/Strategies for the CCHC: CCHCs should ask all women of childbearing age about their health insurance coverage status and their usual source of care, and refer women without adequate coverage to social services or other agencies as appropriate. Information regarding opportunities to apply for coverage at linguistic and culturally appropriate sites should be consistently made available by CCHCs.
0
20
40
60
80
100
Yes No Unsure
Percent
Has Insurance
PCSHS Percent Coverage By Age Group
All
18‐45
Others

21
Routine Preventive Care Currently, more than 40 million persons have no particular doctor’s office, clinic, health center, or
other place where they go for health care advice. People with a usual source of health care are
more likely than those without a usual source of care to receive a variety of preventive health care
services. In the PCSHS 62% of participants indicated they had visited a health care provider for a
check‐up in the last year.
0
20
40
60
2011 2012 2013Arizona 60.5 62.7 62.6
National 66.1 67 67.9
Percent of BRFSS Respondents
Reporting having a Routine Medical Exam in the Past
12 Months
62%19%
8%
8%
1% 2%
PCSHS‐Last Visit to a Doctor for a Routine Checkup
Last Year
Last 2 Years
Last 5 years
5 or more
Never
Blank

22
The lower rate among women in the reproductive age group receiving annual preventive health exams
is concerning given their need for routine gynecological care and visits where preconception health
promotion might occur.
According to BRFSS data, the reliability of the question is not high. It is possible that participants may
include visits for injuries or visits to monitor/treat chronic conditions such as asthma or diabetes rather
than limiting their response only to general physical exams.
Implications/Strategies for the CCHC: CCHCs should promote annual preventive health exams for all
child care staff. It may be helpful to suggest that the annual preventive health visit take place around
the individual’s birthday. It may be important to define the components of a routine preventive health
visit which should include immunization, blood pressure screenings, a head‐to‐toe physical assessment,
reproductive/sexual health screenings, and other age‐appropriate assessments. These components
change over the life course, and as key research findings are incorporated in to health care. Insurance
and other forms of health care coverage may also impact included components of the visit.
0.0
10.0
20.0
30.0
40.0
50.0
60.0
70.0
80.0
Past year 2 years 5 years More than 5years
Never Blank
PCSHS‐Last visit to a Doctor for a Routine Checkup by Age Group‐‐Percent
All 18 to 45 All other

23
Mammogram
Breast cancer is the second‐leading cause of cancer death among women in the United States. In 2014,
an estimated 233,000 women were diagnosed with the disease and 40,000 women died from it. It is
most frequently diagnosed among women ages 55 to 64 years, and the median age of death from breast
cancer is 68 years. In 2010, 20% of women aged 50‐74 years had not had a mammogram with the
previous 2 years. Strong evidence shows that mammography screening can reduce breast cancer deaths
by 17% among women aged 50–69 years. The United States Preventive Services Task Force (USPSTF)
recommends biennial screening for women aged 50–74 years.
www.uspreventiveservicestaskforce.org/Page/Document/UpdateSummaryFinal/breast‐cancer‐
screening Evidence supporting mammography among women aged 40–49 years is lower but with
higher false positives that result in less net benefit.
All women participating in the PCSHS who indicated they were age 50 or over (oldest was age 66) are
represented in the data below.
0
10
20
30
40
50
60
70
80
90
US‐2012 AZ‐2012 PCSHS‐2014
Percent
Women Age 50‐74 having a Mamogram in the Last 2 Years
US‐2012
AZ‐2012
PCSHS‐2014

24
This is self‐reported data as proof of screening was not required.
Implications/Strategies for the CCHC: CCHCs should promote preventive health screenings for all child
care staff. There is confusion regarding when to begin mammography and how often women should be
routinely screened. Providing current evidence‐based materials and referral to services for uninsured
women could improve the rates of screening in women 50‐74.
The Well Woman Health Check Program is a free breast and cervical cancer screening and diagnostic
program for uninsured or underinsured women in Pima County and in other Arizona counties.
Uninsured or underinsured women ages 40 – 64 years old may receive breast and cervical cancer
screening and those 21 – 64 years old may be referred for cervical cancer screening.
Has had at least one32%
Never14%
At least every2 years54%
PCSHS Women Ages 50‐74 having a Mammogram

25
Cervical Cancer Screening
Approximately 40%‐60% of cervical cancer deaths can be prevented by increased use of the Pap test
(smear) for detection and effective, timely treatment. Starting Pap smears is recommended at age 21
years or 3 years after the initiation of intercourse.
http://www.uspreventiveservicestaskforce.org/Page/Document/UpdateSummaryFinal/cervical‐cancer‐
screening however guidelines are currently under review. A test for evidence of human papillomavirus
(HPV) infection may also be included with the Pap test. Almost all cases of cervical cancer are caused by
infection with types of the HPV. The office visit during which a Pap test is most often performed,
sometimes referred to as the annual exam, is a prime opportunity for the health care provider to screen
for preconception risk factors and provide treatment or other interventions as necessary.
This is self‐reported data; no proof of screening was required. BRFSS concludes the question regarding ever having had a Pap test has high validity.
There is concern regarding the number of women reporting that they have never had a pap smear. It is not possible to know if there was reluctance to answer or confusion related to the question.
Implications/Strategies for the CCHC: CCHCs should promote preventive health screenings for all child care staff. Young women may not be familiar with when pap tests should begin and may miss opportunities for HPV screening, opportunities to receive HPV vaccine, and counseling regarding sexually health behaviors and contraception. Providing current evidence‐based materials and referral to services for uninsured women could improve the rates of screening.
The Well Woman Health Check Program is a free breast and cervical cancer screening and diagnostic program for uninsured or underinsured women in Pima County and in other Arizona counties. Uninsured or underinsured women ages 21 – 64 years old may be referred for cervical cancer screening.
0.0
5.0
10.0
15.0
20.0
25.0
30.0
35.0
40.0
45.0
50.0
Lastyear
Nouterus
2‐5years
5 ormore
Never Blank
Percent
PCSHS Last Pap Test
All Women
18 to 44
All Other Women

26
Influenza Vaccine
Arizona Child Care Center Licensing Rules R9‐5‐301. General Licensee Responsibilities requires that
"every September, a licensee shall provide to parents of enrolled children information related to
recommendations for influenza vaccinations for children." No requirements are in place for child care
staff to receive information regarding influenza vaccine. Current recommendations from the Centers for
Disease Control for adults include seasonal flu vaccine as soon as the vaccine becomes available.
Vaccination to prevent influenza is particularly important for people who are at high risk of serious complications
from influenza such as individuals with chronic diseases such as asthma and diabetes.
Even healthy people should get vaccinated because they can spread influenza to those at high risk for
complications from the flu or those who are not able to get flu vaccine. Because infants younger than 6
months old cannot receive seasonal flu vaccine, family members and their child care providers should be
vaccinated to protect the infant. Pregnant women should receive flu vaccine. The vaccine is safe for
pregnant and breastfeeding women.
More than a third of PCSHS participants (35%) age 18 and older indicated they had received influenza
vaccine during the previous year (2013‐2014 influenza season). This is lower than the rate for both
Arizona and the nation. However, for those with asthma and diabetes rates PCSHS rates were higher.
This is self‐reported data. Proof of vaccine was not requested.
45.00%
38.30%
35%
41.20%
33.40%
56%
47.50%
55.40%
53.80%
0.00% 10.00% 20.00% 30.00% 40.00% 50.00% 60.00%
US‐Total
AZ‐Total
PCSHS‐Total
US asthma
AZ asthma
PCSHS asthma
US diabetes
AZ diabetes
PCSHS diabetes
Influenza Vaccine 2013‐2014 Season Adults ≥ Age 18 with and without
Chronic Disease

27
Implications/strategies for CCHCs: There are annual opportunities for promoting influenza vaccine in
the child care environment for staff, children, staff and families. Pregnant women should also receive
influenza vaccine. Informational materials from a variety of resources including CDC influenza pages,
www.Immunize.org , social media, and local campaigns by health‐related organizations may provide
materials and resources for the CCHC to share with child care staff. From time‐to‐time free influenza
vaccine may be provided by pharmaceutical companies or local health and vaccine voucher distribution
or special clinics targeting child care providers may be planned.

28
Smoking
Smoking is the most preventable cause of morbidity and mortality in the United States. Women
smokers are 25.7 times more likely than women who never smoked to develop lung cancer. For men
smokers, it’s 25 times the risk of men who never smoked. Besides lung cancer, tobacco use also
increases the risk for cancers of the mouth, lips, nose and sinuses, larynx (voice box), pharynx (throat),
esophagus (swallowing tube), stomach, pancreas, kidney, bladder, uterus, cervix, colon/rectum, ovary
(mucinous), and acute myeloid leukemia. In the United States, tobacco use is responsible for nearly 1 in
5 deaths; this equals about 480,000 early deaths each year.
More than 140,000 women die each year from smoking‐related causes. Women of reproductive age
(18‐44 years) who smoke risk adverse pregnancy outcomes, including difficulty conceiving, spontaneous
abortion, prematurity, and premature rupture of membranes. Maternal smoking accounts for 20% of
low birth weight infants, 8% of preterm births, and 5% of perinatal deaths. Sudden unexpected infant
death (SUID) is increased 3 times by maternal smoking during pregnancy.
Infants who are exposed to secondhand smoke after birth are also at greater risk for SIDS as the
chemicals in secondhand smoke appear to affect the brain in ways that interfere with its regulation of
infants' breathing.
Arizona adults showed a significantly higher rate of “quit attempts” in 2013 than the national average.
Although every state in the United States is required to provide quitline services, the Arizona model
funded by a portion of tobacco taxes and administered through the Arizona Department of Health
Services, Bureau of Tobacco and Chronic Disease, the ASHLine has been helping people quit tobacco
since 1995. There has been aggressive media outreach to the public and marketing of the quit services
to health professionals.
19.20%
16.30%
12.60%
20.50%
11.70%
14%
19.20%
60.40%
US‐Adults ≥ 18 (2013)
AZ‐Adults ≥ 18 (2013)
PCSHS ≥ 18 (2014)
US‐Women 18‐44 (2013)
AZ‐Women 18‐44 (2013)
PCSHS Women 18‐44 (2014)
Current Smokers/ Quit Attempt last year/ Ouit Attempt last year

29
Implications/Strategies for the CCHC: The ASHline (Arizona Smokers' Helpline) provides free services in
both English and Spanish across a variety of platforms. Services include one on one support, coaching,
quit medications. Referrals are easy and confidential. Currently the ASHline has increased its services
for pregnant and postpartum women. The CCHC can assist child care staff with accessing the services of
the ASHline and provide regular encouragement for quitting during CCHC visits. The Centers for Disease
Control and Prevention (CDC) recommends smoking cessation prior to pregnancy. All childbearing‐aged
women counseled about the benefits of not smoking before, during, and after pregnancy, a discussion
of medications, and referral to intensive services that aid individuals attempting to stop smoking.
CCHC consultation should also include information regarding the risks of secondhand and thirdhand
smoke for infants. Caregivers who smoke during the caregiving day should wash their hands and change
their clothing before holding an infant as nicotine residue will cling to a smoker's skin and clothing and
be transferred or breathed in by the infant.
Women 18‐44 Others All
Yes 19.2 22.2 20.2
No 76.9 77.8 77.2
0102030405060708090
Percent
PCSHS: Smoked at Least 100 Cigarettes in Your Life‐by Age Group

30
Alcohol Use
The Centers for Disease Control and Prevention defines alcohol misuse as more than 1 drink per day on
average for women and more than 2 drinks per day on average for men and a pattern of drinking that
results in harm to one’s health, interpersonal relationships or ability to work. Alcohol misuse plays a
contributing role in a wide range of health conditions, such as hypertension, gastritis, liver disease and
cirrhosis, pancreatitis, certain types of cancer (for example, breast and esophageal), cognitive
impairment, anxiety, and depression. Alcohol misuse has also been implicated as a major factor in
morbidity and mortality as a result of trauma, including falls, drownings, fires, motor vehicle crashes,
homicide, and suicide.
Alcohol use in pregnancy is linked to a pattern of developmental abnormalities known as fetal alcohol
syndrome (FAS) characterized by impaired growth and mental retardation in the infant. FAS seems to
result from frequent and heavy drinking, especially binge drinking, during early pregnancy (3‐8 weeks
post‐conception).
Preconception drinking is highly predictive of alcohol use during pregnancy. Because the US Surgeon
General has determined that no amount of alcohol consumption during pregnancy is known to be safe,
current medical guidelines advise against any alcohol use around the time of conception and throughout
pregnancy. CDC analysis of 2002 Behavioral Risk Factor Surveillance System (BRFSS) data for women
aged 18 – 44 indicated that the prevalence of binge drinking was 12.4% both for all women of
childbearing age overall and for those who might become pregnant.
In the PCSHS 103 respondents indicated they had not had an alcoholic drink in the last month. Seven
respondents did not complete the question.
More than 38 million US adults binge drink (defined for women as 4 or more drinks during a single
occasion and for men as 5 or more drinks during a single occasion) about 4 times a month, and the
largest number of drinks per binge is on average eight. This behavior greatly increases the chances of
getting hurt or hurting others due to car crashes, violence, and suicide. Drinking too much, including
binge drinking, causes 80,000 deaths in the US each year and, in 2006 cost the economy $223.5 billion.

31
Implications/Strategies for CCHCs: Although past studies have indicated that moderate alcohol
consumption has protective health benefits such as reducing the risk of heart disease, recent studies
show this may not be true. All individuals should be aware that alcohol affects every organ in the body,
and that each individual reacts differently to drinking alcohol. Certain individuals (those with chronic
diseases and those who may become pregnant) should not use alcohol. Since most individuals do not
drink every day, there is an increasing focus on the amount that people consume on days they do drink.
In addition, if signs of alcohol dependence or misuse are noted, individuals should be directed to
support programs that would assist them to achieve long‐term cessation of alcohol use. Women should
be advised to delay any future pregnancies until they are able to abstain from alcohol use.
17.4
17.6
13.8
13.1
0 5 10 15 20
US‐Total
US‐Women 18‐44
Arizona‐Total
Arizona‐Women 18‐44
Percent
Binge Drinking‐2013
63.1
22.2
14.8
not binge drinkers
binge drinkers
don't know/blank
Percent
Percent of PCSHS Individuals Reporting Binge Drinking

32
Servings of Fruits and Vegetables
Eating a diet rich in fruit and vegetables is important for all individuals for weight management,
prevention of chronic disease, and intake of essential vitamins and minerals. Furthermore, maternal
nutritional status is an important determinant of placental and fetal growth, and clinical studies have
shown a positive association between a healthy diet prior to conception and during pregnancy and
improved birth outcomes. (Vujkovic)
Eating fruits and vegetables adds nutrients to diets, reduces the risk for heart disease, stroke, and some
cancers, and helps manage body weight when consumed in place of more energy‐dense foods.
However, during 2007–2010, half of the total U.S. population consumed <1 cup of fruit and <1.5 cups of
vegetables daily; 76% did not meet fruit intake recommendations, and 87% did not meet vegetable
intake recommendations.
Implications/Strategies for the CCHC: All individuals should be counseled to consume a well‐balanced
diet including fruits and vegetables, iron and calcium‐rich foods, and protein‐containing foods. Since up
to 50% of pregnancies are unplanned, women of reproductive age should receive messages which
remind them of the impact of good nutritional status and healthy babies. Teachable moments regarding
nutrition occur routinely during discussions of children’s nutrition, healthy eating environments and
family‐style meal service.
14.1
33.5
51.9
17.3
33.9
48.0
10.1
31.9
58.0
5+ servings 5 servings <5 servings
Servings of Fruits and Vegetables Each Day by Age Groupincludes Women 18‐44
All
18‐44
Other

33
Use of Vitamin Supplements
In general multivitamins/mineral supplements (MVMs) contain a combination of vitamins and minerals.
Research has shown that more than one‐third of Americans take multivitamins. Among the most
common MVMs are basic, once‐daily products containing all or most vitamins and minerals, with the
majority in amounts that are close to recommended amounts. About one in four young children takes
an MVM, but adolescents are least likely to take them. Use of MVMs increases with age during
adulthood so that by age 71 years more than 40% take a multivitamin supplement. (National Institutes
of Health, Office of Dietary Supplements)
Most individuals probably do not need vitamin supplements, but people who don't get enough vitamins
and minerals from food alone, are on low‐calorie diets, have a poor appetite, or avoid certain foods
(such as strict vegetarians and vegans) might be advised to take a supplement. Additionally
childbearing‐age women who can become pregnant should get 400 mcg/day of folic acid from fortified
foods and/or dietary supplements to reduce the risk of birth defects of the brain and spine in their
newborn babies. Pregnant women should take an iron supplement as recommended by their health
care provider, and postmenopausal women may take calcium and vitamin D supplements to increase
bone strength and reduce the risk of fractures.
The PCSHS survey asked participants to indicate how often they take a multivitamin, prenatal vitamin or
folic acid vitamin.
Participants were also asked to indicate if they knew whether their multi vitamins they take contain at
least 400 mcg of folic acid. Folic acid is a B vitamin used by the body to make new cells. CDC urges
0
10
20
30
40
50
60
BLANK 1‐3 No vitamins 4‐6 every day
% taking vitamins by age group
Frequency per week
Days per Week Taking VitaminsAll‐Women 18‐44‐Others

34
women to take 400 mcg of folic acid every day, starting at least one month before getting pregnant, to
help prevent major birth defects of the baby's brain and spine.
Neural tube defects (NTDs) affect 3,000 pregnancies in the US each year. Many NTDs can be prevented
when women capable of becoming pregnant consume the recommended amount of folic acid prior to
conception.
Implications/Strategies for the CCHC: The Clinical Work Group of the Select Panel on Preconception
Care (CDC) and other organizations recommend that all women of reproductive age take a folic acid
containing multivitamin (400 µg daily). These guidelines are particularly important since half of all
pregnancies are unplanned. The CCHC can suggest discuss adding a multivitamin to the caregiver’s daily
routine. Most multivitamins sold in the United States have the amount of folic acid women need each
day (but check the label). Arizona’s Power Me A2Z program offers free vitamins with 400 mcg folic acid
to childbearing age women. The website at www.powermea2z.org has valuable information regarding
folic acid and women’s concerns.
Single‐vitamin folic acid pills are available and some breakfast cereals have 100% of folic acid required
each day. (See http://www.cdc.gov/ncbddd/folicacid/cereals.html )
Both men and women benefit from folic acid even past the reproductive years. Folic acid lowers blood
levels of the amino acid homocysteine, high levels of which are linked to cardiovascular disease and
stroke. The vitamin may also reduce the risk of Alzheimer's disease, improve symptoms of depression,
hearing loss and decrease the risk of certain cancers.
0
10
20
30
40
50
60
Do not takevitamins
Yes No I don't know
Percent
Multivitamin Contains at least 400 mcg Folic Acid
All respondents
Age 18‐44
Other age group

35
Feeling and Acting
Research has shown that poor mental health is a major source of distress, disability, and social burden. Furthermore, poor mental health can interfere with social functioning and negatively impact physical well‐being as well as the practice of health‐promoting behaviors Research indicates that child care staff generally report high levels of satisfaction with their work. They are proud of their occupation and identify child care as a skilled teaching profession. (Whitebook et al). However, given the characteristics (teaching/caregiving) and conditions of their work (long hours, often working alone with few breaks, and low pay), it should come as no surprise that child care workers also report occupational stress. The National Training Institute for Child Care Health consultants proposes these sources of occupational stress in the child care environment:
1. the novelty and unpredictability of daily activities, 2. significant demands and high level of responsibility for children’s welfare, 3. inadequate professional support and recognition, 4. inadequate salaries and benefits, 5. lack of clear job expectations and methods of evaluation, 6. noise and activity level.
For 2013 in the United States, adults age ≥18 years reported an average of 3.7 mentally unhealthy days
out of the previous 30 days, while Arizona adults in the same age group reported 3.9 days. Twenty
percent of participants of the Pima County Staff Health Survey indicated that they experienced at least 5
or more days when their mental health was not good (stress, depression, problems with emotions).
Others indicated they were not sure if or how many bad days they experienced.
05
1015202530354045
Percent
PCSHS: Days Mental Health was not Good (last 30 days)

36
Implications/strategies for CCHCs: Focusing on supporting a healthy staff that are well nourished, and receive regular wellness advice from a health care provider is an intuitive place to begin interventions. Involving administrative personnel in a systems level approach to reduce stress for child care staff should be addressed at the same time. Exploring group size and ratios, environments which reduce noises, adequate break times away from the responsibilities of children, a system of clear expectations and regular appraisals, support and professional growth opportunities, and wages and benefits which reflect the value of the work of staff. Mental health conditions, including depression and anxiety, are common among pregnant, postpartum, and non‐pregnant women of reproductive. Mental health issues for child care staff mental health may adversely affect women’s family relations, social life and their ability to function at school or work. The CCHC should be familiar with mental health resources available in the community for both crisis intervention and ongoing services.
MH Visit28%
No Visit72%
Percent of Individuals Reporting ≥5 Days of Bad Mental Health that Saw a Health Care Worker to be Checked for a Mental
Health Concern

37
Social Support Someone to Give You Help
Social support means having friends and other people, including family, to turn to in times of need or crisis. It may consist of financial or material assistance, or simply a resource or friend who listens or gives advice. Social support enhances quality of life and provides a buffer against adverse life events. The presence of social support significantly predicts the individual's ability to cope with stress. Knowing that they are valued by others is an important psychological factor in helping them to forget the negative aspects of their lives, and thinking more positively about their environment. Social support not only helps improve a person's well‐being, it affects the immune system as well. People with adequate social support are less likely to get sick. It also a major factor in preventing conditions such as depression and anxiety from developing. Four items, loosely based on a social support question found in the PRAMS survey were selected for the PCSHS. Question: If you needed it, would you have someone to give you the help listed below?
Someone to loan you $50 0 Yes 0 No Someone to help if you were sick and needed to stay in bed 0 Yes 0 No Someone to talk with about your problems 0 Yes 0 No Someone who could help you if you were not safe from violence in your home 0 Yes 0 No
Implications/Strategies for the CCHC: While the role of the CCHC does not include solving personal problems, the CCHC can link child care staff with appropriate community mental health and social support services. There are a variety of possible programs yet determining where these programs are, what eligibility criteria are in place and the unique referral process may take time to ferret out. A database of resources with referral information and includes hotlines, local, county, state and national
69.4
70.4
77.7
73.8
22.8
22.3
17
17.5
7.8
7.3
5.3
8.7
$50
Sick
Talk
Violence
Percent
Would You Have Someone to Give You Help?
Blank No Yes

38
organizations will help to keep resources quickly identified. Also, the CCHC must stay current with changes that occur as funding is added or lost, and contracted agencies change within government systems.

39
Community Support Home visiting became a national public health strategy to improve the health status of women and children in the late 19th century. Families involved with nurse home visiting programs have fewer repeat pregnancies; improved maternal mental health and children’s cognitive development; reduced unintentional injuries and home safety hazards; and improvement in parenting skills. Pima County Health Department Public Health Nurses provide free home visits to assist families in achieving their health goals through health and safety teaching, and referral to community resources. While public health nurses also offer immunizations, pregnancy support, chronic illness counseling, and child care health consultation, this survey sought to determine if child care staff were familiar with the home visiting services of PCHD.
Home visiting services provided by public health nursing appear to be unfamiliar to the respondents.
While there are specialized home visiting services in Pima County, only Public Health Nursing provides a
nurse generalist who is prepared to address the case management needs of a whole family with a
variety of needs with an eye to promoting health care access and eventual self‐sufficiency.
Implications/strategies for CCHCs: Information regarding public health nursing services should be provided early in the consultation relationship with child care programs. Service brochures should be provided to program directors for giving to families who may have a need for services. A visit to the child care program by the district PHN should be encouraged.
0.0
10.0
20.0
30.0
40.0
50.0
60.0
70.0
80.0
Yes No BLANK
Percent of Respondents Familiar with Pima County PHN Home Visits

40
Physical Activity
In 2011, nationwide (states and DC) 51 percent of adults participated in 150 minutes or more of
moderate‐intensity equivalent aerobic physical activity per week. Regular physical activity can improve
the health and quality of life of Americans of all ages, regardless of the presence of a chronic disease or
disability. For all adults, physical activity can lower the risk of early death, coronary heart disease,
stroke, high blood pressure, Type 2 diabetes, breast and colon cancer, falls, and depression. Adequate
physical activity and maintaining a healthy weight are important for women of reproductive age due to
adverse perinatal outcomes associated with maternal obesity which include neural tube defects,
stillbirth, preterm delivery, gestational diabetes, cesarean delivery, hypertension, postpartum anemia
thromboembolic disorders, and infants with excessive birth weight and low Apgar scores.
Implications and Strategies: Providing recommendations for participating in physical activities that are
appropriate to their physical abilities is a topic which can be introduced as an extension of discussing
physical activity for children as well as in staff health discussions, with the goal of increasing the
proportion of adults who engage regularly, preferably daily, in moderate physical activity for at least 30
minutes per day, or 150 minutes per week. Increasing the amount and intensity of activities can
provide increased benefits. Adults should also do muscle‐strengthening activities that are moderate or
high intensity and involve all major muscle groups on 2 or more days a week, as these activities provide
additional health benefits. See Key Guidelines from www.Health.gov .
0
10
20
30
40
50
60
BLANK <1 hour 1‐2 hours 2‐4 hours >4 hours
Percent
Hours
Weekly Hours Spent in Moderate Physical Activity by Age Group
All
Women 18‐44
Other

41
Occupational Risks for Bones and Muscles
Musculoskeletal injuries involve the supporting structures of the anatomy such as spinal discs, nerves,
tendons and muscles. Musculoskeletal disorders account for nearly 70 million physician office visits in
the United States annually, and an estimated 130 million total health care encounters including
outpatient, hospital, and emergency room visits. According to The National Institute for Occupational
Safety and Health (NIOSH) occupations that require “frequent or heavy lifting, pushing, pulling, or
carrying of heavy objects” put workers at risk for musculoskeletal injury.” Not surprisingly then,
ergonomic analyses of the child care workplace have identified the following musculoskeletal risk factors
to child care workers: frequent heavy lifting and carrying (e. g., children), sitting on the floor or in child‐
size chairs with insufficient or no back support, kneeling, squatting, reaching to a variety of heights.
(King et al., 1996)
In 2003, the National Training Institute for Child Care Health Consultants conducted a 3‐day
Caregiver/Teacher Lifting Study, in infant and toddler rooms in the Chapel Hill, North Carolina area. The
study included not only how much weight caregivers were lifting but the reasons why lifting occurred.
The results demonstrated that that infant and toddler caregivers/teachers are lifting significant amounts
of child weight during the workday. The results obtained in this study suggest that the average amount
lifted by these caregivers/teachers during a full day shift (7.125 hours) is close to 1000 pounds, or ½ ton.
The results indicate substantial similarity between the two groups (infants/toddlers) in lifting for reasons
of hand washing, moving, and comforting/reading to. Infants were lifted more for feeding and napping
purposes, and toddlers were lifted somewhat more for diapering, and for other reasons. (The National
Training Institute for Child Care Health Consultants. Promoting the health and safety of child care staff
training module, version 3, 2013.)
For the Pima County Staff Health Survey, four high risk occupational duties were selected for responses.
Staff was asked to indicate all listed activities which are a part of their regular duties. Included was
lifting children/equipment while twisting their body; lifting children/equipment who weigh more than
29 pounds; sitting on the floor without back support; sitting in child‐size chairs.

42
Since characteristically, the work‐related injuries reported for workers in child care settings are injuries
to the back, upper limbs, neck, and lower limbs (The National Institute for Occupational Safety and
Health 1997). Lifting more than 29 pounds as a part of regular duties was the most significant for injury
to the back.
Overweight and obesity increases the likelihood injury will occur during caregiving activities. “Caregiving
requires moving quickly in an urgent situation, getting down to child level, and lifting children.” (Susan
Aronson, Child Care Exchange 1997). Having a body mass index (BMI) in the overweight or obese range
increases the risk of traumatic workplace injury. (Johns Hopkins Bloomberg School of Public Health’s
Center for Injury Research and Policy, 2007) The average BMI of those indicated they had no
67%
54%
60%
61%
Lift and twist
Lift more than 29 pounds
Sit on floor without back support
Sit in child‐size chairs
Included in Regular Duties
Lift and twistLift more than29 pounds
Sit on floorwithout back
support
Sit in child‐size chairs
My duty 139 111 124 125
Back inj 27 28 24 24
020406080100120140160
Number
Duties and Back Injury

43
occupational related injury was 29.8. The average BMI for those indicating they had a work‐related
injury was 33.2.
Implications/Strategies for the CCHC: Prevention of musculoskeletal injuries for child care staff begins
with a review of policies and an observation of current procedures and practices to allow for targeted
interventions. Why are children and equipment lifted? Could sturdy step stools be used to help children
to climb to the changing table or other places to which they would otherwise be lifted? Can heavy items
be placed on rolling carts to be moved from place to place? Is there adult‐size furniture in the classroom
for sitting and working? Has staff been trained on proper body mechanics to understand the
importance of posture in preventing strain on the lower back, and safe lifting of children and
equipment? Is there a policy related to appropriate footwear for staff caring for children? Is staff
encouraged to maintain a healthy weight, general fitness and flexibility? Common conditions
associated with pregnancy including back problems, swollen feet, and varicose veins and the physical
requirements of child care work such as bending, squatting, sitting on the floor, and lifting would be
expected to increase their frequency and intensity during pregnancy.
The module Promoting the health and safety of child care staff training version 3 (2013) from The
National Training Institute for Child Care Health Consultants, Department of Maternal and Child Health,
The University of North Carolina at Chapel Hill, provides an excellent review of promoting
musculoskeletal health for child care staff. (http://ncemch.org/child‐care‐health‐consultants/Part2/2‐
15_m_staff_health.pdf )
28
29
30
31
32
33
34
Injury No injury
Average BMI vs Occupational Injury
Avg BMI

44
Interest in Improving Health Status
The purpose of this survey was to gather information regarding the about the health status and health
concerns of the staff that care for children in Pima County child care programs, for planning activities for
FY 2016 to address those issues and improve the health status of child care staff. Many assumptions
can be made about what needs to be offered to staff to improve their health status, but child care
health consultation remains an egalitarian relationship that occurs between a helpseeker and a
helpgiver. (The National Training Institute for Child Care Health Consultants. (2010). Building
consultation skills training module: version 3.)
Some areas of concern to health professionals did not rise to the top as areas of interest for the child
care staff responding to the survey. Smoking and alcohol use and obtaining health care services did not
rise to the top. On the other hand identified chronic illnesses such as hypertension, diabetes and
asthma (categorized as general health issues) were areas of interest as well as improving health in the
area of nutrition.
The Affordable Care Act creates new incentives and builds on existing wellness policies to promote
employer‐sponsored wellness programs and encourage opportunities to create healthier workplaces.
The Healthy Arizona Worksites Program (HAWP) is a statewide program that provides Arizona
employers with training, technical assistance, tools, and resources to design, implement, and evaluate
worksite wellness initiatives. HAWP also works to create linkages between Arizona businesses engaging
in healthy worksite efforts so they can learn from each other and share experiences.
The goal of the CCHC remains the improvement of the overall health and safety standards in child care
settings, but health promotion for children, families, and the staff who care for, teach, and nurture
children each day can support true quality in early childhood programs.
010203040506070
Percent Interested in Improving Health by Topic and Age
All
18‐44
Other

45
References Aronson, S. (2001) Caregiver health and safety. Child Care Information Exchange Retrieved from
http://www.ccie.com/library_bw/8214000.pdf
Burton, A., Whitebook, M., Young, M., Bellm, D., Wayne, C., Brandon, R. N., Maher, E. (2002). Estimating
the size and components of the U. S. child care workforce and caregiving population.
Washington. D.C.: Center for the Child Care Workforce.
Centers for Disease Control and Prevention. (2004). Pregnancy Risk Assessment Monitoring System
(PRAMS): PRAMS and Unintended Pregnancy. Retrieved from
http://www.cdc.gov/prams/UP.htm.
Centers for Disease Control and Prevention. (2004). Alcohol consumption among women who are
pregnant or might become pregnant—United States 2002. MMWR December 24, 2004.
Retrieved from
http://www.cdc.gov/mmwr/preview/mmwrhtml/mm5350a4.htm
Centers for Disease Control and Prevention. (2014). Fetal Alcohol Spectrum Disorders—Data and
Statistics.
Retrieved from
http://www.cdc.gov/ncbddd/fasd/data.html
Child Care Aware of America. (2015). Child Care in the State of: Arizona. Retrieved from
http://usa.childcareaware.org/wp‐content/uploads/2015/06/2015‐State‐Fact‐Sheets‐
Arizona.pdf.
Daniel Smith, Inc. (2002). Using art materials safely. Retrieved from
http://www.danielsmith.com/content‐‐id‐83.
Darlow S, Goodman MS, Stafford JD, Lachance CR, Kaphingst KA. Weight perceptions and perceived risk
for diabetes and heart disease among overweight and obese women, Suffolk County, New York,
2008. Prev Chronic Dis 2012;9:110185.
Gratz, R., Claffey, A. (1996). Adult health in child care: health status, behaviors, and concerns of
teachers, directors, and family care providers. Early Childhood Research Quarterly, 11(2), 243‐
267.
Hennessy, C.H., Moriarty, D.G., Zack, M.M., Scherr, P.A., Brackbill, R. (1994). Measuring health‐related
quality of life for public health surveillance. Pub Health Reports, 109, 665‐672.

46
Johns Hopkins Bloomberg School of Public Health’s Center for Injury Research and Policy (2007). Obesity
increases risk of injury on the job. Retrieved from http://www.jhsph.edu/news/news‐
releases/2007/pollack‐bmi‐injury.html
Mariet, C., Vinod, S., Arun, B. (2014). Prevalence of various musculoskeletal disorders in child care
workers in day care settings. International Journal of Physiotherapy and Research 2(4), 599‐603.
McGrath, B., Huntington, A. (2007). The health and wellbeing of adults working in early childhood
education. Australian Journal of Early Childhood, 32(3), 33‐38.
Moos, M.K., Dunlop, A.L., Jack, B.W., Nelson, L., Coonrod, D.V., Long, R., . . . Gardiner, P.M. (2008).
Healthier women, healthier reproductive outcomes: recommendations for the routine care of all
women of reproductive age. American Journal of Obstetrics and Gynecology, 199(6), 280‐289.
National Association for Child Care Resource and Referral Agencies (NACCRRA). We can do better:
NACCRRA’s ranking of state child care center standards and oversight. 2007. No longer available.
National Insititues of Health, Office of Dietary Supplements (2013). Retrieved from
https://ods.od.nih.gov/factsheets/MVMS‐Consumer/
The National Training Institute for Child Care Health Consultants. (2010). Building consultation skills
training module: version 3. Chapel Hill (NC): The National Training Institute for Child Care Health
Consultants, Department of Maternal and Child Health, The University of North Carolina at
Chapel Hill.
The National Training Institute for Child Care Health Consultants. (2010). Promoting the health and
safety of child care staff training module: version 3. Chapel Hill (NC): The National Training
Institute for Child Care Health Consultants, Department of Maternal and Child Health, The
University of North Carolina at Chapel Hill.
Nelson, D.E., Holtzman, D., Bolen, J., Stanwyck, C.A., Mack, K.A. (2001). Reliability and validity of
measures from the Behavioral Risk Factor Surveillance System (BRFSS). Soz Praventivmed, 46(1),
S3‐42.
Schatz, M., Dombrowski, M.P., Wise, R., Thom, E.A., Landon, M., Mabie, W., . . . McNellis, D. (2003).
Asthma morbidity during pregnancy can be predicted by severity classification. The Journal of
Allergy and Clinical Immunology, 112, 283‐288.
Trust for America’s Health, & The Robert Wood Johnson Foundation. (2015). The state of obesity: better
policies for a healthier America. Retrieved from http://stateofobesity.org/states/az/.

47
United States Department of Labor: Bureau of Labor Statistics. (2008‐2009). Occupational Outlook
Handbook: Child Care Workers. Washington, D.C.
United States Department of Labor: Bureau of Labor Statistics. (2014). Household data annual averages:
employed persons by detailed occupation, sex, race, and Hispanic or Latino ethnicity. Retrieved
from http://www.bls.gov/cps/cpsaat11.pdf.
Vujkovic, M., Ocke, M.C., van der Spek, P.J., Yazdanpanah, N., Steegers, E.A., Steegers‐Theunissen, R.P.
(2007). Maternal Western dietary patterns and the risk of developing a cleft lip with or without a
cleft palate. Obstetrics and Gynecology, 110(2), 378‐384.
Whitebook, M., Phillips, D., Howes, C. (2014). Worthy work, STILL unlivable wages: the early childhood
workforce 25 years after the National Child Care Staffing Study. University of California,
Berkeley: Center for the Study of Child Care Employment, Institute for Research on Labor and
Employment.
Whitebook, M., Sakai, L., Gerber, E., Howes, C. (2001). Then and now: changes in child care staffing,
1994‐2000. University of California, Berkeley: Institute of Industrial Relations & Washington, DC:
Center for the Child Care Workforce.
U.S. Preventative Services Task Force. (2009). Breast cancer: screening. Retrieved from
www.uspreventiveservicestaskforce.org/Page/Document/UpdateSummaryFinal/breast‐cancer‐
screening.
U. S. Preventative Services Task Force (2012). Cervical cancer: screening. Retrieved from
http://www.uspreventiveservicestaskforce.org/Page/Document/UpdateSummaryFinal/cervical‐
cancer‐screening.

In October of 1987, Pima County Health De-
partment Division of Public Health Nursing
was awarded a contract by Arizona Depart-
ment of Health Services, Maternal Child
Health (now known as the Bureau of Wom-
en’s and Children’s Health) for the purpose
of determining the risks children assumed by
virtue of being in child care settings and im-
proving the standards of health and safety in
group care. With ongoing funding from the
Bureau through Title V funding, Pima County
has continued to maintain child care health
consultation services in Pima County. We
are grateful for the ongoing support of ADHS/
BWCH.
Conclusion
Pima County Health Department 3950 S. Country Club Road, Suite 100 Tucson, AZ 85714 www.webcms.pima.gov./government/health_department
Staff Health: It’s All About Me!