staff report - city of guelphguelph.ca/wp-content/uploads/2013transitannualreport.pdf · floor...
TRANSCRIPT

STAFF REPORT
PAGE 1
TO Operations, Transit & Emergency Services (OTES) Committee
SERVICE AREA Operations, Transit & Emergency Services DATE June 3, 2014 SUBJECT 2013 Guelph Transit Annual Report REPORT NUMBER OTES061422
EXECUTIVE SUMMARY PURPOSE OF REPORT To provide the Operations, Transit & Emergency Services Committee with information related to Guelph Transit’s performance to key performance indicators, supporting areas of sustainability, customer service, internal processes and organizational capacity. KEY FINDINGS A number of initiatives were started or completed in 2013, in areas of customer service, service improvements and community wellbeing including;
• Support of the affordable bus pass pilot program • Implementation of a new service model • Development of key performance indicators
FINANCIAL IMPLICATIONS There are no financial implications associated with this report. ACTION REQUIRED Operations, Transit and Emergency Services Committee to receive this report.
RECOMMENDATION
1. THAT the Operations Transit & Emergency Services Committee report regarding 2013 Guelph Transit Annual Report, #OTES061422, dated June 3, 2014 be received for information.
BACKGROUND This is the third annual report of Guelph Transit, in this format.

STAFF REPORT
PAGE 2
This report provides committee members with information related to budget performance, a dashboard and scorecard reporting on key performance indicators, supporting areas of financial performance, customer service, internal processes and organizational capacity.
GLOSSARY OF TERMS Term Definition Key Performance Indicator (KPI)
A measurement of the degree or status of progress towards goals and objectives. A measurement that can be impacted by management activities.
Statistic A measurement that provides information on trends or events. Management activities often have minimal impact on statistics, such as number of customer calls or quantity of visits. Statistics inform activity that can impact the key performance indicators.
Dashboard Provides a snapshot of performance of key performance indicators to the goals/targets. Usually linked to the strategic directions.
Scorecard A performance management tool that provides more detail measurement information, including trends and initiatives.
REPORT Guelph Transit provides people with mobility and access to employment, community resources, medical care, and recreational opportunities across Guelph.
Public transportation also helps to reduce road congestion and travel times, air pollution, energy and oil consumption, all of which benefit both riders and non-riders alike.
Guelph Transit operates essentially around the clock: regular weekday service in 2013 was provided from 5:40 a.m. to 12:15 a.m. and late night service for the University of Guelph runs from 12:30 a.m. to 3:30 a.m. Guelph Transit provides both conventional and mobility services to the community through a fleet of 73 low floor conventional buses and 10 mobility vans. Mobility services are supplemented through a contract with an external vendor to provide accessible taxi service.
2013 was a very exciting and challenging year for Guelph Transit with the implementation of a new service model, supporting the affordable bus pass pilot program and the development of key performance measures.
In summary, 2013 was a very busy year. The annual report (attached) provides an overview of departmental performance highlights the achievements from 2013 and defines some of the departmental goals for 2014.

STAFF REPORT
PAGE 3
As with previous reports, Committee members are encouraged to convey opinions on the value of the report content and its format in order to improve on the report going forward.
FINANCIAL IMPLICATIONS There are no financial implications associated with this report. CORPORATE STRATEGIC PLAN 2.3 Provide accountability, transparency and engagement. DEPARTMENTAL CONSULTATION Guelph Transit COMMUNICATIONS N/A ATTACHMENTS ATT-1 Transit Annual Report _______________________ __________________________ Recommended By Approved By Phil Meagher Derek McCaughan General Manager Executive Director, Guelph Transit Operations, Transit & Emergency Services 519-822-1260 x3321 519-822-1260, x 2018 [email protected] [email protected]

2013 Annual Report Guelph Transit

2013
Ann
ual R
epor
t Gue
lph
Tran
sit
1
Table of Contents
General Manager’s Message 2
Department Identity Statement 3
2013 Performance 5
CSP Support 16
2013 Achievements 17
2014 Initiatives 18
2013 Financial Performance 6
2013 Customer Service Performance 9
2013 Internal Process Performance 12
2013 Organizational Capacity Performance 14
Department Overview 4

2013
Ann
ual R
epor
t Gue
lph
Tran
sit
2
General Manager’s Message Presented for your perusal is the 2013 Guelph Transit Annual Report. This is the third year that the Annual Report has been presented to Council in this format.
Guelph Transit is one of the largest departments in the City of Guelph and is part of the Operations, Transit and Emergency Services Service Area. Transit operates regular weekday service from 5:45am to 12:15am Monday to Friday and operates extended service from 12:30am to 3:30am Thursday to Saturday under contract to accommodate students at the University of Guelph.
2013 was a pivotal year for Guelph Transit. Major service changes were implemented early in 2013 as a result of service issues that were experienced when frequencies were changed to 15 minute peak and 30 minute off peak service cycles. The change resulted in a loss of customer confidence in Guelph Transit which was reflected in our decreased passenger trips in 2013 versus previous year’s performance. This reduction in ridership also resulted in less revenue being generated at Transit putting further pressure on the day to day operations.
In addition the City of Guelph conducted an audit of various city departments with respect to overtime performance and costs. The results of this audit put Transit in an unfavourable position as the absenteeism and overtime costs at Transit were at an unfavourable level. This along with the fact that collective bargaining was starting and there had been previous mediation efforts due to the deteriorated union/management relationship resulted in acrimony within the organization. Also during the third quarter of the 2013 some staff changes took place resulting in an interim General Manager and Acting Manager of Operations being placed in the organization in order to reset Transit.
The overtime audit also resulted in a 90 Day Recasting Guelph Transit Plan being formulated in order to improve Transit performance for both our customers, employees and the City of Guelph. The 90 day plan is integrated into the Guelph Transit work plan for 2014 along with other key drivers that affect Transit operations and performance.
In summary 2013 was a year of change for Guelph Transit which has resulted in a renewed focus on customer service, operational performance and employee engagement in order to improve the reputation of Guelph Transit and the City of Guelph.
The team at Guelph Transit looks forward to improving on changes which have taken place during 2013 and are focused on the needs of our customers during 2014 and beyond.
2013
Ann
ual R
epor
t Gue
lph
Tran
sit
3
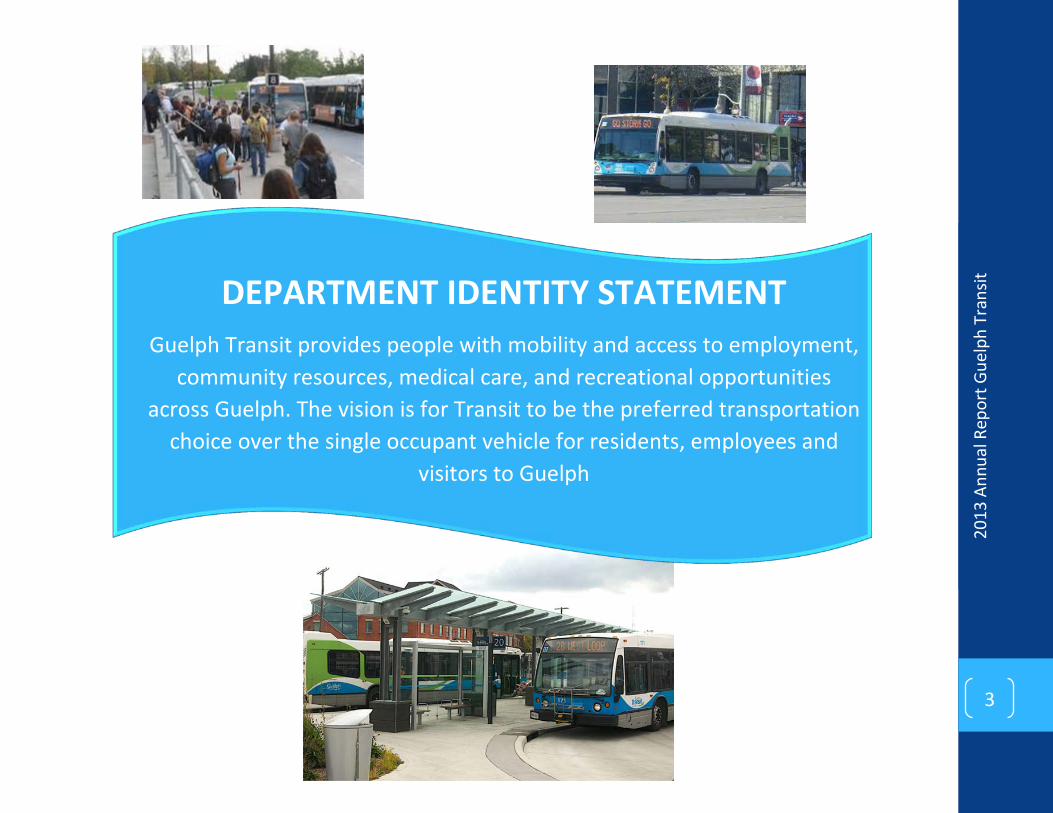
DEPARTMENT IDENTITY STATEMENT Guelph Transit provides people with mobility and access to employment,
community resources, medical care, and recreational opportunities across Guelph. The vision is for Transit to be the preferred transportation
choice over the single occupant vehicle for residents, employees and visitors to Guelph

2013
Ann
ual R
epor
t Gue
lph
Tran
sit
4
Department Overview
Operations, Transit & Emergency Services Executive Director
Guelph Transit General Manager
Business Services Supervisor
Operations Manager
Quality Assurance & Continuous Improvement
Manager
Planning & Scheduling Supervisor
WO
RKFO
RCE
DIST
RIBU
TIO
N
Operations, Transit & Emergency Services (58%)
Planning & Building, Engineering & Environmental (20%)
Community & Social Services (14%)
Corporate && Human Resources (7%)
CAO Administration (1%)
• Manage Guelph Transit’s business functions • Maintain communication channels • Monitor marketing and sales programs, pilots
and initiatives • Oversee the customer service
• Conventional service employs 73 fully accessible low-floor buses
• Transit’s _ fleet of 10 mobility buses provide door-to-door service for passengers who may or may not use personal mobility devices
• Facility management • Capital project management • Continuous Improvement
• Prepare annual service standard and benchmarking report
• Assess route performance and develop route and service adjustments
• Continued monitoring of the new service model (introduced in 2013)

2013
Ann
ual R
epor
t Gue
lph
Tran
sit
5
2013 Performance The performance scorecards for Guelph Transit consist of both KPIs and Statistics. Both types of measurements are needed to effectively manage the department. The scorecard identifies performance for the current reporting period and one previous reporting period. Trend analysis is provided through the performance charts of the scorecard.
Performance is broken into four key areas;
• Financial • Customer Service • Internal Processes • Organizational Capacity
Definitions Key Performance Indicator (KPI): A measurement of the degree or status of progress towards goals and objectives. It is a measurement that can be impacted by management activities.
Statistic: A measurement that provides information on trends or events. Management activities often have minimal impact on statistics, such as number of customer calls or quantity of visits. Statistics inform activity that can impact the key performance indicators.
Trend: The direction that a measure (statistic or KPI) is moving. It can be towards or away from the target/goal.
Status:
The results are positively trending. Meaning they are moving closer to target.
The results are negatively trending. Meaning they are moving away from the target.
The results are positive and within target, no action is necessary.
The results are in range of the target, but not yet achieving target, some mitigating action may be necessary.
The results are outside the target range and corrective actions/initiatives are required to correct performance.

2013
Ann
ual R
epor
t Gue
lph
Tran
sit
6
Financial Performance
Monitoring our operating budget performance provides us the necessary information to manage the department and ensure services are provided to the community efficiently
Financial Performance Scorecard
Measure 2013 Performance 2013 Target Trend 2012
Performance Operating Revenues consist of user fees, service charges, product sales and external recoveries
-5.9% 0%/2% -4.2%
Cash Fares
5% 0%/2%
-13%
Ticket Fares
-19% 0%/2% -13%
Passes
-14% 0%/2% -10%
U-Pass/Late Night
-1% 0%/2%
7%
Operating Expenditures include salary, wage & benefits, purchased goods and services and other expenses.
2.1% 0%/-2% 1.2%
Overall Operating Budget Performance includes the expenses and revenues that occur during the normal provision of the department services
8.7% 0%/-2% 6.2%
Revenue vs. Cost provides information on the percent (%) of expenditures offset by the revenues received
52% Max 57%
55%
Municipal Subsidy per Capita is the amount ($) that the Municipality spends, not recovered through revenue, to provide transit service to the community, per current population levels
$104.2 No target set - statistic $88.40
2013
Ann
ual R
epor
t Gue
lph
Tran
sit
7
Fi
nanc
ial P
erfo
rman
ce T
rend
s
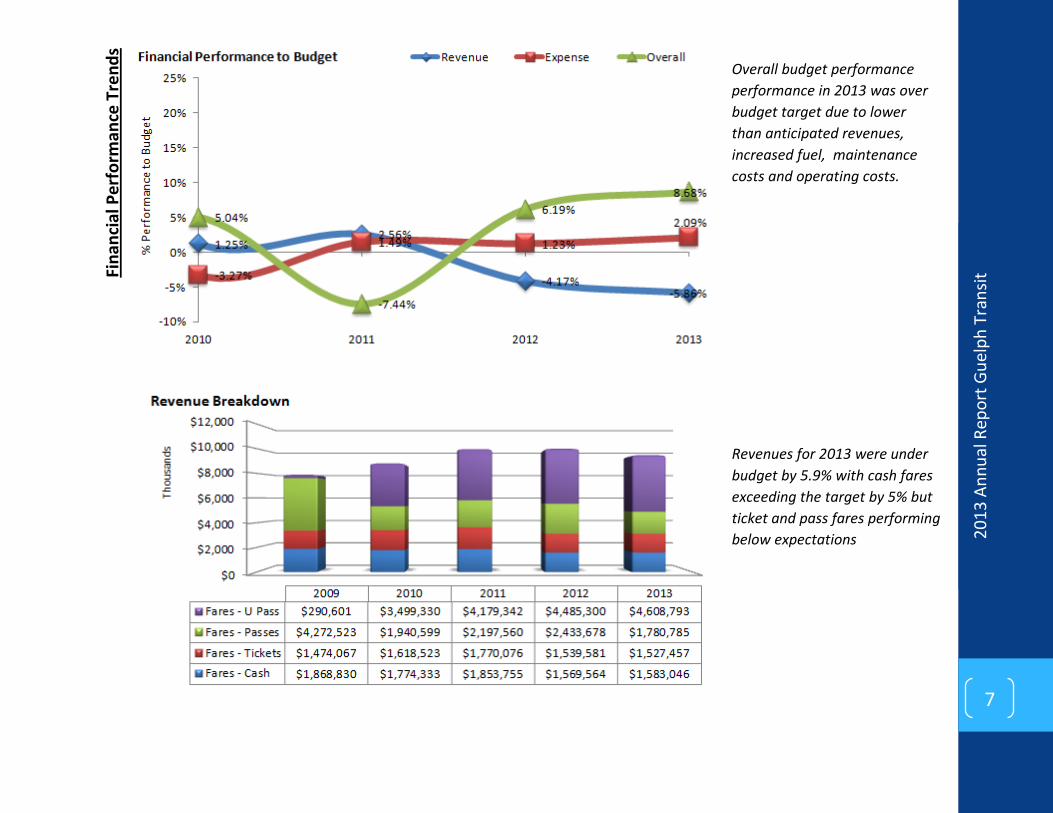
Overall budget performance performance in 2013 was over budget target due to lower than anticipated revenues, increased fuel, maintenance costs and operating costs.
Revenues for 2013 were under budget by 5.9% with cash fares exceeding the target by 5% but ticket and pass fares performing below expectations
2013
Ann
ual R
epor
t Gue
lph
Tran
sit
8
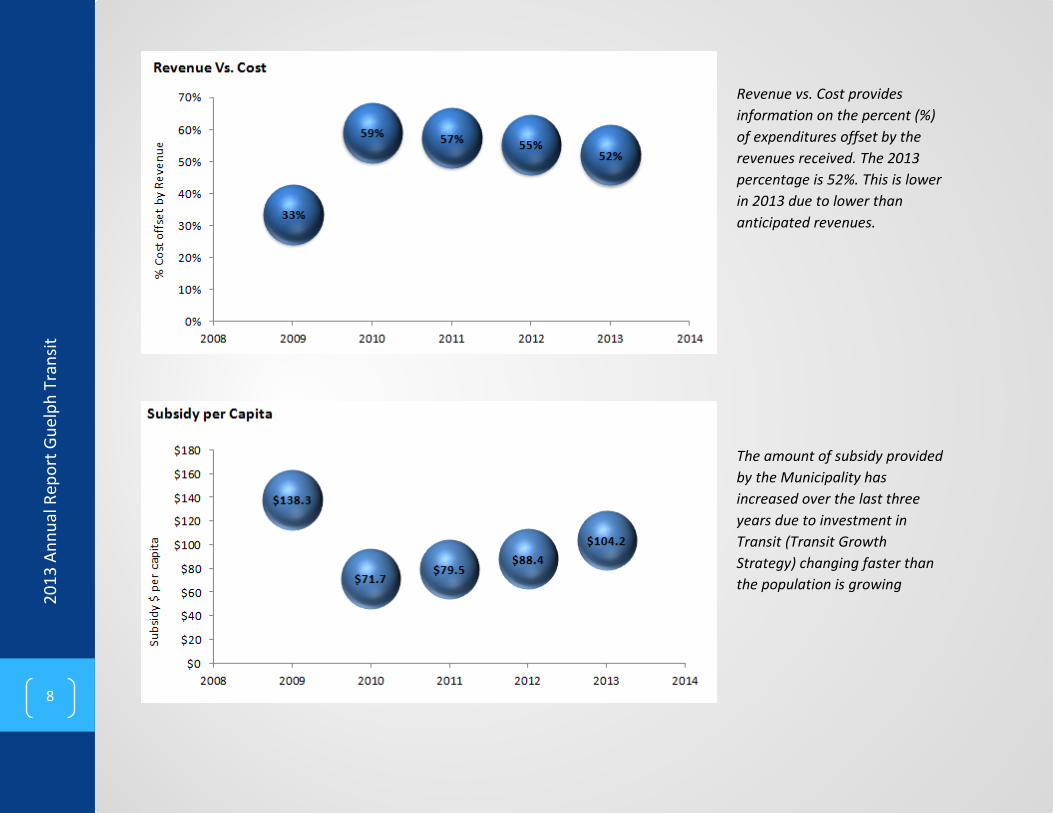
Revenue vs. Cost provides information on the percent (%) of expenditures offset by the revenues received. The 2013 percentage is 52%. This is lower in 2013 due to lower than anticipated revenues.
The amount of subsidy provided by the Municipality has increased over the last three years due to investment in Transit (Transit Growth Strategy) changing faster than the population is growing
2013
Ann
ual R
epor
t Gue
lph
Tran
sit
9
Customer Service
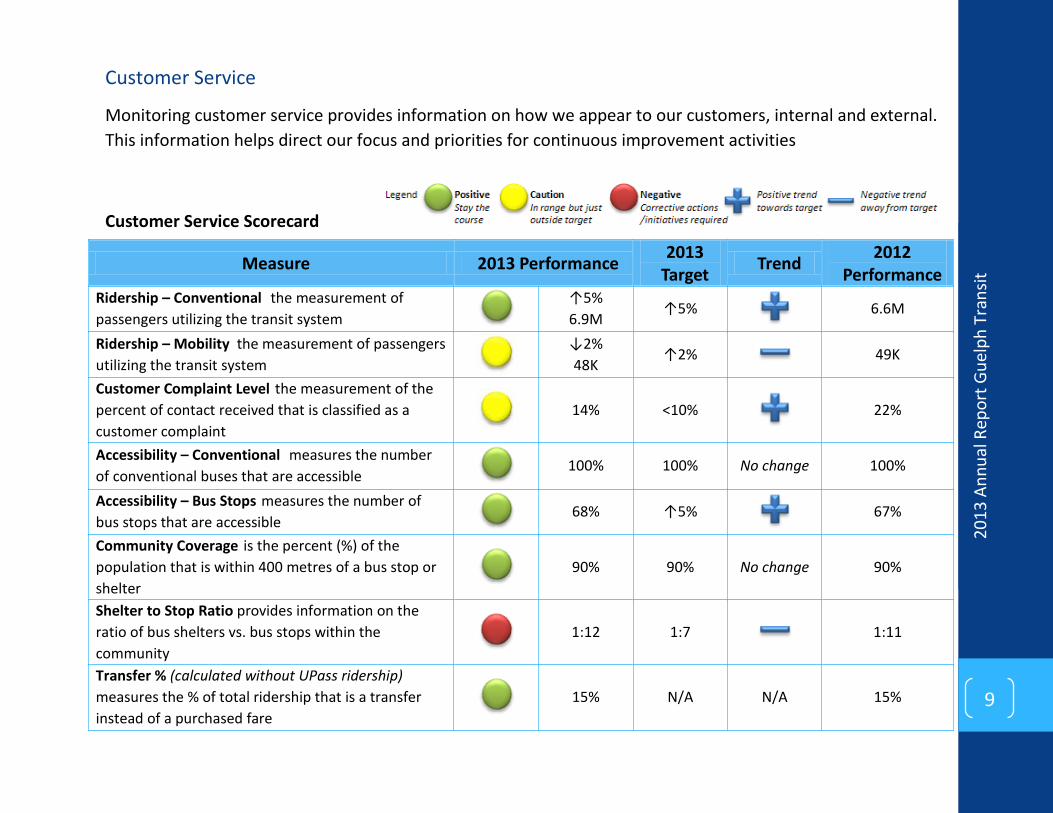
Monitoring customer service provides information on how we appear to our customers, internal and external. This information helps direct our focus and priorities for continuous improvement activities
Customer Service Scorecard
Measure 2013 Performance 2013 Target Trend 2012
Performance Ridership – Conventional the measurement of passengers utilizing the transit system
↑5% 6.9M
↑5%
6.6M
Ridership – Mobility the measurement of passengers utilizing the transit system
↓2% 48K
↑2% 49K
Customer Complaint Level the measurement of the percent of contact received that is classified as a customer complaint
14% <10%
22%
Accessibility – Conventional measures the number of conventional buses that are accessible
100% 100% No change 100%
Accessibility – Bus Stops measures the number of bus stops that are accessible
68% ↑5%
67%
Community Coverage is the percent (%) of the population that is within 400 metres of a bus stop or shelter
90% 90% No change 90%
Shelter to Stop Ratio provides information on the ratio of bus shelters vs. bus stops within the community
1:12 1:7 1:11
Transfer % (calculated without UPass ridership) measures the % of total ridership that is a transfer instead of a purchased fare
15% N/A N/A 15%
2013
Ann
ual R
epor
t Gue
lph
Tran
sit
10
Cust
omer
Ser
vice
Tre
nds
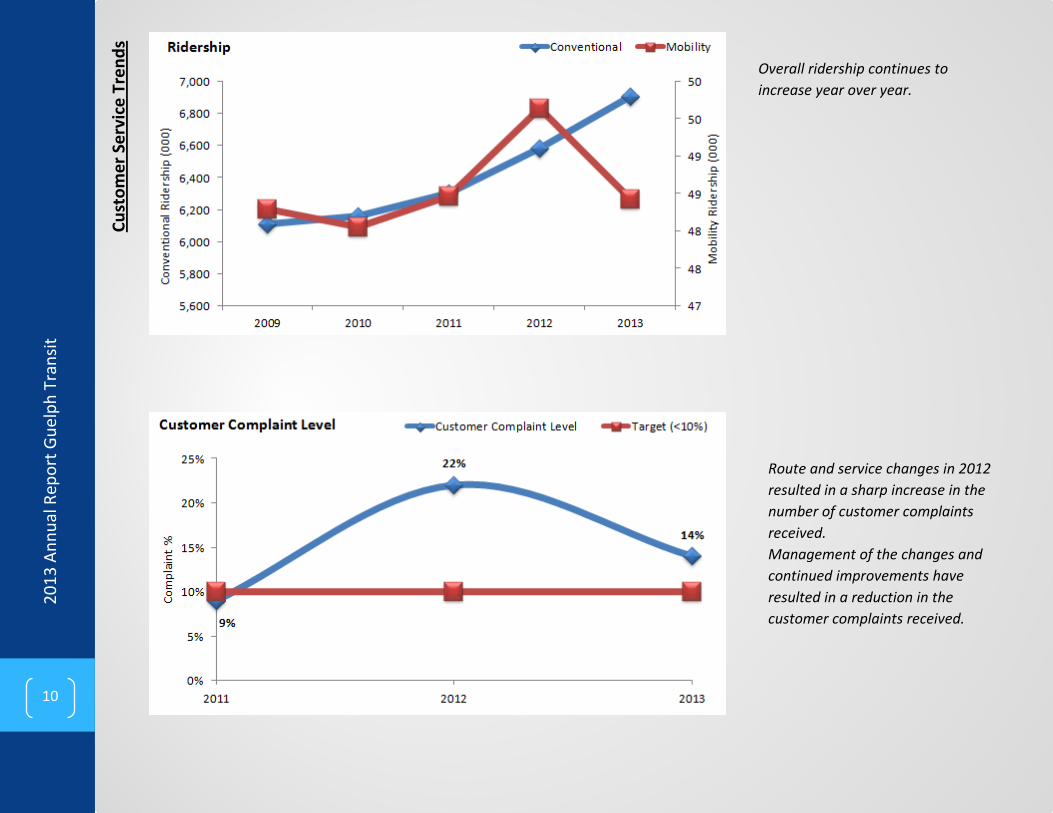
Overall ridership continues to increase year over year.
Route and service changes in 2012 resulted in a sharp increase in the number of customer complaints received. Management of the changes and continued improvements have resulted in a reduction in the customer complaints received.

2013
Ann
ual R
epor
t Gue
lph
Tran
sit
11
100% of the conventional buses are accessible. 68% of the bus stops are accessible.
90% of the population is within 400 metres of a bus stop or shelter.
The 2012 route changes resulted in shelters being removed and reinstallation is underway, where applicable.

2013
Ann
ual R
epor
t Gue
lph
Tran
sit
12
Internal Process Performance
Monitoring the process that we need to excel at in order to provide services and ensure customer and stakeholder satisfaction provides us information required to identify and prioritize continuous improvement activities.
Financial Performance Scorecard
Measure 2013 Performance 2013 Target Trend 2012
Performance Schedule Adherence measures the percentage of time the vehicle arrives at the stops no more than two (2) minutes early or five (5) minutes late compared to the scheduled time.
82% 85% 85%
Passenger Load Factors provides a measurement of infrastructure utilization.
This is a future measurement for Transit once the Transit Technology Plan is implemented. The auto-passenger counters need to be installed in the
vehicles for this data to be collected Service Utilization measures the routes that have an average of 25 passengers per hour.
This is a future measurement for Transit once the Transit Technology Plan is implemented and the auto-passenger counters are implemented.
Mileage is a statistic that tracks the total kilometers travelled while providing transit service to the community.
5.4M Statistic – No Target Set 5.0M
Cost $ per Kilometer measures the total cost of providing transit services per kilometer travelled while providing this service.
$2.36 $2.30 $1.97
Revenue $ per Kilometer measures the total revenues received per kilometer travelled while providing transit services to the community.
$1.82 $2.05 $1.90

2013
Ann
ual R
epor
t Gue
lph
Tran
sit
13
In
tern
al P
roce
ss T
rend
s
A target of 85% is in line with industry standards for transit properties the size of Guelph.
The cost per kilometre was $2.36 in 2013. The revenue per kilometre travelled was $1.82 in 2013.
Transit travelled enough kilometres to go to the moon and back 13 times or to travel around the world 121

2013
Ann
ual R
epor
t Gue
lph
Tran
sit
14
Organizational Capacity Performance
Monitoring the performance in the identified areas of organizational capacity will allow us to ensure that we can sustain our ability to change and improve.
Organizational Capacity Scorecard
Measure 2013 Performance 2013 Target Trend 2012
Performance Accident Rating is tracked through Corporate Commercial Vehicle Operator's Registration (CVOR)
38 <20-25 21
Employee Engagement was surveyed across the organization in 2012.
33% Single data point no target
set or trend available 33%
Training - ATU measures the training plan attainment, which is the planned training vs. actual training. This measure is important to ensure organizational capacity is maintained and built
100% 95% N/A 100%

2013
Ann
ual R
epor
t Gue
lph
Tran
sit
15
Org
aniz
atio
nal C
apac
ity T
rend
s
Transit employee engagement overall score was 33% engaged, 35% somewhat engaged and 33% disengaged
The accident rate is a rolling 5 year total of incidents as reported through the CVOR
2013
Ann
ual R
epor
t Gue
lph
Tran
sit
16
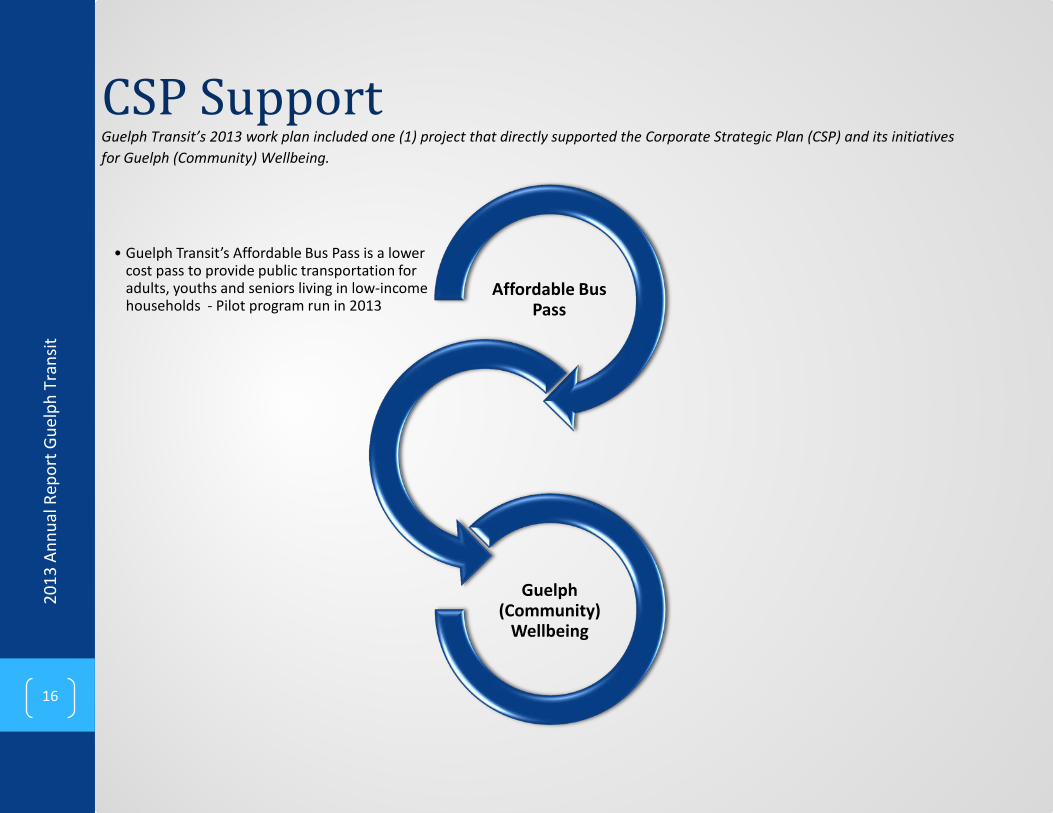
• Guelph Transit’s Affordable Bus Pass is a lower cost pass to provide public transportation for adults, youths and seniors living in low-income households - Pilot program run in 2013
Affordable Bus Pass
Guelph (Community)
Wellbeing
CSP Support Guelph Transit’s 2013 work plan included one (1) project that directly supported the Corporate Strategic Plan (CSP) and its initiatives for Guelph (Community) Wellbeing.

2013
Ann
ual R
epor
t Gue
lph
Tran
sit
17
• Support of the Hamilton Tiger Cats home games at University of Guelph
Hamilton Tiger Cats
• Implementation of new service model of peak service every 20 minutes and off-Peak service every 30 minutes
Service Model
• Initiated contract negotiations with ATU
Contract Negotiations
• Development and implementations of key performance measures
Key Performance Indicators
2013 Accomplishments
2013
Ann
ual R
epor
t Gue
lph
Tran
sit
18
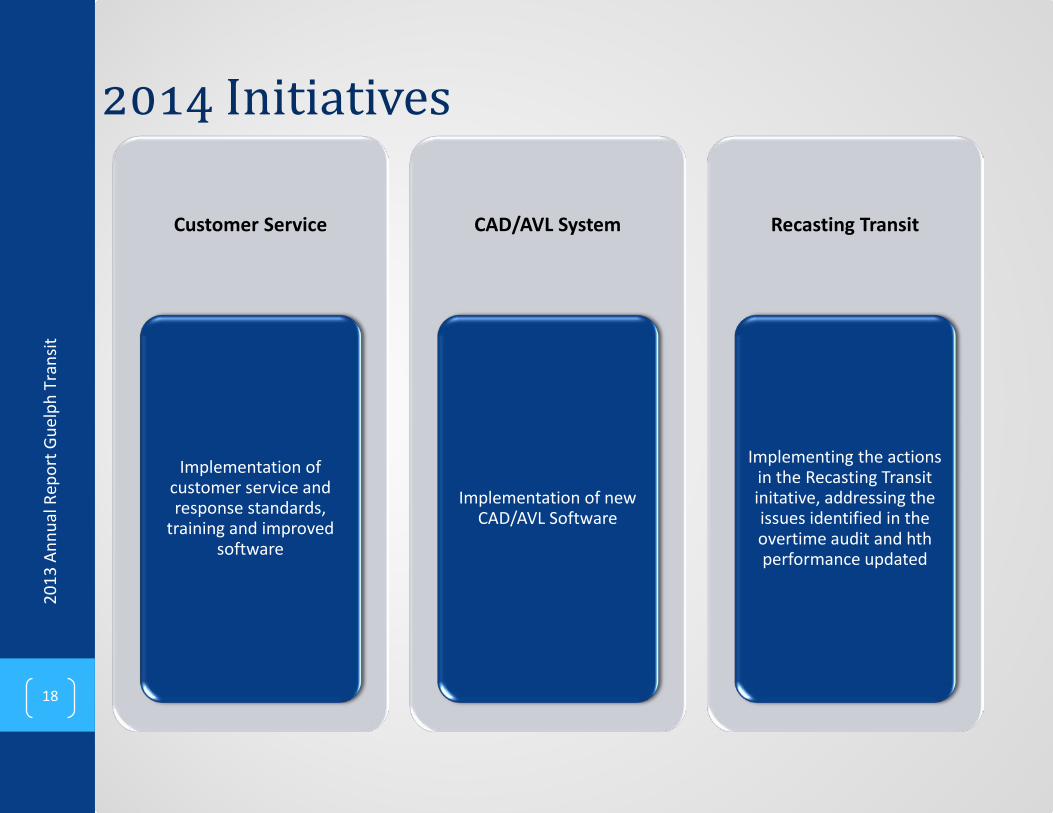
2014 Initiatives
Customer Service
Implementation of customer service and response standards,
training and improved software
CAD/AVL System
Implementation of new CAD/AVL Software
Recasting Transit
Implementing the actions in the Recasting Transit initative, addressing the issues identified in the overtime audit and hth performance updated

2013
Ann
ual R
epor
t Gue
lph
Tran
sit
19
Contact Information
Guelph Transit Administration office opens Monday to Friday from 8 a.m. to 4 p.m.
Telephone: 519-822-1811 Email: [email protected] TTY: 519-837-5731 Fax: 519-822-1322
Follow on Twitter Connect on Facebook