staff report for the 2011 article iv consultation—debt sustainability … · · 2012-04-052011...
TRANSCRIPT

CAMBODIA STAFF REPORT FOR THE 2011 ARTICLE IV CONSULTATION—DEBT SUSTAINABILITY ANALYSIS1
Cambodia has been upgraded to a “medium performer” based on the World Bank’s
Country Policy and Institutional Assessment (CPIA) and now faces a low risk of debt
distress (from moderate last year). While external debt burden indicators do not breach
the relevant indicative thresholds under the baseline scenario, the debt level is sensitive to
shocks as indicated in standard bound tests.2 Under an alternative scenario with a higher
level of borrowing over the medium and long term, Cambodia may lose its low debt
distress rating. In particular, the scope for absorbing additional risk, including from
contingent liabilities related to the rapid growth of infrastructure projects outside the
budget and the banking system, would be substantially smaller. All this underscores the
need for a prudent borrowing strategy, underpinned by continued fiscal consolidation
over the medium term, and improvements in debt and contingent liability management,
which should be incorporated in the authorities’ upcoming debt strategy document.
1 This DSA has been prepared jointly by IMF and World Bank staffs and in consultation with the Asian Development Bank (AsDB), using the debt sustainability framework for low-income countries approved by the Boards of both institutions. 2 The low-income country debt sustainability framework (LIC DSF) recognizes that better policies and institutions allow countries to manage higher levels of debt, and thus the threshold levels are policy-dependent. Cambodia’s policies and
institutions, as measured by the World Bank’s CPIA, place it as a “medium performer,” reflecting the 2010 CPIA upgrade. The
relevant indicative thresholds for this category are: 40 percent for the NPV of debt-to-GDP ratio, 150 percent for the NPV of debt-to-exports ratio, 250 percent for the NPV of debt-to-revenue ratio, 20 percent for the debt service-to-exports ratio,
and 30 percent for the debt service-to-revenue ratio. These thresholds are applicable to public and publicly guaranteed
external debt.
Approved By Vivek Arora and Dominique Desruelle (IMF) Jeffrey D. Lewis and Sudhir Shetty (IDA)
Prepared By International Monetary Fund International Development Association
January 18, 2012

2011 ARTICLE IV REPORT—DEBT SUSTAINABILITY ANALYSIS CAMBODIA
2 INTERNATIONAL MONETARY FUND
1. Cambodia’s DSA indicates that the risk of debt distress is low. Under the baseline macroeconomic outlook (Box 1), including assumptions on growth and fiscal consolidation, external debt burden indicators do not breach the relevant indicative thresholds. These thresholds are higher than in the 2010 DSA, given Cambodia’s recent upgrade as a medium performer based on the World Bank’s CPIA measure of institutional capacity.
2. Staffs have analyzed an additional country-specific alternative scenario of increased bilateral external borrowing. Assuming a doubling of external borrowing from the baseline over 2011–21 on less concessional terms than those from multilateral donors, this scenario indicates that the scope for absorbing risks would be significantly reduced and Cambodia would lose its low debt distress rating.
3. At the end of 2010, Cambodia’s external public and publicly guaranteed (PPG) debt stock was 28 percent of GDP in nominal terms and 20 percent in net present value (NPV) terms. Until 2008, strong economic growth and favorable external conditions contributed to a decline in debt ratios. However, in 2009, the external PPG debt ratios rose, partly reflecting an increase in the overall fiscal deficit against the backdrop of the global recession. For 2011, the debt stock in PV terms as a share of GDP, as a share of exports of goods and nonfactor services, and of government revenues is projected at 20 percent, 39 percent and 154 percent, respectively. The past DSA (2010) baseline macroeconomic scenario broadly matches the macroeconomic developments, with slightly higher-than-projected growth outcome in recent years, but no tangible impact on debt dynamics.
Cambodia: External Public Debt Indicators at end-2010
Indicative Thresholds
End-2010
NPV of debt, as a percent of: GDP 40 20 Exports 150 40 Revenue 250 149 Debt service, as a percent of: Exports 20 1 Revenue 30 5
Sources: IMF and World Bank.
4. Around half of Cambodia’s external debt is held by multilateral creditors, primarily the AsDB (27 percent) and the World Bank’s IDA (18 percent). China is the largest emerging creditor, accounting for about 66 percent of total bilateral disbursements in 2010. Cambodia remains in arrears to the Russian Federation and the United States. Following a Paris Club agreement in 1995, Cambodia concluded agreements with France, Germany, Italy, and Japan. The status of negotiations of outstanding debt obligations with the Russian Federation and the United States has effectively remained unchanged since the last DSA. Currently, Cambodia is not servicing its debt with either of these creditors, and efforts to conclude
Cambodia: Stock of Public and Publicly Guaranteed External Debt at End-2010
As a Share of External Total Debt
In percent of GDP
Total 100 28 Multilateral 49 14 Bilateral 51 14 Of which: Non-
rescheduled debt with the U.S. and Russian Federation 24 7
Sources: Cambodian authorities; IMF and World Bank estimates.

CAMBODIA 2011 ARTICLE IV REPORT—DEBT SUSTAINABILITY ANALYSIS
INTERNATIONAL MONETARY FUND 3
agreements with each under the framework of the Paris Club are required. Since prospects for resolution are unclear, the current DSA
assumes no restructuring in its baseline, with arrears continuing to build up throughout the projection period.
Box 1. Cambodia: Macroeconomic Assumptions Underlying the DSA (2011–31)
The Cambodian economy has performed well in 2011 with overall growth at slightly below 6 percent, on the back of robust garment exports, rising tourism income, and a recovering real estate sector. The recent severe flood is a temporary setback, but agricultural activity should revert back to trend by 2012, pushing GDP growth to 6½ percent.
Inflation is projected to average 5.6 percent in 2011, before gradually declining toward 3 percent in the medium term.
The potential growth rate of Cambodia in the medium and longer terms has been upgraded to 7–8 percent, on the assumption that Cambodia will continue implementing necessary reforms in a steadfast and evenhanded manner (for detailed analysis of the drivers of potential growth see Box 3 in the accompanying staff report). There has been some encouraging progress, such as a rising global market share in garment exports, large investments in hydropower projects that soon will substantially lower the cost of electricity in Cambodia which remains three times as high as in neighboring countries, and an emerging diversification of FDI beyond the garment manufacturing sector.
The external current account deficit (including official transfers) is projected to be above 9 percent of GDP during 2011–13, before trending toward 5 percent of GDP in the longer term. A higher current account deficit in the short term reflects high import contents of the build-operate-transfer (BOT) hydropower projects, which are incorporated in the macroeconomic
framework from 2011 onward. These imports are fully financed by corresponding FDI flows. As the construction of these power plants is completed, FDI as a share of GDP should stabilize at around 6 percent, while imports of construction materials and petroleum for electricity production should also level off. Official transfers including loans and grants are programmed to continuously decline as a percentage of GDP in line with rising per capita income. With a positive outlook for export competiveness and FDI, and a narrowing current account deficit in the longer term, gross official reserves in months of next year’s imports are expected to gradually rise from 4.3 months in 2011 toward 5 months in the long run.
Projected fiscal consolidation is an important anchor of macroeconomic stability in the medium term and beyond. The overall fiscal deficit in terms of GDP (excluding grants) is expected to narrow from about 6 percent in 2011 to less than 4 percent in 2016, before gradually falling to 2½ percent by 2031. Revenue would be the main driver of consolidation and is expected to rise to over 14 percent of GDP (excluding grants) by 2016 from about 12 percent of GDP in 2011 in line with targets adopted in the PFM reform program. Revenue (excluding grants) is assumed to increase to 16½ percent of GDP over the long term, implying that gaps in the productivity of Cambodia’s tax system vis-à-vis regional peers would gradually be closed. Public expenditure would remain mostly at around 18 percent through the medium term, and kept below 19 percent up to 2031
EXTERNAL DEBT SUSTAINABILITY ANALYSIS5. All external debt indicators remain below the policy-dependent debt burden thresholds under the baseline scenario, and no thresholds are breached under standardized stress test. The main results of the external DSA are as follows:
All debt indicators in the baseline scenario are expected to decline over the 20-year projection period (Table 1a). During the projection period, the PV of the
debt-to-GDP ratio decreases from 20 percent in 2011 to about 14 percent in 2031 (compared to an indicative threshold of 40 percent), while the PV of the debt-to- exports ratio decreases from 39 percent in 2011 to 27 percent in 2031 (compared to an indicative threshold of 150 percent). The PV of the-debt-to-revenue ratio declines from 154 percent in 2011 to 80 percent in 2031 (indicative threshold: 250 percent). The debt service-to-exports

2011 ARTICLE IV REPORT—DEBT SUSTAINABILITY ANALYSIS CAMBODIA
4 INTERNATIONAL MONETARY FUND
and debt service-to-revenue ratios stay well below the indicative thresholds throughout the entire projection period due to concessionality of previous debts.
The standard stress tests do not reveal any serious vulnerability (Table 1b and Figure 1). A one-time 30 percent depreciation and the shock to exports push the NPV of debt-to-revenue ratio to 212 and 219 percent respectively, highlighting the need for improved revenue performance.
6. An additional country-specific alternative scenario considers the impact of increased borrowing (Tables 3a and 4a). This scenario illustrates how increased borrowing (US$880 million during 2011–21, about double the amount envisaged under the baseline scenario) under consideration by the authorities can affect debt sustainability.3 The terms for most of this additional borrowing are assumed to be comparable to bilateral loans from emerging donors: 60 percent of the loans are at 2 percent interest rate with grace period and maturity of 7 and 20 years.4 With no information on the nature or the type of projects to be financed in the higher borrowing scenario and the fact the potential growth has already been upgraded since the last DSA to 7–8 percent, the alternative scenario does not assume any “growth dividends.” Limited administrative capacity of the government to manage debt-financed capital investment and challenges in public financial management would
3 Based on a borrowing scenario in the authorities’ preliminary debt strategy, which is yet to be finalized and, therefore, is not in the 2012 budget, adopted in December 2011. 4 Another 20 percent at 1 percent interest rate with a grace period and maturity of 12 and 40 years; the remaining loans are assumed to be from multilateral agencies.
further reduce the likelihood of any growth dividend. The main results under this borrowing scenario are as follows:
There would be a significant accumulation of external debt, with the total debt stock rising to 38 percent of GDP (NPV of debt-to-GDP at 29 percent) over the medium term.
In several bound tests, the indicative thresholds are breached for a prolonged period of time (Figures 3 and 4). The increased borrowing would therefore push the debt distress rating from low to moderate.
Moreover, the return to sustainable debt levels would become more difficult if contingent liabilities, which tend to correlate with shocks under the bound tests, were triggered. Given the large exposure to BOT projects as noted in the accompanying staff report, if problems in only 1 out 10 BOT projects arose potentially leading to a total loss of investment costs, an additional 5 percent of GDP would be added to the debt stock. Similarly, based on international experience, a banking crisis for a country with a financial depth as in Cambodia during the DSA projection period could add about 10 percent of GDP to public debt.5
Apart from impairing Cambodia’s ability to absorb shocks, the scenario also underscores the need to raise tax revenue as planned. If the revenue-to-GDP ratio stagnates, higher fiscal deficits would push public debt close to the sustainability threshold.
5 Based on the pace of financial deepening (e.g., credit-to-GDP ratio) during the last decade, over the DSA projection period, Cambodia’s credit-to-GDP is expected to reach or exceed that of the median emerging market (EM) economy (Rishi et al., 2010). Empirical studies show that the median direct fiscal cost of banking crises in EMs is 11.5 percent of GDP (Laeven and Valencia, 2010).
CAMBODIA 2011 ARTICLE IV REPORT—DEBT SUSTAINABILITY ANALYSIS
INTERNATIONAL MONETARY FUND 5
PUBLIC DEBT SUSTAINABILITY ANALYSIS7. Given the predominance of external debt, public debt dynamics closely track that of the external debt. Cambodia does not have, and is not expected to have in the foreseeable future, a market for domestic government debt securities.
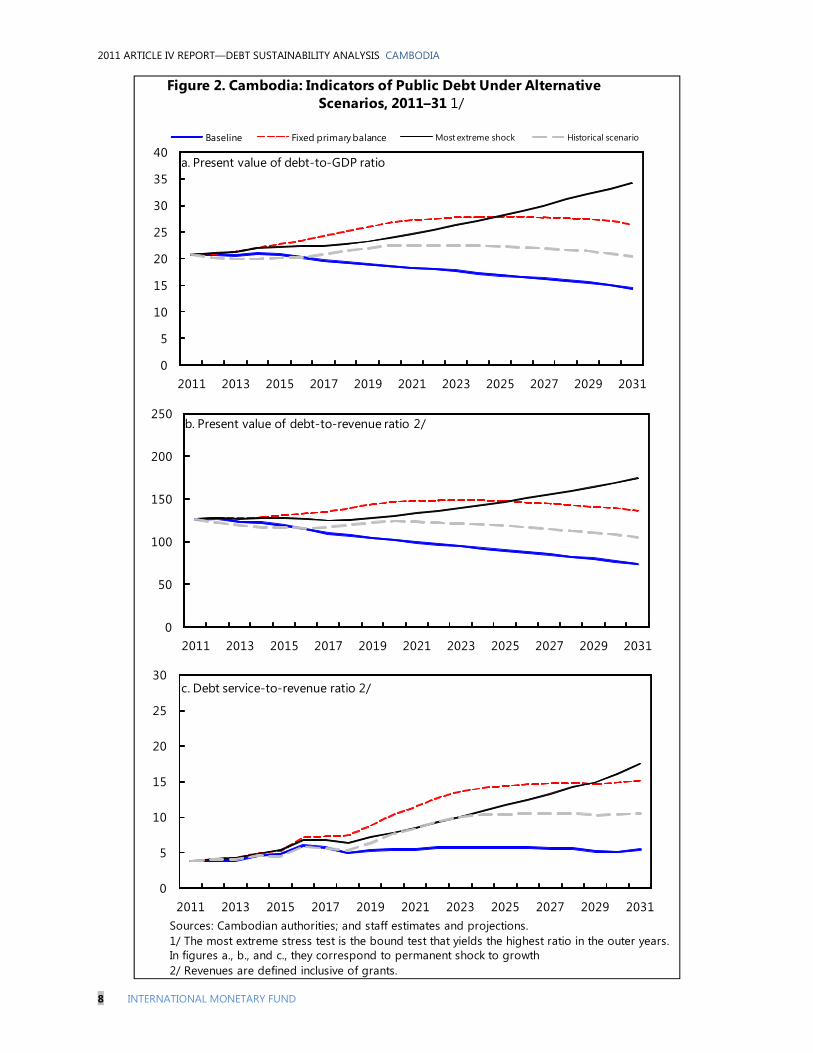
8. The nominal stock would increase modestly to 29 percent of GDP (21 percent of GDP in NPV terms) by end-2011 and then gradually decline after 2012, reflecting the fiscal consolidation envisaged under the baseline over the medium term (Table 2a). The PV of public debt-to-GDP ratio and the public debt service-to-revenue ratio would decline gradually over the
long term to 14 percent and 64 percent respectively. The debt service-to-revenue ratio remains low in most scenarios for the entire projection period under the baseline.
9. Public debt dynamics are adversely affected by a permanent growth shock and accommodative fiscal stance. Under a permanent growth shock, the level of public debt (as a share of GDP) continues to rise to over 35 percent of GDP (in PV terms). If the primary balance remains unchanged at 2011 level, the PV of public debt-to-GDP continues to rise to 28 percent increase by 2025 and then declines gradually (Table 2b).
DEBT MANAGEMENT10. The authorities are close to finalizing their formal debt strategy. Staffs welcomed the significant progress in designing a public debt strategy and the creation of a high-level (seven-member) government committee on public debt management, chaired by the Minister of Economy and Finance and co-chaired by the Governor of the National Bank of Cambodia. The debt strategy considers alternative borrowing plans and assesses associated risks. The debt unit at the MEF
is also building its capacity, including through TA provided by the AsDB, for analyzing contingent liabilities from the BOT projects and the financial sector. The authorities also acknowledge the importance of a comprehensive approach to debt management, a transparent and objective management of investment projects, and the need to maintain concessionality of new borrowing. Once finalized, the debt strategy is expected to be published in early 2012.
VIEWS OF THE AUTHORITIES11. The authorities were in broad agreement with the DSA. They underscored that government borrowing would be undertaken only for investment in a few critical sectors (e.g., infrastructure such power, roads, ports, irrigation) and that they would strengthen capacity to assess the budgetary, debt, and growth implications of
investment projects. They also welcomed suggestions to strengthen monitoring BOT projects with a view to minimizing fiscal risks. Regarding the alternative scenario with higher borrowing, the authorities concurred that elevated borrowing would lead to Cambodia’s losing the low distress rating.

2011 ARTICLE IV REPORT—DEBT SUSTAINABILITY ANALYSIS CAMBODIA
6 INTERNATIONAL MONETARY FUND
CONCLUSION12. In the staffs’ view, Cambodia is at low risk of debt distress based on external indicators under the baseline scenario and the higher thresholds as a medium performer. The baseline projections and the associated standard stress tests show limited risk related to external debt given that none of the indicators breaches the indicative debt burden thresholds. However, in view of Cambodia’s low domestic revenue base, risks to total debt and debt service need to be managed through further strengthening revenue efforts over the medium term.
13. The increase in debt ratios under an alternative scenario with a higher borrowing path highlights the need for a prudent borrowing strategy and careful management
of public debt. This exercise also underscores the importance of effective management of new debt accumulation and any contingent liabilities from the rapidly growing BOT projects and the financial sector. Increased borrowing will significantly reduce the government’s ability to tackle any future crises within the sustainability thresholds.
14. The staffs encourage the authorities to build on recent steps and move forward as quickly as possible to strengthen debt management capacity. In this regard, it will be important to continue the work under way to develop and implement a comprehensive debt management strategy and to closely monitor the contingent liabilities from the BOT projects and the financial sector.

CAMBODIA 2011 ARTICLE IV REPORT—DEBT SUSTAINABILITY ANALYSIS
INTERNATIONAL MONETARY FUND 7
Sources: Cambodian authorities; and staff estimates and projections.1/ The most extreme stress test is the bound test that yields the highest ratio in 2021. In figure b. it corresponds to a one-time depreciation shock; in c. to an export shock; in d. to a one-time depreciation shock; in e. and f. to an exports shock.
Figure 1. Cambodia: Indicators of External Debt Under Alternative Scenarios, 2011–31 1/
0
5
10
15
20
25
30
35
2011 2016 2021 2026 2031Baseline Historical scenario Most extreme shock 1/ Threshold
f. Debt service-to-revenue ratio
0
5
10
15
20
25
30
35
0.00.51.01.52.02.53.03.54.04.5
2011 2016 2021 2026 2031Rate of debt accumulation
Grant-equivalent financing (% of GDP)
Grant element of new borrowing (% right scale)
a. Debt accumulation
05
1015202530354045
2011 2016 2021 2026 2031
b. Present value of debt-to-GDP ratio
0
20
40
60
80
100
120
140
160
2011 2016 2021 2026 2031
c. Present value of debt-to-exports ratio
0
50
100
150
200
250
300
2011 2016 2021 2026 2031
d. Present value of debt-to-revenue ratio
0
5
10
15
20
25
2011 2016 2021 2026 2031
e. Debt service-to-exports ratio
2011 ARTICLE IV REPORT—DEBT SUSTAINABILITY ANALYSIS CAMBODIA
8 INTERNATIONAL MONETARY FUND
Sources: Cambodian authorities; and staff estimates and projections.1/ The most extreme stress test is the bound test that yields the highest ratio in the outer years. In figures a., b., and c., they correspond to permanent shock to growth2/ Revenues are defined inclusive of grants.
Figure 2. Cambodia: Indicators of Public Debt Under Alternative Scenarios, 2011–31 1/
0
50
100
150
200
250
2011 2013 2015 2017 2019 2021 2023 2025 2027 2029 2031
b. Present value of debt-to-revenue ratio 2/
0
5
10
15
20
25
30
35
40
2011 2013 2015 2017 2019 2021 2023 2025 2027 2029 2031
Baseline Fixed primary balance Most extreme shock Historical scenario
a. Present value of debt-to-GDP ratio
0
5
10
15
20
25
30
2011 2013 2015 2017 2019 2021 2023 2025 2027 2029 2031
c. Debt service-to-revenue ratio 2/

CAMBODIA 2011 ARTICLE IV REPORT—DEBT SUSTAINABILITY ANALYSIS
INTERNATIONAL MONETARY FUND 9
Sources: Cambodian authorities; and staff estimates and projections.1/ The most extreme stress test is the bound test that yields the highest ratio in 2021. In figure b. it corresponds to a one-time depreciation shock; in c. to an export shock; in d. to a one-time depreciation shock; in e. to an exports shock; and in figure f. to a one-time depreciation shock.
Figure 3. Alternative Scenario of Increasing Borrowing Limits, Indicatorsof External Debt, 2011–31 1/
0
5
10
15
20
25
30
35
2011 2016 2021 2026 2031Baseline Historical scenario Most extreme shock 1/ Threshold
f. Debt service-to-revenue ratio
0
5
10
15
20
25
30
35
0.0
1.0
2.0
3.0
4.0
5.0
6.0
7.0
8.0
2011 2016 2021 2026 2031Rate of debt accumulationGrant-equivalent financing (% of GDP)Grant element of new borrowing (% right scale)
a. Debt accumulation
-505
1015202530354045
2011 2016 2021 2026 2031
b. Present value of debt-to-GDP ratio
-20
0
20
40
60
80
100
120
140
160
2011 2016 2021 2026 2031
c. Present value of debt-to-exports ratio
-50
0
50
100
150
200
250
300
2011 2016 2021 2026 2031
d. Present value of debt-to-revenue ratio
0
5
10
15
20
25
2011 2016 2021 2026 2031
e. Debt service-to-exports ratio

2011 ARTICLE IV REPORT—DEBT SUSTAINABILITY ANALYSIS CAMBODIA
10 INTERNATIONAL MONETARY FUND
Sources: Cambodian authorities; and staff estimates and projections.1/ The most extreme stress test is the bound test that yields the highest ratio in 2021.In figures a. and b., they correspond to permanent shock to growth, and for c. itcorresponds to a one time depreciation in 2011. 2/ Revenues are defined inclusive of grants.
Figure 4. Alternative Scenario of Increasing Borrowing Limits, Indicatorsof Public Debt, 2011–31 1/
0
20
40
60
80
100
120
140
160
180
200
2011 2013 2015 2017 2019 2021 2023 2025 2027 2029 2031
b. Present value of debt-to-revenue ratio 2/
0
5
10
15
20
25
30
35
40
2011 2013 2015 2017 2019 2021 2023 2025 2027 2029 2031
Baseline Fixed primary balance Most extreme shock Historical scenario
a. Present value of debt-to-GDP ratio
-4
1
6
11
16
21
26
2011 2013 2015 2017 2019 2021 2023 2025 2027 2029 2031
c. Debt service-to-revenue ratio 2/

CAMBO
DIA
2011 ARTICLE IV REPORT—
DEBT SU
STAINABILITY AN
ALYSIS
INTERN
ATION
AL MO
NETARY FU
ND
11
Historical Standard 2011–16 2017–312008 2009 2010 Average 1/ Deviation 1/ 2011 2012 2013 2014 2015 2016 Average 2021 2031 Average
External debt (nominal) 2/ 27.0 28.5 27.6 28.1 28.1 27.9 28.2 27.8 27.2 24.3 18.4Of which: Public and publicly guaranteed (PPG) 27.0 28.5 27.6 28.1 28.1 27.9 28.2 27.8 27.2 24.3 18.4
Change in external debt -2.4 1.5 -0.9 0.5 0.0 -0.2 0.3 -0.4 -0.6 -0.4 -0.9Identified net debt-creating flows -8.0 -1.7 -4.8 -2.3 -0.9 -1.4 -1.8 -2.0 -2.9 -2.7 -1.9
Noninterest current account deficit 4.3 3.2 3.8 2.3 1.4 9.2 9.8 9.0 6.5 6.1 5.4 5.1 5.5 5.0Deficit in balance of goods and services 9.2 8.4 8.3 11.2 10.1 9.4 7.0 6.8 6.5 7.1 6.7
Exports 48.5 43.4 49.3 51.5 51.0 51.6 52.5 53.3 54.1 53.9 53.8Imports 57.7 51.8 57.6 62.7 61.1 61.0 59.6 60.1 60.6 61.0 60.5
Net current transfers (negative = inflow) -9.3 -9.5 -8.9 -10.0 0.8 -5.9 -4.3 -4.3 -4.4 -4.4 -4.5 -4.1 -3.6 -4.0Of which: Official -6.6 -6.7 -6.8 -3.8 -2.0 -1.8 -1.7 -1.5 -1.4 -0.8 -0.3
Other current account flows (negative = net inflow) 4.4 4.3 4.4 4.0 4.0 3.9 3.8 3.7 3.4 2.2 2.4Net FDI (negative = inflow) -7.7 -5.0 -6.8 -4.4 3.6 -10.4 -9.3 -9.0 -6.9 -6.6 -6.8 -6.5 -6.3 -6.4Endogenous debt dynamics 3/ -4.7 0.1 -1.8 -1.2 -1.4 -1.3 -1.4 -1.5 -1.5 -1.4 -1.1
Contribution from nominal interest rate 0.2 0.3 0.3 0.3 0.3 0.3 0.3 0.4 0.4 0.3 0.3Contribution from real GDP growth -1.6 0.0 -1.6 -1.4 -1.7 -1.6 -1.7 -1.9 -1.9 -1.7 -1.4Contribution from price and exchange rate changes -3.2 -0.1 -0.6 … … … … … … … …
Residual (3–4) 4/ 5.6 3.2 3.9 2.8 0.9 1.1 2.1 1.6 2.3 2.3 1.0Of which: Exceptional financing 0.0 -0.2 -0.2 -0.1 -0.1 -0.1 -0.1 -0.1 -0.1 0.0 0.0
Present value (PV) of external debt 5/ ... ... 19.5 20.2 20.4 20.2 20.6 20.3 19.9 18.1 14.3PV of external debt (in percent of exports) 5/ ... ... 39.5 39.2 39.9 39.2 39.2 38.1 36.9 33.5 26.7
PV of PPG external debt ... ... 19.5 20.2 20.4 20.2 20.6 20.3 19.9 18.1 14.3In percent of exports ... ... 39.5 39.2 39.9 39.2 39.2 38.1 36.9 33.5 26.7In percent of government revenues ... ... 149.0 154.0 151.1 145.2 142.0 137.2 131.2 110.0 79.7
Debt service-to-exports ratio (in percent) 1.2 1.5 1.4 1.2 1.2 1.4 1.6 1.6 2.0 1.7 1.7PPG debt service-to-exports ratio (in percent) 1.2 1.5 1.4 1.2 1.2 1.4 1.6 1.6 2.0 1.7 1.7PPG debt service-to-revenue ratio (in percent) 4.3 5.3 5.3 4.8 4.7 5.1 5.7 5.9 7.0 5.7 5.2Total gross financing need (in billions of U.S. dollars) -0.3 -0.1 -0.3 -0.1 0.2 0.1 0.1 0.1 -0.1 -0.1 0.1Noninterest current account deficit that stabilizes debt ratio 6.7 1.7 4.7 8.7 9.8 9.2 6.2 6.5 6.0 5.6 6.3
Key macroeconomic assumptionsReal GDP growth (in percent) 6.7 0.1 6.0 8.1 3.6 5.8 6.5 6.4 6.8 7.4 7.4 6.7 7.6 7.8 7.7GDP deflator in U.S. dollar terms (change in percent) 12.3 0.5 2.0 3.7 3.8 7.6 4.0 3.1 2.9 2.7 2.8 3.9 2.4 2.5 2.5Effective interest rate (percent) 6/ 0.8 1.1 1.1 1.1 0.1 1.1 1.1 1.2 1.3 1.4 1.5 1.3 1.5 1.6 1.5Growth of exports of G&S (U.S. dollar terms, in percent) 7.3 -10.0 22.8 12.4 12.6 18.9 9.6 11.2 11.8 12.1 11.9 12.6 10.0 10.6 10.3Growth of imports of G&S (U.S. dollar terms, in percent) 12.1 -9.8 20.3 11.6 10.7 23.8 8.0 9.7 7.3 11.3 11.2 11.9 9.7 10.8 10.4Grant element of new public sector borrowing (in percent) ... ... ... ... ... 25.5 27.5 30.8 27.3 28.7 28.7 28.1 27.0 22.6 26.0Government revenues (excluding grants, in percent of GDP) 13.0 12.0 13.1 13.1 13.5 13.9 14.5 14.8 15.2 16.4 18.0 17.0Aid flows (in billions of U.S. dollars) 7/ 0.6 0.7 0.6 0.5 0.6 0.6 0.6 0.7 0.7 0.9 1.4
Of which: Grants 0.3 0.4 0.6 0.4 0.4 0.4 0.5 0.5 0.5 0.7 1.3Of which: Concessional loans 0.2 0.2 0.0 0.1 0.1 0.2 0.2 0.2 0.2 0.2 0.2
Grant-equivalent financing (in percent of GDP) 8/ ... ... ... 4.1 3.8 3.6 3.6 3.3 3.2 2.6 1.7 2.3Grant-equivalent financing (in percent of external financing) 8/ ... ... ... 62.0 63.9 67.5 60.3 63.6 62.7 59.4 58.8 59.1
Memorandum items:Nominal GDP (in billions of U.S. dollars) 10.4 10.4 11.3 12.8 14.2 15.6 17.1 18.9 20.9 34.1 91.5Nominal dollar GDP growth 19.8 0.6 8.1 13.9 10.8 9.7 9.9 10.4 10.4 10.8 10.2 10.4 10.4PV of PPG external debt (in billions of U.S. dollars) 2.3 2.6 2.9 3.1 3.5 3.8 4.2 6.2 13.1(PVt-PVt-1)/GDPt-1 (in percent) 2.9 2.3 1.8 2.4 1.9 1.7 2.2 1.6 1.1 1.4Gross remittances (in billions of U.S. dollars) 0.3 0.3 0.2 0.3 0.3 0.4 0.5 0.5 0.6 1.1 0.9PV of PPG external debt (in percent of GDP + remittances) ... ... 19.1 19.8 19.9 19.7 20.0 19.8 19.3 17.5 14.2PV of PPG external debt (in percent of exports + remittances) ... ... 37.8 37.6 38.2 37.4 37.3 36.2 34.9 31.6 26.2Debt service of PPG external debt (in percent of exports + remittances) ... ... 1.3 1.2 1.2 1.3 1.5 1.6 1.8 1.6 1.7
Sources: Cambodian authorities; and staff estimates and projections.1/ Historical averages and standard deviations are generally derived over the past 10 years, subject to data availability. 2/ Includes both public and private sector external debt. The years in the table refer to calendar years.3/ Derived as [r - g - ρ(1+g)]/(1+g+ρ+gρ) times previous period debt ratio, with r = nominal interest rate; g = real GDP growth rate, and ρ = growth rate of GDP deflator in U.S. dollar terms. 4/ Includes exceptional financing (i.e., changes in arrears and debt relief); changes in gross foreign assets; and valuation adjustments. For projections, also includes contribution from price and exchange rate changes.5/ Assumes that PV of private sector debt is equivalent to its face value.6/ Current-year interest payments divided by previous period debt stock. 7/ Defined as grants, concessional loans, and debt relief.8/ Grant-equivalent financing includes grants provided directly to the government and through new borrowing (difference between the face value and the PV of new debt).
Actual
Table 1a. Cambodia: External Debt Sustainability Framework, Baseline Scenario, 2008–31 1/(In percent of GDP, unless otherwise indicated)
Projections

2011 ARTICLE IV REPORT—
DEBT SU
STAINABILITY A
NALYSIS CA
MBO
DIA
12 IN
TERNATIO
NAL M
ON
ETARY FUN
D
2011 2012 2013 2014 2015 2016 2021 2031
Baseline 20 20 20 21 20 20 18 14
A. Alternative scenariosA1. Key variables at their historical averages in 2011–31 1/ 20 18 16 15 14 13 10 7A2. New public sector loans on less favorable terms in 2011–31 2/ 20 21 22 23 23 23 23 21
B. Bound testsB1. Real GDP growth at historical average minus one standard deviation in 2012–13 20 21 21 21 21 21 19 15B2. Export value growth at historical average minus one standard deviation in 2012–13 3/ 20 24 30 30 29 28 24 15B3. U.S. dollar GDP deflator at historical average minus one standard deviation in 2012–13 20 21 22 22 22 21 19 15B4. Net nondebt creating flows at historical average minus one standard deviation in 2012–13 4/ 20 23 25 25 25 24 21 15B5. Combination of B1–B4 using one-half standard deviation shocks 20 23 28 28 27 26 22 16B6. One-time 30 percent nominal depreciation relative to the baseline in 2012 5/ 20 29 28 29 29 28 25 20
Baseline 39 40 39 39 38 37 34 27
A. Alternative scenariosA1. Key variables at their historical averages in 2011–31 1/ 39 36 32 29 26 25 19 13A2. New public sector loans on less favorable terms in 2011–31 2/ 39 41 42 43 43 43 43 38
B. Bound testsB1. Real GDP growth at historical average minus one standard deviation in 2012–13 39 40 39 39 38 37 33 27B2. Export value growth at historical average minus one standard deviation in 2012–13 3/ 39 51 72 70 67 64 54 35B3. U.S. dollar GDP deflator at historical average minus one standard deviation in 2012–13 39 40 39 39 38 37 33 27B4. Net nondebt creating flows at historical average minus one standard deviation in 2012–13 4/ 39 45 49 48 47 45 39 28B5. Combination of B1–B4 using one-half standard deviation shocks 39 46 56 55 53 51 43 30B6. One-time 30 percent nominal depreciation relative to the baseline in 2012 5/ 39 40 39 39 38 37 33 27
Baseline 154 151 145 142 137 131 110 80
A. Alternative scenariosA1. Key variables at their historical averages in 2011–31 1/ 154 135 117 106 95 88 63 37A2. New public sector loans on less favorable terms in 2011–31 2/ 154 157 155 156 155 152 140 114
B. Bound testsB1. Real GDP growth at historical average minus one standard deviation in 2012–13 154 154 151 147 142 136 114 83B2. Export value growth at historical average minus one standard deviation in 2012–13 3/ 154 176 219 208 198 187 144 86B3. U.S. dollar GDP deflator at historical average minus one standard deviation in 2012–13 154 157 156 153 147 141 118 86B4. Net nondebt creating flows at historical average minus one standard deviation in 2012–13 4/ 154 171 182 175 168 159 127 82B5. Combination of B1–B4 using one-half standard deviation shocks 154 174 200 192 183 173 137 87B6. One-time 30 percent nominal depreciation relative to the baseline in 2012 5/ 154 212 204 199 193 184 154 112
Table 1b. Cambodia: Sensitivity Analysis for Key Indicators of External Debt, 2011–31(In percent)
Present value of debt-to-GDP ratio
Projections
Present value of debt-to-exports ratio
Present value of debt-to-revenue ratio

CAMBO
DIA
2011 ARTICLE IV REPORT—
DEBT SU
STAINABILITY AN
ALYSIS
INTERN
ATION
AL MO
NETARY FU
ND
13
2011 2012 2013 2014 2015 2016 2021 2031
Baseline 1 1 1 2 2 2 2 2A. Alternative scenariosA1. Key variables at their historical averages in 2011–31 1/ 1 1 1 1 1 2 1 1A2. New public sector loans on less favorable terms in 2011–31 2/ 1 1 1 2 2 2 2 3B. Bound testsB1. Real GDP growth at historical average minus one standard deviation in 2012–13 1 1 1 2 2 2 2 2B2. Export value growth at historical average minus one standard deviation in 2012–13 3/ 1 1 2 2 2 3 3 3B3. U.S. dollar GDP deflator at historical average minus one standard deviation in 2012–13 1 1 1 2 2 2 2 2B4. Net nondebt creating flows at historical average minus one standard deviation in 2012–13 4/ 1 1 1 2 2 2 2 2B5. Combination of B1–B4 using one-half standard deviation shocks 1 1 2 2 2 2 3 2B6. One-time 30 percent nominal depreciation relative to the baseline in 2012 5/ 1 1 1 2 2 2 2 2
Baseline 5 5 5 6 6 7 6 5
A. Alternative scenariosA1. Key variables at their historical averages in 2011–31 1/ 5 5 5 5 5 6 4 3A2. New public sector loans on less favorable terms in 2011–31 2/ 5 5 5 6 7 8 8 8B. Bound testsB1. Real GDP growth at historical average minus one standard deviation in 2012–13 5 5 5 6 6 7 6 5B2. Export value growth at historical average minus one standard deviation in 2012–13 3/ 5 5 6 7 7 8 9 6B3. U.S. dollar GDP deflator at historical average minus one standard deviation in 2012–13 5 5 5 6 6 7 6 6B4. Net nondebt creating flows at historical average minus one standard deviation in 2012–13 4/ 5 5 6 6 7 8 7 6B5. Combination of B1–B4 using one-half standard deviation shocks 5 5 6 7 7 8 8 6B6. One-time 30 percent nominal depreciation relative to the baseline in 2012 5/ 5 7 7 8 8 10 8 7
Memorandum item:Grant element assumed on residual financing (i.e., financing required above baseline) 6/ 25 25 25 25 25 25 25 25
Sources: Cambodian authorities; and staff estimates and projections.
1/ Variables include real GDP growth, growth of GDP deflator (in U.S. dollar terms), noninterest current account in percent of GDP, and nondebt creating flows. 2/ Assumes that the interest rate on new borrowing is by 2 percentage points higher than in the baseline, while grace and maturity periods are the same as in the baseline.3/ Exports values are assumed to remain permanently at the lower level, but the current account as a share of GDP is assumed to return to its baseline level after the shock(implicitly assuming an offsetting adjustment in import levels). 4/ Includes official and private transfers and FDI.5/ Depreciation is defined as percentage decline in dollar/local currency rate, such that it never exceeds 100 percent.
Debt service-to-exports ratio
(In percent)
Projections
Table 1b. Cambodia: Sensitivity Analysis for Key Indicators of External Debt, 2011–31 (concluded)
Debt service-to-revenue ratio

2011 ARTICLE IV REPORT—
DEBT SU
STAINABILITY A
NALYSIS CA
MBO
DIA
14 IN
TERNATIO
NAL M
ON
ETARY FUN
D
Standard 2011–16 2017–312008 2009 2010 Average 1/Deviation 1/ 2011 2012 2013 2014 2015 2016 Average 2021 2031 Average
Public sector debt 2/ 27.8 29.2 28.2 28.7 28.6 28.3 28.6 28.1 27.5 24.5 18.5Of which: Foreign-currency denominated 27.0 28.5 27.6 28.1 28.1 27.9 28.2 27.8 27.2 24.3 18.4
Change in public sector debt -2.8 1.4 -1.0 0.5 -0.1 -0.3 0.3 -0.5 -0.6 -0.4 -0.9Identified debt-creating flows -4.8 4.1 -0.6 0.0 -0.1 -0.6 -0.2 -1.0 -1.2 -0.9 -0.2
Primary deficit -0.5 4.0 2.3 1.9 1.7 2.4 2.4 1.6 2.0 1.3 1.1 1.8 1.1 1.4 1.0Revenue and grants 16.4 16.3 18.0 16.4 16.4 16.8 17.2 17.4 17.6 18.4 19.4
Of which: Grants 3.3 4.2 4.9 3.3 3.0 2.8 2.7 2.5 2.4 1.9 1.4Primary (noninterest) expenditure 15.9 20.2 20.3 18.8 18.9 18.4 19.1 18.7 18.7 19.4 20.8
Automatic debt dynamics -4.3 0.1 -2.9 -2.4 -2.5 -2.2 -2.2 -2.3 -2.3 -2.0 -1.5Contribution from interest rate/growth differential -2.4 0.3 -1.7 -1.6 -1.9 -1.8 -1.9 -2.1 -2.1 -1.9 -1.5
Of which: Contribution from average real interest rate -0.5 0.3 0.0 -0.1 -0.1 -0.1 -0.1 -0.1 -0.1 -0.1 -0.1Of which: Contribution from real GDP growth -1.9 0.0 -1.6 -1.6 -1.8 -1.7 -1.8 -2.0 -1.9 -1.8 -1.4
Contribution from real exchange rate depreciation -2.0 -0.2 -1.3 ... ... ... ... ... ... ... ...Other identified debt-creating flows 0.0 0.0 0.0 0.0 0.0 0.0 0.0 0.0 0.0 0.0 0.0
Privatization receipts (negative) 0.0 0.0 0.0 0.0 0.0 0.0 0.0 0.0 0.0 0.0 0.0Recognition of implicit or contingent liabilities 0.0 0.0 0.0 0.0 0.0 0.0 0.0 0.0 0.0 0.0 0.0Debt relief (HIPC and other) 0.0 0.0 0.0 0.0 0.0 0.0 0.0 0.0 0.0 0.0 0.0Other (specify, e.g., bank recapitalization) 0.0 0.0 0.0 0.0 0.0 0.0 0.0 0.0 0.0 0.0 0.0
Residual, including asset changes 2.0 -2.7 -0.3 0.4 0.0 0.3 0.5 0.5 0.5 0.4 -0.7
Other sustainability indicators … … 20.1 20.7 20.9 20.7 21.0 20.7 20.3 18.3 14.4Of which: Foreign-currency denominated … … 19.5 20.2 20.4 20.2 20.6 20.3 19.9 18.1 14.3Of which: External ... ... 19.5 20.2 20.4 20.2 20.6 20.3 19.9 18.1 14.3
Of which: External ... ... ... ... ... ... ... ... ... ... ...Gross financing need 3/ 1.0 5.1 3.5 3.6 3.5 2.7 3.1 2.5 2.5 2.3 2.5PV of public sector debt-to-revenue and grants ratio (in percent) … … 111.6 126.7 126.9 123.5 122.3 119.3 115.2 99.5 74.3PV of public sector debt-to-revenue ratio (in percent) … … 153.7 158.3 154.8 148.6 144.9 139.8 133.5 111.2 80.1
Of which: External 4/ … … 149.0 154.0 151.1 145.2 142.0 137.2 131.2 110.0 79.7Debt service-to-revenue and grants ratio (in percent) 5/ 4.1 3.3 3.9 3.8 3.9 3.9 4.5 4.8 6.0 5.5 5.5Debt service-to-revenue ratio (in percent) 5/ 5.1 4.5 5.3 4.8 4.8 4.7 5.4 5.6 7.0 6.1 5.9Primary deficit that stabilizes the debt-to-GDP ratio 2.3 2.6 3.2 2.0 2.5 1.9 1.7 1.8 1.7 1.5 2.3
Key macroeconomic and fiscal assumptionsReal GDP growth (in percent) 6.7 0.1 6.0 8.1 3.6 5.8 6.5 6.4 6.8 7.4 7.4 6.7 7.6 7.8 7.7Average nominal interest rate on forex debt (in percent) 0.8 1.1 1.1 1.1 0.1 1.1 1.1 1.2 1.3 1.4 1.5 1.3 1.5 1.6 1.5Average real interest rate on domestic debt (in percent) -10.5 -2.1 -2.8 -4.6 2.8 -3.7 -3.5 -3.0 -2.8 -2.7 -2.8 -3.1 -2.4 -2.5 -2.5Real exchange rate depreciation (in percent, + indicates depreciation -7.2 -0.6 -4.7 -2.5 2.8 -3.1 ... ... ... ... ... ... ... ... ...Inflation rate (GDP deflator, in percent) 12.3 2.6 3.1 4.5 3.3 4.1 3.8 3.3 3.2 3.1 3.1 3.4 2.7 2.8 2.8Growth of real primary spending (deflated by GDP deflator, in percen 16.7 27.3 6.2 5.1 9.5 -1.9 6.9 3.7 11.3 4.9 7.6 5.4 10.9 8.4Grant element of new external borrowing (in percent) ... ... ... … … 25.5 27.5 30.8 27.3 28.7 28.7 28.1 27.0 22.6 ...
Sources: Cambodian authorities; and staff estimates and projections.1/ Historical averages and standard deviations are generally derived over the past 10 years, subject to data availability.2/ The public sector debt represents general government gross debt. 3/ Gross financing need is defined as the primary deficit plus debt service plus the stock of short-term debt at the end of the last period. 4/ Revenues excluding grants.5/ Debt service is defined as the sum of interest and amortization of medium- and long-term debt.
Table 2a. Cambodia: Public Sector Debt Sustainability Framework, Baseline Scenario, 2008–31(In percent of GDP, unless otherwise indicated)
Actual Projections

CAMBO
DIA
2011 ARTICLE IV REPORT—
DEBT SU
STAINABILITY AN
ALYSIS
INTERN
ATION
AL MO
NETARY FU
ND
15
2011 2012 2013 2014 2015 2016 2021 2031
Baseline 21 21 21 21 21 20 18 14A. Alternative scenariosA1. Real GDP growth and primary balance are at historical averages 21 20 20 20 20 20 22 20A2. Primary balance is unchanged from 2011 21 21 21 22 23 23 27 26A3. Permanently lower GDP growth 1/ 21 21 21 22 22 22 25 34B. Bound testsB1. Real GDP growth is at historical average minus one standard deviations in 2012–13 21 22 22 23 23 23 23 21B2. Primary balance is at historical average minus one standard deviations in 2012–13 21 22 23 24 23 23 20 15B3. Combination of B1–B2 using one half standard deviation shocks 21 21 22 22 22 22 19 15B4. One-time 30 percent real depreciation in 2012 21 29 28 27 26 25 21 16B5. 10 percent of GDP increase in other debt-creating flows in 2012 21 30 29 29 28 27 23 16
Baseline 127 127 124 122 119 115 100 74A. Alternative scenariosA1. Real GDP growth and primary balance are at historical averages 127 123 119 117 117 116 123 106A2. Primary balance is unchanged from 2011 127 127 128 129 131 133 148 136A3. Permanently lower GDP growth 1/ 127 128 127 128 128 127 133 174B. Bound testsB1. Real GDP growth is at historical average minus one standard deviations in 2012–13 127 130 132 133 132 130 124 109B2. Primary balance is at historical average minus one standard deviations in 2012–13 127 133 140 138 133 128 108 78B3. Combination of B1–B2 using one half standard deviation shocks 127 129 131 130 127 122 105 79B4. One-time 30 percent real depreciation in 2012 127 174 165 158 151 143 116 82B5. 10 percent of GDP increase in other debt-creating flows in 2012 127 182 175 169 162 154 125 85
Baseline 4 4 4 5 5 6 5 5A. Alternative scenariosA1. Real GDP growth and primary balance are at historical averages 4 4 4 5 4 6 8 11A2. Primary balance is unchanged from 2011 4 4 4 5 5 7 11 15A3. Permanently lower GDP growth 1/ 4 4 4 5 5 7 8 18
B. Bound testsB1. Real GDP growth is at historical average minus one standard deviations in 2012–13 4 4 4 5 6 7 8 10B2. Primary balance is at historical average minus one standard deviations in 2012–13 4 4 4 5 6 9 7 5B3. Combination of B1–B2 using one half standard deviation shocks 4 4 4 5 6 8 6 5B4. One-time 30 percent real depreciation in 2012 4 5 6 7 7 9 9 10B5. 10 percent of GDP increase in other debt-creating flows in 2012 4 4 5 6 14 15 10 7
Sources: Cambodian authorities; and staff estimates and projections.1/ Assumes that real GDP growth is at baseline minus one standard deviation divided by the square root of the length of the projection period.2/ Revenues are defined inclusive of grants.
Table 2b. Cambodia: Sensitivity Analysis for Key Indicators of Public Debt, 2011–31(In percent)
Present value of debt-to-GDP ratio
Projections
Present value of debt-to-revenue ratio 2/
Debt service-to-revenue ratio 2/

2011 ARTICLE IV REPORT—
DEBT SU
STAINABILITY A
NALYSIS CA
MBO
DIA
16 IN
TERNATIO
NAL M
ON
ETARY FUN
D
Historical Standard 2011–16 2017–312008 2009 2010 Average 1/ Deviation 1/ 2011 2012 2013 2014 2015 2016 Average 2021 2031 Average
External debt (nominal) 2/ 27.0 28.5 27.6 30.0 34.8 35.9 36.2 37.6 38.1 35.2 19.3Of which: Public and publicly guaranteed (PPG) 27.0 28.5 27.6 30.0 34.8 35.9 36.2 37.6 38.1 35.2 19.3
Change in external debt -2.4 1.5 -0.9 2.4 4.8 1.1 0.4 1.3 0.5 -1.2 -1.6Identified net debt-creating flows -8.0 -1.7 -4.8 0.1 1.5 0.6 -0.1 -0.5 -1.7 -2.1 -1.1
Noninterest current account deficit 4.3 3.2 3.8 2.4 1.4 11.6 12.2 11.2 8.5 8.0 7.1 6.3 6.3 6.1Deficit in balance of goods and services 9.2 8.4 8.3 13.6 12.5 11.6 9.1 8.7 8.3 8.4 7.4
Exports 48.5 43.4 49.3 51.5 51.0 51.6 52.5 53.3 54.1 53.9 53.8Imports 57.7 51.8 57.6 65.1 63.4 63.3 61.7 62.1 62.4 62.3 61.2
Net current transfers (negative = inflow) -9.3 -9.5 -8.9 -10.0 0.8 -5.9 -4.3 -4.3 -4.4 -4.4 -4.5 -4.1 -3.6 -4.0Of which: Official -6.6 -6.7 -6.8 -3.8 -2.0 -1.8 -1.7 -1.5 -1.4 -0.8 -0.3
Other current account flows (negative = net inflow) 4.4 4.3 4.4 4.0 4.1 3.9 3.8 3.7 3.3 2.0 2.5Net FDI (negative = inflow) -7.7 -5.0 -6.8 -4.4 3.6 -10.4 -9.3 -9.0 -6.9 -6.6 -6.8 -6.5 -6.3 -6.4Endogenous debt dynamics 3/ -4.7 0.1 -1.8 -1.1 -1.5 -1.6 -1.7 -1.9 -2.0 -2.0 -1.2
Contribution from nominal interest rate 0.2 0.3 0.3 0.3 0.3 0.4 0.5 0.5 0.5 0.6 0.3Contribution from real GDP growth -1.6 0.0 -1.6 -1.4 -1.8 -2.0 -2.2 -2.4 -2.5 -2.5 -1.5Contribution from price and exchange rate changes -3.2 -0.1 -0.6 … … … … … … … …
Residual (3–4) 4/ 5.6 3.2 3.9 2.3 3.3 0.5 0.5 1.8 2.2 0.9 -0.5Of which: Exceptional financing 0.0 -0.2 -0.2 -0.1 -0.1 -0.1 -0.1 -0.1 -0.1 0.0 0.0
Present value (PV) of external debt 5/ ... ... 19.6 21.7 25.7 26.7 27.2 28.4 28.9 27.5 15.2PV of external debt (in percent of exports) 5/ ... ... 39.7 42.2 50.5 51.8 51.7 53.2 53.5 50.9 28.3
PV of PPG external debt ... ... 19.6 21.7 25.7 26.7 27.2 28.4 28.9 27.5 15.2In percent of exports ... ... 39.7 42.2 50.5 51.8 51.7 53.2 53.5 50.9 28.3In percent of government revenues ... ... 149.7 167.4 192.6 191.9 185.2 188.7 185.9 165.4 81.8
Debt service-to-exports ratio (in percent) 1.2 1.5 1.4 1.3 1.3 1.6 1.8 1.9 2.3 2.7 2.4PPG debt service-to-exports ratio (in percent) 1.2 1.5 1.4 1.3 1.3 1.6 1.8 1.9 2.3 2.7 2.4PPG debt service-to-revenue ratio (in percent) 4.3 5.3 5.3 5.1 5.0 6.0 6.6 6.8 7.9 8.6 7.0Total gross financing need (in billions of U.S. dollars) -0.3 -0.1 -0.3 0.2 0.5 0.5 0.4 0.5 0.3 0.4 1.2Noninterest current account deficit that stabilizes debt ratio 6.7 1.7 4.7 9.2 7.4 10.1 8.2 6.7 6.6 7.5 7.9Key macroeconomic assumptions
Real GDP growth (in percent) 6.7 0.1 6.0 8.1 3.6 5.8 6.5 6.4 6.8 7.4 7.4 6.7 7.6 7.8 7.7GDP deflator in U.S. dollar terms (change in percent) 12.3 0.5 2.0 3.7 3.8 7.6 4.0 3.1 2.9 2.7 2.8 3.9 2.4 2.5 2.5Effective interest rate (percent) 6/ 0.8 1.1 1.1 1.1 0.1 1.2 1.1 1.4 1.5 1.6 1.6 1.4 1.7 1.7 1.7Growth of exports of G&S (U.S. dollar terms, in percent) 7.3 -10.0 22.8 12.4 12.6 18.9 9.6 11.2 11.8 12.1 11.9 12.6 10.0 10.6 10.3Growth of imports of G&S (U.S. dollar terms, in percent) 12.1 -9.8 20.3 11.6 10.8 28.6 8.0 9.5 7.1 11.1 11.0 12.5 9.5 10.7 10.2Grant element of new public sector borrowing (in percent) ... ... ... ... ... 23.8 23.3 26.5 26.1 24.9 25.3 25.0 25.7 23.0 25.2Government revenues (excluding grants, in percent of GDP) 13.0 12.0 13.1 13.0 13.4 13.9 14.7 15.0 15.6 16.6 18.6 17.3Aid flows (in billions of U.S. dollars) 7/ 0.6 0.7 0.6 0.5 0.6 0.6 0.7 0.7 0.8 1.1 1.8
Of which: Grants 0.3 0.4 0.6 0.4 0.4 0.5 0.5 0.5 0.6 0.8 1.7Of which: Concessional loans 0.2 0.2 0.0 0.1 0.1 0.2 0.2 0.2 0.2 0.2 0.2
Grant-equivalent financing (in percent of GDP) 8/ ... ... ... 4.5 4.8 4.1 3.9 4.1 3.9 3.2 2.1 2.8Grant-equivalent financing (in percent of external financing) 8/ ... ... ... 53.0 44.1 55.9 56.9 51.2 52.7 58.7 67.4 60.7Memorandum items:Nominal GDP (in billions of U.S. dollars) 10.4 10.4 11.3 12.8 14.2 15.6 17.1 18.9 20.9 34.1 91.5Nominal dollar GDP growth 19.8 0.6 8.1 13.9 10.8 9.7 9.9 10.4 10.4 10.8 10.2 10.4 10.4PV of PPG external debt (in billions of U.S. dollars) 2.3 2.8 3.7 4.2 4.6 5.4 6.0 9.4 13.9(PVt-PVt-1)/GDPt-1 (in percent) 4.6 6.8 3.5 3.1 4.2 3.6 4.3 2.0 0.5 1.5Gross remittances (in billions of U.S. dollars) 0.3 0.3 0.2 0.3 0.3 0.4 0.5 0.5 0.6 1.1 0.9PV of PPG external debt (in percent of GDP + remittances) ... ... 19.2 21.3 25.2 26.1 26.4 27.6 28.1 26.6 15.1PV of PPG external debt (in percent of exports + remittances) ... ... 38.0 40.5 48.3 49.4 49.2 50.5 50.6 48.0 27.8Debt service of PPG external debt (in percent of exports + remittances) ... ... 1.3 1.2 1.2 1.5 1.8 1.8 2.2 2.5 2.4
Sources: Cambodian authorities; and staff estimates and projections.1/ Historical averages and standard deviations are generally derived over the past 10 years, subject to data availability. 2/ Includes both public and private sector external debt. The years in the table refer to calendar years.3/ Derived as [r - g - ρ(1+g)]/(1+g+ρ+gρ) times previous period debt ratio, with r = nominal interest rate; g = real GDP growth rate, and ρ = growth rate of GDP deflator in U.S. dollar terms. 4/ Includes exceptional financing (i.e., changes in arrears and debt relief); changes in gross foreign assets; and valuation adjustments. For projections, also includes contribution from price and exchange rate changes.5/ Assumes that PV of private sector debt is equivalent to its face value.6/ Current-year interest payments divided by previous period debt stock. 7/ Defined as grants, concessional loans, and debt relief.8/ Grant-equivalent financing includes grants provided directly to the government and through new borrowing (difference between the face value and the PV of new debt).
Actual
Table 3a. Alternative Scenario of Increasing Borrowing Limits, External Sustainability Framework, 2008–31 1/(In percent of GDP, unless otherwise indicated)
Projections

CAMBO
DIA
2011 ARTICLE IV REPORT—
DEBT SU
STAINABILITY AN
ALYSIS
INTERN
ATION
AL MO
NETARY FU
ND
17
2011 2012 2013 2014 2015 2016 2021 2031
Baseline 22 26 27 27 28 29 27 15A. Alternative scenariosA1. Key variables at their historical averages in 2011–31 1/ 22 22 19 17 16 15 10 0A2. New public sector loans on less favorable terms in 2011–31 2/ 22 28 29 31 33 34 35 23B. Bound testsB1. Real GDP growth at historical average minus one standard deviation in 2012–13 22 26 28 28 29 30 28 16B2. Export value growth at historical average minus one standard deviation in 2012–13 3/ 22 29 37 37 37 37 33 16B3. U.S. dollar GDP deflator at historical average minus one standard deviation in 2012–13 22 27 29 29 31 31 30 16B4. Net nondebt creating flows at historical average minus one standard deviation in 2012–13 4/ 22 29 32 32 33 33 30 16B5. Combination of B1–B4 using one-half standard deviation shocks 22 29 35 35 36 36 32 17B6. One-time 30 percent nominal depreciation relative to the baseline in 2012 5/ 22 36 37 38 40 41 39 21
Baseline 42 51 52 52 53 54 51 28A. Alternative scenariosA1. Key variables at their historical averages in 2011–31 1/ 42 43 37 32 30 28 19 0A2. New public sector loans on less favorable terms in 2011–31 2/ 42 54 57 58 62 63 65 43B. Bound testsB1. Real GDP growth at historical average minus one standard deviation in 2012–13 42 51 52 52 53 53 51 28B2. Export value growth at historical average minus one standard deviation in 2012–13 3/ 42 63 88 86 86 85 75 37B3. U.S. dollar GDP deflator at historical average minus one standard deviation in 2012–13 42 51 52 52 53 53 51 28B4. Net nondebt creating flows at historical average minus one standard deviation in 2012–13 4/ 42 56 62 61 62 61 56 29B5. Combination of B1–B4 using one-half standard deviation shocks 42 57 70 69 69 69 62 32B6. One-time 30 percent nominal depreciation relative to the baseline in 2012 5/ 42 51 52 52 53 53 51 28
Baseline 167 193 192 185 189 186 165 82A. Alternative scenariosA1. Key variables at their historical averages in 2011–31 1/ 167 163 138 116 106 98 61 0A2. New public sector loans on less favorable terms in 2011–31 2/ 167 206 212 209 219 220 212 123B. Bound testsB1. Real GDP growth at historical average minus one standard deviation in 2012–13 167 196 199 192 196 193 172 85B2. Export value growth at historical average minus one standard deviation in 2012–13 3/ 167 218 266 251 249 241 199 88B3. U.S. dollar GDP deflator at historical average minus one standard deviation in 2012–13 167 201 206 199 203 200 178 88B4. Net nondebt creating flows at historical average minus one standard deviation in 2012–13 4/ 167 213 229 218 219 213 182 85B5. Combination of B1–B4 using one-half standard deviation shocks 167 217 249 236 236 229 194 89B6. One-time 30 percent nominal depreciation relative to the baseline in 2012 5/ 167 271 269 260 265 261 232 115
Table 3b. Alternative Scenario with Increasing Borrowing Limits: Sensitivity Analysis for Key Indicators of External Debt, 2011–31(In percent)
Present value of debt-to-GDP ratio
Projections
Present value of debt-to-exports ratio
Present value of debt-to-revenue ratio

2011 ARTICLE IV REPORT—
DEBT SU
STAINABILITY A
NALYSIS CA
MBO
DIA
18 IN
TERNATIO
NAL M
ON
ETARY FUN
D
2011 2012 2013 2014 2015 2016 2021 2031
Baseline 1 1 2 2 2 2 3 2A. Alternative scenariosA1. Key variables at their historical averages in 2011–31 1/ 1 1 1 1 1 2 1 1A2. New public sector loans on less favorable terms in 2011–31 2/ 1 1 2 2 2 3 4 3
B. Bound testsB1. Real GDP growth at historical average minus one standard deviation in 2012–13 1 1 2 2 2 2 3 2B2. Export value growth at historical average minus one standard deviation in 2012–13 3/ 1 1 2 3 3 3 4 3B3. U.S. dollar GDP deflator at historical average minus one standard deviation in 2012–13 1 1 2 2 2 2 3 2B4. Net nondebt creating flows at historical average minus one standard deviation in 2012–13 4/ 1 1 2 2 2 2 3 3B5. Combination of B1–B4 using one-half standard deviation shocks 1 1 2 2 2 3 4 3B6. One-time 30 percent nominal depreciation relative to the baseline in 2012 5/ 1 1 2 2 2 2 3 2
Baseline 5 5 6 7 7 8 9 7A. Alternative scenariosA1. Key variables at their historical averages in 2011–31 1/ 5 5 5 5 5 6 4 2A2. New public sector loans on less favorable terms in 2011–31 2/ 5 5 6 8 8 10 12 10B. Bound testsB1. Real GDP growth at historical average minus one standard deviation in 2012–13 5 5 6 7 7 8 9 7B2. Export value growth at historical average minus one standard deviation in 2012–13 3/ 5 5 7 8 8 9 12 8B3. U.S. dollar GDP deflator at historical average minus one standard deviation in 2012–13 5 5 6 7 7 9 9 8B4. Net nondebt creating flows at historical average minus one standard deviation in 2012–13 4/ 5 5 6 7 7 9 10 8B5. Combination of B1–B4 using one-half standard deviation shocks 5 5 7 8 8 9 11 8B6. One-time 30 percent nominal depreciation relative to the baseline in 2012 5/ 5 7 8 9 10 11 12 10Memorandum item:Grant element assumed on residual financing (i.e., financing required above baseline) 6/ 24 24 24 24 24 24 24 24
Sources: Cambodian authorities; and staff estimates and projections.1/ Variables include real GDP growth, growth of GDP deflator (in U.S. dollar terms), noninterest current account in percent of GDP, and nondebt creating flows. 2/ Assumes that the interest rate on new borrowing is by 2 percentage points higher than in the baseline, while grace and maturity periods are the same as in the baseline.3/ Exports values are assumed to remain permanently at the lower level, but the current account as a share of GDP is assumed to return to its baseline level after the shock(implicitly assuming an offsetting adjustment in import levels). 4/ Includes official and private transfers and FDI.5/ Depreciation is defined as percentage decline in dollar/local currency rate, such that it never exceeds 100 percent.6/ Applies to all stress scenarios except for A2 (less favorable financing) in which the terms on all new financing are as specified in footnote 2.
Debt service-to-revenue ratio
Debt service-to-exports ratio
(In percent)
Projections
Table 3b. Alternative Scenario with Increasing Borrowing Limits: Sensitivity Analysis for Key Indicators of External Debt, 2011–31 (concluded)

CAMBO
DIA
2011 ARTICLE IV REPORT—
DEBT SU
STAINABILITY AN
ALYSIS
INTERN
ATION
AL MO
NETARY FU
ND
19
Standard 2011–16 2017–312008 2009 2010 Average 1/Deviation 1/ 2011 2012 2013 2014 2015 2016 Average 2021 2031 Average
Public sector debt 2/ 27.8 29.2 28.2 30.5 35.3 36.3 36.7 37.9 38.4 35.4 19.4Of which: Foreign-currency denominated 27.0 28.5 27.6 30.0 34.8 35.9 36.2 37.6 38.1 35.2 19.3
Change in public sector debt -2.8 1.4 -1.0 2.3 4.8 1.0 0.3 1.3 0.5 -1.2 -1.6Identified debt-creating flows -4.8 4.1 -0.6 0.2 4.9 1.0 -0.1 1.0 0.2 -0.7 -0.6
Primary deficit -0.5 4.0 2.3 1.9 1.7 2.6 7.5 3.6 2.7 3.9 3.3 3.9 2.1 1.1 1.7Revenue and grants 16.4 16.3 18.0 16.2 16.3 16.8 17.5 17.8 18.3 19.0 20.5
Of which: Grants 3.3 4.2 4.9 3.3 3.0 2.9 2.9 2.8 2.7 2.4 1.8Primary (noninterest) expenditure 15.9 20.2 20.3 18.8 23.8 20.4 20.2 21.7 21.6 21.1 21.5
Automatic debt dynamics -4.3 0.1 -2.9 -2.4 -2.6 -2.6 -2.8 -2.9 -3.0 -2.8 -1.7Contribution from interest rate/growth differential -2.4 0.3 -1.7 -1.6 -2.0 -2.2 -2.4 -2.6 -2.8 -2.7 -1.6
Of which: Contribution from average real interest rate -0.5 0.3 0.0 0.0 -0.1 -0.1 -0.1 -0.1 -0.1 -0.1 -0.1Of which: Contribution from real GDP growth -1.9 0.0 -1.6 -1.6 -1.9 -2.1 -2.3 -2.5 -2.6 -2.6 -1.5
Contribution from real exchange rate depreciation -2.0 -0.2 -1.3 ... ... ... ... ... ... ... ...Other identified debt-creating flows 0.0 0.0 0.0 0.0 0.0 0.0 0.0 0.0 0.0 0.0 0.0
Privatization receipts (negative) 0.0 0.0 0.0 0.0 0.0 0.0 0.0 0.0 0.0 0.0 0.0Recognition of implicit or contingent liabilities 0.0 0.0 0.0 0.0 0.0 0.0 0.0 0.0 0.0 0.0 0.0Debt relief (HIPC and other) 0.0 0.0 0.0 0.0 0.0 0.0 0.0 0.0 0.0 0.0 0.0Other (specify, e.g., bank recapitalization) 0.0 0.0 0.0 0.0 0.0 0.0 0.0 0.0 0.0 0.0 0.0
Residual, including asset changes 2.0 -2.7 -0.3 2.1 -0.1 0.1 0.4 0.3 0.2 -0.5 -1.0Other sustainability indicators … … 20.2 22.3 26.2 27.2 27.6 28.8 29.3 27.7 15.3
Of which: Foreign-currency denominated … … 19.6 21.7 25.7 26.7 27.2 28.4 28.9 27.5 15.2Of which: External ... ... 19.6 21.7 25.7 26.7 27.2 28.4 28.9 27.5 15.2
Of which: External ... ... ... ... ... ... ... ... ... ... ...Gross financing need 3/ 1.0 5.1 3.5 3.7 8.7 4.8 4.0 5.2 4.8 3.6 2.4PV of public sector debt-to-revenue and grants ratio (in percent) … … 112.1 137.2 160.8 161.4 157.4 161.3 160.2 145.6 74.9PV of public sector debt-to-revenue ratio (in percent) … … 154.4 171.7 196.4 195.2 188.1 191.2 188.1 166.7 82.2
Of which: External 4/ … … 149.7 167.4 192.6 191.9 185.2 188.7 185.9 165.4 81.8Debt service-to-revenue and grants ratio (in percent) 5/ 4.1 3.3 3.9 3.8 4.6 4.6 5.0 5.3 6.4 7.0 6.1Debt service-to-revenue ratio (in percent) 5/ 5.1 4.5 5.3 4.8 5.6 5.6 6.0 6.3 7.5 8.0 6.7Primary deficit that stabilizes the debt-to-GDP ratio 2.3 2.6 3.2 0.2 2.8 2.6 2.4 2.6 2.8 3.3 2.7Key macroeconomic and fiscal assumptionsReal GDP growth (in percent) 6.7 0.1 6.0 8.1 3.6 5.8 6.5 6.4 6.8 7.4 7.4 6.7 7.6 7.8 7.7Average nominal interest rate on forex debt (in percent) 0.8 1.1 1.1 1.1 0.1 1.2 1.1 1.4 1.5 1.6 1.6 1.4 1.7 1.7 1.7Average real interest rate on domestic debt (in percent) -10.5 -2.1 -2.8 -4.6 2.8 -3.7 -3.5 -3.0 -2.8 -2.7 -2.8 -3.1 -2.4 -2.5 -2.5Real exchange rate depreciation (in percent, + indicates depreciatio -7.2 -0.6 -4.7 -2.5 2.8 -3.1 ... ... ... ... ... ... ... ... ...Inflation rate (GDP deflator, in percent) 12.3 2.6 3.1 4.5 3.3 4.1 3.8 3.3 3.2 3.1 3.1 3.4 2.7 2.8 2.8Growth of real primary spending (deflated by GDP deflator, in perce 16.7 27.3 6.2 5.1 9.5 -1.9 35.1 -8.8 5.8 15.3 6.5 8.7 8.8 8.3Grant element of new external borrowing (in percent) ... ... ... … … 23.8 23.3 26.5 26.1 24.9 25.3 25.0 25.7 23.0 ...
Sources: Cambodian authorities; and staff estimates and projections.1/ Historical averages and standard deviations are generally derived over the past 10 years, subject to data availability.2/ The public sector debt represents general government gross debt. 3/ Gross financing need is defined as the primary deficit plus debt service plus the stock of short-term debt at the end of the last period. 4/ Revenues excluding grants.5/ Debt service is defined as the sum of interest and amortization of medium- and long-term debt.
Table 4a. Alternative Scenario of Increasing Borrowing Limits: Public Sector Debt Sustainability Framework, 2008–31(In percent of GDP, unless otherwise indicated)
Actual Projections

2011 ARTICLE IV REPORT—
DEBT SU
STAINABILITY A
NALYSIS CA
MBO
DIA
20 IN
TERNATIO
NAL M
ON
ETARY FUN
D
2011 2012 2013 2014 2015 2016 2021 2031
Baseline 22 26 27 28 29 29 28 15A. Alternative scenariosA1. Real GDP growth and primary balance are at historical averages 22 21 20 20 20 20 19 16A2. Primary balance is unchanged from 2011 22 22 22 22 23 23 24 22A3. Permanently lower GDP growth 1/ 22 27 28 29 31 32 35 36B. Bound testsB1. Real GDP growth is at historical average minus one standard deviations in 2012–13 22 27 29 30 32 32 33 22B2. Primary balance is at historical average minus one standard deviations in 2012–13 22 23 24 24 26 27 26 15B3. Combination of B1–B2 using one half standard deviation shocks 22 22 22 23 25 26 25 15B4. One-time 30 percent real depreciation in 2012 22 34 34 34 34 34 31 18B5. 10 percent of GDP increase in other debt-creating flows in 2012 22 35 36 36 36 36 32 17
Baseline 137 161 161 157 161 160 146 75A. Alternative scenariosA1. Real GDP growth and primary balance are at historical averages 137 128 121 115 112 108 100 77A2. Primary balance is unchanged from 2011 137 133 130 128 128 127 127 110A3. Permanently lower GDP growth 1/ 137 162 165 163 171 173 181 172B. Bound testsB1. Real GDP growth is at historical average minus one standard deviations in 2012–13 137 165 171 169 176 177 171 109B2. Primary balance is at historical average minus one standard deviations in 2012–13 137 139 141 139 145 145 136 71B3. Combination of B1–B2 using one half standard deviation shocks 137 135 133 132 138 140 134 73B4. One-time 30 percent real depreciation in 2012 137 209 203 193 192 187 162 86B5. 10 percent of GDP increase in other debt-creating flows in 2012 137 216 212 204 203 198 170 85
Baseline 4 5 5 5 5 6 7 6A. Alternative scenariosA1. Real GDP growth and primary balance are at historical averages 4 4 4 4 0 1 0 6A2. Primary balance is unchanged from 2011 4 4 4 5 1 2 3 11A3. Permanently lower GDP growth 1/ 4 4 5 6 6 8 11 20B. Bound testsB1. Real GDP growth is at historical average minus one standard deviations in 2012–13 4 4 5 6 6 8 11 12B2. Primary balance is at historical average minus one standard deviations in 2012–13 4 4 5 5 2 4 6 6B3. Combination of B1–B2 using one half standard deviation shocks 4 4 4 5 1 2 6 6B4. One-time 30 percent real depreciation in 2012 4 5 7 8 8 10 13 14B5. 10 percent of GDP increase in other debt-creating flows in 2012 4 4 6 7 15 15 13 9
Sources: Cambodian authorities; and staff estimates and projections.1/ Assumes that real GDP growth is at baseline minus one standard deviation divided by the square root of the length of the projection period.2/ Revenues are defined inclusive of grants.
Table 4b. Alternative Scenario of Increasing Borrwing Limits: Sensitivity Analysis for Key Indicators of Public Debt, 2011–31(In percent)
Present value of debt-to-GDP ratio
Projections
Present value of debt-to-revenue ratio 2/
Debt service-to-revenue ratio 2/

CAMBODIA STAFF REPORT FOR THE 2011 ARTICLE IV CONSULTATION—INFORMATIONAL ANNEX Prepared By
Asia and Pacific Department (In consultation with other departments)
I. Fund Relations .................................................................................................................. 2
II. IMF-World Bank Collaboration...................................................................................... 4
III. Relations with the Asian Development Bank ............................................................. 7
IV. Statistical Issues ........................................................................................................... 10
V. Main Websites of Data ................................................................................................. 13
CONTENTS
January 18, 2012