staffing cutbacks in the south australian public sector and their likely effects
DESCRIPTION
Results of a survey of state public sector employeesTRANSCRIPT

Staffing cutbacks in the South Australian public sector and their likely effects
Results of a survey of state public sector employees
Submitted to …DateSubmitted to …Date
Mike RaffertyHanna SchutzSerena Yu
Faculty of Economics and BusinessUniversity of Sydney
Acknowledgements
The authors wish to thank the more than 3,000 survey participants who spent the time completing the surveys. An earlier version of the survey was trialled on a group of public sector employees in South Australia, and they provided very useful feedback on its clarity and content. Jill Considine and Sally Wright provided very insightful comments and suggestions on an earlier version of the report. Funding support for the study was provided by the Public Service Association of South Australia. The report reflects solely the views of the authors, who are responsible for any remaining errors or omissions.
Report Summary
In 2009, the South Australian government announced it would be cutting public sector employees by 1600 over the next three years. In announcing the cutbacks, the SA Treasurer said that doing so would help restore the State’s fiscal position in the wake of the Global Financial Crisis. The Treasurer also suggested that it would target staff cuts on back office administrative staff. The implication here was that this targeting would prevent or at least minimise any impact on actual service delivery to the public.
The current paper reports the results of a survey of public sector employees in South Australia. The survey asked respondents about their current work arrangements, their experiences with previous staff cutbacks and expectations about current and impending cuts.
An earlier paper examined the claimed fiscal credentials of the retrenchment of public spending during a recession (Rafferty 2009). Rafferty found that the weight of recent academic and policy research supports a countercyclical role for fiscal policy. Further, when the private sector does fill the gaps that emerge with public sector cutbacks it is at considerably greater cost. Rafferty also argued that targeting fiscal residuals, such as surpluses and deficits, is now considered to be a poor approach to good policy, partly because it ignores the large longerterm impacts of spending and taxing in general. Also, spending on building physical and especially human capital is now understood to be critical to economic success, but public finance still treats the two differently (spending on physical capital is understood to have long lasting effects, but the effects of spending on human capital are treated as transitory).
The current paper is a companion piece to a survey of the empirical evidence on the effects of staffing cuts on service provision (Norton et.al. 2009). In reviewing the empirical research, Norton et al. found that cutbacks, particularly those motivated by shortterm gains, that target cuts on an acrosstheboard basis and do not attempt to change the scope of delivery to reflect the lower resourcing tend to be quite damaging to service delivery and to the organisations delivering those services. These are features that seem to characterise the South Australian Government’s motivation and approach to the planned implementation of cutbacks. Research on staffing cutbacks in Australia whether in the private or public sector is notably scarce, and one advantage of the current research is that it provides insights from those people directly engaged in the process of public sector service delivery.
Below is a summary of the key research findings: 1. The South Australian public sector is characterised by a long
term vocationally oriented workforce, with a high proportion of
3

the workforce involved, in some way, in frontline service delivery.
2. There is little empirical support for the notion of a neat distinction between frontline service delivery and back office administrative support work. Indeed, the largest group of survey respondents report performing both service delivery and administrative tasks: raising the question of how staffing cutbacks could even begin to exclusively target nonservice delivery employees.
3. Public sector employees in South Australia are working long hours that often include large amounts of unpaid overtime, are carrying high workloads, and are working under a considerable amount of pressure.
4. There is significant concern about the standard of services that will be able to be achieved as cutbacks are rolled out.
5. Many areas of service provision seem to be stressed to breaking point already. For instance, twothirds of workers who have frontline service delivery responsibilities said that any further cutbacks will result in at least a oneforone reduction in services.
6. Of particular concern with regard to the effect of cutbacks are longer queues, delays in processing, inadequately trained staff, reductions in the quality of services, and staff dissatisfaction with resultant quality of service delivery.
7. We also found that public sector employees anticipate that they will suffer increased aggravation and complaints from the general public as services standards subsequently decline.
Put simply, we found that the planned cuts in staffing of the public sector can be expected to have a deleterious effect on the availability and quality of public services, and will increase workload pressures on remaining staff. The proposition advanced by the Government – that by concentrating cuts on so called back office administrative staff, the cuts will not affect services finds no support in this research.
Our findings are consistent with other research that has shown that the nature of public service delivery tends to be team based. Therefore, neat demarcations between service delivery and administrative staff are, not only difficult, but often inappropriate, to make. In recent reviews of child protection services in South Australia, and in reviews of populist fiscal retrenchment campaigns such as the Commonwealth’s ‘efficiency dividend’, there is strong evidence that cuts have eroded the capacity of agencies to adequately deliver services that what were once considered basic requirements in a wealthy and decent society.
4
It is clear from this study that the proposed cutbacks of 1600 public sector employees will have a significant impact on services delivered to the South Australian public. The open question is how much of an impact. Respondents in this study paint some fairly alarming scenarios. The next stage of this research project will be to develop some realistic models of the likely effects of cuts in specific service delivery areas.
5

Table of Contents
1. Introduction 6
2. Background and survey description 7
3. Description of survey respondents 9
4. Experience of previous staffing cutbacks 18
5. Effects of past staff cutbacks on service delivery 19
6. Expectations about likely effects of
planned staffing cutbacks 20
7. Additional survey analysis 21
8. Summary Conclusions 21
9. References 23
6
1. Introduction
In 2008, the South Australian government announced that it would cut back on staffing by 1600 people. In its 20082009 Budget, South Australian Treasurer, The Hon. Kevin Foley, announced a series of cuts in public spending which were said to be about responding to the fiscal effects of the Global Financial Crisis (GFC). In particular, cuts amounting to $250 million over the threeyear forward estimates were announced.1 Subsequently, in the midyear budget review, Kevin Foley announced that to realise the cuts in spending, the State Government would cut around 1600 public sector jobs. The Treasurer argued that one of the key consequences of the fiscal cutbacks would be a “reduction of 1600 public servants not directly involved in the delivery of frontline services.”2 (Foley 2009, 4).
This paper should be read in conjunction with an earlier report on the fiscal credentials of the planned cutbacks (Rafferty 2009) as well as recent policy research on public spending in a downturn (Spilimbergo et.al. 2008, and Freedman 2009). These metaanalyses have established that the weight of recent academic and policy research supports a countercyclical role for fiscal policy. As one review of the extant evidence suggests:
“…quite simply, governments should make sure that existing programs are not cut for lack of resources” (Spilimbergo et.al. 2008, 6)
Furthermore, targeting fiscal residuals like the yeartoyear surplus or deficit is a poor approach to good policy. The targeting of fiscal residuals ignores the large impacts of spending and taxing in an absolute sense. This approach also ignores the fact that spending on physical capital is treated differently to spending on human capital: spending on physical capital is understood to have long lasting effects, but the effects of spending on human capital are treated as transitory.
1 In delivering the 200809 SA budget, Treasurer Foley explained that : “The Treasurer says that this will be his seventh State Budget and the seventh he has handed down in surplus. The Budget will deliver a net operating surplus of: $160 million in 200809; $356 million in 200910; $434 million in 201011; and $424 million in 201112. We fought hard to win our AAA credit rating and I am not about to give that away through reckless spending or tax cuts. The ongoing uncertainty in world financial markets means that, in addition to building for the future, we must manage potential risks. The Budget also [therefore] sets new savings targets across portfolios of: $25 million in 200910; $75 million in 2010 11; and $150 million in 2011‐12.” SA Treasury Budget Overview 2008. 2 According to Treasurer Foley, “In successive budgets the government has continued to put additional resources into frontline services with significant increases in doctors, nurses, teachers and police. Over the forward estimates (ie by 30 June 2012) the public sector workforce is projected to grow by 4200 full time equivalents compare with 30 June 2006.Against that background the government has decided to seek a reduction in public sector staff focused on administrative positions. The government will ask agency Chief Executives to reduce FTEs by 1200 by the end of 200910. A further staff reduction of 200 FTEs will be sought in each of 201011 and 201112.” (Foley 2009, 6).
7
This paper is predominantly concerned with the effect of the planned cutbacks, on staffing and service delivery. In announcing the staffing cutbacks, Treasurer Foley said the government was focusing on cutting, what he termed administrative staff, rather than frontline service delivery personnel. Implicit in the targeting is the assumption that the two types of activities are relatively well demarcated, and that nonfrontline service delivery staff or activities do not facilitate service delivery.
This proposition is contentious but untested. One purpose of the current research is to test the proposition empirically3. This report summarises the results of a survey of public sector employees in South Australia who were asked about their current work arrangements, their experiences with previous staff cutbacks and expectations about current and impending cuts. One advantage of this research is that it draws information from those closest to actual public service delivery and administration. The findings provide very valuable insights into the current provision of public services, the effects of past cutbacks and the likely impacts of proposed cutbacks.
The rest of the report is structured as follows: the next section provides a background to the survey including the research design, and data collection approach. This is followed by a section describing the characteristics of the sample and comparing, where possible, the sample with the population. The subsequent section reports the results of the survey in terms of past and expected effects of staff cutbacks. The report concludes with a discussion of areas for further research and a summary of the major findings of the research.
2. Background and survey description
In December 20094, an online survey was conducted of state public sector employees in South Australia. The survey was designed to obtain three types of data, and offered two ways of providing responses. The survey sought information from public sector employees on their:
1. current work arrangements, 2. experiences with previous staff cutbacks, and 3. expectations about current and impending cuts.
Most of the survey questions asked respondents to indicate, on a fivepoint scale, the extent to which they agreed or disagreed to a range of statements. However, respondents were also able to comment, in their own words, about likely impacts of the cutbacks.
3 An earlier report reviewed the existing literature on the effects of staffing and fiscal policy retrenchment (Norton et.al. 2009).
4 The survey was closed on December 31, 2009.
8

Public Service Association (PSA) members of South Australia were sent an email from the PSA to inform them of the study and ask them to participate. All storage and record keeping of the survey data, as well as analysis and reporting was undertaken solely by the authors.
Some 3,092 responses were received although not all respondents answered all questions so response numbers vary across the findings from 1163 to 3092 respondents. The online survey was closed off at the end of December 2009. Partial responses were included in the analysis.
9

3. Description of the survey respondents
3.1 Length of service in the public sector
A large number of the survey respondents were longterm vocationally oriented employees. As shown in Chart 1, 43 percent of respondents have been employed in the public sector for more than 20 years, with a further 27 percent (70 percent cumulatively) employed in the public sector between 10 and 19 years. The longterm tenure of these employees far exceeds national averages. By way of a benchmark, the average tenure of the Australian worker is around 5 years, with only 24 percent of Australian workers employed by the same employer for over ten years (ABS 2008a). A further comparison can be made with the Australian public sector more broadly, where 34 percent of workers are of long term tenure, (exceeding ten years).
Chart 1 Composition of survey respondents, by tenure in public sector
Less than 1 Year
2% 14 Years11%
59 Years17%
1019 Years27%
20+ Years43%
3.2 Length of employment with current agency/area
Almost two thirds of respondents have been working in their current agency/area for more the 5 years (61%), with only 9 percent reporting that they have been working there for less than 1 year.
3.3 Gender
The female dominated nature of the sector was reflected in the findings with women comprising two thirds (66%) of all respondents. As we discuss later, it might be useful to compare the gender composition of respondents to the
10

broader population of the PSA membership and indeed the SA public sector workforce. Nationally, however, approximately 45 percent of the broader Australian workforce is female (ABS 2008b).
3.4 Area of employment
As shown in Chart 2, the largest number of respondents work in the core human services areas of Health (29%), Families and Communities (19%), and Justice services (police, correctional and attorney general’s – 11%). A further 11 percent work in transport, energy and infrastructure, 6 percent in Education (primary, secondary and further) and Children’s services and the remainder (24%) are spread across a range of other functional areas.
Chart 2 Composition of Respondents, by functional area
Health29%
Education and
Children's Services
6%
Transport11%Justice
11%
Families and
Communities
19%
Other24%
3.5 Employment classification
Most of the respondents (68%) are employed as an Administrative Service Officer (ASO), a further 15 percent are employed as Professional Officers (POs), and 11 percent as Operational Services (OPS) workers.
3.6 Frontline service delivery and administrative support
Chart 3 shows that in describing their current role, 30 percent of respondents reported their role as predominantly “frontline service delivery” and 27 percent as predominantly, “administrative support”. Given the proposed
11

staffing cutbacks however, a significant finding is that almost half of all respondents (43%) report being responsible for a combination of both frontline service delivery and administrative support. This point is discussed in more detail below, but it bears noting here that the neat demarcation between front line service delivery and administrative support is not supported by survey participants.
Chart 3 Composition of respondents, nature of work undertaken
Front30%
Back27%
Mixed43%
The survey respondents are fairly evenly distributed in lengths of tenure between the three work roles (frontline, administrative and mixed). Almost two thirds (63 percent) of frontline service delivery workers have worked in the public sector for over 10 years. This compares to 72 percent of back office staff and 73 percent of staff who have mixed responsibilities with a similar tenure of over 10 years.
3.7 Employment status
As shown in Chart 4, 83 percent of respondents are employed on a fulltime continuing basis and 17 percent are employed on a parttime basis. The Chart shows that only a handful of respondents (0.4%) are employed on a casual basis. The low rate of casualisation indicated, however, is probably due to the lower rate of union membership amongst casual employees and generally poorer response rates among casual employees. Previous research has shown that casualisation in the community services sector is relatively high compared to other sectors (e.g. Campbell 2004). By way of comparison, 70
12
percent of the broader Australian work force is employed full time (and 30 percent part time), with the incidence of casual work reaching 20 percent of all workers (ABS 2008b).
13

Chart 4 Composition of respondents, by employment status (% of total)
Full Time82.9%
Part Time16.8%
Casual0.4%
3.8 Geographic location
More than eight out of ten respondents work in the Adelaide metropolitan area, with the remainder (19%) working in regional South Australia.
3.9 Hours of work
As shown in Chart 5, 20 percent of respondents work 35 hours or less per week. Over half, (57%) work between 3640 hours and a quarter (23%) work 41 or more hours each week. By way of comparison, the average fulltime Australian worker works 38.1 hours, with an average 1.6 hours of paid overtime (ABS 2008c). The comparison survey response and the ABS series are not measuring exactly the same thing, (our survey included all workers, whereas the ABS survey includes fulltime workers). Nevertheless, survey responses suggest the prevalence of extended hours, and as we show below, a significant portion of respondents also reported a high incidence of unpaid overtime hours.
14

Chart 5 Composition of respondents, by weekly working hours
<20 hours3% 2130 hours
10%
3135 hours7%
3640 hours57%
41+ hours23%
3.10 Overtime and unpaid work
In total, 55 percent of respondents report regularly working unpaid overtime. Of these, more than 40 percent work between 12 hours of unpaid work per week, one third (33%) work 34 unpaid hours per week, and one in five (20%) work 510 hours of unpaid work. Three percent did between 1120 hours of unpaid work, and 1 percent did more than 20 hours unpaid work per week.
The total number of unpaid hours these respondents alone are working equates to between 3,319 to 5,671 hours per week. Converting this into a fulltime equivalent staffing rate, shows that, at a conservative estimate, these respondents alone, on top of their paid working hours, are donating to the public sector the workload equivalent of between 83 and 142 FTE staff per year5. This suggests that much service delivery is contingent on the goodwill of a vocationally oriented workforce.
5 These figures are calculated by multiplying the lower bounds of each of the unpaid hours brackets by the total number of people working these hours and summing those totals. Eg. 476 people working one hour of unpaid overtime (lower bound) each week, 378 people working 3 hours of unpaid overtime each week… and so on. The FTE is calculated by total the total number of unpaid hours worked (3319 per week), dividing it by an FTE of 40 hours per week.
15

Table 1 Average number of unpaid hours of work per weekChart 4 – Average number of unpaid hours of work per week
In disaggregating the responses, it becomes clear that the incidence of unpaid hours falls more heavily on workers with some or all of their duties belonging to frontline service delivery (those reporting that they do mostly frontline service delivery or a mixture of both service delivery and administration), with 24 percent of these workers experiencing at least 5 unpaid hours per week, compared to 19 percent of those reporting to be back office workers.
The experience of unpaid work also diverges across functional areas, with one in four respondents working at least 5 unpaid hours in Education, Transport and Justice Services, and almost one in two in Environmental Services. Refer to Chart 6.
Chart 6 Incidence of unpaid overtime (greater than 5 hours per week),by functional area*
0%
10%
20%
30%
40%
50%
60%
Health Education FurtherEducation /Employment
Transport Justice Families andCommunities
Environment
16
*Note that fewer than 30 responses were recorded for the Environmental and Further Education departments.
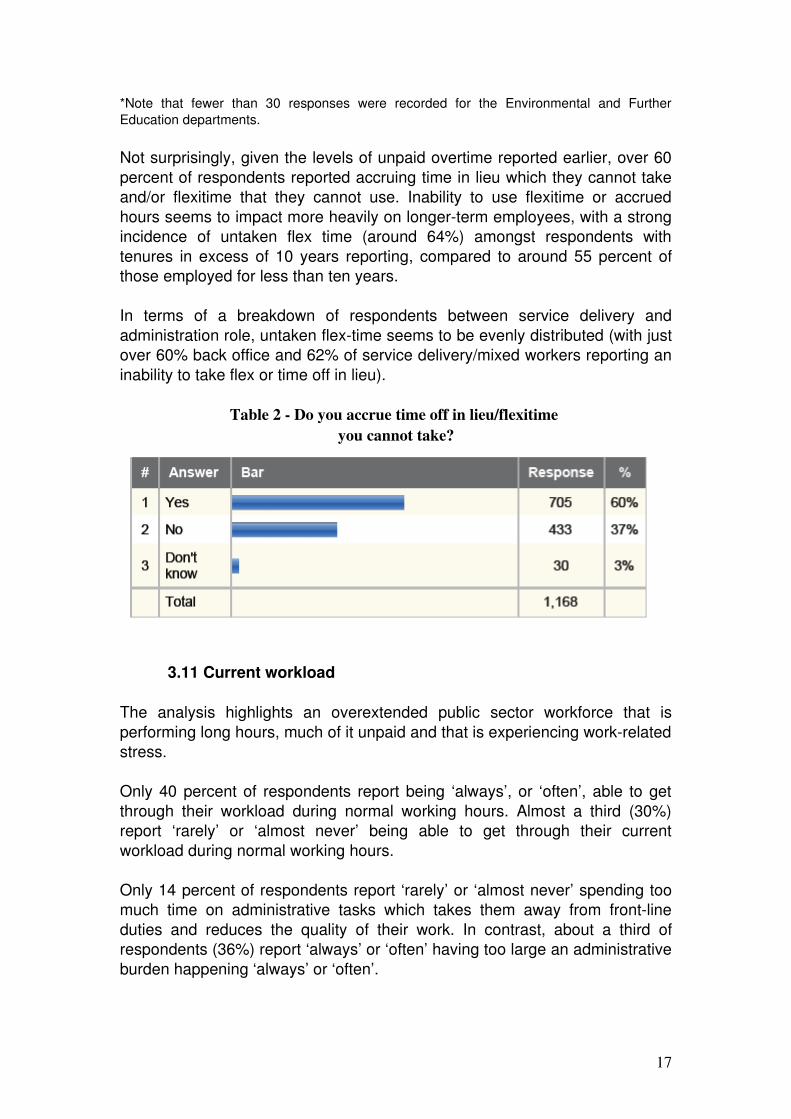
Not surprisingly, given the levels of unpaid overtime reported earlier, over 60 percent of respondents reported accruing time in lieu which they cannot take and/or flexitime that they cannot use. Inability to use flexitime or accrued hours seems to impact more heavily on longerterm employees, with a strong incidence of untaken flex time (around 64%) amongst respondents with tenures in excess of 10 years reporting, compared to around 55 percent of those employed for less than ten years.
In terms of a breakdown of respondents between service delivery and administration role, untaken flextime seems to be evenly distributed (with just over 60% back office and 62% of service delivery/mixed workers reporting an inability to take flex or time off in lieu).
Table 2 Do you accrue time off in lieu/flexitime you cannot take?
3.11 Current workload
The analysis highlights an overextended public sector workforce that is performing long hours, much of it unpaid and that is experiencing workrelated stress.
Only 40 percent of respondents report being ‘always’, or ‘often’, able to get through their workload during normal working hours. Almost a third (30%) report ‘rarely’ or ‘almost never’ being able to get through their current workload during normal working hours.
Only 14 percent of respondents report ‘rarely’ or ‘almost never’ spending too much time on administrative tasks which takes them away from frontline duties and reduces the quality of their work. In contrast, about a third of respondents (36%) report ‘always’ or ‘often’ having too large an administrative burden happening ‘always’ or ‘often’.
17
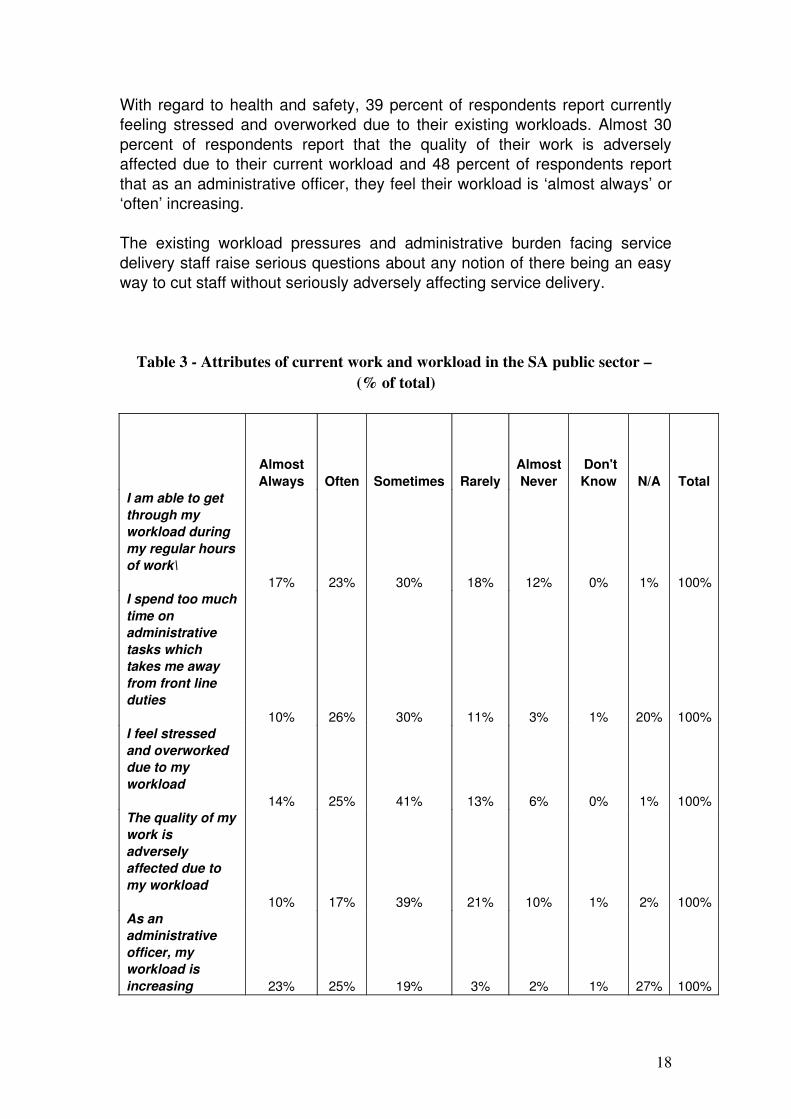
With regard to health and safety, 39 percent of respondents report currently feeling stressed and overworked due to their existing workloads. Almost 30 percent of respondents report that the quality of their work is adversely affected due to their current workload and 48 percent of respondents report that as an administrative officer, they feel their workload is ‘almost always’ or ‘often’ increasing.
The existing workload pressures and administrative burden facing service delivery staff raise serious questions about any notion of there being an easy way to cut staff without seriously adversely affecting service delivery.
Table 3 Attributes of current work and workload in the SA public sector – (% of total)
Almost Always Often Sometimes Rarely
Almost Never
Don't Know N/A Total
I am able to get through my workload during my regular hours of work\
17% 23% 30% 18% 12% 0% 1% 100%I spend too much time on administrative tasks which takes me away from front line duties
10% 26% 30% 11% 3% 1% 20% 100%I feel stressed and overworked due to my workload
14% 25% 41% 13% 6% 0% 1% 100%The quality of my work is adversely affected due to my workload
10% 17% 39% 21% 10% 1% 2% 100%As an administrative officer, my workload is increasing 23% 25% 19% 3% 2% 1% 27% 100%
18
4. Experiences with previous staff cutbacks
In total, two thirds of respondents have or are currently experiencing cutbacks in their agency/area. Of those respondents who had experienced previous staff cutbacks, 70 percent ‘agreed’ or ‘strongly agreed’ that their workload had increased significantly. The onus of such cutbacks fell significantly more heavily on those who identified as performing some front line service delivery, with almost 73 percent of those with duties reporting significant increases in workload, compared to around 58 percent of back office staff. Further, the functional areas reporting the greatest impact on workloads are in the Health and Justice Services, with 76 percent of workers citing increased workloads.
Similarly, almost 80 percent of respondents report experiencing more stress and pressure at work as a result of previous staff cutbacks. In addition, more than 60 percent of respondents ‘agreed’ or ‘strongly agreed’ that staff cuts meant that they often felt overwhelmed at work.
With regard to previous workforce reductions, 55 percent of respondents ‘agreed’ or ‘strongly agreed’ that previous staff cuts had increased their administrative load which took them away from frontline service delivery. Significantly, over 61 percent of workers with frontline responsibilities cited greater administrative loads, compared to 33 percent of back office workers.
Slightly more than 8 out of 10 respondents report that, as a result of staff cutbacks, it has become more difficult for their unit/organisation to cover regular and unplanned staff absences.
These results taken together suggest a public sector workforce which has become progressively less able to cope with existing workloads and less resilient to any changes to staffing or resource cuts.
19
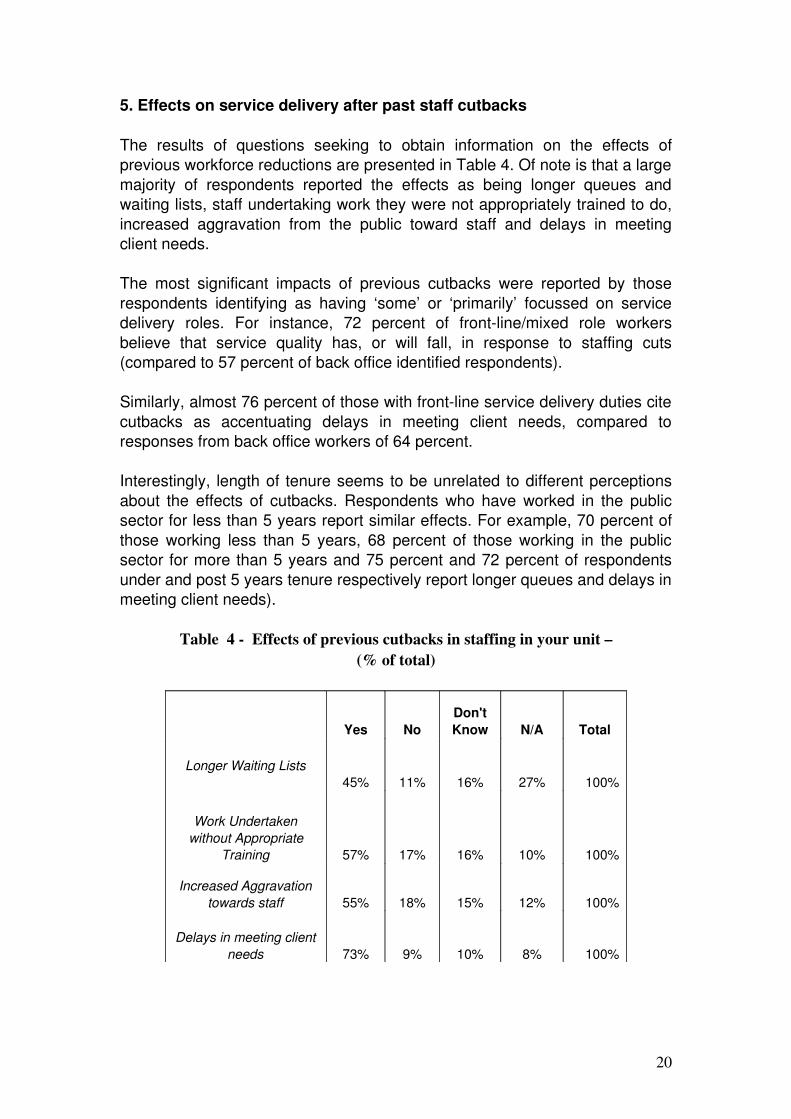
5. Effects on service delivery after past staff cutbacks
The results of questions seeking to obtain information on the effects of previous workforce reductions are presented in Table 4. Of note is that a large majority of respondents reported the effects as being longer queues and waiting lists, staff undertaking work they were not appropriately trained to do, increased aggravation from the public toward staff and delays in meeting client needs.
The most significant impacts of previous cutbacks were reported by those respondents identifying as having ‘some’ or ‘primarily’ focussed on service delivery roles. For instance, 72 percent of frontline/mixed role workers believe that service quality has, or will fall, in response to staffing cuts (compared to 57 percent of back office identified respondents).
Similarly, almost 76 percent of those with frontline service delivery duties cite cutbacks as accentuating delays in meeting client needs, compared to responses from back office workers of 64 percent.
Interestingly, length of tenure seems to be unrelated to different perceptions about the effects of cutbacks. Respondents who have worked in the public sector for less than 5 years report similar effects. For example, 70 percent of those working less than 5 years, 68 percent of those working in the public sector for more than 5 years and 75 percent and 72 percent of respondents under and post 5 years tenure respectively report longer queues and delays in meeting client needs).
Table 4 Effects of previous cutbacks in staffing in your unit –(% of total)
Yes NoDon't Know N/A Total
Longer Waiting Lists45% 11% 16% 27% 100%
Work Undertaken without Appropriate
Training 57% 17% 16% 10% 100%
Increased Aggravation towards staff 55% 18% 15% 12% 100%
Delays in meeting client needs 73% 9% 10% 8% 100%
20

Client needs not met 54% 18% 20% 8% 100%
21
6. Expectations about planned future cutbacks
In estimating the impact on service delivery if the government were to cut back staffing by 5 percent in the respondents unit, the analyses show that:
• Only 3 percent thought there would be no impact,• 15 percent thought there would be some impact on their workload
and stress, but little or no impact on service delivery.• 21 percent thought there would be a small reduction (ie less than 5%
reduction) in either the amount or quality of service provided.• 34 percent estimated that there would be a roughly oneforone
impact on service delivery – for each staff member lost, services would be unavailable to one member of the public
• 27 percent estimated that there would be a greater than oneforone loss in service delivery.
Again, in disaggregating these responses it becomes clear that concern about adverse effects of future cutbacks was strongest amongst workers with frontline service delivery roles. In total, two thirds (66%) of service delivery workers expect a oneforone or greater diminution of service delivery in response to a future cutback, compared to half (48%) of back office workers.
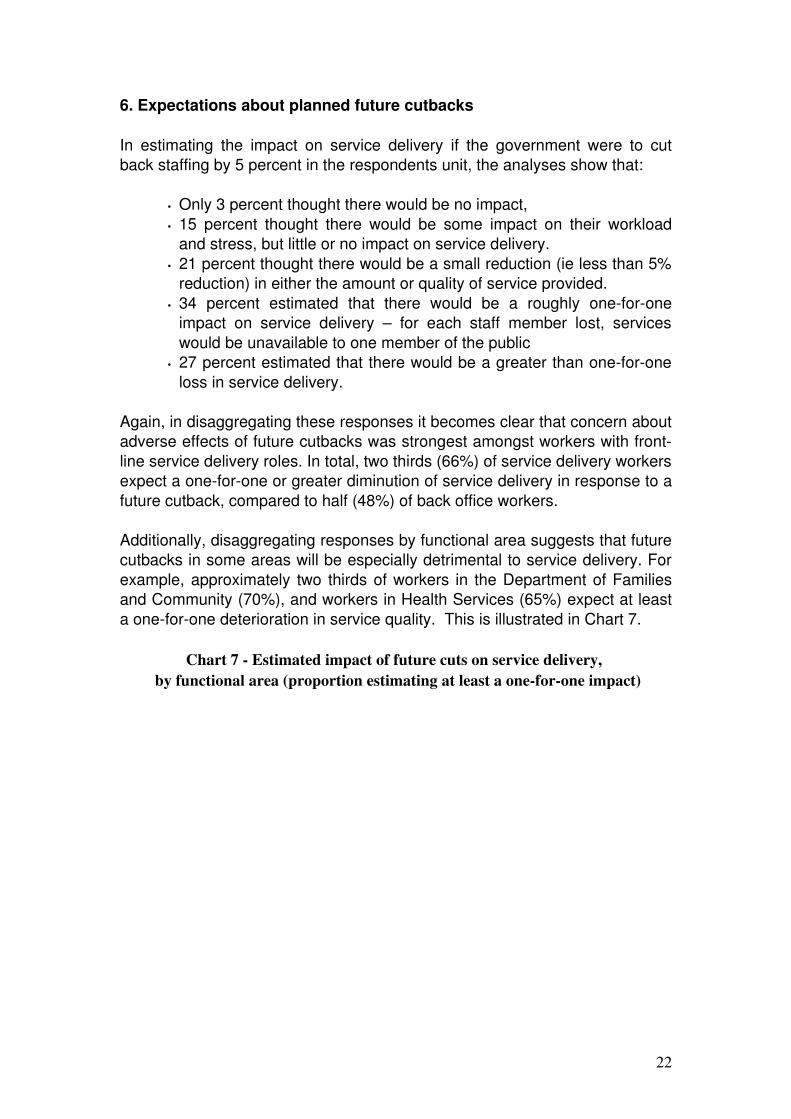
Additionally, disaggregating responses by functional area suggests that future cutbacks in some areas will be especially detrimental to service delivery. For example, approximately two thirds of workers in the Department of Families and Community (70%), and workers in Health Services (65%) expect at least a oneforone deterioration in service quality. This is illustrated in Chart 7.
Chart 7 Estimated impact of future cuts on service delivery, by functional area (proportion estimating at least a oneforone impact)
22

0%
20%
40%
60%
80%
100%
Health Education FurtherEducation /Employment
Transport Justice Families andCommunities
Environment
23
7. Some additional data analysis and directions for future research
In order to enhance the robustness of our analysis, we would see additional data regarding the following as desirable:
• the profile of the broader SA public sector workforce, for example by tenure, age and front/back office duties, to ascertain any response biases in the survey,
• measures of service delivery, both quantity and quality, to ascertain actual changes following cutbacks, and
• the nature of previous job cuts, by number and occupation/functional area, if available.
In the next stage of the research we will synthesise the analyses presented in this report with the comments provided by respondents on their likely impacts of further cutbacks. This synthesis will enable us to develop some broad scenarios that demonstrate the likely impacts of cutbacks on actual service delivery.
8. Summary and Conclusions
This report has provided an analysis of the current work and employment conditions, of South Australian public sector employees. In addition, it has explored the perceived experiences of staff with pervious cutbacks and their expectations about the effect of any subsequent workforce reductions.
The survey responses have permitted a rich understanding of current work patterns, previous experiences with staff cutbacks and expectations about planned cutbacks. It is difficult to reduce these to a few summary statements. Nevertheless, with this caveat, the main findings of the survey clearly suggest:
• The presence of a longterm vocationally oriented workforce,• The absence of a neat dichotomy between frontline service delivery
and back office administration the largest group of respondents report performing a mixture of service delivery and administration,
• The high incidence of long working hours, including many unpaid hours, and a struggle to cope with current workloads,
• A broad consensus of negative experiences with previous cutbacks in terms of their effects on service delivery and their workloads, and
• The prevalence of serious concerns about the impacts of impending cutbacks, including many who fear that cutbacks will severely affect services (more than a oneforone impact on services)
One of the key ways that the staffing retrenchments was sold as a package was that by focussing cutbacks on ‘administrative’ or ‘back office’ staff, it would minimise impacts on frontline service delivery.
24
The findings of this study suggest that the demarcation between front and back office workers is clearly a contentious one for at least four reasons:
1. more people report providing mainly frontline service delivery than mainly administrative support.
2. the largest group of respondents reported performing both service delivery and administration, and this group was significantly larger than either of the two single role groups. Taken together, nearly threequarters of respondents report performing either mainly or a mixture of frontline service delivery roles.
3. in reporting on their experiences with past cutbacks, 62 percent of those directly involved in frontline service delivery reported adverse effects, and attribute part of this to the extra administrative work they have had to take on. This is consistent with the nature of service delivery being in team based work environments.
4. in reporting on expectations of effects of current and planned future cuts almost twothirds of respondents identifying as performing some frontline service delivery expect it will have at least a oneforone effect on service delivery.
On the basis of this study, there is little or no empirical support for either the taxonomy of front office versus back office roles, or that by targeting cutbacks only to backoffice workers it can be done without (or with minimal) impact on service delivery levels. Indeed, the results of the survey directly contradict these propositions. The Government’s claims have never been tested in any of the various functional areas of the public service. Our findings suggest that the idea of a ‘free lunch’ from cutbacks in staffing is spurious. Services are currently and will continue to be affected adversely, and already overextended public sector employees are likely to become even more stressed and overwhelmed.
Our findings are also consistent with those of most of the research presented in our literature survey on staffing cutbacks and fiscal retrenchment. We have identified that a large majority of respondents who have front office service delivery responsibilities have already taken on greater (and notably, increased administrative) workloads in response to previous agency cutbacks. They fear even greater workloads will befall them if the proposed cutbacks proceed. In addition, more than twothirds of these respondents ‘agreed’ or ‘strongly agreed’ that the quality of services provided to the public by their department were adversely affected.
Given the diversity of services provided by public servants the question arises as to what the likely adverse affects will be in the different services. In order to
25

scope out some likely scenarios around this, the next stage of the research looks at the likely impacts on services of different functional areas.
26

10.References
ABS (Australian Bureau of Statistics) 2008a Labour mobility in Australia, Cat. No. 6209.0, ABS, Canberra.
ABS (Australian Bureau of Statistics) 2008b Labour Force, Australia, Cat. No. 6202.0, ABS, Canberra.
ABS (Australian Bureau of Statistics) 2008c Employee Earnings and Hours, Australia, Cat. No. 6306.0, ABS, Canberra.
Access Economics, 2009, New South Wales government services in the global financial crisis, report to the NSW Public Service Association, Access Economics, Sydney, May.
Campbell, I 2004 Casual work and casualisation: How does Australia compare? Report prepared for a conference ‘Work Interrupted: Casual and Insecure Employment in Australia’, Melbourne, August 2 2004
Foley, K 2009 Mid Year Budget Review 200809 Government of South Australia, Adelaide.
Freedman, C, Kumhof, M Laxton, D and Lee, J 2009 The Case For Fiscal Stimulus, IMF Staff Position Note SPN/09/03, IMF Washington March.
Norton, K, Rafferty, M, Schutz, H and Yu, S 2009, Cutting Staff in the South Australian Public Sector: A Review of the Issues, Faculty of Economics and Business, University of Sydney, December, mimeo.
Rafferty M. 2008 What First World Governments Can Learn from the Third World – Recent Thinking About Public Spending, prepared for the PSA SA branch, Faculty of Economics and Business, University of Sydney, December, mimeo.
Parliament of South Australia, 2009, Report of the Select Committee on Families SA, Third Session of the FiftyFirst Parliament November.
Spilimbergo, A Symansky, S, Blanchard, O and Cottarelli, C 2008, Fiscal
Policy for the Crisis, IMF Staff Position Note, SPN/08/01, IMF Washington, December.
27

28