staff.sim.vuw.ac.nzstaff.sim.vuw.ac.nz/pedro-antunes/wp-content/uploads/t36.pdf · 2...
TRANSCRIPT

0 P a g e
In A Quest to Solve Information System Agility Problems
A SaaS Experience
By
Haibo Yang
A thesis
submitted to Victoria University of Wellington
in fulfilment of the requirements for the degree of
Doctor of Philosophy in Information Systems
Victoria University of Wellington
2018

1
2
Acknowledgements
First and foremost, I must thank my brilliant supervisory team: Associate Professor
Pedro Antunes, Dr. Mary Tate (HRA), Dr. David Johnstone, and Professor Sid Huff
(HRA). Your extensive knowledge, great enthusiasm, infinite patience, and firm
support have been invaluable in the creation of this thesis. I deeply appreciate the
candid insights you have shared with me, regarding academia, life, and love.
My PhD has been a long and winding journey, many people have helped me along
the way. My sincere thanks to all the admin staff in the School of Information
Management and the School of Engineering and Computer Science, especially Usha,
for your high efficiency, professionalism, and friendship. Thank Wiebke, Chiara, and
Fang for all the inspiration, stimulation, and caring. Thank Hugo and Deon for those
mind-blowing conversations and controversial jokes. Thank Richard and Brian for
sharing the genuine joy in the pain of entrepreneurship. Thank Jimmy and Amy for
looking after our animals and offering enjoyable distractions.
A special thanks to my thesis examiners: Dr. Markus Luczak-Roesch, Professor
Alistair Barros, and Associate Professor Antonio Rito Silva. Thank you for the
extraordinary scrutiny and fantastic recommendations.
Thank you, mum. I know this thesis is my "baby", not your grandchild. But I promise
that you will be a grandma soon. Thank you, Lizzie, you are a true game changer and
my life saver. Thanks for bringing me home.
Thank you, my late father. It's been more than 13 years since I last saw you, spoke to
you, and hugged you. But your spirit still lifts me up in my darkest moments. Thank
you for all the sacrifices. You are my hero.
Finally, a big THANK YOU to all my colleagues, teachers and students for the
intellectual sparks you have passed on to me. Live long and prosper.
3
Abstract
Change is endemic in modern business competition. In an age of globalisation, with
the rapid development of information technologies (IT), changes occur at a much
faster pace, and are also more unpredictable. Being agile in a turbulent environment
has been ranked highly by executives in surveys of business issues conducted in
past five years. Today nearly all organisations rely on information systems (IS) to
operate. IS Agility is critical in achieving overall agility and performance in business.
However, despite the strong interest from the practitioner community, IS Agility in
academia has often been perceived as an overly abstract concept that is difficult to
study. Resultantly, despite its importance, little has been published on how to
systematically solve IS Agility problems with theoretical rigour and practical
relevance. This “how to” question is a challenging one to researchers and is the
major motivation of the present study.
A key difficulty to study IS Agility is the lack of a solid conceptualisation. In this
thesis, based on a multidisciplinary literature review looking for a unified theory of
IS Agility, we proposed the IS Agility Nomological Network (ISANN) as a holistic
conceptualisation to be used for problem solving. Such a conceptualisation includes
an IS Agility Cycle illustrating four stages (i.e. Sense, Diagnose, Select, and Execute) of
the dynamic interactions between IS and its human agents (e.g. IS users and IS
developers), a decision tree presenting four main IS Agility drivers (i.e. Change
Frequency, Uncertainty, Information Intensity, and Time Criticality), and a pyramid
incorporating four IS Agility Providers (i.e. Agile System-Development, Agile-System
Architecture, Agile System-Operation, and Agile-System Configuration ). We classify IS
Agility as having at least two sides, Dev Agility and Ops Agility. The former
represents the agility of IS development function while the later refers to the IS
operation function. We believe they are not the same, as agility in system

4
development process doesn’t necessarily translate to agility in the resulting system
operation.
To be able to answer the “how to” question and design a systematic problem-solving
approach, we then operationalised ISANN by developing data and task models in
real-world settings. These models were used to investigate and analyse IS Agility
problems faced by Software as a Service (SaaS) adopters. Such a SaaS environment,
due to its multi-tenancy nature, provides a great opportunity to observe the
interactions and trade-offs between Dev Agility (e.g. stories from engineers and
developers) and Ops Agility (e.g. stories from operators and users), as well as an
abundant source of IS Agility related business problems. Eventually, more elements
and factors emerged from this SaaS practice and were merged into the final artefact
created in this study: ISACAM (Information System Agility Causation Analysis
Method). ISACAM incorporates all the dimensions and facts derived from the
theoretical conceptualisation and the ongoing real-world problem-solving practice.
The effectiveness of ISACAM in solving IS Agility problems has been observed
through improved performance in real-life businesses. Furthermore, five
technological rules have been synthesised to offer a prescription for designing
solutions to improve IS Agility.
5
Table of Contents
Chapter 1 : Introduction .................................................................................................................... 14
1.1 Research Problem / Motivation ......................................................................................... 15
1.2 Research Goals / Objective / Questions .......................................................................... 18
1.3 Research Strategy / Plan ....................................................................................................... 19
1.4 Research Scope / Delimitations.......................................................................................... 22
1.5 Major Outcomes / Contributions ....................................................................................... 24
1.6 Thesis Structure ........................................................................................................................ 26
Chapter 2 : The Anatomy of IS Agility .......................................................................................... 28
2.1 Introduction ............................................................................................................................... 28
2.2 A Conceptualisation of Agility ............................................................................................. 29
2.2.1 Agility vs. Flexibility: A Conceptual Clarification ................................................. 29
2.2.2 Agility in Business: A Conceptual Evolution .......................................................... 36
2.2.3 Sense and Respond Models: The Agility Cycle ...................................................... 40
2.2.4 Main Categories of IS Agility Research .................................................................... 52
2.3 IS Agility Need vs. Supply - The Nomological Network ............................................. 68
2.3.1 IS Agility Drivers ............................................................................................................... 70
2.3.2 IS Agility Providers .......................................................................................................... 75
2.3.3 The IS Agility Nomological Network (ISANN) ....................................................... 78
2.4 Chapter Summary .................................................................................................................... 79
Chapter 3 : Operationalising ISANN ............................................................................................. 80
3.1 Introduction ............................................................................................................................... 80
3.2 An Operational View of IS Agility: Illustrative Scenarios ......................................... 80
3.2.1 Dev S-R: Sensing and Responding Purely at Dev Level ..................................... 84
6
3.2.2 Ops S-R: Sensing and Responding Purely at Ops Level ..................................... 94
3.2.3 On Interactions between the Dev and Ops Agility Cycles ............................... 104
3.2.4 Section Summary ............................................................................................................ 106
3.3 Applying ISANN: Descriptive Analysis of Cloud Services ....................................... 109
3.3.1 Cloud Computing Services .......................................................................................... 113
3.3.2 IS Agility Analysis of Cloud Services ....................................................................... 117
3.3.3 Section Summary ............................................................................................................ 128
3.4 Chapter Summary .................................................................................................................. 129
Chapter 4 : Design Science Research Methodology .............................................................. 132
4.1 Introduction ............................................................................................................................. 132
4.2 Problem formulation ............................................................................................................ 133
4.3 Philosophical Paradigm: Post-Positivism ..................................................................... 136
4.3.1 The Ontological Dimension ........................................................................................ 137
4.3.2 The Epistemological Dimension ............................................................................... 139
4.3.3 The Methodological Dimension ................................................................................ 140
4.4 Design as a Scientific Research Method ........................................................................ 141
4.4.1 Design? Science? Or both? ........................................................................................... 141
4.4.2 Design Science Research in IS Field ........................................................................ 146
4.4.3 Design as a Reflective Practice .................................................................................. 149
4.5 Artefacts Design and Evaluation ...................................................................................... 152
4.5.1 The DSR Strategy and Process................................................................................... 152
4.5.2 The Choice of Design Methods .................................................................................. 158
4.5.3 The Choice of Evaluation Methods .......................................................................... 164
4.6 Challenges of Design Science Research ......................................................................... 170

7
4.6.1 Danger of Self-Referential Paradox ......................................................................... 170
4.7 Chapter Summary .................................................................................................................. 176
Chapter 5 : The Creation of ISACAM ........................................................................................... 178
5.1 Introduction ............................................................................................................................. 178
5.2 The Evolution of ISACAM .................................................................................................... 178
5.2.1 The DSR Environment .................................................................................................. 179
5.2.2 Episode One – A “Sensing” Problem ........................................................................ 183
5.2.3 Episode Two – A ”Diagnosing” Problem ................................................................ 205
5.2.4 Episode Three – A “Selecting” Problem ................................................................. 230
5.3 Ladders of Reflection ............................................................................................................ 257
5.3.1 Reflection on Action – Some General Observations .......................................... 257
5.3.2 Reflection on Technological Rules and ISACAM Artefacts ............................. 262
5.3.3 Reflection on the Success of “Agile Methodologies” ......................................... 273
5.4 Chapter Summary .................................................................................................................. 277
Chapter 6 : Conclusion ..................................................................................................................... 280
6.1 Achieved Objectives .............................................................................................................. 280
6.2 Main Contributions ................................................................................................................ 281
6.3 Limitations ................................................................................................................................ 283
6.4 Future Work ............................................................................................................................. 285
References ............................................................................................................................................ 287
Appendix ............................................................................................................................................... 299
8
List of Figures
Figure 1: Components of Universal Agility in Sports Science ............................................. 33
Figure 2: The Agility Cycle ................................................................................................................ 43
Figure 3: Dev Agility Cycle ................................................................................................................ 55
Figure 4: Ops Agility Cycle ................................................................................................................ 60
Figure 5: IS Agility Pyramid ............................................................................................................. 65
Figure 6: The Network of IS Agility ............................................................................................... 69
Figure 7: IS Agility Need Drivers - a decision tree .................................................................. 74
Figure 8: The Nomological Network of IS Agility (ISANN) .................................................. 78
Figure 9: A Dynamic View of IS Agility ........................................................................................ 82
Figure 10: The Steps for a Structured IS Agility Analysis of Cloud Services ............... 118
Figure 11 A Strategic Framework of the Present DSR ......................................................... 156
Figure 12 Design Process in General Design Theory ........................................................... 163
Figure 13 FEDS Evaluation Strategies ....................................................................................... 165
Figure 14: A Recursive Function in Python ............................................................................. 172
Figure 15 A Self-Referencing Table Structure ........................................................................ 173
Figure 16 Result of a Self-Join Query.......................................................................................... 174
Figure 17: The Heinrich's Safety Triangle ................................................................................ 185
Figure 18: The Initial Data Model of ISACAM Ver 1.0 .......................................................... 193
Figure 19: The Task Model of ISACAM Ver 1.0 ....................................................................... 195
Figure 20: The SDSE Mapping Table for Episode One ......................................................... 197
Figure 21: The Data Model of ISACAM Ver 1.1 ....................................................................... 215
Figure 22: The Task Model of ISACAM Ver 1.1 ....................................................................... 216
Figure 23: The SDSE Mapping Table for Episode Two ........................................................ 218
Figure 24: The Data Model of ISACAM Ver 1.2 ....................................................................... 240
Figure 25: The Task Model of ISACAM Ver 1.2 ....................................................................... 242
Figure 26: The SDSE Mapping Table for Episode Three ..................................................... 244
Figure 27: Recap The SDSE Mapping Table ............................................................................. 265
Figure 28: The Data Model of ISACAM Ver. 1.3 ...................................................................... 271

9
Figure 29: The Task Model of ISACAM Ver. 1.3 ...................................................................... 272
Figure 30: Scrum Software Development Process ................................................................ 274
Figure 31: The SDSE Mapping Table for Scrum Methodology ......................................... 275

10
List of Tables
Table 1: Research Strategy and Plan ............................................................................................ 21
Table 2: Types of Agility in Sports Science ................................................................................ 31
Table 3: Contrasting Agility and Flexibility ............................................................................... 35
Table 4: Early Definitions of Agility in Business Literature ................................................ 38
Table 5: More Recent Definitions of Agility in Business Literature ................................. 39
Table 6: “Sense and Respond” Models ......................................................................................... 41
Table 7: Cynefin Framework ........................................................................................................... 51
Table 8: The Current Status of Key Research Areas of IS Agility ....................................... 66
Table 9: Drivers of IS Agility ............................................................................................................ 73
Table 10: Summary of Dev S-R vs. Ops S-R .............................................................................. 108
Table 11: Cloud Service Layers and Providers ....................................................................... 114
Table 12: IS Agility Analysis of IaaS ............................................................................................ 119
Table 13: IS Agility Analysis of PaaS ........................................................................................... 122
Table 14: IS Agility Analysis of SaaS ........................................................................................... 125
Table 15: Positivism vs. Post-positivism .................................................................................. 136
Table 16: Map of Design Science .................................................................................................. 146
Table 17: Commonly Prescribed DSR processes ................................................................... 153
Table 18: Key Components of ISACAM and Design Methods used ................................. 162
Table 19: The Key Artefacts and Evaluation Methods......................................................... 169
Table 20: Near Miss to Minor Injury Ration at E1 Company 2011 Q1 to 2012 Q2 .. 187
Table 21: ADS Problem Solving of Episode One .................................................................... 189
Table 22: Near Miss to Minor Injury Ratio at E1 Company 2011 Q1 to 2012 Q4 ..... 191
Table 23: Near Miss to Minor Injury Ratio at E1 Company 2011 Q1 to 2014 Q1 ..... 201
Table 24: A Brief Summary of Episode One ............................................................................. 201
Table 25: Number of Safety Events reported between 2012 Q1 and 2014 Q3 .......... 206
Table 26: The Average Days Taken to Issue Corrective Actions 2012 Q1 to 2013 Q2
................................................................................................................................................................... 208
Table 27: ADS Problem Solving of Episode Two.................................................................... 211

11
Table 28: The Average Days Taken to Issue Corrective Actions after Safety Incidents
- 2012 Q1 to 2013 Q4 ....................................................................................................................... 213
Table 29: Number of Safety Events by Investigation types 2012-2013 ....................... 222
Table 30: The Average Days Taken to Issue Corrective Actions ..................................... 226
Table 31: A Brief Summary of Episode Two ............................................................................ 227
Table 32: Number of Audits Started and Corrective Actions Issued at E3 in 2013 . 232
Table 33: ADS Problem Solving of Episode Three ................................................................ 236
Table 34: Number of Audits Started and Corrective Actions Issued at E3 Company
From April 2013 to March 2014 .................................................................................................. 238
Table 35: Number of Audits Started and Corrective Actions Issued at E3 Company
From April 2013 to August 2014 ................................................................................................. 251
Table 36: A Brief Summary of Episode Three ......................................................................... 254
Table 37: ISACAM Technological Rules ..................................................................................... 263
Table 38: Achieved Research Objectives .................................................................................. 280

12
List of Publications (derived from this thesis) Resulted from Chapter 2:
Yang, H., Antunes, P. and Tate, M. (2016). Towards a unified conceptualisation of
Agility: A design perspective. The 20th IEEE International Conference on Computer
Supported Cooperative Work in Design (CSCWD) Nan Chang, China.
Resulted from Chapter 3:
Yang, H., Huff, S., and Tate, M. (2013). Managing the Cloud for Information Systems
Agility. Cloud Computing Service and Deployment Models: Layers and Management.
A. Bento and A.K.Aggarwal. Hershey, PA, USA, IGI Global: 70-93.
This book chapter has inspired and been cited in the first empirical studies towards the
impact of Cloud Computing on IS Agility, e.g. (Sawas & Watfa, 2015).
Yang, H. and Tate, M. (2012). "A Descriptive Literature Review and Classification of
Cloud Computing Research." Communications of the Association for Information
Systems 31(1/2): 35-60.
As at 1st May 2018, this journal article has been cited over 200 times and remained on
the “Most Popular Papers” list of the AIS since its inception.

13

14
Chapter 1 : Introduction
For over a decade, becoming agile and able to thrive in a dynamic environment has
been rated by executives as being at the top of their wish list. In an earlier global
survey, 89 percent of over 1500 respondents indicated that agility is “very” or
“extremely” important for business performance, while 91 percent perceived that
the importance of agility has increased in the five years preceding the survey
(McKinsey, 2006). Annual surveys conducted by the Society for Information
Management (SIM) have consistently ranked agility at the high end among the top
ten IT management concerns (Kappelman, McLean, Johnson, & Gerhart, 2014;
Luftman & Ben-Zvi, 2010). More recently, agility has been again highlighted as a
critical topic to both IS research and practice (Salmela, Tapanainen, Baiyere,
Hallanoro, & Galliers, 2015).
Given organisations nowadays rely extensively on IS (information systems) to
operatate and to make business decisions, IS Agility has been emphasised as a
crucial foundation for agile business by many researchers (Bhatt, Emdad, Roberts, &
Grover, 2010; Caswell & Nigam, 2005; Goodhue, Chen, Boudreau, Davis, & Cochran,
2009). As found in a survey of 660 CIOs conducted by HP, that the inability of the IT
system to respond quickly to business changes is a genuine concern for these
executives (HP, 2011).
This thesis, employing a Design Science Research paradigm, proposes a unified
conceptualisation of IS Agility, and creates a generic IS Agility Causation Analysis
Method (ISACAM) for design purposes. Both aim at empowering researchers and
practitioners to clearly understand, analyse, and solve IS Agility problems with
theoretical rigour and practical relevance. In the remainder of this chapter, we will
discuss the research problem, motivation, goals, scope, research design, and major
contributions of the study.

15
1.1 Research Problem / Motivation
The present study was motivated by one grand problem observed in both the IT
industry and the IS research field:
RP0: The lack of prescriptive and systematic methods for solving IS Agility issues.
This grand problem can be divided into two sub problems:
RP1: The lack of conceptual clarity and consistency of IS Agility as a notion
RP2: The lack of prescriptive practice and method for designing IS Agility as a capability
Despite its importance, the concept of IS Agility tends to be taken at its face value
thus seldom receives in-depth analysis from either researchers or practitioners
(Mathiassen & Pries-Heje, 2006). Systematic and rigorous examination of this
concept has been rare. One reason that IS Agility is such an under-researched
concept, despite the high industry demand, is that researching the concept has
traditionally been difficult. Such difficulty lies in the complex and multifaceted
nature of agility, which makes it hard to agree on how it should be investigated and
from whose perspective (MacCormack, 2008).
Resultantly, the concept of IS Agility has been communicated in an ambiguous
manner in both academic and practitioner literature. To the best extent, this concept
is vaguely defined, using other abstract notions, as an ability of IS to produce nimble
and speedy responses to business changes. Such conceptual vagueness is mostly
caused by a lack of distinctiveness of the core concept of agility. Both IS researchers
and IT practitioners tend to carelessly mix agility with other indefinite concepts, for
example “flexibility” has often been loosely used in an interchangeable term of
agility in both academic literature (Fullerton & Ness, 2010; Ngo-Ye & Ahsan, 2005)
and in real-world IT projects. The indiscriminate use of “agility” and “flexibility”
makes a literature review challenging. One has to delve into each article to seek a
clear definition of its key concept –either “flexibility” or “agility”- before confidently

16
including the article as a relevant reference. Achieving terminological
distinctiveness and consistency is an important step for us to proceed further with
research in this area.
We believe the conceptual vagueness (RP1) leads to the practical ambiguity (RP2).
Without a solid conceptualisation, IS Agility as a notion, is bound to yield, diverse
and disparate, interpretations and speculations, from both researchers and
practitioners. For instance, in IS studies (i.e. studies published in IS journals or at IS
conferences), when agility is referred to, the topics of interest can spread across the
full spectrum what the IS field could possibly stretch. Researchers don’t seem to
have a consistent focus. Although they can reach as close to the presumed centre of
our IS field, i.e. the design and development of IS artefacts, many times they can
jump as far as to the boundaries, if any, between IS and other disciplines, e.g.
organisational culture and climate. In the IT industry, agility, however, is mostly
perceived as the equivalent to the adoption of agile software development methods,
the scalability of computational resource, the modularity of system architecture, etc.
Such diverse and inconsistent interpretations of IS Agility can make it difficult for
both researchers and practitioners to find a common ground for knowledge sharing
and problem solving.
Beginning with a general problem for research, and moving on to design and
develop studies with clearly stated questions in specific contexts, has long been
established as a reliable practice (T. J. Ellis & Levy, June, 2010). However, not all
problems are suitable for design science research (DSR). Gleasure (2015) argued
that for a problem to be research-worthy to DSR, it should at least meet one of the
three criteria:
1) the prescriptive aspect of the problem is less mature than the analytical, explanatory or predictive aspect,
2) effective solutions do not exist when an opportunity arises to engage with the class of design problems,

17
3) important elements of a system may only become visible through the act of design (Gleasure, 2015).
The research problems, RP0, RP1 and RP2, tackled by the present study meet all
three criteria, thus are suitable for DSR. First, IS Agility is not a mature field of study
with rigorous and relevant prescriptions, thus many ambiguous and vague
interpretations exist. Second, no existing methods have been established to solve IS
Agility related problems. Third, to create a method for solving IS Agility problems,
conventional behavioural research approaches cannot be more effective than the act
of design through means-ends plus trial-and-error approaches. Before the present
study, we simply didn’t know what important factors should be taken into
consideration to systematically solve IS Agility problems.
Furthermore, Ellis and Levy (2010) have recommended three types of problems
that can drive DSR studies:
a) Lack of a product or a tool to correct a troublesome situation with emerging
or evolving conditions
b) Lack of a workable method to conceptualise how to address a problem
c) Lack of instantiation in a new domain to address with unsolved conditions
where similar problems were solved successfully in another domain
(Timothy J Ellis & Levy, 2010)
The three research problems (RP0, RP1 and RP2) driven this study fit in all three
types listed above. Firstly, prior to the present study, there was no products or tools
taking a holistic approach to help solving IS Agility related problems. Secondly,
conceptualising IS Agility has been a challenging task and no workable
conceptualisation was provided for problem-solving purposes before the present
study. Thirdly, although not directly applicable, studies in other domains (i.e. sports
science) that successfully address agility problems of athletes, can provide valuable
insights to the present study, specifically in the creation of a systematic method for
investigating and solving agility problems in the IS domain.

18
1.2 Research Goals / Objective / Questions
Driven by the research problems identified from the previous section, we in turn
identify two main research goals:
A. To generate a unified and holistic conceptualisation of IS Agility so that both
researchers and practitioners can understand and utilise in their own
specific contexts with clarity and consistency;
B. To design and develop a systematic method for investigating and solving IS
Agility problems with which researchers and practitioners can follow
prescriptive steps and rules to implement with clarity and consistency.
As a result of setting the above goals, this study explores the following research
questions:
RQ1: What are the constituents of IS Agility?
RQ2: How do these constituents work together?
RQ3: How to apply a conceptualisation of IS Agility in the form of a
systematic method to investigate and solve IS Agility problems?
Consequently, our study established the following objectives:
a. To examine, synthesise, and refine existing theories/models of agility
published in a broad range of literature;
b. To create a unified conceptualisation (i.e. ISANN) that explains why IS Agility
is needed and how it can be achieved;
c. To justify and improve this unified conceptualisation and associated models
through peer-review processes and/or scenario-based illustrations;
d. Based on the improved conceptualisation of IS Agility, to create a method for
analysing and designing solutions to IS Agility problems (i.e. ISACAM);

19
e. To evaluate and improve the relevance and effectiveness of the method
through real-world applications.
1.3 Research Strategy / Plan
The research literature has suggested two main strategies for conducting DSR. The
first, strategy 1, is the deductive type examining theories in a context where an
industrial partner may or may not be present (Gleasure, 2015). The second,
strategy 2, is the inductive/abductive type developing theories that are emerging
from real-world projects. Gleasure urged there is a shortage of strategy 2 studies
which is limiting the research field from generating new knowledge. One reason for
such a shortage is that, engaging in industry projects can be too demanding for
researchers with large volume of academic commitments. Another reason is that,
not all industry projects can produce novel insights, especially with those merely
routine consultancy projects. (Gleasure, 2015). Therefore, a key to effectively
conduct strategy 2 DSR is that researchers need to identify the cutting edge of
practice where mature artefacts may not yet exist.
The present study adopted strategy 2 DSR for two reasons. The first reason is that
existing theories and models for explaining IS Agility are mostly too abstract and
incomplete to be used in a strategy 1 type study. The second reason is that, as the
researcher, I am also a “reflective practitioner” (Schön, 1983) working actively in
the IT industry with direct access to real-life projects that are considered “cutting
edge of practice” in terms of delivering agility in a Software as a Service (SaaS)
environment. This SaaS solution has been adopted by over 100 client organisations
ranging from large corporates in the energy industry to smaller entities such as
regional or city councils. Such an environment offers abundant opportunities for IS
Agility research, as almost all client organisations are expecting to improve IS agility
(Hugos, 2010; Liu et al., 2007; Mullins, 2010; Oracle, 2010).

20
Table 1 (in the next page) presents an overview of this study with four stages of
research have been conducted to address all four research questions.
RP1 (divided into RQ1 and RQ2) was first addressed in Chapter 2 and 3 before RP2,
because when “the emerging or evolving condition is either very poorly understood or
extremely complex”, the conceptualisation of the problem supersedes the lack of a
tool or product (Timothy J Ellis & Levy, 2010). The real issue lies in “the absence of a
workable method of conceptualizing how to address the problem…the lack of a way to
model a siltation constitutes a worthy problem applicable to design
research”(Timothy J Ellis & Levy, 2010) (p.111). Addressing RP1 was mostly done
through conceptualising and modelling IS Agility based on literature investigation
and synthesis, as well as illustrations and analysis of industry examples (presented
in Chapter 2 and 3). The results derived from addressing RP1 have been evaluated
and published as a conference paper and a book chapter respectively (Yang,
Antunes, & Tate, 2016; Yang, Huff, & Tate, 2013).

21 P a g e
Table 1: Research Strategy and Plan
Research Problem
Thesis Segment
Purpose Research questions
Artefacts / Outcomes
Design activities Evaluation activities
Description
RP1
Chapter 2
To establish a holistic conceptualisation of IS Agility
RQ1: What are the constituents of IS Agility?
The IS Agility Nomological Network (ISANN)
Cross discipline literature review and synthesis
Conceptual analysis and modelling
Artificial & Formative
Goal/Efficacy
Demonstration (Peer Review)
The main outcome of Chapter 2 was published as a CSCWD 2016 paper. (Yang et al., 2016)
Chapter 3
To examine the effectiveness and usefulness of the conceptualisation in explaining and analysing IS Agility
RQ2: How do these constituents work together?
The Operational View of Dev vs. Ops Agility
A structured IS Agility analysis on Cloud Services
Conceptual analysis and modelling
Feature analysis
Artificial & Formative
Illustrative Scenarios(Peer Review)
Goal/Efficacy
Scenario-based analysis and demonstrations in Chapter 3.
Punished CAIS article on classification of Cloud Computing research (Yang & Tate, 2012)
Published an IGI Global book chapter explaining how to manage Cloud Services for IS Agility (Yang et al., 2013)
RP2 Chapter 5
To operationalise the conceptualisation and apply it in real-world problem-solving situations.
RQ3: How to apply a conceptualisation of IS Agility as a systematic method to investigate and solve IS Agility problems?
ISACAM (Information System Agility Causation Analysis Method)
Technological Rules
Dimensional modelling
Hierarchical Task Analysis
Work domain analysis (Abstraction Decomposition Space)
Naturalistic & Formative
Real-world problem solving in the form of evaluation episodes
Goal/Effectiveness
Chapter 5 explains how incremental changes were made onto ISACAM through processing real-world problems. It also demonstrates the effectiveness of ISACAM.
22
RP2 (more specified in RQ3) was addressed through build-and-evaluate cycles (with
methodology presented in Chapter 4, processes and outcomes presented in Chapter
5). Based on ISANN, data models and task models (essential components of ISACAM)
were built, assessed, and evolved in real-world problem-solving settings. Models
then were adopted in software prototypes.
As one of the first comers in this research direction, this study intends to maximise
its contribution by embracing changes that happened during the investigation.
Changes included emerging themes and relationships that were not found in the
literature review and analysis but helped better understand and investigate the
phenomenon of interest.
1.4 Research Scope / Delimitations
The research scope can be summarised into three key words:
Adopters of Public Cloud
IS Agility
SaaS
Adopters of Public Cloud
We chose public Cloud Computing as the research context for two reasons. Firstly,
public Cloud Computing, which the term “cloud computing” commonly refers to,
brings most impact to the traditional way of IT provisioning by providing the
general public with off-site, on-demand, and pay-as-you-go computing self-services
(Mell & Grance, 2010). Secondly, compared to private cloud adopters who often are
limited to internal users of a small number of organisations, public cloud adopters
represent a much larger user base with significantly higher demographic diversity.
In this study, the users subscribed to the NOHARM SaaS solution - that I have been
directly involved in its fundamental activities such as designing, developing, training
23
and consulting - are organisations of drastically different sizes, from different
industries, stretching from public sector to private sector, yet all have a common
intention, to reduce cost and improve agility by adopting the web-based multi-
tenant SaaS approach.
IS Agility
The focus of this research is on IS Agility. This is based on the premise that IS Agility
is important and has become a critical component of an agile business (Goodhue et
al., 2009). Today’s IS are often tightly coupled with business processes (especially in
businesses requiring intensive information processing). Without agility, the IS may
become an inhibitor rather than an enabler of business changes (SEO & Paz, 2008).
There are other factors that may impact the overall agility of an organisation, e.g.
human resource strategy (Shafer, Dyer, Kilty, Amos, & Ericksen, 2001). However,
those other factors are not included within the scope of this study.
Besides agility, other pertaining concepts have been developed to explain business
success in turbulent environments, such as absorptive capacity (Cohen & Levinthal,
1990), strategic flexibility (Ansoff, 1980), dynamic capabilities (Tecce, Pisano, &
Shuen, 1997), and improvisational capabilities (Pavlou & El Sawy, 2010).
Nonetheless, these concepts largely zero in on strategic issues, whereas the concept
of agility can apply to not only strategic issues, but more often it applies to tactical
and operational issues. Strategic issues are distinct from tactical or operational
issues (Porter, 1996). Therefore in alignment with other IS researchers, we have
treated agility as a unique notion distinct from the aforementioned concepts
(Overby, Bharadwaj, & Sambamurthy, 2006; Pavlou & El Sawy, 2010).
Moreover, the thesis is focused on analysing and solving IS Agility problems. This is
done through designing an innovative method and applying it in real-world
scenarios happened in the Cloud Computing ecosystem. The premise for such a
study to be feasible is a well-established, stable cloud provider and adopter

24
relationship where we can engage with the adopter’s IS Agility problems on the
provider’s behalf. The adopters in such a context are mature cloud service users.
Therefore other issues related to pre-adoption concerns such as data security,
privacy, and “vendor lock-in” are considered beyond the scope of this thesis.
SaaS
This study was developed through real-world experiences in a cloud-based SaaS
environment. Compared to the other two main layers of Cloud Computing services
(i.e. IaaS and PaaS), SaaS seems to be the most problematic layer in terms of
providing IS Agility to adopters, as changes and uncertainties occur at SaaS level
tend to be much more diverse and complex. Such an observation was gained from a
comprehensive review of Cloud Computing research literature and years of practical
experience in the SaaS industry. The literature review was then published on CAIS
(Yang & Tate, 2012), followed by an IS Agility analysis on each layer of cloud
services being published as a book section (Yang et al., 2013). An updated version of
this analysis has been articulated in Section 3.3.2 of the thesis. Later an empirical
study inspired by our book section also provided evidence to our observation that
SaaS has significant problems with delivering IS Agility (Sawas & Watfa, 2015).
Therefore we see SaaS as an excellent field to study IS Agility problems as there is
no lack of them.
1.5 Major Outcomes / Contributions
This study has four main contributions.
First, it has created the first IS Agility Nomological Network (hereafter ISANN,
reported in Section 2.3.3) which brings a high level of clarity and consistency to the
theoretical foundation of the concept of IS Agility. IS Agility as a notion has long
suffered from a lack of consistency and distinctiveness in the literature. Such an

25
issue can be a critical hinder for the IS research community to build up cumulative
research culture (Keen, 1980). ISANN is considered the rigorous “kernel theory” for
our further investigations and can be used by other researchers for new empirical
studies as well. Part of ISANN has been published in a recently conference paper
(Yang et al., 2016). The full version of ISANN will be published in the near future.
Second, based on the “kernel theory”, this study offers in-depth analysis of the
interdependencies between Agility components (reported in Section 3.2). Such
analysis is practical and relevant to practitioners and can help them to make
informed judgements by clarifying ambiguous agility notions. This contribution is in
alignment with the call from Robey and Markus that IS research products need to
be made simpler and consumable to thrive (Robey & Markus, 1998).
Third, this study provides a structured IS Agility method to analyse cloud services.
An earlier version of this method has been published as a book chapter (Yang et al.,
2013) which then inspired one of the first empirical studies regarding the impact of
Cloud Computing on IS Agility (Sawas & Watfa, 2015). This empirical study has
provided strong support to our analysis. An updated version of this method is
reported in Section 3.3.2.
Finally, this study has designed and developed a structured and systematic method
(ISACAM as the outcome of Stage Three, reported in Chapter 5 :) for investigating
and solving IS Agility problems. ISACAM is based on solid theoretical analysis and
reasoning yet evolves through series of real-world applications. Those major
applications of ISACAM have yield successful results and are reported as three
episodes in Chapter 5.

26
1.6 Thesis Structure
The remainder of this thesis is structured as follows:
Chapter 2 surveys existing literature and synthesise a unified conceptualisation of IS
Agility in the form of a conceptual framework (ISANN). Chapter 3 attempts to
operationalise ISANN and demonstrates its efficacy through a series of illustrate
scenarios. Particularly on the two key subcomponents of IS Agility, i.e. Dev Agility vs
Ops Agility. Chapter 4 reviews the DSR methodology and provides justification for
our choices of design and evaluation methods. Next Chapter 5 provides detailed
description and reflections of the design and formative evaluations of ISACAM via a
series of real-world applications. Finally, Chapter 6 concludes the research by
elaborating on implications and limitations of the study and suggesting future
directions.

27
28
Chapter 2 : The Anatomy of IS Agility
2.1 Introduction
This chapter provides a literature review based on careful selection and
examination of peer-reviewed studies on agility across multiple disciplines (sports
science, military, business, and information technology).
IS appears to be a fertile field for popular but weakly defined concepts (Henri Barki,
2008). IS Agility is a good example, referred frequently by practitioners and
researchers but often vaguely defined. Such vagueness has caused problems in
differentiating the concept from other related ones and in establishing it as a
legitimate and distinctive IS construct.
The development of a valid conceptualisation of IS Agility has been difficult (Maurer
& Goodhue, 2010). The difficulty in conceptualising IS Agility largely comes from the
complex and multi-faceted nature of the general concept of agility (MacCormack,
2008). As such, agility in the business context has been made often indistinguishable
from other similar notions and misused in academia and practice as an
interchangeable term to other buzzwords such as flexibility and adaptability
(Salmela et al., 2015; Yousif & Pessi, 2016).
IS Agility can be viewed as a particular instance of the general concept of agility
(Pankaj, Hyde, Ramaprasad, & Tadisina, 2009). Establishing a good
conceptualisation of agility in general is essential for providing a conceptual
foundation for IS Agility. To understand the general concept, a broad review of
related literature was conducted. Given the multidisciplinary nature of this concept,
and the conceptual ambiguity existing in both academia and practice, the literature
review extends to publications in the areas of sports science and military research
where agility has long been studied with clearer and distinguishable
conceptualisations. The purpose of this review is to elaborate on the essential

29
meaning of agility, as well as to establish a proper theoretical foundation for the
subsequent design and development of artefacts (Webster & Watson, 2002).
This chapter starts by examining the general concept of agility and then extends to
the specialised concept of IS Agility. This progression from generalisation to
specialisation dominates the structure of the literature review. First, by comparing
agility with other concepts, specifically, flexibility, we can provide more conceptual
clarity to make the notion of agility distinguishable. Next we examine existing
definitions and models of agility to identify the most valid ones. This is followed by
further interrogation of the literature to synthesise the drivers and providers of IS
Agility in the IS Agility Nomological Network (ISANN) for systematically describing
and understanding the subcomponents of IS Agility.
2.2 A Conceptualisation of Agility
2.2.1 Agility vs. Flexibility: A Conceptual Clarification
Surveying both business related and IS related literatures suggests that the general
concept of agility has suffered from the lack of a clear distinction between itself and
other seemingly similar notions. Confusing agility with other concepts, especially
flexibility, seems to be a common mistake in business and IS contexts. For instance
numerous articles which include “flexibility” in their titles discuss the same concept
to those with “agility” (Fink & Neumann, 2007, 2009). Some papers even use these
two terms in an interchangeable manner (Fullerton & Ness, 2010; Ngo-Ye & Ahsan,
2005; Sawas & Watfa, 2015; Yousif & Pessi, 2016).
Such terminological confusion can lead to perplexity not only in conceptualisation,
but also in operationalisation of the potential constructs forming the notion of
agility. Without a common terminology, studies are at risk of misleading each other,
which makes it difficult for the IS research community to build up a cumulative

30
research culture (Keen, 1980). Furthermore, Barki et al. (1993) have warned that
“lacking a common research vocabulary” can make literature search less fruitful
with low precision (i.e. a considerable number of articles found via keyword search
in research databases can be of little relevance). The indiscriminate use of “agility”
and “flexibility” makes a literature review unnecessarily troublesome, as the
reviewer cannot rely on the title/abstract of an article to decide its relevance. One
has to delve into each article to seek a clear definition or an explanation of its key
concept – being either “flexibility” or “agility”- before confidently including the
article as a relevant reference. Hence achieving terminological consistency is
deemed critical to proceeding further with research in this area.
Exploring the origins of agility and flexibility also helps to clarify and differentiate
these concepts. Business researchers have admitted that both agility and flexibility
are “diverse concepts that are hard to grasp” (Gong & Janssen, 2010). Part of the
reason is that both were imported from other disciplines. Consequently, their
distinctness is likely to be under-appreciated or lost in translation, hence misuses
occur.
Both terms were originally used to describe physical capabilities of living beings and
have been studied comprehensively in sports science as key predictors of athletic
performance. Therefore, it is logical to look to the sports science literature as a
source of developed knowledge about these two concepts and as a source of useful
insights into the similarities and distinctions between the two.
In sports science, the agility concept is used to portray a desirable athletic capability
which is critical to the athlete’s performance in many competitive sports. Such
capability is defined as a rapid whole body movement with change of velocity or
direction accurately in response to a stimulus (Sheppard & Young, 2006). Thus
agility involves both reaction time and velocity. Reaction time is defined as the
minimum time from the presentation of a stimulus to the onset of a response, and
velocity is defined as the rate of change in position with respect to time (specifically

31
referring to position) (Sheppard & Young, 2006). Other underlying factors related
to reaction time and velocity have been considered in sports, in particular the ideas
of speed, coordination, reflex, and balance, all under one umbrella. But we will not
delve into that level of detail in this thesis.
Agility is often used in the context of managing temporal and spatial uncertainties.
Depending on the presence and absence of these uncertainties, agility in sports
science has been classified into four categories: simple, temporal, spatial, and
universal (as shown in Table 2 below ) (Sheppard & Young, 2006).
Table 2: Types of Agility in Sports Science
Types Definition Example of Sporting Skill
Simple No spatial or
temporal uncertainty
Gymnast's floor routine: pre-planned activity, initiated when the
athlete desires, with movements that the athlete has pre-planned.
Stimulus is the athlete's own movement and the physical domain in
which they are executing the skill.
Temporal
Temporal
uncertainty, but
movement is pre-
planned (spatial
confidence)
Athletics sprint start: pre-planned activity, initiated in response to a
stimulus (starter's pistol) wherein there is no certainty as to exactly
when the pistol will fire.
Spatial
Spatial uncertainty,
but timing of
movement is pre-
planned (temporal
confidence)
Volleyball or racquet sport service receive: the umpire determines a
narrow window of time wherein the server must serve the ball to the
opponent. However, there is no certainty on the part of the receiver
as to where the service will be directed.
Universal Spatial and temporal
uncertainty
Ice hockey or football: during offensive and defensive plays, the
athletes cannot anticipate with certainty when or where opposition
players will move to.
Source: (Sheppard & Young, 2006).
32
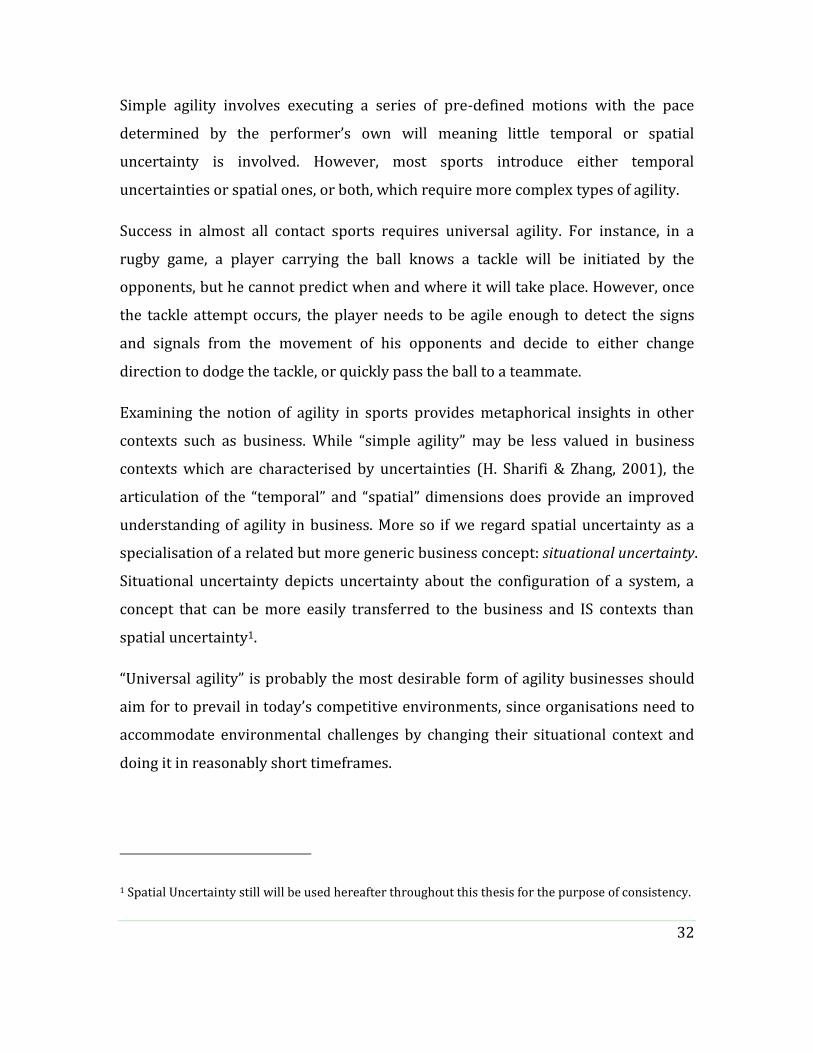
Simple agility involves executing a series of pre-defined motions with the pace
determined by the performer’s own will meaning little temporal or spatial
uncertainty is involved. However, most sports introduce either temporal
uncertainties or spatial ones, or both, which require more complex types of agility.
Success in almost all contact sports requires universal agility. For instance, in a
rugby game, a player carrying the ball knows a tackle will be initiated by the
opponents, but he cannot predict when and where it will take place. However, once
the tackle attempt occurs, the player needs to be agile enough to detect the signs
and signals from the movement of his opponents and decide to either change
direction to dodge the tackle, or quickly pass the ball to a teammate.
Examining the notion of agility in sports provides metaphorical insights in other
contexts such as business. While “simple agility” may be less valued in business
contexts which are characterised by uncertainties (H. Sharifi & Zhang, 2001), the
articulation of the “temporal” and “spatial” dimensions does provide an improved
understanding of agility in business. More so if we regard spatial uncertainty as a
specialisation of a related but more generic business concept: situational uncertainty.
Situational uncertainty depicts uncertainty about the configuration of a system, a
concept that can be more easily transferred to the business and IS contexts than
spatial uncertainty1.
“Universal agility” is probably the most desirable form of agility businesses should
aim for to prevail in today’s competitive environments, since organisations need to
accommodate environmental challenges by changing their situational context and
doing it in reasonably short timeframes.
1 Spatial Uncertainty still will be used hereafter throughout this thesis for the purpose of consistency.
33
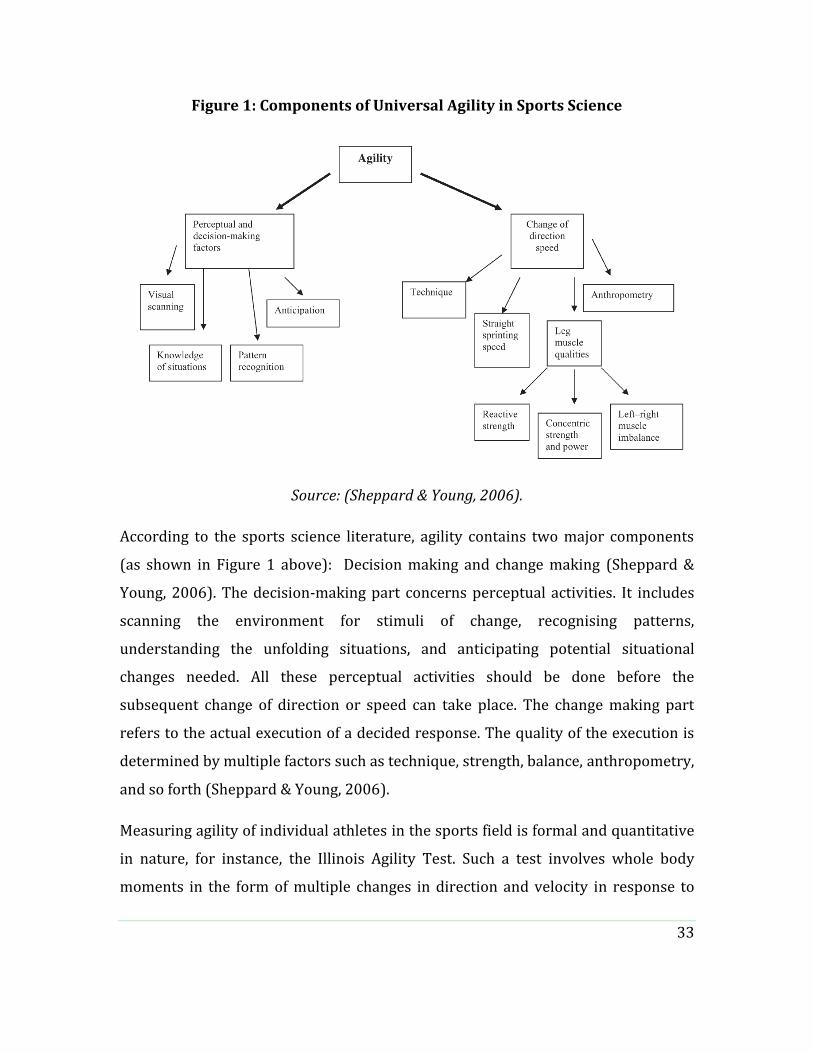
Figure 1: Components of Universal Agility in Sports Science
Source: (Sheppard & Young, 2006).
According to the sports science literature, agility contains two major components
(as shown in Figure 1 above): Decision making and change making (Sheppard &
Young, 2006). The decision-making part concerns perceptual activities. It includes
scanning the environment for stimuli of change, recognising patterns,
understanding the unfolding situations, and anticipating potential situational
changes needed. All these perceptual activities should be done before the
subsequent change of direction or speed can take place. The change making part
refers to the actual execution of a decided response. The quality of the execution is
determined by multiple factors such as technique, strength, balance, anthropometry,
and so forth (Sheppard & Young, 2006).
Measuring agility of individual athletes in the sports field is formal and quantitative
in nature, for instance, the Illinois Agility Test. Such a test involves whole body
moments in the form of multiple changes in direction and velocity in response to

34
certain types of events, and the result is judged by the time taken for the testee to
finish the test. The less time needed to complete the test, the more agility the testee
is considered to have.
Flexibility is also a frequently mentioned concept in sports science, but in contrast
to agility, it is considered less complex. Though it also relates to change, flexibility
does not involve uncertainty nor the temporal dimension that characterises agility.
Flexibility is often defined as the total “achievable excursion” of a body part through
its potential range of motion (ROM) in a smooth, easy, unrestricted, and pain free
manner (Alter, 2004).
Such emphasis on range means that flexibility can be conveniently evaluated by
simple tests such as a “sit and reach” in which the testee is asked to reach both arms
forward while sitting on the floor with straight legs. The maximum reach can be
measured with a ruler. The further the maximum reach is, the more flexibility the
testee is considered to have.
Depending on the particular sport, flexibility is often seen not as critical as agility to
the athlete’s performance. For instance, cricket players do not need to be as flexible
as gymnasts, but they do need a higher level of universal agility to be able to hit and
run in the right time to succeed in games.
In many sports, agility training is used to improve athletic performance, whereas
flexibility training is considered a supportive conditioning for preventing injuries
from sudden stretch of muscles and joints when performing agility-demanding tasks
in competitions (Alter, 2004).
Table 3 below summarises the differences between the concepts of agility and
flexibility derived from the sports science literature. Though both concepts relate to
change, they are separate and distinctive to each other. Such conceptual
distinctiveness helps us clarify the two notions in the business and IS contexts and
gives insight into the true meaning of each.

35
Table 3: Contrasting Agility and Flexibility
Agility Flexibility
Emphasis on Speed of motion
Yes No
Emphasis on Range of motion
No Yes
Uncertainty Yes
(Temporal or Spatial or both)
No
Measurement Response Time Capability Range
Purpose Mostly for improving athletic performance – increasing speed of response
Mostly for preventing sports injury – widening range of response
Any good definition should include a genus and differentia. The former describes a
broader category of the thing to be defined, and the latter is what distinguishes the
thing from others in the same category (Pankaj et al., 2009). The definitions of
agility and flexibility provided by sports science literature meet these criteria. They
both concern the athlete’s response in the form of motions, or changes of body
positions, but one emphasises the time for completing the response while the other
emphasise the range of the response.
In this study, the differentia summarised in Table 3 is used to guide the review and
synthesis of the agility and flexibility concepts as drawn from the literature in the
business and IS disciplines. On one hand, if a reference to flexibility includes
notions of uncertainty (temporal and/or spatial) and speed of response, it will
be treated as an agility reference and included in the review. On the other hand,
if a study refers to agility but does not introduce the aforementioned notions,
it will be excluded from the review.

36
The foregoing review of the sports science literature has injected great conceptual
clarity concerning the concepts agility and flexibility. With such clarity, next, we
examine the definitions of agility in relevant business and IS literature.
2.2.2 Agility in Business: A Conceptual Evolution
2.2.2.1 The History of Agility in Business Research
For decades, business researchers have studied various approaches and capabilities
for handling changes in organisations and their environments. Such changes used to
happen at a relatively slow pace and often with limited level of uncertainty involved,
hence the traditional approach for handling changes has been to increase flexibility
which is essentially to expand the range of processes/products/services a business
system can accommodate (Slack, 1993).
Today, however, simply building flexibility cannot cope with the changes faced in
many industries (e.g. banking, finance, insurance, IT, manufacturing). The
globalisation and development of technologies have introduced unprecedented
levels of complexity and uncertainty, along with a much higher rate of change, into
the internal and external environments of businesses. Building up agility has
therefore been identified as a new approach replacing flexibility with the inclusion
of speed for handling rapid and unanticipated changes in the business environment
(Baskerville, Mathiassen, & Pries-Heje, 2005; Kieran Conboy, 2009; Kieran Conboy &
Fitzgerald, 2004).
Agility, again, is an imported concept for business organisations. The earliest
appearance of this concept in the business literature was probably the “corporate
agility” brought in by Brown and Agnew in 1982 (Brown & Agnew, 1982). However,
the first time that agility entered the mainstream business literature was in a report
named 21st Century Manufacturing Enterprise Strategy (Goldman, Preiss, Nagel, &
37
Dove, 1991) within which the term agile manufacturing was coined. This report was
a result of a joint study in the 1980s by the US government and the US business
sector to discover new approaches for the US manufacturing industry to succeed in
the global competition, with a special focus on its Japanese competitors.
Following this report, business agility was discussed more extensively in a
subsequent book titled Agile Competitors and Virtual Organisations (Goldman, Nagel,
& Preiss, 1995) which defined four dimensions of agile competition: 1) enriching the
customer, 2) cooperating to enhance competitiveness, 3) organising to master change,
and 4) leveraging the impact of people and information. Businesses need to compete
against rivals in handling changes in their customers, partners, and business
operations to achieve desirable financial performance (Ngo-Ye & Ahsan, 2005).
Businesses must not only be capable to change, but to change quickly and gracefully
(Baskerville et al., 2005).
The concept of agility has then been disseminated across various business
disciplines. To describe such ability, researchers and practitioners have created a
number of terms including “business agility” (Mathiassen & Pries-Heje, 2006),
“corporate agility” (Bradley & Hood, 2003), ”enterprise agility” (C.-Y. Huang & Nof,
1999), “organisational agility” (Sull, 2010). Such vigorous creation of new terms for
describing a common concept is a sign of increasing interest, but it is also a
reflection of the lack of a common and concrete conceptualisation in the centre of
such interest.
2.2.2.2 The Development of Definitions of Agility in the Business Literature
Various definitions of agility can be found in the business literature. Table 4 below
summarises several early definitions of agility. These definitions commonly describe
agility by its antecedents (e.g. unanticipated or unexpected changes, rapid change)
and consequences (e.g. thrive, survive, and embrace change). Defining a concept by
its antecedents and consequences is a useful practice for initial conceptualisations of
a phenomenon of interest since such interest is often aroused by the need for

38
effectively and efficiently articulate the antecedents and the need to articulate the
desirable consequences. This is also a sign of the concept being premature and at a
pre-science stage.
Table 4: Early Definitions of Agility in Business Literature
Definitions (Agility defined by its antecedents and consequences) Reference
The ability to react quickly to changing circumstances. (Brown & Agnew, 1982)
Agility is the ability to thrive in a competitive environment of continuous and unanticipated change and to respond quickly to rapidly changing, fragmenting global markets that are served by networked competitors with routine access to a worldwide production system and are driven by demand for high-quality, high-performance, low-cost, customer-configured products and services.
(Goldman et al., 1995)
Agility is primarily concerned with the ability of enterprises to cope with unexpected changes, to survive unprecedented threats from the business environment, and to take advantage of changes as opportunities.
(H Sharifi & Zhang, 2000)
The ability of an organisation to thrive in a continuously changing, unpredictable business environment.
(Dove, 2001)
Agility is the successful exploration of competitive bases (speed, flexibility, innovation pro-activity, quality, and profitability) through the integration of reconfigurable resources, and best practices in a knowledge-rich environment to provide customer-driven products and services in a fast-changing market environment.
(Ramasesh, Kulkarni, & Jayakumar, 2001)
Agility is the continual readiness of an entity to rapidly or inherently, proactively or reactively, embrace change, through high quality, simplistic, economical components and relationships with its environment.
(Kieran Conboy & Fitzgerald, 2004)
Later conceptualisations tend to focus more on the core components or elements of
the concept by removing antecedents and consequences from the definitions.

39
Defining a concept by capturing its core primitives alone is essential for achieving
conceptual maturity and theoretical parsimony. This in turn can enable further
possible scientific operationalisation of the concept.
Table 5: More Recent Definitions of Agility in Business Literature
Definitions (Agility defined by its core components) Reference
The ability to detect and seize market opportunities with speed and surprise.
(Ngo-Ye & Ahsan, 2005)
Agility is a response to the challenges posed by a business environment dominated by change and uncertainty.
(Zain, Rose, Abdullah, & Masrom, 2005)
The ability of firms to sense environmental change and respond readily.
(Overby et al., 2006)
The ability to sense and respond to changes in an organisation’s internal and external environment by quickly assembling resources, relationships and capabilities.
(Gallagher & Worrell, 2008)
Table 5 above lists more recent definitions of agility found in the business literature,
which focus more on core concepts. These definitions attempt to elucidate the
internal composition of agility by describing forms of motion as the core
components of agility, e.g., “sense” and “respond”. The core components of agility
have been added into these definitions over time and in an incremental manner, e.g.
after “respond” has been well established as a core component of agility (Goldman
et al., 1995), “sense” was incorporated into the definition (Overby et al., 2006).
Being able to respond to changes quickly has for long been mentioned as part of
being agile (Goldman et al., 1995; Overby et al., 2006; H. Sharifi & Zhang, 2001).
“Responding” is the ability to leverage favourable changes or to develop defences
against negative changes by adjusting one’s course of action (Nazir & Pinsonneault,

40
2008). This could involve modifying existing products, services, processes,
distribution channels, or creating new ones (Overby et al., 2006).
Early conceptualisations often stress the “responding” part and consider agility to
be a reactive capability. This is in line with the COBIT (Control Objectives for
Information and related Technology) framework (IT_Governance_Institute, 2007)
which specifies agility as the capability of an IT function to respond to received
changes in business requirements and strategy. Subsequent research work has
suggested that agility should also be conceptualised as a proactive capacity in which
sensing change should be the first action taken before responses can be made
(Gallagher & Worrell, 2008; Overby et al., 2006). In the business context, “sensing” is
the ability of an organisation to track regulatory changes, competitor’s actions,
consumer preferences, technological advancements, and so forth (Overby et al.,
2006).
The importance of this “sense and respond” lens in understanding business IS was
argued by Sambamurthy in an influential MISQ paper (Sambamurthy, Bharadwaj, &
Grover, 2003) and used in subsequent studies to further develop theories. For
instance, Overby et al. (2006) in an EJIS paper has proposed that the imbalance
between sensing and responding capabilities can prevent firms from being agile and
waste valuable resource (Overby et al., 2006). Since then, the capabilities of “sensing”
and “responding” have been considered core components of agility and matching
development should be done on both capabilities to achieve agility.
2.2.3 Sense and Respond Models: The Agility Cycle
The “sense and respond” lens provides some structural integrity regarding business
agility. Such a structure roughly resonates with the components of agility in sports
science literature, i.e. as shown in Figure 1 in Section 2.2.1, “sense” is more aligned
with “perceptual and decision making” , while “respond” more with “change of

41
direction and speed”. This rough alignment confirmed our approach in selecting
literature and allowed us to review the literature with a better focus at a finer level
of detail. Further investigation into the existing publications has suggested that
“sense and respond” is not at all a brand-new notion in non-sport contexts and has
been studied by other research communities besides business and IS. For instance,
military researchers have long been developing models and theories to improve
responsiveness in C2 (Command & Control) operations based on sense and respond
behaviour (Lawson, 1981).
Table 6: “Sense and Respond” Models
Model Components Authors
SDSE Sense-Diagnose-Select-Execute (Pankaj et al., 2009)
SARI Sense-Interpret-Analyse-Decide-Respond (J. Schiefer & Seufert, 2005)
SIDA Sense-Interpret-Decide-Act (Haeckel & Nolan, 1996)
SPCDA Sense-Process-Compare-Decide-Act (Lawson, 1981)
SHOR Stimulus-Hypothesis-Option-Response (Wohl, 1981)
OODA Observe-Orient-Decide-Act (Boyd, 1976)
Table 6 above provides a list of other representative “sense and respond” models we
found across the literature of business, IS, and military. Among this set of models, the
OODA model developed by military strategist Colonel John Boyd for the US Air Force
is considered a seminal work. OODA, with “Observe and Orient” seen as subunits of
“Sense” while “Decide and Act” as subunits of “Respond”, was developed as a training
program for fighter pilots to explicitly establish a dynamic learning habit. It is
believed that pilots who learn to “cycle through” these mental stages faster than their
opponents will prevail in dogfights where agility overtakes raw offensive power.
Such a belief was derived from observations during the Korean War in the 1950s’

42
when the US F-86 Sabres pilots achieved a 10 to 1 kill ratio over the pilots flying the
more powerful Russian MIG-15 fighters. Compared to the mechanically more
advanced MIG-15, the F-86 aircrafts allowed better visibility for fast sensing and
easier control systems for rapid manoeuvre (Osinga, 2005).
The OODA model was first articulated as a tactical model for air-to-air combats in
the 1960s’ and later became a strategic model for command and control. The
essence of OODA is a loop-like structure with Observe often being the default
starting point. The following phases, Orient, Decide, and Act will in turn send
feedback to the Observe phase for better informed observation. Such a model
represents a philosophy of handling uncertainty and unpredictability through
continuously refreshing one’s perception of the reality and challenging the status
quo.
The OODA model has been applied in business studies by Steve Haeckel and Richard
Nolan who altered it to a SIDA loop (also in Table 6) to explain the transformation of
modern businesses from “Make and Sell” to “Sense and Respond” in the information
age (Haeckel & Nolan, 1996). The OODA model has also been extended to the E-
Commerce context by John Canter as an “agility” model to explain the competition in
business environments, which are seen as complex, non-linear, unpredictable and
continuously changing (Canter, 2000). As argued by Canter, a competitive business
marketplace is similar in many ways to a military battlefield (Canter, 2000).
Later on, more models have been published in business outlets, but share much in
common with the OODA model. Examples include the SARI (J. Schiefer & Seufert,
2005) and SDSE (Pankaj et al., 2009) models. SDSE is the most recent model used to
describe the subcomponents of agility and has been assessed in an empirical IS
study based on ten interviews with IS executives. In this study, Pankaj et al. (2009)
verified that Sensing, Diagnosing, Selecting, and Executing are considered the four
key capabilities enabling agility and concluded that each capability has its own
distinct features which need to be developed individually.

43
2.2.3.1 The Agility Cycle
All “sense and respond” models affirm a cyclic view of how agility should be
achieved. Based on these models and following the recent terminology used in the
literature (Pankaj et al., 2009), we propose the “Agility Cycle” (see in Figure 2, also
called the “SDSE loop” in this thesis) as an abstract yet fundamental means to
illustrate and consolidate the concept of agility. In this study, we posit that agility is
not a one-off effort, rather, it is achieved though iterative loops which result in a
continuous awareness and readiness for change in an ever-shifting and uncertain
environment. An agile organisation needs to strive for refreshed perception of
reality during each loop, as observations of the environment may be incomplete and
imperfect.
In this Agility Cycle, we also introduce the concept of “Synchronicity” to highlight
the time aspect of agility, as well as “Friction” and “Torque” to represent the forces
that slow down and/or speed up the cycle. All these notions will be explained in the
following pages.
Figure 2: The Agility Cycle
Sensing is about detecting and collecting signals from the business environment
that suggest a need for change in the perception of reality and/or the course of

44
action. This is arguably essential to initiate or continue a response, as the sensing
capability of an organisation determines what changes can be observed (Ngo-Ye &
Ahsan, 2005; Overby et al., 2006). Today, physical and virtual sensors can be set up
to monitor business signals such as customer shopping preferences, performance in
order fulfilment, reputation on social media, etc. Sensors can also be used to
capture signals from the IS and underlying technologies, such as security breaches
of users, computing and storage resource, network traffic, etc.
If the sensing capability is flawed, the organisation may delay necessary changes.
Even worse, it may initiate incorrect responses which can mislead the business to
waste valuable resources. Given that most business organisations do not have
unlimited resources, the consequences of flawed sensing, if not detected, can strain
a business significantly ranging from cost increases to loss of market share and
competitive advantages (Pankaj et al., 2009).
Diagnosing is about filtering and interpreting signals. Filtering involves separating
valid signals from noise (Pankaj et al., 2009). Effectively and efficiently filtering out
relevant and valuable data and discarding the rest is especially imperative for
businesses operating in “globally wired”, information intensive marketplaces
(Canter, 2000). Such marketplaces are overloaded with data but much of it is noise
rather than signals. With the explosive growth of data fuelled by further diffusion of
Internet-based applications, the signal-to-noise ratio tends to wane thus
distinguishing the two is becoming more important than ever (Silver, 2012).
Without a proper filtering mechanism, businesses can be overwhelmed or even
paralysed by the excessive amount of data received from internal, organisational,
and environmental sources.
Interpreting is also a critical phase of diagnosing. Once a signal is sensed, it needs to
be analysed and understood before any meaningful response can be made. Accurate
diagnosis allows the organisation to gain more understanding towards the nature
and cause of a change. An important objective of the diagnosis phase is to detect
45
patterns and trends by collectively interpreting signals which individually may be
too small to indicate an upcoming change in the environment (Pankaj et al., 2009).
Today, many businesses have started to adopt techniques such as data-driven risk
assessment and probabilistic analysis to help evaluating the likelihood and potential
consequences of changes occurring in their organisations as well as from their
environments.
Selecting is about deciding on a response to the diagnosed change. This is the
process of choosing an hypothesis about a situation and making a response to it
(Grant & Kooter, 2005). A response can be as big as “change the whole working
process” or as little as “keep an eye on it”. Setting up criteria for selecting a response
can help the decision making process. The four metrics—time, cost, predictability,
and scope,—defined by Dove may be used as metrics to assess response proficiency
(Dove & LaBarge, 2014). Ideally, an agile business should be capable of continuously
selecting responses within the time constrains and without compromise on other
metrics (Pankaj, 2005). In situations where agility is critical, time should be
prioritised but if there are several responses satisfying the time constraints, then
other criteria need also be considered. This requires mastery in estimation to assess
the available responses against the four metrics and the resources available. In
reality, a “quick patch job” that can be done in time may be more valuable than a
robust solution done too late (Pankaj, 2005).
Executing is the process of testing the chosen hypothesis by acting on the selected
response (Grant & Kooter, 2005). This stage is where flexibility can play a role. An
inflexible business may find executing harder than a flexible one does. However, if
an inflexible business senses a change way before the flexible one takes notice, it
might start responding much earlier than the flexible one. Therefore, we note again
that being flexible is not a sufficient condition to agility. Even though flexibility can
help, a flexible organisation may not be agile if it is unable to detect and decide in a
timely manner.

46
Execution involves disseminating decisions and supervising actions through
feedback (Canter, 2000). This stage is a critical part of the Agility Cycle, as a
successful execution requires excellence in coordination between multiple aspects
of the selected response (e.g. time, cost, scope, etc.). Being the last stage of the
Agility Cycle, execution failure can effectively negate the results of the previous
stages.
If a response is not executed within the time constrains, or it is executed in time but
not as intended (e.g. of poor quality, at excessive cost) then it cannot be considered
successful. The execution phase completes one loop of the Agility Cycle. As
responses have been made, the situation is now changed, hence initiating a new loop
that demands for new observations (Canter, 2000).
In a large business, multiple Agility Cycles may be processed concurrently within
and between functions and business units. Reconciling these multiple cycles
requires more effort in coordination and communication than does focusing on a
single one. Therefore, an additional layer of orchestration or federation needs to be
considered when designing an agile IS to support an agile organisation.
Synchronicity is used to describe the time aspect of the Agility Cycle. Dennis et al.
(2008) in their MISQ article defines Synchronicity as “a state in which individuals
are working together at the same time with a common focus” (p.581) (Dennis, Fuller,
& Valacich, 2008). Following this definition, by Synchronicity we mean that the
individual steps in the Agility Cycle, i.e. “Sense”, “Diagnose”, “Select”, and “Execute”,
should be working continuously without anyone lags behind and sharing a common
focus of looping through the cycle.
Synchronicity characterises a synchronous and timely flow from one step to the next
without any blockage. It demands for a desirable state of harmonious balance across
the four steps of the Agility Cycle when continuously looping through iterations. In
one single loop through the Agility Cycle, the output of a previous step (e.g. diagnose)
47
should naturally become part of the input of the following phase (e.g. select) without
delay. When looping through multiple iterations, however, a fast-moving Agility
Cycle may have several steps (e.g. sense and diagnose) processing the next iteration
already while the others (e.g. select and execute) still finishing the current one. This
way, the capacity of each step on the Agility Cycle is fully utilised and not waiting in
idle state. Such a full utilisation of capacity represents a high level of “Agility
Alignment” described by Overby et al. (2006). This level of alignment indicates no
material imbalance between the “sense” and “respond” capabilities of an enterprise
through overdevelopment or underdevelopment.
Synchronicity also indicates that in any single loop of the Agility Cycle, the “respond”
phase should occur within a certain acceptable period of time after the “sense”
phase, and vice versa. Otherwise a response would be considered “out of sync”
meaning outdated or even failed. Such an “acceptable time frame” between sense
and respond hereafter is denoted by ∆S-R. In business, this ∆S-R can vary much
vertically within an organisation, or horizontally across industries. For instance,
along the vertical hierarchy, at the operational level, a business may need to set its
∆S-R as short as a matter of minutes (e.g. order fulfilment for online digital
products), whereas at the strategic level, an acceptable ∆S-R can mean weeks if not
months (e.g. acquisition of a smaller rival company). Horizontal contrast also exists
among different industries, for example, in textile manufacturing, days or weeks are
acceptable values of ∆S-R for changing colours and styles of products, whereas in
high-frequency stock trading it often goes down to seconds if not milliseconds,
meaning a few seconds late is considered a failure as the opportunities are already
gone.
We argue that explicitly defining ∆S-R values at different organisational levels is
essential for businesses to achieve agility. Being agile presupposes being time-
sensitive and acknowledge time constrains in business operations. This is a key
property that differentiates agility from other concepts such as flexibility. Previously

48
such time constrains have often been vaguely described as “quickly” (Gallagher &
Worrell, 2008; Goldman et al., 1995), “rapidly” (Kieran Conboy & Fitzgerald, 2004;
Goldman et al., 1995), “with speed” (Ngo-Ye & Ahsan, 2005),, “in real time” (Pankaj
et al., 2009), or “right-time and on-demand" (Knabke & Olbrich, 2013). All these
terms are attempts to capture the sense of urgency that inheres in agility. However,
the terms “quickly, rapidly, with speed” can be too ambiguous to implement,
whereas “real time” may be too radical and may only happen in an ideal world.
The notions of Synchronicity and ∆S-R can provide more conceptual clarity than the
predecessors by articulating a particular state and depicting a specific and realistic
time frame within which agile businesses should perform. Since modern businesses
are defined by competition, it is not the absolute speed that matters, but rather the
speed relative to one’s customers and competitors (Canter, 2000). As long as a
business can maintain a higher tempo of actions relative to customers and
competitors, it is agile enough to cope with the challenges and reap the
opportunities. To achieve this, a business must be able to loop through the Agility
Cycle without disruptive delay or bottlenecks at any of the four phases.
Torque and Friction are two key forces commonly being studied in natural
phenomena (e.g. Cyclone intensity (Smith & Montgomery, 2015) ) or man-made
artefacts (e.g. Helicopter rotor (Ferris & Smith, 1978) , Gear transmission
(Fernandez-del-Rincon et al., 2017)) involving rotational and cyclic motions. In this
thesis, the Agility Cycle is cyclic and rotational in nature. We have found that
introducing the Torque and Friction notions into the mix brings higher conceptual
clarity and helps gain insights into the inner workings of the Agility Cycle in a
metaphorical fashion.
We define Torque as the force that drives forward the Agility Cycle to sense and
respond to changes, whereas Friction is the counter-force to stop the forwarding
movement. The stronger the “Torque” is, the more rapidly the Agility Cycle can loop
forward, and shorter the ∆S-R will be. As a result of higher Torque, quicker decisions
49
can be made, and faster actions can be taken. On the opposite, the higher “Friction”
an Agility Cycle encounters, the slower it can cycle, and the longer ∆S-R will be. Or
even worse, the cyclic motion may halt if Friction overpowers Torque. As a result, a
business may be paralyzed into stagnation and become indecisive and unresponsive
to changes. From an IS perspective, when agility is critical and a set of time
constraints are given, the designers should favour features that add more Torque
and be cautious with those bringing in more Friction.
However, one shall not hope to remove Friction completely and once for all. It is the
nature of any cyclic and rotational systems (such as a complex decision support
system) that Torque goes hand in hand with Friction (which is expressed in the
concept of feedback from the environment). Often designers will need to
continuously make trade-offs to keep a system evolving and tuned to support
business agility. In some extreme cases where agility is the main desired outcome,
identifying Torque and Friction should become part of the requirement engineering
effort starting from the beginning of an IS development project. For example,
MitoSystems.com 2 , which has designed and developed a ground-breaking
knowledge discovery system called Mitopia, has explicitly defined Torque and
Friction besides the OODA loop in their requirements documentation in order to
keep development focused on agility throughout the whole Software Development
Life Cycle (SDLC).
There is no doubt the proposed Agility Cycle is based on previous studies from
multiple research disciplines, which we see as a strength. Such a proposal integrates
the various models with concepts taken from sports science, military research,
mechanical engineering, and business studies with the purpose to bring conceptual
clarity and establish structural integrity of Agility as a critical concept. The Agility
2 http://mitosystems.com/how-to-write-requirements/

50
Cycle integrates the “perceptual and decision making” component of agility defined
in sports science (as shown previously in Figure 1), while the execution of response
parallels the “change of direction and speed” component (as shown in Figure 1). The
Agility Cycle also explicitly depicts agility from a cyclic and rotational view, which is
adopted from the OODA loop by John Ford (Osinga, 2005). The introduction of
Synchronicity is influenced by the Theory of Media Synchronicity (Dennis et al.,
2008). And finally, Torque, and Friction are included based on studies of cyclic and
rotational motions in science and engineering (Fernandez-del-Rincon et al., 2017;
Ferris & Smith, 1978; Smith & Montgomery, 2015).
2.2.3.2 Other notions not to be confused with the Agility Cycle
Besides agility, the business literature has seen other concepts being developed to
describe business behaviour in turbulent environments, such as absorptive capacity
(Cohen & Levinthal, 1990), strategic flexibility (Ansoff, 1980), dynamic capabilities
(Tecce et al., 1997), and improvisational capabilities (Pavlou & El Sawy, 2010).
However, these concepts largely zero in on strategic issues, whereas the concept of
agility can not only describe strategic behaviours, but also tackle tactical and
operational issues. Strategic issues are distinct from tactical or operational issues
(Porter, 1996). Therefore, many IS researchers have urged to treat agility as a
unique notion distinct from the aforementioned concepts (Overby et al., 2006;
Pavlou & El Sawy, 2010).
The Cynefin model (Snowden & Boone, 2007), however, stands out on its own to be
the most supportive concept to the Agility Cycle we defined. The Cynefin model was
first developed by Dave Snowden in 1999 in the context of knowledge management
and organisational strategy. Later in 2002, the model has absorbed
complex adaptive systems theory into the mix. It was further developed and
elaborated by Cynthia Kurtz at the IBM Institute of Knowledge Management, and by
Mary Boone to extend the model to Leadership. The Cynefin model appeared as the

51
cover feature in the Harvard Business Review in 2007 in the context of leadership
and decision making (Snowden & Boone, 2007).
Table 7: Cynefin Framework
Complex Complicated
Probe-Sense-Respond
Emergent Practice
Enabling constraints & Loosely Coupled
Sense-Analyse-Respond
Good Practice
Governing Constraints & Tightly coupled
Chaotic Simple
Act-Sense-Respond
Novel Practice
Lacking constraint & De-coupled
Sense-Categorize-Respond
Best Practice
Tightly constrained & No degree of freedom
Cynefin, although positioned itself as a framework for understanding and planning
organisational strategy and leadership, highlights the critical value of “sense and
respond” in all four quadrants representing four typical situations commonly faced
by decision makers. Essentially, for any context defined by the model, (i.e. complex,
complicated, chaotic, and simple), a business must go through the cycles of sense and
respond. The four different contexts suggest different ways to approach the “sense
and respond” cycle. In the “complex” and “chaotic” situations, Cynefin suggests to
either probe or act first to gain initial feedback, and then proceed with “sense and
respond”. In the “complicated” or “simple” contexts, Cynefin suggests sensing first,
and then either analyse or categorize, before the subsequence response.
We see the Cynefin model as a great supplement, not a rival, to the Agility Cycle
described in Figure 2. The Agility Cycle, emphasises the cyclic nature of agility in
business. This means that cycles after cycles of “sense, diagnose, select, and execute”
stages performed in Synchronicity should be the nature of an agile business. We do
not foresee, from an IS perspective and for the purpose of our study, that there is a

52
need to differentiate which stage should be initiated first in different contexts. As
long as the IS is designed properly to support and facilitate all these stages, the
business and in particular the decision makers can choose where to start. Moreover,
the steps proposed by the Cynefin model, namely, “act, probe, analyse, and
categorise”, are all activities covered by “diagnose” and “execute” in our Agility Cycle.
To sum up, this section has presented the agility theories and models derived from
various streams of the research literature and integrated them in to one model - the
proposed Agility Cycle. This Agility Cycle is comparable to the agility mechanism of
natural living beings and of artificial control systems. Like rugby players in a
competitive game or jet fighters in a dogfight, businesses which can execute the
cycle faster, with better Synchronicity, higher torque and lower friction, than their
competitors are more agile and will gain an ever-increasing advantage with going
through each cycle. Such advantage can accumulate quickly so as to allow the more
agile ones to overwhelm their opponents and to prevail (Canter, 2000).
2.2.4 Main Categories of IS Agility Research
The proposed Agility Cycle enables us to structure our inquiry into how the IS
literature has been regarding the concept of agility. Among the published IS
research, we have seen a diverse range of interests stretching from organisational
culture and climate, to system design and development. Not all of these are directly
related to the core Agility Cycle concepts (e.g. “sense and respond”) we have
elaborated. In this research, we specifically focus on IS Agility per se, which is
defined as:
The ability to design, develop and use machine-based information systems to
facilitate the “sense and respond” capabilities of human-based organisations.
Depending on the problems of interest, IS Agility can be studied from two
perspectives, one is targeting at challenges from a system design standpoint studying

53
the creation and construction of individual IS. This can include design patterns,
development processes, and characteristics of IS, often in a generic term (Babb, Hoda,
& Norbjerg, 2014; Dove & LaBarge, 2014; G. Lee & Xia, 2010). The other is targeting
at issues from an information design viewpoint studying the utilisation,
configuration and organisation of a collection of information supporting a common
business goal. This can include business decision making, event processing,
workflow modelling, often in specific systems with explicit business missions (P.-Y.
Huang, Pan, & Ouyang, 2014; Nguyen, Schiefer, & Tjoa, 2007; Rasouli, Ghazanfari, &
Eshuis, 2017; Rouse, 2007). The former, hereafter termed “Dev Agility”, involves the
interplay between the IS and its developers to make effective responses to changes in
the technological components of the IS, whereas the latter, hereafter termed “Ops
Agility”, is mainly concerned with the interplay between the IS and its users3 on
making effective responses to changes in the business components of the IS.
The “Dev vs. Ops” dichotomy provides a useful structure for us to organise the
review of IS Agility literature. This structure fits well with the common classification
scheme in IS research where studies make a clear distinction between IS
development and IS operation (H. Barki, Rivard, & Talbot, 1993). Such a
dichotomous classification is also in alignment with the language used by IS
practitioners, e.g. the recently popular notion of “DevOps” (Erich, Amrit, & Daneva,
2014). “Dev Agility” can be seen as a joint capability of a system and its developers. It
often refers to the “sense and respond” ability that an IS development function needs
to create working systems, in situations where business requirements can be
incomplete, uncertain and unarticulated, which in turn change frequently even when
the coding phase has started (K. Conboy, Coyle, Wang, & Pikkarainen, 2011). “Ops
3 By users we mean those members who operate IS to achieve business goals within the limits and constrains inherited by the IS. This would include business users, super users, system administrators and so on, who can adjust the system within the boundary designed by IS developers. Users can create new content, reorganise existing functions and workflows, but are not responsible for creating new functionalities beyond the existing options of an IS.

54
Agility” is more a joint capability of a system and its users. It is related to how well a
system in operation is designed to allow easy and rapid changes on its own
behaviours to support the “sense and respond” ability of its users to handle
unpredictable changes in business processes and environments (Schatten & Schiefer,
2007).
Fundamentally the focus of “Dev Agility” differs from that of “Ops Agility”. The
former is responsible for sensing and responding to changes in the system-
engineering environment (e.g. to detect and act effectively and sustainably on
changing demand on technological infrastructure and evolving
functionalities/business requirements). On the other hand, the latter is mostly
concerned with sensing and responding to changes in the system-operation
environment which may or may not necessitate changes in the system-engineering
environment (e.g. to monitor and respond effectively and sustainably to changes in
online sales above/below different targets in different regions; this can mean
capturing and analysing evolving product preferences of online customers, and
adjusting online marketing approaches in a timely manner). Chapter3 will discuss
the interplays between “Dev Agility” and “Ops Agility”, as well as their inner
workings in more detail.
2.2.4.1 Dev Agility
“Dev Agility” aims at improving the Agility Cycle of IS development. Such an agility is
mostly about enabling IS developers to sense and respond to required technological
changes, in the development mode of the IS being designed. The systems
engineering literature has clearly identified Dev Agility as having two sides: agility of
the system development process; and agility of the resulting system (Haberfellner &
Weck, 2005) (Dove & LaBarge, 2014). The former inquiry, can be summed up as the
title “Agile System-Development”, analyses the agile engineering methodologies for
developing IS, while the latter can be summed up by the title “Agile-System

55
Architecture”, examines common architectural arrangements and principles of agile
systems.
Relating back to the Agility Cycle, studying and applying agile engineering methods
and techniques are for increasing the desirable change-driven “Torque” of the IS
development team when building new or modifying existing software components,
while dissecting and extracting common design patterns from known agile systems
are means for decreasing undesirable change-resistant “Friction” inherited in the
integration of system subcomponents. Both are critical to the “Synchronicity” of the
Dev Agility Cycle as they work together to reduce the ∆S-R of IS development teams.
Such a dynamic interplay is illustrated in Figure 3 below.
Figure 3: Dev Agility Cycle

56
Agile System-Development
As shown in Figure 3 above, this category of research has a strong focus on
increasing the “Torque” of IS development teams so they can cycle through the SDSE
loop effectively by taking on new requirements frequently and delivering small
chunks of functionality in much shorter iterations (often in weeks, if not days), when
compared to traditional plan-driven or waterfall engineering approaches (Boehm &
Turner, 2003; Sommerville, 2010).
This category of literature concerns software-intensive engineering approaches to
boost short iterative system development processes as well as to improve team
capabilities and productivity. Such type of system-development methods is
generally recognised as “short cycle time development” (Richard & Jan, 2004).
Methods examined in this category allow development teams to maintain a high-
level of responsiveness when faced with new/changed requirements. This research
area has been highly prolific since the inception of The Agile Manifesto in 2001, and
it zeroes in on Agile Software Development Methodologies (commonly known as
Agile Methods) such as Extreme Programming, Scrum Project Management, and
Adaptive Software Development etc. These methods suggest principles and
practices emphasizing people over processes, working software over
documentations, short iterative deliverables/prototypes over long planning phases,
and close collaboration between development teams and clients over contract
negotiation (AgileAlliance, 2001).
Agile Methods are believed to have revolutionized software development practice
and have been passionately adopted by many business organisations across
different industries. In academia, IS researchers have been studying the impact of
these methods, e.g. in project success factors (Chow & Cao, 2008), management
approaches (Coram & Bohner, 2005 ), leadership style (Yang, Huff, & Strode, 2009),
and so on. It would be impossible to discuss IS Agility without mentioning Agile
Methods. The downsides of Agile Methods, however, as often criticised by

57
conventionalists, are the lack of detailed documentation, the lower quality
assurance due to fast iterations and the extensive dependence on individual
capabilities of developers.
Agile-System Architecture
As shown in Figure 3, this category of literature concerns mostly with devising
methods to improve the modifiability of IS, in development mode, by IS developers.
Such methods aim to decrease the “Friction” of the Dev Agility Cycle to a degree that
even unexpected new requirement changes are necessitated, the IS development
team will be faced with minimal resistance entailed from the architectural
arrangements of the existing system when making the decided technological
changes. In other words, this category is about devising and evaluating means to
minimise architectural rigidity in IS.
Researchers and practitioners have reported several key characteristics of Agile-
System Architecture, such as compatibility (Bhatt et al., 2010; Ngo-Ye & Ahsan,
2005), interoperability (Hugoson, Magoulas, & Pessi, 2009), scalability (Bhatt et al.,
2010; Pankaj et al., 2009), modularity (Bhatt et al., 2010; Dove & LaBarge, 2014;
Ngo-Ye & Ahsan, 2005), and standardisation (Bhatt et al., 2010; Gallagher &
Worrell, 2008; Nazir & Pinsonneault, 2008). A detailed review of these
characteristics is not the purpose of this section and can be found in our book
chapter (Yang et al., 2013). Among the above architectural characteristics,
modularity is often deemed to be a deciding factor for the level of re-constructability
of a system (Camarinha-Matos, Afsarmanesh, & Rabelo, 2003; Martensson, 2007)
(Dove & LaBarge, 2014). Other characteristics are more of prerequisites (e.g.
standardisation and compatibility) or somewhat outcomes (e.g. scalability and
interoperability) of high level of modularity. For instance, effective and functional
modular design requires predefined standards (either globalised or localised) and
sound compatibility to ensure connectivity across modules and components. These
can then enable better interoperability across systems and services. Scalability is

58
also a benefit of modularly designed systems as modularized resources and
applications are easier to couple and decouple with each other. Advances in
modularity should allow fast changes of the technological components of the IS
(hardware infrastructure and software application) without major economic
penalty (Nazir & Pinsonneault, 2008).
Non-modular and tightly coupled architecture can become a major “Friction” since
integrating new technological components can often become a whole-system
reconstruction work which is slow and costly (Dove & LaBarge, 2014). A highly
modularised system, on the other hand, consists of reusable modules that are “self-
contained, encapsulated units, complete with well-defined interfaces which conform to
the plug-and-play infrastructure…” (Dove & LaBarge, 2014). Such an architectural
design can also be found in those classic toy construction kits such as Erector Set,
Bristle Blocks, and Marble Run which all allow kids to develop new toys and modify
existing toys with ease and speed.
In general, Agile-System Architecture can be constructed to support effective and
timely changes. This research area focuses extensively on software design patterns
and architectural principles to accommodate functionality and technological
changes. Many studies can be found on long-standing topics such as Objected
Orientation (Singh & Chana, 2012) , Service-Oriented Architectures (A. Barros,
Decker, Dumas, & Weber, 2007; Ren & Lyytinen, 2008), Aspect-Oriented
Programming (F. J. Barros, 2015), Layered-Architectural Style (Babar, Brown, &
Mistrík, 2013), etc. These techniques are mainly concerned with creating loosely
coupled, plug-and-play, system components and sub-functions that can be modified
in isolation, in development mode, without significant time and cost penalties.
However, developing and following a reference architecture to map out all the key
components/elements/interdependencies of an agile-system for a specific domain
may require a significant amount of time and effort which can become cost-
prohibitive to IS practitioners in the private sector expecting month-by-month new
59
releases to compete and survive in a fast-paced marketplace. Not to mention that
defining the degree of granularity for modularising a system is a difficult decision to
be made upfront and has long been a critical challenge for system developers
(Dörbecker & Böhmann, 2015),
2.2.4.2 Ops Agility
The aforementioned two subcategories are the main pillars of “Dev Agility” found in
the literature. However, with Dev Agility only, a business may find itself seeing new
IS releases—with new features being implemented and old bugs being fixed—more
effectively and frequently. But there is no guarantee that such releases and bug
fixings will improve the “sense and respond” capabilities and quality of the very
business. Being agile in the development mode of an IS doesn’t suffice agility in its
runtime mode. This is the fundamental issue addressed by “Ops Agility”, which
focuses on sensing and responding to the changes occurring in the IS-operation
environment, in the runtime mode, regarding the business components of IS.
“Ops Agility” aims to improve the Agility Cycle of IS operation and utilisation (in
business-focused functional groups such as production, distribution, sales &
marketing, etc.). We identified two main subcategories of “Ops Agility” in the
literature: “Agile System-Operation” and “Agile-System Configuration”. The former
looks into approaches for increasing the change-driven “Torque” through
technology-enabled “sensing and responding” driven by smart business sensors,
analytics, and automation etc. The latter searches ways for decreasing change-
resistant “Friction” via enabling system users to make effective and timely
alterations of the business components of IS (e.g. risk classifications, product
associations, operational workflows), through self-service parameter configurations,
with minimal intervention from the original IS developers. Both are critical to the
“Synchronicity” of the Ops Agility Cycle (shown in Figure 4 below) as they work
together to minimise the ∆S-R of IS users of non-IT business functions.
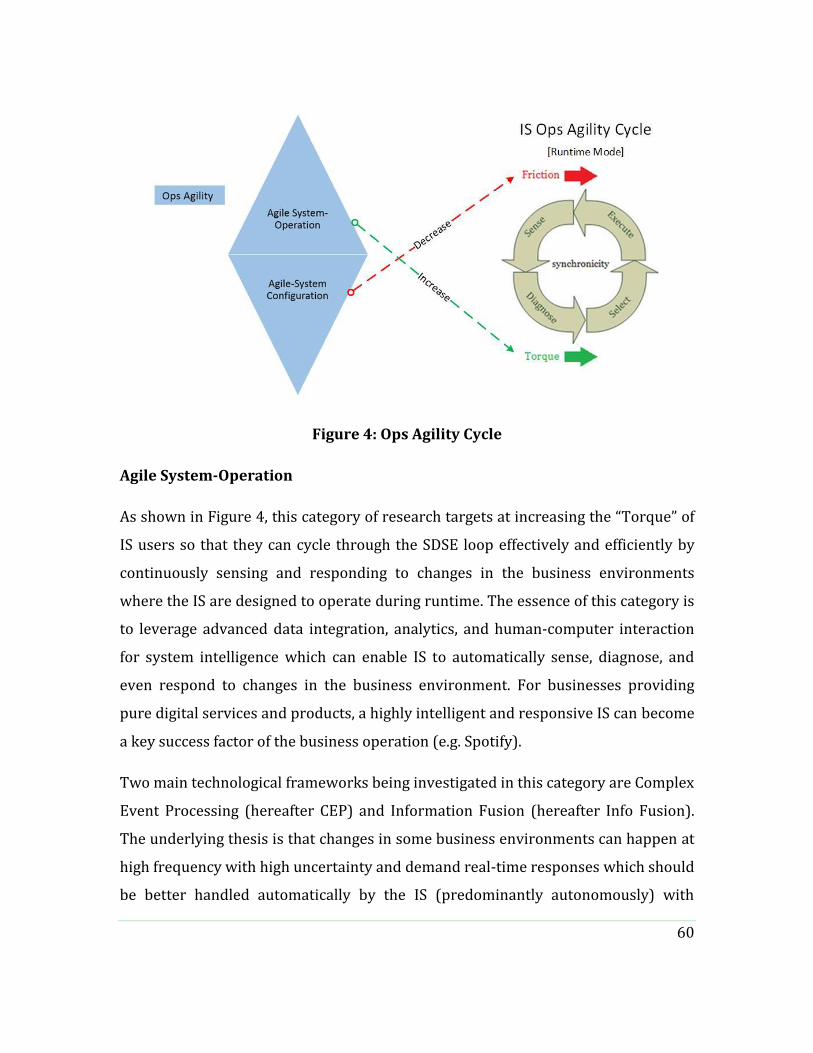
60
Figure 4: Ops Agility Cycle
Agile System-Operation
As shown in Figure 4, this category of research targets at increasing the “Torque” of
IS users so that they can cycle through the SDSE loop effectively and efficiently by
continuously sensing and responding to changes in the business environments
where the IS are designed to operate during runtime. The essence of this category is
to leverage advanced data integration, analytics, and human-computer interaction
for system intelligence which can enable IS to automatically sense, diagnose, and
even respond to changes in the business environment. For businesses providing
pure digital services and products, a highly intelligent and responsive IS can become
a key success factor of the business operation (e.g. Spotify).
Two main technological frameworks being investigated in this category are Complex
Event Processing (hereafter CEP) and Information Fusion (hereafter Info Fusion).
The underlying thesis is that changes in some business environments can happen at
high frequency with high uncertainty and demand real-time responses which should
be better handled automatically by the IS (predominantly autonomously) with
61
assistance from human operators, rather than the other way around. In such
environments, IS should have explicitly defined “sense and respond” functionalities
for users to perform the initial setup and following adjustments (Zappia, Paganelli,
& Parlanti, 2012). With comprehensive event rule definitions, many responses can
be automated based on the integration of multiple data sources for inference and
decision making. IS users are allowed to define rules, add sensors and alerts, and
create responses to events. Gradually many well-tested responses and reliable
recommendations can be made automatic. Practical agile applications in specific
areas include banking fraud detection (Nguyen, Schiefer, & Tjoa, 2005), algorithmic
stock trading (Acharya & Sidnal, 2016), B2B eService recommendation system
(Shambour & Lu, 2012), traffic management (Dunkel, Fernández, Ortiz, & Ossowski,
2011), etc.
Research in this category directly concerns the optimal balance of collaboration and
coordination between IS and users that can help businesses to sense and respond to
environmental changes (Josef Schiefer, Rozsnyai, Rauscher, & Saurer, 2007). This
involves utilising IS-enabled sensing capability to identify new threats and
opportunities to the business, as well as to analyse and evaluate options in real time.
This can be done by users setting up business sensors to automatically collect
data/signals from the environment, integrating disparate data sources to
collectively detect trends and patterns cannot be discovered through each
individual source alone (Solano, Ekwaro-Osire, & Tanik, 2012). Furthermore, IS can
be operated in a way that helps the users perform inferences and make time-
sensitive decisions on appropriate courses of action (Paschke, Vincent, & Springer,
2011; J. Schiefer & Seufert, 2005), which can improve the speed of response to
counter threats or reap opportunities. This can also include the actual execution of
the decided actions, monitoring the progress of actions, and collecting feedback.
More importantly, Agile System-Operation is about cultivating the ability to get all
the aforementioned steps done in Synchronicity and within the constrained ∆S-R
defined by the business environment.
62
Established heavy-weight CEP and Info Fusion engines (e.g. TIBCO StreamBase) are
expensive investments thus have not been universally adopted in business
operations. Nonetheless in many business contexts, the “sense and respond” design
logic and work mechanism of CEP and Info Fusion can still be adopted to create
solutions that will deliver automated intelligence and make responses to business
changes. Furthermore, light-weight solutions (Zappia et al., 2012) and open source
options (e.g. WSO2, Esper) are also emerging which can potentially boost the
adoption of such technologies.
Agile-System Configuration
As shown in Figure 4, the main purpose of this category is to look for approaches
that can make the business-supporting features of IS more modifiable and
manipulable, in runtime mode, by IS users, through configuration (often model-
based with adjustable parameters), if not construction. Such approaches aim for
reducing the “Friction” on the Ops Agility Cycle to a degree that when unexpected
new operational changes are necessitated, the business components of IS can be
effectively and easily reconfigured by users or even the IS itself, during runtime, to
support these changes, with minimal technological difficulties and business
disruptions caused by rigid configuration design built into the IS.
Research topics in this category are relatively diverse but mostly represent the
various aspects of dynamic configurability of sociotechnical systems, particularly
adaptive Process-Aware Information Systems (PAIS) with which users can rely on to
make easy and timely changes in business processes, using visual modelling tools.
Historically, a major drawback of traditional PAIS has been the lack of adaptability
in the implemented processes which then leads to rigid behaviours or gaps between
real-world processes and implemented ones (Reichert, Rinderle-Ma, & Dadam,
2009). PAIS promotes the separation of two important concerns: activity execution
(e.g. workflow automation) and process modelling (e.g. BPMN) which were
originally derived from the manufacturing industry where machine operations and

63
assembly lines prevail. However, modern application of PAIS aim to support non-
manufacturing, service businesses and office operations which involve mostly
human activities that are more complex and changeable than those on the factory
floor. The operations that PAIS need to support in a modern business environment
are far less standardised and repetitive, therefore difficult to fit in static process
models and execution plans (Adams, 2010).
Many have reported systematic approaches for improving the dynamic
configurability of PAIS so that processes execution instances can be adapted during
runtime. To name a few, the Resilient BPM Framework based on the balance
between “Control (prescribe vs. discretionary” and “Response (planned vs.
unplanned” has laid out a high level conceptual model including five essential
components: failure handling, exception handling, model adaptation, restricted ad-
hoc changes, and unstructured interventions, as well as necessary services for
detection, diagnosis, recovery, and escalation of changes at both model and process
instance levels (Antunes & Mourão, 2011). More technologically detailed solutions
such as YAWL Worklet Services are based on Activity Theory and Ripple-Down Rule
technique allow real-time launch or cancelation of smaller tasks which can be
inserted to existing workflow instances upon execution (Adams, 2010). Also
ADEPT2, leveraging Well-Structured Marking-Nets, can support process
modifications (e.g. add, delete, change the sequence of tasks) during runtime both at
the model and the instance levels through compliance to structural and behavioural
criteria (Reichert et al., 2009).
Others focus more on specific techniques for solving particular issues associated
with dynamically changing processes in IS. For instance, using partner synthesis to
create configuration guideline capturing all feasible configurations which in turn
improves the correctness and efficiency of process model configuration (Van der
Aalst, Lohmann, & La Rosa, 2012). More on configuration correctness includes
event-based configuration guidance to ensure correct process variants and domain

64
compliance (Boubaker, Mammar, Graiet, & Gaaloul, 2016); automated extraction of
configuration guidance from reusable business process repository to assist users
creating and modifying effective business-driven IS (Assy & Gaaloul, 2015);
configuration optimisation through a binary linear program under a set of
constraints (Rekik, Boukadi, Assy, Gaaloul, & Ben-Abdallah, 2016). Furthermore,
studies have proposed systematic methods for comparing and evaluating PAIS
solutions, in terms of change patterns and change support features (B. Weber,
Reichert, & Rinderle-Ma, 2008), and workflow time patterns (Lanz, Weber, &
Reichert, 2010).
In a nutshell, the model-driven configurability of PAIS enables users to change the
system to accommodate changing business processes with little intervention from IS
developers (i.e. from the Dev Agility Cycle). These changes can be done fast,
especially when compared with the more traditional software line-by-line coding.
Agile-System Configuration is about empowering users with highly adaptable
configuration allowing the IS to be reconfigured to support changing business
processes, during runtime, with ease and speed. This can reduce the Friction on the
Ops Agility Cycle where users not only know what changes are occurring in the
business environment, but more importantly, have the capability to directly modify
the IS behaviours to support these changes effectively and efficiently.
One historical critique is that process models often take a prescriptive role. That is,
there is an engine that determines what information processing activities are
required/allowed according to the prescribed model. However, research
developments such as Coordination Theories (Cabitza & Simone, 2013), Dynamic
Workflow Management (Adams, 2010), and all the aforementioned studies on
configurable PAIS have gone beyond prescriptive modelling to help IS users
overcome model prescriptions, especially allow effective changes in process/model
configuration when unexpected events occur during runtime. Furthermore,
alternative approaches have also been proposed to take a paradigm shift by “moving

65
away from model-based control flow” to context-based “dynamic activities defined by
participants as processes unfold” (Antunes, Baloian, Zurita, & Pino, 2018), as well as
to make process modelling and execution more of a bottom-up social-collaboration
among users (e.g. AGILIPO) (Silva et al., 2009)
2.2.4.3 The IS Agility Pyramid
Figure 5: IS Agility Pyramid
Figure 5 above presents the “IS Agility Pyramid” integrating Dev Agility and Ops
Agility into a unified model. Agile System-Development, Agile-System Architecture,
Agile System-Operation, and Agile-System Configuration are the four key areas of IS
Agility research we synthesised and labelled from our cross-discipline literature
review. These categories can be seen as “key pillars” supporting the overall IS Agility
with each playing a unique role in relation to the Dev Agility Cycle and Ops Agility
Cycle. Based on our conceptualisation of IS Agility, each pillar of research facilitates
either the increase of “Torque”, or the decrease of “Friction” on the Agility Cycle, be it
Dev or Ops.

66
Our observation is that the intended impact of Dev Agility studies is mainly in the
development mode of the IS life cycle and often at individual IS level, i.e. the
development of a single IS, one at a time. The key stakeholders of concern are mostly
IS developers, engineers, etc. The research focusing on the Ops Agility, on the other
hand, is mostly focusing on the runtime mode of the IS life cycle and can cover a
federation of IS and their collaborative behaviours.
Table 8: The Current Status of Key Research Areas of IS Agility
“Key
Pillars”
To Support Benefits
to Agility
Cycle
Research Style Key
Stakeholders
& Phase of IS
Life Cycle
Dev
Agility
Agile
System-
Development
Changes in
business/user
requirements &
functionalities
etc.
Increasing
Torque
Light-weight, industry-
agnostic approach, tends
to investigate abstract
principles, methods,
practice adopted in
smaller projects,
individual IS, and
development teams
IS Developers,
Engineers etc.
In
Development
Mode Agile-System
Architecture
Changes in
technological
structure &
capacity of IS
etc.,
Reducing
Friction
Ops
Agility
Agile
System-
Operation
Changes in
business
operations &
environments
etc.
Increasing
Torque
Heavy-weight, industry-
specific approach, tends to
scrutinize effectiveness
and efficiency of large-
scale rule/flow engines via
simulation and real-life
implementation across a
federation of IS.
IS Operators,
Users, etc.
In Runtime
Mode
Agile-System
Configuration
Changes in
business-
supporting
features of IS
etc.
Reducing
Friction
Table 8 above summarises some main attributes of the four “key pillars” we
discovered from the literature. Each of the four has a different purpose in terms of
the nature of changes being facilitated, as well as the torque-increasing vs. friction-
reducing benefits from an Agility Cycle viewpoint. The two “key pillars” of research
under Dev Agility have seen a plethora of research from academic disciplines such
67
as Computer Science and Software Engineering, which practically matches the
strong interest from the IT industry. On the contrary, the two Ops Agility “key pillars”
are less developed in an academic sense but tend to be driven from practitioners
and large commercial entities (e.g. TIBCO’s StreamBase and iProcess).
The reason might be that Dev Agility seems to be easier to study as it concerns
mostly abstract principles, methods, and practice (e.g. Scrum, SOA) which can be
introduced, observed, and measured in smaller sized IS development projects, with
light-weight individual systems, and without strong attachment to any specific
industry (Babb et al., 2014). Ops Agility studies, on the other hand, tend to require a
lot more resources as they often involve design, simulation, and real-life
implementation of heavy-weight rule/flow engines to test their efficiency and
effectiveness in large industries such as finance (Saad & Arakaki, 2014) and banking
(Nguyen et al., 2005). This is reasonable, as for businesses operating in these
industries, unexpected events and exceptions can result in catastrophic losses thus
they tend to have large R&D funds for improving IS Ops Agility.
However, we believe Ops Agility can also be studied following the light-weight
approach used in Dev Agility studies, that it, focusing more on the generally abstract
principles, methods, and practice that are applicable in wider industries for
achieving Ops Agility. With a raised level of awareness, IS researchers can make
more noticeable contribution to research in IS Ops Agility, due to our close
relationship to business operations and systems, as well as organisation and
management theories.
The IS Agility Pyramid not only illustrates the key research areas identified in the
literature, but can also serve as the first articulation of the principle capabilities to
achieve IS Agility in practice. It illustrates the main constituents of IS Agility and
how they work together. This technically answers the first two research questions
(RQ1 and RQ2) proposed in Chapter 1. Nevertheless, the IS Agility Pyramid is not
sufficient to answer the third research question which concerns with method

68
development for investigating and solving IS Agility problems. To formulate a
problem-solving method, we will need to understand why IS Agility is needed in the
first place. The next section discusses the Need vs. Supply of IS Agility.
2.3 IS Agility Need vs. Supply - The Nomological Network
Having dug deep into the essence of IS Agility and established desirable conceptual
clarity, we extended our lens to see the fuller picture of agility. To effectively design
agility in an IS context, one should not only be able to articulate what makes agility
achievable but need to understand why and when agility is needed.
Early studies in agile manufacturing are no doubt the pioneers in searching the need
for agility. Sharifi and Zhang (2001), in their well cited paper, proposed a conceptual
model of agility in manufacturing within which two concepts “Agility Drivers” and
“Agility Providers” were coined and used as the two key forces that make a firm agile.
The concept of “Agility Drivers” describes factors that necessitate a business to be
agile to maintain its competitive advantage, while the concept of “Agility Providers”
describes means by which the capabilities of being agile could be obtained (H. Sharifi
& Zhang, 2001). Sharifi and Zhang (2000, 2001) further validated these two concepts
in industrial questionnaire surveys from some 1,000 companies followed by
subsequence case studies based on two manufacturing companies.
Following the same route, as shown in Figure 6, we define “IS Agility Drivers” as the
environmental and organisational factors that necessitate the needs for IS Agility. Such
drivers in turn determine the “Need Level” for IS Agility. Meanwhile, “IS Agility
Providers” can be defined as the means to enable the sensing, diagnosing, selecting,
and executing capabilities of IS. Such providers will in turn decide the “Capability
level” for IS Agility. Resultantly, the Need Level and the Capability Level will
determine the actual status of IS Agility (IS Agility in use).

69
With strong drivers and high need level, but weak providers meaning low capability
level, an IS needs to, but is unable to be agile. In such situation, an organisation is
likely to fail in leveraging this IS to reap opportunities and counter threats in the
business missions it was designed to support. For example, in the HP survey report
mentioned earlier, an executive complained that the lack of IS Agility had made his
company miss business opportunities. His company was unable to run a special
pricing promotion to exploit a rival’s mistake. The bottleneck wasn’t the marketing
department or the sales team, instead, it was the CRM system which was too rigid to
configure and allowed pricing updates to be made only once a quarter (HP, 2011).
On the contrary, with weak drivers and low need level, but strong providers and high
capability level - an IS can but doesn’t need to be agile. This scenario may indicate a
typical overprovisioning in IT. This could mean a serious waste of resource as
building unnecessary agility capabilities in IS often involves extra cost and time on
top of regular IT provision. For example, building a system with a modular design
may allow easier and faster future changes of its technological structure, however
this requires considerable extra effort (i.e. in structural analysis, communication and
coordination of the sub-components) than merely building it in a monolithic fashion.
Figure 6: The Network of IS Agility
IS Agility Drivers
Need Level Capability Level
Actual IS
Agility
IS Agility Providers
70
2.3.1 IS Agility Drivers
2.3.1.1 Change and Uncertainty
Change and uncertainty have been widely identified as the drivers of agility in
various disciplines such as sports training (Sheppard & Young, 2006), HR (Shafer et
al., 2001), system engineering (Dove & LaBarge, 2014) and IS management (Gebauer
& Schober, 2006). In business context, these two drivers at times are joined together
by researchers to form new notions such as “Environment/Market Dynamism”
(Coronado, Lyons, & Kehoe, 2004; Sengupta & Masini, 2008). The increasing
frequency of change and degree of uncertainty in today’s business competition has
introduced unprecedented market dynamism into many industries (e.g. finance,
manufacturing, retailing, IT, etc.). To retain a leadership position in a dynamic
marketplace, an organisation needs to be able to morph itself at will without
significant cost and time, and do so faster than their rivals (Pankaj et al., 2009).
In general, organisations operating in a business environment characterised by
uncertainties and changes have a much higher “need level” compared to those
operating in a relatively stable markets with little turbulence involved (Coronado et
al., 2004; Sengupta & Masini, 2008; H. Sharifi & Zhang, 2001. ). For example, firms
producing cement will require much less agility , in contrast to firms producing
computers (Coronado et al., 2004).
Uncertainty can have two dimensions, Temporal and Spatial (Sheppard & Young,
2006) (previously listed in Table 2). “Temporal” uncertainty indicates the timing of
change cannot be known upfront while “Spatial” uncertainty refers to the situation
that “where” the change will occur is unknown. As discussed in previous sections,
nowadays with the ever-increasing level of globalization and e-Commerce
implementation, organisations often find themselves faced with both Temporal and
Spatial uncertainties without knowing when and where changes would happen in
their environments. The two-dimensional concept of uncertainty will be revisited
and discussed with examples in the following sections.
71
2.3.1.2 Information Intensity and Time Criticality
Uncertainty and change alone, may necessitate the need for business agility, however,
do not guarantee the need for IS Agility. The degree of dependency on IS for
organisations to perform mission-critical operations may vary largely across
industries, e.g. firms manufacturing commodities do not depend on IS as much as
firms producing automobiles do. Additional need drivers are required to justify the
necessity of IS Agility.
Besides the uncertainty and change which are considered as two generic need
drivers for agility, Information Intensity (Coronado et al., 2004) and Time Criticality
(Gebauer & Schober, 2006) are identified as two additional specific drivers of IS
Agility need. Reportedly, the level of Information Intensity and Time Criticality
involved in a business operation largely determines the dependency of this business
on IS (Coronado et al., 2004; Gebauer & Schober, 2006; Pankaj, 2005).
Time Criticality is more conspicuous in competitive environments than in the
opposite (Gebauer & Schober, 2006; Goldman et al., 1995). Although certain
industries include a higher percentage of time-critical operations (e.g. operations of
stock brokers are likely much more time-critical than those of shoe makers),
business competition has been seen as another major catalyst for Time Criticality
(Bhatt et al., 2010). Organisations operating in highly competitive marketplaces often
cannot afford to be slow or late in making necessary changes in course of action, and
have to move fast owing to pressures from rivals, customers, and suppliers (H.
Sharifi & Zhang, 2001). Therefore support from IS as communication infrastructure
and automation platform becomes compulsory in order for the firm to be able to
sense changes, make effective responses and timely implementations (Overby et al.,
2006).
Information Intensity is greater in some industries than in others (Coronado et al.,
2004). The amount of daily information processed by a bank is likely to be
exponentially more than that processed by a breakfast cereal maker. In industries

72
with high Information Intensity, the volume of data that organisations must process
can easily outstrip traditional human capacity, hence using computer-based IS has
become the norm for achieving effective and efficient information processing and
decision making (Pankaj et al., 2009). In short, with high Information Intensity, IS can
enable organisations to make sense out of what would otherwise overwhelm them
(Overby et al., 2006).
In environments characterised by high Information Intensity and high Time
Criticality, managing a business wherein timely sense making and action taking are
impossible without IS. This phenomenon is referred as “managing by wire” (Haeckel
& Nolan, 1996). IS have been wired into organisations and become the backbone of
many business operations, hence the ability of IS to sense and respond to change, is
becoming crucial, as it can define the pace at which businesses can sense and
respond to change (Pankaj et al., 2009). Rigid IS are often found hampering the
business’s ability to make changes (Oosterhout, Waarts, & Hillegersberg, 2006; SEO
& Paz, 2008). The dependency of businesses on IS has further been tightened by the
growth of E-Commerce implementations. Consequently many have argued that to
certain degree, “managing IS” is essentially “managing business”, and being agile in
business first requires being agile in IS (Bhatt et al., 2010; Lyytinen & Rose, 2006;
Oosterhout et al., 2006; Weill, Subramani, & Broadbent, 2002).
2.3.1.3 Drivers of IS Agility and the Decision Tree
Table 9 summarises the four environmental and organisational factors driving the
need for IS Agility, namely Change Frequency, Uncertainty, Information Intensity, and
Time Criticality. Indeed, IS Agility is a competitive advantage but not all organisations
need to invest in it. For IS Agility to be relevant, first the very organisation should
have the need to be agile (i.e. operating in a fast-changing environment with high
level of uncertainty), second it should have the need to be agile in IS (i.e. entailed
high level of Time Criticality and Information Intensity).

73
Table 9: Drivers of IS Agility
Change Uncertainty Information Intensity
Time Criticality
(H. Sharifi & Zhang, 2001)
Change Frequency
Uncertainty
(Kieran Conboy & Fitzgerald, 2004)
Change Frequency
(Gebauer & Schober, 2006)
Business Process Variability
Business Process Uncertainty
Business Process Time Criticality (Pankaj, 2005) Change
Frequency Uncertainty Information
Intensity
(Coronado et al., 2004)
Business Environment Dynamism
Information Intensity
(Sengupta & Masini, 2008)
Market Dynamism
Based on the four drivers identified from the literature, we propose a tool for
organizations to assess their needs for IS Agility. Figure 7 below depicts a decision
tree to evaluate if IS Agility is truly needed. With low level of Change Frequency in a
business environment, there is no need for agility at all. With high level of Change
Frequency, but low level of Uncertainty, responses to changes can be mostly defined
in advance (such as emergency plans for fire evacuation in a warehouse). When both
Change Frequency and Uncertainty are at high level, but Time Criticality is low,
having the flexibility of being able to move parts/projects/operations around to alter
the original course of action would be sufficient, even the process is not executed at a
rapid pace.

74
Figure 7: IS Agility Need Drivers - a decision tree
Finally, with high level of Change Frequency, Uncertainty, and Time Criticality, if
Information Intensity is low, a business should focus on improving organisational
agility4 instead of investing heavily in IS Agility. After all, in a business with low
Information Intensity, the IS implemented are unlikely to be a mission-critical game
changer. Resultantly, we argue that only when all the four IS Agility drivers are
presented at high level, a business should zero in on IS Agility to stay competitive and
lead the field.
4 Organisational agility is often achieved through strengthening leadership, strategy, culture and organisation structure etc. which has been well studied in management literature but is beyond the scope of this paper.
75
2.3.2 IS Agility Providers
The four “key pillars” previously presented in the IS Agility Pyramid, are considered
high-level IS Agility Providers. This level of detail is deemed sufficient for the
purpose of this chapter – i.e. laying out the theoretical foundation of the following
design science study. Although a finer level of classification for IS Agility Providers
may exist, it is seen as beyond the scope of this chapter. Moreover, investigation into
the IS Agility Drivers has brought about new insights for understanding the
usefulness of IS Agility Providers, especially on the two dimensions of uncertainty
introduced in the previous section, namely, “Temporal” uncertainty and “Spatial”
uncertainty which make changes unpredictable.
In a turbulent marketplace, business requirements and system functionalities are
changing more frequently. It is next to impossible to estimate when and where these
changes will occur. The Dev Agility Cycle is dedicated for IS developers to handle
such changes in the system environment. Extending from our understanding in
Section 2.2.4.3, Agile System-Development focuses on increasing the Torque in Dev
Agility Cycle, partly through establishing disciplined practice to handle Temporal
Uncertainty. In reality, with the pervasive use of Internet based IS, system users may
send through change requests of any nature and at any time. However Agile System-
Development methods (i.e. Scrum, XP) are devised to establish Temporal
Confidence by strictly defining fixed tempo for the development team to sense and
respond with little ambiguity on the time dimension. For example, 15 minutes Daily
Scrums (Or Stand-up meetings) to plan for the next 24 hours, Two-week Sprints, Bi-
weekly Estimation meeting, Product Backlogs, and Sprint Backlogs are all artefacts
designed to enforce regular and frequent development iterations with stable
intervals and manageable workload. This way the development team will have a pre-
defined period of time for diagnosing change requests and deciding on responses
based on carefully selected, limited set of new requirements and bugs. Such an
artificially defined temporal certainty can improve the development team’s

76
productivity and maximize throughput, as well as protect the team from being
overwhelmed by the continuous change requests raised by client users.
“Agile-System Architecture” provides means to reduce Friction in the Dev Agility
Cycle mostly through handling Spatial Uncertainty. Changes in business
requirements and system functionalities are often not predictable, that is, the IS
developers cannot know upfront which part of the IS will need to be changed and to
what degree. Designing the technological structure of IS in a modular, plug-and-play
manner helps establish Spatial Confidence. By intentionally dividing a complex
system into loosely-coupled subsystems which exhibit limited interdependence
(Tiwana & Konsynski, 2010), developers can confidently add, remove, or modify
individual modules and units knowing such changes will not affect other parts of the
system. Take SOA as an example, it advocates encapsulating functionalities into
services which can be invoked by others when needed. These services are reusable
modules which can facilitate the speed in software system design and development
(Setia, Sambamurthy, & Closs, 2008). With appropriate granularity of each modular
sub-unit, one can assure good spatial confidence as constructing an IS will become
almost like building a Lego house.
The Ops Agility Cycle is for IS users to leverage IS to deal with changes in business
environments which again often are uncertain in both temporal and spatial
dimensions. “Agile System-Operation” is essentially a way of operating IS to detect
changes as soon as they occur which in turn help improve Temporal Confidence.
Such type of system operation can bring more Torque to the Ops Agility Cycle by
assisting IS users in sensing and diagnosing, even automatically responding to
business changes right after they occur. Instead of the traditional retrospective
analysis of business events and transactional data, smart IS are built upon real-time
data processing engines (often rule-based, such as TIBCO’s StreamBase) that can be
tuned by IS users to detect abnormities, unexpected incidents, potential risks, etc. in
the business environment. Such a “real-time” focus makes the IS intelligent enough

77
to sense and respond to frauds in transactions, to suggest optimised pricing, to
promote cross selling and proactive inventory. In industries where products are fully
digitized, companies are naturally becoming data-driven, such system operation
style then should be considered a core competitive advantage to their businesses.
For example, both Spotify and Pandora are relying on Apache Spark to generate
dynamic online music recommendations to retain existing customers as well as
attracting new ones. In short, “Agile System-Operation” can help IS users establish
Temporal Confidence by offering a mentality of “we don’t know when changes are
going to happen, but we do know once they occur we will be notified immediately,
and responses can then be made in real time.”
“Agile-System Configuration” is concerned with reducing the “Friction” in the Ops
Agility Cycle. When changes in business environments occur, users should be
allowed to alter the business-supporting features of the IS (e.g. business process,
workflow, company code, security rules) using abstract models during runtime,
instead of having to request IS developers to make code-level changes in
development mode. Spatial Confidence can be established for IS users knowing
they have the control to add and modify the behaviours of the business components
in their IS using visualised modelling approaches. In reality, Process Aware
Information Systems represent a cluster of tools specialised in identifying,
controlling, and executing business activities on the basis of process models (Van
der Aalst, 2009). Dynamic workflow management and case handling systems are
typical examples of PAIS. These systems can be configured and altered by IS users
without a single line of code and often no intervention needed from the IS
department. ProWorkflow and Zoho Creator are two examples of cloud-based
platforms that business users can design and implement operational processes
through drag-and-drop modelling and tap their solutions to existing enterprise IS
through rapid wizard-driven data integration.

78
2.3.3 The IS Agility Nomological Network (ISANN)
Figure 8: The Nomological Network of IS Agility (ISANN)
Gradually, with time, we formulated the IS Agility Nomological Network (hereafter
ISANN) by integrating the IS Agility Drivers and Providers identified during our
long-lasting iterative literature review and synthesis. As shown in Figure 8, the
nomoligical network illustrate the mechanism of IS Agility as an ability as well as the
current landscape of IS Agility as a research field.
We consider ISANN the most complete conceptualisation of IS Agility so far. It
provides us with a guiding map for confidently further our inquiries and analysis
into IS Agility related topics, in both the academia and the industry. As the first one
of its own kind, this map provides the conceptual clarity, establishes the structural
integrity, and acknowledges the contextual dependency of IS Agility. Such a map
may not be extremely exhaustive, but it captures the critical crux of IS Agility. ISANN

79
is informative enough to remove ambiguities as well as help both researchers and
practitioners quickly grasp the nature and essence of IS Agility from a vantage point.
There are at least two types of balance need to be considered according to this
ISANN. First is the balance between “Need Level” and “Capability Level” which has
been discussed in detail in the previous sections. The second one, is the balance
between “Dev Agility” and “Ops Agility” which will be discussed in the following
sections using business scenarios.
2.4 Chapter Summary
In this chapter we have reviewed existing Agility literature across various
disciplines and provided conceptualisation of general Agility as well as IS Agility.
First, this chapter has established a clear conceptual boundary of Agility by
clarifying the similarities and differences between Agility and Flexibly. Next it has
reviewed the historical development of the definitions of Agility to solidify the core
notion of “Sense and Respond”. The major outcome is the creation of ISANN. Such a
conceptual framework incorporates salient concepts and relationships such as the
IS Agility Drivers and Providers, Dev Agility vs. Ops Agility, Torque and Friction,
Synchronicity, etc. The following chapters will focus on business environments
having high IS Agility Need Level. Chapter 3 will attempt to operationalise ISANN to
demonstrate and evaluation its efficacy in describing and decomposing IS Agility
phenomena. This is done through a series of illustrative business scenarios
(specifically in the Cloud Computing context) to explain the demand, supply, and
creation of IS Agility.
80
Chapter 3 : Operationalising ISANN
3.1 Introduction
The purpose of this chapter is to demonstrate the application of ISANN in
illustrative scenarios to generate insights into how and why IS Agility can be
achieved, and to evaluate the efficacy of ISANN as a more complete conceptual
framework for explaining the IS Agility phenomenon. This is done through real-life
scenarios collected from different levels of Cloud Computing services.
Researchers have suggested that “the agility of IS is often studied through IT
solutions that compose IS” (Izza, Imache, Vincent, & Lounis, 2008, p.5). In fact,
without a specific IT solution in mind, conceptually incorporating all the IS Agility
elements introduced in the previous chapter can be convoluted and lack focus.
Cloud computing5, as a common IT solution to today’s businesses, has been
promoted as an agility booster by vendors and service providers. A study of IS
Agility simply cannot ignore the existence of Cloud Computing as it offers a great
context for analysing and observing IS Agility delivered through technological
innovations. This chapter provides a structured analysis on the IS Agility effects of
the Cloud Computing at different service levels. Such an exercise helped us examine
and demonstrate the efficacy of ISANN with regard to our goal of dissecting IS
Agility.
3.2 An Operational View of IS Agility: Illustrative Scenarios
Articulating Dev Agility and Ops Agility is a difficult endeavour. Part of the difficulty
comes from a lack of clarity regarding the underlying agility mechanism. This has
5 While there are several variants of deployment models for Cloud Computing (private, hybrid, etc.), this study focuses on the most common and influential type of these variants, public cloud computing.

81
been a historical issue, but we have made a successful attempt to tackle it in Chapter
2. As a theoretical basis, Chapter 2 has established the conceptual clarity and
structural integrity of IS Agility in the form of ISANN. This chapter proposes an
operational view articulating IS Agility from an organisational perspective. This
view provides a clear structure for examining the roles of Dev Agility and Ops Agility
and their interplay. In particular, it shows Dev Agility Cycle and Ops Agility Cycle are
parallel to yet dependent on each other.
As shown in Figure 9 below, we consider Dev Agility Cycle and Ops Agility Cycle as
two parallel loops: with the inner SDSE loop representing Dev Agility while the
outer SDSE loop concerning Ops Agility. These two SDSE loops (represented by solid
lines in the diagram) can purely cycle on their own tracks respectively, namely, Dev
S-R and Ops S-R (where “S-R” stands for “Sense and Respond”) represented by solid
single arrow lines. They can also interact or even intertwine with each other at any
point when necessary. Such an interaction can be initiated from the inner loop –
hereafter called “Dev-initiated interaction”, or from the outer loop – hereafter
called “Ops-initiated interaction”. In Figure 9 the Dev-initiated interactions are
illustrated using red dashed lines while Ops-initiated interactions are represented
by dark-blue dashed lines. There are also double arrow dashed-lines allowing free
exchange of data, information, knowledge, and wisdom between the two loops.
Moreover, the Torque and Friction arrows are also presented in Figure 9.

82
Figure 9: A Dynamic View of IS Agility
Change signals should be sensed and responded by business functions. Signals only
related to potential changes in the technological components of the IS will be
diagnosed and responded mainly by the Dev Agility Cycle which is often the
responsibility of the internal IT function and/or an external IS provider (e.g. a SaaS
or IaaS vendor). When cycling solely on the “Dev S-R” track, the inner loop works as
a fully self-contained organ only sensing, diagnosing, and responding to necessitated
technological component changes (e.g. this could be as fundamental as to sense the
occurrence of deadlocks in an online flight booking system and respond with a

83
hotfix). For organisations seeing themselves primarily operating on the Dev S-R
track, the overall level of IS Agility depends predominately on the effectiveness and
efficiency of the Dev Agility Cycle. Therefore, Dev Agility is critical and should be the
focus of investment (e.g. strong expertise in system architecture, and productivity-
boosting automation tools for IS developers).
On the other hand, signals related to changes in the business components of the IS
will be responded most often in the Ops Agility cycle and may be diagnosed
collectively by one or multiple non-IT business functions (e.g. sales, marketing, and
service quality management). When cycling solely on the “Ops S-R” track, the outer
loop works as a self-sufficient unit sensing and responding to changes in the
business environment, fully capable of making changes in business-supporting
features of the IS (e.g. to sense inefficiency in the established inventory ordering
processes and respond with optimised workflows and business rules to reduce
customer complaints). For organisations operating mainly on the Ops S-R track, the
level of overall IS Agility is mostly dependent on the effectiveness and efficiency of
the Ops Agility Cycle, thus Ops Agility is essential and should be the focus of
investment (e.g. intelligent tools to detect exceptions in business operations, smart
workflows to support changing business processes).
Exclusively operating on the Dev S-R represents one extreme of a spectrum while
solely cycling on the Ops S-R sits at the other end. The Dev Agility Cycle and Ops
Agility Cycle can also be intertwined with and depending on each other, which
makes the illustration of their relationships more complex. Organisations may see
signals, diagnoses, decisions, and actions being bounced across these two cycles
from time to time, following various tracks (e.g. as represented by the double arrow
dashed lines in Figure 9). Such interactions can be initiated either by the Dev Agility
Cycle or the Ops Agility Cycle, depending on the nature of the business (e.g. IT-
centric vs. Non IT-centric). For the purpose of clarity, the next sections will first give

84
clean examples of a pure “Dev S-R” and a pure “Ops S-R”, and then elaborate on the
intertwining relationships between the two cycles in more detail.
3.2.1 Dev S-R: Sensing and Responding Purely at Dev Level
As shown in Figure 9, operating on the “Dev S-R” track involves either the IS
developers and/or the IS being signal sensors that detect changes needed. On this
track, signals are proactively sensed to indicate and justify necessary changes in the
technological components (Hobbs & Scheepers, 2010). The subsequent actions
including “diagnosing signals”, “selecting and executing responses”, are mainly
handled within the IS development function. Depending on the dimensions of
uncertainty involved (i.e. Temporal, Spatial, or both), the capabilities of the
technologies, value vs. cost, and human performance consequences 6(Parasuraman,
Sheridan, & Wickens, 2000), cycling on the Dev S-R track may or may not require
intensive human involvement meaning various levels of automation can be designed
and implemented.
3.2.1.1 Dev S-R with High Level of Automation
With high Temporal Uncertainty and low Spatial Uncertainty, the nature of a change
can be known to the IS developers but the timing for that change is unknown. In this
situation, the IS can be programmed to follow known processes that will drive to
expected outcomes. A response can be predefined and even made fully automatic
by IS developers to maximise the “Torque” and drive the Dev Agility Cycle forward
at high speed. The IS itself can be set up to demonstrate a high level of autonomy
with sensing, diagnosing signals, selecting and executing responses, which may
6 Parasuraman et. al. (2000) have provided a more detailed set of criteria for deciding the level of automation that can be achieved. However, we are not going to restate the ten levels of automation and the full list of criteria in this thesis which are beyond the scope of this thesis.
85
involve changing its own technological behaviours automatically via adjustments on
parameters, calculations and so on.
To take a simple example, consider Firm A, a China based SaaS company, providing
its own B2C (Business to Consumer) e-Commerce web store solution to SMEs. Small
business owners can sign up and pay a small monthly fee to open an online store on
this platform in a self-service manner. However, a new trend is observed that an
increasing number of business owners start to request dedicated e-Commerce
solutions and are willing to pay for a premium service in order to build their own
brands and customer bases. Such requests can come in anytime (convenient or not)
and will require responses directly from the IS department of Firm A. Traditionally,
deploying a dedicated e-Commerce solution would require weeks of laborious
manual work coordinated by multiple IS technicians (e.g. implementing a
standalone Linux virtual server with PHP and Apache installed, deploying a single-
tenant MySQL database and the online-store application, setting up the IP and DNS
to make the store accessible to the public, integrating with payment channels,
installing secure FTP).
Therefore, whether or not responding to these requests is mostly depending on the
available capacity of Firm A’s IS team. The lead time between sensing a request for a
new standalone e-Commerce implement and responding with a functional solution
to the customer, i.e. ∆S-R > two weeks, was unacceptable. The Dev Agility Cycle in
such a circumstance was clearly out of Synchronicity by the Friction entailed in the
manual implementation. From time to time, Firm A had to delay such types of
implementation due to excessive demand on their already overloaded IS team. The
manual implementation had clearly become a bottleneck. As a result, some larger
business owners have turned to Firm A’s competitors who either have more
resources to handle manual implementations or apply different technologies to
provide faster deployment of dedicated e-Commerce solutions.

86
Seeing the loss of revenue from larger business owners, Firm A’s IS department
decided to speed up the implementation process for dedicated e-Commerce
solutions. The IS development team was commissioned to automate those manual
deployment and configuration steps as much as possible. Following the Scrum
method, the Product Owner prioritised this implementation automation task in the
product backlog (illustrative of Agile System-development), the IS development
team then evaluated available technology options and decided to adopt Red Hat
Ansible as a platform to construct the automation. They selected Ansible because it
already contains various commonly needed modules for virtual server provisioning,
configuration management, application deployment, intra-service orchestration and
so on (illustrative of Agile System-Architecture). Developers are allowed to
construct new and customised modules as well. All modules can be invoked
sequentially as tasks executed through Ansible Playbook.
Within one Sprint, the alpha version of the automated standalone e-Commerce
implementation was developed. In the following month, a fully tested stable version
was launched and started to accept purchase orders online. Larger business owners
now will only need to send their orders in, chose a business category and store
template, decide the initial set of e-Commerce modules, make the payment, then
their dedicated online store will be launched automatically and made ready for
product data upload and layout configuration in a few hours – a much shorter ∆S-R
compared to the traditional manual method.
In this scenario, the implementation of a standalone e-Commerce solution has
changed from slow (stretched into weeks), laborious, and manual processes to a
fully automated machine-driven task (completed in hours). The IS development
team of Firm A was leveraging both Agile System-Development and Agile-System
Architecture to increase the Torque and reduce the Friction in the Dev Agility Cycle.
The original high Friction imposed by the manual implementation has been reduced
drastically via automation which closes the gap between the sensing and responding

87
of the IS development team with regard to such user requests. In fact, most of the
“sense and respond” responsibilities have shifted from the IS team to the IS itself.
The changing user requirements can now be handled automatically on the Dev S-R
track with high Synchronicity, responses are made right after changes being sensed,
the ∆S-R has been shortened from weeks to just a few hours.
3.2.1.2 Dev S-R with Moderate level of Automation
In many business computing scenarios, the IS development team can control and
minimise temporal uncertainty by following a known process with predefined
timeframes but cannot do so with spatial uncertainty. As such, cycling purely on the
“Dev S-R” track will still require considerable human effort. With spatial uncertainty
being present, the nature of changes and the expected outcomes cannot be known in
advance thus valid and reliable responses can hardly be highly automated. Such a
spatial uncertainty has been exacerbated by the increasingly popular Cloud
Computing business model having IS deployed and delivered on the Internet (i.e.
SaaS) and shared by a huge number of different organisations. The average number
of users of a traditional on-premises IS can range from hundreds to thousands, if not
tens of thousands, whereas with a cloud-based multi-tenant IS, such a number can
easily go up to millions. For an IS team developing and supporting such a SaaS type
of IS, the diversity and the sheer volume of system changes requested by the IS
users can be drastically higher than that with an on-premises IS.
For an online application with a small set of functionalities – often free with only
tens, if not hundreds, of functional points, e.g. an Internet file sharing service such as
Dropbox - the expansion of user base may not seem to be a major threat from a
functionality perspective as a single focused application with simple features can
legitimately keep user expectations within its original scope. However, with a
complex IS offering a large set of functionalities and supporting critical business
processes (e.g. ERP, CRM, LMS), client organisations need to pay a considerable
subscription fee for using its sophisticated features involving thousands and more
88
functional points, users would expect a lot more can be done in such a system.
Resultantly, the tenfold, even hundredfold expansion of user base boosted by the
SaaS model, to a complex IS, often means much higher rate new requirement
changes bundled with higher diversity and spatial uncertainties.
With Agile System-Development methods (e.g. Scrum), however, an IS development
team can establish a certain degree of “temporal confidence” to make the situation
less overwhelming and even manageable. These methods mandate the need setting
up disciplined mapping between tasks/processes and timing, often introduce a
versatile tool set to facilitate the automation of information flow and task/process
management, to make the sensing and responding processes partially automated.
Such methods establish formal rules and tempo agreeable for both IS development
team and IS user groups. This way, the IS team does not need to sense and respond
in a 24/7 fashion, rather, it can have time for change aggregation, estimation,
prioritisation, delivery, and reflection.
Firm B, for instance, as a New Zealand based SaaS provider, has adopted to manage
the ever-changing user requirements towards its evolving cloud-based IS offering
specialised in operational risk management. Firstly, an online tracking system called
FogBugz (also a cloud-based solution) has been set up for all client users to send
their change requests or bug reports in the form of “cases” via emails. This tracking
system acts as the main sensor enabling the IS development team to keep “sensing”
changes even when they are not at their workplace. Client users can send through
requests any time and of any nature. All the “cases” recorded in Fogbugz will be read,
classified, often rewritten as “user stories”, and then assigned to a “Product Backlog”
by the tier-one support team members on a daily basis, with duplicates removed.
Secondly, according to the Scrum methodology, the team has formally established a
bi-weekly “Sprint” routine which can effectively control the level of temporal
uncertainty (by the time this chapter was written, they had already gone through
over 150 sprints, with some 12,000 cases recorded in the FogBugz). With such a
89
routine, the team will do pre-defined tasks on certain days. On the second Thursday
into a Sprint, the product owner (sometimes with client user representatives) will
meet with the development team in a Sprint Review meeting to demonstrate what
new features have been developed in the present Sprint. On the following Monday,
at the beginning of a new sprint, the development team will have a Sprint Planning
meeting with the top 10 priorities in mind to decide which cases from the Product
Backlog should go into the Sprint Backlog. This is to limit the commitments for the
planned Sprint and maintain a manageable workload. They will also need to discuss
design decisions for the selected cases. On Wednesday the same week, the team will
meet again to do some “Backlog Grooming” by aggregating user stories and
estimating cases left in the Product Backlog to help the product owner make
decisions for the upcoming Sprints. The rest of the time in a Sprint will be left for
coding and testing with each team member being assigned to “just enough” number
of “cases”. Last but not the least, the newly developed features and fixed bugs during
one Sprint will be automatically deployed from the development environment to the
test environment in the following Sprint for quality assurance and testing, and then
to the production environment in the third following Sprint with a Release Note
being circulated among all system administrators at all client organisations.
Furthermore, to avoid being overwhelmed by the ever-expanding Product Backlog
contributed by the increasing number of client users, the team also introduced other
concepts such as “Half Life” and “Technical Debt” into the rules. “Half Life” means
that after 30 days if a user story is not approved to be implemented then it should
be considered half of the value to the original estimation. Such a concept helps the
team with prioritisation of tasks. “Technical Debt” means the compromises have
been made on system design due to time pressure or budget constraint. The
development team often comes up with their own requirements – again in the form
of user stories – to reduce Technical Debt. The product owner needs to take a
balanced approach to handle Technical Debt and new requests from client users.

90
After all, reducing Technical Debt, in the language used in this thesis, is a form of
reducing Friction of the Dev Agility cycle.
Agile System-Development methods such as Scrum focuses on establishing a strict
routine for the IS development teams to follow which intends to remove ambiguity
and minimise Temporal Uncertainty. The team will know, in the face of ever-
changing user requirements, at least, which activities and tasks should be worked
on and when, on a regular basis. Such a disciplined approach, when practised well,
can generate high Torque to speed up the Dev Agility Cycle. Moreover, whenever a
bottleneck is observed, or in the Scrum term, a “roadblock” is hit, team members can
raise it at the daily “stand-up” meetings to seek help from others or reprioritise
tasks in order to keep the Dev Agility Cycle moving forward.
Establishing some forms of Agile System-Development routine helps IS
development teams improve confidence towards the temporal dimension of
uncertainty. By following a regular “sense and respond” frequency with a high level
of Synchronicity, a predefined, fixed value of ∆S-R can be agreed upfront. Such a
regular frequency helps the team to manage expectations from IS users and
maintain high responsiveness without being swamped or paralyzed by irregular,
diverse, yet constantly changing user requirements. With a clearly defined and
agreed ∆S-R, the team will know precisely when to sense, diagnose, select, and
execute on a day-to-day basis. Such regularity removes the burden of project
coordination and helps IS development teams keep the momentum on their SDSE
cycles, often voluntarily and autonomously
In this scenario, the Friction was not explicitly illustrated. However, as discussed
previously, the Friction is decided by the difficulty in making changes on the
technological components provoked by changing business requirements. Such
difficulties can be reduced, as discussed in Chapter 2, by a carefully designed Agile
System-Architecture to improve the changeability of the IS. Modern developer tools
such as code generators (e.g. CodeCharge Studio) can also reduce the effort required

91
for creating and modifying IS functionalities and features. In a SaaS context,
establishing an ecosystem for IS developers to share their work in terms of
customising and extending the IS of interest and creating new modules or add-ons.
For example, Salesforce.com opens its development platform Force.com to
developers to leverage the power of the crowd to help mitigating the pressure
caused by ever coming new requirements from millions of system users.
3.2.1.3 Dev S-R with Low Level of Automation
Although equipped with modern smart tools for designing, developing, testing,
debugging, and deploying, IS development teams can, from time to time, still find
themselves cycling on the Dev S-R track with mostly manual effort. This often
happens on occasions where no Spatial nor Temporal confidence is formally
established in the system environment, particularly with those ad-hoc events where
processes and outcomes cannot be known upfront.
For example, a New Zealand based IT consulting business, Firm C, provides OLAP
(Online Analytical Processing) reporting services to its clients for operational
performance management purposes. Firm C has developed as many as 800
automated online data reports and dashboards (either in tabular or graphical
formats) for over 40 client organisations. Many of these reports are set up to
execute and distribute to client users on predefined dates (such as weekly planning
sessions, monthly board meetings, quarterly operational reviews, etc.). The rest are
designed to be run by client users in real time during other important occasions.
Hence the quality and performance of these reports are critical and closely
monitored. Once the IS team and/or the IS itself detect an undesirable change (e.g.
anomalies) in the quality or performance of these reports it must diagnose and
respond to the change as soon as feasible. Such change can be sensed automatically
by monitoring the execution of these reports and the CPU/Memory usage of the
OLAP servers (Firm C uses a database performance analyser called SolarWinds to
monitor and track server performance), or by manually receiving complaints from
92
the clients. Although the managers at firm C don't like to see them, complaints do
occur especially when client users trying to run their reports on an ad-hoc basis.
One day the support desk received a complaint from a client user experiencing
extremely slow response-times and eventually timeout errors when running an ad-
hoc management report and was worried as the report was required for an
important meeting the next day morning. The source of the slowness could come
from the virtual server being overly occupied at the time the report was running, or
a malfunction of the underlying OLAP system, or the design of this particular report
being flawed, or simply the client’s network condition being poor, or some other
unknown factors.
Such a scenario, with similarities to the previous one of Firm B (as reported in
section 3.2.1.2), also involves both Temporal and Spatial uncertainties. However
Firm B’s scenario focuses on changes (i.e. business/user requirements), even though
unpredictable and irregular, can be regulated and responded to at a regular pace
(e.g. one Sprint every fortnight) which helps the IS development team build
Temporal Confidence. On the other hand, in Firm C’s scenario, changes initiated by
the client user cannot be regulated on the temporal dimension due to strict time
constraints – they need to be responded to immediately.
Although one could perhaps define formal procedures to handle situations like Firm
C’s scenario, automating the processes of diagnosing and responding to issues as
such is next to impossible. Various IS technicians have to be involved and apply their
knowledge and skills to find out the actual reasons for the error and initiate a quick
response to satisfy the IS user. The diagnosing, selecting, and executing capabilities
of IS team hence are critical. Most of the sensing and responding has to be done
manually. First a complaint is manually received by the support desk, then the IS
team has to manually diagnose the root cause of the issue and decide on how to
react. In such a scenario, the capabilities of IS personnel largely decide how the agile
response is made and what the outcome may be.
93
In such a manual process, the complaining IS user is expecting an effective response
immediately, but the actual ∆S-R is decided mostly by the available capabilities of
the IS team that makes the response. A highly skilled and experienced expert,
compared to a novice one, can achieve a higher level of Synchronicity in the SDSE
cycle and represent a significant increase in Torque and shorten the ∆S-R. A novice
IS team member, on the other hand, when operating alone, may hit multiple
bottlenecks or “roadblocks” during the process of diagnosing and responding and
end up bringing in more Friction and increasing the ∆S-R.
For example, experienced IS expert would diagnose the nature of the issue first by
scanning the OLAP server logs, the report execution logs, together with the helpdesk
logs to find out when was the last time the report did not run well, what did the
server usage look like, and were there any similar complaints from other clients. By
collectively considering all these aspects, the expert could determine that the
timeout error was not an issue about the report design nor the server capacity, but a
bug associated with a recent update of the OLAP server which may cause a deadlock
when certain queries were concurrently requested by multiple clients. The issue
could be addressed by a hot-fix, and the complaining client can be reassured that the
report would run properly in the next few hours.
However, without a comprehensive understanding of the technologies and systems
in use, less experienced IS team members could have focused extensively on the
particular slow report at first and spent hours in checking its design for flaws,
without being able to reproduce the error experiences by the complaining client
user. In the end, they might miss the window for fixing the problem in time which in
turn would result in inconvenience for the client’s meeting and damaged reputation
of the company.

94
3.2.1.4 Dev S-R Summary
To sum up, on the “Dev S-R” track, changes on the technological component of IS are
detected and handled within the IS function (either an internal department or an
external provider). Such handling can range from highly automatic by machines in
real time (minimising ∆S-R) to mostly manual by humans with context-based time
constraints (∆S-R can be fixed or negotiable). The higher percentage of manual
handling needed in the process, the more demand for highly skilled and experienced
IS personnel to increase Torque and Synchronicity. In general, firms should aim at
identifying those manual processes and convert them into more automated
processes with higher efficiency and similar, if not higher, effectiveness, compared
to the results of manual work. Although we admit, in reality, depending on the level
of Spatial and Temporal uncertainties, efforts in automation may be found more
expensive than having humans to sense and respond manually, we do believe, a
systematic approach can be designed to help IS practitioners and researchers
articulate the point where automation is most appropriate. 7
3.2.2 Ops S-R: Sensing and Responding Purely at Ops Level
As shown in Figure 9, operating on the “Ops S-R” track involves the IS or the IS users
being the signal sensors for detecting business changes needed. On this track,
signals are proactively detected by the IS users and/or the IS to indicate and justify
necessary changes in the business components of the IS. Hence the subsequent
actions including “diagnosing signals”, “selecting and executing responses”, will be
mainly within the relevant business functions relying the IS to operate.
7 Parasuraman et. al. (2000) proposed a set of criteria for deciding the level of automation can be achieved. We believe the dimensions of uncertainty and several other factors should be included to make the criteria more effective and practical. This will be demonstrated in our new publications.

95
Again, similar to the Dev S-R track, depending on the dimensions of uncertainty
involved (Temporal, Spatial, or both), as well as the capabilities of the IS and
technologies, cycling purely on the Ops S-R track may or may not require intensive
human involvement, thus various levels of automation can be observed.
3.2.2.1 Ops S-R with High Level of Automation
With the advance in system design and technologies, some signals indicating
changes in the business environment can now be captured and responded
autonomously by the IS itself, often when only Temporal Uncertainties are present.
On the Ops S-R track, once Spatial Confidence can be established, the IS can be
trained to follow certain rules and logic to infer and construct responses. The
system itself can then automatically sense and diagnose signals and make responses
to change its own business-supporting behaviours.
The same Firm A from section 3.2.1.1, for example, has implemented an intelligent
recommendation system into its B2C e-Commerce web store platform. Such a
system, can detect a user’s browsing behaviour and analyse his/her preferences
thus can dynamically and autonomously change the contents of the web page
presented to that user with recommended products he/she will be interested in
buying. All these operations are done in real time. Many customers are surprised yet
pleased to see how relevant the recommended products can be, thus go ahead to
add more into their shopping carts. In fact, over 30 percent of Firm A’s online
revenue (e.g. transaction fee) is believed to be generated by the recommendation
system alone.
Such an intelligent recommendation system is built upon Apache Spark and
modelled in a Complex Event Processing fashion (illustrative of Agile System-
Operation). Powered by large amount of transactional data with timestamps and
smartly designed collaborative filtering based on user feedback (e.g. product ratings,
reviews and comments), the recommendation system can discover relationships
linking product to product, customer to product, and customer to customer. Using a
96
consumer-based approach, the system will assume two consumers have a similar
taste if they demonstrate alike preferences, namely, matching patterns can be found
in their purchasing history, consumer surveys, browsing behaviour, etc. Using a
content-based filtering approach, the system can compute similarities between
products by comparing their attributes, consumer ratings, and so on. This way,
when generating recommendations for a customer, the system can use the known
preferences of other similar customers, plus products believed most relevant to
those ones currently being viewed or already in the customer’s shopping carts.
In this scenario, the IS can readily process through the SDSE cycle and change its
business-supporting behaviours automatically and anonymously in real time. Surely
the advancement in computational power and algorithms plays a significant role in
fully automating the Ops S-R track, metaphorically, increasing the Torque and
Synchronicity. However, we must acknowledge that the layered architecture and
modularised presentation design (illustrative of Agile System-Architecture) of Firm
A’s web store platform also contribute to the success, as these allow the
recommendation system to dynamically change the content on web pages without
any difficulties and any support from human operators, in other words, minimising
the Friction and ∆S-R.
Moreover, as mentioned at the beginning of this section, we argue that such a fully
automatic Ops S-R track can be achieved largely because Spatial Confidence can be
established in advance, that is, Firm A knows where to make changes in the business
components/behaviours of the IS and how to make them. Essentially the nature of
responses produced by a recommendation system such as the one developed by
Firm A is just modifying content of web pages and pushing relevant products
information to users in real time. But the system does not know when such a
response is needed and so Temporal Uncertainty is present.
The key challenge here is the requirement of minimised ∆S-R and high level of
Synchronicity, that is, once the IS senses a customer begin to browse certain product

97
information, it will need to make a response by computing and presenting
recommendations instantly. If there is a noticeable delay and the recommended
products cannot be calculated or presented on the web page in a timely manner, the
customer may navigate to other pages or leave the web store without even seeing
the recommendations. Resultantly customer shopping behaviours and purchase
decisions will not be affected at all, due to delayed responses, which defeats the
whole purpose of implementing the recommendation system.
3.2.2.2 Ops S-R with Moderate Level of Automation
Still, many changes in business environments can involve uncontrollable Spatial
uncertainties and will require some form of human intervention. Similar to the Dev
S-R track, certain level of Temporal Confidence can be established by setting up a
regular sensing and responding frequency, namely a constant ∆S-R, for IS users to
process through the SDSE cycle with a moderate level of automation.
Today many enterprise systems (e.g. ERP, CRM, SCM) with built-in KPIs and
benchmarking functions can sense important business changes below or beyond a
certain threshold (Trinh-Phuong, Molla, & Peszynski, 2010). Firm D, for example, a
New Zealand based energy company, has its own CRM and ERP system implemented
for years and has established a routine for data reporting and analysis on a regular
basis (Weekly, Monthly, and Quarterly). Such a routine establishes temporal
confidence and is deemed critical for keeping Firm D’s operational performance on
track, as well as regularly looking for threats and opportunities. Users of such IS in
Firm D (often business analysts and managers) can subscribe to relevant data
analysis reports and have the results delivered to their email boxes automatically. In
other words, users, with the assistance from the IS, are observing business changes
at a regular frequency. Their responses to change are made at regular intervals,
either every week, every month, or every quarter.
One week in the first quarter of the 2015 financial year, based on the integrated data
reports automatically generated from the CRM and ERP systems, users in the sales

98
department sensed that the growth rate of new customers from a recently
developed region in the first quarter has dropped considerably below the target,
compared to the same quarter a year before. This could indicate either an
approaching market saturation, or a change in the intensity of competition in that
region. Firm D then deployed market intelligence capabilities in that region, which
suggested that there was a variety of comparable products and services pushed out
to that region by rivals. Firm D then concluded that this region has become more
competitive and a new strategy had to be designed for the next quarter.
At this point, although Firm D still did not know what the response should be to
such a change (Spatial Uncertainty), it already knew when to decide the response
(Temporal Confidence): at the monthly operational meeting coming up in a week’s
time. At that meeting, Firm D decided on what responses had to be made. The
meeting participants came up with various solutions including changing pricing
strategy, increasing marketing effectiveness, implementing a customer loyalty
program, and so on. All these responses would represent changes in the business-
supporting features of Firm D’s CRM and ERP systems. The firm needed to add an
additional follow up call in the sales workflow, adjust new customer discount rates,
modify unit prices, and alter the incentive-rewarding mechanism specifically for the
targeted region to attract new customers and retain existing ones. From an IS
perspective, all these adjustments were system configuration work thus were
completed by IS users in the sales department within a week without involvement
from the IS department (illustrative of the Agile-System Configuration). Being able
to make these business changes so quickly and effectively through pure system
configuration effort was largely attributed to the fact that the IS involved were
designed and engineered in a highly configurable fashion. IS users were empowered
to confidently change the business components of IS through defining/modifying
process models and parameters without the need to understand the inner workings
of the infrastructure.
99
In this scenario, the Friction on the Ops S-R track was low due to the fact that the IS
involved were leveraging Agile-System Configuration designs and technologies to
allow IS users to add, modify, and delete business processes, rules, and workflows
without intervention from the Dev Agility Cycle. Furthermore, by establishing a
regular sensing and responding routine. a group of IS users can agree on a fixed ∆S-R
to ensure a rhythmic cycling on the Ops S-R track, with a certain level of automation
in the sensing part. Without a regular routine, given today’s level of market
turbulence, IS users can be constantly exposed to signals from the business
environment and easily fall into traps – either become paralysed by the
overwhelming amount of business data, often containing large volume of noise, or
get forced into a counterproductive fire-fighting mode leading to exhaustion and
burnout. Similar to the Dev S-R discussion (i.e. the Scrum practice) in section 3.2.1.2,
setting up a constant ∆S-R can help IS users establish Temporal Confidence which in
turn allows time for deciding priorities and designing effective responses. Having a
regular “sense and respond” frequency can improve the level of Synchronicity as
processing through the SDSE cycle becomes a rhythmic and graceful effort.
3.2.2.3 Ops S-R with Low level of Automation
Although empowered by modern IS for data gathering and processing, IS users can,
at times, find themselves cycling through the Ops S-R track with much manual effort
and low level of automation. This often happens on occasions where neither Spatial
Confidence nor Temporal Confidence is formally established in the business
environment.
Firm E, for example, a New Zealand based health service provider, over years, has
implemented several IS to support staff training (custom built LMS), incidents and
injuries management (WorkAon), workforce management (Kronos), and payroll
processing (PayGlobal). For years, these IS were believed to be sufficient for the
managers and staff members to report and record their health and safety related
matters - such as hazards, risks, incidents, staff competency and training – upon

100
occurrence. Despite Firm E’s high-risk operation, a “management by exception” style
was followed.
However, the environment was changing. Due to undesirably higher work-related
injury and fatality rates in New Zeeland, significant legislation changes have been
made along with a new Health and Safety Reform Bill that came in force on 4th April
2016. Managers and directors (collectively called Officers in The Bill) can now be
held primarily accountable for a breach of health and safety practice, even if the
PCBU (the Persons Conducting a Business or Undertaking, or the persons in control
of a place of work) is not going to be held responsible. This law change “…aims to
ensure that those in governance positions will proactively manage health and safety
and provides for some much-needed accountability.” 8
Moreover, Officers are required to “…exercise a duty of due diligence to ensure the
PCBU complies with its duties….Due diligence requires, among other things, an
understanding of the nature of operations, hazards and risks and ensuring that the
PCBU implements processes for complying with their duties….The Bill significantly
increases the category of offences, with a three-tiered hierarchy being introduced,
along with a range of other offending provisions. The Bill then imposes across all three
tiers a six-fold increase in fines from the Act.” 9For instance, Officers, if deemed
“reckless conduct in respect of a health and safety duty”, can face severe penalties
up to five years in prison and/or a $600,000 fine.
With such a radical change in legislation, Officers at Firm E sensed an urgent need to
respond (∆S-R = ASAP) by gaining high visibility to their health and safety risks and
monitor the effectiveness of risk controls in order for making adjustments. However,
as mentioned in the beginning of this section, data relevant to health and safety
8 https://www.laneneave.co.nz/all-publications/70-employment-law-alert-no-8/
9 ibid.
101
management was captured in several different systems and only patricianly
integrated in monthly and quarterly reports prepared by health and safety advisors.
Preparing these reports was time-consuming and prone to error as it required a
collective effort from administrators (IS power users) of each system to pull data
from the disparate systems into CSV files and send them to an analyst. That analyst
then needed to reconcile and integrate the data into a unified dataset (in reality, a
complex Excel spreadsheet) and to produce a standard set of calculations and charts.
The health and safety advisors at Firm E would then work on this Excel spreadsheet
and spend another week or so to plough through the data and look up for
meaningful information so they can report to the Officers. After all the manual
handling, a few weeks would be gone, thus the Officers at Firm E could never see the
real-time updates how their health and safety management system was performing.
They were always viewing their dated data and historical reflections.
Clearly, the traditional approach for data gathering, analysis and reporting used by
Firm E on its health and safety matters presented a major bottleneck and was
deemed too slow to produce the needed level of due diligence to the Officers
(delayed sensing and diagnosing). It simply created too much Friction on the Ops S-
R track, which made the whole sense and respond cycle out of Synchronicity with
reality. The Officers with a duty of due diligence needed the IS to be agile enough to
provide timely feedback on the firm’s health and safety decisions and actions.
Stressed managers initially planned to build a new safety management IS and
integrate all health and safety related data into it for better data consistency, higher
information visibility and real-time performance analysis. However, later this plan
was dropped due to the estimated time and effort were unaffordable. It would take
minimal eight months to design, develop, and implement the new system. This was
nowhere near to the ∆S-R = ASAP expected by Firm E’s Officers.
Under serious time pressure, Firm E called in external experts for help. Together
they decided to adopt Microsoft Power BI as a replacement for the old data

102
integration and analysis approach. Such a tool has the capacity to discover
relationships across scattered datasets which can considerably improve the speed
and accuracy of data reconciliation. It allows visualised data modelling to cleanse
and transform the integrated data for higher quality. Within a few days, system
administrators and safety analysts have got Power BI installed on their work
computers. One week later, some were sitting in tutorials learning how to use a
model-driven approach to define their datasets and tap into different data sources
including all Firm E’s exiting IS.
Within three weeks, new health and safety management reports and data analysis
results started to come out. Based on the integrated data models built using Power
BI and regular data refresh from source systems, Firm E has now become able to
monitor its critical health and safety risks daily with most of the manual data
processing work being replaced by automation. Next step the Officers want to build
a real-time dashboard to track the effectiveness of designed risk controls. They are
much assured that due diligence can be achieved, and their health and safety risks
are in check.
In this scenario, cycling on the Ops S-R was mostly manual by the IS users. The IS in
question were merely scattered data recording systems with little intelligence built
in. The IS users had to put in tedious work to integrate the data needed for “sensing
and responding” to changes in their operational safety practice. This work involved
both Temporal and Spatial uncertainties. Temporal uncertainty came from the
unpredictable availability of needed personnel to perform the manual data handling
work. Spatial uncertainty came from the unforeseeable errors and discrepancies in
the various versions and copies of CSV files and Excel spreadsheets. There was a
major lag on the Ops S-R track due to Friction caused by the slow process of
detecting and diagnosing signals from disparate data sets. The Ops S-R track in this
context was out of Synchronicity with an unacceptably long ∆S-R.

103
Due to undesirable performance, eventually more automation was introduced onto
the Ops S-R track of Firm E’s health and safety management team. The advance in
intelligent data analysis tools (i.e. Power BI in this scenario) helped the IS users
establish Temporal Confidence by automatically and autonomously performing all
the tasks needed to refresh the data and calculations daily, as well as monitoring the
whole process and keep the users updated on unexpected events (illustrative of
Agile System-Operation and Torque Boost on Ops S-R). The model-driven data
integration and analysis approach embedded in such tools can help establishing
Spatial Confidence by providing a single version of the truth with high level of
accuracy and certainty. Instead of Firm E’s originally error-laden process of having
multiple IS users handling various versions and copies of data files, data from
different sources can be visually organised into one unified semantic model. Along
building this model, an automated workflow can be configured to execute data
extracting, cleansing, transforming, and loading into the model. When data
sources/sets change, the workflow can be modified quickly and easily by adding,
altering, or removing detailed data manipulation steps to accommodate the changes
(Illustrative of Agile System-Configuration and Friction Reduction on Ops S-R).
3.2.2.4 Ops S-R Summary
To sum up, on the “Ops S-R” track, changes in business environment and the
business supporting-feature of IS are detected and handled predominantly by IS
users with minimal intervention from the IS function (either an internal department
or an external provider). Such type of handling can range from high to low level of
automation. The higher percentage of manual handling is needed, the more
dependency on the skills, experiences, and availability of IS users to maintain
desirable ∆S-R and Synchronicity. In general, firms should aim at identifying those
manual processes and gradually, through learning and reflection, convert them into
automatic yet effective processes. Intelligent tools and technologies are becoming
more available to help IS users reduce Friction and increase Torque while
performing “sensing and responding”. Again, we admit that, in reality, the mix of

104
Spatial and Temporal uncertainties may make the effort of automation more
expensive than having humans to sense and respond manually. Organisations will
need to be able to evaluate automation options and make trade-offs. One starting
point could be gaining insights from human-automation interaction research
(Hancock et al., 2013). In addition, we believe articulating the Temporal and Spatial
dimensions of uncertainty and establishing some form of context-based confidence
in at least one dimension would improve the feasibility of automation.
3.2.3 On Interactions between the Dev and Ops Agility Cycles
Although the Ops Agility Cycle and the Dev Agility Cycle can operate separately on
their own tracks in parallel, at times, they also intertwine with each other. Such an
intertwining relationship can be complex and dynamic in reality. The diagram in
Figure 9 intends to graphically capture this cross-loop interrelationships. As
represented in dashed lines which allow a free flow between the two loops. In the
real world, organisation may find themselves having to cycle through some parts of
the outer loop and then other parts of the inner loop (or vice versa) in order to
effectively and efficiently sense and respond to changes.
The interaction between the inner and outer loops can take in many forms as both
loops can communicate and collaborate with each other at any stage if required.
With a great deal of simplification, we classify the types of interaction into two: Dev-
initiated vs. Ops-initiated, with each represents a deviation from the pure and clean
Dev S-R and Ops S-R tracks. In both types of interactions, actions and decisions can
be bounced between the Dev Agility Cycle and the Ops Agility Cycle with each
contributes its own portion to keep cycling forward.
3.2.3.1 Dev-Initiated Interaction
The Dev-initiated interaction means the Dev Agility Cycle takes lead in sensing
signals and detecting potential changes in the business environment which need to
105
be forwarded to the Ops Agility Cycle to diagnose and decide on responses. The
responses could include a modification of the technological components of the IS or
an adjustment of the business components instead.
For instance, the Dev Agility Cycle can sense threats presented by abnormal user
transactions and then report to the Ops Agility Cycle to decide if a more restricted
access to system/data should be enforced. This way, the signals for change are
sensed on the Dev Agility Cycle and decisions on responses are being made on the
Ops Agility Cycle, yet the execution of the decision is done back on the Dev Agility
Cycle.
Dev Agility Cycle may intentionally or unintentionally capture signals suggesting
changes in business components of the IS. These signals then get forwarded to the
Ops Agility Cycle to diagnose and respond. For example, a data integrity issue
sensed by the Dev Agility Cycle may need to be responded by the Ops Agility Cycle to
alter the business workflow and classification rules. This time, the selecting and
executing capabilities on the Dev Agility Cycle are not required.
Such a Dev-initiated interaction represents an emerging view of the role of IS
function in organisations. The IS function is, to a lesser extent, just a passive unit
that solves technical problems such as infrastructure glitches and bugs in software
applications. Instead, with more business operations turning into highly digitalised
products and services, the IS function can serve as a scout in detecting business
problems, identifying risks, and making innovations. This is especially true with
organisations having Internet based services as their core businesses.
3.2.3.2 Ops-Initiated Interaction
The Ops-initiated interaction, on the other hand, depicts a situation where the Ops
Agility Cycle detects signals for potential changes in the business environment
which require the Dev Agility Cycle to make responses. For instance, through
analysing historical sales data, an online book selling business has discovered a

106
clear trend that old customers are moving away. The business then intends to add a
smarter cross-vendor loyalty program into their online store. Such a program
cannot be implemented without help from IS developers/engineer, as in involves
adding new technological structures and functionalities into the underpinning IS to
retrieve and integrate customers’ points accumulated via historical purchases done
with other collaborating vendors. Signals for changes are observed and interpreted
on the Ops Agility Cycle yet decisions for response (e.g. technologies and techniques
to be used for the development of such cross-vendor loyalty program) are made and
executed collectively with the Dev Agility Cycle.
In such a situation, the Dev Agility Cycle acts more as a reactive responder to signals
sensed and diagnosed on the Ops Agility Cycle. The IS users may first detect signals
indicating necessary changes in the technological components of the IS which they
cannot implement. Then IS developers are called in to make the changes by either
constructing new features or modifying existing functionalities of the IS. Such Ops-
initiated interaction represents a traditional view of the role of the IS function in
organisations, i.e. being a supportive and reactive function to other business
operations. However, given the transformational role of technologies in modern
businesses, lesser organisations can afford purely operating in this manner and
ignore the sensing capabilities on the Dev Agility Cycle.
3.2.4 Section Summary
This section elaborated on an operational view of the IS Agility Cycles from an
organisational standpoint. Conceptually, the two Agility Cycles (Dev vs. Ops) can
operate on their own tracks (Dev S-R vs. Ops S-R) in parallel and/or intertwine with
each other at the same time. Table 10 below summarises the key elements
emerging from this elaboration. In this table we present only the pure form of Dev S-
R and Ops S-R which are essential to understand the IS Agility concept. The
intertwining relationships between the two are more like variations with no

107
fundamental deviation from the core conceptualisation thus not presented in the
table for simplicity and readability.
As shown in Table 10 below, Dev S-R and Ops S-R have different responsibilities in
terms of sensing signals and responding to changes. Both can have various levels of
automation, although for to simplify the presentation we classified only three levels
(high, moderate, and low). More extensive classification of automation can be found
in the work of Parasurman et al. (2000), even though it does not address issues of
uncertainty. We will not discuss automation any deeper as it involves complex
context-based design and decisions thus would take us far apart from the primary
purpose of this thesis.
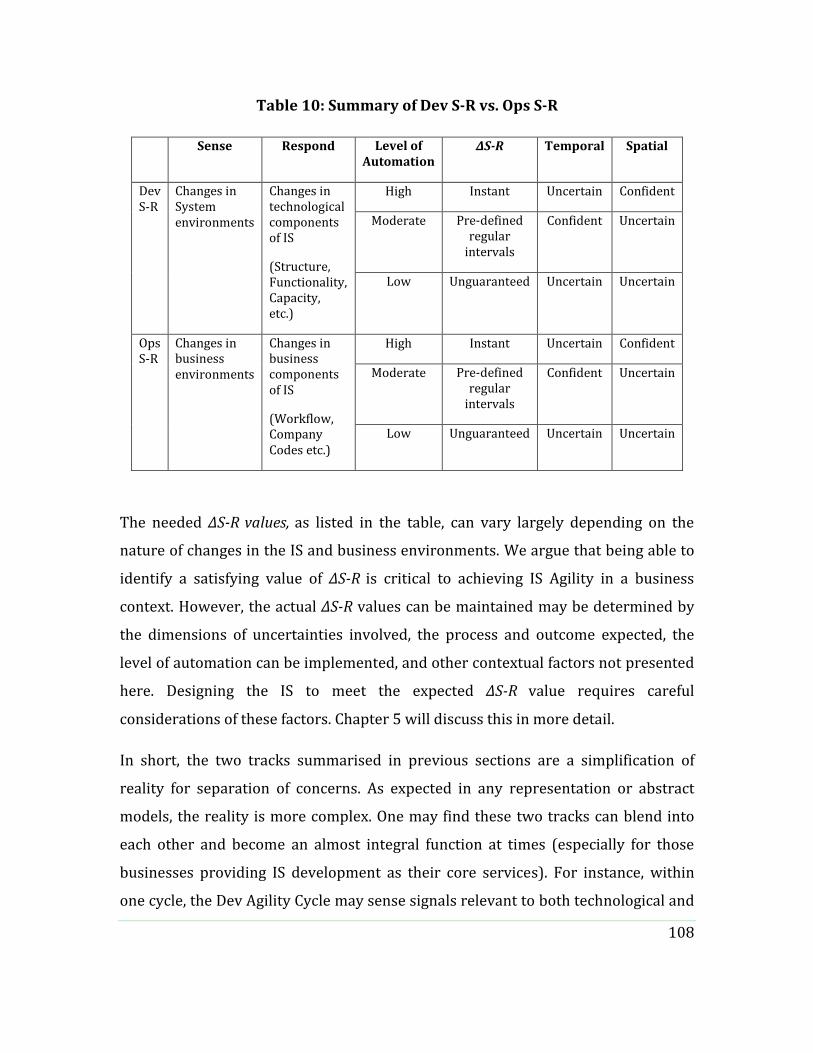
108
Table 10: Summary of Dev S-R vs. Ops S-R
Sense Respond Level of Automation
∆S-R Temporal Spatial
Dev S-R
Changes in System environments
Changes in technological components of IS
(Structure, Functionality, Capacity, etc.)
High Instant Uncertain Confident
Moderate Pre-defined regular
intervals
Confident Uncertain
Low Unguaranteed Uncertain Uncertain
Ops S-R
Changes in business environments
Changes in business components of IS
(Workflow, Company Codes etc.)
High Instant Uncertain Confident
Moderate Pre-defined regular
intervals
Confident Uncertain
Low Unguaranteed Uncertain Uncertain
The needed ∆S-R values, as listed in the table, can vary largely depending on the
nature of changes in the IS and business environments. We argue that being able to
identify a satisfying value of ∆S-R is critical to achieving IS Agility in a business
context. However, the actual ∆S-R values can be maintained may be determined by
the dimensions of uncertainties involved, the process and outcome expected, the
level of automation can be implemented, and other contextual factors not presented
here. Designing the IS to meet the expected ∆S-R value requires careful
considerations of these factors. Chapter 5 will discuss this in more detail.
In short, the two tracks summarised in previous sections are a simplification of
reality for separation of concerns. As expected in any representation or abstract
models, the reality is more complex. One may find these two tracks can blend into
each other and become an almost integral function at times (especially for those
businesses providing IS development as their core services). For instance, within
one cycle, the Dev Agility Cycle may sense signals relevant to both technological and
109
business components of the IS. Then it will go on to respond to signals related to the
technological side and pass the signals related to the business side onto the Ops
Agility Cycle. Hence “Dev S-R” and “Ops S-R” can both be present in one cycle. In the
same fashion, the Ops Agility Cycle may proceed by itself while passing signals down
to the Dev Agility Cycle.
Depending on the business models and technologies in use, some firms may value
one track over the others. For instance, firms with their own e-Commerce
implementations which require responsiveness, reliability, and easy recovery to
support smooth and secure online transactions, may find that the “Dev S-R” track
deserves much investment. On the contrary, firms purely relying on third-party
solutions to conduct online retail and maintaining little in-house IS capability, may
have no interest in developing “Dev S-R” at all, rather, they would focus their
investment on ”Ops S-R” and adopt more low-maintenance cloud-based smart
applications to satisfy their customers.
This section has brought about more detailed understanding and a holistic view
concerning IS Agility and its positioning within the organisation. This view has
injected higher level of conceptual clarity into this study. Yet again, without a
specific IS solution in mind, conceptually incorporating all the discussed IS Agility
elements together may seem to lack focus. More technology-specific analytical
elements will be provided in the following sections.
3.3 Applying ISANN: Descriptive Analysis of Cloud Services
To achieve agility in IS, IT practitioners have devoted considerable effort to bring
about innovations in technical architectures and frameworks. In particular, the
service-oriented paradigm has become increasingly popular in recent years (Chang,
He, & Castro-Leon, 2006). This paradigm proposes that IT systems should be built

110
based on loosely coupled and reusable modular services which can be quickly
constructed and deconstructed to support changing requirements in IS and business
requirements (Setia et al., 2008). Such a popular paradigm in the IT industry is in
alignment with the “Agile-System Architecture” identified in ISANN. Out of the
notion of service orientation has emerged a new approach for converting
conventional IT resources into public online services – an approach commonly
called cloud computing.
Cloud computing delivers IT resources in a service-oriented model and is marketed
as a new approach to provide agile and responsive computational power to
businesses. The necessary underlying infrastructure is provided by large data
centres located in distant areas offering cheap electricity, with each operating tens
of thousands of servers (Katz, 2009), which brings about economies of scale. Plus
the advancement in server virtualisation and administration automation, Cloud
Computing providers can rent out their computing resources and software services
to clients at a low price in a pay-as-you-go subscription fashion. These resources
and services are delivered via the Internet, often in a self-service model with which
users can initiate, configure, and terminate virtual servers and systems remotely
without intervention from vendors (Mell & Grance, 2010). Therefore, Cloud
Computing adopters no longer need to maintain and manage local IT infrastructures
and systems to support their business activities. For an organisation, this means the
“Dev Agility Cycle” becomes mostly the responsibility of the cloud provider.
Resultantly, the business can focus more on their core business operations and the
“Ops Agility Cycle” by leaving many IT-related activities such as server installation,
maintenance, and software updates to be handled by remote specialised vendors
who are dedicated in managing such technologies and infrastructures.
Cloud computing, as a unified IT delivery model with a focus on agility gains,
provides a valuable context for us to better understand issues surrounding IS Agility.
The following sections further the elaboration of ISANN and use it as a conceptual
111
framework to descriptively analyse the agility impact of Cloud Computing services
(i.e. IaaS vs. SaaS). Through this chapter, we are able to justify that ISANN is not only
a theoretically robust conceptualisation, but more importantly, a practically
relevant model for inspecting and designing IS Agility in real-world businesses.
Subsequently, ISANN is deemed capable to provide a solid foundation for designing
a systematic method to dissect and solve IS Agility problems.
Today, when discussing IS Agility, Cloud Computing is perhaps among the top-cited
technology terms. Cloud Computing providers and proponents often highlight
“agility” as a key benefit to promote adoption. For instance, Oracle has organised an
online seminar titled “Cloud Computing enables IT agility” (Oracle, 2010), while
Microsoft has promised that adopting cloud services brings “more agility, more
freedom, and more choice” (Microsoft, 2010). Some technology commentators even
suggest that it is “agility, not savings, may be the true value of the cloud” (Mullins,
2010). CIO magazine has been recommending “business strategy based on Cloud
Computing and agility” (Hugos, 2010). All these promises and efforts have made
Cloud Computing an unprecedented phenomenon when researching IS Agility.
Despite the large supply of marketing materials and white papers, to date there has
been limited academic research explaining if cloud-based services really enable IS
Agility , and if so, how it may happen (Sawas & Watfa, 2015). This section takes our
refined understanding of IS Agility to the Cloud Computing context and “drills down”
into a deeper analysis of the potential effects of cloud services. Through a structured
assessment, using the concepts and insights generated from previous literature and
synthesis (e.g. ISANN), we have reasoned and discovered that different levels of
cloud-based services have different impacts on IS Agility which can vary drastically
from high Synchronicity with minimised ∆S-R, to low Synchronicity with ∆S-R
mostly unguaranteed. Such a structured analysis, again, can help us evaluate the
usefulness and effectiveness of ISANN (and those more detailed elements and inner
workings discussed in Section 3.2) in the real-world business context.

112
An earlier version of this analysis has been published 10and cited as part of the
theoretical foundation by one of the first empirical studies into the impact of Clout
Computing on IS Agility (Sawas & Watfa, 2015). This empirical study provided
evidence to support the outcome of our structured analysis, that is, the agility claim
made by cloud service providers is only partially valid. SaaS is mostly a cost-saving
option allowing light-weight implementations, but appears to have no guaranteed
impact on IS Agility (Sawas & Watfa, 2015). IaaS and PaaS can address some aspects
of the agility issues related to technology infrastructure and software development
(Sawas & Watfa, 2015), but are not sufficient to achieve the full scope of IS Agility
we conceptualised in the previous sections. Nevertheless, Sawas and Watfa (2015),
from an organisational capability point of view, applied a “reflective measurement”
approach to survey the perceived IS Agility effects among CIOs and IT managers of
78 companies have adopted some form of cloud service for unspecified business
applications. By contrast, our structured analysis in the next section is
predominantly “formative” based on the subcomponents constituting ISANN and
performed from a system design viewpoint.
In general, we view that Cloud Computing is more of a facilitator than an enabler, to
IS Agility Cycles. In other words, business adopters should expect Cloud Computing
to help eliminate or mitigate bottlenecks in their consciously established IS Agility
Cycles, instead of hoping it to be an “Agility Injection” that can miraculously turn a
rigid business operation into an agile one. Among the three levels of cloud services,
we still consider a genuine SaaS delivery model has the most potential to facilitate a
fuller scope of IS Agility (i.e. both Dev Agility and Ops Agility), provided it is
10 This structured analysis has been published as a chapter in the IGI Global book titled “Cloud Computing Service and Deployment Models: Layers and Management” edited by Al Bento and Anil Aggarwal (Yang et al., 2013). We are very pleased to see this book chapter later inspired one of the first empirical studies surveying the impact of Cloud Computing on IS Agility (Sawas & Watfa, 2015).
113
designed to incorporate the sensing and responding capabilities needed by the
business and is built on top of automatically scalable infrastructures such as native
PaaS or IaaS. However, many self-claimed SaaS offerings on the market today don’t
meet such criteria. Therefore, we intend to provide the following analysis as a
guiding principle for SaaS vendors to examine the design and development of their
solutions/services if IS Agility should be delivered to the business users/customers.
This analysis will also be informative to Cloud Computing adopters to review which
level of cloud services can meet their agility needs and to evaluate service providers
more effectively.
3.3.1 Cloud Computing Services
Cloud Computing offers a competitive alternative to traditional IT provisioning.
Instead of operating servers and applications in an on-premises fashion, Cloud
Computing provides on-demand computing power and storage via the Internet, with
rapid implementation, pay-as-you-go subscription, little maintenance, and less local
IT staffing (Truong, 2010). Such a “rent-based” IT provisioning model is promised
to reduce cost and improve agility for its business adopters, according to leading
providers such as (Microsoft, 2010) and (VMware, 2011).
Formally, the National Institute of Standards and Technology (NIST) of the U.S.
defines Cloud Computing as a “model for enabling convenient, on-demand network
access to a shared pool of configurable computing resources (e.g., networks, servers,
storage, applications, and services) that can be rapidly provisioned and released
with minimal management effort or service provider interaction” (Mell & Grance,
2010). Despite the emphasis on computing infrastructure at its early stage, Cloud
Computing has now grown into a full-fledged service stack. Such a stack offers a
spectrum of rental services ranging from hardware-intensive to software-intensive.
These generally include three layers: IaaS (Infrastructure-as-a-Service), PaaS

114
(Platform-as-a-Service), and SaaS (Software-as-a-Service). Table 11 below
illustrates some representative cloud providers by service layers.
Table 11: Cloud Service Layers and Providers
Cloud Services Examples of Cloud Providers
IaaS Amazon AWS EC2 & S3, DigitalOcean, IBM Blue Cloud, Microsoft Azure
IaaS, RackSpace, HP FlexDC
PaaS Google App Engine, Microsoft Azure PaaS, IBM BlueMix, LongJump,
Amazon AWS Elastic Beanstalk, Apache Stratos, OpenShift, Heroku, Cloud
Foundry, Engine Yard
SaaS Salesforce CRM, Oracle SaaS platform, Google Apps, NetSuite, Workday
Human Capital Management, Zoho CRM, Xero Accounting, GitHub,
ZenDesk
Source: Extended from (Leavitt, 2009 )
IaaS is the basic form of Cloud Computing and provides the backbone of the cloud
service stack. It offers rental service of computing infrastructures, such as
processors, memory, storage, networking and other forms of hardware resources in
a virtual, on demand manner via the Internet (Leavitt, 2009 ). Developments in
server virtualization and network management have enabled cloud infrastructures
to scale up and down dynamically according to demand. Infrastructure utilisation is
monitored and measured by the cloud management system (e.g. hypervisor). The
IaaS tenants are charged for the resources they have consumed and/or occupied.
Tenants do not manage or control the underlying hardware infrastructure but have
control over operating systems, deployed applications, and some networking
components (e.g., host firewalls) (Mell & Grance, 2010).
Typical IaaS examples include Amazon EC2 (Elastic Cloud Computing) and S3
(Simple Storage Service) where computing and storage infrastructure are open to
public access in a utility fashion. For a fee, a service subscriber can gain access to
thousands of virtual servers from EC2 to run a business simulation and then release
them as soon as the computational work is done. Some researchers further divide
115
IaaS into HaaS (Hardware as a Service) and DaaS (Data as a Service) (Wang et al.,
2008 ), but it is more common that IaaS is referred to as a whole concept.
PaaS moves one step further than IaaS by providing programming and execution
environments (i.e. Integrated Development Environment, hereafter IDE), database
and web servers, and middleware, etc. A PaaS acts as an integrated platform for
software developers to support the full SDLC of design, development, testing,
deployment, and maintenance. Just by clicking through the setup wizard, PaaS
tenants can create identical environments (e.g. development, test, and production)
and integrate their web applications with common middleware in the matter of
minutes. Software applications can be developed using programming languages and
APIs supported by the provider, and then directly deployed onto the same
infrastructure. The PaaS tenants do not need to manage or control the underlying
hardware infrastructure including networking, virtual machines, operating systems,
or storage, but has control over the deployed applications and some needed
configurations of the application hosting environment (Mell & Grance, 2010). PaaS
can reduce the burden of system administration traditionally carried by software
developers who can now concentrate on more creative tasks. PaaS provides a
complete set of development tools, from the interface design, to process logic, and to
integration (Lawton, 2008). Some other appealing features of PaaS include built-in
instruments for measuring the usage of the deployed applications for billing
purposes, dynamic resource allocation to ensure the QoS and SLAs of the deployed
applications and established online communities for collaboration and problem
solving among developers.
An example of PaaS is Google’s App Engine, which allows subscribers to build
applications on the same scalable system architecture that power Google’s own
applications (Foster, Yong, Raicu, & Lu, 2008 ). PaaS offerings tend to lower the
entry level for software development. WaveMaker, recently acquired by VMware, is
providing an easy and intuitive way of building web sites, enabling non-expert

116
developers to build their own online applications in the cloud. Such platforms
comprise a modern instantiation of the End User Computing (EUC) paradigm which
has long been envisioned by generations IS researchers (Huff, Munro, & Martin,
1988). PaaS tenants will likely become providers of SaaS once their applications
deployed become mature. However, unlike the general-purpose IaaS, PaaS providers
may choose to focus on a vertical market and support specialised development in
certain industry segments. For example, Long-Jump’s platform is only for
developing CRM systems for newspapers.
SaaS provides complete, turnkey, hosted software applications, sometimes even
complex enterprise information systems, such as CRM and ERP, through a web
browser via the Internet (Leavitt, 2009 ). This approach is not completely new.
From a service user’s perspective, similar to the previous ASP model (Application
Service Provider), SaaS can eliminate the need to install, run, and maintain the
application on local servers. However, instead of ASP’s single-tenant arrangement,
i.e. each application is customised and hosted for just one client, SaaS is known for
its multi-tenant architecture in which all the service users share the same single
code base maintained by the provider. Authentication and authorization security
policies are used to ensure the separation of tenant data. Such a sharing mechanism
reduces the cost of resource and maintenance; thus SaaS providers can still profit
while offering their services at a lower price than ASP vendors.
A prominent example of SaaS is Salesforce’s online CRM system, Salesforce.com.
This service provides subscribers with complete CRM functionalities as well as a
customization options based on its PaaS by-product Force.com. There are two types
of customizations available, one is “point-and-click configuration” that requires no
programming, the other is “customize with code” that allows user developers to
create new functionalities beyond the constraints of configuration, with Apex -
Salesforce.com’s own native programming language.

117
IaaS, PaaS, and SaaS reflect a full spectrum of cloud services available to the public.
IaaS providers are the most independent as they operate their own datacentres (e.g.
Amazon AWS EC2, IBM Blue Cloud). PaaS providers may build their platforms upon
third-party IaaS (e.g. LongJump), or they may have their own IaaS offerings, and
extend those services by providing software development environments (e.g.
Microsoft Azure). A SaaS provider can either use the PaaS layer to develop and run
its applications, or directly use the IaaS layer to deploy already built applications.
3.3.2 IS Agility Analysis of Cloud Services
The IS Agility analysis is conducted mainly from a business adopter’s perspective,
not a cloud provider’s point of view. This is because that cloud providers have been
promising IT/IS Agility to business adopters, not the other way around. The analysis
is to examine the key characteristics of each cloud service layer against our IS Agility
conceptualisation for a concrete understanding of the contributions the former can
make to the latter via a direct mapping between these two. To perform the
structured analysis, a simple flowchart was developed and followed through step by
step. This is to ensure a consistent structure that the key elements constituting our
IS Agility conceptualisation are being assessed against the core characteristics of
each layer of cloud services.
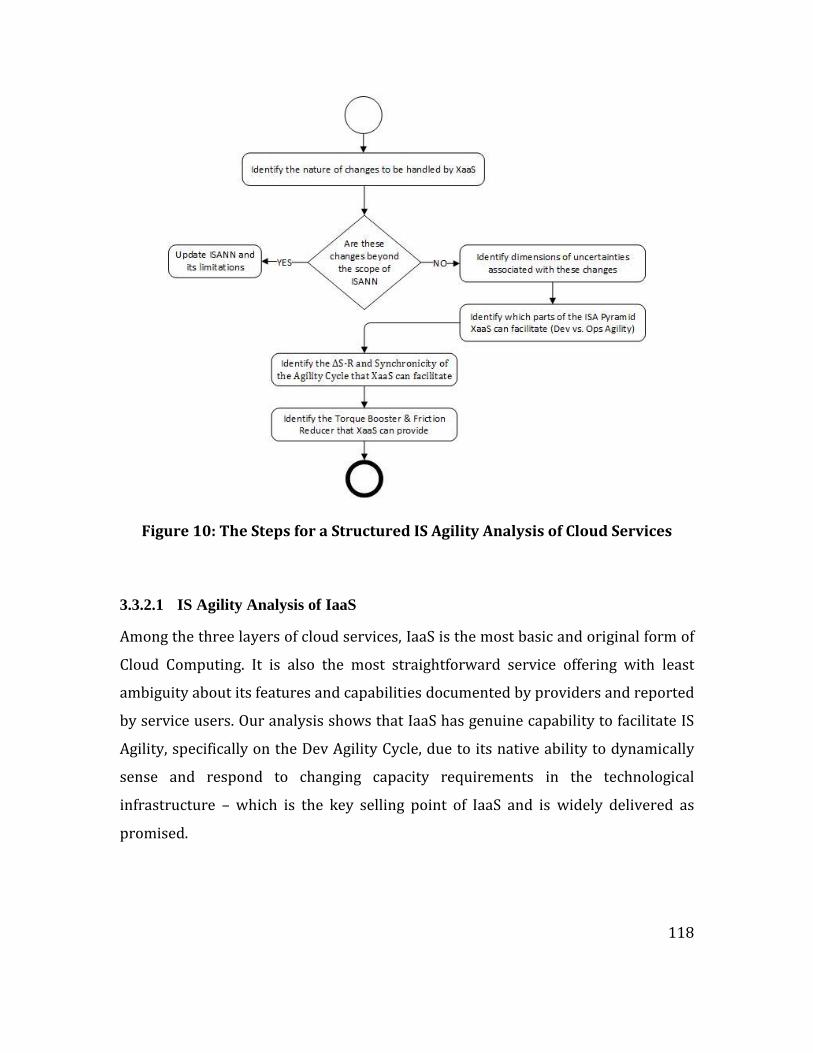
118
Figure 10: The Steps for a Structured IS Agility Analysis of Cloud Services
3.3.2.1 IS Agility Analysis of IaaS
Among the three layers of cloud services, IaaS is the most basic and original form of
Cloud Computing. It is also the most straightforward service offering with least
ambiguity about its features and capabilities documented by providers and reported
by service users. Our analysis shows that IaaS has genuine capability to facilitate IS
Agility, specifically on the Dev Agility Cycle, due to its native ability to dynamically
sense and respond to changing capacity requirements in the technological
infrastructure – which is the key selling point of IaaS and is widely delivered as
promised.

119
Table 12: IS Agility Analysis of IaaS
Mapping IS Agility Elements to IaaS
Nature of Changes Supported Specifically by IaaS
Concentrated mainly on technological components of IS.
Basic and straightforward automated provisioning allows rapid expansion and shrinkage of computing, storage, and networking capacity, in according to changing user workload
Uncertainty Dimensions
Spatial Confidence can be established due to nature of changes predictable, i.e. variation of capacity, thus mainly Temporal Uncertainty – unknown timing of such changes
IS Agility Providers Facilitated Specifically by PaaS
Mainly on Agile System-Architecture thus supporting Dev Agility Cycle
Synchronicity
Higher than traditional hosting service, with minimal gap between Sensing and Responding to changes in the technological environment due to automated resource allocation can be triggered by predefined threshold
∆S-R = real time, nearly instant
Friction Reducer vs. Torque Booster
Mostly reducing Friction via dynamic resource allocation enabled by virtualisation and modularisation
Following steps illustrated in Figure 10, we first identified the nature of changes
that IaaS is designed to handle. This is done through analysing the service
descriptions11, formal definitions (e.g. the NIST version in Section 3.3.1), tutorials
11 For example: Amazon EC2 https://aws.amazon.com/ec2/details/ and IBM Blue Cloud
https://www.ibm.com/cloud/products/

120
and demos, and several trial experiences of major IaaS offerings (e.g. Amazon EC2,
IBM Blue Cloud, and RackSpace). The nature of changes IaaS can handle is
essentially the growth and decline of capacity at the technological infrastructure
level. Given the advancement in virtualisation, modularisation, and resource
scheduling algorithms, such capacity changes can be automatically monitored and
managed by hypervisors in a seamless manner (Lunsford, 2009). Therefore, there is
little Spatial Uncertainty involved. The IaaS knows how to scale up and down virtual
resources and can do so rapidly and autonomously once metrics and conditions are
defined (e.g. Amazon’s CloudWatch). The uncertainty we identified at IaaS level is
mostly at the Temporal dimension, meaning the timing of workload changes
demanding increase or decrease capacity is unknown upfront. This is in alignment
with the previous discussion in Section 3.2, automation is more practical when
Spatial Confidence can be established in advance while Temporal Uncertainty still
presents.
Due to the high level of automation, there is little gap between sensing changes of
workload and responding with dynamic capacity and resource allocation. IaaS can
maintain a sustainably low ∆S-R and high Synchronicity. For business adopters
using IaaS to develop, run and test their applications, at least they can expect agility
when faced with unexpected changes in IT infrastructure capacity requirements, or
referred to by some as “rapid elasticity” (Mell & Grance, 2010). As such, IaaS is
mapped into the Agile-System Architecture category and considered a Friction
Reducer to the Dev Agility Cycle due to its ability to completely remove the burden
of installing, upgrading, and maintaining physical machines and networking
equipment in a local server cluster. From a business adopter’s perspective, IaaS
represents a new generation of automation in capacity scaling and load balancing
(Böhm, Leimeister, Riedl, & Krcmar, 2010) and can deliver far more responsive and
dynamic capacity than traditional hosting services. To save time, IaaS users can set
up separate QoS criteria for each application deployed to have its own capacity plan

121
through a web-based self-service portal without needing to talk to a server
technician.
In addition, some well-established IaaS providers (e.g. Amazon EC2) can offer user
choices of easy switching between various types of computing capacity to support
specialised computational tasks. This is particularly handy for R&D intensive
businesses who tend to have different computational workloads for different
projects. These will require different computing infrastructure for optimal
performance and cost balance. For example, data-intensive computing tasks upon
massively-parallel architecture can be assigned to GPU clusters for better
performance, those process-control applications built on sequential architecture
would be more suitable for CPU clusters.
Despite the widely-tested dynamic capacity of IaaS that can contribute to users’
Agile System-Architecture, our analysis identified no intended contribution of IaaS
to Agile System-Development. This is understandable because that changes and
uncertainties need to be sensed and responded in software development activities
are beyond the scope of infrastructure services. Moreover, IaaS seems to have no
intended contribution to users’ Ops Agility Cycle. After all, this is depending on the
nature of IaaS users’ business operations and the applications they deploy on IaaS.
The applications deployed by users may be just an archive management system for
staff members and have little to do with improving the sensing and responding
capabilities of their own businesses.
3.3.2.2 IS Agility Analysis of PaaS
PaaS can facilitate the processes of IS development by enabling developers to build,
test and publish their web applications in a much easier and quicker way compared
to the traditional approach of developing applications in local IDE (Lawton, 2008). A
genuine PaaS provider (e.g. Microsoft Azure PaaS, IBM BlueMix) can provide
specialized tools/services besides a web-based IDE to make their platforms a one-
stop shop for software development, test automation, middleware integration (e.g.

122
identity management, message queuing) , version control, application publication,
and performance monitoring (e.g. Azure’s Application Insights). Our analysis shows
that these special capabilities of PaaS can support IS Agility, particularly on the Dev
Agility Cycle.
Table 13: IS Agility Analysis of PaaS
Mapping IS Agility Elements to PaaS
Nature of Changes Supported Specifically by PaaS
Concentrated mainly on technological components of IS:
Common changes in software development environment, generic software functionalities, generic features and components
Uncertainty Dimensions
Both Spatial and Temporal Uncertainties – PaaS can improve confidence on both dimensions when faced with changes in the generic functionalities and features of applications
IS Agility Providers Facilitated Specifically by PaaS
On both Agile System-Development and Agile-System Architecture thus supporting Dev Agility Cycle
Synchronicity
Higher than application development in traditional local IDE, reduced gap between Sensing and Responding due to easy and direct integration with common middleware, as well as automation of system administration tasks
∆S-R: shorter than using traditional local IDE yet still defined by capabilities of PaaS adopters (e.g. IS developers)
Friction Reducer vs. Torque Booster
Improve Torque via task automation and reduction of system admin effort, reduce Friction by easy coupling and decoupling with common application building blocks
Following the same steps used in our analysis of IaaS, we first identified the nature
of changes that PaaS specifically can handle. This is done predominantly through

123
analysing official tutorials and workshops, demonstrations, technical documents,
and trial experiences from several key PaaS providers (e.g. Microsoft Azure PaaS,
IBM BlueMix). As shown in Table 13, our observation is that a general-purpose PaaS
can facilitate more generic changes in the technological components of an
application. For instance, IBM BlueMix allows developers to call on an arsenal of
prebuilt services (known as “application building blocks”) to construct their
applications with a wide range of features such as security, mobile, integration, and
analytics. Within each feature, there are often various options for developers to
choose (e.g. The Data and Analytics category of services includes Apache Hadoop,
Apache Spark, Elasticsearch, Insights for Twitter, and a dozen more choices).
Given the availability of a large set of common “application building blocks”, when
faced by changes in generic functionalities and features, PaaS can reduce the level of
uncertainty and help developers establish confidence on both Temporal and Spatial
dimensions. This is a good illustration of Agile-System Architecture which in turn
facilitates Agile System-Development. As such, the Synchronicity on the Dev Agility
Cycle of PaaS adopters should be higher than what they could achieve with
traditional local IDEs. In the same fashion, the ∆S-R should be shorter for the same
developers migrated from local IDE to PaaS. Some particular changes (e.g. adding an
live chat feature for the sales representatives to communicate directly with online
customers) used to need days of manual handling to implement, can be done on
PaaS in the matter of hours due to the automation of admin tasks (Torque Booster)
and directly usable application building blocks (Friction Reducer).
However, despite all the task automation and building blocks facilitating generic
changes in software development, adopters may not be able to leverage the power
of PaaS to handle their business-specific changes. PaaS is essentially an all-in-one
web-based software development and deployment platform. As discussed in
previous sections, software development, as a human activity, inevitably faces
changes in user requirements, functionalities and features. Some changes are
124
generic ones that can fully leverage the agility of PaaS for rapid implementation (e.g.
adding a SMS text messaging functionality to an existing web application). Other
changes are more business-specific and may be even unique to the particular group
of users with no immediate solutions can be articulated. This type of changes are not
rare and will not be directly supported by the building blocks on PaaS. The PaaS
adopters (e.g. application developers) will need to dissect the problems based on
their domain knowledge and probably implement some ad-hoc custom-built
solutions.
Furthermore, from an adopter’s viewpoint, PaaS doesn’t necessarily contribute to
Ops Agility Cycle. Similar to our analysis of IaaS, whether or not PaaS can have an
impact on the adopter’s Ops Agility Cycle is depending on the nature of the adopter’s
business operation and the application being developed and deployed on PaaS. If the
application developed and deployed on PaaS is an online product catalogue for sales
representatives and customers, it is difficult to make a case that such an application
can boost the sensing and responding capabilities of the PaaS adopter’s own
business operation as a real estate developer.
3.3.2.3 IS Agility Analysis of SaaS
Unlike IaaS and PaaS, we have found SaaS offerings highly diverse and divergent,
which makes our analysis difficult. After all, there are only tens of IaaS and PaaS
providers in the market offering consistent, general-purpose services, whereas
thousands of SaaS providers are already in business for assorted purposes and the
number is still growing. This is understandable as the entry barrier and upfront
investment for becoming an IaaS and/or PaaS provider is generally quite high as
they normally need to establish industry-strength, large-scale data centres to ensure
the resource pool is big enough to accommodate the maximum capacity required by
customers. A typical cloud data centre would reportedly contain tens of thousands
of physical servers plus all the networking, security, cooling, and facilitates needed
to stabilise the computing environment (Katz, 2009). On the contrary, SaaS in
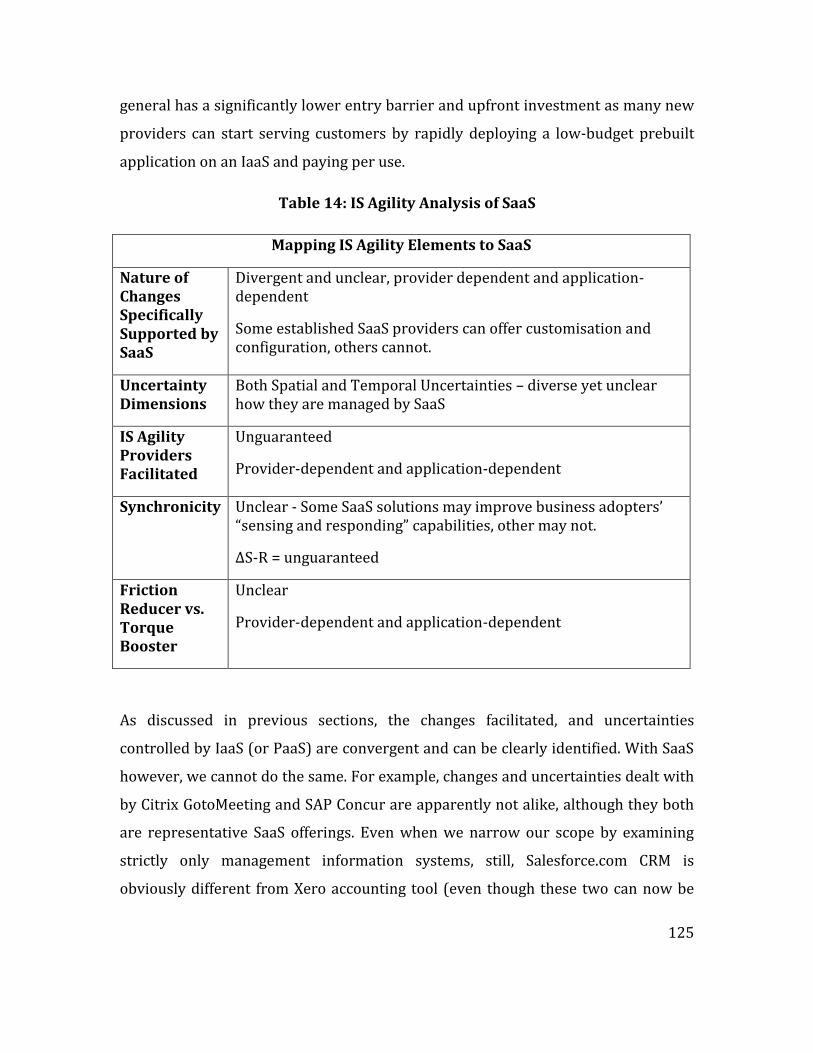
125
general has a significantly lower entry barrier and upfront investment as many new
providers can start serving customers by rapidly deploying a low-budget prebuilt
application on an IaaS and paying per use.
Table 14: IS Agility Analysis of SaaS
Mapping IS Agility Elements to SaaS
Nature of Changes Specifically Supported by SaaS
Divergent and unclear, provider dependent and application-dependent
Some established SaaS providers can offer customisation and configuration, others cannot.
Uncertainty Dimensions
Both Spatial and Temporal Uncertainties – diverse yet unclear how they are managed by SaaS
IS Agility Providers Facilitated
Unguaranteed
Provider-dependent and application-dependent
Synchronicity
Unclear - Some SaaS solutions may improve business adopters’ “sensing and responding” capabilities, other may not.
∆S-R = unguaranteed
Friction Reducer vs. Torque Booster
Unclear
Provider-dependent and application-dependent
As discussed in previous sections, the changes facilitated, and uncertainties
controlled by IaaS (or PaaS) are convergent and can be clearly identified. With SaaS
however, we cannot do the same. For example, changes and uncertainties dealt with
by Citrix GotoMeeting and SAP Concur are apparently not alike, although they both
are representative SaaS offerings. Even when we narrow our scope by examining
strictly only management information systems, still, Salesforce.com CRM is
obviously different from Xero accounting tool (even though these two can now be
126
integrated via “Trigger and Action” configuration). Without a convergent set of
changes and uncertainties being supported, we cannot perform IS Agility analysis on
SaaS as a whole. To reason and appreciate the impact of SaaS on IS Agility, we would
need to analyse the providers and services in a case-by-case manner. Such an effort
is considered impractical and beyond the scope of the present study, yet it can be a
candidate for future research if a SaaS classification schema can be developed to
enable a group-by-group analysis.
Table 14 above sums up our general observations on SaaS from an IS Agility
standpoint. No assured findings can be presented there. Having said that, depending
on the ambition and capabilities of a SaaS provider, some IS Agility supporting
features can be found among those well-established SaaS offerings. Take the
superstar SaaS Salesforce.com for an example, founded in February 1999, had initial
public offering (IPO) in June 2004, has invested heavily in R&D to improve the
capabilities of its SaaS CRM system, with its stock price gone from the original 3.95
USD to 122.82 USD (as at 20th April 2018) in 14 years. We see Salesforce.com is a
non-typical SaaS as it also opens its own system development platform as a PaaS
offering (i.e. Force.com) in 2007 to allow both developers and users to customise
the standard CRM package through Apex code and Point-and-Click App building tool.
Such a move has largely improved Salesforce adopters’ ability to handle
technological and business changes in their requirements. Prior to launching
Force.com, Salesforce.com has already opened a marketplace in 2006 called
AppExchange where developers and users can share the Apps they developed with
each other. These Apps can be directly plugged in to the Salesforce CRM to make
system adaptions and extensions convenient to adopters. There are currently
almost 3,000 Apps in this marketplace with customer reviews and
recommendations. Furthermore, all these customisation options are offered despite
the fact that the Salesforce CRM is already a highly configurable system with inbuilt
engines to support workflow and business rules.

127
The whole Salesforce ecosystem built around Force.com and AppExchange can
provide unconventional yet effective support to the IS Agility we conceptualised.
This ecosystem can facilitate changes in both technological and business aspects of
the Salesforce CRM system. The workflow and rule engines built in the system are in
alignment with the Agile-System Configuration we conceptualised by allowing
dynamic changes in business processes. The Force.com and AppExchange are
supporting the Agile-System Architecture by enabling easy and fast modifications of
the technological structure of the system. However, we cannot state the same on
Agile System-Development and Agile System-Operation as the former is more
concerned with how developers handle changing business requirements while the
latter is more about how users operate the system to sense and respond to business
changes. Both are not identifiable in the features and characteristics of the IS in
question (i.e. Salesforce CRM), and would be mostly depending on the individual
level practice of the SaaS adopters. Still, we can conclude that Salesforce CRM can
facilitate both Dev Agility Cycle and Ops Agility Cycle of its adopters in the part of
business this system is designed to support.
Nevertheless, again, Salesforce.com is a uniquely special case among thousands of
SaaS providers. To say every SaaS provider has the same level of capability and
investment to enable adopters IS Agility, is almost like saying all software
development companies can become Microsoft. The majority of SaaS providers do
not have their development platforms open to adopters like Salesforce does. Many
smaller providers with less mature systems have to take the full responsibility of
developing new features upon adopters’ requests. The provider-adopter
relationship then could become a more traditional outsourcing form with which
considerable time and effort will be needed to merely manage communication and
collaboration. In such a case, support to the Dev Agility Cycle is more dependent on
the Synchronicity can be achieved between the SaaS adopter and the provider, as
well as on the IS development capabilities of the provider. The ∆S-R will not be
guaranteed. The provider can reject a proposal from the adopter to make certain

128
system changes that are not directly beneficial to or may even cause issues for other
adopters sharing the same multi-tenant SaaS instance. Support to the Ops Agility
Cycle is also unguaranteed. A SaaS solution, meaning a single code base with shared
multi-tenant database and process engines, tends to set limitations on the adopters’
ability to adjust the IS for optimised sensing and responding capabilities specifically
relevant to their own business environments. These observations have been
supported by the empirical study from (Sawas & Watfa, 2015).
Finally, we can, however, envisage the possibility of a SaaS adopter’s Ops Agility
Cycle being supported by SaaS, not from a single provider, but from a selection of
providers. These providers can each offer a narrow yet focused set of business-
supporting functionalities. A masterfully selected group of interoperable SaaS can
form a federation of applications that specifically strengthen the adopter’s “Sensing,
Diagnosing, Selecting and Executing” capabilities. This will require a deep
understanding of the adopter’s business operation as well as a broad knowledge of
the capabilities and functionalities of SaaS offerings on the market.
3.3.3 Section Summary
Using the concepts, logic, and relationships established in ISANN, this section has
analysed Cloud Computing services with regard to their capabilities in facilitating IS
Agility. Such an analysis has demonstrated the usefulness of our IS Agility
conceptualisation in terms of dissecting a complex phenomenon, structuring the
analysis, and organising the findings (i.e. Table 12). An earlier version of this
analysis, as mentioned at the beginning of Section 3.3, has been published and cited
by one of the first empirical studies into Cloud Computing’s impact on IS Agility, as
part of the foundation (Sawas & Watfa, 2015). We consider this a recognition of the
usefulness and effectiveness of our conceptualisation work in terms of explaining
and analysing IS Agility.

129
For Cloud Computing, our analysis indicated that future research in this area should
carefully differentiate each layer of the Cloud services. Each layer does exhibit
notably different characteristics and capabilities, and distinct impact on IS Agility.
Again, such a finding has been supported by empirical evidence published by (Sawas
& Watfa, 2015). To leverage Cloud Computing for IS Agility, organisations must
recognise and understand these differences between the three layers of cloud
services. Each layer needs to be analysed and evaluated against the adopter’s
“sensing and responding” requirements. ISANN can be used as a tool to structure
such an analysis.
3.4 Chapter Summary
Chapter 3 has demonstrated that the concepts, logic, and relationships integrated in
ISANN are powerful means for analysing and explaining the IS Agility phenomenon.
Through a series of business scenarios, we illustrated an operational view of Dev
Agility Cycle, Ops Agility Cycle, and their interplays. We then furthered the analysis
to a specific IT provisioning model, Cloud Computing, which is closely associated
with agility in today’s business environment. The structured analysis and
explanations provide valuable insights for business practitioners and researchers
who are seeking to leverage Cloud Computing for IS Agility, and for researchers
seeking to conceptualise relationships between IS Agility and Cloud Computing. The
analysis presented in this chapter can serve as a basic framework for furthering
research in this area.
In a nutshell, the value of the analysis work done in this chapter is twofold. Firstly, it
articulates the IS Agility effect of each key layer of Cloud Computing services in a
systematic and structured manner with concrete examples and conceptual clarity.
Secondly, it demonstrates the usefulness of ISANN in decomposing and analysing IS
Agility phenomena which justifies that an innovative, yet formal tool can be

130
designed based on ISANN to solve IS Agility problems systematically with
theoretical rigour and practical relevance. Next chapter will discuss the
methodological aspects of the design and development of such a tool.

131
132
Chapter 4 : Design Science Research Methodology
4.1 Introduction
As stated in Chapter 1, the research goals of this study are twofold and include:
A. To generate a unified and holistic conceptualisation of IS Agility so that both
researchers and practitioners can understand and utilise in their own
specific contexts with clarity and consistency;
B. To design and develop a systematic method for investigating and solving IS
Agility problems with which people can follow prescriptive steps and rules
to implement with clarity and consistency.
The earlier stage of this study (reported in Chapter 2 and 3) have fulfilled the first
goal. The later stages aim to achieve the second goal through a Design Science
Research (DSR) approach. This chapter reports and discusses the rational, processes
and reflections of the journey crafting the following DSR. It includes discussions on
Design Science as an academic field of inquiry on its own, as a scientific study
approach in IS research, and as a rich knowledge base guiding the creation of
artefacts. In this thesis, we take a broader view of the term “artefact”. The artefacts
created during this research can include tools, methods, rules, software applications,
as well as the publications yielded, and finally, the thesis itself.
The DSR part of this study was conducted in real-world business settings. Instead of
working in a laboratory with university students. I, as the researcher, have been
involved in the development and implementation of cloud-based SaaS solutions for
over six years, and worked with many client organisations (mostly New Zealand
based businesses and government departments) to solve their problems with data
processing, information analysis, decision making, and of course, agility with IS.
Such a client base offers abundant examples and opportunities for studying IS
Agility and finding common patterns and trends which make it possible to design an

133
analytical method that is applicable and useful for investigating and solving IS
Agility problems.
Following Schön’s theory on design as a reflective practice (Schön, 1983), I, the
researcher, have positioned myself as a reflective practitioner throughout the whole
research project. Actions and reflections were continuously interleaving with each
other during problem formulation, solution design and evaluation. Given the in-
depth theoretical synthesis and analysis I have completed in Chapter 2 and 3, it is in
fact inevitable and natural for me to apply the knowledge and insights gained from
my study into my day-to-day job and evaluate their relevance and usefulness to
practical problems and issues in the real-world.
This chapter explains and justifies the selection of the research design used in this
study. A research design should address research questions, philosophical
paradigms, methodological considerations regarding challenges and issues. The
following sections are to address these aspects and to provide justification and
practical guidelines.
This chapter is constructed as follows: first, the research problems and questions
are recapped (as they have been introduced in Chapter 1 already) and their
implications are discussed. Next the choices of philosophical paradigm and
methodological approach for this study are explained. Then the DSR approach is
reviewed and assessed as a scientific method for conducting academic research.
Finally, the strategies and techniques for designing and evaluating research
artefacts are articulated.
4.2 Problem formulation
Chapter 1 has already elaborated on the justification of choosing a DSR approach to
address the research problems motivating this study. This section provides more
details about how the problems were formulated at the first place.

134
Since 2008, I, as the researcher, also as an IS practitioner, have been working closely
with agile software development teams in different organisations in New Zealand. I
have developed a strong interest towards the concept “agility” in an IS context. I
studied the differences between agile software development projects and traditional
ones, and later published the results at the American Conference of Information
Systems in 2009 (Yang et al., 2009).
During my years of working with and within agile software development teams, I
have observed that the “agility” focus of these teams is consistently on delivering
new features and modifications on working software frequently and regularly.
These software development teams tend to believe agile methods (e.g. XP, Scrum)
make them agile in sensing and responding to changes in user requirements. This is
unsurprising as agile methods have been much popular in software engineering for
the past decade (Babb et al., 2014). Since the inception of Agile Alliance12, the word
“agility” has often been associated with “agile methods” by software practitioners
(illustrative of Agile System-Development in the IS Agility Pyramid).
However, in recent years I have worked more closely with IS users to solve their
issues and problems with IS implementations and operations. I have been able to
frequently conduct “reflection on action” and “reflection in action” (Schön, 1983)
during my problem investigations to study the discrepancies in problem definition
between IS users and developers. Particularly, I have seen IS Agility as a concept
being described as having different meanings to the two groups. For instance,
instead of receiving monthly new releases from IS developers demonstrating new
changes in technological components of the system (e.g. system reliability being
improved through bug fixing, system performance being enhanced via
infrastructure upgrade), IS users would rather focus on improving the business
components of the system in a way they could effectively and efficiently sense and
12 https://www.agilealliance.org/

135
respond to changes in the business environment. In fact, IS users tend to hope such
a “sensing and responding” cycle related to the business components of the IS could
go without intervention from IS developers or experts, as “getting the IT department
involved will mean extra time and complexity” – according to one business operation
manager from a New Zealand based energy company.
Therefore, my observation in the industry, as well as in the IS academia, is that
agility as a concept lacks a unified, clear, and workable conceptualisation that can
reconcile the view from IS developers with the view from IS users. This is
disturbingly counter-productive in both IS research and practice as merely forming
a common ground for the definition and measures of IS Agility can become a
struggle, especially for problem solving purposes.
In such a background, this study set to address the following research problems
(stated first in Chapter 1 but recapped below):
RP0. The lack of prescriptive and systematic methods for solving IS Agility issues.
This grand problem can be divided into two sub problems:
RP1. The lack of conceptual clarity and consistency of IS Agility as a notion.
RP2. The lack of prescriptive practice and method for designing IS Agility as a capability.
This study is concerned with how to systematically solve IS Agility related problems.
These problems are often difficult to articulate due to the ambiguity and obscurity
posed by the complexity of the messy concept of “IS Agility”. We can choose to either
just live with messy problems and work around them as black boxes, or face them
and thrive through innovations (Denning, 2007). This study takes the latter path.
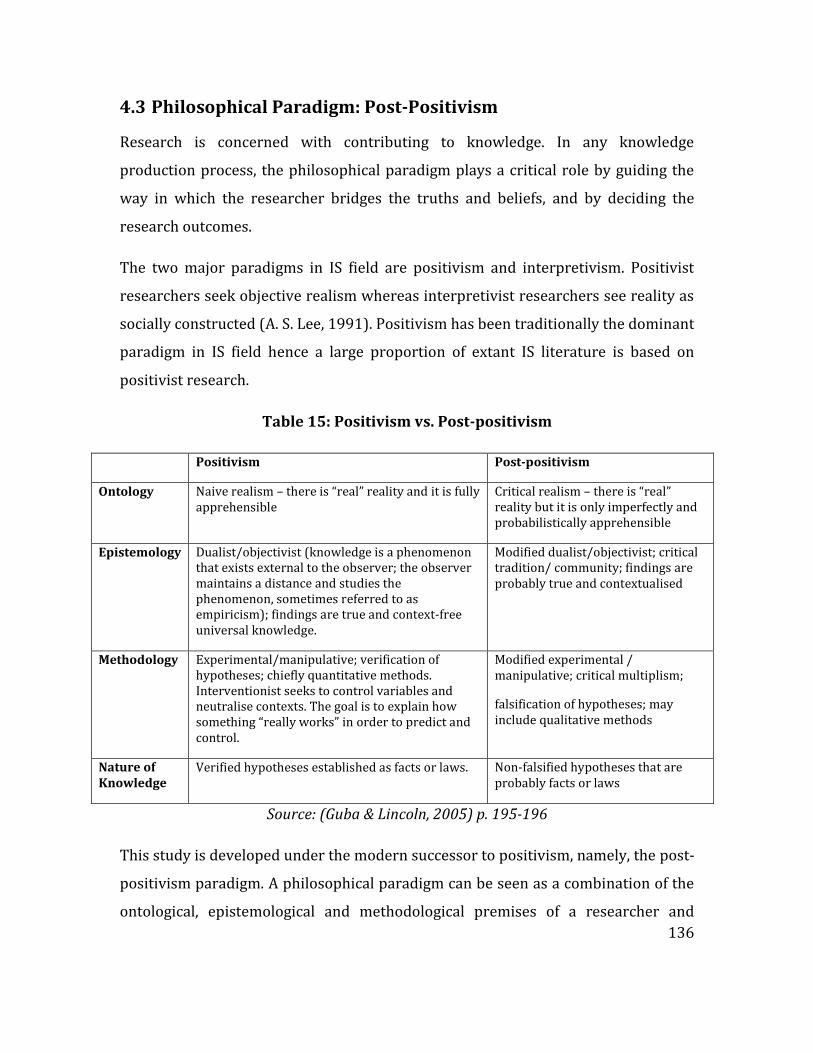
136
4.3 Philosophical Paradigm: Post-Positivism
Research is concerned with contributing to knowledge. In any knowledge
production process, the philosophical paradigm plays a critical role by guiding the
way in which the researcher bridges the truths and beliefs, and by deciding the
research outcomes.
The two major paradigms in IS field are positivism and interpretivism. Positivist
researchers seek objective realism whereas interpretivist researchers see reality as
socially constructed (A. S. Lee, 1991). Positivism has been traditionally the dominant
paradigm in IS field hence a large proportion of extant IS literature is based on
positivist research.
Table 15: Positivism vs. Post-positivism
Positivism Post-positivism
Ontology Naive realism – there is “real” reality and it is fully apprehensible
Critical realism – there is “real” reality but it is only imperfectly and probabilistically apprehensible
Epistemology Dualist/objectivist (knowledge is a phenomenon that exists external to the observer; the observer maintains a distance and studies the phenomenon, sometimes referred to as empiricism); findings are true and context-free universal knowledge.
Modified dualist/objectivist; critical tradition/ community; findings are probably true and contextualised
Methodology Experimental/manipulative; verification of hypotheses; chiefly quantitative methods. Interventionist seeks to control variables and neutralise contexts. The goal is to explain how something “really works” in order to predict and control.
Modified experimental / manipulative; critical multiplism;
falsification of hypotheses; may include qualitative methods
Nature of Knowledge
Verified hypotheses established as facts or laws. Non-falsified hypotheses that are probably facts or laws
Source: (Guba & Lincoln, 2005) p. 195-196
This study is developed under the modern successor to positivism, namely, the post-
positivism paradigm. A philosophical paradigm can be seen as a combination of the
ontological, epistemological and methodological premises of a researcher and

137
determine the research actions (Denzin & Lincoln, 2005). This section aims to
explain why post-positivism is better-suited to this study by analysing and
comparing positivism and post-positivism with regard to ontology, epistemology,
and methodology (as shown in Table 15).
4.3.1 The Ontological Dimension
Ontology refers to the assumption about what is reality and deals with the nature of
being (Guba & Lincoln, 2005). Positivists and post-positivists both believe that an
objective reality is “out there” independent of the researcher’s mind. Therefore the
researcher and the subject (the phenomena in the world that are their focus of the
research) are two separate, independent things. Both paradigms have an underlying
assumption that the research subject has inherent qualities existing independently
of the researcher (R. Weber, 2004).
The subtle ontological difference between these two paradigms lies in the
apprehensibility of reality. Positivists contend that the objective reality is fully
apprehensible and there is a unique, best description of any chosen aspect of the
phenomenon. Reality operates according to immutable natural laws that often take
the form of cause and effect. Under positivist paradigm, truth is defined as the set of
statements that accurately describe reality. With a belief that “if appropriate general
laws are known and relevant initial conditions are manipulable, we can produce a
desired state of affairs natural or social” (Wanda J. Orlikowski & Baroudi, 1991 ,p.11),
positivist studies often set off to seek for universal laws for prediction and control.
However the quest of universal laws and the disregard of contextual factors have
limited the problem-solving capability and development of positivist studies in the
social world where human behaviours are often not rational and predictable
(Wanda J. Orlikowski & Baroudi, 1991).
138
Post-positivists admit that the objective reality can never be fully apprehended
(Guba & Lincoln, 2005). Reality is merely apprehensible on a probabilistic basis and
contextual factors should be taken into consideration and critically assessed. Given
the same objective reality, individual researchers may observe it differently in
different contexts. This is especially the case in the social world. IS research and
practice can be largely influenced by contextual factors. For example, a same ERP
system with same implementation procedure may succeed in one organisation but
fail in another, owing to the differences in organisational structure, business
processes, IT capabilities, user expectations, level of uncertainties, and so forth.
Positivist approaches focusing on “discover unilateral causal relationships that are
the basis of generalised knowledge that can predict patterns of behaviour across
situations” (Wanda J. Orlikowski & Baroudi, 1991) tend to ignore contextual factors
and leave unexplainable gaps in the research findings. On the other hand, post-
positivists urge that research findings are contextual in nature and there is no
research outcome that can claim to be the absolute truth. Hence research efforts
help humans approach the reality closer, but not necessarily achieve it.
This study aims at advancing knowledge towards IS Agility and how it can be
generated in a certain technological context, i.e. Cloud Computing and SaaS. The
literature analysis and synthesis in Chapter 2 have enabled us to establish a
systematic and structured conceptual view of IS Agility (i.e. ISANN). However, the
pre-specified knowledge derived from the literature is neither seen as absolute
truth, nor adequate to cover the whole domain of the studied subject. Rather, such
knowledge is considered merely a summary of collective understandings produced
from previous research efforts done by us humans.
Taking a post-positivist stance is believed beneficial as it keeps the investigation
open for potentially new and influential contextual factors which help portray a
more complete picture of the phenomenon of interest. Moreover, post-positivism
also represents how the researcher appreciates knowledge acquired via IS research.

139
The majority of IS research is largely based on human perceptions and experiences
with technologies/systems hence should be treated as a “reflection of the absolute
truth” rather than the “absolute truth” itself.
4.3.2 The Epistemological Dimension
Epistemology refers to the assumption about how knowledge can be obtained, in
plain words, it is about the philosophy of how we humans come to know the world
(Creswell, 2009). The major difference between positivist and post-positivist lies in
the objectivity of the researcher. Positivist epistemology believes that a researcher
can be absolutely objective and put aside personal biases and beliefs and see the
world as it really is. A positivist research would often claim its description of the
reality as the absolute truth.
On the contrary, post-positivists reject the idea that ultimate objectivity and value-
free judgements can be achieved by any researcher. Therefore knowledge is
conjectural and there can be no absolute claims about truth (Creswell, 2009). This
view recognises that we humans are all biased and all of our observations are
affected by such biases. As a result, human knowledge is based on not
unchallengeable, rock-solid foundations, but rather upon human conjectures and
curiosities. Any research can only produce imperfect understanding towards the
reality owing to the cognitive limitations of humans and other influential factors
such as capabilities of instruments and fullness of datasets. Consequently, even top
scholars in “hard-science” fields such as Physics still have doubts regarding the
nature of modern science, that is, either scientific theories truly are “discoveries” or
merely “human inventions” (Von Foerster, 2003).
Furthermore, post-positivists argue that even though objectivity can never be
achieved perfectly, the best hope for approaching objectivity is to triangulate across
multiple fallible perspectives, which encourages researchers to criticise each other’s

140
work. Therefore, post-positivist in philosophy is also called critical realism. In IS
research which human subjects and artefacts are often involved, even in the best
case where the researcher can claim to be value-free and absolutely detached from
the phenomenon, the objectivity of the participants is yet no way to be guaranteed.
Taking a post-positivist stance, researchers can admit that the knowledge acquired
via studies is contextualised thus need not to make universal claims. Post-positivists
should stay critical to investigate the multiple facets of reality. In this study, the
literature reviewed, and artefacts developed are not context-free and would not
exist without “human inventions”. Such inventions are deeply contextualised (e.g.
ISANN would become meaningless and of no use if taken out of its original context
and placed into an environment having no reference to IT or IS), yet they help us
gain better understandings towards the phenomenon of interest.
4.3.3 The Methodological Dimension
Methodology deals with the practical process of research. The two major
methodological schools are quantitative approach and qualitative approach.
Quantitative approach originated in the field of natural sciences and was first used
to numerically study natural phenomena. Qualitative approach originated in the
social sciences and was developed to study social and cultural phenomena based on
non-numeric data (Myers, 1997).
Any research is based on some underlying assumptions about what methods are
valid and appropriate. Positivists aim to replicate the methods of natural science,
which was developed for analysing conditions and forces in the material world,
most often using quantitative methods. The prowess of quantitative approaches has
been well demonstrated all the way through the contemporary evolution of science
and technology. The dominance of quantitative approaches can be observed across a
wide range of scientific disciplines from conventional “hard science” (e.g. Physics,
141
Chemistry) to relatively recently established “soft science” (e.g. Management,
Sociology). However, post-positivist epistemology rejects that quantitative approach
should be the only choice especially when the social world is studied. This view has
led an increasing subscription to qualitative approach in social research which
makes the situation today is less “qualitative versus quantitative” and more how
research practices lie on a continuum between the two (Creswell, 2009, p.3-4).
Rather than commonly working in a deductive manner as their positivist
counterparts, post-positivist researchers utilise both deduction and induction in
their studies and embrace qualitative approaches as well as quantitative ones.
There is a common misunderstanding that qualitative approaches are always
related to interpretivism (Wanda J. Orlikowski & Baroudi, 1991). Guba and Lincoln
(2005) suggest that the underlying philosophical paradigm for qualitative research
can vary and is mainly dependent upon the philosophical assumptions of the
researcher. Therefore, it is not unreasonable for post-positivist studies to employ
qualitative methods.
In this post-positivist study, both qualitative and quantitative approaches have been
utilised. Qualitative techniques were adopted for formulating and investigating IS
Agility problems as well as designing solutions to solve the problems. Quantitative
techniques were used to measure the usefulness and effectiveness of the designed
solutions. Detailed applications of both approaches are reported in Chapter 5.
4.4 Design as a Scientific Research Method
4.4.1 Design? Science? Or both?
Although some may still debate whether design is an art or a science, scientific
design activities have been well observed and acknowledged for decades. At the
centre of any design endeavour lies a human-made so-called “artefact”. Design as an

142
artificial phenomenon is distinct from things occurring in the nature without human
intervention. A few hundred years ago, design effort was still considered more of an
art, not much of a science. Indeed, in most of the history of human civilisation, the
majority of visible work done by engineers was mostly associated with architectures
and objects that changes the surroundings of humans to improve aesthetical value
more than functional efficiency (e.g. temples and monuments from ancient times).
However, along with the advancement of technologies and industrialisation,
especially the dawn of modern computing starting from the 20th century, more and
more engineers have established their roles dealing with predominantly functional
efficiency and scientific theories. For instance, integrated chip engineers would
value interconnectivity, testability, controllability, and observability over aesthetic
characteristics of the chips being designed. In fact, to be able to design such
“artefacts”, engineers must first acquire extensive amount of scientific knowledge
and training which effectively presents a significant shift from the traditional “art”
view of design.
Today, artistic design and scientific design coexist and collaborate in many ways. On
classic example is the relationship between industrial design and design engineering
(Eder, 2011). According to Eder, the former focuses on the artistic elements,
appearance, ergonomics, customer appeal, and other observable properties.
Industrial engineers intend to produce “visually attractive and user-friendly”
artefacts following more intuitive design processes by defining the “envelope” first
and then working from the outside to inwards, meaning the internal constituents
and actions will need to bear the constrains set from the outside (Eder, 2011). The
engineering approach to design, on the other hand, focuses on functioning and
operation of artefacts, hence needs to be aware of the whole range of uses of an
artefact and their complex interactions. Engineers are particularly equipped with
scientific knowledge and processes in order to systematically create and test their
designs, optimise their methods and tools to improve efficiency and effectiveness, as
143
the artefacts they create should work and fulfil a purpose by helping to perform a
process (Eder, 2011).
Scientific design, as argued by Cross, should refer to “modern, industrialised design
– distinct from pre-industrial, craft-oriented design – based on scientific research
but utilising a mix of both intuitive and non-intuitive design methods” (Cross, 1993).
Therefore, in this thesis, we believe, when deciding if a design effort is more of an
art or more of a science, one may evaluate the “artefact” first. If the artefact being
designed requires mostly artistic appreciation and experience (e.g. garden
landscaping), then the designer in action would probably be recognised as “creative
artists”. On the other hand, if the artefact being designed demands largely scientific
knowledge and skills (e.g. unmanned spacecraft), then the designer involved would
likely be referred to as “scientific researchers”.
With the ever-increasing demand on the design of modern technologies,
undoubtedly more attention and investment have been given to “scientific” design
efforts. The first conference on Design Methods, held in London in 1962 was an
iconic event launching Design Science as an academic field of enquiry with a strong
focus on novel and scientific design methods (Cross, 1993). Soon after, design
method books and conferences were appearing at an unprecedented speed with
knowledge and experiences being shared frequently across previously separated
design disciplines such as architecture planning, mechanical engineering, software
development, and so on.
After the “scientifically designed” artefacts started being rapidly adopted in the
modern world, the term “Design Science” began to be recognised and accepted in
academic institutions worldwide. Cross pointed out that Design Science includes
“both process and product knowledge and theory thus refers to an explicitly
organised, rational and wholly systematic approach to design; not just utilisation of
scientific knowledge of artefacts, but design in some sense as a scientific activity
itself” (Cross, 1993). However, such a statement was considered controversial by
144
some, thus design researchers started to contemplate on the differences and
commonalities between the long-lasting conventional natural science and the new-
born fashionable design science.
To clarify the distinction between design science and natural science. Herbert A.
Simon, a Nobel Prize laureate and a Turing Award winner, one of the most cited
authors in design methods, has for long advocated design as “the science of the
artificial” which did not exist in the nature before being produced by humans. He
further explained the differences between design science and natural science, in
terms of the purpose of inquiry, are that the former deals with the “contingent” -
how things ought to be, whereas the latter deals with the “necessary” - how things
are (Simon, 1996). From a methodological point of view, Cross later added that the
critical distinction between the two is that method may be vital to natural science
due to the necessity of validating results, but not to design science as results may
not have to be repeatable (Cross, 1993).
At the same time, many have tried to articulate the common ground between design
science and natural science. Archer urged that both are essential ways for humans
to observe and structure the world (Archer, 1981). Levy later claimed that natural
science itself has been evolving and no longer means “a fixed methodology focused on
a specific view of the world” but more of “an expanded rationality for problem-
identifying, -structuring, and -solving activities” (Levy, 1985). Cross later commented
that Levy’s view suggested the indistinguishable characteristics between natural
science and design science which share “a complex recognition of the web of
interdependencies between knowledge, action and reflection” (Cross, 1993).
In fact, as observed by John R. Pierce in his book on Information Theory, many of the
most powerful scientific discoveries have derived “not through the study of
phenomena as they occur in nature”, instead, have arisen from studying phenomena
“in man-made devices…in products of technology” (Pierce, 2012)(p.19). An
explanation to such an observation is that human-made artefacts are “simplified and

145
ordered in comparison with those occurring naturally” (ibid.). For example, the
development of the general science of thermodynamics was driven heavily by the
creation of the steam engine which forms “phenomena involving heat, pressure,
vaporisation and condensation occur in a simple and orderly fashion” (ibid.).
Design Science, since its inception, has seen a strong drive from the engineering
design field. Unsurprisingly, engineering design researchers, specifically Hubka and
Eder, were the first to provide a definition of Design Science as “a collection of
logically connected knowledge in the area of design, and contains concepts of technical
information and of design methodology…addresses the problem of determining and
categorizing all regular phenomena of the systems to be designed, and of the design
process…concerned with deriving from the applied knowledge of the natural science
appropriate information in a form suitable for the engineer’s use” (Hubka & Eder,
1987).
Hubka and Eder (2012) further elaborated on four key categories of statements of
Design Science: Design knowledge about objects (systems), Design process knowledge
(e.g. Design methodology), Theory of technical systems, Theory of design processes. As
shown in Table 16 , these four were positioned in a quadrant with “Practice (branch,
domain) Knowledge” to “Theory” on the vertical axis, and “Object knowledge” and
“Process knowledge” at the horizontal axis. Although a more detailed version of this
quadrant was later refined to be specific on Engineering Design Science, we have
found the generic version shown in Table 16 more applicable to the present study
which is hosted in, not an engineering, but a business school.

146
Table 16: Map of Design Science
Practice (Branch, Domain) Knowledge
Prescriptive statements
O
bje
ct
Kn
ow
led
ge
Stat
emen
ts
abo
ut
tech
nic
al
ob
ject
s (s
yst
ems,
ar
tefa
cts)
Design knowledge about objects (systems)
Design process knowledge (e.g. Design methodology)
Pro
cess
K
no
wle
dg
e
Stat
emen
ts
abo
ut
the
des
ign
pro
cess
Theory of technical systems
Theory of design processes
Theories
Descriptive statements
Source: adapted from (Hubka & Eder, 2012)
The present study is deemed to bring salient understanding mostly towards the
Practice knowledge and Object Knowledge ends. In Chapter 2 and 3, we have brought
new depth in the practice knowledge of the IS Agility domain through the creation of
ISANN. In Chapter 5, we explore and explain the nature of another designed artefact,
namely, ISACAM, a first of its own kind method for analysing and solving IS Agility
problems. The creation and evaluation of this artefact will in turn contribute to the
object knowledge by promoting new insights into how IS Agility can be designed.
4.4.2 Design Science Research in IS Field
Since the inception of the IS field manifested by the first International Conference in
Information Systems (ICIS) in 1980, “Behaviour Science Research” has gained
dominance in IS schools and publication outlets. Early IS researchers, likely due to
the anxiety with the “new-born” status, were preoccupied with justifying and
proving IS as a “scientific” and “rigorous’ research discipline that should be
respected, recognised, and cited by other scientific communities. Such a
preoccupation, however, had resulted in an overly self-conscious attitude and
desperate attempts to establish IS as a quasi-natural science by mimicking
147
philosophies, methods, techniques, and presentation styles from hard sciences such
as Physics and Mathematics.
For a while, the legitimacy of the IS field was endangered by the lack of practical
relevance and guidance to practitioners as well as the weak contribution to other
neighbouring academic disciplines. One key reason being identified was that IS
researchers tended to focus much on the theoretical significance of the context
where IT artefacts are being used. Such IT artefacts are taken as granted and treated
as an separable item from their context with “discrete processing capabilities” thus
often disappear from view (Wanda J Orlikowski & Iacono, 2001). Excessively
focusing on the research context instead of the core matters (the IT artefacts),
makes IS studies hard to stand out and differentiate themselves from works
produced by researchers from other well-established business disciplines (e.g.
Management, Marketing, Accounting, Finance, etc.) who are interested in
understanding the broad impact of IT to their own fields and practices. Resultantly
the IS field has been suffering from a lack of respect and recognition from other
academic communities as well as setbacks when seeking funding for research.
Leading researchers in the IS field have warned there would be “nothing at the
centre” of the IS discipline due to much of the past research development being
focused on “intellectual periphery” drawing “intellectual capital” from outside the
field (Lyytinen & King, 2004). The centre of IS field, was supposed to be grounded
primarily in praxis, specifically on the human made, information intensive, “IT
artefacts”. However, earlier IS studies predominately treated the “IT artefacts” as
“black boxes” without looking inside (Iivari, 2007). The “IT artefacts” were often
conceptualised as a variable with its presence or absence being observed to test its
organisational, social, and or cultural impact (e.g. technology driven behavioural
changes) as well as to identify factors affecting its adoption and diffusion of
technologies. Numerous statistical IS studies have been published, with a common
practice treating “IT artefacts” as a primary independent variable, to assess the

148
dependant variables such as communication behaviour and effectiveness at
organisation, team, and individual levels. Nevertheless, the statistical studies and
findings have been often criticised for the lack of details on how theories/models
can be turned into implementation in real world practice.
Over 25 years ago, Nunamaker and the colleagues, in a JMIS (Journal of Management
Systems) essay, have already challenged the “black box” view towards IT artefacts in
the IS field. They urged “system development” should be accepted as a research
method to promote the focus on analysing, designing, and developing IT artefacts
(Nunamaker Jr, Chen, & Purdin, 1990), instead of focusing solely on the “intellectual
periphery”. Indeed, technologies are not equivalent to each other in terms of
capacities, capabilities, purposes, and behaviours. More importantly, technologies
are changing all the time, thus should not be treated as mysterious black boxes.
However, seeing little improvement but more diversion from the centre in IS
research, Hevner et al. (2004), in a thoughtful and highly influential MISQ
(Management of Information Systems Quarterly) article, urged the strong need for
Design Science Research (DSR) in the IS field and suggested a conceptual framework
for designing artefacts as a means of conducting scientific research towards the end
goal of efficient and effective management of information (Alan R. Hevner, March,
Park, & Ram, 2004). So far this article has been cited over 10,000 times (according
to Google Scholar). It has forcefully driven the DSR movement forward and resulted
in a series of developments including the first International Conference on Design
Science Research in Information Systems and Technology (DESRIST) in 2006.
Hevner et al. (2004) further argued the dominant “Behavioural Science Research”
should give space to DSR as these two should complement rather than compete
against each other. The former should provide “truth” to the latter in the form of
theories whereas the latter should offer “utility” to the former in the form of
artefacts. Such a complementary view has effectively eased the tension between the
two schools of thought. New generations of IS researchers started adopting a

149
pragmatic approach and focus on understanding and solving problems instead of
spending excessive amount of time debating with each other the academic
justification or philosophical stances of their research. After all, we human beings,
ought to learn to live and let live in the real world.
DSR has been gradually adopted in the IS field and helped us to restore our focus on
the “core”, namely, the human-made IT artefacts. Still, senior researchers are calling
for more DSR studies in the years beyond and deem that the IS field is no longer
modelling itself “on the research disciplines found in the natural and social sciences,
but instead charts a course for its future development by modelling itself on the
research disciplines found in the professions, such as medicine, engineering,
architecture., and law” (A. Lee, 2010).
The present study is a typical project based on the profession of IS development and
services. In such a profession, IS Agility issues have been frequently encountered
but often ill defined, partially understood, and roughly handled on an ad-hoc basis.
The processes, solutions and outcomes can vary greatly depending on the expertise
and experiences of the people assigned to solve the problems. With the artefacts
created in this study (e.g. ISACAM), however, we have introduced a high level of
theoretical clarity and structure which can systematically reduce the need for ad-
hoc practices. This in turn makes the investigation and problem-solving processes
more consistent, systematic, and effective.
4.4.3 Design as a Reflective Practice
Allen S. Lee’s proposition of modelling the IS field on the research disciplines found
in the more design-oriented professions (A. Lee, 2010), is significant and can be
traced back to the days when Design Science attempted to establish itself as an
academic discipline. Donald A. Schön has long been arguing that practitioners in
150
design professions, with systematic reflections, become researchers themselves
(Schön, 1983).
In Donald A. Schön’s classic book “The Reflective Practitioner: How Professionals
Think in Action” (Schön, 1983), design is articulated as a reflective practice meaning
professional engineers are consciously aware of their implicit knowledge base and
learn from their experiences. He explores the idea that we, as designers, tend to
know more than we can say thus often rely on “tacit knowledge” to make informed
guesses and act on hunches to solve problems. Therefore design practice "triggers
awareness of new criteria for design: problem solving triggers problem setting."
(Schön, 1988)
Schön defines the key notion in his book: reflection in action which refers
to reflecting while performing an action as a way to optimise the immediately
subsequent actions. He believes that when a practitioner starts to reflect-in-action,
he/she then becomes a researcher in a practice context. Such a researcher will
adjust his/her actions according to iterative reflections which in turn create a
mental “ladder of reflections”, namely, action is followed by reflection and every
reflection is followed by action. In such a ladder, the outcomes of reflections can also
become the sources for further reflections (Schön, 1983).
Furthermore, Schön argues that design, as a “reflection in action”, occurs naturally
when engineers are handling a “situation of uncertainty, instability, uniqueness and
value conflict” and trying to change the situation to a preferred state. He suggests
“reflection in action hinges on the experience of surprise” (p.56) meaning reflections
occur mostly when our actions do not yield results as expected in a way that
surprises us (Schön, 1983)
An engineer may stop reflecting when he/she becomes too acquainted with a
particular field of expertise, in other words, “over-learned”. An over-learned
engineer, can become narrow-minded and rigid with a set of own theories-in-action
151
- which Schön referred to as “knowing-in-action” - based on previous experiences.
The engineer will find his/her own practice to become increasingly repetitive and
routine. This way his/her knowing-in-action will turn into a tacit and spontaneous
form. The engineer, may develop a symptom that is “selectively inattentive to
phenomena that do not fit the categories of his/her knowing in action” which in turn
can result in boredom and burn-out (Schön, 1983).
According to Schön, consciously practice reflection-in-action can correct the negative
consequences of becoming “over-learned” and help us to “surface and criticise the
tacit understanding that have grown up around the repetitive experiences of a
specialised practice, and can make new sense of the situations of uncertainty or
uniqueness which he/she may allow him/herself to experience” (Schön, 1983) (p.61).
In this study, I have carried dual identities throughout the journey. One is the IS
practitioner specialised in designing Business Intelligence solutions. The other one
is the Design Science researcher interested in learning how to solve real-world IS
Agility problems. The practitioner, as informed by Schön, has been fully aware of his
reflection-in-action and made great use of it in his daily practice with clients and
colleagues while solving IS-related problems. Such reflection-in-action, has
informed the other identity, namely the Design Science researcher, to map a
theoretically grounded academic artefact (i.e. ISANN) into a practically relevant
method (i.e. ISACAM) for improved understanding and solution design (i.e. for
investigating and solving IS Agility problems).
Comprehension of the role of a reflective practitioner in research setting has
naturally led to reflective analysis on the design activities and outcomes. Reflective
analysis has been used in innovative design studies as a means for evaluation
(Antunes, Simes, & Pino, 2013). Because innovative artefacts at the early
development stage may have to be continuously assessed by the experts who
designed the artefacts at the first place. Due to the salient nature of innovative
artefacts, often non-experts or the general public cannot fully apprehend and

152
appreciate the value and the problems such artefacts can solve. Not to mention
there would be no comparable artefact to benchmark against. In this study,
adjustments and improvements were then made based on reflections and feedback
gained through real-world applications of the artefact (e.g. ISACAM). Such
reflections are also considered a type of formative evaluation in this study which is
discussed in Section 4.5.3.
4.5 Artefacts Design and Evaluation
4.5.1 The DSR Strategy and Process
Methodologists in the IS field, when prescribing methodological guidance for DSR,
tend to confine themselves at an abstract level without elaborating on the detailed
design and evaluation activities. This makes a stark contrast to the circumstantial
and specific prescription given to Behavioural Science Research (Alturki, Gable, &
Bandara, 2011) which often gets explained at a low level of granularity, for instance,
interviewing techniques (Myers & Newman, 2007), survey development
(Pinsonneault & Kraemer, 1993), and the overall qualitative research method
(Myers, 1997). A general consensus is that to conduct DSR, one needs to go through
certain generic stages listed below (Timothy J Ellis & Levy, 2010; A. Hevner &
Chatterjee, 2010; Peffers, Tuunanen, Rothenberger, & Chatterjee, 2007):
Identify Problem Define Objective Design and Development Test and Evaluation Communication
These stage-based research processes have been frequently referred to by Design
Science researchers as the basic steps to follow when conducting DSR in the IS field.
Table 17 below provides a summary of previous studies iterating on these steps,

153
either partially or fully, in the hope of establishing rigour and discipline in the
conduct and execution of DSR.
Table 17: Commonly Prescribed DSR processes
Generic DSR Activities
Identify Problem
Define Objective
Design and Development
Test and Evaluation
Communication
(Nunamaker Jr et al., 1990)
Construct a conceptual framework
Develop system architecture & Analyse , design, and build system
Experiment, Observe, and evaluate the system
(Walls, Widmeyer, & El Sawy, 1992)
Meta requirement & Kernel theories
Build Evaluate
(March & Smith, 1995)
Build Evaluate
(Alan R. Hevner et al., 2004)
Identify relevant problems
Design as a search process
Design evaluation
Communication of research
(Peffers et al., 2007)
Problem identification and motivation
Define the objectives of a solution
Design and development
Demonstration
Evaluation
Communication
(Kuechler & Vaishnavi, 2008)
Awareness of problem
Suggestion Development Evaluation Conclusion
(Offermann, Levina, Schnherr, & Bub, 2009)
Identify problem, Literature research,
Expert Interviews, Pre-evaluate relevance
Design artefact
Literature research
Refine hypothesis, Expert survey, Laboratory experiment, Case study/action research,
Summarise results
(Timothy J Ellis & Levy, 2010)
Identify the problem & Describe the objectives
Design & Develop the artefact
Test the artefact & Evaluate testing results
Communicate the testing results
(A. Hevner & Chatterjee, 2010) p.28-30
Problem identification and motivation
Define the objectives for a solution
Design and Development
Demonstration
Evaluation
Communication

154
These five steps, essentially are strategic-level guidelines with limited operational-
level instructions. Repetitively prescribing high level abstract view of DSR is a
manifestation of a pragmatic approach emphasising ends over means. Such an
emphasis has both benefits and risks. One key benefit is that researchers following
these guidelines will have room to improvise with their imagination and be creative.
This is reasonable given the enormous diversity of topics being studied in the IS
field, DSR in IS may result in artefacts that are drastically distinct in nature, e.g. from
software applications, to organisational policies. On the other hand, the missing of
finer level guidelines will risk reproducibility and reliability of the design process as
well as the resulting artefacts. Every researcher can have his/her own preferred,
maybe even unique approaches to design and develop artefacts while others may
not be able to comprehend and duplicate.
Discontented by the lack of specification in those high-level guidelines, a group of
researchers from QUT (Queensland University of Technology), after reviewing and
analysing some 60 DSR articles, “distilled” key activities/steps/tasks involved in
DSR and synthesised fourteen finer processes in a model called the “Overall DSR
roadmap”. The roadmap was published at the DESRIST 2011 conference (Alturki et
al., 2011) and is a considerable improvement from previous DSR guidelines in terms
of practical clarity.
1. Document the spark of an idea/problem 2. Investigate and evaluate the importance of the problem idea 3. Evaluate the new solution feasibility 4. Define research scope 5. Resolve whether within the Design Science paradigm 6. Establish type (IS design sciences vs. IS design research) 7. Resolve theme (Construction, Evaluation, or both) 8. Define requirements 9. Define alternative solutions 10. Explorer knowledge base support of alternatives 11. Prepare for design and/or evaluation 12. Develop (construction) 13. Evaluate: “Artificial “Evaluation 14. Evaluate: “Naturalistic“ Evaluation

155
This roadmap introduced considerations regarding feasibility, scope,
methodological fit of the research problem to DSR, requirements, and alternative
solutions (Alturki et al., 2011). The authors, citing March and Smith’s work, stated
that “acceptable research need not extend to evaluation if the design solution is
particularly novel.” (Alturki et al., 2011; March & Smith, 1995). They further argue
that both construction research and evaluation research should be promoted but
such a separation is a key decision to be made as evaluation often require “different
expertise and entail substantial resources” (Alturki et al., 2011).
Nonetheless, similar to those previous guidelines listed in Table 17, this roadmap
still remains silent on how artefacts should be designed, what design decisions
should be made, and which techniques should be used. The design and
development phase is yet unclear and abstracted which leaves much tolerance to
deviation and improvisation. The underlying assumption seems to be that
researchers will determine design processes and techniques during the
development process in accordance with the research problems and objectives.
Such an assumption may be right but only to a certain degree when the artefacts
being designed are drastically different from each other thus design decisions
would/should be different.
After reviewing these DSR guidelines offered in the IS literature, we concluded that
they are mostly useful for strategic level research decisions rather than operational
level instructions. Therefore, following the “Three Cycles” tradition established by
Hevner and his colleagues (A. Hevner & Chatterjee, 2010; Alan R Hevner, 2007; Alan
R. Hevner et al., 2004), we mapped out the strategic framework of the present DSR
study in Figure 11 below.

156
Figure 11 A Strategic Framework of the Present DSR
Adapted from: (Alan R Hevner, 2007; Alan R. Hevner et al., 2004)
Firstly, in the Relevance Cycle, we acknowledge the environment of the present
study as contextualised particularly by the need for IS Agility. Without such a need
this study would not be relevant or justifiable. At the centre of this environment are
the sociotechnical systems to be investigated. The whole concept of IS Agility is built
upon such systems involving both machine-focused technical component and
human-focused business components. A purely technical system, such as a C++
compiler, would have little relevance to our conceptualisation of IS Agility. Next we
identify the SaaS providers and adopters as key agents interacting in this
environment. Such a feature is not necessarily a unique attribute of IS Agility studies,
but it is a convenient enabler to the current study. With access to the intensive
interactions between SaaS providers and adopters in the real world, it is much
easier to find and engage with IS Agility issues associated with the same
sociotechnical system. This way the environment is more controlled because all
157
adopters are sharing the same SaaS system. Such an arrangement helps us reduce
the complication of having to compare IS Agility issues with system ABC and those
with system XYZ. We can then focus on investigating the nature of the problems (e.g.
Dev Agility Cycle having low torque vs. high friction) rather than the different
features and functionalities of the systems.
Secondly, in the Rigour Cycle, as shown in Figure 11 above, we recognise the
knowledge base of this study should provide the “Kernel Theory” about IS Agility as
a specialisation of a more generic concept of Agility. This is done in Chapter 2
through reviewing and synthesising concepts and models from a broad range of
literature across multiple disciplines. The result of such an exercise is the first
artefact developed, namely, ISANN. Next we searched the knowledge base for
exemplar DSR studies published on key IS journals such as (Abbasi, Albrecht, Vance,
& Hansen, 2012; Markus, Majchrzak, & Gasser, 2002) to gain inspirations and
practical guidance. Furthermore, we also drew upon the knowledge base of design
engineering (Takeda, Veerkamp, & Yoshikawa, 1990) and analytical modelling
(Kimball & Ross, 2013) (Diaper & Stanton, 2003) to choose theories and techniques
that can facilitate the design and development of our artefacts.
Last but not the least, in the Design Cycle, artefacts (e.g. ISACAM) are developed and
tested using mixed styles and techniques. This is done through iteratively drawing
upon the knowledge base for guidance and inspirations, applying knowledge-driven
designs in the DSR environment, reflecting on the efficacy of such applications, and
improving the designs for better outcomes. Reflection in/on action techniques are
used to assess and learn from the experiences. New knowledge being generated is
then added back to the knowledge base (e.g. through peer-reviewed publications).
More details about the Design Cycle are discussed in the following sections.
158
4.5.2 The Choice of Design Methods
Our goal in the Design Cycle, is to develop a systematic method for solving IS Agility
problems. We have consulted the knowledge base and created ISANN - a unified
conceptualisation of IS Agility. We plan to use ISANN as a conceptual framework to
construct the problem space and scope the initial elements needed for the method
being designed (i.e. ISACAM).
Moreover, to develop a problem-solving method, we need to explicitly identify what
are the key requirements for “problem solving”. In mathematical terms, problem
solving fundamentally involves “operations” on “numbers” (Schoenfeld, 2014). Of
course, the sequence and combination of operations need to be correct in order to
solve a problem. However, IS Agility problems are sociotechnical in nature thus we
do not expect solutions to be generated purely by using quantitative methods. For
this reason, we decide to use “task and data” instead of “operation and number” to
represent the key requirements underpinning our problem solving method. Such a
choice allows not just quantitative approaches but also qualitative ones. Similar to
mathematical problem solving, the right sequence and combination of tasks are
important to success.
Next, we need to find a reliable approach to map ISANN into a “task and data” driven
problem-solving method. As mentioned previously, the IS literature tends to offer
generic guidelines and stay at an abstract level regarding how the Design Cycle
should be executed. Leaving too much unspecified at design and development phase
may risk the reproducibility and reliability of the design processes and the resulting
artefacts. Researchers may be allowed to use their creativity and imagination but
can also make immature or improvised design decisions based on intuition. This can
present a deviation from the intended scientific research/design approach and a
shift more towards an artistic design practice.
To mitigate these risks, we decided to look for support from a broader knowledge
base kept by other reference disciplines with strong design culture such as
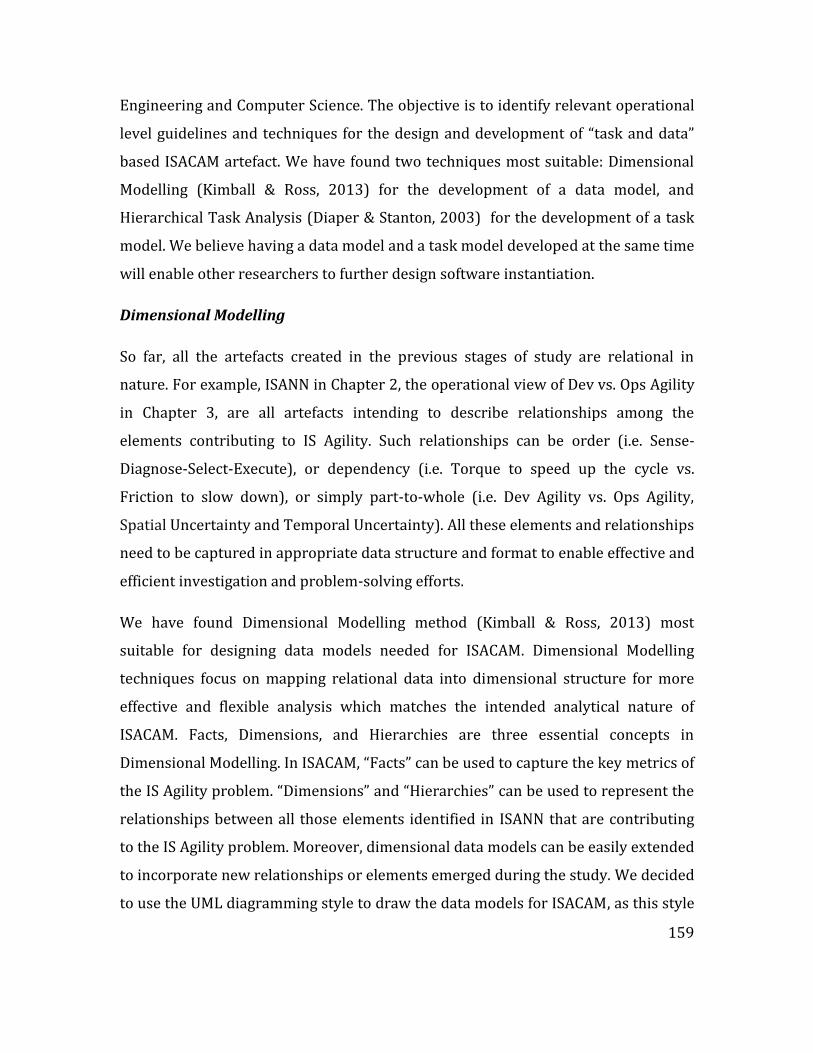
159
Engineering and Computer Science. The objective is to identify relevant operational
level guidelines and techniques for the design and development of “task and data”
based ISACAM artefact. We have found two techniques most suitable: Dimensional
Modelling (Kimball & Ross, 2013) for the development of a data model, and
Hierarchical Task Analysis (Diaper & Stanton, 2003) for the development of a task
model. We believe having a data model and a task model developed at the same time
will enable other researchers to further design software instantiation.
Dimensional Modelling
So far, all the artefacts created in the previous stages of study are relational in
nature. For example, ISANN in Chapter 2, the operational view of Dev vs. Ops Agility
in Chapter 3, are all artefacts intending to describe relationships among the
elements contributing to IS Agility. Such relationships can be order (i.e. Sense-
Diagnose-Select-Execute), or dependency (i.e. Torque to speed up the cycle vs.
Friction to slow down), or simply part-to-whole (i.e. Dev Agility vs. Ops Agility,
Spatial Uncertainty and Temporal Uncertainty). All these elements and relationships
need to be captured in appropriate data structure and format to enable effective and
efficient investigation and problem-solving efforts.
We have found Dimensional Modelling method (Kimball & Ross, 2013) most
suitable for designing data models needed for ISACAM. Dimensional Modelling
techniques focus on mapping relational data into dimensional structure for more
effective and flexible analysis which matches the intended analytical nature of
ISACAM. Facts, Dimensions, and Hierarchies are three essential concepts in
Dimensional Modelling. In ISACAM, “Facts” can be used to capture the key metrics of
the IS Agility problem. “Dimensions” and “Hierarchies” can be used to represent the
relationships between all those elements identified in ISANN that are contributing
to the IS Agility problem. Moreover, dimensional data models can be easily extended
to incorporate new relationships or elements emerged during the study. We decided
to use the UML diagramming style to draw the data models for ISACAM, as this style

160
has been widely accepted as a standard approach for modelling IS artefacts, data
models, logic sequence, programming units such as classes, and so on (Booch, 2005).
A series of dimensional models are presented in the next chapter illustrating the
evolution of ISACAM.
Hierarchical Task Analysis
ISACAM is to be used for investigating and solving IS Agility problems. Such a
method should prescribe certain tasks and activities in the right sequence for users
to follow. This way ISACAM can minimise ad-hoc processes and make the
investigation and problem-solving exercise systematic, consistent and rigorous.
Given the already ambiguous nature of IS Agility and the absence of an established
method to solve IS Agility problems, it is critical to provide step-by-step instructions
to ISACAM users to ensure all key aspects, elements, and relationships of IS Agility
are considered and analysed so that optimised solution can be generated.
We have found Hierarchical Task Analysis (HTA) (Diaper & Stanton, 2003) a
powerful method for developing the procedure of ISACAM. HTA is based on the
theory of human performance and often being used in HCI (Human Computer
Interaction) studies. It was originally built for decomposing and studying individual
elements of a task. HTA offers a great way of depicting a system containing goals
and sub-goals with feedback loops in a nested hierarchy. Investigating IS Agility
problems involves tasks and goals that can break down into multiple hierarchies of
subunits. HTA offers versatile and flexible techniques for capturing how tasks are
performed in a systematic and structured manner. It can be used to describe both
human tasks and system tasks (Diaper & Stanton, 2003). All these features of HTA
make it an excellent candidate for developing the task model of ISACAM. The next
chapter will present a series of HTA based task models to demonstrate the
development of ISACAM.

161
Technological Rules
Clearly the notion “task and data” was inspired by the “operation and number” style
of problem solving in mathematics. We call such type of problem solving “systematic”
as it must have a set of rules established in advance and apply them strictly through
the problem-solving tasks. Mathematical problem solving heavily relies on existing
theorems. Such theorems are widely tested and accepted for us to follow and
rationally apply on new problems in new settings.
Besides this “systematic” style of problem solving, the other style - we call it
“intuitive” - is more common in real life. When no strict rules or principles are
established, one has to begin investigating the problem at hand based on his/her
own life experience and intuition to discover clues and patterns that are perceived
reliable enough to further the reasoning process. An example of such an approach
being used is when a new manager is trying to resolve undesirable, counter-
productive office politics.
The creation of ISACAM is essentially trying to trigger a shift from the traditional
“intuitive” ad-hoc way of solving IS Agility problems to a rule-driven, theoretically
grounded, “systematic” way. To generate successful solutions using the “intuitive”
way may require high level of expertise and experiences from the problem solver.
However, following a “systematic” method with prescribed rules, we believe even
novice problem solvers can produce effective solutions.
The rules we produce in this study are called “technological rules”. Technological
rules are important products of DSR. A technological rule is defined as “a chunk of
general knowledge, linking an intervention or artefact with a desired outcome or
performance in a certain field of application” (Aken, 2004) (p.228). To solve the
“serious utilisation problem” faced by business research, more prescription-driven
research should be conducted with the aim to produce technological rules with
highly practical relevance (Aken, 2004).

162
Table 18 below provides a summary of the key components of ISACAM discussed
above.
Table 18: Key Components of ISACAM and Design Methods used
Data Model Task Model Technological Rules
Pu
rpo
se
To ensure critical data is captured for investigating and solving IS Agility problems
To establish a consistent and repeatable procedure for investigating and solving IS Agility problems
To provide guidance for ISACAM users to judge and decide solutions
Re
qu
ire
me
nts
The model needs to capture all attributes and relationships identified in ISANN and have the extensibility to incorporate new ones emerged during the study.
The model needs to provide step-by-step instructions and prescribe what need to be done to systematically investigate and solve IS Agility problems
The rules need to be generic enough for ISACAM users to apply in their specific contexts
Na
ture
Definition of data structure Sequence of activities Chain of judgements
De
sig
n
me
tho
d UML, Dimensional
Modelling Hierarchical Task Analysis
IF-THEN rule specification
Prior to this study, no technological rules were found guiding our investigation of IS
Agility problems. Such an absence of systematic problem solving was one of the
study motivations. Given the novelty of the IS Agility problem-solving method (i.e.
ISACAM) being developed in this study, we expected that a full set of rules will not
be formulated at the beginning of the journey. During the Design Cycle of ISACAM
through applying it on real-world problems, several technological rules have been
observed and tested which are presented in the next chapter. Technological rules
should not be a specific prescription to a specific situation, rather, it should be a
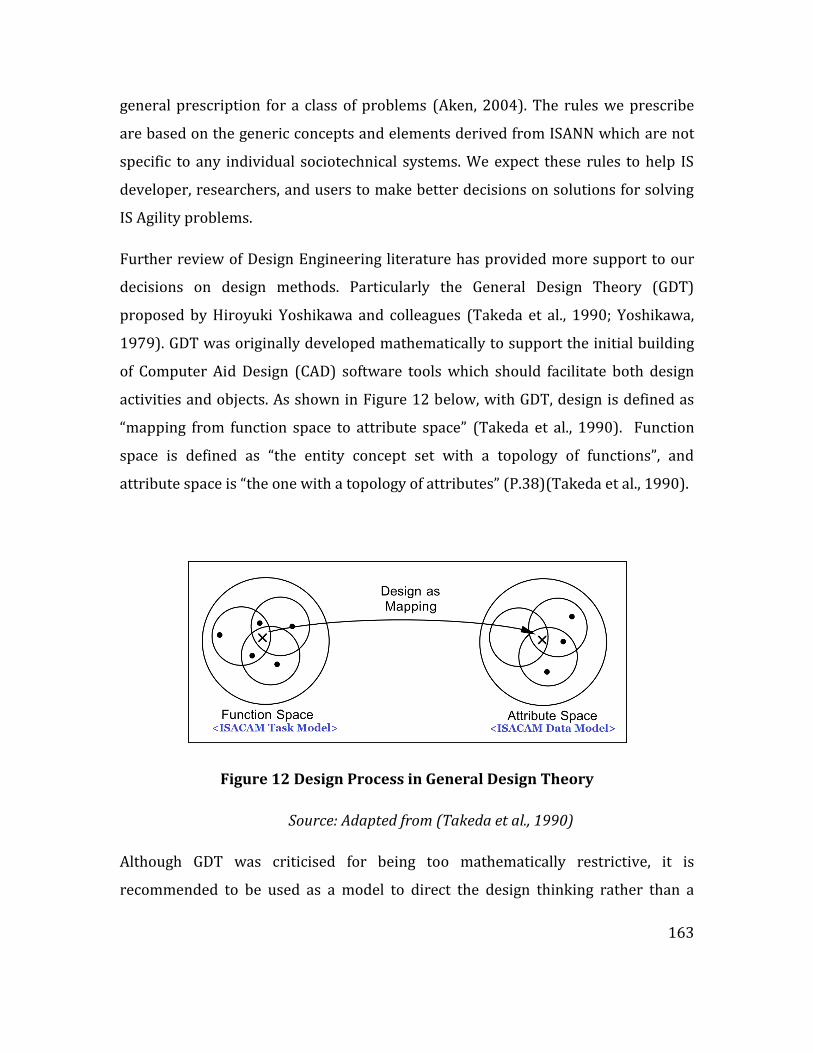
163
general prescription for a class of problems (Aken, 2004). The rules we prescribe
are based on the generic concepts and elements derived from ISANN which are not
specific to any individual sociotechnical systems. We expect these rules to help IS
developer, researchers, and users to make better decisions on solutions for solving
IS Agility problems.
Further review of Design Engineering literature has provided more support to our
decisions on design methods. Particularly the General Design Theory (GDT)
proposed by Hiroyuki Yoshikawa and colleagues (Takeda et al., 1990; Yoshikawa,
1979). GDT was originally developed mathematically to support the initial building
of Computer Aid Design (CAD) software tools which should facilitate both design
activities and objects. As shown in Figure 12 below, with GDT, design is defined as
“mapping from function space to attribute space” (Takeda et al., 1990). Function
space is defined as “the entity concept set with a topology of functions”, and
attribute space is “the one with a topology of attributes” (P.38)(Takeda et al., 1990).
Figure 12 Design Process in General Design Theory
Source: Adapted from (Takeda et al., 1990)
Although GDT was criticised for being too mathematically restrictive, it is
recommended to be used as a model to direct the design thinking rather than a

164
precise guideline for design creations (Reich, 1995). Thinking design as a mapping
exercise from functionalities to attributes is a useful tactic and aligns with our
decisions on developing a task model (containing functions needed to perform
ISACAM) and a data model (containing attributes captured and analysed for
generating solutions) simultaneously for ISACAM. We can iteratively map the
emerging tasks needed to solve IS Agility problems into the data model of ISACAM
until no more new tasks can be identified. Moreover, GDT prescribes that function
space and attribute space are built on the same entity concept set (Takeda et al.,
1990)(p.39). This is exactly how our task and data model are built as both are
derived from ISANN thus share the same set of entity concepts.
4.5.3 The Choice of Evaluation Methods
Contradicting opinions can be observed in the DSR literature regarding the
necessity of evaluation. Such contradiction can be found among different
researchers. For instance, in a MISQ paper, Hevner et al. (2004) stated “evaluation is
a crucial component of the research process” (p.85), whereas some other researchers
suggest that “acceptable research need not extend to evaluation if the design solution
is particularly novel.” (Alturki et al., 2011; March & Smith, 1995). The contraction
can even be observed in the same article of the same authors. For example, Hevner
et al. (2004), on page 97, while assessing another DSR study done by (Markus et al.,
2002), noted “no formal evaluation was attempted in the sense of comparison with
other artefacts. This is not surprising, nor is it a criticism of this work. There simply are
no existing artefacts that address the same problem.”
I was baffled at the beginning by such contradicting statements but soon realised
they can be reconciled if I dug deeper into the next level of granularity regarding the
concept “evaluation”. I have found the FEDS (Framework for Evaluation in Design
Science) published on the EJIS (European Journal of Information Systems)
particularly helpful (Venable, Pries-Heje, & Baskerville, 2016). As shown in Figure
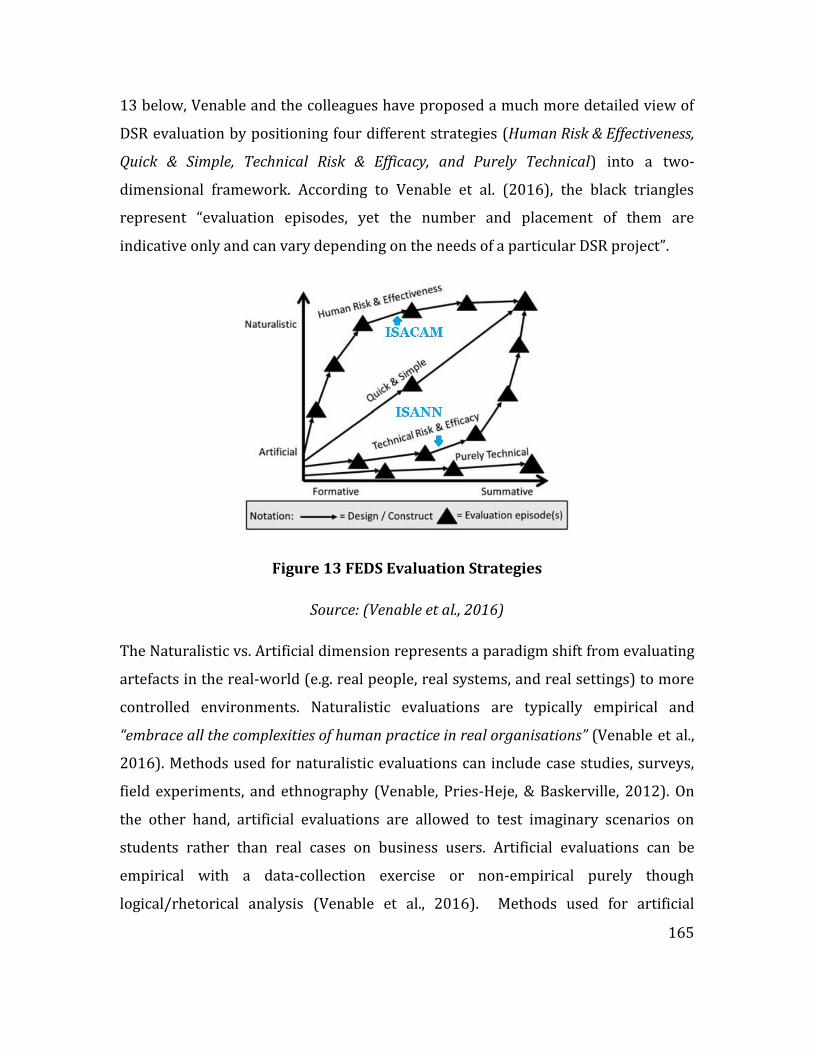
165
13 below, Venable and the colleagues have proposed a much more detailed view of
DSR evaluation by positioning four different strategies (Human Risk & Effectiveness,
Quick & Simple, Technical Risk & Efficacy, and Purely Technical) into a two-
dimensional framework. According to Venable et al. (2016), the black triangles
represent “evaluation episodes, yet the number and placement of them are
indicative only and can vary depending on the needs of a particular DSR project”.
Figure 13 FEDS Evaluation Strategies
Source: (Venable et al., 2016)
The Naturalistic vs. Artificial dimension represents a paradigm shift from evaluating
artefacts in the real-world (e.g. real people, real systems, and real settings) to more
controlled environments. Naturalistic evaluations are typically empirical and
“embrace all the complexities of human practice in real organisations” (Venable et al.,
2016). Methods used for naturalistic evaluations can include case studies, surveys,
field experiments, and ethnography (Venable, Pries-Heje, & Baskerville, 2012). On
the other hand, artificial evaluations are allowed to test imaginary scenarios on
students rather than real cases on business users. Artificial evaluations can be
empirical with a data-collection exercise or non-empirical purely though
logical/rhetorical analysis (Venable et al., 2016). Methods used for artificial

166
evaluations can include laboratory experiments, simulations, criteria-based analysis,
theoretical arguments, and mathematical proofs (Venable et al., 2012).
The Formative vs. Summative dimension represents a transition in “functional
purposes” of DSR evaluations. This dimension of evaluation was originated in
education programmes but later brought into the IS literature by Dan Remenyi and
Michael Sherwood-Smith (Remenyi & Sherwood-Smith, 1999). The differences
between summative and formative evaluations are subtler. Venable et al. argued
that “the distinction does not arise in the innate qualities of the evaluation process, but
rather inhabits the functional purpose of the evaluation” (Venable et al., 2016).
The purpose of formative evaluations is to improve the evaluand (the artefact being
evaluated) thus such evaluations can and should be applied multiple times in a DSR
study to encourage continuous improvements of the design (Venable et al., 2016). In
fact, Remenyi and Sherwood-Smith (1999) argued that formative evaluations are
inherently part of the artefact design and analysis processes, even though such
evaluations are often not articulated. On the contrary, the purpose of summative
evaluations is to decide if the evaluand is the right choice for certain applications.
Therefore such evaluations, if needed, would most often take place at the end of a
project (Venable et al., 2016). In other words, we consider formative evaluations are
developmental in nature, whereas summative evaluations are more judgemental.
The FEDS brings greater insights into the nature and purpose of DSR evaluation. It
helps us reconcile the seemingly contradicting opinions listed at the beginning of
this section. We can now see that the contradiction and confusion were caused by
the lack of specification in those statements. For instance, when Hevner et al. (2004)
first stated “evaluation is crucial components of the research process” and later
assessed the DSR study done by Markus et al. (2002) as “no formal evaluation was
attempted…this is not…a criticism”, they would not appear contradicting if more
specific characteristics of evaluations were provided. According to Remenyi and
Sherwood-Smith (1999), formative evaluations are not only crucial, but an integral
167
part of IS artefact design and analysis. We believe that a designer simply cannot
improve her designed artefacts without some form of formative evaluations. In fact,
Markus et al. (2002) did evaluated their DSR artefact “TOP Modeler” in a naturalistic
and formative fashion. They just didn’t organise summative evaluation at the end of
the project, which was noted by Hevner et al. (2004) as “no formal evaluation”.
However, Markus et al. (2002) called for future research to accumulate empirical
evidence to establish the validity of their generalizability argument.
In the same vein, if specific characteristics are being assigned to the word
“evaluation”, the statements by other researchers such as “acceptable research need
not extend to evaluation if the design solution is particularly novel.” (Alturki et al.,
2011; March & Smith, 1995) may not appear contradicting to Hevner et al. (2004) in
terms of the importance of “formative evolution” and their tolerance to the absence
of formal “summative evaluation”. Alturki et al. (2011) in their DSR roadmap argued
that a DSR study can follow a construction-focused theme without formal evaluation
or evaluation-focused theme without formal construction of artefacts. However,
again these authors didn’t differentiate the types of evaluations13. Therefore, our
interpretation to both Hevner et al. (2004) and Alturki et al. (2011), based on FEDS,
is that formative evaluation is a necessity and inherently part of the design process,
while summative evaluation may not be necessary if a designed artefact is novel or
first of its own kind.
Both ISANN and ISACAM developed in this study are novel artefacts hence formative
evaluations are considered sufficient. The strategies prescribed by FEDS also
suggest the same choice on the “functional purpose” dimension as our evaluations is
developmental, not judgemental. However, ISANN and ISACAM have different
design/evaluation goals thus need different treatments. The evaluation of ISANN
13 The same authors in a later publication have started differentiating formative evaluations from summative ones (Alturki, Gable, & Bandara, 2013) .

168
should focus on the efficacy of this conceptual framework with regard to describing
and decomposing IS Agility phenomena (demonstrated in Chapter 2 and 3 through
illustrative scenarios and descriptive analysis). The evaluation of ISACAM should
aim to assess its effectiveness in investigating and solving IS Agility problems
(demonstrated in Chapter 5 through a series of design/evaluation episodes).
According to FEDS, as shown in Figure 13, for ISACAM we should take the Human
Risks & Effectiveness strategy as the critical goal of the evaluation is to establish that
“the utility/benefit will continue in real situation and over the long run” (Venable et
al., 2016). Not to mention it is not costly to evaluate ISACAM with real problems as
my day job was about solving problems for our SaaS adopters. Therefore, a
Naturalistic & Formative evaluation approach is justifiable and affordable.
On the other hand, for ISANN we should take the Technical Risk & Efficacy strategy,
as illustrated in Figure 13. Unlike ISACAM, ISANN was not built to solve real-world
problems thus naturalistic evaluations are unjustifiable. Rather, the creation of
ISANN is to help structuring our study and analysis of IS Agility. As such,
demonstrating the structure and clarity provided by ISANN through illustrative
scenarios, publishing ISANN-based structured analysis in academic outlets for
feedback (Yang et al., 2016) (Yang et al., 2013), are considered sufficient as Artificial
& Formative evaluations.
The formative evaluations demonstrated in this study are “goal-seeking” in nature,
namely, to assess if the designed artefacts have achieved the design goals. Goal
based artefact evaluation is still the first choice among DSR researchers. Prat et al.
(2015) conducted a methodological analysis on 121 DSR papers published in eight
key IS journals within the “AIS Senior Scholars basket” (including MISQ, EJIS, ISJ, ISR,
JIT, JMIS, JSIS, JAIS) from 2004 to 2014. They have found that over 80% of these DSR
studies have used goal based criteria for the evaluation of artefacts (Prat, Comyn-
Wattiau, & Akoka, 2015).

169
Following the same tradition recommended by Prat et al. (2015), we have chosen
efficacy as the criterion for artificial evaluations and effectiveness for naturalistic
evaluations. Efficacy is defined as “the degree to which the artefact achieves its goal
considered narrowly, without addressing situational concerns”, whereas effectiveness
is defined as “the degree to which the artefact achieves its goal in a real situation”
(Prat et al., 2015). These two criteria are commonly used by DSR methodologists as
well. For instance, Peffers et al. demonstrated the efficacy of their artefact by using it
to retroactively analysing and decomposing four already published IS research
projects (Peffers et al., 2007). Hevner et al. (2004) evaluated their artefact (i.e. the IS
Research Framework) in the same fashion. That’s why they made the “no formal
evaluation was attempted” comment on the “TOP Modeler” study done by Markus et
al. (2002). In this thesis, the efficacy of ISANN has been demonstrated in a similar
way through illustrative scenarios and descriptive analysis presented in Chapter 2
and 3, as well as through peer-reviewed publications. The effectiveness of ISACAM is
demonstrated through three design/evaluation episodes solving real problems in
the real-world.
Table 19 below provides a summary of the evaluation methods applied on the key
design artefacts produced in this study.
Table 19: The Key Artefacts and Evaluation Methods
Artefacts Evaluation Style Metrics Feedback
ISANN &
The Operational view of Dev Agility
vs. Ops Agility
Formative & Artificial
Descriptive/Illustrative Scenarios
Goal/Efficacy
Peer-reviewed publication
Consensus among experts
ISACAM
Formative & Naturalistic
Observational or Participatory
Goal/Effectiveness
Real-world problem solving in the form of evaluation episodes
Performance improvement

170
4.6 Challenges of Design Science Research
4.6.1 Danger of Self-Referential Paradox
Researchers may argue that the DSR process is inherently self-referential and
circular in nature (Glanville, 1999; Rohde, Brödner, Stevens, Betz, & Wulf, 2017).
Through design, researchers are effectively engaging with the materials of a
problematic situation in a “reflective conversation” (Schön, 1992). Following Schön
(1992), the design researcher needs to ”construct the design world within which
he/she sets dimensions of his/her problem space, and invents the moves by which
he/she attempts to find solutions” (p.11). Engaging a reflective conversation means
that one needs to self-evaluate his/her own premature designs, learn from
unexpected results, adjust, and sometimes even reconstruct the artefact, iteratively
until the design reaches a satisfactory condition. Such a self-referential process
allows continuous “simplification and pattern finding” reflections promoting
modification, extension, and unification of understandings (Glanville, 1999). Some
pioneer thinkers have even requested that the artefact produced by a DSR, e.g. a
design theory, should be self-referential as well, meaning it should explain its own
emergence (Jonas, 2007).
Although being acknowledged and embraced by design researchers, the notion of
“self-referential”, if unexamined, can become problematic and even paradoxical.
Senior theorists have warned that extra care needs to be taken when constructing
self-referential logic such as “using the logic to test a claim that is the same as the
logic used to create it in the first place” (Argyris, 2003)(p.1184). Self-referential
statements and claims in mathematics and logic studies has traditionally been
considered sceptical and may cause illogical inferences (e.g. Russell’s paradox in Set
Theory) (Friedman & Sheard, 1987; Yanofsky, 2003). An obvious self-referential
semantic paradox can be illustrated by the statement “This sentence is not true.”
One can assume this statement to be either true or false, it will always contradict to
itself.

171
Unsurprisingly, philosophers have already offered a deeper elaboration on self-
referential logic and pointed out the crux of those paradoxes. Philosophical studies
are frequently concerned with naturally self-referential “vertical theories” about the
general nature of theories (Fitch, 1946). For instance, Whitehead’s doctrine
reported in the book Process and Reality is a vertical theory of all theories including
itself (Whitehead & Sherburne, 1957). Self-referential theories can be safe, as long
as the logic is self-referentially consistent (Fitch, 1946). Self-referentially
inconsistent logic, however, can cause “vicious circularity” and result in paradox
that contradicts itself. In fact, identifying self-referential inconsistency in a
philosophical view is a standard method for philosophers to refute such a view
(Fitch, 1946). Along the same line, self-referential statements can be as consistent as
“Homological is a homological word”, or as inconsistent as “Hierological is a
hierological word”. The former is sound and meaningful while the latter is
paradoxical.
Self-referential design patterns are more often practised in Computer Science than
in the IS field. For instance, Figure 14 below demonstrates a classic Python example
of recursive function calculating the factorial of natural numbers. The function
factorial() calls itself inside its own definition to repetitively multiply the input
number by the next smaller number till 1 is arrived. Such a self-referencing method
is highly effective when a same logic/operation needs to be applied on a dataset
over and over again.

172
Figure 14: A Recursive Function in Python
However, if the logic is flawed in a way that is inconsistent to the original design (e.g.
change “n-1” to “n+1” in the Python code above), such a self-referential function can
cause “vicious circularity” and let the operation repeat infinitely. This may cause the
host computer to run out of memory and crash, commonly known as “stack
overflow”. To prevent such an undesirable event, Python has a default value of 1000
as the “maximum recursion depth” meaning even an ill-defined self-referential
function can only execute itself 1000 times at the max.
Figure 15 below illustrates another self-referential design pattern widely used in
database systems. In such a table structure, each row of record contains reference
to its parent (e.g. record id=71 “Fixed Wing” has parent_id=70 pointing to “Aircraft”)
which allows representation of technically unlimited levels of hierarchical
relationship among these records. To display these records in a visually more
recognisable hierarchical structure, we will need to write a self-join SQL query to
match the parents with the children (see Figure 16 for the query and result).

173
Figure 15 A Self-Referencing Table Structure
In this example, both the table structure and the query are self-referential by design.
Such a design is beneficial in several ways including saving the need for creating
multiple data tables to represent multiple levels of hierarchical relationship. This in
turn allows dynamic increase and decrease in levels of hierarchies through simple
data inputs from end user applications (e.g. a new grandchild level can be added
easily by a user entering a new record “Scooter” with parent_id=738 pointing to
“Motorbike”). On the other hand, without the self-referential design, adding a new
level of hierarchy may mean creating a new table in the database which often
requires intervention from IS specialists as such an operation cannot be done
directly by end users in any serious business database systems.
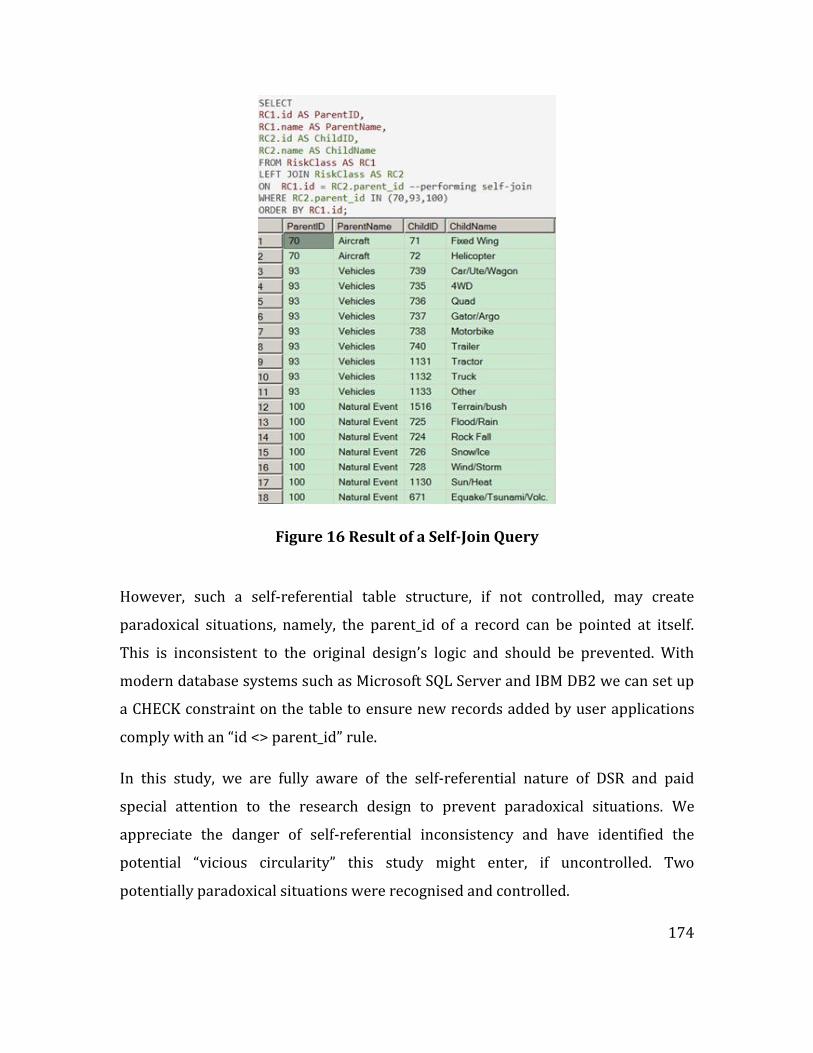
174
Figure 16 Result of a Self-Join Query
However, such a self-referential table structure, if not controlled, may create
paradoxical situations, namely, the parent_id of a record can be pointed at itself.
This is inconsistent to the original design’s logic and should be prevented. With
modern database systems such as Microsoft SQL Server and IBM DB2 we can set up
a CHECK constraint on the table to ensure new records added by user applications
comply with an “id <> parent_id” rule.
In this study, we are fully aware of the self-referential nature of DSR and paid
special attention to the research design to prevent paradoxical situations. We
appreciate the danger of self-referential inconsistency and have identified the
potential “vicious circularity” this study might enter, if uncontrolled. Two
potentially paradoxical situations were recognised and controlled.

175
The first one is at the kernel theory level, we have made a statement at the
beginning of the thesis that “Agility is a confusing concept in the IS literature”.
Therefore, in Chapter 2, it will become self-referentially inconsistent if we only
examine the IS literature in order to clarify the conceptual confusion. To prevent
such a paradoxical situation, our control method is to extend the scope of literature
review to a much broader range of disciplines such as sports science and military
research. This was an effective approach that not only fends off the possible paradox,
but also leads to a much higher conceptual clarity of Agility.
The second one resides in the design and evaluation cycle of this study, particularly
on the judgement on ISACAM artefact. We believe that the designer and the judge
should not be the same person(s) otherwise there will be a risk of self-referential
paradox. Summative evaluations are judgemental in nature and could determine the
fate of the designed artefact thus should better not be conducted by the designer
herself. Formative evaluations are developmental in nature and used to improve the
designed artefacts thus are self referentially consistent with the design effort.
In this study, to avoid being self-referentially inconsistent, we do not make
judgemental claims such as ISACAM is universally applicable or generalizable to all
possible environments. ISACAM was developed based on ISANN and evolved
through solving real-world problems in a SaaS environment. This environment,
denoted by Env1, is the context we are placed in to conduct our formative
evaluations to improve the effectiveness of ISACAM. Metaphorically, Env1 is the
place where ISACAM was grown up and trained. The positive feedback received, and
performance improvement observed in Env1 during the problem solving episodes
can be considered justification of the design of ISACAM, not evidence for
generalisation. The effectiveness of ISACAM has limited generalizability due to the
fact that all formative evaluations were done in the same Env1. To make a valid
generalizability argument, ISACAM will need to be taken out of Env1 and applied in
different environments, probably with some form of summative evaluations. Of

176
course, we believe that to improve the scientific rigour of DSR, summative
evaluations should be performed by someone else, not the designer(s), and in
environments that differ from where the artefact was originally designed.
4.7 Chapter Summary
This chapter discusses the methodological aspect of the present study. It explains
the choice of Design Science Research, the philosophical stance and the importance
of DSR to the IS field. It elaborates on the design and evaluation of artefacts in terms
of strategic intention and operational techniques. Explanation has been provided
regarding why and how certain methods and techniques were chosen for designing
and evaluating the intended artefacts. Next chapter will discuss details regarding
the design and evaluation of ISACAM.

177

178
Chapter 5 : The Creation of ISACAM
5.1 Introduction
The ISANN was developed extensively based on literature analysis and logical
reasoning. The key concepts and relationships identified in the ISANN have been
evaluated through illustrative scenarios and descriptive analysis in Chapter 2 and 3.
With rationally selected design methods discussed in Chapter 4, we are now ready
to use the ISANN as a conceptual framework to create the initial version of ISACAM
(version 1.0) – an analytical method for systematically investigating and solving IS
Agility problems. Next, through applying the ISACAM on real-world problems, we
are enabled to explore new elements and factors necessitated from the environment,
but not discovered in the original knowledge base. Iterative applications of the
ISACAM helped us identifying what other new data features should be considered,
quantitatively or qualitatively, besides those already described in the ISANN. In
other words, the evolution of ISACAM is a process of absorbing new knowledge from
the research environment. Such knowledge is then presented in the form of a more
complete structure of the ISACAM – from the early version 1.0 to the latest version
2.0.
5.2 The Evolution of ISACAM
As discussed in Section 4.5.2, we have developed two types of operational level
models based on the ISANN. These include a series of data models and task models
which were constructed using Dimensional Modelling and Hierarchical Task
Analysis methods. The data and task models are the integral parts of ISACAM and
were developed with an intention to enable future development of software
instantiations.
179
As illustrated in Section 4.5.1, the real-world setting used to design and evaluate the
ISACAM, or the DSR “environment” according to (Alan R. Hevner et al., 2004), is
consist of a SaaS platform, a SaaS provider and a group of adopters. The ISACAM
evolves through iteratively being applied to analyse and solve real-world problems
raised by those SaaS adopters. Those problems were particularly driven by the need
for IS Agility in IS-supported operations. Through the applications on real-world
problems, the ISACAM has been able to evolve significantly and absorb new features
for effective problem analysis and solution design.
5.2.1 The DSR Environment
The DSR environment essentially is the ecosystem of a cloud-based SaaS provider
(hereafter called The NOHARM Cloud). The NOHARM Cloud is a professional service
firm specialised in safety risk management and has been one of the leading service
providers in New Zealand for years. The SaaS solution provided by The NOHARM
Cloud is a highly modularised software information system built upon a multi-
tenant architecture. The IS (hereafter called NOHARM) has been evolving over a
decade with incremental changes in functionalities and steady increase of the client
base. After years of client-driven development, NOHARM has now expanded to a
much larger system containing ten major modules, hundreds of explicit or implicit
subsystems, over 2,000 web pages and scripts, and over 200 database tables.
By 2016, over 80 NZ based medium and large sized organisations have subscribed
to the NOHARM service and been actively using the system to manage their
operational safety risks, hazards and incidents etc. These organisations are
demographically diverse, some are as large as having over ten thousand employees,
while others are smaller entities with hundreds of staff members. Many of these
organisations are NZ’s iconic businesses operating in high-risk industries such as oil
& gas, forestry, transportation, construction, dairy & farming, etc. These
organisations use NOHARM to carry out activities including reporting incidents,
180
conducting investigations, identifying hazards, assessing/controlling risks,
analysing root causes, planning/tracking corrective actions, implementing audit
programs, and so on.
Safety management was traditionally seen as a compliance-oriented practice relying
heavily on the obedience to organisational policies and procedures. However,
compliance-focused approaches are proven to be, at best, maintaining the status quo,
instead of continuously improving safety performance. Modern businesses are
operating in fast changing environments where continual improvement becomes
essential. Today, many new safety programs are developed based on risk
management frameworks (e.g. ISO 31000) with which organisations identify, assess,
treat, and control safety risks through continuous reflections and adjustments on
reactive measures such as incidents and near misses, as well as on proactive
measures such as risks controls, audits, and safety plans.
Safety risk management has always been an important topic. In New Zealand, this
topic has recently become far more critical than ever to businesses. In the wake of
Pike River disaster (Pike_River_Royal_Commission, 2010), New Zealand government
has determined to transform safety management practice in this country. WorkSafe
New Zealand, a new government agency, acting as a workplace health and safety
regulator, has been launched on 16th December 2013 (WorkSafe, 2013). New
legislation changes (e.g. WorkSafe New Zealand Act 201314) have been proposed
and debated thoroughly in the public eye. Resultantly, the new Health and Safety
(H&S) at Work Act finally came into effect in April 2016. As part of the government’s
overhaul of NZ’s occupational H&S framework.
The Act introduces a range of new due diligence obligations specifically on Officers
(termed as PCBU – The Person Conducting a Business or Undertaking). These
14 http://www.legislation.govt.nz/act/public/2013/0094/latest/DLM5302019.html?src=qs

181
obligations explicitly require the PCBU to understand operations and their
associated risks; to ensure the organisation has established processes to receive and
respond to information regarding incidents, hazards, and risks; and to provide
appropriate resources and practical steps for incident prevention. Failed to do so, in
the face of incidents, can result in harsh penalties including hefty fines and years of
imprisonment (Worksafe, 2015).
Such a drastic regulation change and associated serious penalties have driven New
Zealand organisations to change their behaviours significantly and rapidly. CEOs
and boards of directors are now legally accountable for actively managing safety
related risks (in the past these were mostly dealt with by H&S managers and
advisors) thus are in need to make their organisations sensitive and responsive to
workplace safety risks. Agility suddenly becomes a popular concept to safety risk
management. To be more agile and legally responsible in the safety space,
specialised information systems are deemed to be essential (Department of Labour,
2011). As recommended by ACC (Accident Compensation Corporation), to
implement a safe workplace, organisations need to establish information systems
that can ensure “employees are informed about and understand the risks of hazards
with which they work” (ACC, 2016) (pp.38 ).
All the aforementioned changes have made safety risk management IS a great
context to apply the ISACAM and study IS Agility problems. Such systems were often
designed without agility in mind originally but now are expected to deliver it to
users. The NOHARM ecosystem, is an ideal test bed for ISACAM. With its multi-
tenancy nature, NOHARM offers a diverse sample set of user groups faced by
various IS Agility problems. Users from different client organisations often try to
develop their own solutions to solve these problems using their knowledge and
experiences in the H&S work domain. However, often their solutions are limited by
their mental models grounded in their specific subjects. Such limitations pose a

182
severe challenge when users are attempting to leverage the IS to sense and respond
to safety risks effectively and efficiently.
The situation that NOHARM users are facing is another proof of the Dev Agility vs.
Ops Agility dichotomy. The NOHARM development team, has been practising agile
methods for many years. Following the Scrum methodology, the team has managed
to reach the 150th Sprint in Q1 of 2016. The team in general has been responsive to
system changes requested by client users with a discipline of executing biweekly
Sprints and releasing new features monthly. However, as discussed in previous
chapters, agility in system development process differs from agility in the resulting
system. The former doesn’t necessarily lead to the latter (Haberfellner and Weck,
2005). Given the intrinsic limitations of their work domain, the changes or solutions
requested by client users are often not effective in altering the behaviours of the
system and of themselves to work together seamlessly to sense and respond to
safety risks. According to NOHARM users, although the NOHARM development team,
as the SaaS provider, is agile in responding to their requests for system changes,
they still, from time to time, find themselves not handling safety related tasks in a
timely manner. For instance, users may misuse the NOHARM system by
inappropriately configuring key parameters and classifying information. They may
see themselves receiving too much data, or too little, meaning they become
cognitively overloaded, or underloaded, either way, they cannot efficiently derive
actionable information, which then leads to uncertainty with the situation and delay
in decisions and responses.
In a nutshell, the NOHARM system and its client base, represent a fertile test bed for
applying the ISACAM and assessing results against conventional wisdom. Given the
legislation changes happening in New Zealand’s workplace safety, organisations are
becoming increasingly intolerant to delay and inaccuracy in safety data and
information processing. They are now requesting more agility in there is to support
the sudden change in risk appetite. Safety risk management systems, such as

183
NOHARM, are now facing the challenge and demanded to empower users to sense
and respond to safety risks effectively and efficiently.
In the following sections, the application, evolution, and evaluation of ISACAM is
reported in the form of three episodes. These episodes are all derived from
representative cases based on the real-world problems faced by NOHARM clients.
They are presented and elaborated to demonstrate the effectiveness of ISACAM, the
rationale of its evolution, and the limitations imposed by client users own work
domains.
5.2.2 Episode One – A “Sensing” Problem
5.2.2.1 The Problem and Context
Episode One was derived from a problem-solving case for a major forestry and
manufacturing company (hereafter named the E1 Company) who is an active client
with over five thousand users accessing NOHARM on a regular basis. Episode One
was chosen to be reported in this thesis for two reasons: firstly, it represents a
typical IS Agility problem where the SDSE cycle of the agent had lost Synchronicity
due to the lack of “sensing” ability which in turn caused insufficient data flowing
towards the agent (in this episode, H&S managers and advisors at the E1 Company)
and resulted in indecision and inaction; secondly, this episode enabled us to reflect
and evolve ISACAM to the next level (from version 1.0 to 1.1) with the inclusion of
new elements (e.g. Torque Booster and Friction Reducer as two key solution types
for increasing IS Agility which will be discussed in the following sections).
The E1 Company had long been experiencing unacceptably low “Near Miss”
reporting rate. In an average month, the whole organisation could only gather 30 to
40 Near Miss data points. Such a number is far too low for a large organisation like
E1 Company with a dozen of major reporting lines and each has hundreds of
employees.

184
Near Misses, or Close Calls, are terms used in safety management practice to
describe “unplanned events occurred that did not result in injury, illness or damage,
but had the potential to do so”15. History has suggested that many serious and
catastrophic incidents were preceded by warnings and Near Miss events.
The absence of negative impact has made gathering Near Miss data points a
challenging task to organisations. With incidents, workers cannot avoid reporting
due to the actual consequences associated, e.g. injured persons, damaged properties.
But Near Misses don’t cause any real harm thus people can turn a blind eye and
don’t bother telling anyone.
To H&S managers, Near Misses are valuable data points where organisations can
learn from “narrowly escaped” events without paying the penalty – as there was no
harm done. Trends and patterns may be found proactively through analysing Near
Miss data at the early stage before risks manifest in the form of loss-producing
incidents. In short, quality Near Miss data is critical to proactive incident prevention.
Near Misses, especially those with high potential consequences, should be collected
and analysed in a timely manner to identify weakness of the existing operational
processes and safety programs for continual improvements.
Without sufficient Near Miss data points, the E1 Company could not determine if
their safety program was truly effective. They had to rely on actual injury incidents
to gain insights which often come with a high price and painful penalty (i.e. loss of
production time, damage of assets, fines, legal cost, etc.). On the other hand, when
there was a low injury rate for a period, the company could not tell if it was just pure
luck or a major injury was about to occur.
15 Source: Fact sheet from OSHA and the National Safety Council -
http://www.nsc.org/WorkplaceTrainingDocuments/Near-Miss-Reporting-Systems.pdf

185
Not only the absolute number of reported Near Misses matters, in fact the ratio
between Near Misses and Minor Injuries (injuries require only first aid or simple
medical treatment but no days off from work) is considered more important to
injury prevention. For instance, the Heinrich’s Safety Triangle, adopted by some
safety practitioners, suggests that naturally for every Minor Injury, there ought to be
ten Near Misses. Figure 17 shows an adjusted version of Heinrich’s Triangle with a
finer breakdown to Serious Injury, Fatality, and Catastrophe.
Figure 17: The Heinrich's Safety Triangle
Source: The Creative Works Group16
Some organisations may create their own versions of safety triangle adjusting the
ratios to either higher or lower, based on the nature of their operations. The E1
Company and many other businesses in the same industry adopted the default 10:1
ratio to gauge the performance of Near Miss reporting. However, prior to 2011, the
E1 Company was performing way below expectations using their paper-based
16 http://creativeworksgroup.com.au/home/heinrichs-triangle-should-be-followed/

186
Incident and Near Miss reporting systems and processes with the ratio between
Near Miss and Minor Injury being somewhere between 2:1 to 3:1.
The E1 Company have modernised their safety management systems by adopting
NOHARM in early 2011 with the hope to improve the safety data and information
flow between frontline workers and management level decision makers. Before the
implementation of NOHARM system, reporting Near Misses and Incidents would
require frontline workers at the E1 Company to fill out paper forms and hand them
in to the managers or safety advisors before their offices during work hours. With
the NOHARM, employees now can directly access the web-based IS anywhere with a
computer and an Internet connection. They can now fill out electronic forms online
anytime they want without the limitation of office hours. Therefore, the E1 Company
was expecting a significant increase in Near Miss reporting rate.
After the implementation of NOHARM in early 2011, employees and contractors did
seem to report more Near Misses in the system. As shown in Table 20 below,
according to data kept in the NOHARM system, from the first quarter of 2011 to the
fourth, the number of Near Misses reported increased from 211 to 358. Such an
increase was then observed in early 2012 with the number rising up to 513 but then
dropping down to 410.

187
Table 20: Near Miss to Minor Injury Ration at E1 Company 2011 Q1 to 2012 Q2
Data Source: The NOHARM System (Visualised in Microsoft SSRS 2014)
Nevertheless, managers at the E1 Company were not satisfied. Because the ratio
between Near Misses and Minor Injuries was almost staying the same for six
quarters, fluctuating slightly but consistently remaining below 4:1 which is a slight
improvement compared to previous years when the old paper-based system was
used but still far away from the expected 10:1 ratio. The number of Minor Injuries
was increasing almost in proportion to that of Near Misses. This was deemed to be
merely a result of the increased number of operations caused by the expansion of
business and workforce at the E1 Company, plus the convenience of having the
NOHARM system to report everything about safety risks, not just Near Misses.
In short after the implementation of the NOHARM system, frontline workers at the
E1 Company did seem to be reporting more Near Misses than they were before.
However, what the E1 Company didn’t want to see was the proportioned increase of
Minor Injuries. This means their safety program and risk management practice were
not being improved. A true improvement should result in an increased ratio
between Near Misses and Minor Injuries with Near Misses trending upwards while
Minor Injuries trending downwards.
The E1 Company felt uneasy to be stuck for six quarters at the below 4:1 ratio. They
started to look for means to improve the data collection capability or the “signal

188
detection” (a metaphor used by one of the managers) of their safety IS in order to
respond to changes in their operational risks in a timely and effective manner.
5.2.2.2 The Initial User-Driven Solution and Results
To solve the problem, the H&S advisors and managers at the E1 Company analysed
the situation and worked out a solution. Their processes of problem analysis and
solution design were predominately based on their expertise in the safety risk
management work domain and their understandings of the NOHARM system. Such
processes can be effectively summarised in an Abstraction Decomposition Space
(ADS) illustrated in Table 21.
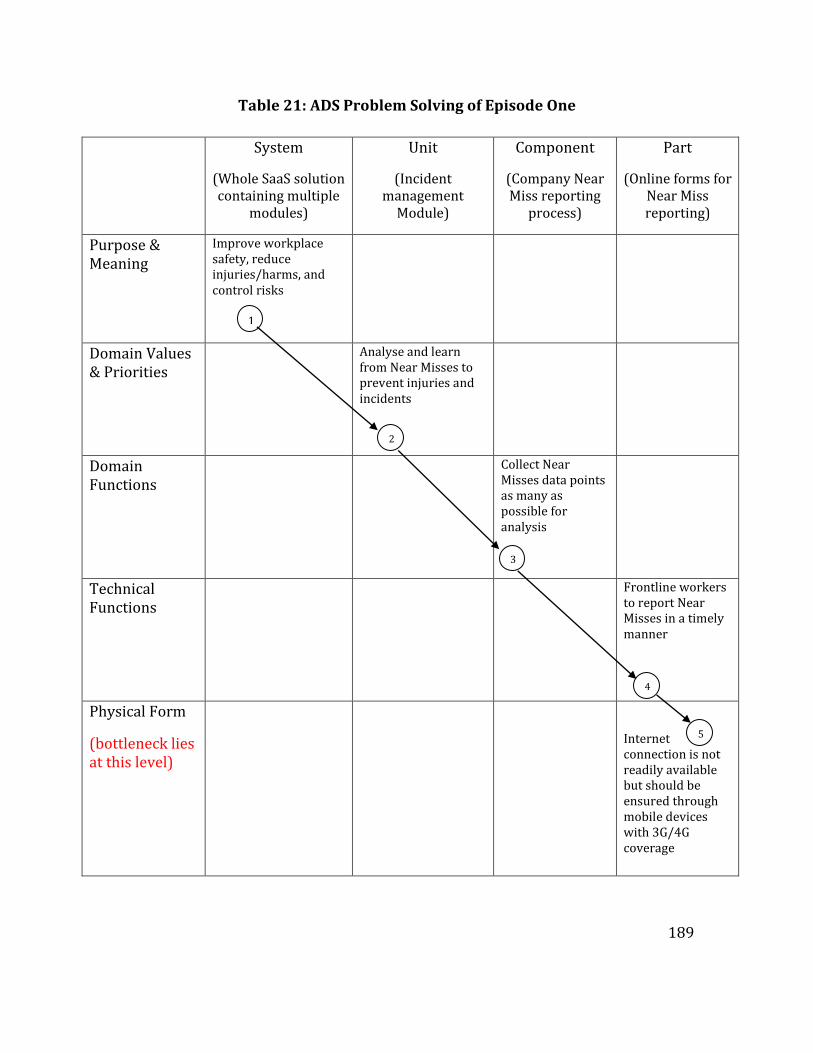
189
Table 21: ADS Problem Solving of Episode One
System
(Whole SaaS solution containing multiple
modules)
Unit
(Incident management
Module)
Component
(Company Near Miss reporting
process)
Part
(Online forms for Near Miss reporting)
Purpose & Meaning
Improve workplace safety, reduce injuries/harms, and control risks
Domain Values & Priorities
Analyse and learn from Near Misses to prevent injuries and incidents
Domain Functions
Collect Near Misses data points as many as possible for analysis
Technical Functions
Frontline workers to report Near Misses in a timely manner
Physical Form
(bottleneck lies at this level)
Internet connection is not readily available but should be ensured through mobile devices with 3G/4G coverage
1
2
3
4
2 5

190
After discussions with frontline workers, as well as articulating the purpose, values,
and functions of the NOHARM system/components (see in Table 21), the H&S
advisors at the E1 Company concluded, that the key reason for the lack of significant
increase in Near Miss reporting rate after implementing a web-based IS was because
of the system’s dependence on computer and Internet connection (i.e. “Physical
form” in Table 21) when submitting online forms (i.e. “Part” in Table 21). To the E1
Company, there seemed to be no problem at the “Domain function” and “Technical
function” levels of the NOHARM ecosystem. They deemed the lack of mobile
computing device and Internet connection, or in the ADS terminology, the “Physical
form”, was the key issue.
Frontline workers did not carry computers with them when they were out working
in the fields or operating machinery on the factory floor. When a Near Miss event
occurred, they would need to remember it, sometimes by jotting it down on a piece
of paper if the Near Miss was indeed mentally disturbing, and then went back to the
office or home (wherever a computer and Internet connection are available) after
finished the day’s work and enter the Near Miss data into the NOHARM system.
However, by the time workers finished their work of the day, the vividness of the
event could fade away enough that they tended to forget reporting the Near Miss at
all. Either it was inattention or tiredness, many would not bother sitting in front of a
computer or logging into the system merely to type up the whole story of an event
that didn’t hurt anyone. In fact, if there were multiple Near Misses happened during
the day, much of the details would be lost by the time a worker tries to recall these
events.
At the E1 Company, the solution then became straightforward: to issue a mobile
device (with 3G/4G technology) to each group of frontline workers so they can
record Near Misses into the NOHARM right after the occurrence of such events
without having to look around for a computer or wait till the end of a work day.
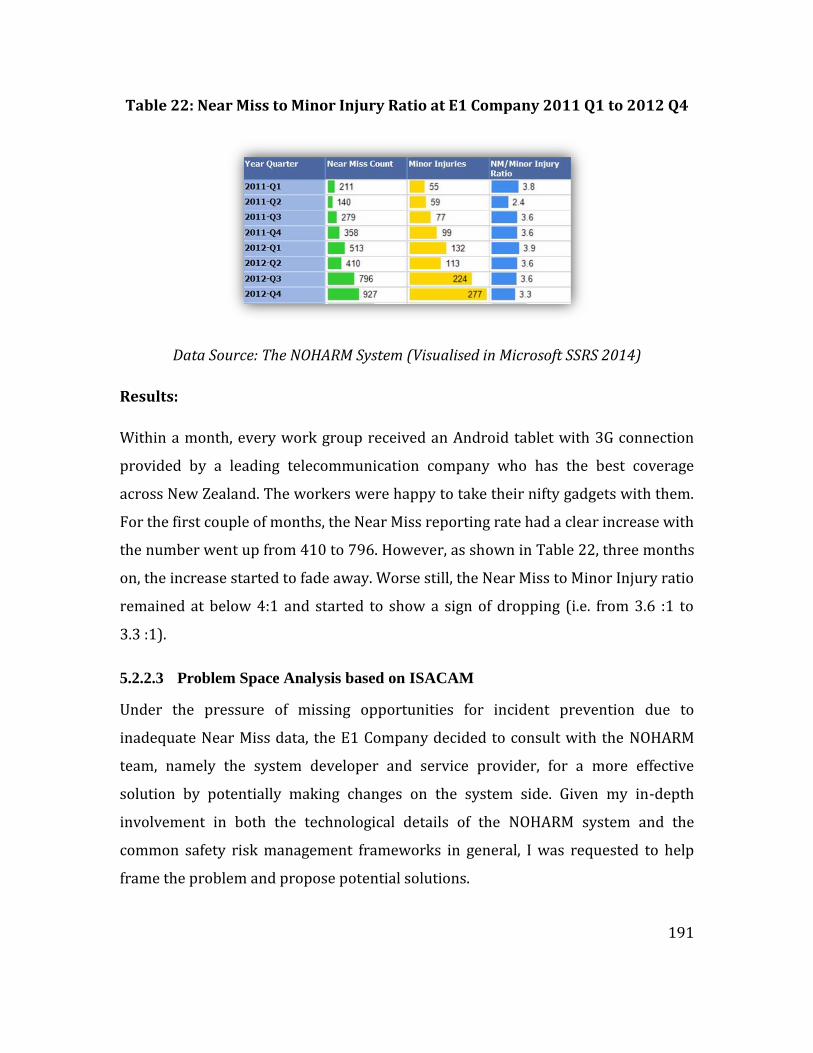
191
Table 22: Near Miss to Minor Injury Ratio at E1 Company 2011 Q1 to 2012 Q4
Data Source: The NOHARM System (Visualised in Microsoft SSRS 2014)
Results:
Within a month, every work group received an Android tablet with 3G connection
provided by a leading telecommunication company who has the best coverage
across New Zealand. The workers were happy to take their nifty gadgets with them.
For the first couple of months, the Near Miss reporting rate had a clear increase with
the number went up from 410 to 796. However, as shown in Table 22, three months
on, the increase started to fade away. Worse still, the Near Miss to Minor Injury ratio
remained at below 4:1 and started to show a sign of dropping (i.e. from 3.6 :1 to
3.3 :1).
5.2.2.3 Problem Space Analysis based on ISACAM
Under the pressure of missing opportunities for incident prevention due to
inadequate Near Miss data, the E1 Company decided to consult with the NOHARM
team, namely the system developer and service provider, for a more effective
solution by potentially making changes on the system side. Given my in-depth
involvement in both the technological details of the NOHARM system and the
common safety risk management frameworks in general, I was requested to help
frame the problem and propose potential solutions.

192
Instead of following the same work domain-based approaches used by the E1
Company, we examined the problem from an IS Agility standpoint. We used the
ISANN as a starting point to construct the problem space. Initially, the ISANN was
too conceptual to be applied directly as an analytical method, thus we mapped it
into two operational level models (data vs. task) that can systematically guide
through the analytical processes as well as to capture relevant data needed for
problem investigation. These models then became the fundamental structure of
ISACAM.
The initial ISACAM (Ver 1.0) was relatively primitive but it consisted of the key
elements of ISANN. The first operational model of ISACAM, see Figure 18, is
essentially a data model developed using the Dimensional Modelling method
(explained in Chapter 4) to map out the key factors and relationships needed to be
captured for analysing and solving IS Agility problems. The second model, see
Figure 19, is a task model developed using the Hierarchical Task Analysis method to
plan out the main steps needed to go through in order to analyse and solve IS Agility
problems. In short, the data model ensures that data essential to IS Agility is
collected and documented in a structured and systematic way. The task model
articulates a step-by-step instruction to collect data, analyse problems, and design
solutions.
After iterations of problem solving applications and evolution of ISACAM, we also
developed a set of “technological rules” to guide the judgement and design decisions
while using the ISACAM to solve problems. These technological rules are
documented at the end of this chapter as they were synthesized at a later stage of
the evolution journey of ISACAM.
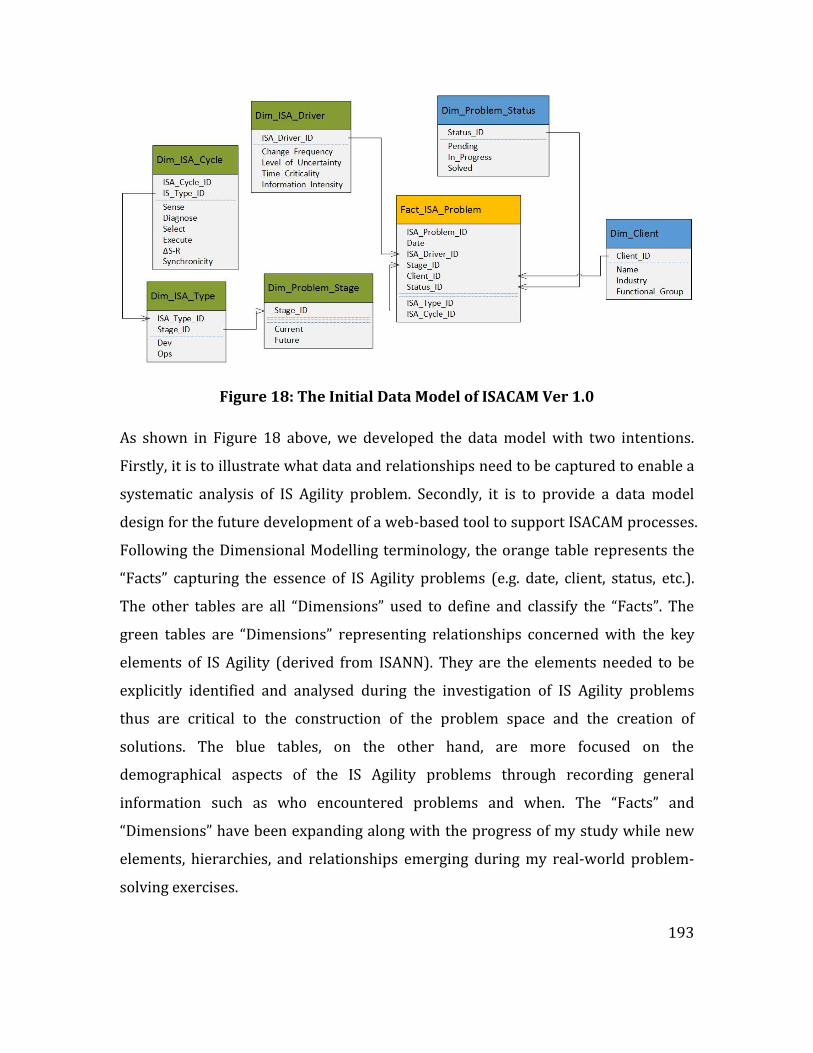
193
Figure 18: The Initial Data Model of ISACAM Ver 1.0
As shown in Figure 18 above, we developed the data model with two intentions.
Firstly, it is to illustrate what data and relationships need to be captured to enable a
systematic analysis of IS Agility problem. Secondly, it is to provide a data model
design for the future development of a web-based tool to support ISACAM processes.
Following the Dimensional Modelling terminology, the orange table represents the
“Facts” capturing the essence of IS Agility problems (e.g. date, client, status, etc.).
The other tables are all “Dimensions” used to define and classify the “Facts”. The
green tables are “Dimensions” representing relationships concerned with the key
elements of IS Agility (derived from ISANN). They are the elements needed to be
explicitly identified and analysed during the investigation of IS Agility problems
thus are critical to the construction of the problem space and the creation of
solutions. The blue tables, on the other hand, are more focused on the
demographical aspects of the IS Agility problems through recording general
information such as who encountered problems and when. The “Facts” and
“Dimensions” have been expanding along with the progress of my study while new
elements, hierarchies, and relationships emerging during my real-world problem-
solving exercises.

194
Following the data model and task model (see Figure 19 below) defined in ISACAM
ver1.0, we first identified E1 Company’s problem space as having high “Change
Frequency” - Near Misses occurred frequently in E1 Company’s high risk industry
especially when working in the field falling trees and operating in the sawmill
cutting timber.
Next, we identified high level of uncertainty in both spatial and temporal
dimensions. Frontline workers didn’t know and couldn’t anticipate when a Near
Miss would occur and didn’t know how much time should be spent on reporting
Near Misses, thus the temporal uncertainty. When a Near Miss did occur, workers in
the work group didn’t have a clear direction to follow, hence the spatial uncertainty.
Workers had to discuss and decide if the event was worth reporting, who should be
logging it in to the NOHARM system, and when. Although the E1 Company had
issued a mobile device to individual workgroups, there was no dedicated person in a
workgroup looking after the mobile device and to log Near Miss events. Not to
mention workers could change workgroup from time to time almost everyone had
excuses for forgetting to report Near Misses occurred within one group.
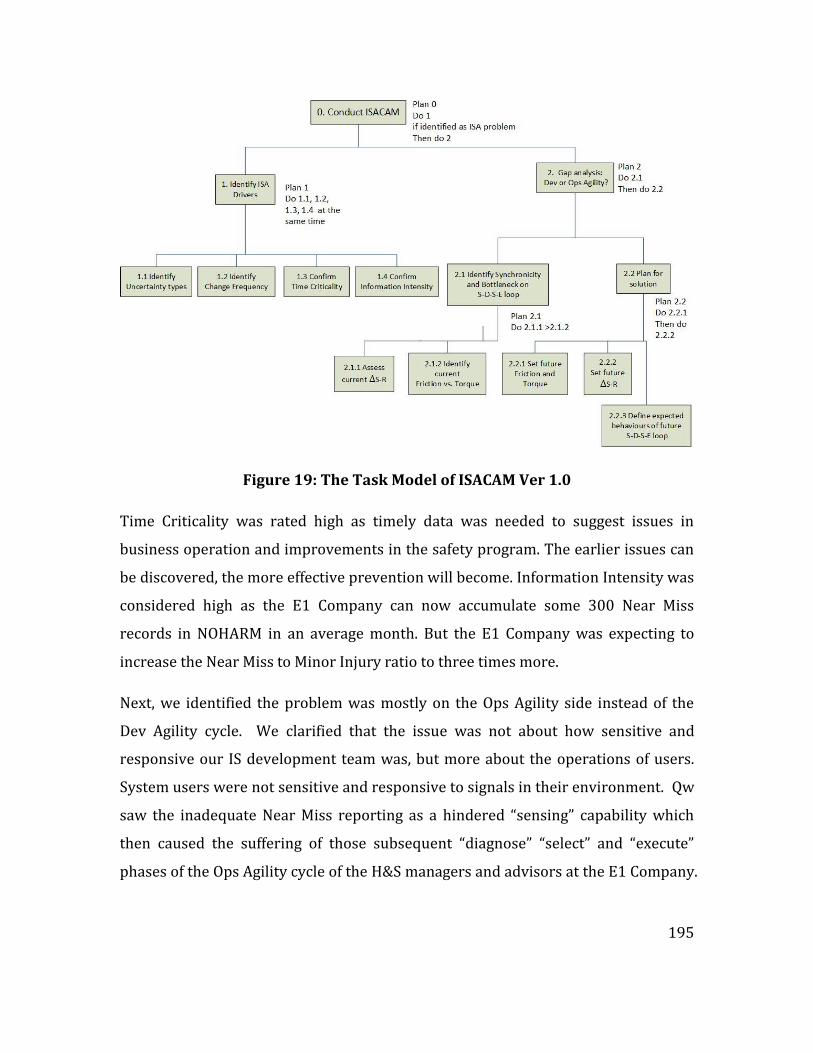
195
Figure 19: The Task Model of ISACAM Ver 1.0
Time Criticality was rated high as timely data was needed to suggest issues in
business operation and improvements in the safety program. The earlier issues can
be discovered, the more effective prevention will become. Information Intensity was
considered high as the E1 Company can now accumulate some 300 Near Miss
records in NOHARM in an average month. But the E1 Company was expecting to
increase the Near Miss to Minor Injury ratio to three times more.
Next, we identified the problem was mostly on the Ops Agility side instead of the
Dev Agility cycle. We clarified that the issue was not about how sensitive and
responsive our IS development team was, but more about the operations of users.
System users were not sensitive and responsive to signals in their environment. Qw
saw the inadequate Near Miss reporting as a hindered “sensing” capability which
then caused the suffering of those subsequent “diagnose” “select” and “execute”
phases of the Ops Agility cycle of the H&S managers and advisors at the E1 Company.

196
We requested the E1 Company to set the expected ∆S-R value in terms of their
regular data analysis, decision making, and action taking processes (together with
the Near Miss reporting these steps manifested a typical Ops Agility cycle) on Near
Miss events. The ∆S-R needed to be clearly defined instead of vaguely described as
“ASAP” or “as soon as you can”. The expected ∆S-R for sensing and responding to
Near Misses at the management level was then decided to be five work days,
meaning weekly.
At the end of 2012, H&S advisers and managers at the E1 Company were still unable
to go through the “sense and respond” cycle on a weekly basis because in some
weeks there were just no sufficient Near Miss data points to diagnose and respond
to. For instance, in the fourth quarter of 2012, although a historically highest
number, 927 Near Misses were reported in NOHARM, once breaking down the
number into 13 weeks and then into the 12 main reporting lines, on average a
reporting line will have less than 6 Near Misses for the line managers and safety
advisors to review. The ∆S-R in practice was actually a month. Only after a month of
accumulation, the E1 Company could then perform a more meaningful analysis of
Near Miss data at the individual reporting line level17. A month is considered too
long of a “sense and respond” cycle at the E1 Company. Not to mention the number
of Minor Injuries had gone up to 277, a historically highest number.
17 Analysing Near Miss data at the individual reporting line level is critical as the E1 Company has multiple lines of business operations with each faced by different sets of risks. For instance, risks identified from Near Misses reported in a logging site will not necessarily be relevant to operations in a timber-treatment factory, yet both are the core businesses of the E1 Company.

197
Figure 20: The SDSE Mapping Table for Episode One
As shown in Figure 20, the “sensing” part of the Ops Agility cycle was highlighted as
the main bottleneck slowing down the whole “sense and respond” cycle. The H&S
advisors and managers at the E1 Company could efficiently and effectively process
the Near Miss data sensed but they had to wait four times longer than expected for
more signals being collected in order to make insightful diagnosis and confident
decisions. Consequently, new corrective actions would have to be delayed further
which could leave too much room for recurrence of safety events.
5.2.2.4 The Final ISACAM-Driven Solution and Results
Following the ISACAM terminology, the “Current Friction” was found to be high in
the Ops Agility Cycle. This was mostly from workers’ concerns regarding distraction,
loss of production time, and delay in work progress caused by having to report Near

198
Misses on a worksite using mobile devices. An average worker would have to spend
15 to 20 minutes on the mobile device to record a Near Miss as the form contains
some 20 textboxes and dropdown lists to be filled out.
To solve this problem, we needed to introduce “Friction Reducers” to eliminate or
minimise the concerns of frontline workers. This could be done either through
human procedural changes by formally setting aside some time a day for each
workgroup to operate the NOHARM on their mobile devices, or via system
functional changes by making the Near Miss reporting form in the NOHARM system
intelligent enough to automatically populate some of the form elements (e.g.
location, reporting line, date, owner, etc.). The E1 Company accepted both
approaches.
We then identified the “Current Torque” was low and there was a lack of recognition
for workers who reported Near Misses. There was especially little motivation for a
worker to report Near Misses caused by a team mate. Near Misses were seen by
some workers as “mistakes” made by individuals thus exposing them to managers
may cause conflicts or resentment from co-workers. In short, reporting Near Miss
was still considered by many a “favour” to the organisation’s management team
with no direct benefit to the frontline workers.
To solve this problem, we decided to create “Torque Boosters” to change the image
of Near Miss reporting inside the E1 Company. This could be done by proactively
promoting a “no blame” policy so those who caused and reported Near Misses were
not to be ashamed, and/or by recognising those who actively reporting Near Misses
with non-monetary incentives. The E1 Company agreed to implement both
approaches.
To help identifying who were the most active “Near Miss reporters”, we created new
data queries and visualisations using Microsoft SQL Server Reporting Service (SSRS)
for the E1 Company to rank the top 20 individuals who have reported most Near
199
Misses on monthly and year-to-date bases. Names appearing on this list can be seen
by all users (including workers and managers) after logging into the NOHARM and
were also praised in a monthly safety newsletter inside the E1 Company.
Finally, to maximise the results, I proposed to let the frontline workers gain more
“temporal confidence” and “spatial confidence”. As mentioned earlier, the E1
Company agreed to establish a fixed time (up to one hour a day for each workgroup)
for Near Miss discussion and reporting which could reduce the temporal uncertainty
effectively. The spatial uncertainty, could be controlled by explicitly assigning one
person to dedicate that one hour for operating NOHARM on the mobile device and
collecting data from other co-workers inside the his/her workgroup (Note: the
person operating NOHARM is not necessarily the one who spotted/reported a Near
Miss).
Results
In early 2013, the E1 Company started implementing the agreed procedural changes,
i.e. the aforementioned “Torque Boosters” and “Friction Reducers”. The bottleneck
at the “sense” phase started to be resolved. The safety advisors began to receive
much more Near Miss data which enabled them to perform meaningful diagnosis
more frequently. Their Ops Agility cycle started to run with a higher level of
Synchronicity.
As shown in Table 23, according to data kept in the NOHARM system, by the end of
the first quarter, the number of Near Misses reported in NOHARM raised from 927
to 1,388, with Minor Injuries remaining almost the same level to the previous
quarter from 277 to 279. Such a change made a noticeable difference in the ratio
between Near Misses and Minor Injuries which now raised, for the first time in
many years, from the stubborn “below 4:1” to the new historical record 5:1.
200
In the following two quarters, the E1 Company experienced a dramatic change in
their “Near Miss vs. Minor Injury” performance. The Near Misses reported kept
climbing from 1,388, to 2,026, then to 2,319. In the meantime, the Minor Injuries
started to drop from 279 to 215, then to 213. Such a drastic change resulted in an
accelerated increase of the “Near Miss vs. Minor Injury” ratio which raised from 5:1
to 9.4:1, then 10.9:1.
Such a fast and significant change in safety performance was beyond the expectation
of the H&S managers and advisors at the E1 Company. They were able to review and
amend their existing risk control measures and safety processes on a weekly basis
based on the data collected. They acknowledged those top “Near Miss Reporters”
formally according to the visualised “ranking report” we developed. In the next two
quarters, both Near Misses and Minor Injuries started to drop after the new risk
control measures and safety plans being implemented. The Near Miss to Minor
Injury ratio remained at above 10:1 which is in alignment with the Heinrich’s Safety
Triangle discussed previously.

201
Table 23: Near Miss to Minor Injury Ratio at E1 Company 2011 Q1 to 2014 Q1
Data Source: The NOHARM System (Visualised in Microsoft SSRS 2014)
5.2.2.5 Episode Summary and Reflection in Action
Table 24 below summarises the key points of Episode One. Such a table has been
used as a record keeping tool to document the key findings, solutions, and results of
each problem-solving practice using ISACAM. Of course, the layout of this table has
been evolving along with the upgrading journey of ISACAM itself.
Table 24: A Brief Summary of Episode One
Functional Group: Frontline workers - from the E1 Company
Episode One – Unacceptable Near Miss reporting rate
The original solution – summarised in Abstraction Decomposition Space(partial)
System Purpose
Improve workplace safety, reduce injuries, and control risks
Domain Values Analyse and learn from Near Misses to prevent injuries and incidents
Domain Functions
Sense changes in risk profile through timely Near Miss data collection – sufficient data points are needed for further
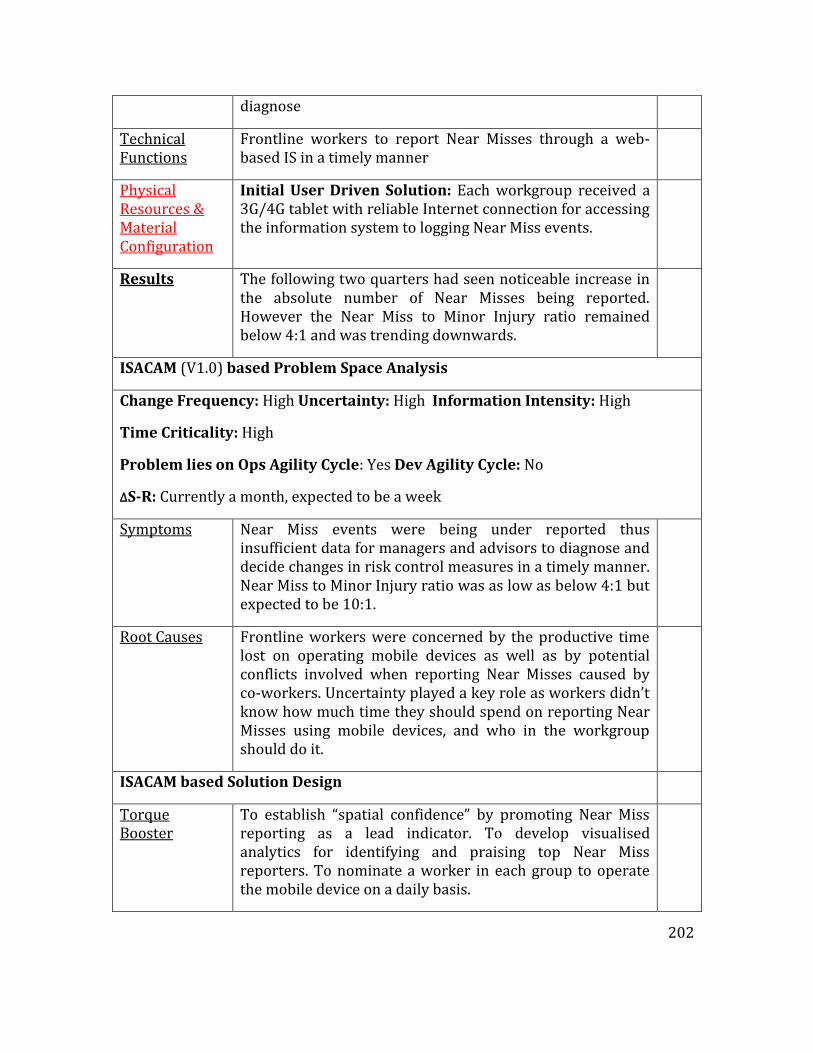
202
diagnose
Technical Functions
Frontline workers to report Near Misses through a web-based IS in a timely manner
Physical Resources & Material Configuration
Initial User Driven Solution: Each workgroup received a 3G/4G tablet with reliable Internet connection for accessing the information system to logging Near Miss events.
Results The following two quarters had seen noticeable increase in the absolute number of Near Misses being reported. However the Near Miss to Minor Injury ratio remained below 4:1 and was trending downwards.
ISACAM (V1.0) based Problem Space Analysis
Change Frequency: High Uncertainty: High Information Intensity: High
Time Criticality: High
Problem lies on Ops Agility Cycle: Yes Dev Agility Cycle: No
∆S-R: Currently a month, expected to be a week
Symptoms Near Miss events were being under reported thus insufficient data for managers and advisors to diagnose and decide changes in risk control measures in a timely manner. Near Miss to Minor Injury ratio was as low as below 4:1 but expected to be 10:1.
Root Causes Frontline workers were concerned by the productive time lost on operating mobile devices as well as by potential conflicts involved when reporting Near Misses caused by co-workers. Uncertainty played a key role as workers didn’t know how much time they should spend on reporting Near Misses using mobile devices, and who in the workgroup should do it.
ISACAM based Solution Design
Torque Booster
To establish “spatial confidence” by promoting Near Miss reporting as a lead indicator. To develop visualised analytics for identifying and praising top Near Miss reporters. To nominate a worker in each group to operate the mobile device on a daily basis.

203
Friction Reducer
To establish “temporal confidence” by allowing one hour a day for each group to operate the mobile device to access the IS. To implement intelligent online forms to save time needed for reporting Near Misses by automatically filing out data fields that can be derived from user’s login details.
Results The following three quarters had seen a dramatic increase in both the absolute number of Near Misses being reported as well as its ratio to Minor Injuries. Such ratio reached over 10:1 at the end of the third quarter which was beyond expectation. Near Miss data analysis could be done weekly instead of monthly.
Evolution of ISACAM
Solution_Type (Friction reducer vs. Torque booster) was added as a new dimension for solution design.
Uncertainty_Type (Spatial vs. Temporal) was added as a separate dimension for problem analysis as well as solution design.
The outcome of Episode One improved the “sensing” capability of the Ops Agility
cycle at the E1 Company with regard to detecting Near Miss “signals”. Such agility
cycle is crucial to safety managers and advisors who need to make effective
responses to changes in their safety risk profile. When under time pressure, poor
sensing performance demonstrated by the frontline workers can doom the efforts
on the subsequence diagnose, select, and execute activities which are the primary
responsibilities of the safety managers and advisors at the E1 Company.
The “sensors” in this episode were essentially human agents. To improve the
“sensing” performance of the frontline workers, purely adding more technologies or
devices into the equation was not enough. The bottlenecks identified were sitting
more on the human side, whereas issues with systems and technologies were more
of an excuse. Once the E1 Company provided more certainty to the workforce by
formally setting time aside for Near Miss reporting, dedicating human resource, and
recognising high performers, Near Misses reporting rates went up dramatically.

204
On reflection, the system side improvements were also effective. New features such
as shortening the time needed for reporting a Near Miss by introducing better
intelligence into the data entry form and providing real-time visualised analytics for
managers and workers to recognise top Near Miss reporters were well received by
the E1 Company. However, my understanding is that if the company did not make
changes on the human side, these improvements on the system side alone probably
would not succeed.
Furthermore, Episode One helped me to further develop ISACAM by introducing two
additional dimensions: “Uncertainty Type” and “Solution Type” into the later
version 1.1. The “uncertainty” dimensions revealed its importance for identifying
root causes on the human side, that is, frontline workers were uncertain on both
“spatial” and “temporal” dimensions thus they tend to put off Near Miss reporting.
The articulation of uncertainty dimensions also played a role when designing
effective solutions. The E1 Company was able to explicitly improve workers’
confidence on both dimensions which in turn drastically changed their Near Miss
reporting behaviour.
The dichotomy of “Friction Reducer” vs. “Torque Booster” offered a great clarity to
the solution design. I could explicitly examine what would drive forward the Ops
Agility cycle and what would slow it down. By applying improvements on both
dimensions optimal results were experienced. Therefore a “Solution Type”
dimension has been formally introduced to the ISACAM models as an additional
dimension dedicated for designing solutions to solve IS Agility problems.
205
5.2.3 Episode Two – A ”Diagnosing” Problem
5.2.3.1 The Problem and Context
Episode Two was based on another problem-solving case for a major energy
company (hereafter named the E2 Company) who has almost two thousands of
users accessing NOHARM on a regular basis. Episode Two was chosen for two
reasons: firstly, it represents a typical IS Agility problem with which the agent had
lost Synchronicity in its SDSE cycle due to the lack of “diagnosing” ability. This in
turn led to unresponsive or even paralysed agent (in this episode, safety managers
and advisors at the E2 Company) which then resulted in chronically delayed
decisions and actions; secondly, this episode allowed me to reflect and evolve
ISACAM to a fuller version (from version 1.1 to 1.2) with the inclusion of new
elements (e.g. Human vs. Machine as two main Control Types for solution design
which will be discussed in the following sections).
The E2 Company is one of the main fuel providers in New Zealand with storage
tanks, retail sites, and logistic network all over the nation. The environmental and
safety risks posed by the nature of operation in this industry, i.e. storing and
distributing inflammable and explosive substance, are considerably high and
require significant efforts to control. Since 2011, the E2 Company has been actively
using the NOHARM system to support its safety risk management practice with the
intention of leveraging technologies to gain agility in operations, e.g. making
effective and timely responses to safety events (i.e. Incidents occurred, Hazards
identified, Near Misses observed) through initiating appropriate investigations and
issuing corrective actions.
The adoption of NOHARM has clearly improved the “sensing” ability of the E2
Company which resulted in a steady and significant increase in the number of safety
events being reported and recorded. As shown in Table 25 below, according to data
stored in the NOHARM system, in 2012 alone, 2,610 records were entered in the
NOHARM system, climbing from 510 in Q1 to 851 in Q4. In 2013 the number was

206
then almost doubled at 5,040. Although many of the safety events didn’t result in
severe consequences, they can provide valuable data points for generating insights
into the effectiveness of safety management program and operational risk controls.
The E2 Company was pleased to be able to collect data of higher volume and better
quality.
Table 25: Number of Safety Events reported between 2012 Q1 and 2014 Q3
Data Source: The NOHARM System (Visualised in Microsoft SSRS 2014)
However, the “diagnosing” ability at the E2 Company, on the other hand, was unable
to catch up with the pace of increase in the volume of data. Safety advisors found
themselves swamped by event analysis tasks and could barely make timely
responses. In safety risk management, a standard practice for diagnosing safety
events, is to first classify them into event categories (some are common e.g.
Fire/Explosions, Motor vehicle accident, while others are more specific depending
on the nature of business e.g. Robberies, Vapour leaks/Emissions to air); next
identify the hazard sources that caused the events (e.g. Electricity, Chemicals,

207
Ergonomics, Psychological, Structural stability, Temperature etc.); and then assess
the level of associated risks by estimating likelihood of recurrence and consequences.
Subsequently, the persons processing the information need to decide if further
detective work is needed, in the form of full investigation or simple investigation. If
an investigation is initiated, the investigator, based on the findings, will issue
corrective actions to make changes in either the business operation or the safety
management practice.
For each occurrence, the whole “diagnosing” process of analysing a safety event to
decide if further investigation is needed may take from as little as 30 minutes to as
much as several hours, depending on how much is known about the associated risks
and hazard sources, how well the event details are documented, and how efficient
and effective the person is while conducting such processes. The NOHARM system
has been designed to support the whole process through configurable workflow
with which relevant roles will be notified via emails at different stages of the
process.
At the E2 Company, for many years prior to the implementation of NOHARM system,
the average time needed to analyse a safety event was about two hours. In most of
the times, when an event was reported to the safety management office, officers
needed to interview the key people involved either through phone call or in person
and then document all the details they gathered to make decisions on appropriate
investigations.
After the implementation of NOHARM, the average time needed for analysing safety
events and deciding investigations has been reduced significantly to merely an hour.
As people who report safety events now can write up detailed descriptions &
comments, attach documents and photos in NOHARM, safety advisors have found it
much easier to make judgements and draw conclusions based on the first hand
information directly available to them in the system.

208
Although NOHARM has successfully helped the E2 Company to reduce some 50% of
the average time needed for analysing a safety event, safety managers and advisors
did not see themselves as responsive as they wanted to be hence were still
requesting higher level of agility. They were more concerned with the delay in
taking corrective actions after safety events being investigated. As shown in Table
26, throughout the whole year of 2012, the average days between events being
reported in the NOHARM system and corrective actions being issued was about 30
days.
Table 26: The Average Days Taken to Issue Corrective Actions 2012 Q1 to
2013 Q2
Data Source: The NOHARM System (Visualised in Microsoft SSRS 2014)
Waiting for 30 days to issue corrective actions was unacceptable to the E2 Company
and is generally considered a slow response in safety management. The longer the
lead time is before new actions are taken to rectify the situation, the more room left
for the reoccurrence of safety events with undesirable consequences, and of course,
the longer the wait to assess the effectiveness of the corrective actions.
In Q2 2013, the E2 Company conducted a major review on its safety risk
management process and gave clear instructions to the safety managers and
advisors that they needed to “shorten the cycle” and make the workflow more “agile,
simple, and quick”. One of the key targets was to reduce the lead time for issuing

209
corrective actions from 30 days to 20 days in three months, and then down to 15
days in the following quarter. This way, the E2 Company would have a twice faster
operational cycle for sensing, and diagnosing safety events, as well as making
proper responses to prevent future occurrence.
5.2.3.2 The Initial User-Driven Solution and Results
At the E2 Company, the original setup in NOHARM, before Q2 2013, was to trigger
an email alert for every single safety event occurred and send to one of the two
safety advisors based in the head office. Once received an email alert, a safety
advisor would log in to the NOHARM system and read the event details following the
hyperlink in the email. Depending on the details reported, the safety advisor would
decide if it was necessary to contact the key people involved and the line manager
for further information. If the event caused no harm and was deemed of low risk, the
safety advisor could take a “fast track” to close the event and initiate no
investigations meaning no corrective actions were required. Such a fast track, may
take anywhere between 20 minutes to an hour. However, if the event caused serious
harm and/or was deemed of high risk, the safety advisor would need to interview
the key people involved (can easily take several hours or a day) to decide if a full-
scale investigation was necessary. A full investigation would take several days (or
over a week) and would result in a series of corrective actions to improve the
situation by better controlling the operational risks involved. For events falling in
between, a shorter form investigation (one day only) would be initiated and
corrective actions would also be issued in most of the cases.
As mentioned in the previous section, with the support of NOHARM, the E2
Company has managed to reduce the average diagnosing time of individual safety
event from two hours to one hour. However, with such a performance increase, the
average days taken to issue corrective actions almost remained the same, that is, 30
days more or less, for six quarters after the implementation of NOHARM. Given the
targets set by the E2 Company’s management team in Q2 2013, namely, reducing
210
the 30-day delay to 20 days and then to 15 days, the safety managers started to
review the event diagnosing process used by the safety advisors with an intention to
identify the bottlenecks that were causing the delay. They estimated that to achieve
the “15 day” target, a safety event must be diagnosed, with investigations issued (if
needed) within 5 working days after the occurrence. Back in Q1 2013, it was
common to see a safety event only got processed three weeks after it entered the
NOHARM system. Yet there was a long queue of events from earlier time waiting to
be diagnosed.
Based on their understandings towards safety event diagnosis and the NOHARM
system processes, the safety managers identified the bottleneck for the delay was
the capacity of the two safety advisors processing safety events. They believed the
two safety advisors had done their best to keep up with the drastically increasing
number of safety events which raised over 200% from Q1 2012 to Q1 2013. As at Q1
2013, for every quarter there were over 1,000 safety events being reported in the
NOHARM system and each on average took one hour to process, meaning the two
safety advisors had to put in over 75 hours of work every single week merely to go
through the events and initiate investigations. This means, to be able to complete
event diagnosis within 5 days after they occur was next to impossible. The two
safety advisors could not afford working full time on the NOHARM system just for
processing safety events. Each of them could only dedicate 15 hours per week on
this matter as they both had other commitments and responsibilities (e.g. following
up on corrective actions, assessing organisational hazards, producing/reviewing
reports, training staff members, visiting high-risk sites, etc.). In total, the two safety
advisors could spend 30 hours every week in total on diagnosing safety events
which means a “45 hours” gap was left unattended on a weekly basis. Such a
discovery effectively explained the 30-day lag in issuing corrective actions and the
long queue of historical events not being processed for weeks, if not months.

211
Similar to Episode One, the whole processes of problem solving can be briefly
summarised in an ADS as a work domain analysis, see Table 27 in the next page.
Table 27: ADS Problem Solving of Episode Two
System
(Whole SaaS solution containing multiple modules)
Unit
(Incident management
Module)
Component
(Company workflow
configuration)
Part
(Email alerts for assessment)
Purpose & Meaning
Improve workplace safety, reduce injuries/harms, and control risks
Domain Values & Priorities
Make prompt and effective responses to safety incidents
to prevent future occurrence
Domain Functions
Assess safety incidents to
initiate investigations and corrective
actions
Technical Functions
(bottleneck lies at this level)
Safety advisors receive email
notifications for diagnosing events
but cannot catch up with the pace
Physical Form Internet connection, Computers, Phones, Servers are all readily accessible
1
2
3
4
2 5

212
In short, the E2 Company found no issue with the top layers of abstraction such as
purposes, priorities, and domain functions in the work domain setup. The NOHARM
was performing well as per its design at the system, unit, and component level of
decomposition. Both advisors operating the NOHARM were highly functional and
held values and beliefs consistent to the organisation’s safety management
framework. They had no problem with their physical equipment or devices thus
could technically function well in the NOHARM system and any other systems they
needed to work on.
However, the only problem, deemed by the E2 Company, was the limited capacity of
the safety advisory team. Such a limitation led to the undesirably low throughput
the technical function level where tasks had been left unattended on a regular basis.
Resultantly, the solution approved at the E2 Company was to bring another full time
safety advisor on board to improve the capacity. To fill up the “45 hours” gap, this
new advisor would dedicate all her work hours on the NOHARM system to diagnose
safety events in a timely manner, namely, within a week after they occur.
Results
In Q3 2013, soon after the new safety advisor, Agent B was recruited and trained up
to speed with the NOHARM system regarding the processes of diagnosing safety
events, the E2 Company started to see a significant increase in event diagnosing
speed. The “30-day lag” was reduced to 20.7 days in Q3 2013 for the first time (see
Table 28). With the new advisor putting in 40 hours work on diagnosing safety
events in the NOHARM system on a weekly basis, the queue of historical events
began to shrink.
However, four months after the new safety advisor’s appointment, one of the two
original advisors, the most senior one (hereafter referred to as Agent A,), sent in his
resignation and accepted a new job offer from another company. It was said that
Agent A, as the virtual leader of the advisory team, had to work extra hours to

213
supervise and review the new safety advisor’s diagnosis and decisions. He was able
to rectify several safety events that did require full investigations yet were assessed
by the new advisor as “no investigation needed”.
Table 28: The Average Days Taken to Issue Corrective Actions after Safety Incidents - 2012 Q1 to 2013 Q4
Data Source: The NOHARM System (Visualised in Microsoft SSRS 2014)
The E2 Company wasn’t totally unprepared for the departure of Agent A. Another
advisor, Agent C was appointed immediately to minimise disruption to the safety
business. Nevertheless, Agent C wasn’t regarded as artful and knowledgeable as
Agent A, especially on diagnosing safety events in the NOHARM environment. From
time to time, Agent C was challenged by line managers regarding his decisions on
more frequent full-scale investigations and demanding corrective actions. Together
with other existing commitments, Agent C couldn’t clear up his queue of safety
events as fast as expected.
To make the situation more difficult, relationships between the three safety advisors
became a bit complicated. Missing Agent A’s leadership and seeing Agent C’s
undesirable performance, the other two advisors were competing to be recognised
as the new leading person in the team. All these human factors, compounded with
the ongoing increase of safety events reported in the NOHARM system, in Q4 2013,

214
the lag in issuing corrective actions had bounced back up to and gone far beyond an
acceptable level, that is, 42.8 days (see Table 28), a historically highest point in the
last two years after the NOHARM implementation.
5.2.3.3 Problem Space Analysis based on ISACAM
Frustrated by the unpleasing results, the E2 Company decided to seek
improvements in the NOHARM system to increase speed and quality of responses to
safety events, as well as to reduce dependency on human agents. Such responses, at
the E2 Company, had been depending heavily on human factors, e.g. capability and
capacity of individual safety advisors, perceived safety justice by line managers, etc.
The E2 Company was hoping to enhance its NOHARM implementation at
engineering level to reduce influence from human factors and to produce agile
responses in a consistent manner.
At the beginning of 2014, The E2 Company approached the NOHARM team for a
system-driven solution to make its safety event management process more agile.
Given the clear instructions from the E2 Company on increasing agility and “shorten
the cycle” and my previous success with addressing IS Agility problems, I had the
opportunity to analyse the problem and propose solutions. I used ISACAM (an
updated version 1.1 as shown in Figure 21 and Figure 22 below) to construct the
problem space and to design NOHARM based solutions for better performance from
an IS Agility point of view.

215
Figure 21: The Data Model of ISACAM Ver 1.1
Equipped with the upgraded data model and task model defined in ISACAM Ver 1.1,
we first identified that all four IS Agility drivers had strong presence in the problem
space. “Change Frequency” was high as the E2 Company was experiencing hundreds
of safety events every month which were expected to alter its course of action in
safety risk management. “Information Intensity” was high as the sheer amount of
data collected from safety events on a weekly basis had already gone beyond human
cognitive processing which had left the three safety advisors overwhelmed on a
weekly basis. “Time Criticality” was a significant issue as the main trouble faced by
the E2 Company was the inability to produce timely responses (in the form of
corrective actions) to the ever-accumulating safety events. In the energy industry
that never lacks high risk operations, an overlooked minor safety event could lead to
a major blow-up if no effective changes were made in time.
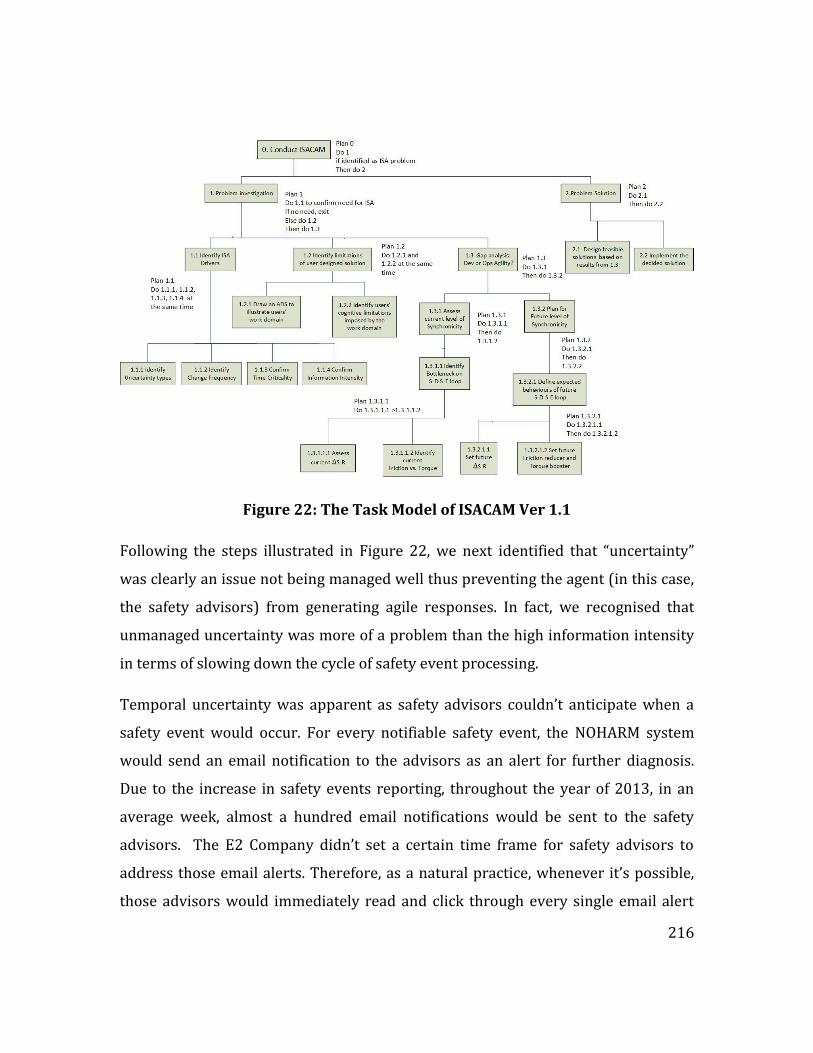
216
Figure 22: The Task Model of ISACAM Ver 1.1
Following the steps illustrated in Figure 22, we next identified that “uncertainty”
was clearly an issue not being managed well thus preventing the agent (in this case,
the safety advisors) from generating agile responses. In fact, we recognised that
unmanaged uncertainty was more of a problem than the high information intensity
in terms of slowing down the cycle of safety event processing.
Temporal uncertainty was apparent as safety advisors couldn’t anticipate when a
safety event would occur. For every notifiable safety event, the NOHARM system
would send an email notification to the advisors as an alert for further diagnosis.
Due to the increase in safety events reporting, throughout the year of 2013, in an
average week, almost a hundred email notifications would be sent to the safety
advisors. The E2 Company didn’t set a certain time frame for safety advisors to
address those email alerts. Therefore, as a natural practice, whenever it’s possible,
those advisors would immediately read and click through every single email alert

217
right after it arrived in their mailboxes. Such a practice, on the surface, was to
ensure every safety event gets attention from the safety advisors as soon as possible.
However, the result was far from satisfying as each email alert could cause a
considerable interruption and distract a safety advisor from the task he or she was
working on. Some a hundred interruptions at random times during an average
week on a regular basis could easily break people’s concentration and cognitively
overload the safety advisory team, which in turn deteriorated their performance
and job satisfaction in general (part of the reason for Agent A’s resignation).
Spatial uncertainty was apparent and not controlled formally in this problem space.
Safety advisors didn’t have explicit guideline to follow when diagnosing safety
events. They had to interpret and analyse the safety events one by one using their
own experience and expertise. No standard or predefined rules for advisors to rely
on when deciding if an event will require full investigation, short investigation, or no
investigation. Most of the judgements and decisions were based on tacit knowledge
communicated among safety team members. Although in many cases when the risks
associated with the safety events were obviously insignificant, the process would
run relatively smoothly as agreement could be promptly reached between safety
advisors, in other cases, especially with medium to high risk events, conflicting
opinions often appeared and required much more time to reconcile. Furthermore,
without a certain set of rules to decide types of investigations, the decisions of a
safety advisor, particularly when suggesting full scale investigations (often require
significant effort and resource from the manager in charge) in the reporting lines
where safety events occurred, tended to invite challenges from the line managers
who considered initiating full investigations a “overkill” given their circumstances
(line managers’ resistance to Agent C’s decisions on full investigations was an
example).
Next, we identified that the E2 Company was mostly attempting to improve its Ops
Agility cycle in terms of processing and responding to safety events. Dev Agility was

218
not a real concern as the E2 Company was focusing on addressing the “information
intensity” issue by adding more human safety advisors into the cycle and didn’t
envisage any system development effort from the NOHARM team. Essentially,
speaking the IS Agility language developed in this thesis, the problem faced by the
E2 Company was not about how fast and well the IS development team could act
upon changing system requirements, rather, it was that the IS users were swamped
by the data/information collected and performed poorly at the “diagnosis” stage
thus could not cycle through the whole process in a timely manner with acceptable
quality.
Figure 23: The SDSE Mapping Table for Episode Two

219
In summary, as shown in Figure 23 above, “diagnosis” was identified as the
bottleneck of the Ops Agility cycle at the E2 Company in terms of safety events
processing. With the support of NOHARM, the E2 Company’s “sense” performance
was increased drastically thus collected large amount of data that overwhelmed the
“diagnosis” capability (limited by the capacity of the safety advisory team). However,
through analysing the investigation processes at the E2 Company, once an event was
diagnosed and investigation initiated, the “select” phase would run smoothly by
deciding what corrective actions should be issued. Next, the “execute” phase,
according to historical data, did also perform well in terms of the actual execution
and completion of corrective actions.
The current value of ∆S-R and its expected future value were already identified at
the E2 Company with the former being some “30 day delay” in issuing corrective
actions (bounced back from 20.7 in Q3 2013 to 42.8 in Q4 2013 as shown in Table
28) and the latter being “15 days”. The desirable outcome would be to first clean up
the historical backlog (as at Q1 2014 some 80 safety events were still left not
diagnosed) and then set up a new event processing mechanism that can diagnose at
least 200 safety events on a fortnightly basis. 200 was a relatively conservative
number calculated based on the past data thus the E2 Company was expecting to see
a higher number in the following months.
5.2.3.4 The Final ISACAM-Driven Solution and Results
Proceeding with ISACAM, the “Current Friction” was seen as high and largely due to
the “Spatial Uncertainty” caused by the lack of explicitly articulated criteria for
assessing the necessity of full scale investigations vs. short investigations. Without
an officially defined standard, every event was an uncertain situation that required
ad-hoc analysis. The safety advisors had to rely on their own discretion in initiating
investigations through reviewing every individual event one after another. This
meant the judgements made would not be always consistent across events and
between advisors which would leave much room for line managers to challenge.

220
Launching a full-scale investigation is generally demanding in human resource and
often cause interruption to business operation of the reporting line being
investigated. Therefore, line managers have a natural tendency to resist, sometimes
even make counter-offers to full investigations in their lines of business. In contrast,
short investigations are less unpleasant to line managers. Of course, “no
investigations needed” is most desirable from a business operation standpoint but
not necessarily from a safety risk management perspective. In short, the “Spatial
Uncertainty” is fuelled up with the interpersonal Friction inside the safety advisory
team as well as between the safety advisors and line managers. Such a Friction was
mostly a result of inconsistency caused by the missing of a commonly-agreed
explicitly-defined basis for initiating investigations.
To create a “Friction Reducer” in the E2 Company situation, certain degree of
“Spatial Confidence” needed to be established. The E2 Company was recommended
to institute an organisational standard set of criteria for deciding “definitely
requiring full investigation”, “definitely requiring short investigation” and
“definitely not requiring investigation”. A set of formally prescribed criteria can
help minimise unnecessary disagreements and conflicts which had been slowing
down the event diagnosing process (the identified bottleneck of the Ops Agility cycle
in this Episode). The safety advisors originally doubted the possibility of articulating
an explicit set of criteria for such a purpose as the decisions on investigations can be
influenced by many factors including event type, incident categories, product type,
parties/people involved, actual consequence, and potential consequence etc. However,
I argued that there was no need for the initial set of criteria to be perfect and
achieve 100% accuracy, rather, a set of criteria that were good enough to perform
80% of the time would be sufficient as a starting point for batch processing safety
events. For those 20% safety events that could not meet any of the defined criteria,
ad-hoc analysis would be carried out to help refine the initial set of criteria.
221
Soon in February 2014, the E2 Company organised a full day workshop including
the whole safety advisory team, safety managers and several representative line
managers to define the criteria. Based on the historical data, they defined nine types
of safety events (e.g. Spills to water, Spills to ground, Process safety incident,
Robberies, Fuel quality, etc.) that would definitely require investigations. The choice
between a full-scale investigation and a short version would be decided by other
factors including parties/people involved, product type, and consequences, etc. With
no intention to generate a perfect algorithm in the first place, the previously deemed
impossible task of articulating a set of explicit criteria for initiating investigations
was completed without a problem.
Following the ISACAM process, the “Current Torque” was recognised as very low.
The safety advisors were the only drivers to move forward the Ops Agility cycle by
manually diagnosing safety events and initiating investigations. To make their
performance worse, the advisors were following the lead of email alerts generated
by the NOHARM system to attend safety events one by one in a piecemeal by
piecemeal manner which caused significant interruptions to their concentration.
They were struggling to keep up with the increasing number of safety events
entered into the NOHARM system while working on other responsibilities. To
improve the “Torque”, the E2 Company had already increased the number of safety
advisors in the cycle, however the resulting performance was unstable and not
sustainable if the number of safety events kept rising.
Therefore, a “Torque Booster” should be designed from the software system side,
rather than from the system user side. Such a recognition later led to the formal
inclusion of a new dimension “Control Type (Human vs. Machine)” in the ISACAM.
We started to evaluate the feasibility of replacing “human controlled processes”
with “machine-controlled processes” through automation and the potential
improvement in agility performance. Given the safety event processing capability at

222
the E2 Company was mostly depending on human agents and their knowledge, We
believed major breakthrough could be made via extracting the tacit knowledge from
the safety advisors and automating their event diagnosis processes.
After reviewing historical data to analyse the outcomes from past two years of
safety event processing, I was able to see a clear trend that although the total
number of safety events had been increasing, the percentage of events requiring
investigations had been dropping significantly from 2012 to 2013. As shown in
Table 29 below, according to the data kept in the NOHARM system, the percentage
of events requiring full scale investigations had been gradually trending downwards
from above 5% in Q1 2012 to below 1% in Q4 2013. The percentage of events
initiated short investigations was receding from some 29% to slightly above 7%
during the same period. In the meantime, the percentage of events resulted in no
investigations had raised from some 65% to over 90%.
Table 29: Number of Safety Events by Investigation types 2012-2013
Data Source: The NOHARM System (Visualised in Microsoft SSRS 2014)
The review of historical investigation data (shown in Table 29) gave me enough
confidence that if a machine-based agent could be designed to automatically pick
out those safety events definitely requiring “no investigations”, we could effectively
remove up to some 90% of the workload from those struggling human agents, i.e.

223
the safety advisors. We could then leave the 10% safety events that potentially
require investigations for human agents to scrutinize and decide if a “full scale” or a
“short form” investigation was necessary.
After the E2 Company formally established a set of criteria for initiating
investigations in February 2014, we, as the NOHARM development team and service
provider, within two sprints (meaning four weeks), were able to design and
implement a system-driven “Torque Booster” through an automated event
classification algorithm, later called the “auto-triaging” function by the E2 Company
internally. Such a function was based on the NOHARM workflow configuration thus
the safety advisors could set up the criteria themselves for machine-driven
automated event processing. In this fashion, safety events were classified into three
groups:
Group One was the most information intensive group and contained the majority of
safety events (up to 90% according the historical data shown in Table 29) that were
“definitely not requiring investigations” (i.e. customers dialling on mobile phones
while filling cars with petrol at the forecourts of service stations ). This group of
events would be automatically forwarded to relevant line managers to review and
close without further investigations. In other words, these events were to be
automatically triaged by the NOHARM system itself without sending email alerts to
safety advisors. Of course, if a line manager believed investigation was needed while
reviewing the events forwarded by the NOHARM, he/she could assign the event
back to a safety advisor and request a “human-driven” diagnosis. As at Q1 2014,
there were about 180 line managers of all levels at the E2 Company, each could
easily spare fifteen to twenty minutes every week to review a couple of safety
events (may well be none, depending how risky their lines of operation were)
classified by the NOHARM system as “no investigations required”.

224
Group Two contained those events that met the criteria for “definitely require
investigations”. For this group, the company maintained the conventional approach
by sending email notifications to the safety advisory team directly to invite further
detective work. However, the number of email alerts sent by the NOHARM system
to the advisors were expected to reduce by 90% from the past due to the “auto-
triaging” function started processing some 90% of the events (Group One)
automatically without sending emails to safety advisors. In fact, to further reduce
temporal uncertainty and minimise interruptions to safety advisors, a summary
report was developed using Microsoft SSRS to list all the Group Two safety incidents
occurred during the day that require attention from the advisors. This report was
then scheduled to send to safety advisors once a day to eliminate the need for
frequently checking emails for updates.
Group Three consisted of safety events that didn’t meet the criteria of the previous
two groups. This group, would represent a smaller number of events and was
expected to shrink over time. The events falling in this group would be sent to safety
advisors to analyse and help refine the established criteria for the previous two
groups. Through continuous learning and adjusting the criteria, the accuracy of the
auto-triaging function would improve and the number of events falling in Group
Three should drop, ideally, to zero. However, even if Group Three could never be
eliminated, it should only represent a slightly extra workload on top of Group Two
which was easily affordable to the safety advisory team.
Essentially, the approach to diagnose Group One was the main component of the
“Torque Booster”. Such an approach completely changed the nature of safety event
processing at the E2 Company from the original “human-driven” manual analysis
that was heavily limited by the capacity of the safety advisory team, to a “machine-
driven” classification (the “auto-triaging”) mechanism coupled with a “quasi-
crowdsourcing” feedback system (over 180 line managers to provide feedback for

225
the classification results done by machines). Since the implementation of this
“Torque Booster”, the event processing speed and capacity were no longer depleting
the cognitive horsepower of the safety advisory team. In other words, the
“bottleneck” at the “diagnosis” phase of the Ops Agility cycle in this Episode could be
effectively resolved. We were expecting the ∆S-R to begin reducing in Q2 2014.
Results
After the full implementation of the “Torque Booster” and the “Friction Reducer“ in
March 2014, the E2 Company started to experience significantly improved
performance in safety events processing. The Ops Agility cycle began to run much
more synchronically as the bottleneck at the “diagnose” phase was resolved by the
boosted processing capacity generated from the auto-triaging function in the
NOHARM system. As shown in Table 30 below, the average days taken to issue
corrective actions dropped to a historical low number at 16.7 in Q2 2014 and then
to 12.7 Q3 2014. The E2 Company was reassured and contented to see its safety
risk management system become much more responsive to safety events with a
decent level of accuracy in initiating appropriate investigations.
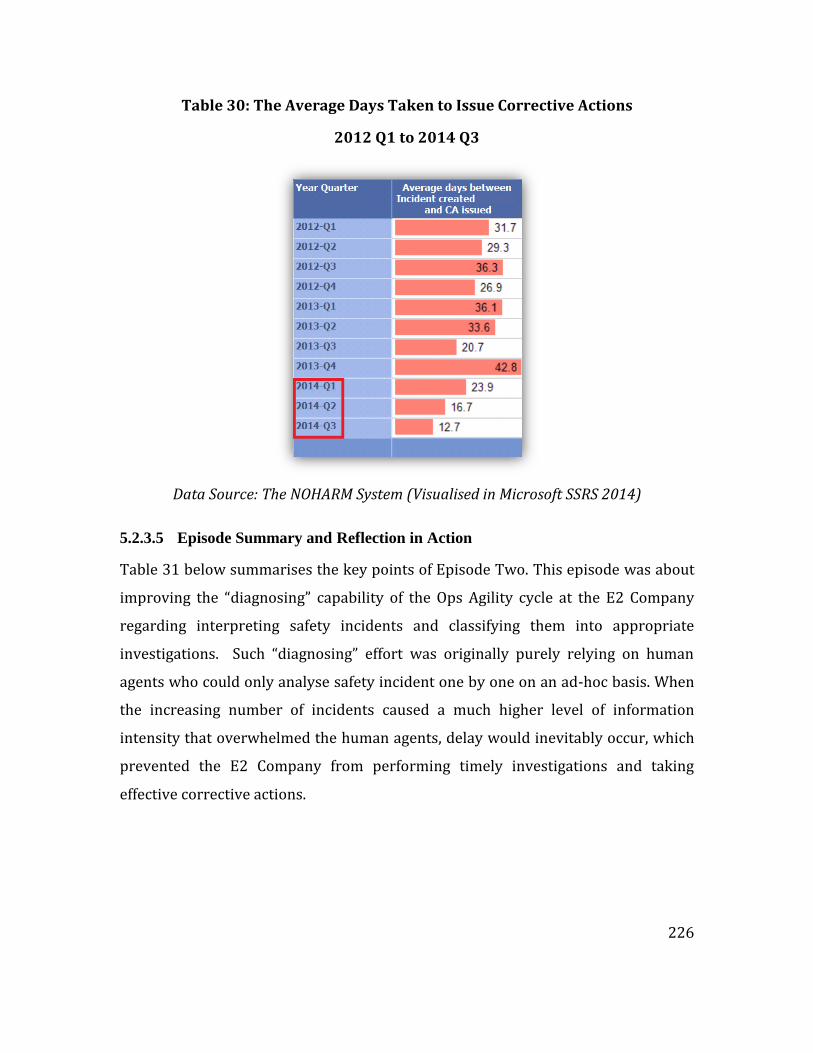
226
Table 30: The Average Days Taken to Issue Corrective Actions
2012 Q1 to 2014 Q3
Data Source: The NOHARM System (Visualised in Microsoft SSRS 2014)
5.2.3.5 Episode Summary and Reflection in Action
Table 31 below summarises the key points of Episode Two. This episode was about
improving the “diagnosing” capability of the Ops Agility cycle at the E2 Company
regarding interpreting safety incidents and classifying them into appropriate
investigations. Such “diagnosing” effort was originally purely relying on human
agents who could only analyse safety incident one by one on an ad-hoc basis. When
the increasing number of incidents caused a much higher level of information
intensity that overwhelmed the human agents, delay would inevitably occur, which
prevented the E2 Company from performing timely investigations and taking
effective corrective actions.

227
Table 31: A Brief Summary of Episode Two
Functional Group: Safety Advisors - from the E2 Company
Episode Two – Excessive delay in safety events assessment
The original solution – summarised in Abstraction Decomposition Space(partial)
System Purpose
Improve workplace safety, reduce injuries, and control risks
Domain Values Make prompt and effective responses to safety incidents to prevent future occurrence
Domain Functions
Diagnose safety events to initiate investigations and corrective actions
Technical Functions
Initial User Driven Solution: Added more safety advisors to speed up the process of analysing details of incidents and assigning appropriate investigations
Physical Resources & Material Configuration
Each safety advisor had reliable Internet connection for accessing the incident data stored in the information system
Results The following quarter had seen noticeable drop (from 33.6 days to 20.7 days) in the delay between safety incident and corrective actions. However, the next quarter had experienced a far greater delay (from 20.7 days to 42.8 days) caused by staff turnover in the safety advisory team.
ISACAM (Ver 1.1) based Problem Analysis
Change Frequency: High Uncertainty: High Information Intensity: High
Time Criticality: High
Problem lies on Ops Agility Cycle: Yes Dev Agility Cycle: No
∆S-R: Currently a month, expected to be two weeks
Symptoms Many safety incidents were not diagnosed as soon as they occurred, rather, they had accumulated in a long queue to be processed by safety advisors in an ad-hoc manner. The average delay between safety incidents and necessary corrective actions had been over 30 days which was

228
expected to be reduced to half.
Root Causes Safety advisors were the only agents responsible for scanning and assessing safety incidents to initiate investigations. The quarterly number of safety incidents had doubled which overwhelmed those advisors. Spatial uncertainly was high as no explicitly defined criteria were used when diagnosing incidents thus the quality of diagnosis depended solely on the experience and knowledge of the safety advisors. Temporal uncertainty was high as email alerts could be sent to safety advisors and interrupt their work anytime during the day.
ISACAM based Solution Design
Torque Booster
Based on predefined criteria, to design a machine-driven auto-triaging function to automatically pick out those incidents needing no investigations vs. definitely requiring investigations.
Friction Reducer
To reduce “spatial uncertainty” by extracting a set of explicitly defined criteria for assessing investigation needs. To reduce “temporal uncertainty” by summarising incidents needing human attention into a daily report automatically sent to safety advisors for review.
Results The following three quarters had seen a continuous drop in the delay between safety incidents and necessary corrective actions (from 23.9 days to 12.7 days).
Evolution of ISACAM
Control_Type (Human Control vs. Machine Control) was added as a new dimension for solution design to explicitly define the level of automation can be achieved.
When faced with drastically increasing information intensity, it is natural to design
some automated procedures to leverage the computational power of machines.
However, such a design needs to be grounded in the specific context with an in-
depth understanding of the business problems in question. It is essential to
229
articulate patterns and trends suggesting what happened in the past, what is the
problem at the present, what is intended to be achieved in the future.
To boost the “diagnosing” performance, a machine-driven and rule-based “auto-
triaging” function was designed and implemented in the NOHARM system to help
the E2 Company automatically filter out safety events that were “definitely not
requiring investigations. This solution was successful mostly due to the fact that
almost 90% of the safety events reported at the E2 Company indeed did not require
investigations. Without the upfront data analysis revealing the 90% figure, the
solution probably would be designed in a different way.
Uncertainty, again, played a critical role in slowing down the agility cycle of human
agents. Either spatial uncertainty or temporal uncertainty is enough to compromise
performance of people. Both together, fuelled with excessive information intensity,
can make human agents procrastinate on decisions and actions, if not paralysed.
I have found that improvement can be gained through merely establishing some
form of confidence or assurance on either “spatial” or “temporal” dimensions, or
even better, on both. For instance, in Episode Two, having an explicitly defined set of
criteria, even though not perfectly exhaustive, for classifying safety incident into
types of investigations, clearly improved “spatial confidence” and speeded up the
incident investigation process by minimising the case-by-case judgements from
different safety advisors and line managers. By summarising all Group Two
incidents into one single report and sending it out once a day, the safety advisors
established more “temporal confidence” knowing they would not miss any incidents
needing their attention, without having to check their emails frequently throughout
the day.
In addition, as a result from Episode Two, I extended ISACAM models by including
an extra dimension called “Control Type” to enforce explicit assessment and

230
articulation of the trade-offs between “Human Control” and “Machine Control” while
designing solutions for improving agility.
5.2.4 Episode Three – A “Selecting” Problem
5.2.4.1 The Problem and Context
Episode Three was based on a problem-solving case for another major energy
company (hereafter named the E3 Company) who has over two thousand active
users accessing the NOHARM system on a regular basis. Episode Three was chosen
to be reported for two reasons: firstly, it represents an IS Agility problem where the
weak “selecting” ability caused delay in deciding responses to the identified changes
(in this episode, many corrective actions were not issued in a timely manner
through the safety auditing processes at the E3 Company); secondly, this episode
helped me to reflect and evolve ISACAM to an even fuller version (from version 1.1
to 1.2) with the inclusion of an important dimension, i.e. the DIKW (Data-
Information-Knowledge-Wisdom) cognitive hierarchy which will be reflected on at
the end of this episode.
The E3 Company is one of the leading gas and electricity providers in New Zealand
with power lines and gas network supporting some half million homes, businesses
and organisations across the nation. The E3 Company acknowledges the high level
of safety risks faced in its daily operations and has been dedicated to continuous
improvements in its safety practice. Instead of the traditional, reactive,
incident/injury-driven approaches (i.e. learn from hindsight), the E3 Company has
taken a more proactive stance by conducting comprehensive safety audits across
high risk business areas all year round.
The whole audit-based safety risk management approach works in a cyclic manner
which allows it to be neatly mapped into the Agility Cycle. Besides the scheduled
regular auditing (monthly and quarterly) in high risk areas, the E3 Company has

231
been continuously “sensing” changes in its incident frequency rate, risk profile and
obligation requirements in order to identify operational areas for ad-hoc auditing.
Those audits themselves serve as a “diagnosis” tool for the company to understand
gaps and issues between the expected performance and the practice in reality. Every
audit consists of several “elements” within each a list of questions are examined. A
reporting line being audited will receive a final score based on its rating against
each audit questions. Once an audit is completed, the auditor then needs to “select”
necessary responses based on the results. At the E3 Company, if an audit resulted in
a score lower than 100%, corrective actions need to be issued in a timely manner to
make remedies and/or improvements in the affected business areas. Of course,
these corrective actions, once accepted, should be “executed” within the scheduled
time frame.
Since April 2013, The E3 Company has started using the NOHARM system to track
their safety audits which were originally recorded in Excel spreadsheets. The
NOHARM system has improved the “sensing” ability of the E3 Company by collecting
safety events and observations with larger quantity and higher quality. Safety
advisors have become more efficient and effective in terms of detecting where and
when audits are needed. They began to directly prescribe audits in the NOHARM
system which can send email reminders to designated auditors. The auditors, in
general, are requested to start audits on scheduled dates and enter audit results into
the NOHARM system within 24 hours after completion. The intention was to
establish a real-time view of changes occurring in the safety practice and the
business environment of the E3 Company so that effective and efficient responses
could be made.
Such a real-time requirement demands high “diagnose” capability from the auditors
which has been drastically improved by the NOHARM system. Audit templates have
been created, maintained and shared in the system and can be modified and tailored
on the fly to meet the purposes of any particular audits. This “open source” style

232
management of audit templates has boosted the efficiency and speed of auditors as
it allows immediate adaptation of auditing processes to fit the business areas being
audited. Moreover, with the support of the NOHARM system, auditors can easily
access historical incident data and previous auditing results of the business areas
being audited which make their “diagnosis” a lot more effective and accurate.
Because of the improved “sense” and “diagnose” capabilities, the E3 Company has
been able to organise large number of audits. In nine months, from April to
December 2013, the E3 Company had started 1,278 safety audits among which
failed audits had resulted in 587 corrective actions (shown in Table 32 below).
These two figures were significantly high, in fact, over ten times higher than the
average in the same industry where many companies were still following the
traditional reactive method relying on post-incident investigations to diagnose
causes and control safety risks. The E3 Company’s belief has been that through its
proactive auditing approach, gaps and issues in safety practice would be revealed
earlier before they lead to incidents of personal injuries and financial losses.
Table 32: Number of Audits Started and Corrective Actions Issued at E3 in
2013
Data Source: The NOHARM System (Visualised in Microsoft SSRS 2014)

233
To be proactive and able to prevent future incidents, strong performance in “sense”
and “diagnose” is only the half way. Being able to “select” and “execute” effective
responses within a required time frame is the other half. At the E3 Company, the
corrective actions have been expected to be issued as soon as possible against
business areas or processes that didn’t pass their audits. After all, timeliness of
audit-driven corrective actions is crucial to proactive safety management. As it will
be pointless to spend extensive amount of time and effort on detecting gaps and
issues yet then delay actions to rectify and improve.
Even though the auditors managed to pull through over 140 audits and issued over
60 corrective actions in an average month in 2013, the E3 Company was not
satisfied. The dissatisfaction largely came from the delay in issuing corrective
actions subsequent to failed audits. As shown in the last column in Table 32 above,
on average, only some 41.7% of corrective actions were issued within 72 hours after
the completion of audits. 72 hours are more or less acceptable at the E3 Company,
however, still some 35.4% of corrective actions were issued over a week after failed
audits. Such a performance was undesirable.
In December 2013, after the establishment of the WorkSafe New Zealand which
caused a sudden surge in demand for higher safety performance, the E3 Company
has launched a slogan called “building agility and increasing insights” across the
whole organisation as a sign of determination to become faster in making insightful
responses to changes in its business and environment. One of the objectives was to
reduce the delay in issuing corrective actions after failed audits. This means to
maximise the percentage of corrective actions issued within 72 hours while
minimising those issued later than a week. It is deemed that the earlier actions are
taken to correct issues identified during the auditing process, the lower the
operational risk and the safer the workforce.
234
5.2.4.2 The Initial User-Driven Solution and Results
In contrast to other companies following reactive approaches and having only one
or two safety advisors looking after safety audits as part-time assignments, the E3
Company has been keeping dedicated auditors to facilitate its proactive safety risk
management approach. Throughout the whole year of 2013, there were four full-
time safety auditors available in any given month for conducting audits and issuing
corrective actions. Nevertheless, these auditors, even well trained in diagnosing
issues and identifying gaps in safety practice, were still swamped by the large
number of safety audits scheduled each month (on average over some 35 audits per
auditor per month), especially struggling to decide on the resulting corrective
actions within a desirable time frame.
At the E3 Company, the original process for issuing corrective actions after failed
audits was that auditors needed to first discuss with the safety advisors (through
phone calls or emails) of the reporting lines with failed audits. This step allowed
room for negotiation to ensure the corrective actions planned are “feasible and
practical” to the targeted reporting lines. Such a “negotiation” phase was designed to
avoid mismatches that corrective actions issued by auditors are simply not
executable given the circumstances of the reporting lines being audited. Once both
parties can agree on a list of corrective actions, the auditors then would go ahead
and schedule them in the NOHARM system and assign to relevant line managers.
Before the end of 2013, the E3 Company reviewed its auditing processes (both in its
business process and in the setup of the NOHARM system), listened to feedback
from auditors, and decided to alter the approach for issuing corrective actions. The
change was straightforward and to grant full authority to auditors for making
decisions on the nature and timeframe of corrective actions. Essentially, such a
change was to simplify the process by removing the “negotiation” step between
auditors and line-level safety advisors.

235
As mapped out in Table 33 in the next page, within the work domain of proactive
safety auditing, the E3 Company deemed that the “negotiation” step was the key
bottleneck slowing down the decisions on corrective actions. This step was seen as
an obsolete “reassurance” function performed between auditors and line-level
safety advisors manually outside the processes set up in the NOHARM system. It
was difficult and sometimes frustrating for both parties to find time for meaningful
“negotiations” based on thorough understanding of objective facts instead of
subjective opinions. As auditors were always busy with audits in the field, they
found it hard to chase up line-level safety advisors for comments on the practicality
and feasibility of their planned corrective actions. Moreover, operational level
details could be lost in email and phone conversations which in turn lead to
miscommunications.
The E3 Company believed that auditors, over time, had accumulated enough data in
the NOHARM system and sufficient experience through months of intensive safety
auditing. They should be well equipped to make decisions on their own regarding
the practicality and feasibility of corrective actions. Therefore auditors, starting
from January 2014, should issue corrective actions directly to line managers to
execute without having to consult with line-level safety advisors. This way they can
save considerable time and effort which should lead to quicker decisions on
corrective actions. After all, safety advisors at the E3 Company were already very
busy people, as only eleven of them needed to look after all aspects of safety
management (e.g. safety plans, personal protective equipment, access permit, and
regulatory requirements) across 93 reporting lines.

236
Table 33: ADS Problem Solving of Episode Three
System
(Whole SaaS solution containing multiple modules)
Unit
(Audit Management Module)
Component
(Record audit results and Issue
Corrective Actions)
Part
(Email reminders, Audit templates,
Action scheduler)
Purpose & Meaning
Improve workplace safety, reduce injuries/harms, and control operational risks
Domain Values & Priorities
Proactively identify safety issues to correct and improve through intensive auditing
Domain Functions
Conduct audits at defined time and places and issue
corrective actions against failed
audits
Technical Functions
(bottleneck lies at this level)
Auditors swamped by audits and
delayed negotiations with
safety advisors on corrective actions
Physical Form Internet connection, Computers, Phones,
Servers are all readily accessible
1
2
3
4
2
5
237
In the same fashion to previous episodes, the ADS above (see Table 33) summarises
the problem-solving processes at the E3 Company in a work domain analysis style.
No issues were found at the top levels of abstractions, i.e. purposes, priorities, and
domain functions. The bottleneck was found at the technical level where the
“negotiation” between audits and safety advisors could delay the process of issuing
corrective actions for failed audits. The NOHARM system was performing well at all
levels of decomposition, i.e. system, unit, component, and part. However, the
“negotiation” process was not integrated in the NOHARM as a component of the
system, rather, it was done by human agents outside the NOHARM system via emails
or phone calls. In general, no problems were found at the physical form level as all
parties had access to technologies and devices they needed to perform their tasks.
The part level decomposition had seen no issues as well, as all parts existing in the
NOHARM were performing as they were designed for.
Results
Started from the beginning of 2014, auditors were granted full authority to decide
on corrective actions without discussing with line-level safety advisors. However,
instead of the expected faster turnover, the E3 Company had seen a clear
deterioration in the performance of auditors in terms of issusing corrective actions
after failed audits. As shwon in Table 34 below, from January to March 2014, on
average some 51.9% of corrective actions were issued later than a week (worse
than the average 35.4% in 2013). On the other hand, only an average 31.7% of
corrective actions were issued within 72 hours which indicated a sharp drop from
the average 41.7% in 2013.

238
Table 34: Number of Audits Started and Corrective Actions Issued at E3 Company From April 2013 to March 2014
Data Source: The NOHARM System (Visualised in Microsoft SSRS 2014)
The unexpected decrease in performance caused unease at the E3 Company. The
senior management team became more concerned than before, especially when
auditors complained that their stress level and workload went up significantly, yet
the speed of decision making on corrective actions plummeted. Clearly, such a result
from the newly implemted auditiing approach was nowhere resonating with the
company-wide slogan “building agility and increasing insights”. Unsatisfied with the
human-driven decision making performance on issuing corrective actions, the E3
Company turned to the NOHARM provider and started to look for system-driven
solutions for boosting the agility in their auditing processes, particulary the process
related to selecting corrective actions .

239
5.2.4.3 Problem Space Analysis based on ISACAM
In February 2014, the E3 Company initiated a discussion with the NOHARM
provider to explore innovative system functionalities that can provide stronger
support to their auditors to process through the particular “from failing audits to
issuing corrective actions” phase faster. Such type of discussion was considered
beyond the scope of the generic SLAs offered by a SaaS provider thus was treated as
a consulting project.
Given the main motivation of the E3 Company was to speed up the cycle from audits
to corrective actions through potential enhancement in the IS functionalities and
processes, I was assigned to this project to analyse the problem from an IS Agility
perspective and to propose effective yet economical solutions to both parties. This
meant the solution needed to involve minimal modifications of the NOHARM system
and have minimal impact on other clients sharing the system, yet still could shorten
the decision cycle of the auditors and maximise the percentage of corrective actions
issued within a desirable timeframe (i.e. 72 hours after failed audits).
To optimise the understanding towards the problem and propose convincing
solutions, we reused my systematic method for IS Agility analysis - now described as
ISACAM ver1.2, which involved more dimensions in the data model (see Figure 24
below) and more detailed steps in the task model (see Figure 25 below). Evolved
from previous versions, ISACAM ver 1.2 became further structured to allow finer-
grained analysis of the problem space. However, we still experienced some
challenges in assessing trade-offs between the promptness of rule-based machine-
driven decisions and the prudence of collaborative decision-making based on
human knowledge and wisdom. I will discuss this more in detail at the end of this
section.

240
Figure 24: The Data Model of ISACAM Ver 1.2
Following the steps summarised in the task model (see Figure 25), I moved on to
construct the problem space based on the data model illustrated in Figure 24. The
starting point was to focus on the drivers for IS Agility in the auditing process of the
E3 Company.
“Change Frequency” was high as in an average month, the E3 Company was
conducting over 140 audits and issuing over 70 corrective actions across 93
reporting lines. All these activities were intended to detect changes in the business
operations and environments at the earliest time possible, so that prompt and
effective responses can be made to mitigate safety risks and prevent
incidents/injuries. The rationale behind these proactive and frequent auditing was
that the E3 Company had been aggressively expanding its business across the nation
and implementing new equipment, new technologies, plus recruiting new frontline

241
workers/contractors which all contributed to a more turbulent operational
environment.
“Information Intensity” was also high as the amount of data and information being
collected and processed through intensive auditing could easily swamp and paralyse
four full-time auditors if there was no computer-based IS to support them. In fact,
without a modern web-based IS having functionalities specifically designed for
safety auditing purposes, i.e. the NOHARM system, the E3 Company would not be
able to initiate and follow through the large number of audits done in 2013.
“Time Criticality” was high as the earlier issues and gaps can be detected via safety
audits and addressed through corrective actions, the lower the operational risks and
the safer the workforce. Timeliness of corrective actions is critical. The E3 Company
invested significant resource into proactive safety auditing not for merely knowing
where problems were, but more importantly, to act on the problems and rectify
errors before undesirable safety events occur.

242
Figure 25: The Task Model of ISACAM Ver 1.2
Both “Spatial Uncertainty” and “Temporal Uncertainty” were found high which was
affecting the performance of auditors in selecting corrective actions but not in
conducting audits. As illustrated in Figure 26 below (mapped the auditing process to
the SDSE model), after the E3 Company changed its process for issuing corrective
actions, auditors alone were responsible for both conducting audits and deciding on
corrective actions for reporting lines that failed their audits.
Conducting audits, or “diagnosing” as shown in Figure 26 below, was found to be the
easier task by auditors as they had established confidence on both temporal and
spatial dimensions. On the temporal dimension, auditors knew when they should
conduct a particular audit on which reporting lines, as the safety advisors would
create the schedule upfront in the NOHARM system. The system would then send
email notifications to remind the auditors for upcoming audits. On the spatial
dimension, auditors also knew what types of audits they should conduct, which
audit templates should be used, and how to tailor the templates for the targeted
243
reporting lines. In short, the level of uncertainty involved in conducting audits had
been kept low through well-established processes and systems.
Nevertheless, issuing corrective actions, or “selecting” as shown in Figure 26, was a
much more challenging task for auditors. Before the E3 Company decided to let
auditors be the sole decision makers on corrective actions, line-level safety advisors
were brought in to help on decisions. These safety advisors knew more details about
the operations and resources regarding the business lines they were working in
thus could help auditors to design feasible and practical corrective actions that
would be willingly accepted and executed by the managers of these reporting lines.
After the change in January 2014, line-level safety advisors were removed from the
process of issuing corrective actions to save time for the auditors to make quicker
decisions on what should be done in the reporting lines failed safety audits. The
assumptions were that auditors should have accumulated enough experiences to
make optimal decisions on their own with the support from historical data collected
in the NOHARM system.
Such assumptions, however, didn’t reflect the reality. When issuing corrective
actions, auditors were faced with higher level of uncertainties at both temporal and
spatial dimensions. The four auditors were responsible for over 140 audits spread
across 93 reporting lines, every month. To maintain neutrality and avoid building
reciprocity, auditors had been shuffled around on a weekly basis to audit safety
practice in different reporting lines which often operate in very different business
areas. This alone made it hard for auditors to retain in-depth knowledge of the
operational level details at the reporting lines they audited.

244
Figure 26: The SDSE Mapping Table for Episode Three
Consequently, on the spatial dimension, without the support from line-level safety
advisors, auditors started to have more doubts about what should be considered
feasible and practical actions for line managers to take on after failed certain audits.
Not to mention novel issues came along with the introduction of new equipment and
technologies boosted by the expansion of business operations. Safety auditors had
to put in extra time to deliberately study the operational level details of reporting
lines they intended to issue corrective actions.
Even after a deliberately designed corrective action was decided, an auditor could
still have uncertainty on the temporal dimension meaning he/she could not be sure
about the time needed for the action to be completed by the targeted reporting line.
Experienced auditors would be very careful not setting unrealistic due dates for

245
corrective actions as this would cause conflicts between safety auditing and
business operation. Setting unrealistic due dates would later result in overdue
actions, yet the number of corrective actions overdue vs. closed on time was one of
the KPI measures for line-level safety performance.
This had long been a dilemma for safety auditors. Setting aggressive due dates on
corrective actions would not only cause bad-looking safety performance stats with
many overdue actions highlighted in red but disturb the priorities of line managers
which would have a negative impact on business operation and production. On the
other hand, conservative due dates would cause unnecessarily delay in corrective
action. Such delay would result in safety issues not being fixed in time which then
could lead to undesirable safety incidents (e.g. personal injuries or property
damages).
As shown in Figure 26 above, after mapped the E3 Company’s auditing process into
the SDSE loop, the bottleneck was apparently at the “Select” phase where auditors
got stuck and slowed down. The issue was not much on the Dev Agility from the IS
development side, but mostly focused on Ops Agility where IS users couldn’t get
enough support to go through the SDSE loop with a desirable level of Synchronicity.
As discussed in Chapter 2, the “Select” phase is mainly about making trade-offs
between possible responses through assessing each one available. Dove’s four
metrics - time, cost, predictability, and scope – sum up the common criteria
employed by decision makers (either implicitly or explicitly) during such an
assessment (Dove & LaBarge, 2014). At the E3 Company, auditors clearly had to
compromise on the “time” metric but not others. They were not comfortable with
issuing “quick patch jobs” that were not thought over carefully which could portray
a negative image of the auditing team. The auditors were put in a difficult position
as they could not effectively and efficiently assess all four metrics of the corrective
actions on their own. After all, line mangers knew best about priorities, resource
and time available in their own reporting lines thus they were in a better position

246
than safety auditors to tell if corrective actions were feasible and practical according
to local circumstances.
Figure 26 also introduced the DIKW (Data-Information-Knowledge-Wisdom)
cognitive hierarchy (Rowley, 2007) which helped me to understand and articulate
why the “Select” phase went out of Synchronicity. The DIKW hierarchy has been
widely cited in various contexts as a classification scheme for of human cognition.
For instance, the DIKW hierarchy has been an often recommended theoretical
model for knowledge management in the ITIL (Information Technology
Infrastructure Library) training courses. More practically, some thoughtful software
engineers have adopted the DIKW hierarchy in their requirement engineering 18
process to clarify the level of cognitive support a system could provide to human
agents.
As an IS designer myself, I have found the DIKW hierarchy useful for analysing the
“supply and demand” relationship between IS and IS users. For the purpose of
solving this particular problem in the auditing process faced by the E3 Company, I
termed the four levels of DIKW as “Transactional data – Analytical information –
Operational knowledge – Practical wisdom”. I coloured each level to represent its
supply in the IS against the demand from IS users. Red means “not available”,
Orange “little if not no”, Blue “sufficient”, and Green “abundant”.
As shown in Figure 26 , at the E3 Company, particularly in the safety auditing
process, the “Sense” phase was done by safety advisors who needed to access
“transactional data” and “analytical information” which were strongly supported by
the IS, i.e. the NOHARM system, thus they could complete their tasks within a
satisfactory timeframe. The “Diagnose” phase was done by auditors who mostly
needed “operational knowledge” of how to conduct safety audits, and “analytical
18 http://mitosystems.com/how-to-write-requirements/

247
information” of how the reporting lines being audited were tracking against safety
performance targets. The need for “analytical information” was directly satisfied by
the NOHARM system, whereas the need for “operational knowledge” was satisfied
by the auditors themselves as they were all competent and well-trained safety
auditors. Therefore the “Diagnose” phase had no trouble to be completed in time.
Nevertheless, the “Select” phase, as shown in Figure 26 above, required “operational
knowledge” and “practical wisdom” regarding the operations and resources at the
reporting lines being audited. The knowledge and wisdom needed was clearly out of
reach to an “information” system (i.e. the NOHARM) yet was not possessed by the
human agents (i.e. the safety auditors) who were assigned to be the sole performer
of the “Select” task and to decide on corrective actions. Such knowledge and wisdom
was more accessible to line managers, yet they were not involved in the “Select”
phase at all. The line managers only got called in at the “Execute” phase to allocate
resources and supervise the execution of corrective actions prudently evaluated and
decided by safety auditors at the “Select” phase. Following the same logic,
unsurprisingly the E3 Company had no issue at the “Execute” phase because as long
as the corrective action selected were practical and feasible, line managers with
abundant “operational knowledge” supported by the NOHARM system providing
sufficient “analytical information”, would execute them within a desirable time
frame.
Through the above structured analysis, it became clear that the “Torque” at the
“Select” phase was too low to drive the auditing process forward in Synchronicity
with other phases of the Ops Agility cycle, i.e. “failing audit and issuing corrective
actions“. The auditors were the only driver pushing through the decision process,
yet they often did not have immediate access to the operational knowledge and
practical wisdom needed for the decisions. Not to mention that the auditors were
already swamped and interrupted on a regular basis as they needed to travel from
one site to another to conduct scheduled safety audits.
248
On the other hand, the “Friction” was high enough to keep the agent (i.e. safety
auditors) from choosing responses in a timely manner (i.e. prompt decisions on
corrective actions). The practicality and feasibility of the decided corrective actions
seemed to be commonly associated to the reputation and authority of auditors.
Auditors were openly concerned that corrective actions with poor practicality and
feasibility would cause complaints or even rejections from line managers due to the
potential interruptions on business operations.
Resultantly, although the E3 Company had expected a shorter ∆S-R by demanding a
“less than 72 hours” response time between “failing audits” and “issuing corrective
actions”, all four auditors found it difficult to achieve. They would not risk issuing
corrective actions that potentially could be considered “impractical” or “unfeasible”,
rather, they would deliberately spend more time and effort on ensuring the quality,
not the speed, of their decisions.
5.2.4.4 The Final ISACAM-Driven Solution and Results
Through ISACAM problem space analysis, it became clear that to bring
Synchronicity into the SDSE cycle of the auditing function at the E3 Company, the
key was to improve the performance at the “Select” phase. In this auditing scenario,
such a “Select” phase required operational knowledge and practical wisdom which
were not directly accessible to the sole performer (i.e. the auditors) of this phase.
Other human agents (i.e. line managers) who possessed these knowledge and
wisdom were left out from the “Select” phase.
Consequently, the auditors were unable to make prompt and confident decisions on
corrective actions. In other words, the auditors were stuck in the deliberative mode,
not moving to the implemental mode (Gollwitzer, Heckhausen, & Steller, 1990), and
kept elaborating on the correctivness of their decisions before issusing them. Given
the large amount of cognition-consuming activities (i.e. safety audits) they needed to
perform on a daily basis at the E3 Company, the auditors could frequently reach a

249
state of decision fatigue where deciding on corrective actions involving a high level
of uncertainty became annoying or even interminating.
From an IS designer’s point of view, an effective solution to the problem at the E3
Company should improve the “Torque” and reduce “Friction” by feeding the “Select”
phase with the needed knowledge and wisdom. Following this logic, we proposed
two approaches to achieve this goal. The first one was to somehow extract the
knowledge and wisdom from the line managers and store them in the NOHARM
system for auditors to access when needed. The second one was to bring line
managers into the “Select” phase and make them a part of the decision-making
process for issuing corrective actions.
The first approach was considered too costly and risky thus rejected. Firstly, the
operational knowledge and practical wisdom needed at the “Select” phase were
predominately tacit in nature thus systemically capturing them in an IS could be
extremely difficult. Not to mention there were 93 line managers at the E3 Company
meaning the knowledge and wisdom capturing effort could take excessive amount
of time. Secondly, the NOHARM system was designed to be a workflow-driven IS to
facilitate flexible processes and collect data/information generated through the
processes, instead of an intelligent decision system designed to make optimal
selection of corrective actions based various factors and variables needing human
knowledge/wisdom. Therefore, the E3 Company should expect the knowledge and
wisdom needed for selecting corrective actions to come from human agents, not the
IS.
The second approach was deemed practical and implementable. To bring the line
managers into the decision-making process for issuing corrective actions, it was to
remove the cognitive burden from safety auditors. To achieve this, a system
modification was proposed to automatically create a corrective action for each failed
audit questions and assign to the line manager responsible. If an auditor failed a
reporting line on a particular safety audit (normally containing 30 to 40 audit

250
questions), the specific questions failed would be used as default titles for corrective
actions. These tentative corrective actions were meant to be reviewed and adjusted
by the line managers in charge thus the default due dates would be set as three days
(72 hours) initially. The line managers would receive email notifications from the
NOHARM system indicating new corrective actions had been created and needed to
be reviewed and accepted. They then would assess the feasibility and practicality of
the auto-generated corrective actions to their own reporting lines within the given
72 hours. Next the line managers would add their comments/reasons and choose to
modify, accept, or close the auto-generated actions. Corrective actions with similar
requirements could be merged into one. Generic actions should be localised and
specified in the business context of the targeted reporting lines. Line managers were
in a far better position to do these than safety auditors. Once a line manager
accepted a corrective action, he/she needed to assign a new achievable due date for
the action to be executed and completed.
This “auto-suggestion” approach let the IS (i.e. the NOHARM system) decide on
corrective actions which then reviewed and accepted by relevant line managers.
Auditors no longer needed to be concerned with optimising corrective actions to
acknowledge line level operational and contextual details. This approach was both a
“Torque Booster” and a “Friction Reducer”. It created ultimate “Torque” to move the
“Select” phase forward by allowing the IS to take control and generate corrective
actions immediately after failed audits. The system-generated corrective actions
were intended to be primitive compared to those prudently designed by human
auditors. However, they would become highly practical and feasible as line
managers were called in by the IS automatically to review, adjust, and accept those
actions within 72 hours. This approach minimised the original “Friction” by
reducing the cognitive load and concerns of auditors. In fact, auditors no longer
needed to gather, remember, and recall operational details of reporting lines failed
their audits. They would just focus on conducting high quality safety audits and not

251
be slowed down by having to find time for deciding on the optimal corrective
actions.
Results
The “auto-suggestion” solution was technically straightforward and implemented
directly in the following sprint in April 2014. The NOHARM system started to
autonomously issue corrective actions and send email notification to line managers
whenever their reporting lines failed safety audits. The line managers were
informed by the system to review, modify, and accept these actions in 72 hours.
Once a corrective action was accepted by the relevant line manager, it was
considered “issued successfully”.
Table 35: Number of Audits Started and Corrective Actions Issued at E3 Company From April 2013 to August 2014
Data Source: The NOHARM System (Visualised in Microsoft SSRS 2014)

252
Such a system-driven “Select” phase freed up safety auditors from difficult decision-
making efforts, as well as enforced a shorter time frame for issuing corrective
actions after failed audits. The E3 Company began to see clear improvement in
performance and a sharp drop in the percentage of delayed corrective actions. As
shown in Table 35 above, the percentage of corrective actions issued over a week
after failed audits had dropped from the original over 50% on average in the first
three months of 2014, to some 20% and then 10% in the following months. The
percentage of corrective actions issued within 72 hours continued to climb up from
as low as 23.23% in March 2014 to as high as 80.33% in August 2014.
5.2.4.5 Episode Summary and Reflection in Action
Episode Three was focused on improving the “Select” capability to bring
“Synchronicity” back into the Ops Agility cycle of the safety auditing process. This
episode led me to examine the need for articulating the limitations of IS in terms of
supporting cognitive activities of human users. Being able to illustrate on the
cognitive hierarchy to articulate what an IS can/cannot support could help users to
understand their choices and why one solution is considered over another.
In reality, improving agility in operational processes sometimes can be as simple as
having the IS to drive the right persons to do the right tasks. This is especially
practical and feasible when it is unbearably expensive and risky to make attempts of
replacing the right persons with machines/algorithms by extracting and
consolidating the operational knowledge and practical wisdom needed from those
highly skilled human agents.
The NOHARM system was able to generate enough “Torque” to speed up the “Sense”
and “Diagnose” phases by providing strong support to safety advisors and auditors
regarding transactional data and analytical information. However, at the “Select”
phase, what needed the most were operational knowledge and practical wisdom,
which were clearly not possessed within a process-oriented workflow-driven IS. In
fact, I suspect any contemporary business IS could claim optimal support at
253
knowledge and wisdom levels of the cognitive hierarchy. After all, the term IS stands
for “Information Systems” which are specialised in certain business operations and
management such as ERP, CRM, SCM, and so on. These types of systems are
designed to facilitate and supervise business processes and workflows. Their
fundamental promise is to capture and process business data and information, not
to guarantee the provision of knowledge and wisdom.
On reflection, the ineffectiveness of E3 Company’s initial solution (i.e. letting safety
advisors alone to decide corrective actions) could also be explained through the
levels of cognitive hierarchy supported by the IS (i.e. the NOHARM system). The E3
Company was hoping data collected and information produced in an IS could enable
their auditors to make prompt yet optimal decisions on matters that clearly require
operational knowledge and practical wisdom from outside the IS. To these safety
auditors, acquiring enough knowledge and wisdom needed would involve
predominately manual effort which they could hardly afford.
The machine-driven automation created in Episode Three was not designed to
outsmart human decision makers. Rather, it was to minimise human-entailed
procrastination and anxiety. We humans, when faced with important decisions, tend
to think long and deep, especially when the outcomes of these decisions may induce
challenges from other human counterparts. The safety auditors at the E3 Company
were in the position to decide on corrective actions without enough understanding
of the changing business operations and resource allocation in the reporting lines
having to execute these actions. Concerned with causing conflicts or challenges from
line managers, those auditors were anxious about the potential of issuing
impractical/unfeasible actions. In the meantime, safety auditors had always got
their own excuses (i.e. already busying with traveling between sites to conduct
safety audits) to procrastinate on making the hard decisions.
In the same manner to previous episodes, Table 36 below summarises the main
points of Episode Three. In this episode, the decisions made by machines (i.e. the IS)

254
automatically were simple and sometimes naïve yet could pull the human
counterparts into the cycle to contribute. In the new process of issuing corrective
actions after failed audits, no human agents would be held accountable for the
decisions made by machines. Instead, safety advisors became free from having to
make these decisions they were struggling with, while line managers only needed to
look after those machine-generated corrective actions assigned to their own lines of
business (could be only a handful for each line every week). A line manager would
possess relevant operational knowledge and practical wisdom to review and
consolidate the machine-generated corrective actions into feasible and practical
ones and set realistic expectations for his/her staff members to execute in the
shortest time frame reasonable. Of course, a line manager could demonstrate that
his/her intelligence is superior to the machines without hurting the feelings of
anyone.
Table 36: A Brief Summary of Episode Three
Functional Group: Safety Auditors - from the E3 Company
Episode Three – Excessive delay in issuing corrective actions after failed safety audits
The original solution – summarised in Abstraction Decomposition Space(partial)
System Purpose
Improve workplace safety, reduce injuries, and control risks
Domain Values Proactively identify safety issues to correct and improve through intensive auditing
Domain Functions
Conduct audits at defined time and places and Select corrective actions for failed audits
Technical Functions
Initial User Driven Solution: Granted safety auditors full authority to decide on corrective actions independently from other parties
Physical Resources & Material
Each safety auditor had reliable Internet connection for accessing the audit templates, incident records, and action

255
Configuration scheduler provided in the web-based information system
Results
ISACAM (V1.2) based Problem Analysis
Change Frequency: High Uncertainty: High Information Intensity: High
Time Criticality: High
Problem lies on Ops Agility Cycle: Yes Dev Agility Cycle: No
∆S-R: Currently a month, expected to be two weeks
Symptoms Many corrective actions were not issued within a desirable timeframe (72 hours) after failed safety audits. Instead, a large percentage of them were issued later than a week after the completion of audits.
Root Causes Safety auditors were the only agents responsible for deciding corrective actions after failed audits, yet they did not possess the operational knowledge and practical wisdom needed to make optimal decisions. Spatial uncertainly was high as safety advisors were unsure what would make a corrective action practical and feasible to a particular reporting line. Temporal uncertainty was high as safety advisors could not estimate the time and effort needed to complete the corrective actions in a targeted reporting line. Moreover, the safety advisors were already busy with conducting safety audits on a daily basis thus they tended to wait and elaborate to seek prudent decisions on corrective actions that would not endanger their authority and reputation.
ISACAM based Solution Design
Torque Booster
A new machine-driven function was created to automatically generate a corrective action right after a failed safety audit question and immediately assign this action to line manager in charge to review and accept within 72 hours.
Friction Reducer
Same as above. Due to the original struggling human decision maker (i.e. safety advisors) being removed from the process, the initial Friction caused by human-entailed procrastination and anxiety disappeared. The new decision reviewers (i.e. line managers) were more efficient and
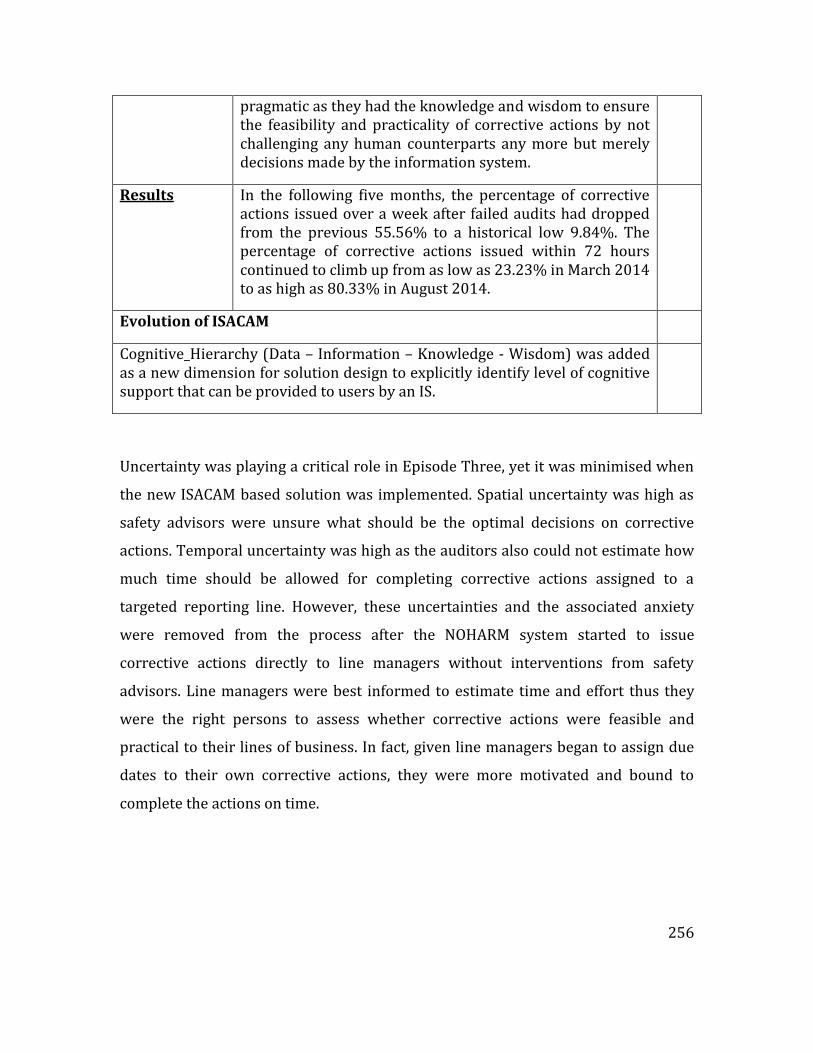
256
pragmatic as they had the knowledge and wisdom to ensure the feasibility and practicality of corrective actions by not challenging any human counterparts any more but merely decisions made by the information system.
Results In the following five months, the percentage of corrective actions issued over a week after failed audits had dropped from the previous 55.56% to a historical low 9.84%. The percentage of corrective actions issued within 72 hours continued to climb up from as low as 23.23% in March 2014 to as high as 80.33% in August 2014.
Evolution of ISACAM
Cognitive_Hierarchy (Data – Information – Knowledge - Wisdom) was added as a new dimension for solution design to explicitly identify level of cognitive support that can be provided to users by an IS.
Uncertainty was playing a critical role in Episode Three, yet it was minimised when
the new ISACAM based solution was implemented. Spatial uncertainty was high as
safety advisors were unsure what should be the optimal decisions on corrective
actions. Temporal uncertainty was high as the auditors also could not estimate how
much time should be allowed for completing corrective actions assigned to a
targeted reporting line. However, these uncertainties and the associated anxiety
were removed from the process after the NOHARM system started to issue
corrective actions directly to line managers without interventions from safety
advisors. Line managers were best informed to estimate time and effort thus they
were the right persons to assess whether corrective actions were feasible and
practical to their lines of business. In fact, given line managers began to assign due
dates to their own corrective actions, they were more motivated and bound to
complete the actions on time.

257
5.3 Ladders of Reflection
5.3.1 Reflection on Action – Some General Observations
The three episodes reported in this chapter were exemplar applications of
“reflection in action” which led to the development of ISACAM as an analytical
method. Such a method was then evaluated through solving real-world IS Agility
problems. The resulting success was beyond expectation yet was a testament of
continuous “ladders of reflections” (Schön, 1983). As discussed in Chapter 4, Schön,
in his classic 1983 “The Reflective Practitioner” book, argued that action, and
reflection on action make a ladder where every action is followed by reflection and
every reflection is followed by action in a recursive manner. “Doing extends thinking
in the tests, moves, and probes of experimental action, and reflection feeds on doing
and its results” (Schön, 1983)(p.280). Possible objects of reflection, according to
Schön, can vary depending on the phenomena of interest and the knowledge of the
reflective practitioner. One can reflect through a more theoretical lens on objects
such as “the tacit norms and appreciations which underlie a judgement” and
“strategies and theories implicit in a pattern of behaviour”, or from a more practical
perspective on objects such as “feeling for a situation led to adopt a particular
course of action”, “the way in which he has framed the problem he is trying to solve”
and “the role he has constructed for himself within a larger institutional context”
(Schön, 1983) (p.62).
My role as the reflective practitioner in this research project, can also be seen as a
reporter attempting to explicitly articulate “situated cognition” and “situated action”
associated with problem-solving activities (Young & McNeese, 1995) in a systematic
and replicable manner, and in the form of ISACAM. As a SaaS provider who is trying
to accommodate different organisations from various industries, using a multi-
tenant architecture based on the same source code and data structure, the IS
development team I have been working with often receive various change requests
from client organisations. However, many changes or solutions proposed by clients
258
are ad-hoc, and far from systematic with a strong sense of avocation. As Schön
(1983, p.22) cited from Wilbert Moore that “avocation is the antithesis to a
profession…is based upon customary activities and modified by the trial and error
of individual practice”. Such a sense of avocation can be felt stronger while clients
are requesting a significant system change to accommodate their own improvised
solution in order to solve a minor problem that will not even exist if their business
operations were optimised.
Unlike traditional on-premises IS which are often dedicated to only one organisation
or business function, with the SaaS model, a service provider cannot tolerate much
of the “avocation” style solutions from clients for two reasons. Firstly, the
sustainability and profitability of a SaaS business is relying on its multi-tenant
model, meaning all clients are sharing the same system design, database structure,
source code, and infrastructure. Changes beneficial to only one SaaS client or just a
small group of clients may not be useful to the rest of the client base. Moreover,
functional changes made for only one client may cause disruption in the system that
could bring negative impact on the operations of other clients. Secondly, the number
of SaaS clients will continue to grow unless the provider is out of business, meaning
change requests will keep increasing especially when new clients are subscribing to
the SaaS. Without a systematic means to filter out “avocation” style solutions
requested by clients, a SaaS provider can be swamped quickly and end up being less
responsive or even paralysed. Consequently, failures to meet the SLAs (Service Level
Agreements) may occur on a regular basis.
In retrospect, I have realised that the reasoning behind “avocation” style client
solutions is mostly based on the narrow views they hold towards certain parts of
the system relevant to their own work domain. In other words, client users are
confined by their own work domain knowledge and practices, thus often do not
think beyond the common and familiar processes they have been following for years.
Instead of consciously constructing a “problem space” to incorporate all the issues

259
they have experienced using the NOHARM system to manage their safety risks,
client users tend to see problems as individual occurrences to be addressed one
after another. Furthermore, SaaS users often do not have time and energy to analyse
IS Agility related problems deeply enough to identify the root causes. After all, they
are professionals specialised in their own work domain (i.e. safety and risk) who
would rather spend their efforts on analysing problems directly within their domain
(e.g. the effectiveness of control measures to certain safety risks).
In contrast to client users, designing, developing, and implementing multi-tenant IS
for large number of clients is our profession as SaaS providers. However, in the IT
industry, we do not seem to have an established, “profession” style method to
handle IS Agility problems raised by clients using our systems and services. Many
SaaS providers remain in the same tradition to offer online help, support desk, user
training, and etc. These are all classic approaches but not directly helpful to clients
who are faced with IS Agility problems. Again Schön (1983, p.22) cited from Wilbert
Moore, noted that “profession involves the application of general principles to
specific problems, and it is a feature of modern societies that such general principles
are abundant and growing”. Ironically, the lack of a “profession” style solution to IS
Agility problems is common among “IS professional” and “IS researchers”. A key
reason to such a common weakness is that agility is a complex concept thus it has
been very difficult to construct a “problem space” for IS Agility problems. The
dimensions of such a problem space are either missing or only incomplete in the
existing literature (as discussed in Chapter 2). The “general principles” for solving IS
Agility problem, therefore, do not exist in the literature.
During my PhD journey and my tenure with the NOHARM SaaS provider, one
interesting phenomenon is that the IS Agility problems encountered have been
predominately on the Ops Agility cycle, namely, from the IS user side, rather than on
the IS developer side. On reflection, I have observed an obvious power imbalance
between the IS users and IS developers, particularly in the SaaS context. With the

260
SaaS delivery model, one business IS provider needs to directly serve hundreds, if
not thousands, of client organisations in real-time. These SaaS clients can come from
different industries with distinct business operations. To be able to handle new
requirements and change requests from such a client base, SaaS providers have to
seek every means to stay agile in system development and deployment to survive
and thrive.
For instance, the NOHARM development team has adopted one of the proven agile
methodologies, Scrum, to manage ever-changing client requirements and organise
short iterative software development cycles (represented as “Agile System-
Development” in the IS Agility Pyramid from Chapter 2). The NOHARM system has
been designed in a modular manner following the SOA principles and implemented
as a cluster of independent web services (represented as “Agile-System Architecture”
in the IS Agility Pyramid). Furthermore, an intelligent code generator and a version
control server have been extensively utilised to improve speed and quality of
programming in order to catch up with the fast iterations defined by the Scrum
methodology. In short, as a SaaS provider, the NOHARM development team need to
and must prepare themselves for optimal Dev Agility to be able to withstand
changes initiated from the increasing client base and the “globally wired”
competitors.
On the other hand, SaaS users (e.g. the NOHARM client base) often are not prepared
or equipped with the knowledge and skills to configure and operate their IS for
optimal Ops Agility. Even though users have the demand to improve agility, there is
just little if no reference and guidance for them to do so. Unlike the plethora of
academic studies and industry white papers focusing specifically on the IS
developer side of Dev Agility (e.g. Agile Methodologies and SOA), the user side of
Ops Agility had not even been clearly defined prior to this study. The lack of
systematic approaches to improve Ops Agility and solve associated problems
indicates a clear knowledge gap in both the academia and the industry. However

261
there seems to be an optimistic hope that those more strategy-oriented studies on
“Organisational Agility” might somehow stretch far enough to fill this gap. But this is
apparently not happening in any near future.
Another interesting experience is that in all these years, there were barely any
“executing” problems raised by the NOHARM clients. I have seen all sorts of issues
raised by users relating to “sensing”, “diagnosing”, and “selecting” phases of the
agility cycle, yet it seems every client has been satisfied by their “execute”
capabilities supported by the NOHARM system. In the context of the NOHARM
system, the “execute” phase is mostly instantiated as the completion of “corrective
actions”. These corrective actions could be generated from incident investigations,
failed safety audits, hazard identifications and so on. These actions are all critical
tasks and need to be executed promptly and carefully to rectify errors, fix issues,
isolate hazards, or in general, minimise safety risks. In safety risk management, once
a corrective action is created, a “due date” and a “person responsible” will be
assigned. In the NOHARM system, as an extra caution, we allow users to assign a
second person to the action as “person to close” the action and a “priority” to be set
by the line manager in charge. All NOHARM clients treat “overdue” actions seriously
and many set the percentage of overdue actions as a lag indicator for safety
performance. To help NOHARM users keep actions completed on time, we have
developed an analytical dashboard for all client organisations to visually track their
progress on actions, as well as a to-do list style operational dashboard to remind
individual users regarding the open actions assigned to them.
My reflection on the lack of “executing” problems, even though a positive one, is that
the two agility drivers “Information Intensity” and “Uncertainty” often reduce their
effect at the “execute” phase. This might be a curious case of the particular NOHARM
system but could still be true in the context of IS designed for other purposes. My
observation is that the actions created in the NOHARM system contain very specific
information prescribing who to execute, when to execute, what to do, where to do,

262
etc. Such an approach provides just enough, not excessive, information to execute
the actions, and allows little uncertainty to the persons being assigned to those
actions. This way the person responsible could drive straight into an “implemental
mode” without getting stuck at a “deliberative mode” (Gollwitzer et al., 1990).
5.3.2 Reflection on Technological Rules and ISACAM Artefacts
Through my problem-solving practice in the above episodes and other unreported,
less intensive experiences, I began to observe common patterns in the successful
solutions. These patterns are summarised in Table 37 as “technological rules” to be
considered while using ISACAM to solve IS Agility problems. Technological rules are
typically heuristic rules generated through prescription-driven design science
research (Aken, 2004). According to Aken (2004), heuristic rules are indeterminate
in nature, thus are to be used in an instrumental way. They are not specific
prescription for a specific setting, rather, are general principles to a class of
problems. Aken (2004) further argued that “A practitioner has to design his/her own
intervention or system, on the one hand based on his/her experience, creativity and
deep understanding of his/her local setting, and on the other (hand) on the knowledge
of the appreciate technological rules of their generative mechanisms and of their
supporting evidence” (Aken 2004, P.238).

263
Table 37: ISACAM Technological Rules
ISACAM-driven Technological Rules
TR1 IF need to improve the overall IS Agility in a business area, first differentiate Ops Agility cycle from Dev Agility and identify which cycle(s) the problem lies.
TR2 IF need to improve the performance of a particular agility cycle (Ops or Dev), first define a measurable target ∆S-R value and then measure the current ∆S-R value, next identify where the bottleneck is in the SDSE loop, and then design Torque Booster and Friction Reducer to resolve it.
TR3 IF need to design a Torque Booster or a Friction Reducer, a starting point is to control the level of uncertainties by explicitly establishing order and confidence in either spatial or temporal dimension.
TR4 IF need to increase Torque and reduce Friction for an SDSE loop and the targeted processes only require data and information accessible to the IS in question, modify the IS to automate the processes and maximise machine control.
TR5 IF need to increase Torque and reduce Friction for an SDSE loop and the targeted processes require knowledge and wisdom inaccessible to the IS in question, modify the IS to solicit contribution from the right human agents who possess such knowledge and wisdom.
As shown in Table 37 above, these heuristic “technological rules” are summarised
using the terminology created in ISANN. These rules do not cover all aspects of
ISANN, but only focus on those factors that enabled me to create effective solutions
to IS Agility problems. Unlike prescriptions found in Heathrow-literature, the rules
here are grounded in academic theories analysed in Chapter 2 and have justification
from the effectiveness of their real-life implementations reported in the three
episodes at the beginning of this chapter.
TR1: IF you want to improve the overall IS Agility in a business area, first differentiate
Ops Agility cycle from Dev Agility and identify which cycle(s) the problem lies.
This rule is critical to the success of solution design to solve IS Agility problems.
When agility problem is raised in the IT space, service providers or software
vendors tend to jump directly into the Dev Agility realm and start preaching Agile

264
Software Development Methodology (hereafter “agile methods”). Users, on the other
hand, tend to have little choice but believe in that agile methods would deliver the
agility they are after. However, adopting agile methods, although can improve
responsiveness and throughput of an IS development team to handle changing user
requirements, itself alone is not the cure to Ops Agility problems.
In all the three episodes reported previously, the SaaS clients had no complaints
towards the Dev Agility of our development team at all. Rather, they were puzzled
by the gap between their expected improvement in operational performance and
the actual reality. The IS users simply did not know how to leverage the IS to
optimise their performance in the business areas they intend to excel. In such a
scenario, agile methods adopted by the IS development team would not solve the
Ops Agility problems faced by the IS users. Being able to explicitly identify and
articulate which agility cycle needs improvement is the crucial first step towards
effective solutions.
TR2: IF you want to improve the performance of a particular agility cycle (Ops or Dev),
first define a measurable target ∆S-R value and then measure the current ∆S-R value,
next identify where the bottleneck is in the SDSE loop and then design Torque Booster
and Friction Reducer to resolve it.
This rule brings clarity to the problematic situation and sets up realistic
expectations (i.e. a measurable and justifiable target ∆S-R value). It forces the
problem solver to be disciplined by mapping the whole chain of activities suffering
from the lack of agility, into the SDSE loop recommended in this thesis. Through
examining the performance of each of the four phases (i.e. Sense, Diagnose, Select,
and Execute), the problem solver will discover which phase is out of Synchronicity
and becomes a bottleneck to the rest. In this thesis, such an exercise is visualised in
a SDSE mapping table (see Figure 27 below taken from Episode Three). Next, the
problem solver should aim at optimising the most constrained area to improve the
performance of the whole SDSE loop. Such an approach has been described as

265
“Theory of Constraints”, which is another widely cited “technological rule” designed
by (Goldratt, 1990) for maximising the output of a factory.
Figure 27: Recap The SDSE Mapping Table
The problem solver needs to identify who and what are responsible to each phase of
the SDSE loop (illustrated in Figure 27 above as “Functional Group” and later added
“DIKW requirement”), and to recognise the Torque vs. Friction dynamics as the
driving and blocking mechanisms. As demonstrated in all the three Episodes,
Torque Booster and Friction Reducer need to be explicitly defined and implemented
for optimal results. The design of these mechanisms is to be guided by the next three
rules below.
TR3: IF you want to design a Torque Booster or a Friction Reducer, first try to control
the level of uncertainties by explicitly establishing order and confidence in either
spatial or temporal dimension.
266
This rule acknowledges the critical role of uncertainty plays in any agility problems.
Uncertainty is often associated with some level of unpredictability on either
temporal or spatial dimension (adopted from sports science, see Chapter 2 for
detailed discussion). In this thesis, temporal uncertainty means that an agent can
predict the possible changes needed in the future, but cannot predict when these
changes will happen and in what sequence. Spatial uncertainty means an agent can
predict when changes are going to happen, but just do not know what these changes
are and what to do with them.
Depending on the nature of the operation, uncontrolled uncertainties in either
spatial or temporal dimension can cause delay, especially for human agents, in
making decisions and producing actions. Unlike machines, we humans have
psychological reactions to uncertainties such as concerns and doubts. When high
level of uncertainty present in the spatial dimension, the human agent is unsure
about what to do and who should do it. Procrastination, avoidance, or even conflicts
can quickly appear. Unless some level of assurance is given to establish a sense of
order and confidence in the process, the situation could become chaotic and reactive
fire-fighting. In such a situation, it is unrealistic to expect improvements or
modifications in IS, or in other words, smarter machines, could alone solve the
problem.
Therefore, the solution designed in Episode One, was to first change the human-side
policy and procedure to ensure frontline workers confidently knew what the right
things to do when a Near Miss event occurred, and who should be doing it on what
equipment. The IS was modified to merely reinforce the spatial confidence by
identifying and prompting desirable behaviours from human agents. In Episode Two,
the spatial uncertainty was mitigated by first explicitly defining a set of criteria to
diagnose if a safety event required further investigation. The IS was then enhanced
to automatically pick out those safety events do not meet the criteria. Such
automation effectively drove the SDSE loop forward. In Episode Three, it was

267
unfeasible to extract a set of criteria to control spatial uncertainty faced by those
safety auditors, thus the solution was to use the IS as a process management tool to
solicit contribution from the line managers who perceived much less spatial
uncertainty in deciding on corrective actions.
On the other hand, when uncertainties present in the temporal dimension, the
human agents know what changes are going to happen and what to do when they
happen, but he/she does not know when these will happen and in what sequence,
thus has to stay alert and diagnose relevant signals to decide if the changes are
coming. In military operations, such a daunting situation is often handled by
dedicated and well-trained guards or scouts with specialised skills and knowledge.
In the business environment, however, a human agent acting as a guard or a scout
tend to have other duties at the same time, which means him/her can be frequently
distracted and have difficulties to concentrate.
In Episode One, the solution to control temporal uncertainty was straightforward by
officially allowing one frontline worker of each workgroup to spend up to one hour
a day dedicated on operating the IS and recording Near Miss events. In Episode Two,
the safety advisors were receiving over 100 email alerts every week and became
overwhelmed due to the need for diagnosing every single alert whenever it came in.
The IS was then modified to filter out some 90% of the noise. The email alerts were
also converted into one single report and sent to the safety advisory team only once
a day, which minimised interruptions originally caused by those scattered alerts
coming in at random time during the day. In Episode Three, temporal uncertainty
was controlled by using the IS to automatically issue corrective actions immediately
after failed safety audits and assign a tentative due date for the human agents to
follow up. The new agents called in by the IS (i.e. the line managers) perceived less
temporal uncertainty (e.g. realistically when a corrective action can be completed)
compared the previous agents (i.e. safety auditors).

268
TR4: IF your need to increase Torque and reduce Friction for an SDSE loop and the
targeted processes only require data, information, and knowledge accessible to the IS
in question, try modifying the IS to automate the processes and maximise machine
control.
TR5: IF you need to increase Torque and reduce Friction for an SDSE loop and the
targeted processes require knowledge and wisdom inaccessible to the IS in question,
try modifying the IS to solicit contribution from the right human agents who possess
such knowledge and wisdom.
These two rules recognise the interplay between IS requirements on cognitive
support and level of machine-controlled automation in business processes. If a
process only requires data, information, or certain level of knowledge that is directly
accessible to the IS, then full automation should be considered to improve
effectiveness and efficiency. In Episode Two, to “diagnose” whether or not further
investigation is needed for a safety event, the data (e.g. details of the safety event
including when, who, what, how, etc.), the information (e.g. the classification and
categorization of the safety event), and some simple knowledge (e.g. a set of criteria
to articulate which classes and categories of safety events definitely do not need
investigations) were all made accessible to the IS to perform the “diagnose” process
without human intervention. Of course, line mangers were requested to review the
“no investigation needed” type of safety events automatically picked out by the IS
and provide feedback to improve the knowledge for better accuracy.
On the other hand, if a process heavily depends on complex knowledge (i.e. tacit
knowledge that cannot be adequately articulated as a set of criteria) and even
certain level of wisdom that only human agents have access to (e.g. organisational
culture, office politics), then automation may be infeasible, let alone resulting in
desirable outcomes. In Episode Three, to “select” a practical and feasible corrective
actions after failed safety audits, both the knowledge (e.g. resource availability, task
priority, effectiveness of similar actions from previous audits) and the wisdom (e.g.

269
potential resistance from frontline workers, potential impact on KPIs) were not
accessible to the IS and even to the human agents who were requested to perform
the “select” process alone. Such knowledge and wisdom at the line level were only
accessible to the line managers themselves. However, it was apparent that the
knowledge and wisdom were too complex to be elicited and engineered into the IS
in a timely manner, thus we could not give full control to the machines as the final
authority to “select” corrective actions. Instead, the IS was used more as a workflow
supervisor to take input from one group of human agents (i.e. auditors who failed
reporting lines for not meeting the requirements of safety audits) and then trigger
responses from another group of human agents (i.e. the line managers who failed
safety audits).
Some may argue that the recent advancement in the Artificial Intelligence (AI) field
may pose a challenge to the two above rules. However, my observation is, even with
the most advanced deep learning technologies, automated decisions can only be as
good as the training data sets used and the feedback systems deployed. In some
business applications, such a training data set may not be readily available, or may
be available but unusable due to data quality issues. Not to mention the feedback
systems may not be in place at all. In Episode Three, the desired result, i.e. a
practical and feasible corrective action, is far more complicated than a “successful
purchase transaction in the web store”. The latter is a typical result used to train the
machine learning based “recommendation engine” at Amazon.com where billions of
transactions have been recorded every year which provides immediate feedback to
the algorithm if the recommendations generated are successful. The reality is,
however, in many systems such as the NOHARM, the results to be achieved are
highly intangible and feedback is often not directly available at the time when
needed.
Having said that, I still believe in using machines to automate business processes for
the sake of agility. Machines do not have emotions when making decisions and

270
producing actions. They should be used when human emotions become a Friction
(not a Torque) to the business processes. Such Friction can come from uncertainties
with the tasks themselves, or with the personal consequences involved in the tasks
such as accountability and reputation. Machines have no sense of fear and ego, thus
can be programmed to produce immediate but maybe naïve responses. However
such responses can promptly trigger subsequent human activities that can improve
the situation. In Episode Three, the IS was programmed to generate “tentative”
corrective actions directly after failed safety audits. This approach saved the
previously struggling human agents (i.e. the safety auditors) from spending
excessive amount of time and effort pondering on optimal solutions. Instead, the IS
directly kicked the ball to line managers who were most capable of deciding on the
feasibility and practicality of corrective actions. In short, from an IS Agility
perspective, automation does not necessarily mean super intelligence, rather, it
requires a great level of coordination to ensure that the right agents (be it humans
or machines) are operating on the right processes at the right time which then lead
to a seamless flow on the SDSE loop with a high level of Synchronicity.
On further reflection, the models of ISACAM have been updated to include those
most essential data and processes discovered in this thesis for solving IS Agility
problems. As shown in Figure 28, since the initial version 1.0, three additional
dimensions have been added to the data model to help articulate and construct a IS
Agility problem space for investigation and solution design. These dimensions are
“Solution Type” from Episode One, “Control Type” from Episode Two, and “Cognitive
Hierarchy” from Episode Three.

271
Figure 28: The Data Model of ISACAM Ver. 1.3
The HTA based process map (shown in Figure 29 below) has also been updated to
include more detailed instructions to guide the problem solvers through the
essential steps for IS Agility problem investigation and solution creation. Once again,
the very first steps are to identify the “IS Agility drivers”. This is important to the
success of the following steps. If the Level of Uncertainty, Change Frequency, Time
Criticality, and Information Intensity of a problem space are all rated high by the
stakeholders, then using ISACAM to solve the problem is appropriate. However, for
the reasons discussed in Chapter 2, if any of these four drivers did not present in the
problem space, sub-optimal result may be expected as the stakeholders may not see
the benefits or feel the pressure to commit to the solutions generated through
ISACAM.

272
Figure 29: The Task Model of ISACAM Ver. 1.3
The data model (Figure 28), process map (Figure 29), SDSE mapping table (Figure
27) and the technological rules (Table 37) are the main artefacts created through
the development, application, and evaluation of ISACAM. They are not perfect but
can effectively help problem solvers to slice and dice IS Agility issues for
improvements. ISACAM, as the first of its own kind, will no doubt keep evolving in
the future through applications in different IS environments other than the
NOHARM SaaS ecosystem. One possible scenario is to develop a web-based tool to
integrate all the aforementioned artefacts and give access to organisations that are
suffering from IS Agility problems. Problem solvers from these organisations can
follow the processes listed in Figure 29, break down their problems using Figure 27,
record their analysis data in a database derived from Figure 28, and design solutions
through instantiating the technological rules (Table 37) in their own business
contexts.
273
5.3.3 Reflection on the Success of “Agile Methodologies”
In retrospect, the lack of Dev Agility problems in the NOHARM SaaS environment
should not be a surprise. Since the inception of the Agile Alliance and its Manifesto
for Agile Software Development19, the success stories of those “agile methods” (e.g.
Scrum, XP) have been widely observed and reported in both academic literature and
industry whitepapers.
As another means of evaluation, I am making an attempt here to analyse and explain
the success of agile methods using ISACAM. I have previously studied agile methods
and their differences from the conventional system development approaches (Yang
et al., 2009). Now when speaking in the ISACAM language, in a typical scenario faced
by an web-based IS development team adopted one or more of the agile methods,
say Scrum for instance (the most commonly applied agile method in the industry20),
all the four drivers for IS Agility would be rated as high.
Change Frequency is high as user requirements are simply evolving quickly all the
time in the context of web-based applications, not to mention that some disruptive
changes needed to drive innovations and survive competitions. Level of Uncertainty
is high as the development team cannot predict what will be changed (spatial
dimension) and when (temporal dimension). Time Criticality is high due to the
strong urge of increasing “speed to market” as well as being the earlier movers in a
globally-wired competition. Many software vendors have development teams
operating simultaneously on different continents just to ensure a 24-hour non-stop
development cycle. Information Intensity is high, which is already an undoubted fact
in the software development practice. With the cloud-based SaaS delivery model,
the intensity of information the development team needs to handle only gets higher.
19 http://agilemanifesto.org/ 20 http://blogs.forrester.com/tom_grant/09-04-17-extended_family_agile

274
I have found that ISACAM can clearly and logically explain the reasons why agile
methods can successfully improve Dev Agility. Although not being explicitly
described in the literature, those successful agile methods, e.g. Scrum, tend to have
their own specific solutions to address the issues and follow the technological rules
articulated in ISACAM. Take Scrum as an example, this method creates a set of
artefacts - purposely designed meetings, filing systems, roles and schedules etc. – to
manage frequent changes in user requirements, high demands on speed to market,
high volume of information, and high level of uncertainties.
Figure 30: Scrum Software Development Process
Source: adopted from The Zenyth Group 21
As shown in Figure 30 above, the Scrum methodology echoes with the second
technological rule (TR2) prescribed in the previous section (see 5.3.2) by setting up
a measurable ∆S-R in advance. Scrum defines a Sprint as a regular, short but
iterative system development cycle. Such a cycle is recommended to be completed
in one to four weeks, but very often set as two weeks in actual practice. For instance,
21 http://www.zenythgroup.com/wp-content/uploads/2015/12/Scrum-Process-Software-Development-Life-Cycle.jpg

275
the NOHARM development team and many agile development teams which I
worked with during one of my previous research projects (Yang et al., 2009),
followed a two-week sprint schedule. More detailed discussions regarding the
Scrum process can be found in Chapter 3 (section 3.2.1). The focus here is on
analysing and explaining the Scrum methodology using ISACAM.
Figure 31: The SDSE Mapping Table for Scrum Methodology
As mapped out in Figure 31 above, the Scrum process can fit in the SDSE loop neatly.
Operating on two-week sprints to develop new features and fix bugs has been seen
as able to maintain a desirable tempo (∆S-R) to handle the high time criticality and
high change frequency entailed by IS providers. Product Backlog and Sprint Backlog
are the filing systems used to record and track requirement changes and
development plans. These backlogs are effective ways for the team members to

276
sense and diagnose changes in the development environment, and manage intensive
information associated with these changes. In the NOHARM development
environment, these backlogs were hosted on a web-based case tracking system that
every team member can access and review.
The Scrum methodology also resonates with the third technological rule (TR3)
prescribed in the previous section (see 5.3.2) by establishing order and confidence
in the face of spatial and temporal uncertainties. The development team cannot
predict what changes in requirements will be (spatial uncertainty) and when they
will need to happen (temporal uncertainty). To avoid chaotic situations, Scrum
creates meetings such as Daily Stand-up (strictly 15 minutes), Sprint Planning (3-4
hours), and Sprint Review (2-3 hours) etc. which are all purposefully designed
events to take place on certain days (temporal order and confidence) during a sprint.
At each meeting, participants will perform predefined tasks (spatial order and
confidence) such as estimating and prioritising user stories at the biweekly Sprint
Planning Meeting, reporting on progress and roadblocks at the daily Stand-up
Meeting. All these predefined time and activities help mitigate the sense of
uncertainty perceived by team members. Even when they cannot predict what
changes are coming next, they can still operate with confidence and much reduced
anxiety knowing what should be done for the current sprint and when.
Last but not the least, the Scrum methodology meets the conditions of the fourth
and fifth technological rules (TR4 and TR5) prescribed in the previous section (see
5.3.2). Product Owner, Scrum Master (or Sprint Master), The Development Team (or
The Team) and Stakeholders are the roles defined in the Scrum process to clarify
responsibilities. Such a role-play approach, with clear instructions on who should
attend which meetings and work on which processes, can effectively bring the
needed data, information, knowledge, and wisdom into the right places when
needed. In the case of the NOHARM development team, transactional data (e.g. user
stories) and analytical information (e.g. priorities, estimated story points) are all

277
recorded in a web-based case tracking system. Many of the tasks involved in
processing these data and information have been automated and controlled by
machines (e.g. automatically classifying incoming user stories into pre-defined
categories, sending reminders to the relevant team members, monitoring
development progress and time spent on sprint items). Those operational
knowledge (e.g. which clients are more positive than others with the new features
developed in the current sprint?) and practical wisdom (e.g. should the team release
some new features to certain clients for UAT?) commonly possessed by human
agents (e.g. The Product Owner, Stakeholders) can all be readily accessible at the
regular meetings in each sprint.
In short, using ISACAM to analyse the Scrum process brings a great level of clarify
and valuable insights into the success of this agile method. Such an analysis also
helps to evaluate the usefulness of ISACAM as a tool to analyse and solve IS Agility
problems. Moreover, the discipline enforced by the Scrum methodology echoes with
the desired state portrayed in ISACAM, which explains the lack of Dev Agility related
problems in the NOHARM environment.
5.4 Chapter Summary
Chapter 5 reported the major evolutions of ISACAM through three real-world
episodes. Each episode recorded a problem-solving practice focused on improving
one blocked phase of the SDSE loop (e.g. “Sense” in Episode One, “Diagnose” in
Episode Two). During these episodes, new elements have emerged, and new
insights have been discovered towards systematically constructing a problem space
for solving IS Agility problems. The interplay between the elements in an IS Agility
problem space have been explored and examined (e.g. dimensions of uncertainty,
cognitive hierarchy, machine driven automation, etc.). The effectiveness of ISACAM
on solving IS Agility problems has been demonstrated in the results of those
episodes.
278
Following the tradition of “reflective practice” (Schön, 1983), I further refined those
ISACAM artefacts (i.e. the data model, the task model, and the SDSE mapping table).
Next, I synthesized patterns found in those ISACAM-driven solutions into five
technological rules and explained each in detail. These rules were then found to be
able to provide powerful explanations to the success of the Scrum methodology. All
these artefacts and findings can be of good use for problem solvers to design rigours
analysis on IS Agility problems and to create effective solutions. Next chapter will
be the conclusion of this thesis.

279

280
Chapter 6 : Conclusion
6.1 Achieved Objectives
At the beginning of this thesis we have set five objectives. Now we can conclude that
all of them have been achieved. Achieving these objectives has effectively fulfilled
the two main goals of this study (see Table 38 below for a summary). Table 1 in
Chapter 1 has already provided another summary of the research problems and
questions being addressed by this study, thus Table 38 is only focusing on the goals
and objectives fulfilled.
Table 38: Achieved Research Objectives
Research Goals Objectives Achieved by
A. To generate a unified and holistic conceptualisation of IS Agility so that both researchers and practitioners can understand and utilise in their own specific contexts with clarity and consistency;
a. To examine, synthesise, and refine existing theories/models of agility published in a broad yet practical range of literature
Chapter 2: Literature review and analysis
b. To create a unified conceptualisation that explains why IS Agility is needed and how it can be achieved
Chapter 2: The creation of ISANN (IS Agility Drivers and Dev vs. Ops Agility cycles, etc.). Peer-reviewed publication
c. To evaluate and improve the efficacy of this unified conceptualisation and associated models through peer-review processes and/or scenario-based illustrations
Chapter 3: ISANN based illustrative scenarios and structured analysis of Cloud Computing services Peer-reviewed publication
B. To design and develop a systematic method for investigating and solving IS Agility problems with which people can follow prescriptive steps and rules to implement with clarity and consistency.
d. Based on the improved conceptualisation of IS Agility, to create a method for analysing and designing solution for IS Agility problems
Chapter 5: ISACAM (data and task models, and technological rules)
e. To evaluate and improve relevance and effectiveness of ISACAM through real-world applications
Chapter 5: Formative evaluations via the three episodes and an ISACAM based analysis of the Scrum methodology

281
IS Agility is a critical ability to modern and Internet-connected businesses, and an
important concept to the advancement of IS and business research. However, prior
to this study, the understanding towards IS Agility was limited and obscure in both
academic and practitioner literature, probably due to the tangled nature of this
concept. The missing of a unified conceptualisation made studying IS Agility a
challenging and sometimes frustrating endeavour.
The present study has accomplished its first goal by establishing ISANN (in Chapter
2) as a holistic and unified conceptualisation for dissecting and researching IS
Agility problems. The graphical ISANN ensures a much higher clarity and
consistency than the scattered semantic definitions of IS Agility found in the existing
literature. This study then moved on and fulfilled the second goal through
designing/developing the ISACAM, which offers operational level prescription for
practitioners and researchers to analyse and solve IS Agility problems. The ISACAM
consists of a series of theory-grained and practice-grounded artefacts including the
data mode, the task model, five technological rules, and the SDSE mapping table. The
effectiveness of these artefacts has been demonstrated in real-world applications
documented in the form of three episodes in Chapter 5.
6.2 Main Contributions
The first contribution of this study, is the graphically rich ISANN which brings the
long-missing conceptual clarity and structural integrity to the complicated concept
of IS Agility. It does so by synthesising related theoretical and conceptual elements
into a unified problem space, which offers a previously non-existing vantage point
for researchers and practitioners to acquire a holistic view of IS Agility, as well as to
understand the relationships between the contributing factors.
The second contribution is the ISACAM, which offers a theory-ingrained yet highly
practical approach to investigate and solve IS Agility problems. Such an approach is

282
prescription-driven and has produced positive results in real-world problem-
solving situations. The creation of ISACAM provides a practical alternative to the ad-
hoc approach used by practitioners to address IS Agility problems. Such problems,
now, can be analysed and solved in a systematic and consistent manner. Moreover,
the ISACAM is generic enough for adopters to interpret in their own specific
contexts to design customised solutions that are most effective to their particular
problems.
The third contribution is that the study itself provides an educational example of
how to combine theoretical rigour and practical relevance, which has been often
considered a major challenge to novice IS researchers. Striking the balance between
rigour and relevance to produce “consumable” research, in fact, could even be a
dilemma to senior IS and business researchers (Aken, 2004; Robey & Markus, 1998).
This study has demonstrated that a DSR project, with the application of “reflective
practice” (Schön, 1983), is a great way for a PhD candidate to first intensively
accumulate subject knowledge to lay a solid theoretical foundation, and then get
immersed in a real-world context to develop and test artefacts derived from
theories through iterations of reflections and design improvements.
The fourth contribution is that the thesis presents a viable path to place the IT
artefact (e.g. an IS) at the centre of an IS phenomenon while generating unique
knowledge distinct from other technology-centric disciplines such as Software
Engineering and Computer Science. The academic legitimacy of the IS field has been
criticised for having “nothing at the centre”, namely, being a “market of ideas”
without a central focus in the research literature and topics (Lyytinen & King, 2004).
Leading IS researchers have urged that the IT artefact should be the “core subject
matter” of the IS field, however, it is often briefly mentioned or even not engaged at
all in many IS studies (Wanda J Orlikowski & Iacono, 2001). The present study set an
example for novice IS researchers to design research strategies that can deeply
engage the IT artefact (i.e. the NOHARM system) as well as ground their research

283
inquiries into business theories (e.g. IS Agility models) to produce salient insights
(e.g. ISANN and ISACAM) that can define the uniqueness of the IS field.
6.3 Limitations
This study has several limitations.
Firstly, it has limited generalizability. As already discussed in Section 4.6.1, we
believe generalizability of DSR studies should come from summative evaluations
performed in settings differ from those artefacts being designed in (e.g. new
environments, new evaluators). Such type of evaluations may “require quite
different expertise and entail substantial resources” thus has been suggested to be
separated from a “construction theme” study (Alturki et al., 2011; Winter, 2008).
Given the artefacts constructed in this study are novel in nature, utilising formative
evaluation as a way to further develop and improve their design is justifiable and
acceptable (see discussions in Section 4.5.3).
Secondly, personal biases may come from my strong interest in IS Agility, which
might lead me to analyse many IS projects I have been involved only from an agility
point of view. Such a tendency might create a “when you have a hammer everything
looks like a nail” mentality. Since 2008, I, as an IS researcher, also as an IT
practitioner, have been working closely with agile software development teams in
different organisations in New Zealand. I have developed genuine interest towards
the concept “agility” in an IS context and studied the differences between agile
software development projects and traditional ones (Yang et al., 2009).

284
As a reflective practitioner, I have experienced a state of “over-learned” 22 for a
period but I was able to regulate my own thoughts and behaviours through
continuous reflection. I then have become fully aware of the potential biases I may
have during this research. Therefore, I have developed a set of criteria to filter out
situations and problems that are not related to IS Agility. These criteria include
Change Frequency, Level of Uncertainty, Time Criticality and Information Intensity
which will be discussed in detail in Chapter 2.
Thirdly, New Zealand is the only context in which the present study was conducted.
This may seem to be purely a convenient and economic choice as I happened to be
working in the IT industry in this country for many years. Having said that, New
Zealand is a great place to study IS Agility in a cloud environment. The average size
(by market capitalisation) of firms in New Zealand is much smaller than in many
other countries (MED, 2009). Due to the smaller size and resource constrains, New
Zealand firms often cannot afford the same level of stability compared to their
global competitors. Companies here tend to adapt at a higher rate to survive, which
leads them to a generally stronger desire for agility as a true competitive advantage.
Unsurprisingly, adopting pay-per-use Cloud Computing services with light-weight
implementation is naturally appealing to many New Zealand firms with tight IT
budgets.
22 Schön (1983) described “over-learned” as a mental state where a practitioner has become too good at what he does thus his practice starts to be more repetitive and routine. Such a mental state can manifest itself as a sense of boredom, inattention to new phenomena, or simply, narrowness and rigidity in practice.
285
6.4 Future Work
Future research can extend the application of ISACAM in contexts other than a SaaS
environment. For instance, researchers can apply the ISACAM to analyse and solve
agility problems with on-premises enterprise systems (e.g. ERP, CRM, and SCM). The
technological rules developed in this study are generic in nature thus can be tested
in wider applications to examine their effectiveness, namely, to aim for a “horizontal
expansion”. On the other hand, researchers from different backgrounds may further
develop more specific rules that give precise instructions only for particular
industries or systems, in other words, to focus on a “vertical concentration”.
We also envisage the future of ISACAM as a web-based application developed
following the data and task models. Such an application can be made accessible to
problem solvers from different backgrounds whoever need to solve IS Agility
problems. The application should have a built-in evaluation feature with which
users can provide feedback for improvements of the application itself as well as the
problem-solving method. Data collected through such an application will be of great
value. In the Appendix, several screenshots were taken from a proof-of-concept to
illustrate the potential software instantiation. However, developing and evaluating a
software instantiation is considered beyond the scope of the current study thus
opportunities should be given to future projects.
Next, the ISACAM can be developed into a short online training course for IS
practitioners to develop their abilities for continuous reflections and adjustments
on their tactics and techniques to improve IS Agility in a business context. Such a
course should follow the tradition of this thesis by requesting participants to bring
in real-world IS Agility problems. These problems can be analysed and discussed
more or less following the style of the three episodes reported in Chapter 5. With a
web-based application and a training course, we can reach out to a broad range of
potential users of ISACAM. Currently applying ISACAM on real-world problems is
limited to a small group of people who have already possessed certain level of

286
expertise in IS Agility. We hope future development will reduce the barrier to enable
novice problem solvers or junior practitioners to apply the ISACAM in their daily
work settings.
287
References
Abbasi, A., Albrecht, C., Vance, A., & Hansen, J. (2012). Metafraud: a meta-learning framework for detecting financial fraud. MIS Quarterly, 1293-1327.
ACC. (2016). How to implement safe workplace practices: a guide to workplace health and safety. Retrieved from http://www.acc.co.nz/PRD_EXT_CSMP/groups/external_ip/documents/publications_promotion/wcm000924.pdf
Acharya, A., & Sidnal, N. S. (2016, 19-22 Dec. 2016). High Frequency Trading with Complex Event Processing. Paper presented at the 2016 IEEE 23rd International Conference on High Performance Computing Workshops (HiPCW).
Adams, M. (2010). Dynamic Workflow In A.H.M. ter Hofstede et al. (eds.) (Ed.), Modern Business Process Automation, . Verlag Berlin Heidelberg: Springer.
AgileAlliance. (2001). Manifesto for agile software development. Retrieved from http://www.agilemanifesto.org/
Aken, J. E. v. (2004). Management research based on the paradigm of the design sciences: the quest for field‐tested and grounded technological rules. Journal of management studies, 41(2), 219-246.
Alter, M. J. (2004). Science of Flexibility (3rd ed.): Human Kinetics Publishers. Alturki, A., Gable, G. G., & Bandara, W. (2011). A Design Science Research Roadmap. In H.
Jain, A. P. Sinha, & P. Vitharana (Eds.), Service-Oriented Perspectives in Design Science Research: 6th International Conference, DESRIST 2011, Milwaukee, WI, USA, May 5-6, 2011. Proceedings (pp. 107-123). Berlin, Heidelberg: Springer Berlin Heidelberg.
Alturki, A., Gable, G. G., & Bandara, W. (2013). The design science research roadmap: in progress evaluation. PACIS 2013 proceedings.
Ansoff, H. I. (1980). Strategic issue management. Strategic Management Journal, 1(2), 132-148.
Antunes, P., Baloian, N., Zurita, G., & Pino, J. A. (2018). Supporting People-Driven, Dynamic and Geo-Located Work Processes. Paper presented at the Proceedings of the 10th International Conference on Subject-Oriented Business Process Management.
Antunes, P., & Mourão, H. (2011). Resilient business process management: Framework and services. Expert Systems with Applications, 38(2), 1241-1254.
Antunes, P., Simes, D., & Pino, L. C. A. (2013). An end-user approach to business process modeling. J. Netw. Comput. Appl., 36(6), 1466-1479. doi:10.1016/j.jnca.2013.03.014
Archer, L. B. (1981). A view of the nature of design research. In J. R. & P. J. (Eds.), Design:Science:Method. Guildford,UK: Westbury House.
Argyris, C. (2003). A life full of learning. Organization Studies, 24(7), 1178-1192. Assy, N., & Gaaloul, W. (2015). Extracting configuration guidance models from business
process repositories. Paper presented at the International Conference on Business Process Management.
Babar, M. A., Brown, A. W., & Mistrík, I. (2013). Agile Software Architecture: Aligning Agile Processes and Software Architectures: Newnes.
Babb, J., Hoda, R., & Norbjerg, J. (2014). Embedding reflection and learning into agile software development. IEEE software, 31(4), 51-57.
Barki, H. (2008). Thar's gold in them thar constructs. ACM SIGMIS Database, 39(3). Barki, H., Rivard, S., & Talbot, J. (1993). A Keyword Classification Scheme for IS Research
Literature: An Update. MIS Quarterly, June, 209-225.

288
Barros, A., Decker, G., Dumas, M., & Weber, F. (2007). Correlation patterns in service-oriented architectures. Paper presented at the International Conference on Fundamental Approaches to Software Engineering.
Barros, F. J. (2015). Aspect‐oriented programming and pluggable software units: a comparison based on design patterns. Software: Practice and Experience, 45(3), 289-314.
Baskerville, R., Mathiassen, L., & Pries-Heje, J. (2005). Agility in Fours: IT Diffusion, IT Infrastructures, IT Development, and Business. In R. Baskerville, L. Mathiassen, J. Pries-Heje, & J. DeGross (Eds.), Business Agility and Information Technology Diffusion (Vol. 180, pp. 3-10). Boston: Springer
Bhatt, G., Emdad, A., Roberts, N., & Grover, V. (2010). Building and leveraging information in dynamic environments: The role of IT infrastructure flexibility as enabler of organizational responsiveness and competitive advantage. Information & Management, 47(7-8).
Boehm, B., & Turner, R. (2003). Balancing agility and discipline: A guide for the perplexed: Addison-Wesley Professional.
Böhm, M., Leimeister, S., Riedl, C., & Krcmar, H. (2010). Cloud Computing - Outsourcing 2.0 or a new Business Model for IT Provisioning? . In F. Keuper, C. Oecking, & A. Degenhardt (Eds.), Application Management Service Management und Service Creation (pp. 2-26): Gabler.
Booch, G. (2005). The unified modeling language user guide: Pearson Education India. Boubaker, S., Mammar, A., Graiet, M., & Gaaloul, W. (2016). A formal guidance approach for
correct process configuration. Paper presented at the International Conference on Service-Oriented Computing.
Boyd, J. R. (1976). An Organic Design for Command and Control. Unpublished lecture notes. In Boyd, J.R. A Discourse on Winning and Losing.
Bradley, S., & Hood, C. (2003). Delivering minimalist workplaces that improve corporate agility. Journal of Facilities Management, 2, 68.
Brown, J. L., & Agnew, N. M. (1982). Corporate Agility. Business Horizons, 25(2), 29. Cabitza, F., & Simone, C. (2013). Computational Coordination Mechanisms: A tale of a
struggle for flexibility. Comput. Supported Coop. Work, 22(4-6), 475-529. doi:10.1007/s10606-013-9187-5
Camarinha-Matos, L., Afsarmanesh, H., & Rabelo, R. (2003). Infrastructure developments for agile virtual enterprises. International Journal of Computer Integrated Manufacturing, 16, 235.
Canter, J. (2000). An Agility Based OODA Model for The e-Commerce/e-Business Enterprise. Retrieved from http://www.iohai.com/iohai-resources/agility-based-ooda-model.html
Caswell, N. S., & Nigam, A. (2005, 19 July 2005). Agility = change + coordination. Paper presented at the E-Commerce Technology Workshops, 2005. Seventh IEEE International Conference on.
Chang, M., He, J., & Castro-Leon, E. (2006). Service-Orientation in the Computing Infrastructure. Paper presented at the IEEE International Symposium on Service-Oriented System Engineering.
Chow, T., & Cao, D.-B. (2008). A survey study of critical success factors in agile software projects. The Journal of Systems and Software, 81, 961-971.
Cohen, W. M., & Levinthal, D. A. (1990). Absorptive capacity: a new perspective on learning and innovation. Administrative Science Quarterly, 35(1), 128-152.

289
Conboy, K. (2009). Agility from First Principles: Reconstructing the Concept of Agility in Information Systems Development. Info. Sys. Research, 20(3), 329-354. doi:http://dx.doi.org/10.1287/isre.1090.0236
Conboy, K., Coyle, S., Wang, X., & Pikkarainen, M. (2011). People over Process: Key Challenges in Agile Development. IEEE Software, 28(4), 48.
Conboy, K., & Fitzgerald, B. (2004). Toward a conceptual framework of agile methods: a study of agility in different disciplines. Paper presented at the Proceedings of the 2004 ACM workshop on Interdisciplinary software engineering research, Newport Beach, CA, USA.
Coram, M., & Bohner, S. (2005 ). The impact of agile methods on software project management Paper presented at the 12th IEEE International Conference and Workshops on the Engineering of Computer-Based Systems, Greenbelt, MD USA
Coronado, M., Lyons, A. C., & Kehoe, D. F. (2004). Assessing the value of information systems in supporting agility in high tech manufacturing enterprises. International journal Operations & Production Management, 24(12).
Creswell, J. W. (2009). Research design: Qualitative,quantitative,and mixed methods approaches (3rd ed.). Thousand Oaks,CA: Sage Publications.
Cross, N. (1993). A history of design methodology, . In M. J. In de Vries, Cross, N. and Grant, D. P. (Eds.). (Ed.), Design Methodology and Relationships with Science . : Dordrecht: Kluwer Academic Publishers.
Denning, P. J. (2007). Mastering the mess. Communications of the ACM, 50(4), 21+. Dennis, A. R., Fuller, R. M., & Valacich, J. S. (2008). Media, tasks, and communication
processes: a theory of media synchronicity. MIS Q., 32(3), 575-600. Denzin, N. K., & Lincoln, Y. S. (2005). The Discipline and Practice of Qualitative Research. In
N. K. Denzin & Y. S. Lincoln (Eds.), The Sage Handbook of Qualitative Research (3 ed., pp. 1-32). CA:Thousand Oaks: Sage Publications.
Department of Labour, N. Z. (2011). Forestry sector action plan 2010-2013. Retrieved from http://www.worksafe.govt.nz/worksafe/about/who-we-work-with/action-agenda-action-plans/forestry-sector-action-plan-2010-13/forestry-action-plan.pdf
Diaper, D., & Stanton, N. (2003). The handbook of task analysis for human-computer interaction: CRC Press.
Dörbecker, R., & Böhmann, T. (2015). Tackling the Granularity Problem in Service Modularization. Paper presented at the 21st Americas Conference on Information Systems Seattle, U.S.
Dove, R. (2001). Response ability: The language, structure and culture of the Agilie enterprise. New York: Wiley.
Dove, R., & LaBarge, R. (2014). Fundamentals of Agile Systems Engineering–Part 1 and Part 2. Paper presented at the Int. Counc. Syst. Eng. Int. Symp.
Dunkel, J., Fernández, A., Ortiz, R., & Ossowski, S. (2011). Event-driven architecture for decision support in traffic management systems. Expert Systems with Applications, 38(6), 6530-6539. doi:http://dx.doi.org/10.1016/j.eswa.2010.11.087
Eder, W. E. (2011). Engineering design science and theory of technical systems: Legacy of Vladimir Hubka. Journal of Engineering Design, 22(5), 361-385.
Ellis, T. J., & Levy, Y. (2010). A guide for novice researchers: Design and development research methods. Paper presented at the Proceedings of Informing Science & IT Education Conference, InSITE.
Erich, F., Amrit, C., & Daneva, M. (2014). Cooperation between information system development and operations: a literature review. Paper presented at the In
290
Proceedings of the 8th ACM/IEEE International Symposium on Empirical Software Engineering and Measurement. ACM. http://doi.acm.org/10.1145/2652524.2652598
Fernandez-del-Rincon, A., Garcia, P., Diez-Ibarbia, A., de-Juan, A., Iglesias, M., & Viadero, F. (2017). Enhanced model of gear transmission dynamics for condition monitoring applications: Effects of torque, friction and bearing clearance. Mechanical Systems and Signal Processing, 85, 445-467. doi:https://doi.org/10.1016/j.ymssp.2016.08.031
Ferris, D. L., & Smith, G. A. (1978). U.S. Patent No. 4,105,365 A. P. a. T. Office. Fink, L., & Neumann, S. (2007). Gaining Agility through IT Personnel Capabilities: The
Mediating Role of IT Infrastructure Capabilities *. Journal of the Association for Information Systems, 8, 440.
Fink, L., & Neumann, S. (2009). Exploring the perceived business value of the flexibility enabled by information technology infrastructure. Information & Management, 46(2), 90-99.
Fitch, F. B. (1946). Self-reference in philosophy. Mind, 55(217), 64-73. Foster, I., Yong, Z., Raicu, I., & Lu, S. (2008 ). Cloud Computing and Grid Computing 360-
Degree Compared. Paper presented at the Grid Computing Environments Workshop, 2008. GCE '08.
Friedman, H., & Sheard, M. (1987). An axiomatic approach to self-referential truth. Annals of Pure and Applied Logic, 33, 1-21.
Fullerton, T., & Ness, L. R. (2010). Information Technology Flexibility: A synthesized model from existing literature. Journal of Information Technology Management, XXI(3), 51-59.
Gallagher, K., & Worrell, J. (2008). Organizing IT to promote agility. Information Technology and Management, 9, 71.
Gebauer, J., & Schober, F. (2006). Information System Flexibility and the Cost Efficiency of Business Processes. Journal of the Association for Information Systems, 7(3), Article 8.
Glanville, R. (1999). Researching design and designing research. Design Issues, 15(2), 80-91. Gleasure, R. (2015). When is a problem a design science problem? Systems, Signs & Actions,
9(1), 9-25. Goldman, S., Nagel, R., & Preiss, K. (1995). Agile Competitors and Virtual Organizations. New
York: Van Nostrand Reinhold. Goldman, S., Preiss, K., Nagel, R., & Dove, R. (1991). 21st century manufacturing enterprise
strategy : An Industry-Led View. Bethlehem,PA: Iacocca Institute,Lehigh University. Goldratt, E. M. (1990). What is this thing called the Theory of Constraints? . Croton-on-
Hudson, NY. : North River Press,. Gollwitzer, P. M., Heckhausen, H., & Steller, B. (1990). Deliberative and implemental mind-
sets: Cognitive tuning toward congruous thoughts and information. Journal of Personality and Social Psychology, 59(6), 1119.
Gong, Y., & Janssen, M. (2010). Measuring process flexibility and agility. Paper presented at the Proceedings of the 4th International Conference on Theory and Practice of Electronic Governance, Beijing, China.
Goodhue, D. L., Chen, D. Q., Boudreau, M. C., Davis, A., & Cochran, J. D. (2009). Addressing Business Agility Challenges With Enterprise Systems. MIS Quarterly Executive, 8(2), 73-87.
Grant, T., & Kooter, B. (2005). Comparing OODA & other models as Operational View C2 Architecture Topic: C4ISR/C2 Architecture. ICCRTS2005, Jun.

291
Guba, E. G., & Lincoln, Y. S. (2005). Paradigmatic Controversies, Contradictions, and Emerging Confluences. In N. K. Denzin & Y. S. Lincoln (Eds.), The Sage Handbook of Qualitative Research (3 ed., pp. 191-215). CA:Thousand Oaks: Sage Publications.
Haberfellner, R., & Weck, O. d. (2005). Agile SYSTEMS ENGINEERING versus AGILE SYSTEMS engineering. Fifteenth Annual International Symposium of the Internation Council On System Engineering (INCOSE).
Haeckel, S. H., & Nolan, R. L. (1996). Managing By Wire: Using I/T to Transform a Business From "Make-and-Sell" to "Sense-and-Respond". In J. N. Luftman. (Ed.), COMPETING IN THE INFORMATION AGE: STRATEGIC ALIGNMENT IN PRACTICE, : Oxford University Press, Inc.
Hancock, P. A., Jagacinski, R. J., Parasuraman, R., Wickens, C. D., Wilson, G. F., & Kaber, D. B. (2013). Human-automation interaction research: Past, present, and future. ergonomics in design, 21(2), 9-14.
Hevner, A., & Chatterjee, S. (2010). Design science research in information systems: Springer. Hevner, A. R. (2007). A three cycle view of design science research. Scandinavian journal of
information systems, 19(2), 4. Hevner, A. R., March, S. T., Park, J., & Ram, S. (2004). Design science in information systems
research. MISQ, 28(1), 75-105. Hobbs, G., & Scheepers, R. (2010). Agility in Information Systems:Enabling Capabilities for
the IT Function. Pacific Asia Journal of the Association for Information Systems, 2(4), Article 2.
HP. (2011). Does IT Deliver Business Agility? Retrieved from http://h10131.www1.hp.com/downloads/does-it-deliver-agility.pdf
Huang, C.-Y., & Nof, S. Y. (1999). Enterprise agility: a view from the PRISM lab. International Journal of Agile Management Systems, 1(1), 51.
Huang, P.-Y., Pan, S. L., & Ouyang, T. H. (2014). Developing information processing capability for operational agility: implications from a Chinese manufacturer. European Journal of Information Systems, 23(4), 462-480.
Hubka, V., & Eder, W. E. (1987). A scientific approach to engineering design. Design Studies, 8(3), 123-137.
Hubka, V., & Eder, W. E. (2012). Design science: introduction to the needs, scope and organization of engineering design knowledge: Springer Science & Business Media.
Huff, S. L., Munro, M. C., & Martin, B. H. (1988). Growth stages of end user computing. Commun. ACM, 31(5), 542-550. doi:http://doi.acm.org/10.1145/42411.42417
Hugos, M. (2010). Business Strategy based on Cloud Computing and Agility. CIO. Retrieved from http://advice.cio.com/michael_hugos/14230/business_strategy_based_on_cloud_computing_and_agility
Hugoson, M.-A., Magoulas, T., & Pessi, K. (2009). Architectural Principles for Alignment Within the Context of Agile Enterprises. Paper presented at the Proceedings of the European Conference on Information Management & Evaluation.
Iivari, J. (2007). A paradigmatic analysis of information systems as a design science. Scandinavian journal of information systems, 19(2), 5.
IT_Governance_Institute. (2007). COBIT 4.1: Framework, Control Objectives, Management Guidelines, Maturity Models. Rolling Meadows IL: IT Governance Institute.
Izza, S., Imache, R., Vincent, L., & Lounis, Y. (2008). An Approach for the Evaluation of the Agility in the Context of Enterprise Interoperability. In K. Mertins, R. Ruggaber, K.

292
Popplewell, & X. Xu (Eds.), Enterprise Interoperability III - New Challenges and Industrial Approaches (pp. 3-14): Springer London.
Jonas, W. (2007). Design Research and its Meaning to the Methodological Development of the Discipline. Design research now, 187-206.
Kappelman, L., McLean, E., Johnson, V., & Gerhart, N. (2014). The 2014 SIM IT key issues and trends study. MIS Quarterly Executive, 13(4), 237-263.
Katz, R. H. (2009). Tech Titans Building Boom. IEEE Spectrum, 46(2), 40. Keen, P. (1980). MIS research: Reference disciplines and a cumulative tradition. Paper
presented at the Proceedings of the First International Conference on Information Systems Philadelphia, December 1980.
Kimball, R., & Ross, M. (2013). The Data Warehouse Toolkit: The Definitive Guide to Dimensional Modeling: Wiley Publishing.
Knabke, T., & Olbrich, S. (2013, 7-10 Jan. 2013). Understanding Information System Agility -- The Example of Business Intelligence. Paper presented at the System Sciences (HICSS), 2013 46th Hawaii International Conference on.
Kuechler, B., & Vaishnavi, V. (2008). On theory development in design science research: anatomy of a research project. European Journal of Information Systems, 17, 489-504.
Lanz, A., Weber, B., & Reichert, M. (2010). Workflow time patterns for process-aware information systems. In Enterprise, Business-Process and Information Systems Modeling (pp. 94-107): Springer.
Lawson, J. (1981). Command control as a process. IEEE Control Systems Magazine, 1(1), 5-11.
Lawton, G. (2008). Developing Software Online With Platform-as-a-Service Technology. Computer, 41(6), 13-15.
Leavitt, N. (2009 ). Is Cloud Computing Really Ready for Prime Time? Computer, 42(1), 15-20.
Lee, A. (2010). Retrospect and prospect: information systems research in the last and next 25 years. Journal of Information Technology. doi:citeulike-article-id:8392856doi: 10.1057/jit.2010.24
Lee, A. S. (1991). Integrating Positivist and Interpretivist Approaches to Organizational Research. Organization Science, 2(4), 342-365.
Lee, G., & Xia, W. (2010). Toward Agile: An Integrated Analysis of Quantitative and Qualitative Field Data on Software Development Agility. MIS Quarterly, 34, 87-114.
Levy, R. (1985). Science, Technology and Design. Design Studies, 6(1), 66-72. Liu, S., Spencer, B., Yong, L., Bo, X., Libo, Z., & Brooks, M. (2007, 24-27 July 2007). Towards an
Agile Infrastructure to Provision Devices, Applications, and Networks: A Service-oriented Approach. Paper presented at the Computer Software and Applications Conference, 2007. COMPSAC 2007. 31st Annual International.
Luftman, J., & Ben-Zvi, T. (2010). Key Issues for IT Executives 2009: Difficult Economy's Impact on IT. MIS Quarterly Executive, 9(1), 46-59.
Lunsford, D. (2009). Virtualization Technologies in Information Systems Education. Journal of Information Systems Education, 20, 339.
Lyytinen, K., & King, J. L. (2004). Nothing at the center?: Academic legitimacy in the information systems field. Journal of the Association for Information Systems, 5(6), 8.
Lyytinen, K., & Rose, G. M. (2006). Information system development agility as organizational learning. Eur J Inf Syst, 15(2), 183-199.

293
MacCormack, A. (2008). Building the Agile Enterprise: Myths, Perceptions, and Reality. Cutter Benchmark Review, 8(4), 5-13.
March, S. T., & Smith, G. F. (1995). Design and natural science research on information technology. Decision support systems, 15(4), 251-266.
Markus, M. L., Majchrzak, A., & Gasser, L. (2002). A design theory for systems that support emergent knowledge processes. MIS Quarterly, 179-212.
Martensson, A. (2007). Producting and Consuming Agility. In K. C. Desouza (Ed.), Agile Information Systems:Conceptualizaion,Construction,and Management (pp. 41-51). Oxford: Butterworth Heinemann.
Mathiassen, L., & Pries-Heje, J. (2006). Business agility and diffusion of information technology. Eur J Inf Syst, 15(2), 116-119.
Maurer, C., & Goodhue, D. (2010). A Theoretical Model of the Enterprise System Agility Life-Cycle. Paper presented at the AMCIS 2010 Proceedings. .
McKinsey. (2006). Building a nimble organization: A Mckinsey Global Survey. Retrieved from http://www.mckinseyquarterly.com/Building_a_nimble_organization_A_McKinsey_Global_Survey_1808
MED. (2009). The Structure and Ownership of New Zealand Companies. Retrieved from http://www.med.govt.nz/templates/MultipageDocumentTOC____42161.aspx
Mell, P., & Grance, T. (2010). The NIST Definition of Cloud Computing. Association for Computing Machinery. Communications of the ACM, 53(6), 50.
Microsoft. (2010). Cloud Services. Retrieved from http://download.microsoft.com/download/7/0/B/70B05EA3-233E-4677-A921-DA409B4EADF6/Microsoft_CloudServices.pdf.
Mullins, R. (2010). Agility, Not Savings, May Be The True Value Of The Cloud. Network Computing. Retrieved from http://www.networkcomputing.com/data-center/agility-not-savings-may-be-the-true-value-of-the-cloud.php
Myers, M. D. (1997). Qualitative Research in Information Systems. MIS Quarterly, 21(2), 241-242.
Myers, M. D., & Newman, M. (2007). The qualitative interview in IS research: Examing the craft. Information and Organization, 17, 2-26.
Nazir, S., & Pinsonneault, A. (2008). The Role of Information Technology in Firm Agility: An Electronic Integration Perspective. AMCIS 2008 Proceedings.
Ngo-Ye, L., & Ahsan, M. (2005). Enterprise IT Application Systems Agility and Organizational Agility. Paper presented at the AMCIS 2005.
Nguyen, T. M., Schiefer, J., & Tjoa, A. M. (2005). Sense and response service architecture (SARESA): an approach towards a real-time business intelligence solution and its use for a fraud detection application. Paper presented at the Proceedings of the 8th ACM international workshop on Data warehousing and OLAP, Bremen, Germany.
Nguyen, T. M., Schiefer, J., & Tjoa, A. M. (2007). ZELESSA: an enabler for real-time sensing, analysing and acting on continuous event streams. International Journal of Business Intelligence and Data Mining, 2(1), 105-141.
Nunamaker Jr, J. F., Chen, M., & Purdin, T. D. M. (1990). Systems Development in Information Systems Research. Journal of Management Information Systems, 7(3), 89-106.
Offermann, P., Levina, O., Schnherr, M., & Bub, U. (2009). Outline of a design science research process. Paper presented at the Proceedings of the 4th International Conference on Design Science Research in Information Systems and Technology, Philadelphia, Pennsylvania.
294
Oosterhout, M., Waarts, E., & Hillegersberg, J. V. (2006). Change factors requiring agility and implications for IT. Eur J Inf Syst, 15(2), 132-145.
Oracle. (2010). Increase Business Performance through IT Agility. Retrieved from https://landingpad.oracle.com/webapps/dialogue/ns/dlgwelcome.jsp?p_ext=Y&p_dlg_id=8920806&src=7011677&Act=8
Orlikowski, W. J., & Baroudi, J. J. (1991). Studying Information Technology in Organizations: Research Approaches and Assumptions. Information Systems Research, 2(1), 1-28.
Orlikowski, W. J., & Iacono, C. S. (2001). Research commentary: Desperately seeking the “IT” in IT research—A call to theorizing the IT artifact. Information Systems Research, 12(2), 121-134.
Osinga, F. (2005). Science, Strategy and War. Delft, The Netherlands, 6. Overby, E., Bharadwaj, A., & Sambamurthy, V. (2006). Enterprise agility and the enabling
role of information technology. Eur J Inf Syst, 15(2), 120-131. Pankaj. (2005). An analysis and exploration of the construct of information systems agility.
(Ph.D.), Southern Illinois University at Carbondale, United States -- Illinois. Retrieved from http://proquest.umi.com/pqdweb?did=921027641&Fmt=7&clientId=7511&RQT=309&VName=PQD
Pankaj, Hyde, M., Ramaprasad, A., & Tadisina, S. K. (2009). Revisiting Agility to Conceptualize Information Systems Agility. In M. D. Lytras & P. O. d. Pablos (Eds.), Emerging Topics and Technologies in Information Systems (pp. 19-54).
Parasuraman, R., Sheridan, T. B., & Wickens, C. D. (2000). A model for types and levels of human interaction with automation. IEEE Transactions on systems, man, and cybernetics-Part A: Systems and Humans, 30(3), 286-297.
Paschke, A., Vincent, P., & Springer, F. (2011). Standards for complex event processing and reaction rules. Paper presented at the Proceedings of the 5th international conference on Rule-based modeling and computing on the semantic web, Ft. Lauderdale, FL, USA.
Pavlou, P. A., & El Sawy, O. A. (2010). The “Third Hand”: IT-Enabled Competitive Advantage in
Turbulence Through Improvisational Capabilities. Information Systems Research, 21(3), 443-471.
Peffers, K., Tuunanen, T., Rothenberger, M. A., & Chatterjee, S. (2007). A design science research methodology for information systems research. Journal of Management Information Systems, 24(3), 45-77.
Pierce, J. R. (2012). An introduction to information theory: symbols, signals and noise: Courier Corporation.
Pike_River_Royal_Commission. (2010). Commission's Report - Volume 1 - What happened at Pike River. Royal Commission on the Pike River Coal Mine Tragedy. Retrieved from http://pikeriver.royalcommission.govt.nz/Volume-One---What-Happened-at-Pike-River
Pinsonneault, A., & Kraemer, K. L. (1993). Survey research methodology in Management Information Systems: An Assessment. Journal of Management Information Systems, 10(2), 75-105.
Porter, M. E. (1996). What is strategy? Harvard Business Review, 74(6), 61-78. Prat, N., Comyn-Wattiau, I., & Akoka, J. (2015). A taxonomy of evaluation methods for
information systems artifacts. Journal of Management Information Systems, 32(3), 229-267.

295
Ramasesh, R., Kulkarni, S., & Jayakumar, M. (2001). Agility in manufacturing systems: an exploratory modelling framework and simulation. . Integrated Manufacturing Systems, 12(6/7), 537-548.
Rasouli, M., Ghazanfari, M., & Eshuis, H. (2017). A process aware information system to support agility in relief operations. Paper presented at the 13th International Conference on Industrial Engineering (IIEC 2017).
Reich, Y. (1995). A critical review of general design theory. Research in Engineering Design, 7(1), 1-18.
Reichert, M., Rinderle-Ma, S., & Dadam, P. (2009). Flexibility in Process-Aware Information Systems. In J. Kurt & M. A. Wil (Eds.), Transactions on Petri Nets and Other Models of Concurrency II (pp. 115-135): Springer-Verlag.
Rekik, M., Boukadi, K., Assy, N., Gaaloul, W., & Ben-Abdallah, H. (2016). A linear program for optimal configurable business processes deployment into cloud federation. Paper presented at the Services Computing (SCC), 2016 IEEE International Conference on.
Remenyi, D., & Sherwood-Smith, M. (1999). Maximise information systems value by continuous participative evaluation. Logistics Information Management, 12(1/2), 14-31.
Ren, M., & Lyytinen, K. (2008). Building Enterprise Architecture Agility and Sustenance with SOA. Communications of AIS, 2008, 75-86.
Richard, B., & Jan, P. H. (2004). Short cycle time systems development. Information Systems Journal, 14(3), 237-264. doi:doi:10.1111/j.1365-2575.2004.00171.x
Robey, F., & Markus, M. L. (1998). Beyond rigor and relevance:Producing consumable research about information systems. Information Resources Management Journal, 11(1), 7-15.
Rohde, M., Brödner, P., Stevens, G., Betz, M., & Wulf, V. (2017). Grounded Design–a praxeological IS research perspective. Journal of Information Technology, 32(2), 163-179.
Rouse, W. B. (2007). Agile Information for Agile Decision Making. In K. C. Desouza (Ed.), Agile Information Systems:Conceptualization,Construction,and Management (pp. 16-29). Oxford: Butterworth Heinemann.
Rowley, J. (2007). The wisdom hierarchy: representations of the DIKW hierarchy. Journal of Information Science, 33(2), 163-180. doi:doi:10.1177/0165551506070706
Saad, S., & Arakaki, R. (2014). An event processing architecture for operational risk management in an industrial environment. Paper presented at the Proceedings of the 8th ACM International Conference on Distributed Event-Based Systems, Mumbai, India.
Salmela, H., Tapanainen, T., Baiyere, A., Hallanoro, M., & Galliers, R. (2015). IS Agility Research: An Assessment and Future Directions. Paper presented at the Twenty-Third European Conference on Information Systems.
Sambamurthy, V., Bharadwaj, A., & Grover, V. (2003). Shaping agility through digital options: Reconceptualizing the role of information technology in contemporary Firms. MIS Quarterly, 27(2), 237.
Sawas, M., & Watfa, M. (2015). The impact of cloud computing on information systems agility. Australasian Journal of Information Systems, 19.
Schatten, A., & Schiefer, J. (2007, 24-26 Oct. 2007). Agile Business Process Management with Sense and Respond. Paper presented at the e-Business Engineering, 2007. ICEBE 2007. IEEE International Conference on.

296
Schiefer, J., Rozsnyai, S., Rauscher, C., & Saurer, G. (2007). Event-driven rules for sensing and responding to business situations. Paper presented at the Proceedings of the 2007 inaugural international conference on Distributed event-based systems, Toronto, Ontario, Canada.
Schiefer, J., & Seufert, A. (2005, 28-30 Nov. 2005). Management and Controlling of Time-Sensitive Business Processes with Sense and Respond. Paper presented at the Computational Intelligence for Modelling, Control and Automation, 2005 and International Conference on Intelligent Agents, Web Technologies and Internet Commerce, International Conference on.
Schoenfeld, A. H. (2014). Mathematical problem solving: Elsevier. Schön, D. A. (1983). The reflective practitioner - how professionals think in action.: Basic
Books. Schön, D. A. (1988). Designing: rules, types, and worlds. Design Studies, 9, 181-190. Schön, D. A. (1992). Designing as reflective conversation with the materials of a design
situation. Knowledge-Based Systems, 5(1), 3-14. Sengupta, K., & Masini, A. (2008). IT agility: striking the right balance. Business Strategy
Review, 19(2), 42. SEO, D., & Paz, A. I. L. (2008). Exploring the Dark Side of IS in Achieving Organizational
Aagility. Communications of the ACM, 51(11), 136-139. Setia, P., Sambamurthy, V., & Closs, D. (2008). Realizing business value of agile IT
applications: antecedents in the supply chain networks. Information Technology and Management, 9, 5.
Shafer, R. A., Dyer, L., Kilty, J., Amos, J., & Ericksen, J. (2001). Crafting a human resource strategy to foster organizational agility: A case study. Human Resource Management, 40(3), 197.
Shambour, Q., & Lu, J. (2012). A trust-semantic fusion-based recommendation approach for e-business applications. Decision Support Systems, 54(1), 768-780. doi:https://doi.org/10.1016/j.dss.2012.09.005
Sharifi, H., & Zhang, Z. (2000). A methodology for achieving agility in manufacturing organizations. International Journal of Operations & Production Management, 20(4), 496-513.
Sharifi, H., & Zhang, Z. (2001). Agile manufacturing in practice: Application of a methodology. International Journal of Operations & Production Management, 21(5/6), 772.
Sheppard, J. M., & Young, W. B. (2006). Agility Literature Review: Classification, Training, and Testing. Journal of Sports Science, 24(9), 919-932.
Silva, A. R., Meziani, R., Magalhaes, R., Martinho, D., Aguiar, A., & Flores, N. (2009). AGILIPO: Embedding social software features into business process tools. Paper presented at the International Conference on Business Process Management.
Silver, N. (2012). The signal and the noise: why so many predictions fail--but some don't: Penguin.
Simon, H. A. (1996). The sciences of the artificial. (3rd Ed.): MIT press. Chicago Singh, S., & Chana, I. (2012). Enabling reusability in agile software development. arXiv
preprint arXiv:1210.2506. Slack, N. (1993). Flexibility as a Manufacturing Objective. International Journal of Operations
& Production Management, 3(3), 4-13. Smith, R. K., & Montgomery, M. T. (2015). Toward clarity on understanding tropical cyclone
intensification. Journal of the Atmospheric Sciences, 72(8), 3020-3031.
297
Snowden, D. J., & Boone, M. E. (2007). A leader's framework for decision making. Harvard Business Review, 85(11), 68.
Solano, M. A., Ekwaro-Osire, S., & Tanik, M. M. (2012). High-Level fusion for intelligence applications using Recombinant Cognition Synthesis. Information Fusion, 13(1), 79-98.
Sommerville, I. (2010). Software Engineering: Addison-Wesley Publishing Company. Sull, D. (2010). Competing through organizational agility. The McKinsey Quarterly, 48. Takeda, H., Veerkamp, P., & Yoshikawa, H. (1990). Modeling design process. AI magazine,
11(4), 37. Tecce, D. J., Pisano, G., & Shuen, A. (1997). Dynamic capabilities and strategic management.
Strategic Management Journal, 18(7), 509-533. Tiwana, A., & Konsynski, B. (2010). Complementarities between organizational IT
architecture and governance structure. Information Systems Research, 21(2), 288(217).
Trinh-Phuong, T., Molla, A., & Peszynski, K. (2010). Enterprise Systems and Organisational Agility: Conceptualizing the Link. Paper presented at the ACIS 2010 Proceedings. .
Truong, D. (2010). How Cloud Computing Enhances Competitive Advantages: A Research Model for Small Businesses. The Business Review, Cambridge, 15, 59.
Van der Aalst, W. M. (2009). Process-aware information systems: Lessons to be learned from process mining. In Transactions on petri nets and other models of concurrency II (pp. 1-26): Springer.
Van der Aalst, W. M., Lohmann, N., & La Rosa, M. (2012). Ensuring correctness during process configuration via partner synthesis. Information Systems, 37(6), 574-592.
Venable, J., Pries-Heje, J., & Baskerville, R. (2012). A comprehensive framework for evaluation in design science research. Paper presented at the International Conference on Design Science Research in Information Systems.
Venable, J., Pries-Heje, J., & Baskerville, R. (2016). FEDS: a framework for evaluation in design science research. European Journal of Information Systems, 25(1), 77-89.
VMware. (2011). Business Agility and the True Economics of Cloud Computing Retrieved from https://www.vmware.com/content/dam/digitalmarketing/vmware/en/pdf/VMware_Business_Agility_and_the_True_Economics_of_Cloud_Computing_White_Paper.pdf
Von Foerster, H. (2003). Disorder/order: discovery or invention? In Understanding Understanding (pp. 273-282): Springer.
Walls, J. G., Widmeyer, G. R., & El Sawy, O. A. (1992). Building an information system design theory for vigilant EIS. Information Systems Research, 3(1), 36-59.
Wang, L., Tao, J., Kunze, M., Castellanos, A. C., Kramer, D., & Karl, W. (2008 ). Scientific Cloud Computing: Early Definition and Experience. Paper presented at the High Performance Computing and Communications, 2008. HPCC '08. 10th IEEE International Conference on.
Weber, B., Reichert, M., & Rinderle-Ma, S. (2008). Change patterns and change support features–enhancing flexibility in process-aware information systems. Data & knowledge engineering, 66(3), 438-466.
Weber, R. (2004). The Rhetoric of Positivisim vs. Interpretivism : A personal view. MIS Quarterly, 28(1), iii-xii.
Webster, J., & Watson, R. T. (2002). Analyzing the past to prepare for the future: Writing a literature review. . MIS Quarterly, 26 (2), iii-xiii.

298
Weill, P., Subramani, M., & Broadbent, M. (2002). Building IT infrastructure for strategic agility. MIT Sloan Management Review, 44(1), 57.
Whitehead, A. N., & Sherburne, D. W. (1957). Process and reality: Macmillan New York, NY. Winter, R. (2008). Design science research in Europe. European Journal of Information
Systems, 17(5), 470-475. Wohl, J. G. (1981). Force Management Decision Requirements for Air Force Tactical
Command and Control. Systems, Man and Cybernetics, IEEE Transactions on, 11(9), 618-639. doi:10.1109/TSMC.1981.4308760
WorkSafe. (2013). Retrieved from http://www.worksafe.govt.nz/worksafe/about Worksafe. (2015). Offences and penalties under the Health and Safety at Work Act 2015.
Retrieved from http://www.worksafe.govt.nz/worksafe/information-guidance/all-guidance-items/hswa-fact-sheets/offences-and-penalties-under-the-health-and-safety-at-work-act-2015
Yang, H., Antunes, P., & Tate, M. (2016). Towards a unified conceptualisation of IS Agility. Paper presented at the The 20th IEEE International Conference on Computer Supported Cooperative Work in Design (CSCWD) Nan Chang, China.
Yang, H., Huff, S., & Strode, D. (2009). Leadership in Software Development: Comparing Perceptions of Agile and Traditional Project Managers. Paper presented at the AMCIS 2009 Proceedings., San Francisco, USA.
Yang, H., Huff, S. L., & Tate, M. (2013). Managing the Cloud for Information Systems Agility. In A. Bento & A.K.Aggarwal (Eds.), Cloud Computing Service and Deployment Models: Layers and Management (pp. 70-93). Hershey, PA, USA: IGI Global.
Yang, H., & Tate, M. (2012). A Descriptive Literature Review and Classification of Cloud Computing Research. Communications of the Association for Information Systems, 31(1/2), 35-60.
Yanofsky, N. S. (2003). A universal approach to self-referential paradoxes, incompleteness and fixed points. Bulletin of Symbolic Logic, 9(3), 362-386.
Yoshikawa, H. (1979). Introduction to General Design Theory subtitle_in_Japanese. Journal of the Japan Society of Precision Engineering, 45(536), 906-912.
doi:10.2493/jjspe1933.45.906 Young, M., & McNeese, M. (1995). A Situated Cognition Approach to Problem Solving. . In P.
Hancock, J. Flach, J. Caid, & K. V. (Eds.) (Eds.), Local Applications of the Ecological Approach to Human Machine Systems. (pp. (pp. 359–391).). NJ: Erlbaum.: Hillsdale,.
Yousif, M., & Pessi, K. (2016). It Agility Research Review: Thematic Analysis and Categorization of literature. Paper presented at the PACIS.
Zain, M., Rose, R. C., Abdullah, I., & Masrom, M. (2005). The relationship between information technology acceptance and organizational agility in Malaysia. Information & Management, 42(6), 829-839.
Zappia, I., Paganelli, F., & Parlanti, D. (2012). A lightweight and extensible Complex Event Processing system for sense and respond applications. Expert Systems with Applications, 39(12), 10408-10419. doi:http://dx.doi.org/10.1016/j.eswa.2012.01.197

299
Appendix
Illustrations of potential software instantiation - configuration pages and a data classification page
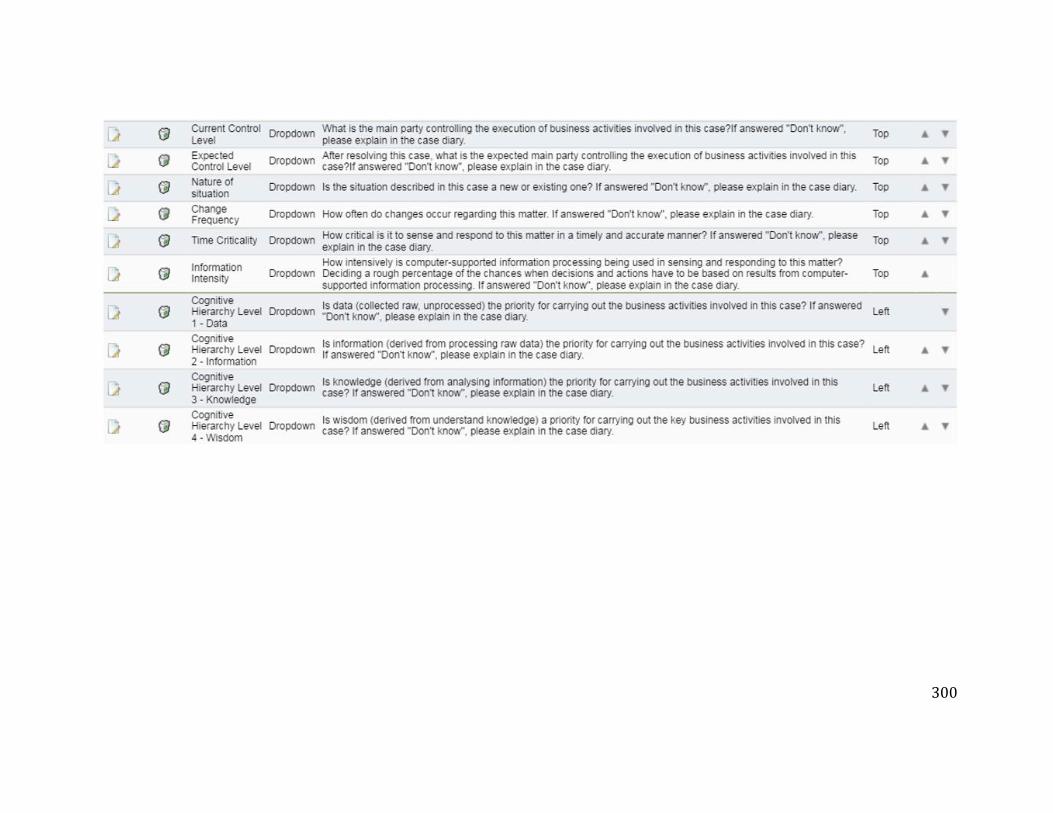
300

301

302