stage 2 disinfectants and disinfection byproducts rule bruce macler usepa region 9 415 972-3569...
TRANSCRIPT

Stage 2 Disinfectants and Disinfection Byproducts Rule
Bruce MaclerUSEPA Region 9415 [email protected]
H
BrClCl
Bromodichloromethane

Stage 2 DBPR• Will ultimately require TTHM and HAA5 MCL
compliance at each monitoring point in distribution system– No averaging across distribution– Goal to control for DBP "hot spots“– More linkage between wholesalers and retailers
• Initial Distribution System Evaluation– Monitoring requirement to determine compliance
points
• Proposed August 18, 2003– Federal Register v.68, n.159, pp49547-49596
• Final Rule expected December 15, 2005*
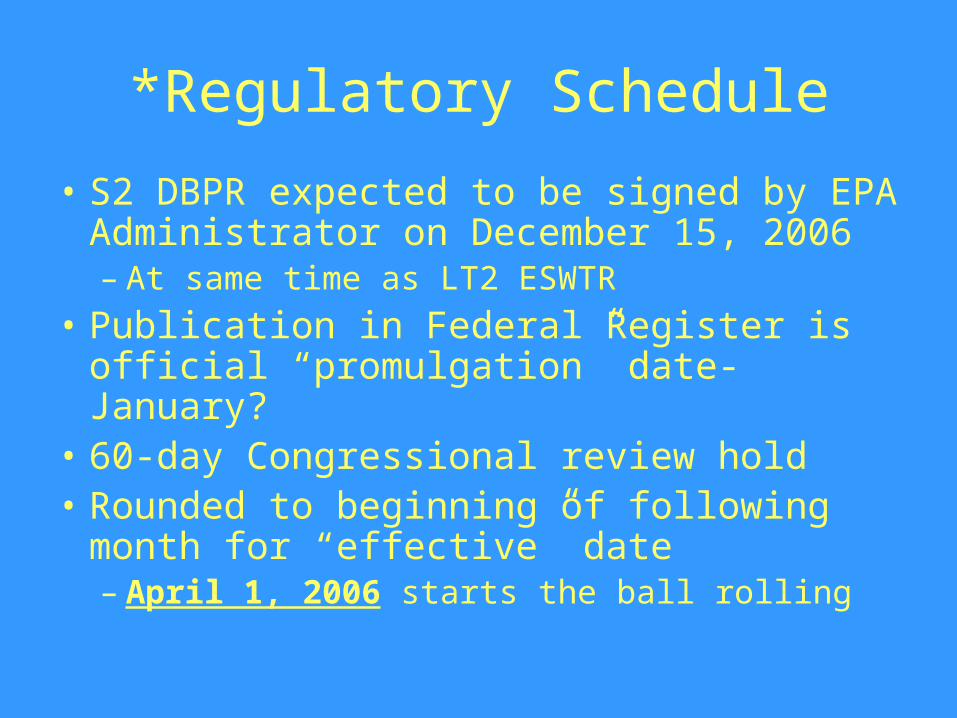
*Regulatory Schedule
• S2 DBPR expected to be signed by EPA Administrator on December 15, 2006– At same time as LT2 ESWTR
• Publication in Federal Register is official “promulgation” date- January?
• 60-day Congressional review hold• Rounded to beginning of following month
for “effective” date– April 1, 2006 starts the ball rolling

Purpose of the Stage 2 DBPR
• Purpose is to provide additional protection from disinfection byproducts of concern
• Supplements existing S1 D/DBPR by focusing on parts of distribution system with higher risks

Significant Changes from Proposal
• Proposed Interim “Stage 2A” MCLs to apply before final “Stage 2B” locational MCLs– Deleted these as too complex
• Proposed early implementation dates– Now will be staggered
• Proposed system-based monitoring– Now will be based on population served
• Added criteria and details on “Significant Excursions”

Systems Affected bythe Stage 2 DBPR
Applies to all CWSs and NTNCWSs that add a disinfectant other than UV, or deliver water that has been treated with a disinfectant other than UV
– Systems using surface water – Systems using ground water under the
influence of surface water
– Ground water systems– Consecutive systems
Consecutive systems are defined in the Stage 2 Rule as public water systems that buy or otherwise receive some or all of their finished water from one or more wholesale systems for at least 60 days per year.

Why Are Consecutive Systems an Issue?
• Wholesalers’ MCL requirements end at turnouts…
• Some regulated contaminants increase in the distribution system– TTHMs– Coliform bacteria
• States have taken varying approaches to regulating DBPs in consecutive systems

Definitions• Consecutive system is a public water system that buys or otherwise
receives some or all of its finished water from one or more wholesale system(s), for at least 60 days per year
• Finished water is water that is introduced into the distribution system of a public water system and is intended for distribution without further treatment, except that necessary to maintain water quality
• Wholesale system is a public water system that treats source water and then sells or otherwise delivers finished water to another public water system for at least 60 days per year. Delivery may be through a direct connection or through the distribution system of one or more consecutive systems
• Combined distribution system is the interconnected distribution system consisting of the distribution systems of wholesale systems and of the consecutive systems that receive finished water from those wholesale systems

Stage 2 DBPR Components• Initial Distribution System Evaluation (IDSE)• New compliance monitoring locations
– Sites chosen from IDSE and/or Stage 1 DBPR sites– Locational Running Annual Average– Operational Evaluations
• Inclusion of consecutive systems• Population based compliance• Revisions to Stage 1 DBPR
– Reduced monitoring based on TOC– Bromate reduced monitoring

Source Water TOC Reduced DBP Monitoring
• Stage 1 DBPR – Systems with
• TTHM < 0.040 mg/L, HAA5 < 0.030 mg/L, and TOC < 4.0 mg/L as a running annual average can qualify for reduced monitoring of TTHM and HAA5
• No timeframe specified
• Stage 2 DBPR – Timeframe added– To qualify for reduced monitoring sample every
30 days– To stay on reduced monitoring sample every 90
days

Reduced Monitoring for Bromate
• Stage 1 DBPR – Systems that use ozone monitor for bromate at the entry
point to the distribution system.
– Reduced monitoring if bromide in source water is < 0.05 mg/L
– Stays in effect until December 31, 2008
• Stage 2 DBPR – Reduced monitoring if bromate is < 0.0025 mg/L RAA at
entry point to the distribution system• New analytical method for bromate with lower detection limit• System must have 12 months of data utilizing new method
– Goes into effect January 1, 2009

Consecutive Systems
• Must comply with IDSE requirements
• Must conduct TTHM and HAA5 compliance monitoring
• Must comply with the Stage 1 DBPR requirements for chlorine and chloramines– Daily monitoring– MCLs (4.0 mg/L)

Challenges for Consecutive Systems
• If receiving treated water – Likely to contain DBPs already– May contain high levels of precursors and
disinfectants that make more DBPs over time
• Upstream treatment changes may substantially affect downstream water quality– Long-term– Variable or episodic

MCL Compliance Challenges for Consecutive Systems
• S1 DBPR controlled DBP precursors– Not an option for consecutive systems
• S2 DBPR introduces new BATs for consecutive systems– Chloramination (>10,000 only)– Management of flow and storage
• These may not work– May need locational treatment in
distribution system
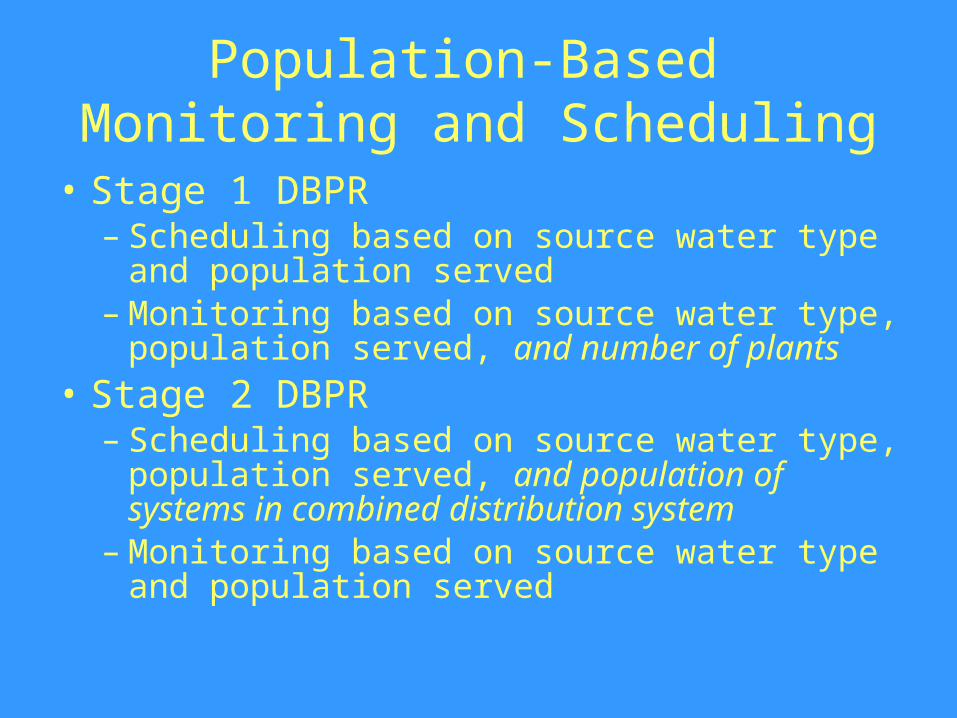
Population-Based Monitoring and Scheduling
• Stage 1 DBPR– Scheduling based on source water type and
population served– Monitoring based on source water type,
population served, and number of plants• Stage 2 DBPR
– Scheduling based on source water type, population served, and population of systems in combined distribution system
– Monitoring based on source water type and population served

Combined Distribution Systems (CDS)
• All systems in a CDS (i.e., wholesalers, consecutive systems) must comply with Stage 2 DBPR requirements on the same schedule– Compliance date is based on the largest system
in the CDS – Largest system is not necessarily the wholesaler
• State has discretion to determine CDS– Emergency or seasonal connections

Combined Distribution Systems
Combined DistributionSystem
Treatment
Plant
River
Wholesale System Consecutive System Consecutive System
System A System B System C

Combined Distribution System Example
System ASystem serving
12,000
System B System serving 60,000
System C System serving
500
Who treats and
sells water to. . .
Sells
wat
er to
. . .
All 3 systems must comply based on the schedule of System B
(Schedule 2)

Violations
Monitoring and MCL violations are attributed to the PWS where the violation occurred
System A sells to System B and a violation occurs in
System BA B
System B is in violation because it has the legal responsibility for complying with the MCL
System B may set up a contract with System A that details water quality delivery specifications
Example

Public Notice and Consumer Confidence Reports
• Responsibility of individual system• Wholesale system is responsible for notifying the
consecutive system of analytical results and violations related to monitoring
• Consecutive system must include the wholesale system’s monitoring results in the consumer confidence report
• Consecutive system must conduct appropriate public notification upon a violation (whether in the wholesale or consecutive system)

Initial Distribution System Evaluation (IDSE)
• Studies conducted by water systems to identify distribution system locations that represent high TTHM and HAA5 levels
• Results of the IDSE are used to select Stage 2 compliance monitoring sites
• Not required for NTNCWSs serving fewer than 10,000 people
• In addition to current regulatory monitoring

Initial Distribution System Evaluation Options
• Standard monitoring– One-year study of TTHM and HAA levels in
distribution system using protocol
• System-specific study using models and data– Must accomplish same goal as standard approach
• “40/30 Monitoring Waiver”– ALL existing data are <40 ug/L for TTHM and <30
ug/L for HAA
• Very small systems waiver– <500 people and existing monitoring site
representative

IDSE Options (cont.)
• Systems serving < 500 people• Can be granted by the State, if the
State determines that the Stage 1 site represents both high TTHM and HAA5 concentrations
Waiver
• All Stage 1 compliance monitoring results (not just LRAAs) are under 40 g/L TTHM and 30 g/L HAA5
• Monitoring periods are specified in rule
Very Small System Waiver
40/30 Certification

IDSE Options (cont.)
• The system must evaluate DBP concentrations throughout the distribution system using existing data source or combination of data sources (e.g., historical data, hydraulic monitoring results)
• Report must be submitted to the State
• System must conduct 1 year of distribution system monitoring for TTHM and HAA5
• Report must be submitted to the State
System Specific Study (SSS)
Standard Monitoring Program (SMP)

Compliance Spread Over Time• Systems >100,000 plus consecutives start first
– 257 SW+ 22 GW systems in R9
• Systems 50-100K plus consecutives– Start six months after first group– 69 SW + 33 GW systems in next group
• Systems 10-50K plus consecutives– Start six months after second group– 86 SW + 181 GW
• Systems <10K– Start six months after third group– 535 SW + 3516 GW

IDSE Schedule
Systems Serving:
Submit 40/30 Cert. or
Monitoring Plan By:
Complete IDSE Study
By:
Submit IDSE Report By:
1 > 100,000 June 30, 2006 June 30, 2008 Sep 30, 2008
2 50,000–99,999
Dec 31, 2006 Dec 31, 2008 Mar 31, 2009
3 10,000–49,999
June 30, 2007 June 30, 2009 Sep 30, 2009
4 < 10,000 Dec 31, 2007 Dec 31, 2009 Mar 31, 2010
Schedule for systems in a combined distribution system is based on that of the largest system in the combined distribution system

IDSE Challenges for Consecutive Systems
• No previous DBP monitoring requirements– May lack data to determine appropriate monitoring
locations for Stage 2 DBPR– May not be eligible for VSS Waiver or
40/30 Certification under IDSE
• Must work with wholesaler, maybe others– Work together to find or get data– Samples may have been taken in consecutive
system’s distribution system

Standard Monitoring
• One of four options for compliance with IDSE requirements
• Most systems that need to complete an IDSE will use this option- hopefully!
• Process is set by U.S. EPA– Frequency, number, and location of samples
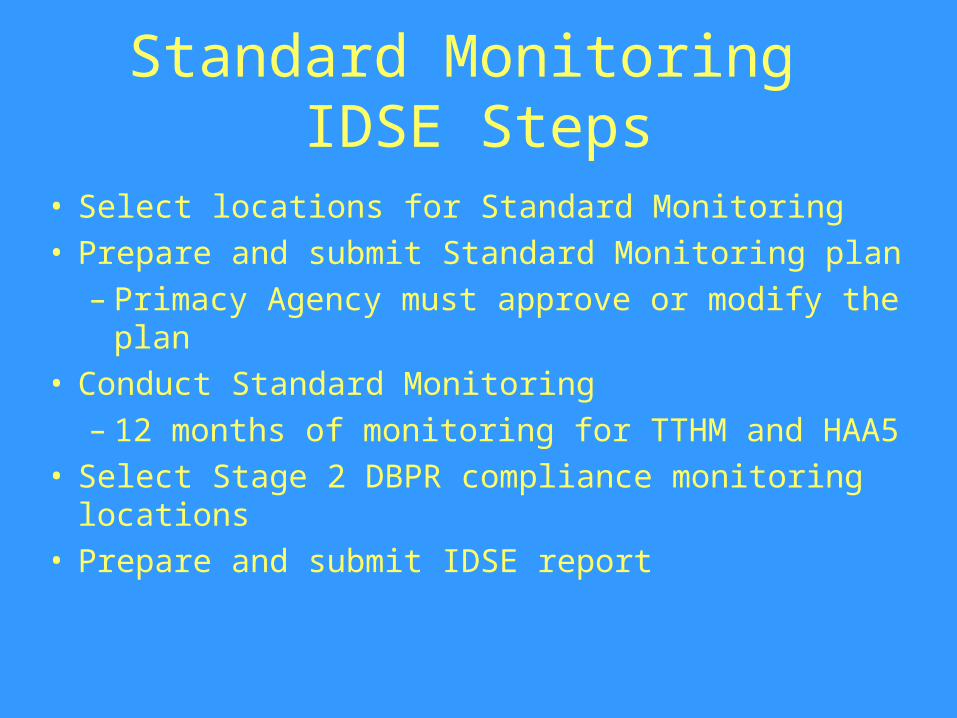
Standard Monitoring IDSE Steps
• Select locations for Standard Monitoring• Prepare and submit Standard Monitoring plan
– Primacy Agency must approve or modify the plan
• Conduct Standard Monitoring– 12 months of monitoring for TTHM and HAA5
• Select Stage 2 DBPR compliance monitoring locations
• Prepare and submit IDSE report

Required Components of Standard Monitoring Plan
• Distribution system schematic– Entry points and sources– Locations and dates of proposed Standard Monitoring
sites– Locations and dates of Stage 1 DBPR monitoring sites
• Population served• Source water type• Justification of Standard Monitoring sites
– Must include data used to justify selection of Standard Monitoring sites

Sampling Requirements• What, where, and how often do I sample?
– Samples Collected• Dual sample set (both TTHM and HAA5) collected at all locations
– Sample Locations• High TTHM levels
• High HAA5 levels
• Average Residence Time
• Near Entry Points
– Number of sites• Based on system type
– Sample Frequency• 1, 4 or 6 samples during the year at each location
• Number based on population served and source type

Standard Monitoring Requirements
• When do I sample?– Sample months
• Peak historical month– Peak TTHM levels or– Peak HAA5 levels or– Month of warmest
water temperature
• Subsequent sample months every 60 days or every 90 days from peak historical month

TTHM and HAA5 Standard Monitoring(1)
• For GW systems or systems that purchase GW
PopulationFrequenc
yTota
lNear EP
ARTHigh
TTHMHigh HAA5
< 500 1/year(2) 2 1(3) - 1 -
500-9,999
4 (every 90 days)
2 - - 1 1
10,000 – 99,999 6 1 1 2 2
100,000-499,999 8 1 1 3 3
> 500,000 12 2 2 4 4
(1) A dual sample set (i.e., a TTHM and an HAA5 sample) must be taken at each monitoring location during each monitoring period.(2) Taken during peak historical month. The peak historical month is the month with the highest TTHM or HAA5 levels or the warmest water temperature.(3) You must monitor at or near the entry point if you are a consecutive system. If you are not a consecutive system, you must monitor at a high HAA5 location.

TTHM and HAA5 Standard Monitoring
• For Surface and GWUDI systems and systems that purchase surface or GWUDI
Population Frequency TotalNear EP
ARTHigh
TTHM
High HAA
5
<500 1/year (2) 2 1(3) - 1 -
500-3,300 4 (every 90 days)
2 - - 1 1
3,301-9,999 4 - 1 2 1
10,000-49,999
6 (every 60 days)
8 1 2 3 2
50,000- 249,999 16 3 4 5 4
250,000-999,999 24 4 6 8 6
1M-4,999,999 32 6 8 10 8
> 5M 40 8 10 12 10

Standard Monitoring Site Selection – Justification
• Plan must include a justification for the selection of sites to be sampled during Standard Monitoring
• Data sources and tools– Distribution system maps– Water quality data– Distribution system operating data

Factors Affecting DBP Formation
• Precursor concentration
• Disinfectant - type and dose
• Water chemistry
• Water temperature
• Water age
• Biodegradation of HAAs

High TTHM concentration
Organics
TTHM Formation
Disinfection

High HAA5 concentration
HAA5 Formation
OrganicsDisinfection

Data Sources and Tools for Site Selection
• Distribution system maps– Pipes
• Dead ends• Length and diameter• Age and material
– Land use• Highly and lightly developed areas• Major users
– Entry points and sources– Key components
• Tanks, pump stations, booster chlorination

Data Sources and Tools for Site Selection
• Water quality data– Source water quality– DBP data
• Can use Stage 1 DBPR data for information• Cannot use Stage 1 DBPR sites for Standard
Monitoring sites
– Disinfectant residual data• Can be indicative of water age• May indicate biodegradation of HAA5

Data Sources and Tools for Site Selection
• Distribution system operating data– Understanding water flow
• Pump run times• Metered flows between pressure zones• Billing records for major users• Advanced tools (hydraulic modeling or tracer
studies)
– Impact of tanks• Tank level records and tank configurations
– Impact of booster chlorination

Selecting Near Entry Point Sites
• Tools– Distribution system map
• Location– After treatment– Before first customer (not required)
• If fewer entry points than needed– Replace with high TTHM and HAA5 sites
• Alternate, starting with TTHM

Selecting Near Entry Point Sites– Example
• System needs 1 location near entry point
• System has 2 surface water treatment plants and 1 well = 3 entry points
• System considers flows from each source– WTP 1 – 5 MGD– WTP 2 – 3 MGD– Well 1 – 0.75 MGD
• Locate site near entry point for WTP 1
WTP 1: 5 MGD
WTP 2: 3 MGD
Well 1:0.75 MGD
xMonitoring Location

Selecting Average Residence Time Sites
• Determination– Flow weighted calculation– Population weighted calculation
• Tools– Distribution system map– Distribution system operational data
• Hydraulic modeling or tracer study
• Pump run times, metered flow
– Distribution system water quality data• Average Disinfectant Residual

Selecting High TTHM Sites• TTHM formation
– Advanced water age is primary factor
• Good TTHM sites– Downstream of tanks – Dead ends, but prior to last customer– Hydraulic dead ends and mixing zones– Downstream of booster chlorination– Sites with difficulty maintaining residual– Areas with low water use– Areas of high historic levels

Selecting High HAA5 Sites• HAA5 formation
– Water age, but also consider biodegradation
• Avoid– Areas with known
biofilm growth– Areas with difficulty
maintaining a residual
• Good HAA5 sites– Downstream of booster
chlorination– Sites with low but
detectable residual– Areas of high historic
levels – Downstream of tanks – Hydraulic dead ends and
mixing zones– Areas with low water use

Standard Monitoring Site Selection
Data Sources and Tools
Disinfectant residual, maps, models, etc.
Select Candidate SitesSelect StandardMonitoring Sites
Narrow DownSelection
Preliminary data will present many “candidate sites” from
which the system can choose “selected sites”

Final “Selected” Sites
• Some site selection will be obvious– Near entry point
• Others will require professional judgment– Consider geographic representation– Consider hydraulic representation– Consider areas fed by sources with higher
DBPs– Use sites that “multi-task”– Consider accessibility

Submitting Standard Monitoring Plan
• Once the system has collected and analyzed its information, it must prepare the plan and submit it to the Primacy Agency– Must include required information

Primacy Agency Review of Standard Monitoring Plan
• Primacy Agency will review the monitoring plan submitted by the system– Verify that it contains required elements– Review Standard Monitoring site selection
and justification
• Primacy Agency may approve or modify plan
If the Primacy Agency does not take action within 12 months from the date when the Plan was due, the system can consider the plan approved

Next Steps
• Conduct 12 months of monitoring based on Standard Monitoring Plan – As approved or amended by Primacy Agency– Begin monitoring when plan has been
approved, or 12 months from submission deadline
• Prepare and submit IDSE report – Purpose of the report is to identify Stage 2
DBPR Compliance Monitoring Sites

Selecting Stage 2 Monitoring Sites
• Calculate a locational running annual average (LRAA) for each IDSE site and Stage 1 DBPR site
• Select sites with highest LRAA values according to Stage 2 requirements
• May select sites with slightly lower LRAA values, but must provide rationale in report– Provides better geographic coverage– Maintain historic data collection– Site is used to sample for other water quality
parameters

IDSE Reporting Requirements
• If using 40/30 certification waiver– All TTHM and HAA5 results from compliance
monitoring required to qualify for the 40/30 certification
– All TTHM and HAA5 results from compliance monitoring taken after the qualifying period for State review
– A schematic of the distribution system with results noted
– Proposed Stage 2B sites and schedule

IDSE Reporting Requirements
• If using System Specific Study– All studies, reports, analytical results, and
modeling used – Stage 1 TTHM and HAA5 analytical results
from the study period– A schematic of the distribution system – Proposed Stage 2B monitoring sites and
schedule

IDSE Reporting Requirements
• If using Standard Monitoring Plan– SMP and Stage 1 TTHM and HAA5 analytical
results– The original monitoring plan and data used to
justify SMP site selections– A schematic of the distribution system with the
results, location, and date of all SMP and Stage 1 samples noted
– Proposed Stage 2 monitoring sites and schedule
– Justification for Stage 2 selection if needed
System Recordkeeping
• Must keep a copy of their IDSE plan and IDSE report as well as state modification or approval for 10 years after date of submittal
• Make all available for review by the state or the public
• CCR must include the range of sample results from the IDSE monitoring in same calendar year as sampling occurred

Primacy Agency Recordkeeping
• Must retain a copy of IDSE study plan and any modifications until replaced by the approved IDSE report
• Must retain a copy of IDSE report and any modifications until replaced or revised in its entirety

Stage 2 Implications for R9 DW Systems
• Monitoring is complex– Expect M/R violations
• For most systems, few changes in monitoring points expected
• Hot spots will be found for some, but unclear how they can be controlled