stage call: cardiovascular reactivity to audition stress...
TRANSCRIPT

RESEARCH ARTICLE
Stage call: Cardiovascular reactivity to
audition stress in musicians
Theerasak Chanwimalueang1, Lisa Aufegger2,3, Tricia Adjei1, David Wasley4,
Cinzia Cruder5, Danilo P. Mandic1*, Aaron Williamon2,3*
1 Department of Electrical and Electronic Engineering, Imperial College London, London, United Kingdom,
2 Centre for Performance Science, Royal College of Music, London, United Kingdom, 3 Faculty of Medicine,
Imperial College London, London, United Kingdom, 4 Cardiff School of Sport, Cardiff Metropolitan University,
Cardiff, United Kingdom, 5 Department of Research and Development, Conservatory of Southern
Switzerland, Lugano, Switzerland
* [email protected] (DPM); [email protected] (AW)
Abstract
Auditioning is at the very center of educational and professional life in music and is associ-
ated with significant psychophysical demands. Knowledge of how these demands affect car-
diovascular responses to psychosocial pressure is essential for developing strategies to
both manage stress and understand optimal performance states. To this end, we recorded
the electrocardiograms (ECGs) of 16 musicians (11 violinists and 5 flutists) before and dur-
ing performances in both low- and high-stress conditions: with no audience and in front of an
audition panel, respectively. The analysis consisted of the detection of R-peaks in the ECGs
to extract heart rate variability (HRV) from the notoriously noisy real-world ECGs. Our data
analysis approach spanned both standard (temporal and spectral) and advanced (structural
complexity) techniques. The complexity science approaches—namely, multiscale sample
entropy and multiscale fuzzy entropy—indicated a statistically significant decrease in struc-
tural complexity in HRV from the low- to the high-stress condition and an increase in struc-
tural complexity from the pre-performance to performance period, thus confirming the
complexity loss theory and a loss in degrees of freedom due to stress. Results from the
spectral analyses also suggest that the stress responses in the female participants were
more parasympathetically driven than those of the male participants. In conclusion, our find-
ings suggest that interventions to manage stress are best targeted at the sensitive pre-per-
formance period, before an audition begins.
Introduction
The first attempt to introduce a taxonomy of stress dates back to Hans Selye in 1936, who
defined stress as a “non-specific endocrine response” [1]. Current research explains stress
through the modulation of the autonomic nervous system (ANS) resulting from physical, envi-
ronmental, or other psychosocial stressors, where both the sympathetic (SNS) and parasympa-
thetic nervous systems (PNS) are involved in the regulation of functions including heart
rhythms, respiration, and blood pressure [2].
PLOS ONE | https://doi.org/10.1371/journal.pone.0176023 April 24, 2017 1 / 14
a1111111111
a1111111111
a1111111111
a1111111111
a1111111111
OPENACCESS
Citation: Chanwimalueang T, Aufegger L, Adjei T,
Wasley D, Cruder C, Mandic DP, et al. (2017) Stage
call: Cardiovascular reactivity to audition stress in
musicians. PLoS ONE 12(4): e0176023. https://doi.
org/10.1371/journal.pone.0176023
Editor: Yih-Kuen Jan, University of Illinois at
Urbana-Champaign, UNITED STATES
Received: December 30, 2016
Accepted: April 4, 2017
Published: April 24, 2017
Copyright: © 2017 Chanwimalueang et al. This is
an open access article distributed under the terms
of the Creative Commons Attribution License,
which permits unrestricted use, distribution, and
reproduction in any medium, provided the original
author and source are credited.
Data Availability Statement: All relevant data are
in the paper and supporting information files.
Funding: The research reported in this article was
supported by grants from the UK’s Arts and
Humanities Research Council (grant ref. AH/
K002287/1), the Peter Sowerby Foundation, and
the Engineering and Physical Sciences Research
Council (grant ref. EP/K025643/1, Multidisciplinary
University Research Initiative EP/P008461, and
Pathways to Impact Grant PSA256).
Competing interests: The authors have declared
that no competing interests exist.
Music performance is a particularly apt domain for studying ANS reactivity to stress [3].
The parameters of performance are set by widely shared conventions and by the constraints of
the music being performed. This enables close control, documentation, and monitoring of sit-
uational variables, while musicians and their audiences interact naturally. Moreover, the
sources of stress in music performances are manifold, from executing technically demanding
compositions to responding to critical audiences in rarified performance spaces. For profes-
sional musicians, the expectation to deliver high-quality performances—no matter where,
when, and for whom—has been linked to debilitating and sometimes career-threatening men-
tal and physical distress [3].
The majority of stress research into music performance has focused on the psychological
construct of performance anxiety using questionnaires, while neglecting the objective assess-
ment of corresponding physiological components. A notable exception is the work of Craske
and Craig [4], who studied 40 musicians in both private and public performance contexts.
Heart rate (HR) was extracted as a measure of autonomous body response prior to and after
the first note played. State anxiety was assessed using a questionnaire before each performance
[5]. The results showed that the highest physiological arousal was captured in the public per-
formance scenario and that the average HR prior to each performance was significantly higher
than the average HR during the corresponding performance. In a similar study, Abel and Lar-
kin [6] recruited 22 musicians to perform in front of a panel of judges. Elevations in measured
HR and state anxiety were observed from the baseline to the pre-performance period, with a
peak in physiological reactivity detected just before participants stepped onto stage. However,
HR was not measured during performance, which prevented direct comparison with the pre-
performance period. While research into physiological stress in musicians has usefully exam-
ined the degree of cardiovascular reactivity at different points in the performance cycle (e.g.
pre-, during-, and post-performance), existing studies have relied mainly on HR [4, 6–8] rather
than the dynamically more informative heart rate variability (HRV).
The analysis of HRV in the time, frequency, and non-linear domains is now widely used to
assess the biomarkers of stress. In particular, the high frequency (HF) power in HRV is consid-
ered to reflect PNS activity influenced by vagal control, while the low frequency (LF) power is
multifaceted and was previously believed to reflect SNS activity. The ratio of the power in the
LF to HF frequency bands (so-called LF/HF ratio) was long thought to indicate the degree of
sympathovagal balance; the higher the ratio, the greater the dominance of SNS, while a lower
ratio was thought to suggest the dominance of PNS activity [9, 10]. However, the LF/HF ratio
is not a reliable indicator of stress, as the LF band reflects both SNS and PNS activity due to the
nonlinear behavior of the vagus nerve [11–16]. Nevertheless, in many psychophysiological
stress studies [17–22], stressors have been found to be associated with an increase in the LF
band and a decrease in the HF band.
Although the analysis of HRV in the frequency domain can identify and capture changes in
stress, nonlinear analysis in the form of structural complexity has recently been used to quan-
tify degrees of determinism versus randomness in signals and has become prevalent [23–26].
This nonlinear metric is conveniently interpreted though the complexity loss hypothesis [27],
which asserts that physiological responses in organisms under constraints (illness, ageing, and
other inhibitions such as stress) exhibit lower structural complexity (fewer degrees of freedom)
than physiological responses in healthy organisms. Among the available entropy measures, the
data-driven sample entropy (SampEnt) methods are particularly interesting; low levels of Sam-
pEnt indicate a time series of high regularity, while increasing values of SampEnt correspond
to a higher degree of irregularity [24]. An improved version of the SampEnt method, called
Fuzzy entropy (FuzzEnt), has also been recently employed [25]. However, neither completely
Cardiovascular reactivity to audition stress
PLOS ONE | https://doi.org/10.1371/journal.pone.0176023 April 24, 2017 2 / 14
deterministic nor purely stochastic data are truly complex, as structural complexity is reflected
in long-range correlations.
Most studies of complexity loss in HRV have been conducted in the context of understand-
ing cardiovascular diseases. Our recent study on psychosocial stress in public performance
[28] was conducted with a single expert pianist and provided evidence of a reduction in com-
plexity in HRV in response to increased stress levels [28–32]. In particular, the study examined
the complexity of the HRV of the performer for the first 20 minutes of low- and high-stress
performances, and concluded that (i) complexity of HRV was significantly lower during the
high-stress performance and (ii) the SampEnt method exhibited better discrimination between
the stress conditions, compared with standard spectral analyses.
The aim of the present study, therefore, is to establish a systematic approach to the exami-
nation of physiological stress in music performance contexts. The evolution of stress responses
to performance was modeled over a cohort of 16 musicians whose electrocardiograms (ECGs)
were recorded for 5 min prior to and 5 min during two performances: (i) a low-stress condi-
tion with no audience present and (ii) a high-stress condition in front of an audition panel. An
audition was deemed particularly well suited for the high-stress scenario, owing to the scrutiny
under which musicians are placed. Auditions also allow enhanced experimental control and
maintain high ecological validity through the assignment of appropriate pieces to be played
and the possibility of demarcating precise timings before and during performance. We used
modern wearable sensing devices for the collection of ECG data and advanced analysis tech-
niques to capture the signature of stress. Specifically, multiscale sample entropy (MSE) [26]
and multiscale fuzzy entropy (MFE) [33] approaches were introduced in order to examine
entropy values over increasing time scales, thus producing so-called complexity profiles (the
MSE and MFE algorithms are described in S1 File). In this way, not only do we account quan-
titatively for objective aspects of performance stress, but we are also able to identify the critical
timing of stress reactivity and estimate the most appropriate period during which to intervene
using stress management strategies.
Material and methods
Participants
Eleven violinists from the Royal College of Music (RCM) and five flutists from the Conserva-
tory of Southern Switzerland (CSI) participated in the study. The cohort consisted of healthy
male (n = 9) and female participants (n = 7) with a mean age of 23.12±2.42 years (range 19–
27), all of whom were advanced music students with at least 10 years of public performance
experience. Recruitment at the RCM took place from October 2012 to March 2013, with data
collection in March 2013, while recruitment at the CSI took place from March to April 2011,
followed by data collection in May 2011. Participants were assigned to perform individually
the Allemande from J. S. Bach’s Partita No. 2 in D minor for solo violin (BWV 1004) or the
Allemande in A minor for solo flute (BWV 1013).
Physiological and psychological measures
For the violinists, ECG was recorded using the Bioharness, a physiological monitoring device
from ZephyrTM which has been validated in a similar scenario by Johnstone and colleagues
[34, 35]. The raw signals were acquired at a sampling rate of 250 Hz. For the flutists, ECG was
collected using the PowerLab (model 26T), a similar acquisition device from ADInstruments.
Electrodes were attached at the chest and intercostal spaces (between ribs VI and VII). The
raw signals were acquired at a sampling rate of 1000 Hz.
Cardiovascular reactivity to audition stress
PLOS ONE | https://doi.org/10.1371/journal.pone.0176023 April 24, 2017 3 / 14

State anxiety
Prior to each performance, participants completed Form Y1 of the State-Trait Anxiety Inven-
tory (STAI) [5], a 20-item questionnaire which assesses the emotional state of a person based
on subjective feelings of nervousness. Each item is rated on a 4-point scale (1 = almost never to
4 = almost always) with cumulative scores ranging from 20 (low anxiety) to 80 (high anxiety).
For reference, the moderate-level score among young men is 36.47±10.02, and among young
women, it is 38.76±11.95 [5].
Experimental design
Induction session. Before conducting the experiment, every participant attended a
20-minute induction session and confirmed their willingness to deliver multiple polished per-
formances (on separate days) of either the Allemande from J. S. Bach’s Partita No. 2 in D
minor for solo violin (BWV 1004) or the Allemande in A minor for solo flute (BWV 1013).
The performance conditions were explained: (1) the low-stress condition involved the assess-
ment of physiological responses during a private performance without any external attendees
apart from the researchers managing the measurement; (2) the high-stress condition was a
performance in front of an audition panel, composed of three members of staff from the RCM
(for violinists) and the CSI (for flutists). The participants were also required to provide back-
ground information on their musical experience and general health. On the day of each perfor-
mance, all participants confirmed that they had not taken anxiolytic medications or other
substances that may affect their perceptions and physiological responses to the performance
scenarios.
Recording protocol. The low- and high-stress performances were scheduled on sepa-
rate days, and the order was counterbalanced across participants. The musicians were asked
to arrive 30 minutes before the pre-performance period for the attachment of the ECG
recording devices and also for usual performance preparation (e.g. warming-up, tuning,
and rehearsing). Stage calls were given at 20 minutes and 10 minutes before performance by
a member of the research team acting as the “backstage manager”. At 5 minutes before per-
formance, participants were brought to a backstage area and asked to complete Form Y1 of
the STAI. The backstage manager then gave a confirmation signal and allowed the partici-
pant to enter the performance room; this period is referred to as pre-performance (PP). It is
important to note that the pre-performance includes the 2–3 minutes needed to walk into
the performance room and settle for the performance. The participants then performed the
designated pieces, for approximately five minutes in duration (5.06 ± 0.22 minutes for the
violinists and 5.19 ± 0.10 minutes for the flutists); this period is referred to as performance(P). Time labels were manually marked by the research team for every condition analyzed.
In addition to the ECG recordings, all performances were recorded using a video camera.
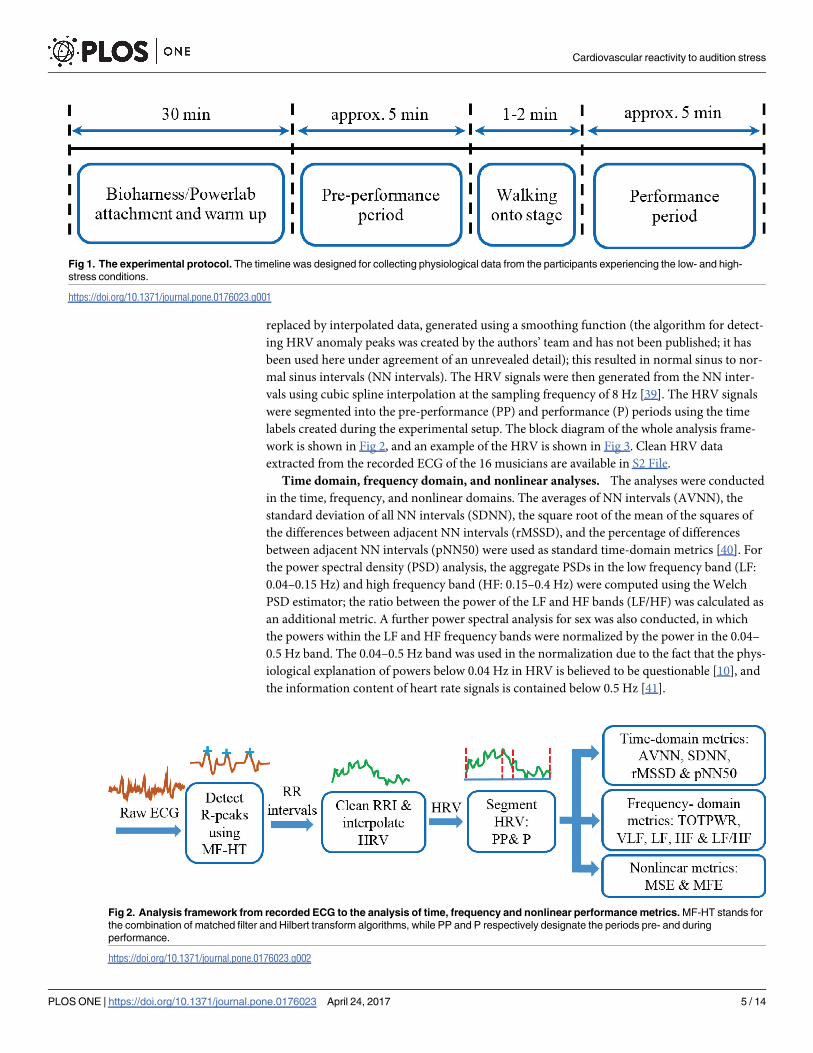
The experimental protocol is summarized in Fig 1.
Data analysis
Pre-processing. The R-peaks in the recorded ECGs were detected using a combination of
matched filtering and Hilbert transform algorithms [36], with the initial QRS complex identi-
fied based on a search for ventricular depolarization (QRS) patterns in the segmented windows
of ECG data. The RR intervals were then created by subtracting the time-intervals of consecu-
tive R-peaks. However, premature ventricular contractions, or ectopic beats, present in the
original RR intervals are known to adversely affect the results from any analyzing metrics [37,
38]. To this end, a custom-made algorithm developed for detecting anomalous peaks in the RR
intervals was used to address those erratic behaviors. The detected anomalous beats were then
Cardiovascular reactivity to audition stress
PLOS ONE | https://doi.org/10.1371/journal.pone.0176023 April 24, 2017 4 / 14
replaced by interpolated data, generated using a smoothing function (the algorithm for detect-
ing HRV anomaly peaks was created by the authors’ team and has not been published; it has
been used here under agreement of an unrevealed detail); this resulted in normal sinus to nor-
mal sinus intervals (NN intervals). The HRV signals were then generated from the NN inter-
vals using cubic spline interpolation at the sampling frequency of 8 Hz [39]. The HRV signals
were segmented into the pre-performance (PP) and performance (P) periods using the time
labels created during the experimental setup. The block diagram of the whole analysis frame-
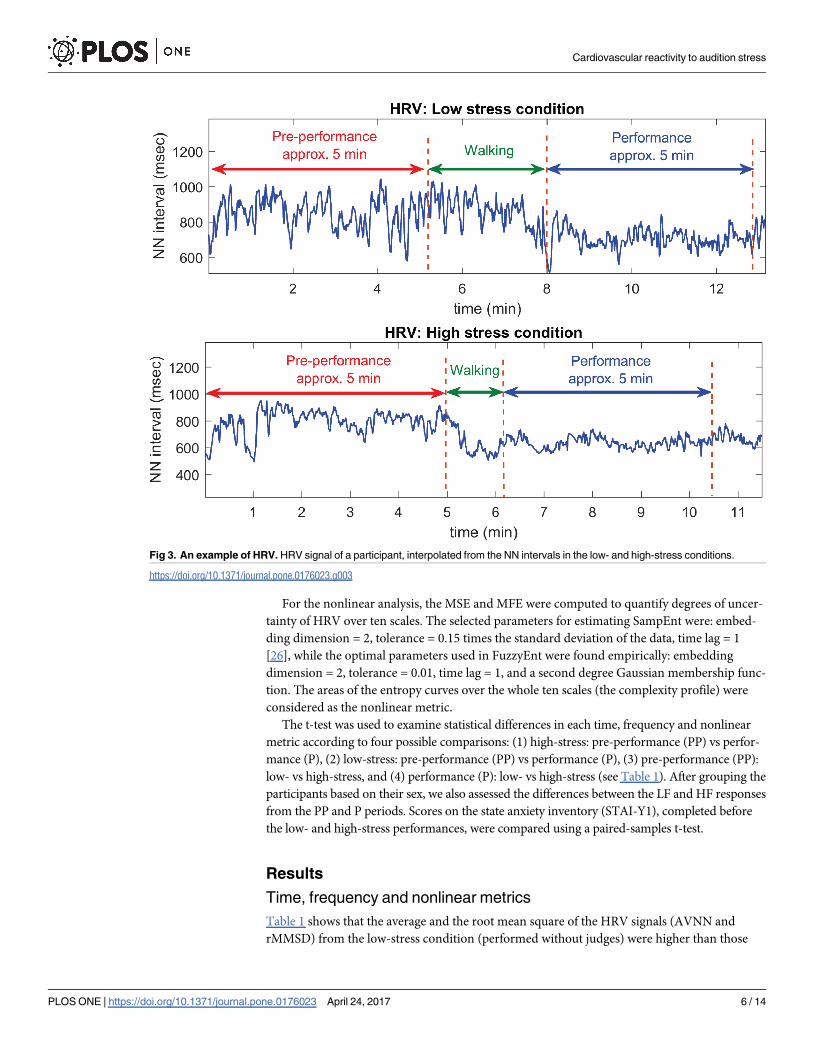
work is shown in Fig 2, and an example of the HRV is shown in Fig 3. Clean HRV data
extracted from the recorded ECG of the 16 musicians are available in S2 File.
Time domain, frequency domain, and nonlinear analyses. The analyses were conducted
in the time, frequency, and nonlinear domains. The averages of NN intervals (AVNN), the
standard deviation of all NN intervals (SDNN), the square root of the mean of the squares of
the differences between adjacent NN intervals (rMSSD), and the percentage of differences
between adjacent NN intervals (pNN50) were used as standard time-domain metrics [40]. For
the power spectral density (PSD) analysis, the aggregate PSDs in the low frequency band (LF:
0.04–0.15 Hz) and high frequency band (HF: 0.15–0.4 Hz) were computed using the Welch
PSD estimator; the ratio between the power of the LF and HF bands (LF/HF) was calculated as
an additional metric. A further power spectral analysis for sex was also conducted, in which
the powers within the LF and HF frequency bands were normalized by the power in the 0.04–
0.5 Hz band. The 0.04–0.5 Hz band was used in the normalization due to the fact that the phys-
iological explanation of powers below 0.04 Hz in HRV is believed to be questionable [10], and
the information content of heart rate signals is contained below 0.5 Hz [41].
Fig 1. The experimental protocol. The timeline was designed for collecting physiological data from the participants experiencing the low- and high-
stress conditions.
https://doi.org/10.1371/journal.pone.0176023.g001
Fig 2. Analysis framework from recorded ECG to the analysis of time, frequency and nonlinear performance metrics. MF-HT stands for
the combination of matched filter and Hilbert transform algorithms, while PP and P respectively designate the periods pre- and during
performance.
https://doi.org/10.1371/journal.pone.0176023.g002
Cardiovascular reactivity to audition stress
PLOS ONE | https://doi.org/10.1371/journal.pone.0176023 April 24, 2017 5 / 14
For the nonlinear analysis, the MSE and MFE were computed to quantify degrees of uncer-
tainty of HRV over ten scales. The selected parameters for estimating SampEnt were: embed-
ding dimension = 2, tolerance = 0.15 times the standard deviation of the data, time lag = 1
[26], while the optimal parameters used in FuzzyEnt were found empirically: embedding
dimension = 2, tolerance = 0.01, time lag = 1, and a second degree Gaussian membership func-
tion. The areas of the entropy curves over the whole ten scales (the complexity profile) were
considered as the nonlinear metric.
The t-test was used to examine statistical differences in each time, frequency and nonlinear
metric according to four possible comparisons: (1) high-stress: pre-performance (PP) vs perfor-
mance (P), (2) low-stress: pre-performance (PP) vs performance (P), (3) pre-performance (PP):
low- vs high-stress, and (4) performance (P): low- vs high-stress (see Table 1). After grouping the
participants based on their sex, we also assessed the differences between the LF and HF responses
from the PP and P periods. Scores on the state anxiety inventory (STAI-Y1), completed before
the low- and high-stress performances, were compared using a paired-samples t-test.
Results
Time, frequency and nonlinear metrics
Table 1 shows that the average and the root mean square of the HRV signals (AVNN and
rMMSD) from the low-stress condition (performed without judges) were higher than those
Fig 3. An example of HRV. HRV signal of a participant, interpolated from the NN intervals in the low- and high-stress conditions.
https://doi.org/10.1371/journal.pone.0176023.g003
Cardiovascular reactivity to audition stress
PLOS ONE | https://doi.org/10.1371/journal.pone.0176023 April 24, 2017 6 / 14

from the high-stress condition (performed in front of three judges); in other words, the cardio-
vascular reactivity of the participants was pronounced in the high-stress condition. However,
none of the time-domain metrics shows significant differences in any of the four comparisons
except the AVNN metric, which shows discrimination for the performance period where the
low- and high-stress conditions were compared. In the frequency domain, the mean power of
all frequency bands (TOTPWR, VLF, LF, and HF) showed decreases from the pre-perfor-
mance to the performance periods, and from the low- to high-stress conditions. The statistical
differences between three comparative scenarios (i.e. two periods of performances and the
high- vs low-stress in the performance period) were significant for the TOTPWR and VLF
metrics. However, the LF metric indicates statistical discrimination only between the two per-
formance periods, while the HF and the LF/HF ratio metrics indicate no statistical discrimina-
tion for any of the comparisons. In the nonlinear domain, both MSE and MFE indicated an
increase in entropy values from the pre-performance to performance periods, and from the
low- to high-stress condition. Statistical comparisons revealed significant differences between
most cases for both MSE and MFE, except for the comparison of the low- and high-stress con-
ditions for the performance period. The complexity profiles of the four comparisons using
MSE and MFE are shown in Fig 4 and Fig 5.
Table 1. Statistical tests of frequency and nonlinear metrics.
Metrics Descriptive statistics Statistical comparisons
Low- stress:
PP
mean±SD
Low- stress:
P
mean±SD
High-stress: PP
mean±SD
High- stress: P
mean±SD
Low- stress:
PP vs P
t15, p
High- stress:
PP vs P
t15, p
PP:
low- vs high- stress
t15, p
P:
low- vs high- stress
t15, p
Time-domain
AVNN 624.0±78.6 637.2±108.2 557.5±91.9 555.3±115.0 -0.52, 0.61 0.07, 0.95 3.00, 0.009 4.01, 0.001
SDNN 51.4±20.6 42.4±17.5 48.7±21.6 38.6±18.8 1.77, 0.10 1.30, 0.21 0.49, 0.63 0.97, 0.35
rMSSD 22.5±10.9 23.8±12.4 16.2±7.7 16.4±6.4 -0.43, 0.67 -0.07, 0.95 2.70, 0.02 2.97, 0.01
pNN50 2.7±3.5 2.8±4.3 1.3±1.5 0.7±0.9 -0.06, 0.96 1.26, 0.23 1.98, 0.07 2.02, 0.06
Frequency-domain
TOTPWR 51.79
±14.37
36.50±12.35 41.42±16.78 26.41±12.16 5.29, 0.0001 4.10, 0.001 2.89, 0.01 3.43, 0.004
VLF 51.61
±14.28
36.41±12.30 41.28±16.70 26.35±12.13 5.27, 0.0001 4.09, 0.001 2.90, 0.011 3.43, 0.004
LF 0.168
±0.126
0.087±0.080 0.146±0.117 0.062±0.070 3.28, 0.005 2.22, 0.04 0.61, 0.55 1.12, 0.28
HF 0.037
±0.037
0.026±0.027 0.020±0.018 0.013±0.010 1.18, 0.26 1.56, 0.14 2.26, 0.04 2.55, 0.02
LF/HF 5.51±2.82 3.78±1.93 7.31±3.69 5.92±9.71 2.24, 0.04 0.5, 0.62 -2.00, 0.06 -1.02, 0.32
Nonlinear complexity
MSE 9.54±1.56 11.50±1.85 8.00±1.41 10.18±1.91 -3.97, 0.001 -3.61, 0.003 4.88, 0.0002 1.97, 0.07
MFE 11.70±1.64 13.61±1.90 10.00±1.64 12.39±1.84 -3.98, 0.001 -3.71, 0.002 4.85, 0.0002 1.79, 0.09
The unit of AVNN, SDNN, rMSSD, and pNN50 is millisecond (msec) and the unit of the TOTPWR, VLF, LF, and HF is s2/Hz. Note. PP = pre-performance
period; P = performance period; AVNN = the averages of NN intervals; SDNN = standard deviation of all NN intervals; rMSSD = square root of the mean of
the squares of the differences between adjacent NN intervals; pNN50 = percentage of differences between adjacent NN intervals; TOTPWR = total NN
interval spectral power; VLF = power in the very low frequency band (0.003–0.04 Hz); LF = power in the low frequency band (0.04–0.15 Hz); HF = power in
the high frequency band (0.15–0.4 Hz); LF/HF = ratio between the power of the LF and HF bands; MSE = multiscale sample entropy; MFE = multiscale
fuzzy entropy.
Bold indicates p < 0.005 (based on Bonferroni correction with a selection of 5% significant level among 11 metrics).
https://doi.org/10.1371/journal.pone.0176023.t001
Cardiovascular reactivity to audition stress
PLOS ONE | https://doi.org/10.1371/journal.pone.0176023 April 24, 2017 7 / 14

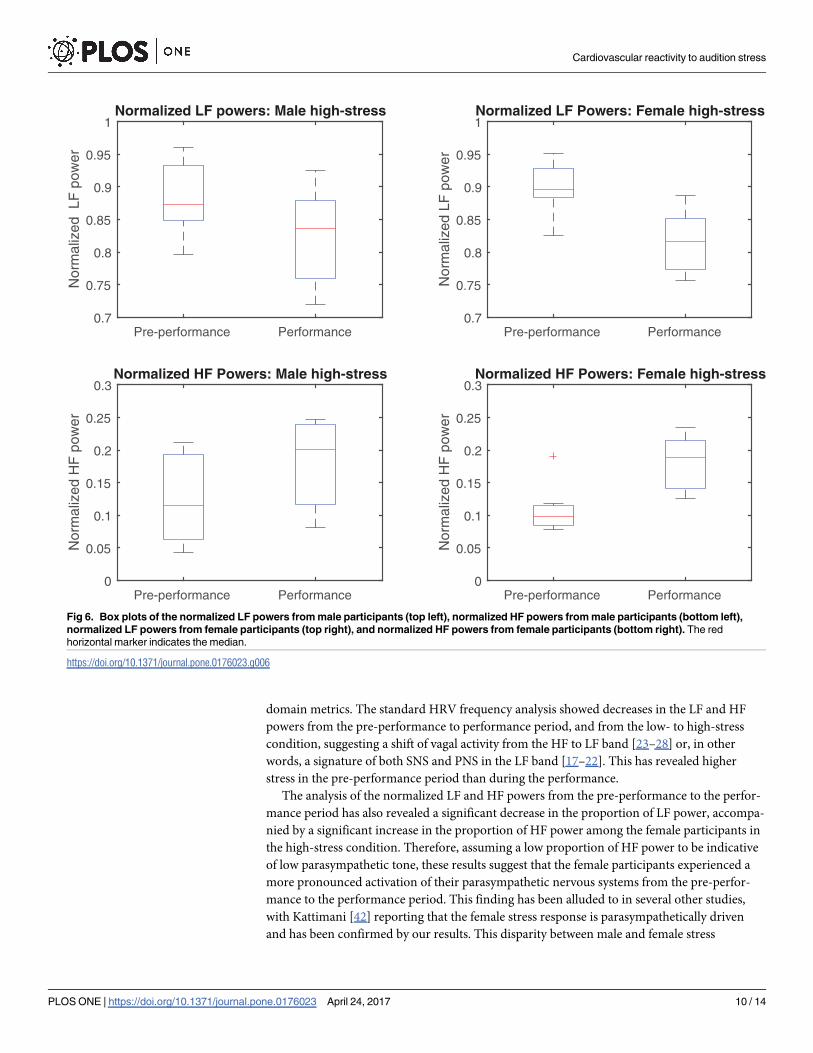
Differences between the normalized LF and HF powers
Analyses of the normalized LF and HF powers revealed differences in the responses of the 9
male and 7 female participants in the high-stress condition. Using a significance level of
p< 0.05, the t-tests revealed statistically significant decreases in the proportion of LF power
from the pre-performance to the performance period in both the male (t8 = 2.7, p = 0.03) and
female participants (t6 = 3.0, p = 0.02). However, the increase in the proportion of HF power
from the pre-performance to the performance period was statistically significant only for the
female participants (t6 = -2.8, p = 0.03); the corresponding p-value from the male participants
was not significant (t8 = -2.2, p = 0.06). Significant differences were not found among the
results from the low-stress condition. These findings are illustrated in Fig 6, which shows box-
plots of the normalized LF and HF powers from the male and female participants during the
high-stress condition, where the red horizontal marker indicates the median.
State anxiety
The reported state anxiety of the musicians was significantly higher in the high-stress condi-
tion (mean = 39.12±7.04) than in the low-stress condition (mean = 34.37±7.88) t15 = -2.594, p-value < 0.05, confirming that the high-stress condition was indeed experienced by the partici-
pants as more anxiety provoking than the low-stress condition.
Fig 4. MSE complexity profiles. LS and HS are abbreviations for the low- and high-stress conditions; PP and P are abbreviations for
the pre-performance and performance periods, respectively. Note that only the low- and high-stress entropies for the performance
period (bottom right) are not statistically different (p-value = 0.07).
https://doi.org/10.1371/journal.pone.0176023.g004
Cardiovascular reactivity to audition stress
PLOS ONE | https://doi.org/10.1371/journal.pone.0176023 April 24, 2017 8 / 14

Discussion and conclusions
We have examined the cardiovascular reactivity of musicians experiencing low- and high-
stress performance conditions within the framework of complexity loss theory, quantified
using the multiscale entropy (MSE) and multiscale fuzzy entropy (MFE) algorithms. Unlike
standard questionnaire-based anxiety assessments, this has been achieved through a suite of
objective stress measures based on physiological responses to stress in two scenarios, low- ver-
sus high- and before- versus during-performance. Advanced signal processing algorithms for
R-peak detection and HRV extraction have been employed to deal with noisy cardiac data in
real-life scenarios, while state-of-the-art data analysis techniques in the time, frequency and
nonlinear complexity domains have been used to quantify the signatures in HRV related to
stress in performance. The analysis has also revealed that currently used spectral analyses of
HRV may be inadequate for detecting stress reactivity, as exemplified by the statistically non-
significant findings reported in Table 1.
The time-domain analysis based on the AVNN and rMMSD metrics has suggested that, in
high-stress conditions, the heart rates of the participants were higher than in low-stress condi-
tions. However, these higher heart rates were accompanied by a smaller difference in heart
rate variability when comparing the pre-performance and performance periods, in all time-
Fig 5. MFE complexity profiles. LS and HS are abbreviations for the low- and high-stress conditions; PP and P are abbreviations for
the pre-performance and performance periods, respectively. Note that only the low- and high-stress entropies for the performance
period (bottom right) are not statistically different (p-value = 0.09).
https://doi.org/10.1371/journal.pone.0176023.g005
Cardiovascular reactivity to audition stress
PLOS ONE | https://doi.org/10.1371/journal.pone.0176023 April 24, 2017 9 / 14
domain metrics. The standard HRV frequency analysis showed decreases in the LF and HF
powers from the pre-performance to performance period, and from the low- to high-stress
condition, suggesting a shift of vagal activity from the HF to LF band [23–28] or, in other
words, a signature of both SNS and PNS in the LF band [17–22]. This has revealed higher
stress in the pre-performance period than during the performance.
The analysis of the normalized LF and HF powers from the pre-performance to the perfor-
mance period has also revealed a significant decrease in the proportion of LF power, accompa-
nied by a significant increase in the proportion of HF power among the female participants in
the high-stress condition. Therefore, assuming a low proportion of HF power to be indicative
of low parasympathetic tone, these results suggest that the female participants experienced a
more pronounced activation of their parasympathetic nervous systems from the pre-perfor-
mance to the performance period. This finding has been alluded to in several other studies,
with Kattimani [42] reporting that the female stress response is parasympathetically driven
and has been confirmed by our results. This disparity between male and female stress
Pre-performance Performance0
0.05
0.1
0.15
0.2
0.25
0.3
Nor
mal
ized
HF
pow
er
Normalized HF Powers: Female high-stress
Pre-performance Performance0.7
0.75
0.8
0.85
0.9
0.95
1
Nor
mal
ized
LF
pow
er
Normalized LF powers: Male high-stress
Pre-performance Performance0
0.05
0.1
0.15
0.2
0.25
0.3
Nor
mal
ized
HF
pow
er
Normalized HF Powers: Male high-stress
Pre-performance Performance0.7
0.75
0.8
0.85
0.9
0.95
1
Nor
mal
ized
LF
pow
er
Normalized LF Powers: Female high-stress
Fig 6. Box plots of the normalized LF powers from male participants (top left), normalized HF powers from male participants (bottom left),
normalized LF powers from female participants (top right), and normalized HF powers from female participants (bottom right). The red
horizontal marker indicates the median.
https://doi.org/10.1371/journal.pone.0176023.g006
Cardiovascular reactivity to audition stress
PLOS ONE | https://doi.org/10.1371/journal.pone.0176023 April 24, 2017 10 / 14
responses has been linked to the effect of oestrogen on the autonomic nervous system. A
review by Saleh and Connell [43] concluded that oestrogen attenuates sympathetic activity;
nevertheless, the exact mechanisms by which oestrogen affects the autonomic nervous system
are not fully known.
Our nonlinear analyses have shown that the MSE and MFE approaches have achieved
robust discrimination of the underlying features related to the dynamics of the heart, regulated
by the autonomic nervous system. Based on the complexity loss theory, both MSE and MFE
have shown that the transitions from pre-performance to performance corresponds to a lower-
ing of stress levels in the musicians. The same complexity pattern was presented in the discrim-
ination from the high-stress condition to the low-stress condition. For rigor, these objectivestress metrics have been benchmarked against the subjective state anxiety scores, where the
low-stress and high-stress conditions corresponded respectively to lower and higher anxiety
reported by the musicians.
The well-documented lack of suitable data acquisition devices (robust to musicians’ move-
ment and motion artefacts, unobtrusive, discreet and comfortable) and a shortage of signal
processing algorithms for real-world wearable applications have so far been prohibitive to
larger-scale studies of stress experiences in human performance. In this study, we have used
both wearable and stationary physiological recording devices and have addressed the imper-
fections and artefacts in such real-world data through advanced data analysis methods. Our
study has focused on combining physiological and psychological measures, analyzed within
the framework of the complexity loss theory, to analyze data from a number of performers and
to extend a previous single-person study, to address a more general issue of musicians’ emo-
tional and physiological adaptability to psychosocial stressors. However, our study still has lim-
itations, such as: (1). the relatively low sample size, which is due to the constraints of recruiting
musicians who were willing and able to provide multiple, polished performances of challeng-
ing repertoire and (2) the lack of resting state (baseline) and post-performance cardiographic
data, as the study was designed to compare only stress reactivity in pre-performance and per-
formance periods.
Subsequent work will consider joint analysis of multivariate physiological data, such as
HRV, respiration rate and skin conductance. The collection, analysis and examination of mul-
tivariate data, in relation to strategies for managing stress and enhancing performance quality,
promises to offer personally and professionally significant advancements in musicians’ train-
ing and skill development, particularly if targeted at the the sensitive period before perfor-
mance, as shown in this study, and employed in a range of performance contexts.
Ethics statement
The research was granted ethical approval by the Conservatoires UK Research Ethics Commit-
tee and was conducted according to ethical guidelines of the British Psychological Society.
Written informed consent was obtained from all participants.
Supporting information
S1 File. Multiscale sample entropy (MSE) and multiscale fuzzy entropy (MFE) algorithms.
(DOCX)
S2 File. R-R intervals and annotations data of 16 participants in two performance condi-
tions: high stress and low stress. The ZIP folder consists of 16 Matlab files (.mat) and one
readme.txt file.
(ZIP)
Cardiovascular reactivity to audition stress
PLOS ONE | https://doi.org/10.1371/journal.pone.0176023 April 24, 2017 11 / 14
Acknowledgments
We wish to thank the musicians and the adjudicators who took part in this study. The research
reported in this article was supported by grants from the UK’s Arts and Humanities Research
Council (grant ref. AH/K002287/1), the Peter Sowerby Foundation, EPSRC grant EP/
K025643/1, EPSRC Pathways to Impact Grant PSA256, and EPSRC Multidisciplinary Univer-
sity Research Initiative EP/P008461.
Author Contributions
Conceptualization: AW DPM DW LA TC.
Data curation: LA CC TC TA.
Formal analysis: TC LA TA CC DW DPM AW.
Funding acquisition: AW DPM.
Investigation: LA CC DW AW.
Methodology: AW DPM DW LA TC.
Project administration: AW.
Resources: AW DPM.
Software: DPM TC TA.
Supervision: AW DPM.
Validation: AW DPM.
Visualization: TC TA DPM.
Writing – original draft: TC LA TA CC DW DPM AW.
Writing – review & editing: TC LA TA CC DW DPM AW.
References1. Selye H. A Syndrome Produced by Diverse Nocuous Agents. Nature. 1936; 138:32.
2. Billman GE. Heart Rate Variability–A Historical Perspective. Frontiers in Physiology. 2011; 2:1–13.
3. Williamon A. Musical Excellence: Strategies and Techniques to Enhance Performance: Oxford Univer-
sity Press; 2004.
4. Craske MG, Craig KD. Musical performance anxiety: The three-systems model and self-efficacy theory.
Behaviour Research and Therapy. 1984; 22(3):267–80. PMID: 6466277
5. Spielberger CD, Gorsuch RL, Lushene R, Vagg PR, Jacobs GA. Manual for the State-Trait Anxiety
Inventory: Palo Alto CA: Consulting Psychologists Press; 1983.
6. Abel JL, Larkin KT. Anticipation of performance among musicians: Physiological arousal, confidence,
and state-anxiety Inventory. Psychology of Music. 1990; 18:171–82.
7. Brotons M. Effects of performing conditions on music performance anxiety and performance quality.
Journal of Music Therapy. 1994; 31:63–81.
8. Yoshie M, Kudo K, Murakoshi T, Ohtsuki T. Music performance anxiety in skilled pianists: effects of
social-evaluative performance situation on subjective, autonomic, and electromyographic reactions.
Experimental Brain Research. 2009; 199(2):117–26. https://doi.org/10.1007/s00221-009-1979-y PMID:
19701628
9. Pagani M, Lombardi F, Guzzetti S, Rimoldi O, Furlan R, Pizzinelli P, et al. Power spectral analysis of
heart rate and arterial pressure variabilities as a marker of sympatho-vagal interaction in man and con-
scious dog. Circulation Research. 1986; 59(2):178–93. PMID: 2874900
Cardiovascular reactivity to audition stress
PLOS ONE | https://doi.org/10.1371/journal.pone.0176023 April 24, 2017 12 / 14
10. Malik M, Bigger JT, Camm JA, Kleiger RE, Malliani A, Moss JA, et al. Heart rate variability: Standards of
measurement, physiological interpretation, and clinical use. Task force of the European Society of Car-
diology \& The North American Society of Pacing and Electrophysiology. Circulation. 1996; 93(5):1043–
65. PMID: 8598068
11. Billman GE. The LF/HF ratio does not accurately measure cardiac sympatho-vagal balance. Frontiers
in Physiology. 2013; 4:1–5.
12. Ahmed AK, Harness JB, Mearns AJ. Respiratory control of heart rate. European Journal of Applied
Physiology and Occupational Physiology. 1982; 50(1):95–104.
13. Brown TE, Beightol LA, Koh J, Eckberg DL. Important influence of respiration on human R-R interval
power spectra is largely ignored. J Appl Physiol. 1993; 75(5):2310–7. PMID: 8307890
14. Tiller WA, McCraty R, Atkinson M. Cardiac coherence: a new, noninvasive measure of autonomic ner-
vous system order. Altern Ther Health Med. 1996; 2(1):52–65. PMID: 8795873
15. Lehrer PM, Vaschillo E, Vaschillo B, Lu S, Eckberg DL, Edelberg R, et al. Heart rate variability biofeed-
back increases baroreflex gain and peak expiratory flow. Psychosomatic Medicine. 2003; 65(5):796–
805. PMID: 14508023
16. Milicevic G. Low to high frequency ratio of heart rate variability spectra fails to describe sympatho-vagal
balance in cardiac patients. Collegium antropologicum. 2005; 29(1):295–300. PMID: 16117339
17. Berntson GG, Cacioppo JT. Heart Rate Variability: Stress and Psychiatric Conditions. 2007:57–64.
18. Berntson GG, Cacioppo JT, Binkley PF, Uchino BN, Quigley KS, Fieldstone A. Autonomic cardiac con-
trol. III. Psychological stress and cardiac response in autonomic space as revealed by pharmacological
blockades. Psychophysiology. 1994; 31(6):599–608. PMID: 7846220
19. Friedman BH, Thayer JF, Tyrrell RA. Spectral characteristics of heart period variability during cold face
stress and shock avoidance in normal subjects. Clinical autonomic research: official journal of the Clini-
cal Autonomic Research Society. 1996; 6(3):147–52.
20. Delaney JP, Brodie DA. Effects of short-term psychological stress on the time and frequency domains
of heart-rate variability. Perceptual and motor skills. 2000; 91(2):515–24. https://doi.org/10.2466/pms.
2000.91.2.515 PMID: 11065312
21. Lucini D, Norbiato G, Clerici M, Pagani M. Hemodynamic and Autonomic Adjustments to Real Life
Stress Conditions in Humans. Hypertension. 2002; 39(1):184–8. PMID: 11799100
22. Sloan RP, Shapiro PA, Bagiella E, Boni SM, Paik M, Bigger JT Jr., et al. Effect of mental stress through-
out the day on cardiac autonomic control. Biological psychology. 1994; 37(2):89–99. PMID: 8003592
23. Pincus SM, Goldberger AL. Physiological time-series analysis: what does regularity quantify? American
Journal of Physiology—Heart and Circulatory Physiology. 1994; 266(4):H1643–H56.
24. Richman JS, Moorman JR. Physiological time-series analysis using approximate entropy and sample
entropy. American Journal of Physiology—Heart and Circulatory Physiology. 2000; 278(6):H2039–H49.
PMID: 10843903
25. Chen W, Wang Z, Xie H, Yu W. Characterization of surface EMG signal based on fuzzy entropy. IEEE
transactions on neural systems and rehabilitation engineering: a publication of the IEEE Engineering in
Medicine and Biology Society. 2007; 15(2):266–72.
26. Costa M, Goldberger AL, Peng CK. Multiscale Entropy Analysis of Complex Physiologic Time Series.
Phys Rev Lett. 2002; 89(6):068102(1–4).
27. Lipsitz LA, Goldberger AL. Loss of ’complexity’ and aging. Potential applications of fractals and chaos
theory to senescence. Jama. 1992; 267(13):1806–9. PMID: 1482430
28. Williamon A, Aufegger L, Wasley D, Looney D, Mandic DP. Complexity of physiological responses
decreases in high-stress musical performance. Journal of The Royal Society Interface. 2013; 10(89):1–
6.
29. Costa M, Goldberger AL, Peng CK. Multiscale entropy analysis of biological signals. Physical review E,
Statistical, nonlinear, and soft matter physics. 2005; 71(2 Pt 1):021906(1–18).
30. Visnovcova Z, Mestanik M, Javorka M, Mokra D, Gala M, Jurko A, et al. Complexity and time asymme-
try of heart rate variability are altered in acute mental stress. Physiological measurement. 2014; 35
(7):1319–34. https://doi.org/10.1088/0967-3334/35/7/1319 PMID: 24854052
31. Tuzcu V, Nas S, Borklu T, Ugur A. Decrease in the heart rate complexity prior to the onset of atrial fibril-
lation. Europace: European pacing, arrhythmias, and cardiac electrophysiology: journal of the working
groups on cardiac pacing, arrhythmias, and cardiac cellular electrophysiology of the European Society
of Cardiology. 2006; 8(6):398–402.
32. Chanwimalueang T, Aufegger La. Modelling stress in public speaking: Evolution of stress levels during
conference presentations. ICASSP, IEEE International Conference on Acoustics, Speech and Signal
Processing—Proceedings. 2016;2016-May:814–8.
Cardiovascular reactivity to audition stress
PLOS ONE | https://doi.org/10.1371/journal.pone.0176023 April 24, 2017 13 / 14
33. Xiong GL, Zhang L, Liu HS, Zou HJ, Guo WZ. A comparative study on ApEn, SampEn and their fuzzy
counterparts in a multiscale framework for feature extraction. Journal of Zhejiang University SCIENCE
A. 2010; 11(4):270–9.
34. Johnstone JA, Ford PA, Hughes G, Watson T, Garrett AT. Bioharness(™) Multivariable Monitoring
Device: Part. II: Reliability. Journal of sports science \& medicine. 2012; 11(3):409–17.
35. Johnstone JA, Ford PA, Hughes G, Watson T, Garrett AT. Bioharness(™) Multivariable Monitoring
Device: Part. I: Validity. Journal of sports science \& medicine. 2012; 11:400–8.
36. Chanwimalueang T. Enabling R-peak detection in wearable ECG: Combining matched filtering and Hil-
bert transform. International Conference on Digital Signal Processing, DSP. 2015;2015-Septe:134–8.
37. Peltola MA. Role of editing of R–R intervals in the analysis of heart rate variability. Frontiers in Physiol-
ogy. 2012; 3:1–10.
38. Domitrovich PP, Stein PK. A new method to detect erratic sinus rhythm in RR-interval files generated
from Holter recordings. Computers in Cardiology. 2002:665–8.
39. Singh D, Vinod K, Saxena SC. Sampling frequency of the RR interval time series for spectral analysis of
heart rate variability. Journal of medical engineering \& technology. 2004; 28(6):263–72.
40. Mietus JE, Peng CK, Henry I, Goldsmith RL, Goldberger AL. The pNNx files: re-examining a widely
used heart rate variability measure. Cardiovascular Medicine. 2002; 88:378–80.
41. Kuusela T. Methodological Aspects of Heart Rate Variability Analysis. Heart Rate Variability (HRV) Sig-
nal Analysis: CRC Press; 2012. p. 9–42.
42. Kattimani YR. Gender Comparison of Heart Rate Variability Response to Exercise in Male and Female
Medical Students. International Journal of Scientifc Study. 2014; 3 (1):48–53.
43. Saleh TM, Connell BJ. Role of oestrogen in the central regulation of autonomic function. Clin Exp Phar-
macol Physiol. 2007; 34(9):827–32. https://doi.org/10.1111/j.1440-1681.2007.04663.x PMID:
17645624
Cardiovascular reactivity to audition stress
PLOS ONE | https://doi.org/10.1371/journal.pone.0176023 April 24, 2017 14 / 14