staggered work hours for traffic management: a case...
TRANSCRIPT
46 TRA NSPORTA TION RESEA RCH RECORD 1280
Staggered Work Hours for Traffic Management: A Case Study
'
GENEVIEVE GIULIANO AND THOMAS F. GOLOB
The Staggered Work Hours Demonstration Project was conducted in downtown Honolulu during a 4-week period in 1988. During the project, official office hours for state, city, and county employees were shifted 45 min later in an attempt to alleviate the early peak-period congestion into downtown Honolulu. Approximately 3,500 of the 7,100 employees working in the Civic Center area participated in the project. This evalualiu11 [ucuses on the project's effects on traffic flO\ , employ e comrnuli.ng experience , employee attitudes, work performance, and productivity. Three types of data were collected: (a) floating-car measurements of travel times and speeds on major corridors into the downtown area on two dates before and two dates during the project; (b) an employee panel survey of reported commuting experiences on the same four dates, as well as attitudes concerning project effects on activity schedules; and (c) a postproject survey of managers concerning work performance and morale . Results indicate a significant overall effect on travel cond1t10.n . Average estimated time saving were in the rang of 3 to 4 min r Jes. than 10 percent of the average commute. However, the effects were not uniform, and nonparticipants benefited more than participants . Many participants also experienced inconveniences associmed with household activities. Project results uggest rhm · taggered w rk hours can improve travel conditions, b111 a permanent project should be as voluntary as possible to minimize problems of equity and inconvenience.
Traffic congestion has become a major public issue in U.S. metropolitan areas. Several recent opinion surveys have shown that, in a ranking of community problems, urban residents list traffic first or second (after crime). Faced with inadequate financial resources for major transportation system improvements and often with environmental constraints that preclude major improvements , public decision makers-pressured to take some action-are increasingly turning toward strategies that attempt to control or reduce congestion by managing travel demand. Travel demand management is aimed at reducing peak-period vehicle trips through strategies such as increased ridesharing and transit use, flexible work schedules, and telecommuting.
Transportation demand management (TDM) is a derivative of transpurlaliun system management (TSM). TSM was popularized in the 1970s, when transportation planners focused on increasing the efficiency or productivity of the transportation system in response to the energy crisis and air quality concerns (1-3). TSM includes both supply- and demandoriented strategies, such as ramp metering, signal coordination, and provision of high-occupancy-vehicle lanes. Demand
G. Giuliano, School of Urban and Regional Planning, University of Southern California, Los Angeles, Calif. 90089. T . F. Golob , Institute of Transport<ttion Studies, University of California , Irvine, Calif. 92717.
management strategies have become particularly attractive in heavily congested urban areas where the more conventional supply side or traffic engineering options have already been extensively implemented and reduction of peak vehicle trips is perceived to be the only short-term solution available.
Alternative work schedules arc among the most widely implemented TDM strategies. They focus on shifting employee work schedules to eliminate or spread out peak-period work trips. Three types of alternative work schedules can be distinguished:
l. Staggered work hours-groups of employees work on fixed schedules with sequential or staggered start and end times,
2. Compressed work week-employees work full-time over a fewer number of work days, and
3. Flexible work hours-employees have some choice in establishing their work schedules.
Several studies of alternative work schedules have been conducted. Some of the studies ( 4-7) have documented the extent to which specific strategies have been implemented; others (8-10) have analyzed employee preferences among strategies. Simulation studies of traffic impacts associated with flexible hours have also been conducted, both separately (11,12) and relative to other TSM alternatives (13-15). Research on the impacts of alternative work schedules at home and in the workplace is more limited. Most existing research focuses on employee productivity issues, such as the feasibility of flexible or staggered shifts within different industries (5,16).
Actual impacts of alternative work hours programs remain unclear. Although impacts on traffic flow have been estimated, little empirical documentation is available (17,18). Employee attitudes toward various work schedule alternatives and the effect these alternatives may have on household schedules and activities continue to be largely unknown (19, 7). Finally, more recent research (10,20) suggests that alternative work schedules may not be complementary to other TDM strategies, such as carpooling and transit use.
A 4-week demonstration project conducted in Honolulu, Hawaii, provided the opportunity to conduct an in-depth analysis of staggered work hours. The project's effects on traffic flow, employee commuting experiences, employee attitudes, and work productivity are summarized in the following paragraphs. The demonstration project and methods and data used in the analysis are discussed. Project results are followed hy conclusions and policy implications. Details of the analyses are reported by Giuliano and Golob (21).
Giuliano and Golob
HONOLULU STAGGERED WORK HOURS DEMONSTRATION PROJECT
Honolulu is an extremely congested city. A recent study (22) of urban freeway congestion ranked Honolulu 14th among U.S. urban areas in terms of annual vehicle-hours of delay, whereas in terms of population size it is ranked 48th. The state of Hawaii conducted the Staggered Work Hours Demonstration Project in downtown Honolulu to determine whether a large-scale shift in work hours among downtown workers could reduce traffic congestion.
The project took place during a 4-week period from February 22 through March 18, 1988. During the project, official office hours for state, city, and county employees were shifted from 7:45 a.m.-4:30 p.m. to 8:30 a.m.-5:15 p.m. The shift to a later schedule was selected because of the early peaking characteristic of downtown-bound traffic. Participation in the project was mandatory for all public employees . Nonparticipation required approval through a formal exemption process. Participation by private-sector downtown employers was encouraged but not required . Eighteen major corporations participated; certain employees of these companies were able to choose their project work schedule. Thus, for privatesector employees, participation meant changing work hours on a voluntary basis (i.e., flexible work hours); the change could be to either an earlier or later schedule, not necessarily to the designated hours of 8:30 a.m.-5:15 p.m.
The project's participation goal was 11,000 employees, or 18 percent of the total estimated downtown work force of 60,000. This goal was based on downtown traffic volume patterns, the proportion of work trips during peak hours, and the peak-hour mode split. An 18 percent participation rate was expected to result in significantly improved peak-period traffic conditions.
METHODS AND DATA
This evaluation of the project focuses on the project's impact on (a) travel and traffic conditions and (b) employees and the workplace. The purpose of the project was to alleviate traffic congestion; thus, the extent to which this objective was realized is of primary interest. However, overall project effectiveness depended on the response and attitudes of employees and managers to the shift in work hours.
Traffic Impact Measurement
Traffic impact measurement requires controlling for seasonal variability as well as day-to-day differences. Seasonal variability was controlled by selecting the month immediately preceding the project as the basis of comparison, minimizing potential differences caused by holidays and tourism patterns. Day-to-day differences were addressed by conducting floating-car observations of travel times and speeds along the three major directional corridors leading to downtown. Trips were made along an identical route, with one car commencing every 15 min, and recording actual times at a series of checkpoints along the route. The floating-car data were used to measure changes in peak travel conditions along the route . Information
47
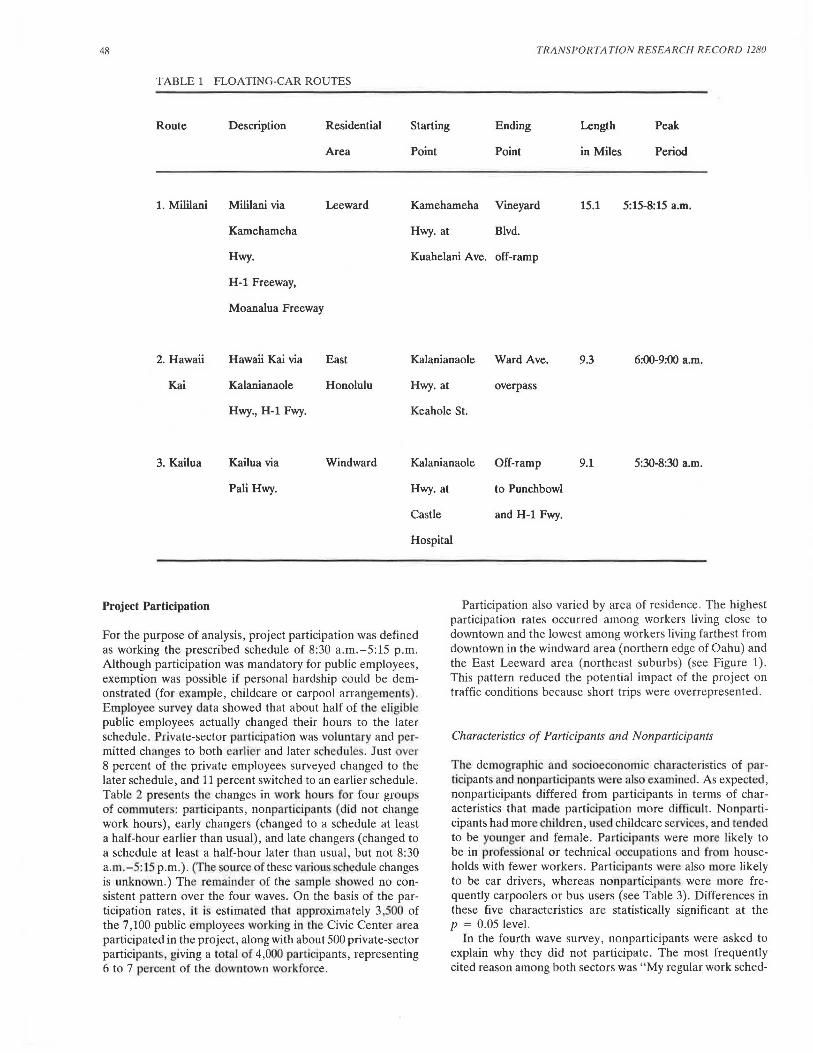
on the three routes is presented in Table 1. Floating-car observations were conducted on all routes on February 3 and 17 (before the project) and March 2 and 16 (during the project). Additional observations were conducted after the project on March 30 for Routes 1 and 3.
Impacts on Employees
A variety of issues concerning employee behavior must be examined to properly evaluate project impacts, including extent of participation in the project, worktrip travel characteristics, impacts on household activities, and attitudes toward the project.
A panel survey of employees was conducted to obtain information on these issues. This type of survey gathers information from respondents at more than one point in time. It is the most effective method for obtaining longitudinal data (23). In this case, accurate reporting of travel experiences was critical because it was likely that (a) travel time differences because of the project might be small and therefore difficult both to perceive retrospectively and to statistically measure and (b) employee attitudes toward the project could affect retrospective reporting. It was also important to be able to observe any changes in attitudes over the course of the project.
The panel had four waves, each coinciding with the tloatmgcar observation days. All four waves contained identical questions concerning commuting experiences on the survey day (e.g., arrival and departure times, mode, and stops before and after work). The panel design thus permitted multiple "before" and "during" comparisons for each individual's commute trip. The first wave also elicited background information on demographic, socioeconomic, and residential location characteristics. In addition, the last wave included questions about attitudes and perceptions of the project.
Respondents were selected on a uniform 20 percent, or 1 in 5, basis both from the public sector and from private-sector companies that had elected to participate in the project. Smveys were distributed and collected at the worksite. The survey response rate was high; all four waves were completed in 69 percent of the 2,297 surveys distributed.
It was expected that implementation of staggered work hours would affect working conditions and productivity, as well as employee attitudes, tardiness and absenteeism, and overall work performance. Therefore, information on workplace effects was gathered through a random survey of public and private management personnel. The mail-back survey was distributed immediately after the close of the project. A total of 371 surveys was distributed, from which 281 valid responses were received.
PROJECT RESULTS
Project impacts are discussed in six general categories: (a) project participation , (b) travel conditions and commuting experiences, (c) perceptions of traffic conditions, (d) perceived project impacts, (e) workplace impacts, and (f) attitudes toward the project.
48 TRANSPORTA TION RESEARCH RECORD 1280
TABLE 1 FLOATING-CAR ROUTES
Route Description Residential Starting Ending Length Peak
Area Point Point in Miles Period
1. Mililani Mililani via Leeward Kamehameha Vineyard 15.1 5:15-8:15 a.m.
Kamehameha Hwy. at Blvd.
Hwy. Kuahelani Ave. off-ramp
H-1 Freeway,
Moanalua Freeway
2. Hawaii Hawaii Kai via East Kalanianaole Ward Ave. 9.3 6:00-9:00 a.m.
Kai Kalanianaole Honolulu Hwy. at overpass
Hwy., H-1 Fwy. Keahole St.
3. Kailua Kailua via Windward Kalanianaole Off-ramp 9.1 5:30-8:30 a.m.
Pali Hwy. Hwy. at to Punchbowl
Castle and H-1 Fwy.
Hospital
Project Participation
For the purpose of analysis, project participation was defined as working the prescribed schedule of 8:30 a.m.-5:15 p.m. Although participation was mandatory for public employees , exemption was possible if personal hardship could be demonstrated (for example, childcare or carpool arrangement ) . Employee survey data showed that about half of the eligible public employees actually changed their hours to the later schedule . Private-sector participation was vol.untary and permitted changes to both earlier and later schedul . Just over 8 percent of the private employees surveyed changed to the later schedule , and 11 percent switched to an earlier schedule. Table 2 presents the changes in work hours for four gr ups of c mmuters: participants, nonparticipants (did not change work hours), early changers (changed to a schedule at least a half-hour earlier than usual), and late changers (changed to a schedule at least a half-hour later than usual, but not 8:30 a.m.-5:15 p .m.). (The source of these various chedule changes is unknown.) The remainder of the sample ·he wed no consistent pattern over the four waves. On the basis of the participation rates, it is estimated tha.t approximately 3 500 of the 7 ,100 public employees worki11g in the Civic Center area participated in the project, along with about 500 private-sector participants giving a total of 4,000 part icipants , representing 6 to 7 percent of the downtown workforce.
Participation also varied by area of residence . The highest participation rates occurred among workers living close to downtown and the lowest among workers living farthest from downtown in the windward area (northern edge of Oahu) and the East Leeward area (northeast suburbs) (see Figure 1) . This pattern reduced the potential impact of the project on traffic conditions because short trips were overrepresented.
Characteristics of Participants and Nonparticipants
The demographic and socioeconomic characteristics of participant and nonpar ticipant were als examined. As expected , nonparticipants differed from participants in terms of characteristics that made participation more difficult. Nonparticipants had more children, u ed childcare services, and tended to be younger and female. Participant were m re likely to be in profes ional or technical occupations and from households with fewer workers. Participants were also more likely to be car drivers, whereas nonparticipant were more frequently carpoolers or bus users (see Table 3). Differences in these five characteristics are statistically significant at the p = 0.05 level.
In the fourth wave survey, nonparticipants were asked to explain why they did not participate. The most frequently cited reason among both sectors was " My regular work sched-

Giuliano and Golob
TABLE 2 WORK HOUR CHANGES BY SECTOR
GROUP PUBLIC
Number %
1-Partlclpants 610 49.6
2-Non Participants 489 39.7
3-Early Changers 10 .8
4-Late Changers 72 5.9
Varying Hours 49 4.0
CIVIC CENTER / C.B.D.
WEST LEEWARD EAST LEEWARD WEST DOWNTOWN
EAST DOWNTOWN EAST HONOLULU WINDWARD
FIGURE I Residential areas on the basis of zip code clusters.
ule is more convenient." However, other reasons cited by public-sector employees with comparable frequency were clearly related to the mandatory nature of the project. These include ridesharing, childcare, and children's school arrangements, as well as other obligations before or after work (see Table 4). These results suggest that project participation was more difficult (and frequently impossible) for workers with time pressure or schedule constraints.
Participation Impacts
Patterns of project participation had clear (and somewhat unanticipated) impacts on the worksite. First, the project
49
PRIVATE
Number %
74 8.4
552 62.7
97 11.0
23 2.6
134 15.2
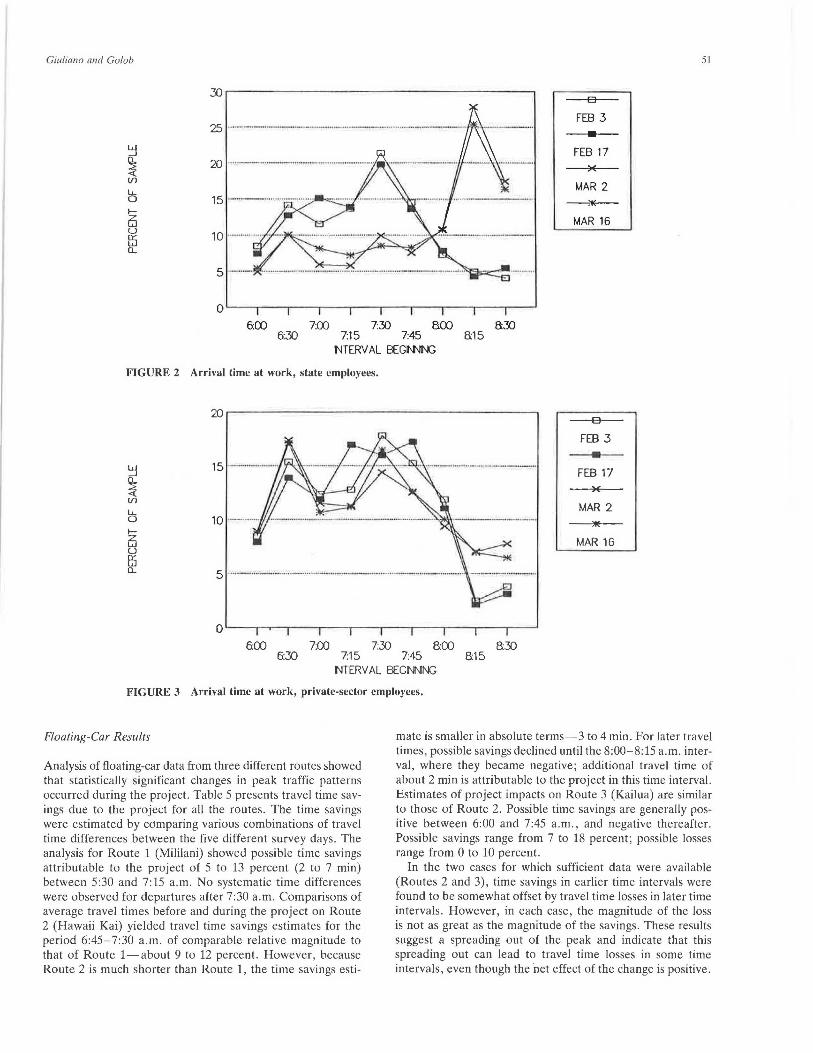
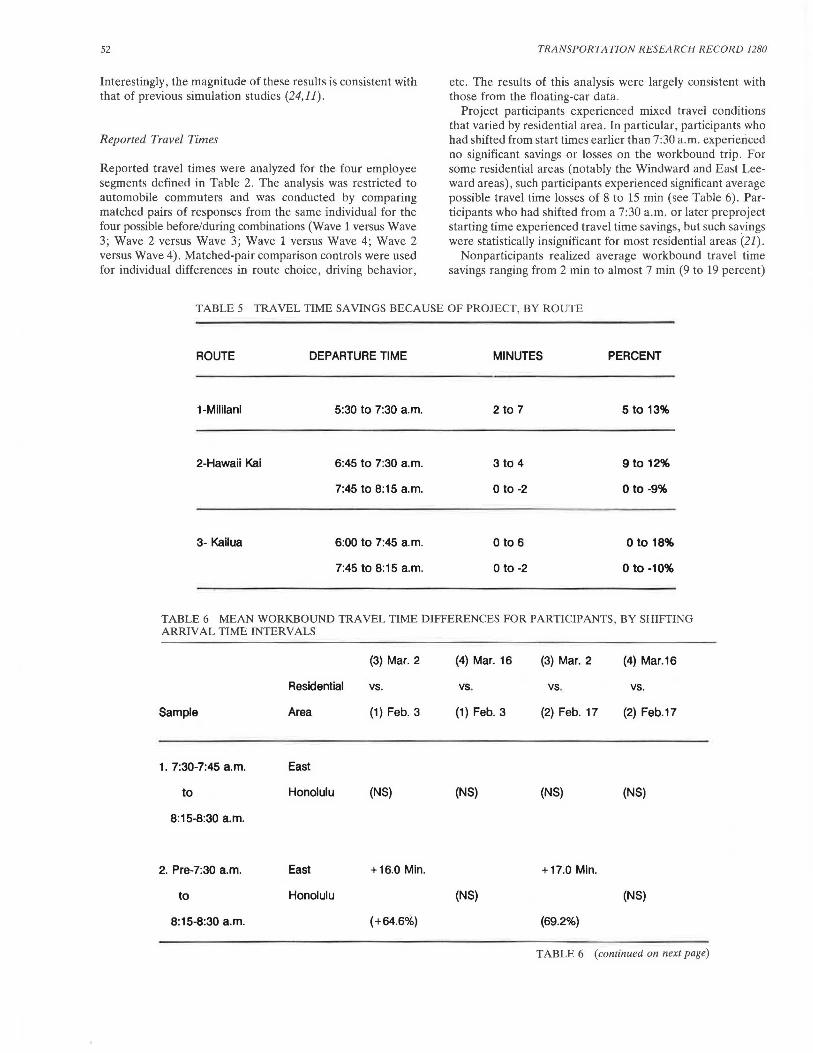
resulted in a significant concentration of arrivals and departures at public worksites . For example, Figure 2 shows arrival times of state employees by 15-min intervals for each survey wave (February 3 and 17 and March 2 and 16). Although the official nonproject start-work time is 7:30 a.m., roughly 30 percent of the arrivals occurred earlier than 7: 15 a.m. before the demonstration project began. Arrivals during the project were far more concentrated around the 8:30 a.m. start time. These results suggest that many employees regularly arrived at work early, probably to avoid traffic congestion or because of schedule constraints of other household members. This concentration of arrivals (and departures) resulted in localized congestion problems at some sites. The project had much less impact on arrival times at private-sector worksites, as shown in Figure 3; an increase in later arrival times resulted in a more even distribution of arrivals during the project.
Second, participation in the project required substantial changes in work schedules for many public-sector employees. Forty percent of public-sector participants shifted from work schedules starting at 7:30 a.m. or earlier, and about 10 percent of participating city and county employees switched from startwork times of 7:00 a.m. Many city and county offices had ongoing flexible hours programs, and these programs were suspended during the demonstration project. Private-sector participants working the 8:30 a.m.-5:15 p.m. schedule during the project switched from previous 7:45 or 8:00 a.m. start times. Thus, the magnitude of the change required for participation was significantly greater for public-sector employees.
Third, some public-sector participants had the added problem of finding a parking space. Most public employee parking is provided on a first-come, first-served basis . At sites where parking is less convenient or available, participants found the most convenient parking already taken. Other participants were unable to use their regular express bus service because express service stops operation on most routes after 5:00 p.m.
Finally, survey results indicated that the project had no significant impact on mode split.
Travel Conditions and Commuting Experience
Project impacts on transportation system performance were measured in two ways: (a) analysis of floating-car data and (b) analysis of reported travel times of downtown commuters.
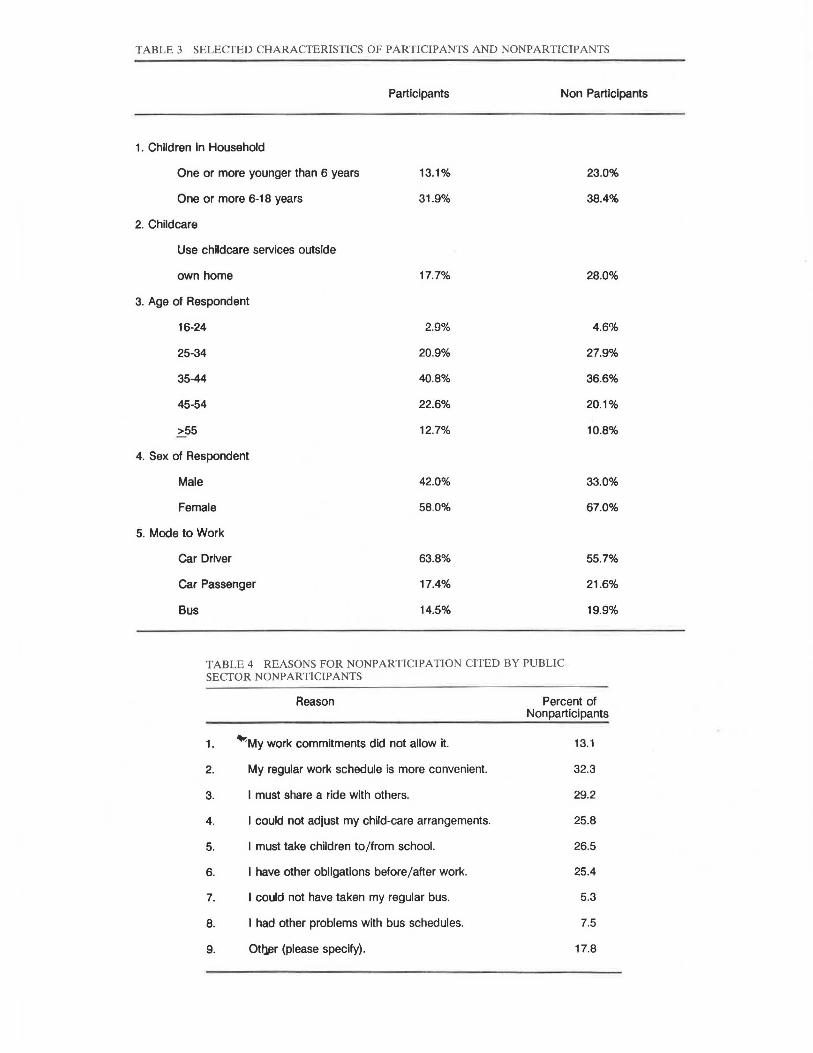
TABLE 3 SELECTED CHARACTERISTICS OF PARTICIPANTS AND NONPARTICIPANTS
Participants Non Participants
1. Children In Household
One or more younger than 6 years 13.1% 23.0%
One or more 6-18 years 31.9% 38.4%
2. Childcare
Use childcare services outside
own home 17.7% 28.0%
3. Age of Respondent
16-24 2.9% 4.6%
25-34 20.9% 27.9%
35-44 40.8% 36.6%
45-54 22.6% 20.1%
>55 12.7% 10.8%
4. Sex of Respondent
Male 42.0% 33.0%
Female 58.0% 67.0%
5. Mode to Work
Car Driver 63.8% 55.7%
Car Passenger 17.4% 21.6%
Bus 14.5% 19.9%
TABLE 4 REASONS FOR NONPARTICIPATION CITED BY PUBLICSECTOR NONPARTICIPANTS
Reason Percent of Nonparticipants
1. '°'My work commitments did not allow it. 13.1
2. My regular work schedule Is more convenient. 32.3
3. I must share a ride with others. 29.2
4. I could not adjust my child-care arrangements. 25.8
5. I must take children to/from school. 26.5
6. I have other obligations before/after work. 25.4
7. I could not have taken my regular bus. 5.3
8. I had other problems with bus schedules. 7.5
9. Ot~r (please specify). 17.8
Giuliano and Golob 51
D
FEB 3 25 -·······-··-... · .. --.. ··---... - ............ - ..... ,_ .............................. _,_,, .. •
FEB 17
MAR 2
1-tj MAR 16 u el Cl..
6:00 7:00 7:30 8:00 8:30 6:30 7:15 7:45 8:15
NTERV AL BEGl'-Nl\C
FIGURE 2 Arrival time at work, state employees.
D
FEB 3
• ~
~ FEB 17
U'l MAR 2 u...
0 ~
I-
ti MAR 16 u el Cl..
6:00 7:00 7:30 8:00 8:30 6:30 7:15 7:45 8:15
NT ERV AL BEGIJ\NNG
FIGURE 3 Arrival time at work, private-sector employees.
Floating-Car Results
Analysis of floating-car data from three different routes showed that statistically significant changes in peak traffic patterns occurred during the project. Table 5 presents travel time savings due to the project for all the routes. The time savings were estimated by comparing various combinations of travel time differences between the five different survey days. The analysis for Route 1 (Mililani) showed possible time savings attributable to the project of 5 to 13 percent (2 to 7 min) between 5:30 and 7:15 a.m. No systematic time differences were observed for departures after 7:30 a.m. Comparisons of average travel times before and during the project on Route 2 (Hawaii Kai) yielded travel time savings estimates for the period 6:45-7:30 a.m. of comparable relative magnitude to that of Route 1-about 9 to 12 percent. However , because Route 2 is much shorter than Route 1, the time savings esti-
mate is smaller in absolute terms-3 to 4 min. For later travel times, possible savings declined until the 8:00-8 :15 a .m. interval, where they became negative; additional travel time of about 2 min is attributable to the project in this time interval. Estimates of project impacts on Route 3 (Kailua) are similar to those of Route 2. Possible time savings are generally positive between 6:00 and 7:45 a.m., and negative thereafter. Possible savings range from 7 to 18 percent ; possible losses range from 0 to 10 percent.
In the two cases for which sufficient data were available (Routes 2 and 3), time savings in earlier time intervals were found to be somewhat offset by travel time losses in later time intervals. However, in each case, the magnitude of the loss is not as great as the magnitude of the savings. These results suggest a spreading out of the peak and indicate that this spreading out can lead to travel time losses in some time intervals, even though the net effect of the change is positive.
52
Interestingly, the magnitude of these results is consistent with that of previous simulation studies (24,11) .
Reported Travel Times
Reported travel times were analyzed for the four employee segments defined in Table 2. The analysis was restricted to automobile commuters and was conducted by comparing matched pairs of responses from the same individual for the four possible before/during combinations (Wave 1 versus Wave 3; Wave 2 versus Wave 3; Wave 1 versus Wave 4; Wave 2 versus Wave 4) . Matched-pair comparison controls were used for individual differences in route choice, driving behavior,
TRA NSPORTATION RESEA RCH RECORD 1280
etc. The results of this analysis were largely consistent with those from the floating-car data .
Project participants experienced mixed travel conditions that varied by residential area. In particular, participants who had shifted from start times earlier than 7:30 a.m . experienced no significant savings or losses on the workbound trip. For some residential areas (notably the Windward and East Leeward areas), such participants experienced significant average possible travel time losses of 8 to 15 min (see Table 6). Participants who had shifted from a 7:30 a.m. or later preproject starting time experienced travel time savings, but such savings were statistically insignificant for most residential areas (21).
Nonparticipants realized average workbound travel time savings ranging from 2 min to almost 7 min (9 to 19 percent)
TABLE 5 TRAVEL TIME SAVINGS BECAUSE OF PROJECT, BY ROUTE
ROUTE DEPARTURE TIME
1-Mililani 5:30 to 7:30 a.m.
2-Hawaii Kai 6:45 to 7:30 a.m.
7:45 to 8:15 a.m.
3- Kailua 6:00 to 7:45 a.m.
7:45 to 8:15 a.m.
MINUTES
2 to 7
3 to 4
Oto -2
o to 6
Oto -2
PERCENT
5 to 13%
9 to 12%
Oto -9%
o to 18%
o to -10%
TABLE 6 MEAN WORKBOUND TRAVEL TIME DIFFERENCES FOR PARTICIPANTS, BY SHIFTING ARRIVAL TIME INTERVALS
(3) Mar. 2 (4) Mar. 16 (3) Mar. 2 (4) Mar.16
Residential VS. vs. vs. VS.
Sample Area (1) Feb. 3 (1) Feb. 3 (2) Feb. 17 (2) Feb.17
1. 7:30-7:45 a.m. East
to Honolulu (NS) (NS) (NS) (NS)
8:15-8:30 a.m.
2. Pre-7:30 a.m. East +16.0 Min. +17.0 Min.
to Honolulu (NS) (NS)
8:15-8:30 a.m. (+64.6%) (69.2%)
TABLE 6 (continued on next page)
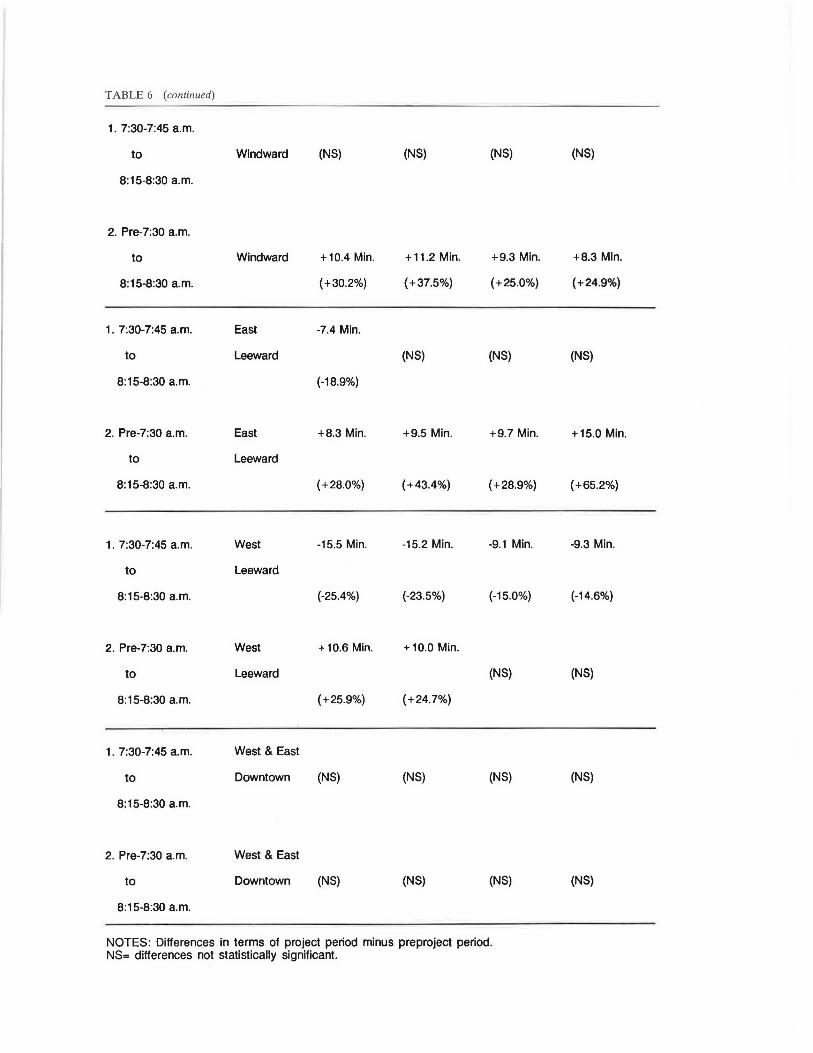
TABLE 6 (continued)
1. 7:30-7:45 a.m.
to Windward (NS) (NS) (NS)
8:15-8:30 a.m.
2. Pre-7:30 a.m.
to Windward +10.4 Min. +11.2 Min. +9.3 Min.
8:15-8:30 a.m. ( +30.2%) (+37.5%) (+25.0%)
1. 7:30-7:45 a.m. East -7.4 Min.
to Leeward (NS) (NS)
8:15-8:30 a.m. (-18.9%)
2. Pre-7:30 a.m. East +8.3 Min. +9.5 Min. +9.7 Min.
to Leeward
8:15-8:30 a.m. (+28.0%) (+43.4%) (+28.9%)
1. 7:30-7:45 a.m. West -15.5 Min. -15.2 Min. -9.1 Min.
to Leeward
8:15-8:30 a.m. (-25.4%) (-23.5%) (-15.0%)
2. Pre-7:30 a.m. West +10.6 Min. +10.0 Min.
to Leeward (NS)
8:15-8:30 a.m. (+25.9%) (+24.7%)
1. 7:30-7:45 a.m. West & East
to Downtown (NS) (NS) (NS)
8:15-8:30 a.m.
2. Pre-7:30 a.m. West & East
to Downtown (NS) (NS) (NS)
8:15-8:30 a.m.
NOTES: Differences in terms of project period minus preproject period. NS= differences not statistically significant.
(NS)
+8.3 Min.
(+24.9%)
(NS)
+15.0 Min.
(+65.2%)
-9.3 Min.
(-14.6%)
(NS)
(NS)
(NS)

54
for those arriving at work hetween 7::10 ;rnd 8:15 a.m. However, nonparticipants who retained either earlier or later schedules experienced no significant changes in travel conditions. Finally, the workers who shifted from 7:30 a.m. to an earlier schedule (mainly private-sector employees) experienced mean travel time savings of 4 to 8 min.
For homebound (afternoon) trips, there was no change in the mean travel times for project participants. However, nonparticipants experienced a mean travel time savings similar to that of the workbound trip (about 10 percent) (21). This distribution of gains and losses between participants and nonparticipants affected attitudes toward the project, as further discussed in the following section .
Perceptions of Traffic Conditions
'l'he perceptions of traffic conditions on the part of downtown employees are also important in evaluating the potential of staggered work hours . Employees were asked to express qualitative comparisons of traffic conditions during and before the demonstration project. They were asked about their trips both to and from work in terms of a 5-point scale ranging from much worse to much better.
Participants and nonparticipants had significantly different perceptions of differences in traffic conditions . Statistical analysis showed that nonparticipants were more likely to perceive traffic conditions on the trip to work as better or much better during the project, while perceptions of participants were more balanced hetween positive :mcl neg:itive peri:;eptions.
Differences in the perceptions of traffic conditions on the trip from work to home were stronger between participants and nonparticipants. Nonparticipants' perceptions were skewed toward the positive side of the scale, whereas participants' perceptions were skewed toward negative responses (see Figure 4).
These perceptions are consistent with the reported travel time changes discussed in the preceding section. Nonparticipants likely enjoyed better travel conditions as participants shifted out of the "peak of the peak" travel intervals. For
50 ..... -.. -----··--· .. ·----........ _ .................. ..
40 ·----.. - .. -·- ·---............ .
30 -----................... -... -.............. _ .... .. l-
C5 u [5
20 ................ - ......... _ .. _ _
u.
0
TRANSPORTATION RESEARCH RECORD 1280
participants, travel impacts depended on their previous schedule. Those who shifted from the 7:45 a.m. start time were likely to have realized some benefit, whereas those who shifted from earlier start times, and thus did not previously travel at the height of the peak, did not realize any travel time gains. In addition, those from specific residential areas (Windward and East Leeward) who shifted from start times earlier than 7:45 a.m. realized significant travel time losses.
There were also differences among the perceptions both of participants and nonparticipants in the public and private sectors (21). Private-sector participants were more likely than public-sector participants to perceive better traffic conditions during the project for the trip both to work and from work . Among nonparticipants, private-sector perceptions were also more positive than those of public-sector participants.
Differences in perceptions between private- and publicsector participants and nonparticipants are not surprising. The voluntary nature of the project for private employees enabled them to optimize their work schedule. Thus , the individuals who changed hours were those who could benefit from the change. Those who could not benefit had no incentive to change and were not required to do so. The increased opportunity to choose one's work schedule probably added a positive subjective element to private-sector employee perceptions.
Perceptions of the two remaining groups of employeesthosc who changed to earlier hours (early changers) and those who changed to later hours (late changers)-were also consistent with reported travel time data (21). The early changers perceived better traffic conditions for both the workbound and homebound trips. They shifted to a less congested part of the peak and thus realized perceptible travel time savings. For the late changers, perceptions were balanced; in other words, there was no perceived change in traffic conditions during the project.
Perceived Project Impacts
The project changed circumstances at work both for participants and nonparticipants. It was anticipated that the change
t-Ot'PART.
MLCH WORSE SAME MUCH BETTER WORSE BETTER
TRAFFIC: DLRll\G VS. BEFORE PROJECT
FIGURE 4 Perceptions of homebound traffic, all sectors.

Gi11/ia110 and Golob
in work schedules would affect employees' work performance, as well as participants' household activities and responsibilities. Of particular concern were family and childcare-related activities, given the large number of two-worker households in Hawaii.
Project participants reported problems in several aspects of nonwork activities, including taking care of personal business (63 percent), scheduling social activities (56 percent), and doing things with household members (56 percent). Arranging for childcare and children's school activities was also identified as a problem. These results are not surprising, given the temporary nature of the project, and do not necessarily suggest that such problems would be experienced if these changes were of longer duration.
Project participants also reported problems in getting to and from work. These problems were related either to finding a parking space or to using peak-only express bus service, as discussed previously.
Participants reported no significant problems with workrelated activities, such as getting work done or meeting with clients or coworkers.
Employee attitudes were also analyzed by sector. Publicsector participants had significantly more negative attitudes about other activities during the project than did privatesector participants. That is, although participants in all sectors reported worse conditions in performing household, social, and work activities, state, city, and county participants were more likely to report much worse conditions. Because privatesector participants worked the same schedule as public-sector participants, the differences in attitudes between the two groups merit further explanation. It is possible that the mandatory nature of the project for public-sector employees made it necessary for many employees to work on the project schedule even though it was inconvenient or difficult for them to do so. In contrast, private-sector participants chose the new schedule willingly, probably only when it was convenient for them to do so. Public-sector participants also experienced a more extreme shift in work hours than did private-sector participants and thus potentially had more adjustments to make in nonwork activities. Finally, the more negative attitude of
SS
public-sector employees may reflect underlying discontent with the mandatory nature of the project.
Work Performance and Productivity
It was also anticipated that the project would affect job performance. The disruptive effects of changing employee work schedules, potential morale problems, and changing government office hours could pose problems for management. When asked to rate their employees' overall performance during the project, private-sector managers reported no change from usual conditions. Public-sector managers were more likely to report the same or worse conditions , with city-county responses significantly more negative than state responses.
Differences in ratings of employee morale were even more striking. Virtually all private-sector managers reported the same or a better level of employee morale during the project. State and city-county responses were just the opposite, as shown in Figure 5. Almost half of the city-county managers reported worse or much worse employee morale during the project, whereas 37 percent of state managers reported worse or much worse employee morale.
Analysis of specific aspects of work activities, including managing, communications, scheduling, and making contacts , revealed that few of these were affected by the project. A large majority (80 percent or more) of managers reported no change in work performance during the project. However, a general pattern of more negative than positive responses was evident, with public-sector management more likely than private-sector managers to report negative experiences. Most frequently identified management problems included coordinating interdepartmental work (21 percent), making con- . tacts with mainland offices (21 percent), scheduling work assignments (17 percent) , and communicating with employees (16 percent). The results indicate that inter- and intraorganization coordination was affected by the project. Publicsector responses were significantly more negative about communicating with other offices outside downtown, suggesting that the shift in work hours within downtown offices caused
0.7 ..--------------------------.
05 ·-· .... ·---····-.. ·-·---...................... -
0.3 ·-.. ·---·---·
0.2 .......... ____ _
Ml£H WORSE WORSE
SAME Ml.01 BEITER BETIER
STATE
OTY
11111111111111111111111111111
PRIVATE
FIGURE 5 Perceptions of project influence on employee morale by sector.

56
some difficulties in maintaining activities that required linkages with units in locations lhal uiu nol shift hours . Problems associated with contacting mainland offices were expected because the shift in business hours increased the time difference in business hours between Hawaii and the mainland .
Attitudes Toward Staggered Work Hours
Any consideration of implementing a permanent staggered work hours program requires an assessment of employee attitudes toward such a proposal. Managers were asked to rate their employees' attitudes toward the project before, during, and after its implementation. Private-sector responses were heavily skewed toward positive ratings, whereas public-sector responses were heavily skewed toward negative ratings. State ratings were significantly more negative than city-county ratings before the project. After the project, private-sector responses remained positive, state responses became significantly less negative (but not positive), and city-county responses remained negative. The shift in state employee attitudes is shown in Figure 6. These results conflict with other studies of employee attitudes toward staggered hours programs. Previous research indicates consistently positive assessments of such programs (25).
Both managers and employees were also asked their opinion about various staggered work hours alternatives that might be implemented in the future. All sectors and participants, as well as nonparticipants, were opposed to mandatory alternatives of staggered work hours. Attitudes toward voluntary alternatives were 1no1e mixed. Managemeul 1espuuses lu alternatives that allow employees to work on different schedules were bimodal-less than 10 percent were neutral. Private-sector managers were most likely to respond positively; state and city-county managers were more often negative, with city-county responses most negative. Voluntary staggered work hours alternatives were perceived positively by employee participants and nonparticipants. State and private participants were more positive than city-county participants ahout voluntary programs .
50 .......... _ ................ - ...... .
40 --·-.. ·-··~--· ... _ .. __ .....
20 __ ,,, ___ .. __
10 '''"' '""""
0 VERY NEGATIVE NEUTRAL
NEGATIVE
TRANSPORTATION RESEARCH RECORD 1280
Evaluation of the project and possible future staggered work hours alternatives showed strong negative feelings toward mandatory programs. Public-sector employees were particularly opposed to any future mandatory program and had generally negative views of the project. These negative attitudes are only partially explained by the experiences of project participants because nonparticipants were also opposed to mandatory alternatives. In contrast, private-sector employees reported favorable attitudes to the project and had no strong feelings either for or against possible future mandatory programs.
These differences in attitudes between private- and publicsector employees reflect their differing experiences . For private-sector employees, the project was a voluntary program. They benefited from having the choice of chilnging their schedules in ways most favorable to their own particular circumstances. In contrast, public-sector employees were faced with il mflncfatory chflnee in sche<l11le thflt in mflny rnses entflile<l a shift of an hour or more . Such shifts are bound to be disruptive, at least in the short run. Moreover, the difficulties of the work schedule shift were compounded for some participants by a longer , more congested commute .
These results indicate that mandatory changes in work schedules are strongly opposed by employees and their managers. Voluntary staggered work hours programs give more flexibility to employees and, understandably, are supported by them. This tlexibility creates additional complexity for management in scheduling and coordinating work, however, and the management response to voluntary alternatives is therefore more mixed. The results also suggest that the negaiive reaciion to mandaiory programs may go beyun<l lhe problems and inconveniences generated by the project and may reflect more fundamental dissatisfaction with the project and its implementation.
CONCLUSIONS AND POLICY IMPLICATIONS
The Staggered Work Hours Demonstration Project is typical of many efforts either made or proposed to solve traffic prob-
VERY POSITIVE POSITIVE
BEFORE
I DURt-.C
liillhllll lll,·1• ill~lilll AFTER
FIGURE 6 Attitudes of state managers toward project.

Giuliano and Golob
!ems. Travel conditions were affected, but problems were encountered in doing so. In this case, the problems stem from (a) the magnitude of travel impacts attributable to the project, (b) the distribution of these impacts, and (c) the mandatory nature of the project.
The project had a significant positive overall effect on traffic conditions. Average estimated travel time savings were in the range of 3 to 4 min, or 7 to 9 percent of the average 45-min commute. There is some question as to whether a change of this magnitude is either meaningful or perceptible to most commuters. An average of 3 to 4 min means that some commuters saved more time than 3 to 4 min and others saved less. It is possible that the change was not noticeable for many commuters. Thus, the benefit of the project may for the most part have gone unnoticed.
The distribution of travel time impacts among the various employee segments and among geographic areas was also a source of problems. Nonparticipants generally benefited more than participants-and without the inconvenience of having to change their work schedule. Participants who shifted from earlier hours (i.e., those who had been taking advantage of preexisting flexible hours programs) incurred the greatest disruption in their schedule and were most likely to experience deteriorated travel conditions. Moreover, these participants were more likely to have the longest commutes. Thus, a significant minority of participants incurred particularly large costs as a result of the project. In contrast, private-sector employees, who were able to choose their work schedule, were more likely to have benefited from the project because they were able to adjust their commute to avoid the worst traffic periods.
These problems became more onerous for public employees because of the mandatory nature of the project . Employees were faced with a work schedule change over which they had little control. Although an extensive public relations program was conducted, employee resistance was not substantially reduced. The exemption process may have added to the negative reaction. Exemption required a formal application process. Guidelines for granting exemptions were uniform in the state and city, but design and implementation of exemption procedures were left to individual departments. Although the vast majority of those who applied for exemptions got them, survey results indicated that there were differences in the way exemption policies were applied among offices (21).
Unintended Consequences
The project also had impacts that were not anticipated. These included (a) effectively penalizing employees who had flexible work hours before the project, (b) localized congestion, and (c) parking and bus use problems.
As discussed previously, participants who switched from arrival times of before 7:30 a.m. incurred longer commutes as a result of the project and were most negatively affected by the travel shifts that took place. The research showed that flexible hours exist (de facto) in the public sector. Although the majority of employees start work at 7:45 a.m., about 40 percent of all public-sector employees start at other times. Arrival times at work are even more spread out, but the project had the effect of concentrating both arrival and depar-
57
ture times. This concentration led to localized congestion problems at major employment site access points and parking lots. Some public-sector participants had the added problem of finding a parking space, while others were unable to use express bus service. These impacts indicate that nonparticipants were more likely to benefit from the project than participants.
Lessons Learned
The project evaluation provides valuable insights for future traffic management policy. Results indicate that, given a choice, employees prefer earlier rather than later work schedules. This preference is shown by the pattern of schedule changes that occurred in the private sector, as well as by the pattern of arrival times among public-sector employees before the project. Preferences for earlier schedules have been documented previously (7). Thus, a voluntary program would likely result in few shifts to a later schedule and could have the effect of simply shifting the peak rather than spreading out the peak. Additional incentives (for example, a wage differential for the late shift) would probably be necessary to achieve a more even distribution of traffic. Factors that effectively penalize late arrivals-such as first-come, first-served parking-would have to be eliminated. Modified staggered hours programs are also a possibility. For example, employees could sign up for available schedule alternatives, much like driver schedules are allocated in the transit industry.
A more serious consideration for such programs is latent demand. It is possible that the benefits of any alternative work hours program would soon be eroded by new trips or by shifts of existing trips to the peak period. Latent demand may be particularly significant in heavily congested areas, where capacity constraints limit peak-period trips. Although latent demand is an issue that applies to any transportation improvement, it is more relevant in this case in view of the magnitude of the travel time savings identified.
A related issue is that of balancing costs and benefits. It is important to determine whether the costs incurred by participants are justified by the resulting transportation system performance improvements. Clearly, a mandatory program is inappropriate.
Finally, this research provided valuable information on the degree to which an individual's work schedule is embedded within the household activity schedule. When the work schedule changes, it affects all members of the household and requires adjustments in other activities. Social activities, childcare, children's activities, and household chores may need to be reorganized and rescheduled. The project also illustrated the dependence of workers on the schedule of other institutions and services. Thus, spreading out the normal work day is dependent on extending hours of childcare services, banks, medical offices, etc., as well as extending work-trip-oriented transit services.
The project demonstrated that staggered work hours can help alleviate traffic congestion. However, impacts are not uniform; some commuters will save time, but others will not. Impacts on the transportation system are sufficiently small that they could easily be eroded by latent-demand-related travel shifts, whereas impacts on the individual may be sig-
58
nificant. Shifting work schedules is just one possible strategy for traffic management, and this research suggests that it can result in a complex set of costs and benefits.
ACKNOWLEDGMENTS
This research was supported by the state of Hawaii and the Oahu Metropolitan Planning Organization. Helpful comments and suggestions by an anonyme:us referee are also acknowledged.
REFERENCES
1. Lnterplan orporntion. Joilll 'trmegies for Urban Trr111spor1a1ion, Air Quality anti Energy Conservation. UMTA, U .. Depunment of Tran portation, 1975.
2. Tra11sporu11ion Control.f To Reduce A11to1110/Jile u~e and lmnrnve Air Quality in Citrus. Office of Policy Analysis, U.S. En~ir~nmental Protection Agency, 1974.
3. A. M. Voorhees and Associates. G11ldeli11es To Reduce Energy Consumption Through Tm11sportatio11. Actions . UMTA. U.S. Department of Tmnsportntion, 1974.
4. Special Report 172: Tran.fponation Sy rem Mmwgement. TRB, National Research Council, Wa~hington , D.C. , 1977.
5. Staggered Work flours-A Report 011 United Staies and /111ernarional Practice. Port Authority of New York and New Jersey, New York, 1975.
6. . Ro ·cnbl om. Peak-Period Trn thc Congestion: A State of the Art Analysis and Evalumion of Effective Solution . Trtmspor· tation, Vol. 7 , No. 2 , 1978, pp. 1.67-191.
7. D. Jones and F. Harrison. Off-Work Early: The Fiiwl Report of the Sa11 Francisco Flex-Time Demonstrat/011 Project . 1n titutc of Tn111sporta1io11 mdies , Unjversi ty of ~alifornia, ljcrkcley, 1983.
8. J . Roark. NCH RP Symlresis of Nighw"y Practice 81 : Experiences in Transportation System Mmragemem . TRB National Research Council, Washington, D.C., 1981.
9. F. J. Wegm3nn and . Stokey. Impact of Flextime on 011 Employer· Based Rides/rare Program: ase S111dy Tennessee \I alley Author· ity, K11o:c11ille, Te1111essee . Dep3rtmcnt of ivil Engineering. University of Tennessee , Knoxville, 1983.
10. R. Cervero and B. Grie enbeck. Factors l11flueuci11g omm11tlng hoices in Suburban Labor Markets: A Ca e A11alysi. of Pleas~
a111011, Califomifl. Tra11sportmio11 l~eseard1 , Vol. 22A, o . 3, 1.988, pp. 151 - 162.
11. A. Tanner. The Impacts of Feasible '1aggered Work Hours and Compressed Work Week Policies on Higl11vay Networks, Transportation Economics, Organizations and Employees. Planning
TRANSPORTATION RESEARCH RECORD 1280
Research Unit, New York State Department of Transportation, Albany, 1977.
12. J . Prnshker and M. Hirsh . Eva/11atio11 of Energy Savings i11 tire Transpor111tio11 Sector Res11/1i11g from Reschet/11/i11g of Working f-1011rs i11 the Tel Aviv Me11·opoliu111 Area. Department of Civil Engineering and Tran-portmion Rcscarcb lnstitute, TcchnionIsrael Institute of Technology, Haifa, Israel, 1987.
13. A. D. May. Demand- upply Modeling for Tran porwtion ystcm Management. In Tra11spona1io11 Research Record 835. TRB , National Research ouncil, Wa hinglon D .C.. , ·1981 , rr R0-86.
14. Y. Sugie . Application of an Eq11ilibri11111 Model ro Siron-Term Traffic Policies Evaluation. Volume 5. International Association of TrnUic and Safety Science Re earch , 198 1. pp. 1-90.
15. G. Giuliano. Testing th Limits fTSM: The 1984 Lo Angeles Summer lympics. Tnwspor1mio11. Vol. 15 J.988 pp. 143- 161.
16. J. Owens. Flextime: ome Management and Labor Problems of the New Flexible Hour Scheduling Practices. Industrial and Labor Relations Review, Vol. 30, No. 2, 1977, pp . 152-161.
17. R. Safavian and K. McLean. Variable Work Hour : Who Benefi ts'! Trt1ffi E11gi11eeri11g, Vol. 45 , o . 3, 1975, pp. 17- 25.
18. Cambridge ystematics Inc. Denver Federal Employee ompressed Work Week Experiment: Eval11atio11 of Trrmsoortation Related Impacts. Denver Regional Council ~f Governments, Denver, Colo., 1980.
19. L. Skinner and . Sheu . impact of Compressed Work Schedules: Solid Demographic and Allit11dinal Factors and Tmvel Pa11er11 Effects. PHWA. U .. Department ofTransportution , 1981.
20. K. Bhatt and T. Higgins. A11 Assessment of Travel Dema11d Approaches at 11/mrbrm Activity Ce111ers . Transportation Sys-tem enter, U .. Department fTra n pOrlation , l989.
21. G. Giuliano and T. Golob. Evaluation of rite 1988 Swggered Work flours Demo11sm11io11 Project irr f/0110/11/11 . Final Report . In. tiLul<l of Trnnsponation Studies, Unjversity a l 'ahlomia, ln•inc , 1989.
22. J. A. Lindley. Q11m1tificll/io11 of Urban Freeway Congestion and A11aly i of Remedial Measures . Final Rep rt. FHWA, U.S. Department of Transporta tion. 19 .
23. M .. D. Und~. Luugilutlinai Data nalysis: M lhods and Applica11on •. ln Loudon Paper in Regional Science I , Pion, Ltd., London , E ngland , 19 8.
24. P. Jovnnis . Analysis am/ Prediction of Travel Response to Flexible Work Hours: A Socioeco110111ic Workplace mu/ Trrmspor1a-1io11 System Perspectiv . Ph.D. dissertat ion . Department of ivil Engineering University of alifornia, Berkeley , 1977 .
25. Barron-A chman Associa tes. Traveler Respo11 e 10 1'ra11sporlll· tio11 "ystem ~umges , 2nd ed. , FHWA, U.S. Department of Transportation, 1.981.
The views expressed in this paper, as well as any errors or omissions, are those of the authors.
Publication of this paper sponsored by Commillee on Ridesharing.