stainless steel clad rebar in bridge...
TRANSCRIPT

SD2000-04-F
Stainless Steel Clad Rebarin Bridge Decks
Study SD2000-04Final Report
Department of Materials and Metallurgical Engineering November 2001South Dakota School of Mines & TechnologyRapid City, SD 57701
South DakotaDepartment of TransportationOffice of Research
Connecting South Dakota and the Nation
SD2000-04 Final Report ii November 2001
DISCLAIMERThe contents of this report reflect the views of the authors who are responsible for the facts andaccuracy of the data presented herein. The contents do not necessarily reflect the official views orpolicies of the South Dakota Department of Transportation, the State Transportation Commission,or the Federal Highway Administration. This report does not constitute a standard, specification,or regulation.
ACKNOWLEDGEMENTSThis work was performed under the supervision of the SD2000-04 Technical Panel:
Mark Clausen .......................................FHWATom Gilsrud ............................. Bridge DesignTodd Hertel.......................... Aberdeen RegionBrian Hines........................................Research
Darin Hodges................Materials & SurfacingDave Huft ..........................................ResearchDarin Larson ..................... Operations SupportPaul Nelson................................ Pierre Region
The investigators wish to thank Mr. Frank Pianca of the Ontario Ministry of Transportation forproviding samples of Nuovinox stainless steel clad reinforcement for laboratory testing. The workwas performed in cooperation with the United States Department of Transportation FederalHighway Administration.
SD2000-04 Final Report iii November 2001
TECHNICAL REPORT STANDARD TITLE PAGE1. Report No.
SD2000-04-F2. Government Accession No. 3. Recipient's Catalog No.
5. Report Date
November 15, 20014. Title and Subtitle
Stainless Steel Clad Rebar in Bridge Decks6. Performing Organization Code
7. Author(s)
William M. Cross, Ed F. Duke, Jon J. Kellar, Ken N. Han, andDan Johnston
8. Performing Organization Report No.
10. Work Unit No.9. Performing Organization Name and Address
South Dakota School of Mines and Technology501 E. St. Joseph StreetRapid City, SD 57701-3995
11. Contract or Grant No.
31070413. Type of Report and Period Covered
Final Report; March 2000 toNovember 2001
12. Sponsoring Agency Name and Address
South Dakota Department of Transportation Office of Research 700 East Broadway Avenue Pierre, SD 57501-2586 14. Sponsoring Agency Code
HR000415. Supplementary Notes
An executive summary is published separately as SD2000-04-X.16. Abstract
The corrosion resistance, mechanical properties, and cladding size and shape of a stainless steelclad (SSC) reinforcing bar (rebar) were investigated. For the mechanical property testing, theblack steel core failed prior to the cladding. The mechanical properties examined were elongation,tensile strength and yield strength. The SSC rebar had greater elongation and tensile strength thanthe specifications, but the yield strength had a 33% probability of being less than the specificationif the actual bar diameter of 0.76” was used.
The SSC rebar with end coating is estimated to give 50-60 years of life before damaging theconcrete. Abrading the cladding reduced the life estimate by a few years, usually 1-5 years.Drilling a hole in the cladding, to simulate a break, significantly reduced the estimated life of theend coated SSC rebar by 15-40 years.
All samples exceeded the nominal bar size. The cladding was generally within specification,except for one failing measurement out of approximately 50 measurements. All examined samplesexhibited a gap between the core and cladding. Cracking of the cladding would be similar to thecorrosion test in which a hole was drilled in the cladding and would lead to a serious decrease inthe life expectancy of the bridge deck compared to non-cracked clad SSC rebar. At the currenttime, the SSC rebar material is not recommended for use due to questions about its long-termmechanical durability.17. Keywords
bridges, design and construction, testing, reinforced concrete,corrosion, bridge decks, reinforcing bars, reinforcing steel,stainless steel, corrosion resistant steel, corrosion resistance,corrosion protection, corrosion tests, mechanical properties,cladding, clad metals, tensile strength, yield strength, durability,chlorides, laboratory tests, impact tests, metal bonding,metallurgy
18. Distribution Statement
No restrictions. This documentis available to the public fromthe sponsoring agency.
19. Security Classification (of this report)
Unclassified20. Security Classification (of this page)
Unclassified21. No. of Pages
5522. Price

SD2000-04 Final Report iv November 2001
SD2000-04 Final Report v November 2001
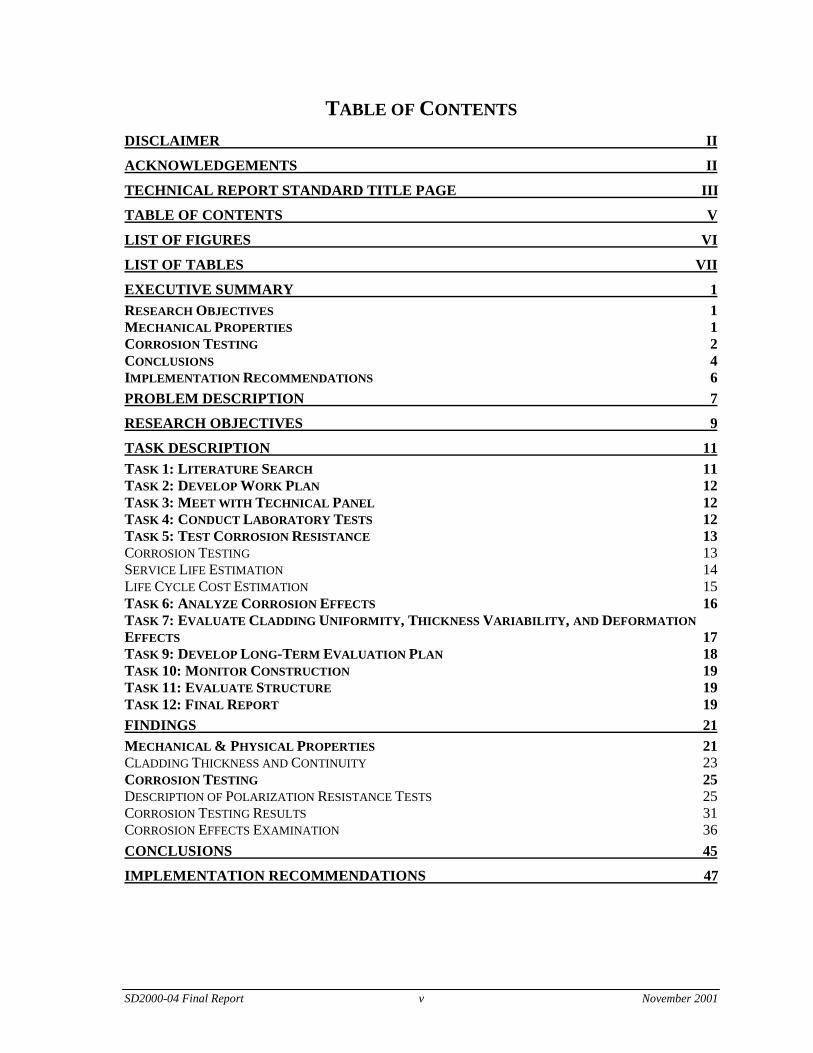
TABLE OF CONTENTS
DISCLAIMER II
ACKNOWLEDGEMENTS II
TECHNICAL REPORT STANDARD TITLE PAGE III
TABLE OF CONTENTS V
LIST OF FIGURES VI
LIST OF TABLES VII
EXECUTIVE SUMMARY 1RESEARCH OBJECTIVES 1MECHANICAL PROPERTIES 1CORROSION TESTING 2CONCLUSIONS 4IMPLEMENTATION RECOMMENDATIONS 6PROBLEM DESCRIPTION 7
RESEARCH OBJECTIVES 9
TASK DESCRIPTION 11TASK 1: LITERATURE SEARCH 11TASK 2: DEVELOP WORK PLAN 12TASK 3: MEET WITH TECHNICAL PANEL 12TASK 4: CONDUCT LABORATORY TESTS 12TASK 5: TEST CORROSION RESISTANCE 13CORROSION TESTING 13SERVICE LIFE ESTIMATION 14LIFE CYCLE COST ESTIMATION 15TASK 6: ANALYZE CORROSION EFFECTS 16TASK 7: EVALUATE CLADDING UNIFORMITY, THICKNESS VARIABILITY, AND DEFORMATIONEFFECTS 17TASK 9: DEVELOP LONG-TERM EVALUATION PLAN 18TASK 10: MONITOR CONSTRUCTION 19TASK 11: EVALUATE STRUCTURE 19TASK 12: FINAL REPORT 19FINDINGS 21MECHANICAL & PHYSICAL PROPERTIES 21CLADDING THICKNESS AND CONTINUITY 23CORROSION TESTING 25DESCRIPTION OF POLARIZATION RESISTANCE TESTS 25CORROSION TESTING RESULTS 31CORROSION EFFECTS EXAMINATION 36CONCLUSIONS 45
IMPLEMENTATION RECOMMENDATIONS 47

SD2000-04 Final Report vi November 2001
LIST OF FIGURESFIGURE 1: PHOTOGRAPH OF A TENSILE TEST FAILED SSC REBAR ..........................................................................2FIGURE 2: IMPACT-TESTED #6 SSC REBAR SHOWING MASSIVE INTERNAL CORROSION.......................................3FIGURE 3: BACKSCATTER SEM IMAGE OF CORE/CLADDING INTERFACE ..............................................................4FIGURE 4: TYPICAL STRESS-STRAIN CURVE WITH DEFINITIONS OF MECHANICAL PROPERTIES ..........................21FIGURE 5: PHOTOGRAPH OF TENSILE TEST FAILED SSC REBAR .........................................................................23FIGURE 6: PHOTOGRAPH OF ANOTHER TENSILE TEST FAILED SSC REBAR.........................................................23FIGURE 7: CUT SURFACE A #6 SSC BAR .............................................................................................................24FIGURE 8: STAINLESS STEEL CLAD REBAR SHOWING HOLE DRILLED IN FLAT PORTION OF CLADDING..............27FIGURE 9: WIRE/NAIL ASSEMBLY BEFORE AND AFTER SOLDERING. ..................................................................27FIGURE 10: TEST SAMPLES OF STAINLESS STEEL CLAD REBAR WITH WIRE/NAIL ASSEMBLY IN PLACE.............28FIGURE 11: ELECTROCHEMICAL CELL WITH ELECTRODES IN PLACE ...................................................................28FIGURE 12: APPARATUS FOR CONDUCTING MULTIPLE CORROSION TESTS SIMULTANEOUSLY............................29FIGURE 13: POTENTIOSTAT..................................................................................................................................29FIGURE 14: EXPECTED POLARIZATION RESISTANCE BEHAVIOR ..........................................................................30FIGURE 15: EXPECTED TAFEL PLOT SHOWING TAFEL SLOPES EQUIVALENT TO 1/BA AND 1/BC.........................30FIGURE 16: GRAPH OF CORROSION DATA FOR BLACK STEEL REBAR DURING ACCELERATED CORROSION
TESTING......................................................................................................................................................32FIGURE 17: UNCOATED SSC REBAR AFTER 8 DAYS AT PH6, 60˚C.....................................................................37FIGURE 18: UNCOATED SSC REBAR AFTER 8 DAYS AT PH6, 60˚C, OTHER SIDE OF SAMPLE FROM FIGURE 17 .37FIGURE 19: CROSS SECTION OF STAINLESS STEEL COATED SSC REBAR TESTED 8 DAYS AT PH6, 60˚C ............38FIGURE 20: IMPACT-TESTED #6 SSC REBAR SHOWING MASSIVE INTERNAL CORROSION...................................39FIGURE 21: #10 SSC REBAR AFTER IMPACT TESTING.........................................................................................39FIGURE 22: BACKSCATTERED SEM IMAGE OF THE CORE/CLADDING INTERFACE AND GAP................................40FIGURE 23: SEM MICROGRAPH OF CLADDING OF IMPACTED #6 SAMPLE, SAME SAMPLE AS FIGURE 20............40FIGURE 24: SEM OF OXIDIZED CORE REGION OF IMPACTED #6 SAMPLE (SAME AS FIGURE 20) .........................41FIGURE 25: SEM MICROGRAPH OF UNOXIDIZED CORE REGION OF #6 SAMPLE WITH INTERIOR CORROSION .....41FIGURE 26: SEM MICROGRAPH OF CLADDING OF #10 SAMPLE ..........................................................................42FIGURE 27: SEM MICROGRAPH OF CORE OF #10 SAMPLE ..................................................................................42
SD2000-04 Final Report vii November 2001
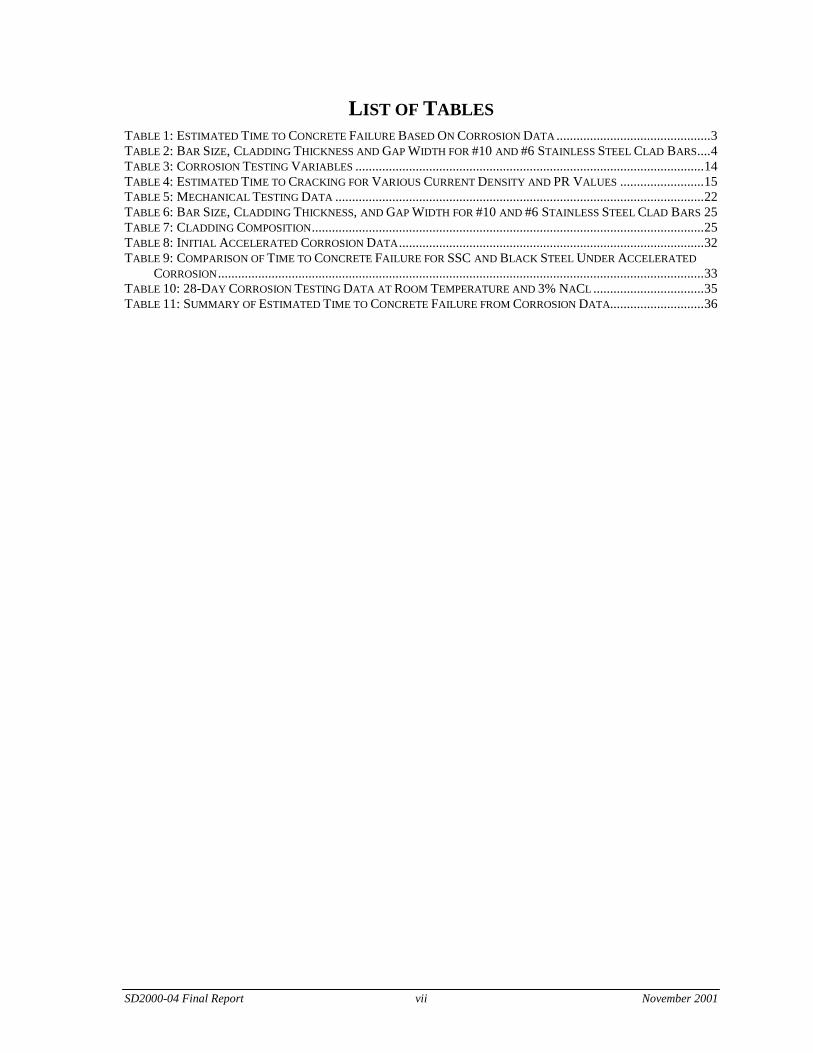
LIST OF TABLESTABLE 1: ESTIMATED TIME TO CONCRETE FAILURE BASED ON CORROSION DATA ..............................................3TABLE 2: BAR SIZE, CLADDING THICKNESS AND GAP WIDTH FOR #10 AND #6 STAINLESS STEEL CLAD BARS....4TABLE 3: CORROSION TESTING VARIABLES ........................................................................................................14TABLE 4: ESTIMATED TIME TO CRACKING FOR VARIOUS CURRENT DENSITY AND PR VALUES .........................15TABLE 5: MECHANICAL TESTING DATA ..............................................................................................................22TABLE 6: BAR SIZE, CLADDING THICKNESS, AND GAP WIDTH FOR #10 AND #6 STAINLESS STEEL CLAD BARS 25TABLE 7: CLADDING COMPOSITION.....................................................................................................................25TABLE 8: INITIAL ACCELERATED CORROSION DATA...........................................................................................32TABLE 9: COMPARISON OF TIME TO CONCRETE FAILURE FOR SSC AND BLACK STEEL UNDER ACCELERATED
CORROSION.................................................................................................................................................33TABLE 10: 28-DAY CORROSION TESTING DATA AT ROOM TEMPERATURE AND 3% NACL .................................35TABLE 11: SUMMARY OF ESTIMATED TIME TO CONCRETE FAILURE FROM CORROSION DATA............................36

SD2000-04 Final Report viii November 2001
SD2000-04 Final Report 1 November 2001
EXECUTIVE SUMMARY
The ongoing problem of corrosion of reinforcing steel in bridge decks has been addressed in SouthDakota with increased concrete cover and the use of epoxy-coated rebar (ECR). To date, thesemeasures appear to have worked well in extending bridge deck life significantly. With thedevelopment of new materials and technologies, the potential for increasing deck life may be evengreater. One of these new materials is stainless steel clad (SSC) reinforcement from Stelax, Ltd. thatconsists of black steel clad with 316L stainless steel during fabrication. The stainless steel claddingis much less susceptible to corrosion than black steel and may provide the means for preventingcorrosion from deicing salts throughout the life of a structure.
The purpose of this research was to evaluate the potential corrosion resistance of both SSC and ECRusing laboratory tests and, based on the results of these tests, design, construct and evaluate a bridgedeck reinforced with SSC bars. The research was to provide information on the constructability andeffectiveness of SSC bridge decks as well as performance and cost-effectiveness data on both SSCand ECR systems.
Research Objectives
Three primary objectives of this research were identified:
1) Determine the corrosion-resistance of SSC compared to ECR reinforcement as well asthe mechanical properties, quality and suitability of SSC for use in bridge decks.
2) Develop design, construction, and evaluation procedures for building a bridge deckusing SSC.
3) Estimate life expectancy and cost effectiveness of SSC, ECR and black steelreinforcement in South Dakota.
Thirteen tasks were outlined to achieve these objectives. The primary research tasks involvedmeasuring the corrosion resistance of the material, determining its mechanical properties, andmeasuring the cladding thickness, bar size, and composition.
Mechanical Properties
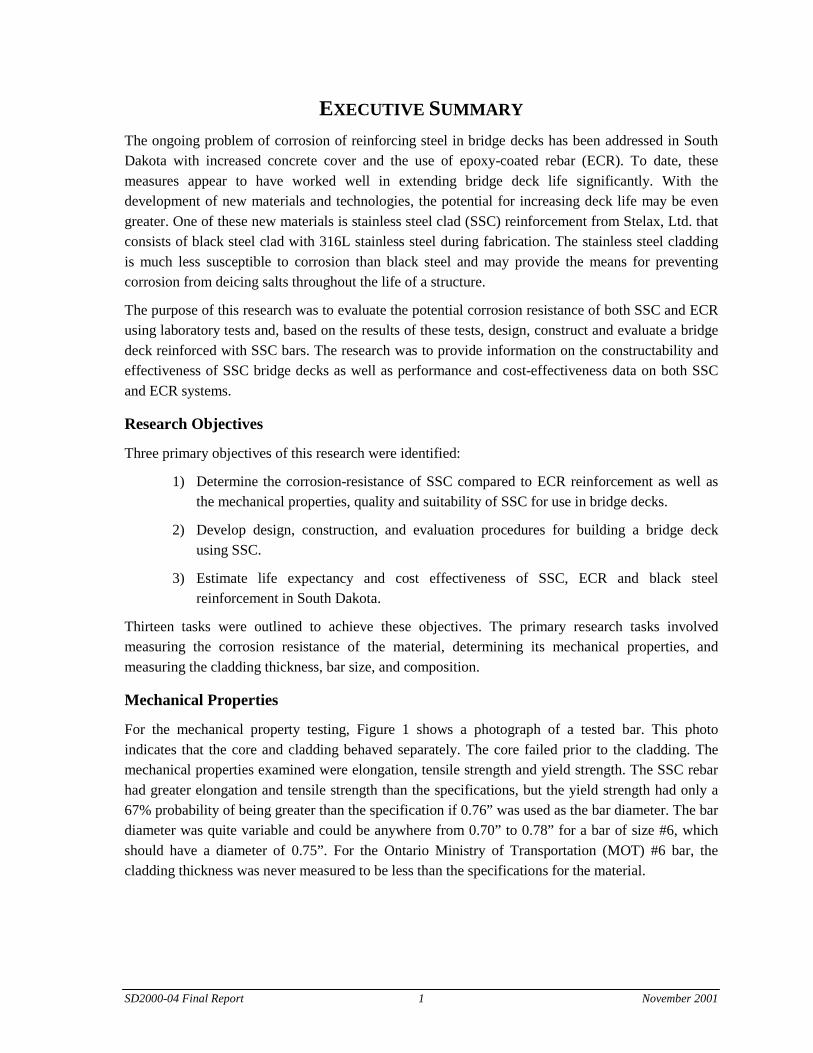
For the mechanical property testing, Figure 1 shows a photograph of a tested bar. This photoindicates that the core and cladding behaved separately. The core failed prior to the cladding. Themechanical properties examined were elongation, tensile strength and yield strength. The SSC rebarhad greater elongation and tensile strength than the specifications, but the yield strength had only a67% probability of being greater than the specification if 0.76” was used as the bar diameter. The bardiameter was quite variable and could be anywhere from 0.70” to 0.78” for a bar of size #6, whichshould have a diameter of 0.75”. For the Ontario Ministry of Transportation (MOT) #6 bar, thecladding thickness was never measured to be less than the specifications for the material.
SD2000-04 Final Report 2 November 2001
Figure 1: Photograph of a tensile test failed SSC rebar
Corrosion Testing
Table 1 summarizes the corrosion data and gives the estimated time to failure for the concrete aroundthe various types of rebar tested. The SSC rebar with end coating is estimated to give 50-60 years oflife before damaging the concrete. Abrading the cladding reduced the life estimate by a few years,usually 1-5 years. Drilling a hole in the cladding significantly reduced the estimated life of the endcoated SSC rebar by 15 to 40 years. The data in bold show those samples exhibiting sufficient life ina bridge deck.
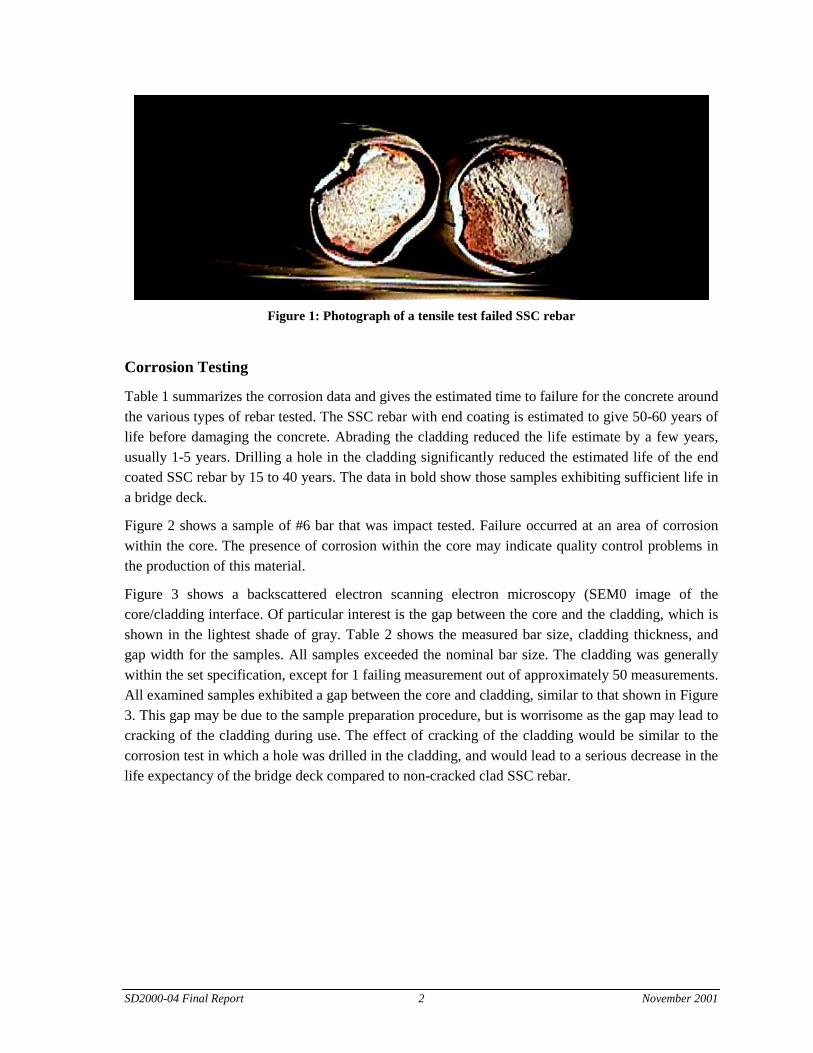
Figure 2 shows a sample of #6 bar that was impact tested. Failure occurred at an area of corrosionwithin the core. The presence of corrosion within the core may indicate quality control problems inthe production of this material.
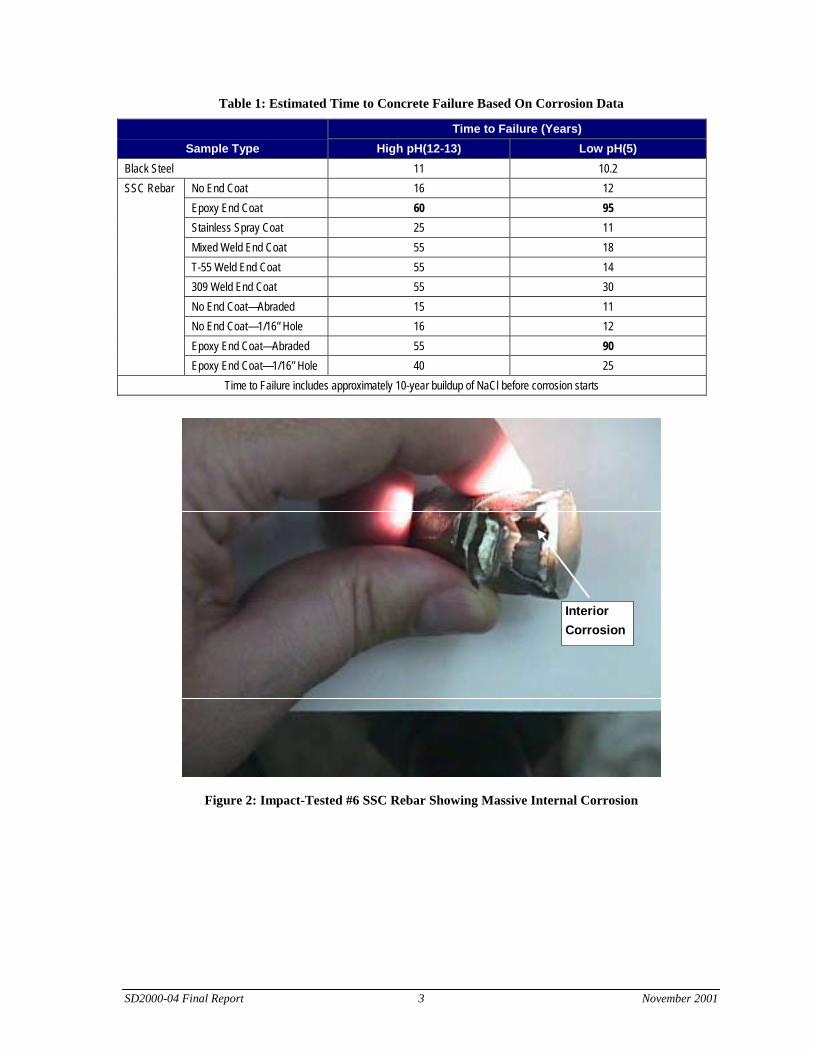
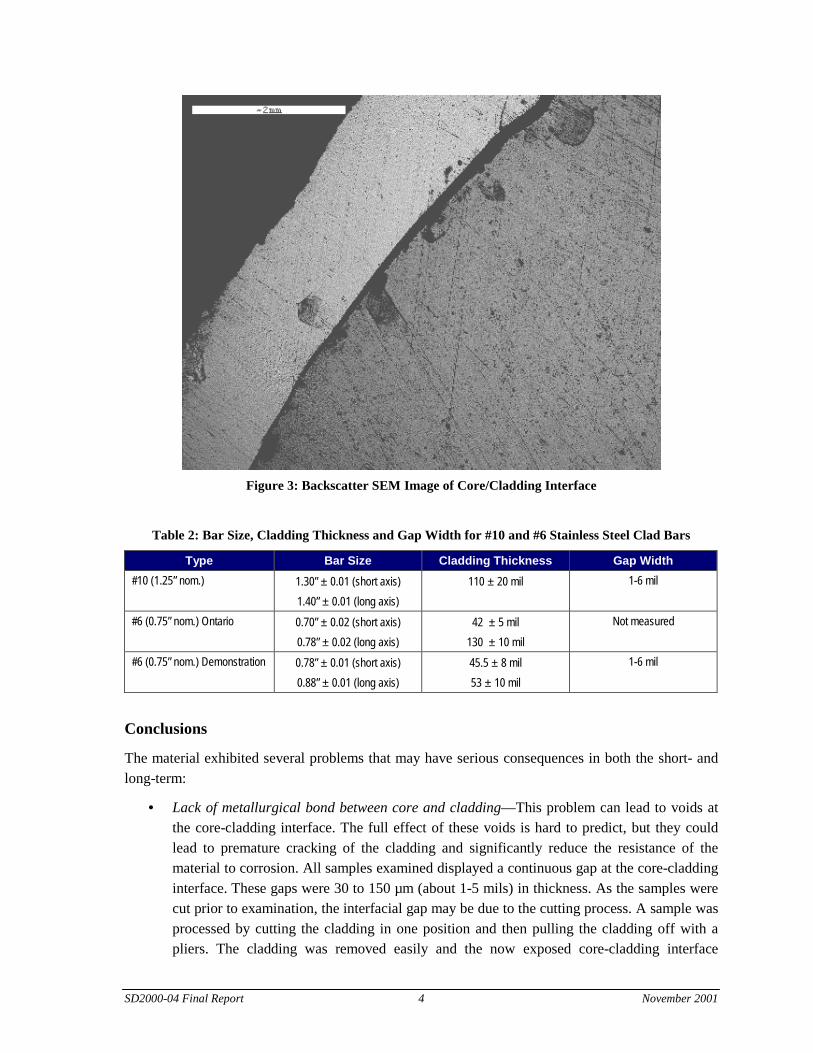
Figure 3 shows a backscattered electron scanning electron microscopy (SEM0 image of thecore/cladding interface. Of particular interest is the gap between the core and the cladding, which isshown in the lightest shade of gray. Table 2 shows the measured bar size, cladding thickness, andgap width for the samples. All samples exceeded the nominal bar size. The cladding was generallywithin the set specification, except for 1 failing measurement out of approximately 50 measurements.All examined samples exhibited a gap between the core and cladding, similar to that shown in Figure3. This gap may be due to the sample preparation procedure, but is worrisome as the gap may lead tocracking of the cladding during use. The effect of cracking of the cladding would be similar to thecorrosion test in which a hole was drilled in the cladding, and would lead to a serious decrease in thelife expectancy of the bridge deck compared to non-cracked clad SSC rebar.
SD2000-04 Final Report 3 November 2001
Table 1: Estimated Time to Concrete Failure Based On Corrosion Data
Time to Failure (Years)Sample Type High pH(12-13) Low pH(5)
Black Steel 11 10.2No End Coat 16 12Epoxy End Coat 60 95Stainless Spray Coat 25 11Mixed Weld End Coat 55 18T-55 Weld End Coat 55 14309 Weld End Coat 55 30No End Coat—Abraded 15 11No End Coat—1/16” Hole 16 12Epoxy End Coat—Abraded 55 90
SSC Rebar
Epoxy End Coat—1/16” Hole 40 25Time to Failure includes approximately 10-year buildup of NaCl before corrosion starts
InteriorCorrosion
Figure 2: Impact-Tested #6 SSC Rebar Showing Massive Internal Corrosion
SD2000-04 Final Report 4 November 2001
Figure 3: Backscatter SEM Image of Core/Cladding Interface
Table 2: Bar Size, Cladding Thickness and Gap Width for #10 and #6 Stainless Steel Clad Bars
Type Bar Size Cladding Thickness Gap Width#10 (1.25” nom.) 1.30” ± 0.01 (short axis)
1.40” ± 0.01 (long axis)110 ± 20 mil 1-6 mil
#6 (0.75” nom.) Ontario 0.70” ± 0.02 (short axis)0.78” ± 0.02 (long axis)
42 ± 5 mil130 ± 10 mil
Not measured
#6 (0.75” nom.) Demonstration 0.78” ± 0.01 (short axis)0.88” ± 0.01 (long axis)
45.5 ± 8 mil53 ± 10 mil
1-6 mil
Conclusions
The material exhibited several problems that may have serious consequences in both the short- andlong-term:
• Lack of metallurgical bond between core and cladding—This problem can lead to voids atthe core-cladding interface. The full effect of these voids is hard to predict, but they couldlead to premature cracking of the cladding and significantly reduce the resistance of thematerial to corrosion. All samples examined displayed a continuous gap at the core-claddinginterface. These gaps were 30 to 150 µm (about 1-5 mils) in thickness. As the samples werecut prior to examination, the interfacial gap may be due to the cutting process. A sample wasprocessed by cutting the cladding in one position and then pulling the cladding off with apliers. The cladding was removed easily and the now exposed core-cladding interface
SD2000-04 Final Report 5 November 2001
indicated only 2-3 areas of core-cladding contact, making up 10-20% of the total possiblecontact area.
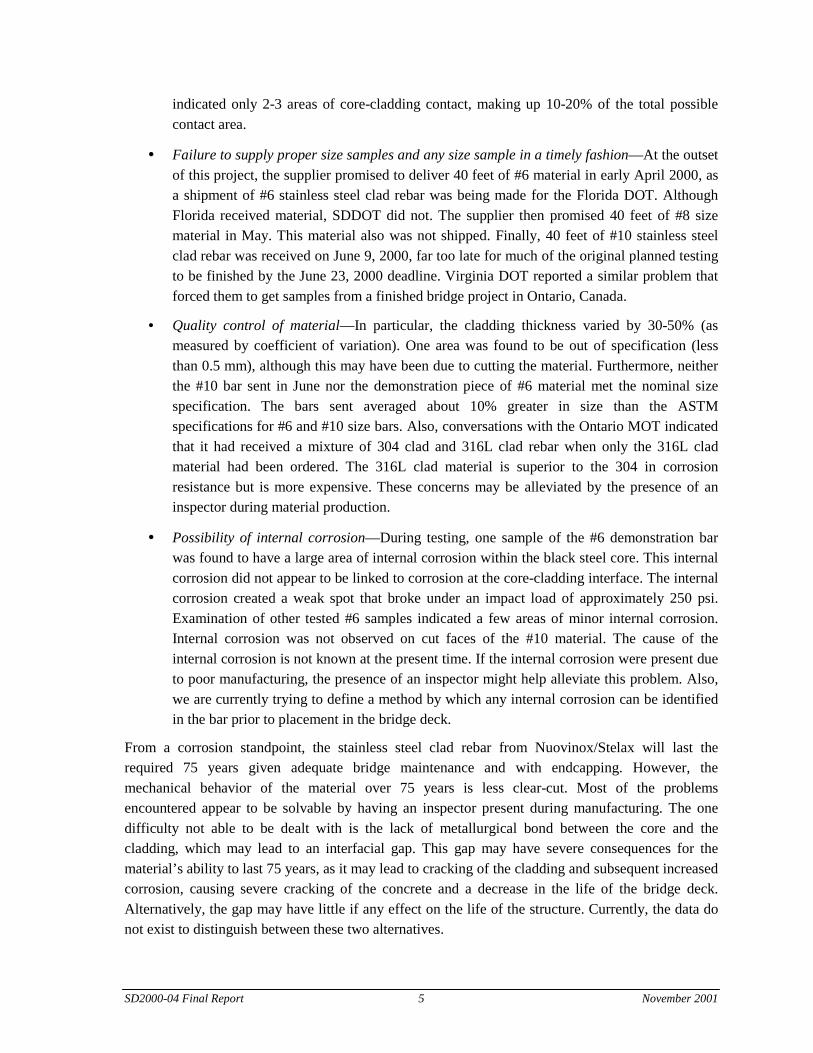
• Failure to supply proper size samples and any size sample in a timely fashion—At the outsetof this project, the supplier promised to deliver 40 feet of #6 material in early April 2000, asa shipment of #6 stainless steel clad rebar was being made for the Florida DOT. AlthoughFlorida received material, SDDOT did not. The supplier then promised 40 feet of #8 sizematerial in May. This material also was not shipped. Finally, 40 feet of #10 stainless steelclad rebar was received on June 9, 2000, far too late for much of the original planned testingto be finished by the June 23, 2000 deadline. Virginia DOT reported a similar problem thatforced them to get samples from a finished bridge project in Ontario, Canada.
• Quality control of material—In particular, the cladding thickness varied by 30-50% (asmeasured by coefficient of variation). One area was found to be out of specification (lessthan 0.5 mm), although this may have been due to cutting the material. Furthermore, neitherthe #10 bar sent in June nor the demonstration piece of #6 material met the nominal sizespecification. The bars sent averaged about 10% greater in size than the ASTMspecifications for #6 and #10 size bars. Also, conversations with the Ontario MOT indicatedthat it had received a mixture of 304 clad and 316L clad rebar when only the 316L cladmaterial had been ordered. The 316L clad material is superior to the 304 in corrosionresistance but is more expensive. These concerns may be alleviated by the presence of aninspector during material production.
• Possibility of internal corrosion—During testing, one sample of the #6 demonstration barwas found to have a large area of internal corrosion within the black steel core. This internalcorrosion did not appear to be linked to corrosion at the core-cladding interface. The internalcorrosion created a weak spot that broke under an impact load of approximately 250 psi.Examination of other tested #6 samples indicated a few areas of minor internal corrosion.Internal corrosion was not observed on cut faces of the #10 material. The cause of theinternal corrosion is not known at the present time. If the internal corrosion were present dueto poor manufacturing, the presence of an inspector might help alleviate this problem. Also,we are currently trying to define a method by which any internal corrosion can be identifiedin the bar prior to placement in the bridge deck.
From a corrosion standpoint, the stainless steel clad rebar from Nuovinox/Stelax will last therequired 75 years given adequate bridge maintenance and with endcapping. However, themechanical behavior of the material over 75 years is less clear-cut. Most of the problemsencountered appear to be solvable by having an inspector present during manufacturing. The onedifficulty not able to be dealt with is the lack of metallurgical bond between the core and thecladding, which may lead to an interfacial gap. This gap may have severe consequences for thematerial’s ability to last 75 years, as it may lead to cracking of the cladding and subsequent increasedcorrosion, causing severe cracking of the concrete and a decrease in the life of the bridge deck.Alternatively, the gap may have little if any effect on the life of the structure. Currently, the data donot exist to distinguish between these two alternatives.
SD2000-04 Final Report 6 November 2001
Implementation Recommendations
1. Based upon this research, the use of the stainless steel clad rebar is not recommended. Whilethe stainless steel clad material from Stelax, Ltd. appears to give sufficient corrosionresistance to achieve a 50-75 year life span if the ends are epoxy-coated or welded with acorrosion resistant material, the lack of metallurgical bonding between the cladding and corecomplicates the analysis to such an extent that the long term effects are difficult to predict.As the stability of the cladding over the life of the bridge deck can not be guaranteed, thestainless steel clad rebar should not be used. In addition, several problems with qualitycontrol of the SSC rebar again make the use of this material problematic.
2. If this material is used despite the above recommendation, an inspector should go to themanufacturing site and oversee the production of the stainless steel clad rebar for use inSouth Dakota bridge decks. Florida DOT did this and Virginia DOT is planning on doingthis. An inspector might help alleviate some of the quality control issues mentionedpreviously.
3. It is recommended that alternative materials be tested for their corrosion resistance and otherproperties similar to the SSC rebar tested in this work. During the course of this work,several other corrosion resistant rebar materials were found and will soon be produced. Inparticular, a Texas company, SMI-CMC, is beginning to produce stainless steel clad rebar bythe Osprey process. The Osprey process material has the advantage of creating ametallurgical bond between the stainless steel cladding and the black steel core. Also, thestainless steel can be clad at any thickness from approximately 1 mil to about 2 inches withvery little variation in the film thickness. The anticipated cost for this material is about 2-5times that of typical rebar. In addition to the Osprey process material, a California company,MMFX, is beginning production of two new types of corrosion resistant rebar material.These two material are a microcomposite steel with approximately 13% chromium and adual-phase ferritic steel.
SD2000-04 Final Report 7 November 2001
PROBLEM DESCRIPTION
The ongoing problem of corrosion of reinforcing steel in bridge decks has been addressed in SouthDakota with increased concrete cover and the use of epoxy-coated rebars (ECR). To date, thesemeasures appear to have worked well in extending bridge deck life significantly. With thedevelopment of new materials and technologies, the potential for increasing deck life may be evengreater. One of these new materials is stainless steel clad (SSC) reinforcement from Stelax, Ltd. thatconsists of black steel clad with 316L stainless steel during fabrication. The stainless steel claddingis much less susceptible to corrosion than black steel and may provide the means for preventingcorrosion from deicing salts throughout the life of a structure.
The literature on stainless steel corrosion identifies one ion as capable of causing pitting, stresscorrosion cracking and intergranular corrosion in the 300 series of stainless steels. This ion is thechloride (Cl-) ion. This susceptibility to chloride ion raises questions concerning the performance ofSSC reinforcement over the estimated 75-year life of the proposed bridge deck. In addition, the cutbar ends have exposed black steel and will be much more likely to corrode than the rest of the barwithout some form of end treatment to protect them. At the same time, questions have been raisedconcerning the performance of epoxy-coated reinforcement due to failures in high chlorideenvironment within 3 years. Although the first epoxy-coated reinforcement bridge decks constructedin South Dakota exhibit no evidence of deterioration after more than twenty years, a recent attemptto evaluate their corrosion resistance in-situ was hampered by the low concentration of chloride ionsat steel depth.
The purpose of this research was to evaluate the potential corrosion resistance of both SSC and ECRusing laboratory tests and, based on the results of these tests, design, construct and evaluate a bridgedeck reinforced with SSC bars. The research was to provide information on the constructability andeffectiveness of SSC bridge decks as well as performance and cost-effectiveness data on both SSCand ECR systems.

SD2000-04 Final Report 8 November 2001
SD2000-04 Final Report 9 November 2001
RESEARCH OBJECTIVES
Three primary objectives of this research were identified.
1) Determine the corrosion-resistance of SSC compared to ECR reinforcement as well asthe mechanical properties, quality and suitability of SSC for use in bridge decks.
2) Develop design, construction, and evaluation procedures for building a bridge deckusing SSC.
3) Estimate life expectancy and cost effectiveness of SSC, ECR, and black steelreinforcement in South Dakota.
The second objective—to design, construct, and evaluate an actual bridge deck—was not pursuedbecause the research performed to accomplish the first objective did not support the suitability ofSSC in bridge decks.

SD2000-04 Final Report 10 November 2001
SD2000-04 Final Report 11 November 2001
TASK DESCRIPTION
This research plan was to be achieved by a team from South Dakota School of Mines andTechnology and the South Dakota Department of Transportation cooperatively accomplishing thefollowing tasks.
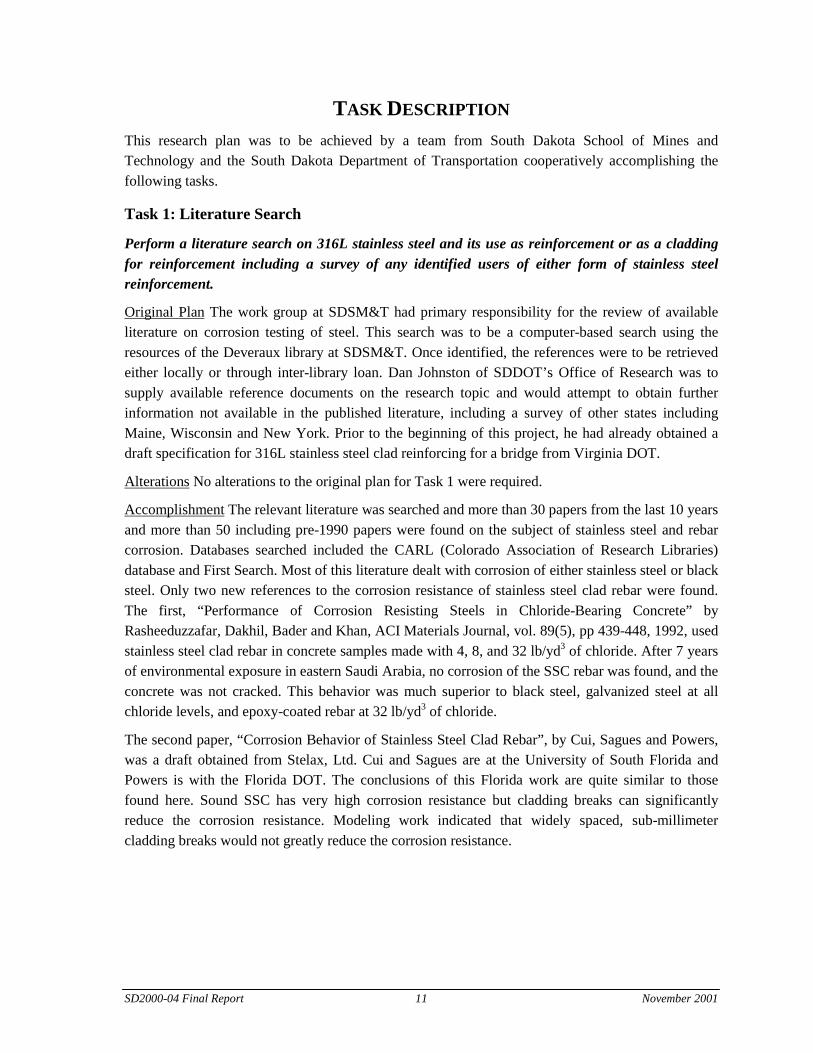
Task 1: Literature Search
Perform a literature search on 316L stainless steel and its use as reinforcement or as a claddingfor reinforcement including a survey of any identified users of either form of stainless steelreinforcement.
Original Plan The work group at SDSM&T had primary responsibility for the review of availableliterature on corrosion testing of steel. This search was to be a computer-based search using theresources of the Deveraux library at SDSM&T. Once identified, the references were to be retrievedeither locally or through inter-library loan. Dan Johnston of SDDOT’s Office of Research was tosupply available reference documents on the research topic and would attempt to obtain furtherinformation not available in the published literature, including a survey of other states includingMaine, Wisconsin and New York. Prior to the beginning of this project, he had already obtained adraft specification for 316L stainless steel clad reinforcing for a bridge from Virginia DOT.
Alterations No alterations to the original plan for Task 1 were required.
Accomplishment The relevant literature was searched and more than 30 papers from the last 10 yearsand more than 50 including pre-1990 papers were found on the subject of stainless steel and rebarcorrosion. Databases searched included the CARL (Colorado Association of Research Libraries)database and First Search. Most of this literature dealt with corrosion of either stainless steel or blacksteel. Only two new references to the corrosion resistance of stainless steel clad rebar were found.The first, “Performance of Corrosion Resisting Steels in Chloride-Bearing Concrete” byRasheeduzzafar, Dakhil, Bader and Khan, ACI Materials Journal, vol. 89(5), pp 439-448, 1992, usedstainless steel clad rebar in concrete samples made with 4, 8, and 32 lb/yd3 of chloride. After 7 yearsof environmental exposure in eastern Saudi Arabia, no corrosion of the SSC rebar was found, and theconcrete was not cracked. This behavior was much superior to black steel, galvanized steel at allchloride levels, and epoxy-coated rebar at 32 lb/yd3 of chloride.
The second paper, “Corrosion Behavior of Stainless Steel Clad Rebar”, by Cui, Sagues and Powers,was a draft obtained from Stelax, Ltd. Cui and Sagues are at the University of South Florida andPowers is with the Florida DOT. The conclusions of this Florida work are quite similar to thosefound here. Sound SSC has very high corrosion resistance but cladding breaks can significantlyreduce the corrosion resistance. Modeling work indicated that widely spaced, sub-millimetercladding breaks would not greatly reduce the corrosion resistance.

SD2000-04 Final Report 12 November 2001
Task 2: Develop Work Plan
Cooperatively develop a work plan including a testing plan.
Original Plan The original work plan was based primarily upon two meetings of involved projectmembers held December 28, 1999 and January 20, 2000 at the SDSM&T campus. Adjustments tothe work plan were to be made after a review of preliminary data compiled after these meetings andafter discussions with the technical panel to address any necessary modifications to the work plan.
Alterations No alterations to the original plan for Task 2 were required.
Accomplishments The work plan was developed in meetings held December 28, 1999 and January20, 2000 on the SDSM&T campus. Adjustments to the work plan were made as described in theupcoming task descriptions.
Task 3: Meet with Technical Panel
Meet with the technical panel to discuss the project and scope of work plan.
Original Plan The research team was to meet with the technical panel to discuss the research shortlyafter the research contract was awarded.
Alterations No alterations to the original plan for Task 3 were required.
Accomplishments Dr. Cross met with the technical panel June 30, 2000 and discussed the projectand the work plan.
Task 4: Conduct Laboratory Tests
Conduct a series of laboratory tests on SSC as outlined in the Virginia DOT draft specifications.
Original Plan Dan Johnston was to be responsible for determining the mechanical properties of theSSC material. These tests were to include determining the yield strength, tensile strength andelongation of the SSC rebar. The Virginia DOT specifications for these properties were minimumyield strength 420 MPa, minimum tensile strength 620 Mpa, and minimum elongation 9%.
The mechanical properties of the SSC rebar were to be measured by applying the procedures givenin ASTM E-8. The yield strength, tensile strength and elongation were to be measured on 5 samplesfrom 5 different bars to obtain a statistical representation of the properties. Also, the pull-outproperties of the SSC rebar were to be measured.
SDSM&T was to be primarily responsible for the determination of the thickness and continuity ofthe cladding, and of the chemical composition of the cladding and core. These were to be determinedby image analysis and SEM imaging for the thickness and continuity, and SEM elemental mappingand point analyses for the composition.
Alterations No alterations to the original plan for Task 4 were required.
Accomplishments The mechanical properties of the SSC rebar were determined from stress-straincurves obtained according to ASTM E-8. The SSC rebar used was obtained from the OntarioMinistry of Transportation (MOT) as the material obtained from Stelax, Ltd. did not fit in the testing

SD2000-04 Final Report 13 November 2001
machine. The elongation and tensile strength were greater than the Virginia DOT specifications. Thetensile modulus exceeded the specifications when the nominal diameter was utilized, but not whenthe measured maximum diameter was used. Similar questions concerning the mechanical propertieswere found by Florida and Oregon DOTs. In addition, the failure of the tested bars was examinedand the cladding and core were found to fail separately and in different manners. The claddingexhibited a more brittle failure than the core and a large gap was found between the cladding andcore after mechanical testing.
As the thickness and continuity of cladding and chemical composition of both the cladding and corewere also a primary concern of Task 7, these results will be presented in Task 7.
Task 5: Test Corrosion Resistance
Conduct a series of statistically valid comparative tests of corrosion resistance on SSC/ECR/316Land black steel reinforcement, all both with and without defects, to determine general corrosionproperties both inside and outside concrete, stress and pitting corrosion properties and endtreatment effectiveness and provide recommendation for end treatment.
Original Plan SDSM&T was to be primarily responsible for the completion of this task. At least 4samples of the various reinforcement materials were to be tested by polarization resistance under avariety of solution conditions to determine their corrosion resistance outside of concrete. Also, SSCwas to be subjected to thermal cycling to examine the effect of thermal mismatch on thisreinforcement. For in-concrete testing, mortar cubes (2” sides) were to be made containing a 1” pieceof reinforcement. The corrosion behavior was to be measured using copper/copper sulfate half-cellpotential measurements and linear polarization. End treatments considered were none, epoxy-coated,metallized ends, and welded stainless steel. The effectiveness of the end treatments was to bedetermined primarily without concrete.
The life of the reinforcement material was to be estimated by comparison with known values forblack steel reinforcement and from the corrosion data obtained, particularly from polarizationresistance measurements. Galvanic testing between SSC and black steel were to be performed. Also,minimum potentiostatic testing of the stainless steel clad material was to be performed to determineconditions for pitting corrosion occurrence. This was to be performed at pH13 with different chlorideion concentrations.
Corrosion Testing
Corrosion testing of concrete reinforcing materials goes back at least 30 years, and several testmethods have been developed. For this work the corrosion testing of the various reinforcingmaterials was to be performed in the following manner:
SD2000-04 Final Report 14 November 2001
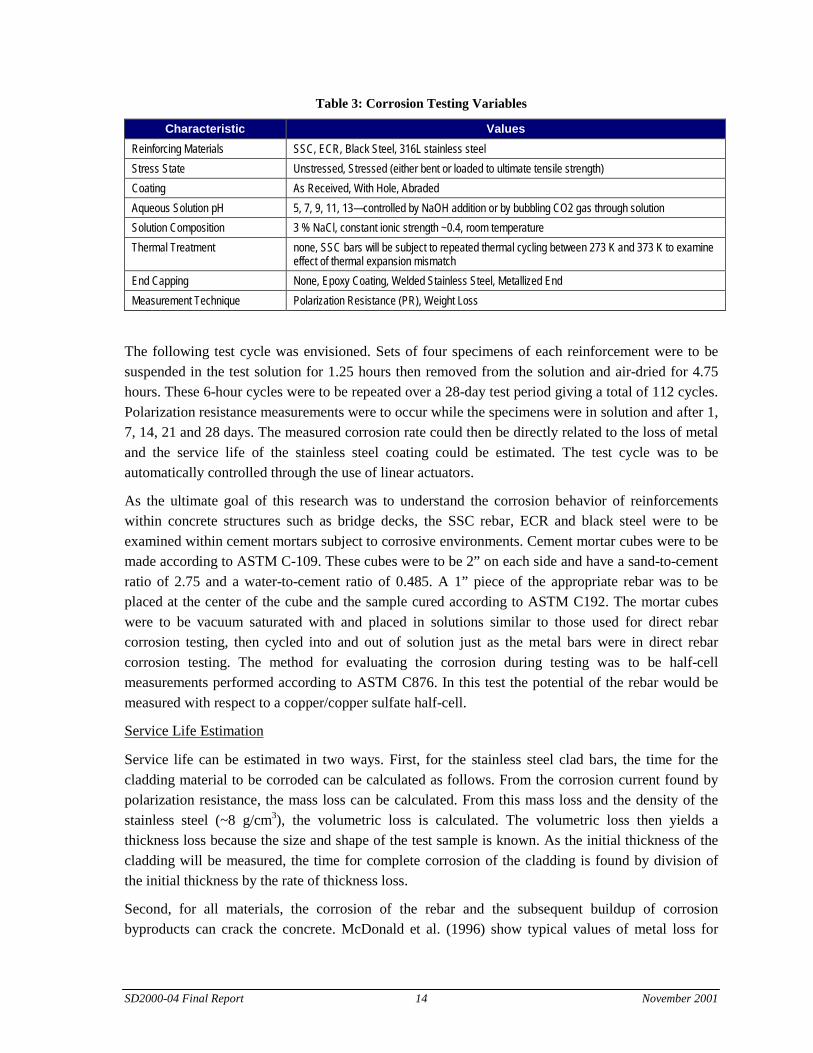
Table 3: Corrosion Testing Variables
Characteristic ValuesReinforcing Materials SSC, ECR, Black Steel, 316L stainless steelStress State Unstressed, Stressed (either bent or loaded to ultimate tensile strength)Coating As Received, With Hole, AbradedAqueous Solution pH 5, 7, 9, 11, 13—controlled by NaOH addition or by bubbling CO2 gas through solutionSolution Composition 3 % NaCl, constant ionic strength ~0.4, room temperatureThermal Treatment none, SSC bars will be subject to repeated thermal cycling between 273 K and 373 K to examine
effect of thermal expansion mismatchEnd Capping None, Epoxy Coating, Welded Stainless Steel, Metallized EndMeasurement Technique Polarization Resistance (PR), Weight Loss
The following test cycle was envisioned. Sets of four specimens of each reinforcement were to besuspended in the test solution for 1.25 hours then removed from the solution and air-dried for 4.75hours. These 6-hour cycles were to be repeated over a 28-day test period giving a total of 112 cycles.Polarization resistance measurements were to occur while the specimens were in solution and after 1,7, 14, 21 and 28 days. The measured corrosion rate could then be directly related to the loss of metaland the service life of the stainless steel coating could be estimated. The test cycle was to beautomatically controlled through the use of linear actuators.
As the ultimate goal of this research was to understand the corrosion behavior of reinforcementswithin concrete structures such as bridge decks, the SSC rebar, ECR and black steel were to beexamined within cement mortars subject to corrosive environments. Cement mortar cubes were to bemade according to ASTM C-109. These cubes were to be 2” on each side and have a sand-to-cementratio of 2.75 and a water-to-cement ratio of 0.485. A 1” piece of the appropriate rebar was to beplaced at the center of the cube and the sample cured according to ASTM C192. The mortar cubeswere to be vacuum saturated with and placed in solutions similar to those used for direct rebarcorrosion testing, then cycled into and out of solution just as the metal bars were in direct rebarcorrosion testing. The method for evaluating the corrosion during testing was to be half-cellmeasurements performed according to ASTM C876. In this test the potential of the rebar would bemeasured with respect to a copper/copper sulfate half-cell.
Service Life Estimation
Service life can be estimated in two ways. First, for the stainless steel clad bars, the time for thecladding material to be corroded can be calculated as follows. From the corrosion current found bypolarization resistance, the mass loss can be calculated. From this mass loss and the density of thestainless steel (~8 g/cm3), the volumetric loss is calculated. The volumetric loss then yields athickness loss because the size and shape of the test sample is known. As the initial thickness of thecladding will be measured, the time for complete corrosion of the cladding is found by division ofthe initial thickness by the rate of thickness loss.
Second, for all materials, the corrosion of the rebar and the subsequent buildup of corrosionbyproducts can crack the concrete. McDonald et al. (1996) show typical values of metal loss for

SD2000-04 Final Report 15 November 2001
cracking to occur. These values range from 0.0013 to 0.038 mm, with an average of 0.014 mm.Thus, using the thickness loss, the time to cracking can be determined. Table 4 shows the currentdensity values that give various years until failure assuming 1 mil of corrosion causes cracking
Table 4: Estimated Time to Cracking for Various Current Density and PR Values
Average current densitiesYears required for 0.0254 mm (0.001in) metal loss and concrete cracking A/m2 mA/ft2
Average PR,ohm*m2
1 0.02180 2.030 1.1910 0.00220 0.200 11.9250 0.00040 0.040 60.4775 0.00029 0.027 89.4100 0.00022 0.020 119.2
Life Cycle Cost Estimation
A life cycle cost analysis model developed as part of an FHWA research project on bridge paintingwas to be used to determine life cycle cost parameters for stainless steel clad, epoxy-coated andblack steel reinforcement. The model is described in Issues Impacting Bridge Painting: An Overviewby T. Bernicki et al. of Northwestern University. The model is based on computing the equivalentuniform annual cost (EUAC) and allows comparison of alternative choices on the basis of initial costper square foot and expected life. The effects of interest rate, inflation, present and future worth andmaintenance over a projected life are considered in the model and can be applied to reinforcementtype with only slight modification. The best aspect of this model is its graphical output, which allowsdirect visual comparison of alternatives based on initial cost, required maintenance, the currentinterest rate, and the current rate of inflation over the projected life of each system.
Alterations Due to problems in delivery of SSC rebar to be tested, a revised testing protocol wasperformed to enable recommendations to be made by the deadline of the technical panel meeting ofJune 30, 2000. At the start of this work, the supplier was contacted and 40 feet of #6 size bar wasrequested. The supplier indicated that the bar would be supplied within 2-4 weeks as the supplier wasfinishing an order for Florida DOT of the same size and type material and that SDDOT’s 40 feetcould be made at the end of the Florida DOT run. After approximately 5 weeks, the supplier wasagain contacted about the material. There was no #6 bar for this work; instead, the supplier was nowmaking #8 bar and could send the required amount in about 2 weeks at the end of the current run.This material was not sent either. Finally, 40 feet of #10 bar was received on June 9, 2000. This wasfar too late for the original testing plan to be completed, as the tests lasted 28 days. Therefore, anaccelerated program was initiated using a small amount of nominally #6 bar that had originally beenintended as an illustrative piece.
The accelerated testing protocol utilized was as follows: 1” sections were cut from a piece of #6stainless steel clad reinforcing bar given to SDDOT to demonstrate the product. Two of thesesections were not end-capped, two were end-capped with an epoxy coating, and two were coated in316L stainless steel. These sections and two pieces of #6 black bar were corrosion tested in a 3%NaCl solution at pH6 and at 60 °C. To help accelerate the corrosion, the samples were dipped into
SD2000-04 Final Report 16 November 2001
the solution for 2 hours and then removed from solution for 4 hours. This cycle was repeatedcontinually for the duration of the test. These tests were performed for approximately 10 days toestimate the corrosion resistance of the stainless steel clad reinforcing bar.
Finally, following meeting with the technical panel in conjunction with Task 8, the researchers wererequested to suspend further investigation following the completion of the experiments then beingperformed. Therefore, neither testing of the epoxy-coated rebar nor the in-concrete testing wasperformed, as the final group of experiments was the PR testing of the bars outside of concrete. Also,testing of SSC rebar was limited to pHvalues of 5 and 12.5 due to this requested suspension of work.
Accomplishments With epoxy end coating the estimated life of the SSC rebar in bridge decks wasapproximately 60-90 years, depending upon the pH. Abrasion did not significantly reduce theestimated life at either pH5 or 12.5. Welded end caps did not exhibit significantly different behaviorat pH12.5, but they performed poorly at pH5. A stainless steel spray coat proved to be little moreeffective than no coating at all. SSC rebar with uncoated ends was not significantly superior tosimply using standard black steel. Drilling a 1/16” hole in the cladding reduced the life estimate atpH12.5 by about 33% to 40 years. At pH5, the 1/16” hole in the cladding reduced the life estimate byabout 75% to 25 years.
There was little difference between the predicted lives of the 316L coated rebar and the 304 coatedrebar tested using the accelerated testing protocol. The 304 coated rebar did, as expected, showslightly more corrosion than the 316L stainless steel coated rebar. However, the conditions were notthe same so that the accelerated testing protocol was assumed to be equivalent to the pH12.5 testingprotocol to determine the life expectancy.
Task 6: Analyze Corrosion Effects
Analyze corrosion effects on all types of steel tested as well as interfacial effects on SSC and ECRusing scanning electron microscopy.
Original Plan SDSM&T was to be primarily responsible for completion of this task. All sampleswere to be autopsied by SEM after treatment to determine any structural or morphological changesor by-products produced by corrosion testing. This was to include elemental mapping and visualconsideration of images.
Following corrosion testing, the metal samples were to be examined by scanning electronmicroscopy (SEM) to investigate the effects of corrosion on the structure and composition of themetal. Digital images were to be acquired at a range of magnifications appropriate to show thesurface morphology and the structure of the steel both before and after testing. In particular, thesurface of the bars was to be examined before and after corrosion testing to document the extent,physical appearance and elemental composition of uncorroded and corroded surfaces. Polishedcross-sections of the metal were to be prepared from samples before and after testing to determinethe elemental composition, and the advance of corrosion with respect to the pre-test surface.
Alterations Due to the recommendations of the technical panel following receipt of the technicalmemorandum in Task 8, only the accelerated test protocol samples were examined by SEM.
SD2000-04 Final Report 17 November 2001
Accomplishments Preliminary analysis of the pre-corrosion samples and some of the post-corrosionsamples was performed, but as little was done prior to the decision of the technical panel to end theresearch project soon after the June 30, 2000 meeting, the examination of corrosion effects wasstopped. Therefore, the analysis performed for this task only considers the first set of acceleratedsamples run under solution conditions of pH6, 3% NaCl and 60°C. The primary corrosion by-product was iron oxide as expected. No major differences were found in the composition of the core.Also some of the samples tested exhibited internal corrosion prior to testing. This is indicative ofpoor steel quality and would be expected to have deleterious effects on the performance of the SSCrebar.
Task 7: Evaluate Cladding Uniformity, Thickness Variability, and Deformation Effects
Provide evaluation of cladding uniformity, thickness variability and effects due to deformationprofile on #4, #5 and #6 reinforcement randomly obtained.
Original Plan SDSM&T was to be primarily responsible for this task. To achieve the objectives ofthis research project several other test procedures needed to be performed. The stainless steelcladding needed be examined to measure the continuity, thickness and composition. Theseexperiments were to be performed by SEM and image analysis. The composition measurement hasalready been described. For the continuity and thickness measurements, at least 5 pieces from 5different SSC bars were to be obtained. The continuity was to be determined by visual examinationof the image analysis and SEM images to ensure that all black steel core was covered with cladding.Thickness measurements were to be performed from the same images as continuity analysis. Thecladding thickness was to be determined from at least 4 points on each image. The claddingthickness determined by SEM and image analysis was to be compared to that found by magneticthickness gage measurements, to determine if the gage will work as a field test procedure.
Alterations Due to the recommendations of the technical panel following receipt of the technicalmemorandum in Task 8 and the receipt of #10 bar rather than #6 bar, the uniformity and claddingthickness were measured primarily on #10 and a demonstration piece #6 bar. As field measurementswere not to be undertaken, no comparisons of thickness measurements to magnetic gagemeasurements were performed.
Accomplishments Pull-away of the cladding from the core and large differences in claddingthickness were found for the demonstration #6 bar. The average cladding thickness for sample 1 was1152.5 µm (about 45.5 mil) with a coefficient of variation of 42%. The smallest thickness measuredwas 261 µm, about half the minimum specification. For sample 2, the average cladding thicknesswas 1349 µm (about 53 mil) with a coefficient of variation of 55.6%. The smallest claddingthickness measured on this sample was 550 µm. For the demonstration #6 bar, the short axisdiameter was 0.778” and the long axis diameter 0.885”, with a coefficient of variation of 1.5 and3.8%, respectively. These axis diameters are both greater than the 0.75” nominal diameter for #6 bar.
The cladding thickness for the #10 bar was found to be 2.719 mm (about 0.11”) with a coefficient ofvariation of 34%. The long and short axis diameters were determined to be 1.30” and 1.40”,respectively. The coefficient of variation of the diameters were both less than 1%. The nominal
SD2000-04 Final Report 18 November 2001
diameter for a #10 bar is 1.25”. Once again, the supplied material was slightly larger than thenominal diameter for the specified size. The #6 bar obtained from Ontario MOT did appear to becloser to the nominal size than the demonstration bar, but the bar size was variable between 0.70”and 0.78”. The thinnest cladding areas always appeared at the transition point between the short axisand long axis.
Task 8: Interim Report
Submit an interim report no later than June 23, 2000 estimating SSC and concrete service life andproviding a recommendation of whether SSC should be incorporated into a bridge deck includingany necessary modifications to design or construction procedures as well as a preferred concretemix design to maximize performance. If the recommendation is not to use SSC, tasks 9-11 neednot be accomplished.
Original Plan This task was to be accomplished by both SDSM&T and SDDOT based on thefindings in tasks 4-7. The recommended concrete mix design was to be based on a thoroughliterature search, laboratory testing and the preliminary results of SD2000-06 Optimized Fly AshContent in PCC for Structures. Recommendations for appropriate materials for use as ties and chairswere to be included along with any construction procedure modifications required were to beincluded in the Technical Memorandum. Potential problems with galvanic corrosion between SSCreinforcement and any substructure steel were to be addressed to minimize these problems.
Alterations No alterations to this task were necessary.
Accomplishments An interim report was submitted on June 23, 2000 prior to the meeting with thetechnical panel on June 30, 2000. Following this meeting, the technical panel recommended thatexperimental work be suspended on this project.
Task 9: Develop Long-Term Evaluation Plan
Develop a long-term evaluation plan, including any plan notes required for installation of testinginstrumentation or samples, if necessary.
Original Plan Both SDSM&T and SDDOT were to be involved in developing a long-term evaluationplan based on the in-concrete research in task 5. Proposed in-place monitoring equipment consistedof three or more system negative connections (#8 AWG wires connected to the reinforcement andstrung to three access ports along the edge of the structure, depending on the deck design, with theconnections coated with nonconductive epoxy) for measuring Cu/CuSO4 half-cell potentials. Sixprobes comprising a short length of SSC #4 rebar tied to an equal length of the same size epoxy-coated or black steel (three of each) were to be installed near the surface of the deck with #8 AWGwires run from each of the bars to access ports to determine whether any galvanic corrosion wastaking place. Three conductivity probes (developed as part of SD98-06 High Performance ConcreteStructures) were also to be wired to the top mat of reinforcement to monitor concrete permeability inthe deck over time.
Alterations Due to the recommendations of the technical panel following receipt of the technicalmemorandum in Task 8, this task was not undertaken.
SD2000-04 Final Report 19 November 2001
Task 10: Monitor Construction
Monitor construction to observe constructability and insure any in-place monitoring equipment isproperly installed.
Original Plan The constructability evaluation was to be primarily the responsibility of SDDOT,while the in-place monitoring equipment installation was to be supervised by both SDDOT andSDSM&T personnel. In addition, concrete test cylinders and beams were to be prepared duringconstruction for measuring compressive and flexural strengths at 7, 14, 28 and 90 days. Relativehumidity, temperature and wind speed were to be monitored throughout construction. Any deviationsfrom standard construction procedures or problems with construction were to be documented.
Prior to construction, a calibrated magnetic thickness gauge was to be used to randomly samplecladding thickness on reinforcement throughout the deck area. Any reinforcement not meeting thespecification minimum of 0.5 mm was to be rejected. If sufficient failures were found during therandom sampling, a systematic survey of cladding thickness on all reinforcement was to beconducted to determine the actual extent of the problem.
Alterations Due to the recommendations of the technical panel following receipt of the technicalmemorandum in Task 8, this task was not undertaken.
Task 11: Evaluate Structure
Perform evaluation of structure during the first year after construction.
Original Plan Structural evaluation was to be performed by SDDOT. It was to include a Cu/CuSO4
half-cell potential survey immediately after construction was completed and the following spring andsummer. Cracking surveys were to be made as soon as practicable after construction, duringmidwinter and the following spring and summer. Additional surveys of either type were to beconducted as needed either by Mr. Dan Johnston or other SDDOT personnel. During this sameperiod, conductivity and galvanic corrosion readings were to be obtained with additional readingstaken on a monthly basis until August 2002.
Alterations Due to the recommendations of the technical panel following receipt of the technicalmemorandum in Task 8, this task was not undertaken.
Task 12: Final Report
Make an executive presentation to the SDDOT Research Review Board at the conclusion of theproject.
Original Plan The research team was to make an executive presentation of the research findings,conclusions, and recommendations at the completion of this project. This presentation was to occurin Pierre, SD.
Alterations No alterations to this task were necessary.
Accomplishments An executive presentation was made to the SDDOT Research Review Board onAugust 17, 2000.

SD2000-04 Final Report 20 November 2001
SD2000-04 Final Report 21 November 2001
FINDINGS
Mechanical & Physical Properties
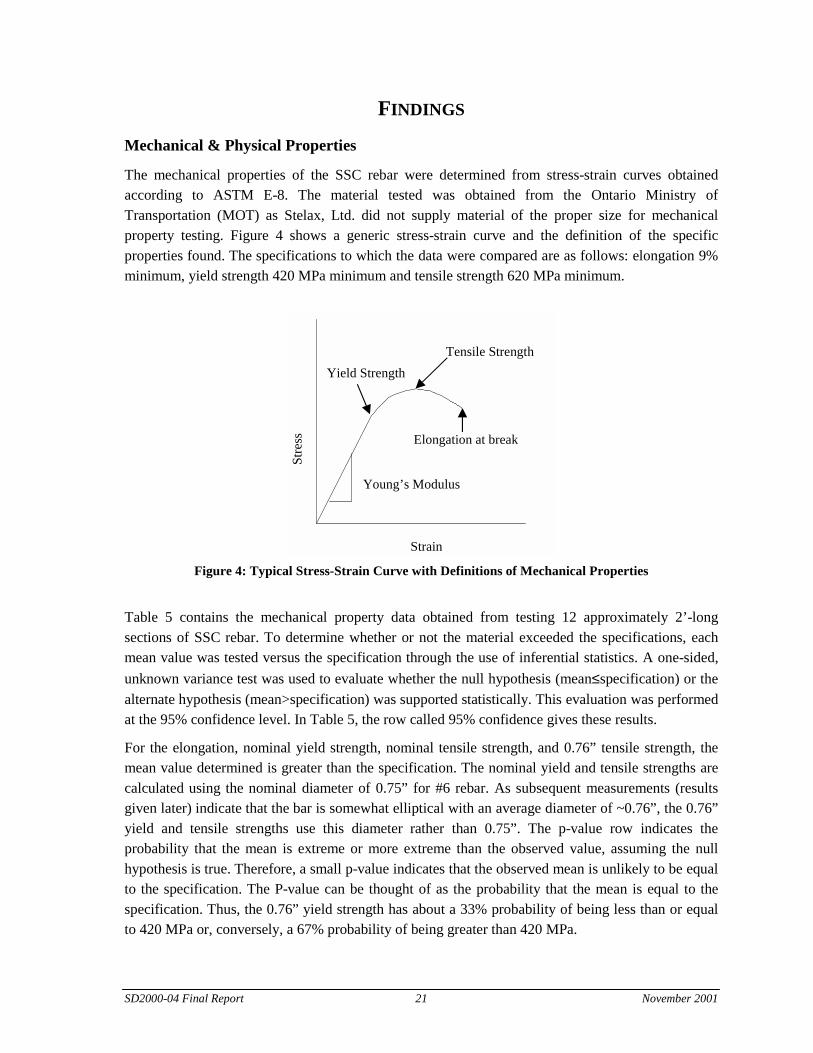
The mechanical properties of the SSC rebar were determined from stress-strain curves obtainedaccording to ASTM E-8. The material tested was obtained from the Ontario Ministry ofTransportation (MOT) as Stelax, Ltd. did not supply material of the proper size for mechanicalproperty testing. Figure 4 shows a generic stress-strain curve and the definition of the specificproperties found. The specifications to which the data were compared are as follows: elongation 9%minimum, yield strength 420 MPa minimum and tensile strength 620 MPa minimum.
Stre
ss
Strain
Young’s Modulus
Tensile StrengthYield Strength
Elongation at break
Figure 4: Typical Stress-Strain Curve with Definitions of Mechanical Properties
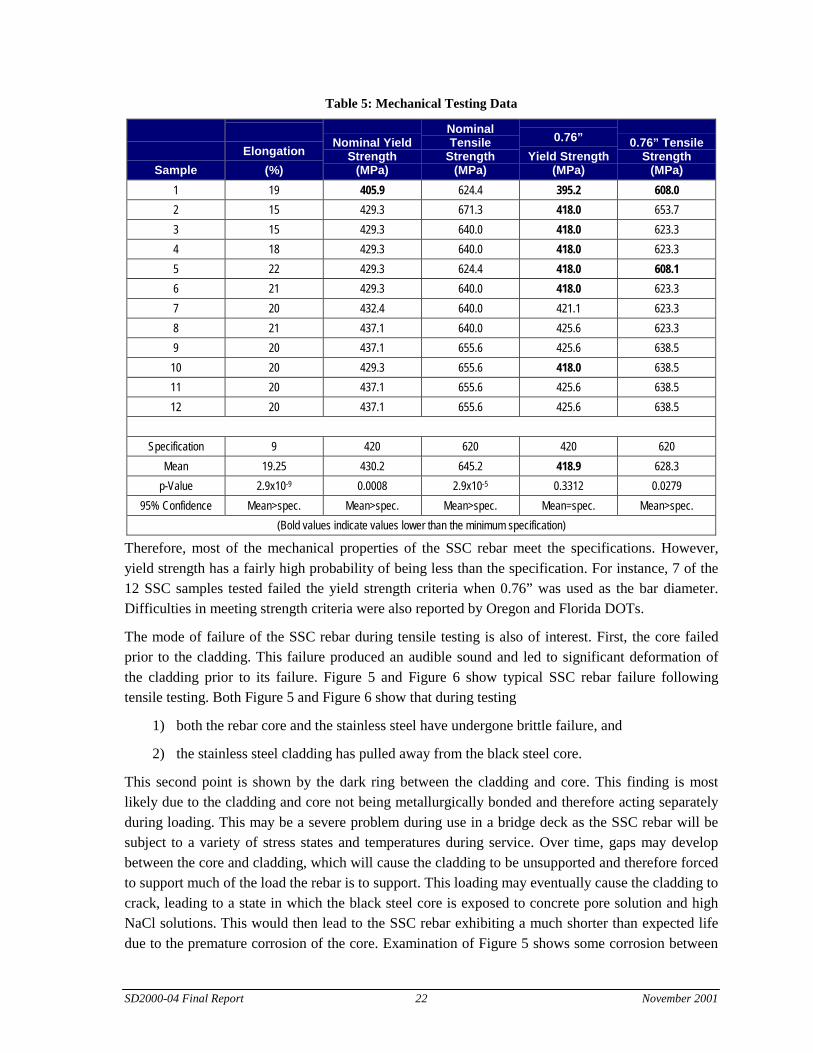
Table 5 contains the mechanical property data obtained from testing 12 approximately 2’-longsections of SSC rebar. To determine whether or not the material exceeded the specifications, eachmean value was tested versus the specification through the use of inferential statistics. A one-sided,unknown variance test was used to evaluate whether the null hypothesis (mean≤specification) or thealternate hypothesis (mean>specification) was supported statistically. This evaluation was performedat the 95% confidence level. In Table 5, the row called 95% confidence gives these results.
For the elongation, nominal yield strength, nominal tensile strength, and 0.76” tensile strength, themean value determined is greater than the specification. The nominal yield and tensile strengths arecalculated using the nominal diameter of 0.75” for #6 rebar. As subsequent measurements (resultsgiven later) indicate that the bar is somewhat elliptical with an average diameter of ~0.76”, the 0.76”yield and tensile strengths use this diameter rather than 0.75”. The p-value row indicates theprobability that the mean is extreme or more extreme than the observed value, assuming the nullhypothesis is true. Therefore, a small p-value indicates that the observed mean is unlikely to be equalto the specification. The P-value can be thought of as the probability that the mean is equal to thespecification. Thus, the 0.76” yield strength has about a 33% probability of being less than or equalto 420 MPa or, conversely, a 67% probability of being greater than 420 MPa.
SD2000-04 Final Report 22 November 2001
Table 5: Mechanical Testing Data
SampleElongation
(%)
Nominal YieldStrength
(MPa)
NominalTensile
Strength(MPa)
0.76”Yield Strength
(MPa)
0.76” TensileStrength
(MPa)1 19 405.9 624.4 395.2 608.02 15 429.3 671.3 418.0 653.73 15 429.3 640.0 418.0 623.34 18 429.3 640.0 418.0 623.35 22 429.3 624.4 418.0 608.16 21 429.3 640.0 418.0 623.37 20 432.4 640.0 421.1 623.38 21 437.1 640.0 425.6 623.39 20 437.1 655.6 425.6 638.510 20 429.3 655.6 418.0 638.511 20 437.1 655.6 425.6 638.512 20 437.1 655.6 425.6 638.5
Specification 9 420 620 420 620Mean 19.25 430.2 645.2 418.9 628.3
p-Value 2.9x10⁻⁹ 0.0008 2.9x10⁻⁵ 0.3312 0.027995% Confidence Mean>spec. Mean>spec. Mean>spec. Mean=spec. Mean>spec.
(Bold values indicate values lower than the minimum specification)
Therefore, most of the mechanical properties of the SSC rebar meet the specifications. However,yield strength has a fairly high probability of being less than the specification. For instance, 7 of the12 SSC samples tested failed the yield strength criteria when 0.76” was used as the bar diameter.Difficulties in meeting strength criteria were also reported by Oregon and Florida DOTs.
The mode of failure of the SSC rebar during tensile testing is also of interest. First, the core failedprior to the cladding. This failure produced an audible sound and led to significant deformation ofthe cladding prior to its failure. Figure 5 and Figure 6 show typical SSC rebar failure followingtensile testing. Both Figure 5 and Figure 6 show that during testing
1) both the rebar core and the stainless steel have undergone brittle failure, and
2) the stainless steel cladding has pulled away from the black steel core.
This second point is shown by the dark ring between the cladding and core. This finding is mostlikely due to the cladding and core not being metallurgically bonded and therefore acting separatelyduring loading. This may be a severe problem during use in a bridge deck as the SSC rebar will besubject to a variety of stress states and temperatures during service. Over time, gaps may developbetween the core and cladding, which will cause the cladding to be unsupported and therefore forcedto support much of the load the rebar is to support. This loading may eventually cause the cladding tocrack, leading to a state in which the black steel core is exposed to concrete pore solution and highNaCl solutions. This would then lead to the SSC rebar exhibiting a much shorter than expected lifedue to the premature corrosion of the core. Examination of Figure 5 shows some corrosion between

SD2000-04 Final Report 23 November 2001
the core and cladding. The effect of breached cladding on the corrosion response of the SSC rebar isdealt with in the next section.
Figure 5: Photograph of Tensile Test Failed SSC Rebar
Figure 6: Photograph of Another Tensile Test Failed SSC Rebar
Cladding Thickness and Continuity
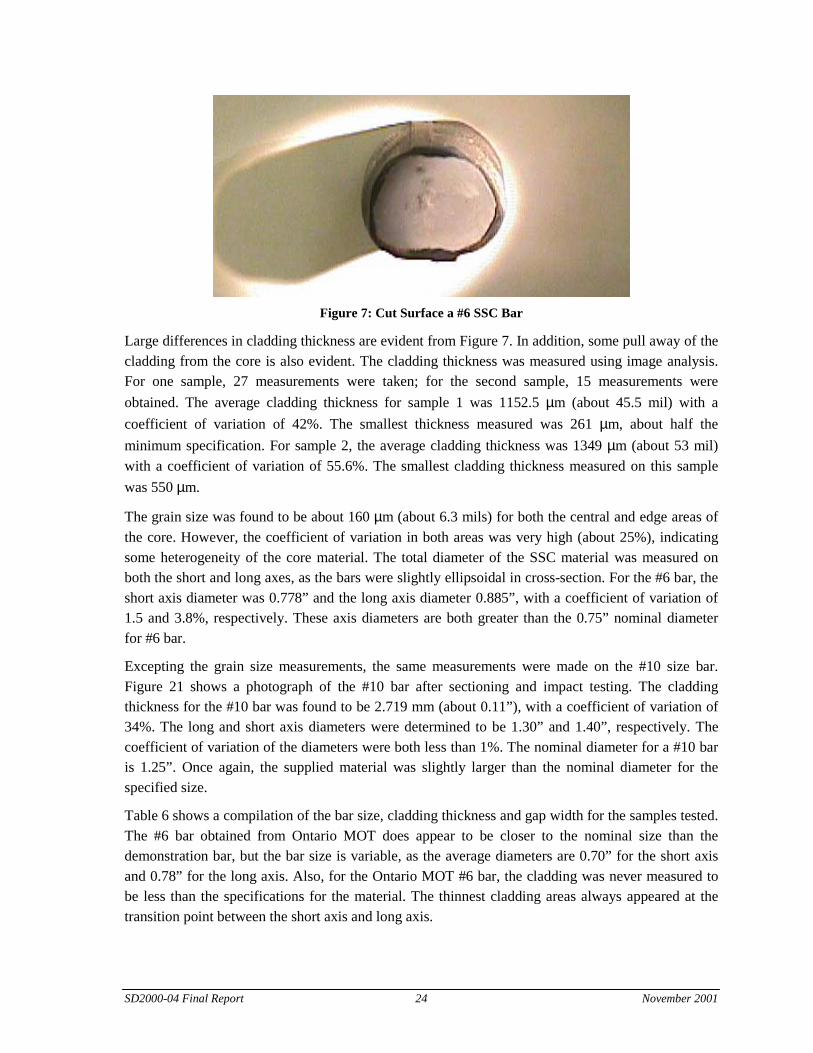
Samples of both #6 and #10 stainless steel clad material were examined to determine their nominalsize, cladding thickness, core homogeneity and thickness of gap between core and cladding. Figure 7shows one of the #6 samples used.
SD2000-04 Final Report 24 November 2001
Figure 7: Cut Surface a #6 SSC Bar
Large differences in cladding thickness are evident from Figure 7. In addition, some pull away of thecladding from the core is also evident. The cladding thickness was measured using image analysis.For one sample, 27 measurements were taken; for the second sample, 15 measurements wereobtained. The average cladding thickness for sample 1 was 1152.5 µm (about 45.5 mil) with acoefficient of variation of 42%. The smallest thickness measured was 261 µm, about half theminimum specification. For sample 2, the average cladding thickness was 1349 µm (about 53 mil)with a coefficient of variation of 55.6%. The smallest cladding thickness measured on this samplewas 550 µm.
The grain size was found to be about 160 µm (about 6.3 mils) for both the central and edge areas ofthe core. However, the coefficient of variation in both areas was very high (about 25%), indicatingsome heterogeneity of the core material. The total diameter of the SSC material was measured onboth the short and long axes, as the bars were slightly ellipsoidal in cross-section. For the #6 bar, theshort axis diameter was 0.778” and the long axis diameter 0.885”, with a coefficient of variation of1.5 and 3.8%, respectively. These axis diameters are both greater than the 0.75” nominal diameterfor #6 bar.
Excepting the grain size measurements, the same measurements were made on the #10 size bar.Figure 21 shows a photograph of the #10 bar after sectioning and impact testing. The claddingthickness for the #10 bar was found to be 2.719 mm (about 0.11”), with a coefficient of variation of34%. The long and short axis diameters were determined to be 1.30” and 1.40”, respectively. Thecoefficient of variation of the diameters were both less than 1%. The nominal diameter for a #10 baris 1.25”. Once again, the supplied material was slightly larger than the nominal diameter for thespecified size.
Table 6 shows a compilation of the bar size, cladding thickness and gap width for the samples tested.The #6 bar obtained from Ontario MOT does appear to be closer to the nominal size than thedemonstration bar, but the bar size is variable, as the average diameters are 0.70” for the short axisand 0.78” for the long axis. Also, for the Ontario MOT #6 bar, the cladding was never measured tobe less than the specifications for the material. The thinnest cladding areas always appeared at thetransition point between the short axis and long axis.
SD2000-04 Final Report 25 November 2001
Table 6: Bar Size, Cladding Thickness, and Gap Width for #10 and #6 Stainless Steel Clad Bars
Type Bar Size Cladding Thickness Gap Width#10 (1.25” nom.) 1.30” ± 0.01 (short axis)
1.40” ± 0.01 (long axis)0.11” ± 0.02 1-6 mil
#6 (0.75” nom.) Ontario 0.70” ± 0.02 (short axis)0.78” ± 0.02 (long axis)
42 ± 5 mil130 ± 10 mil
Not measured
#6 (0.75” nom.) Demonstration 0.78” ± 0.01 (short axis)0.88” ± 0.01 (long axis)
45.5 ± 8 mil53 ± 10 mil
1-6 mil
The cladding composition for the #6 (demonstration) and #10 bar were measured by quantitativeSEM. The #6 Ontario MOT bar was not measured for composition for this work. However, OntarioMOT did measure the composition of some of their bars. Initially, the bars sent were found to be 304stainless steel, but were replaced by 316 clad SSC rebar. From the SEM composition data in Table 7,the demonstration bar is clearly 304L stainless steel as evidenced by the lack of molybdenum in the#6 bar cladding. The #10 bar was found to be 316L stainless steel. Interestingly, the corrosionbehavior was not much different for the #6 and #10 bars, which was not expected given theconditions used in the corrosion tests, where the 316L should outperform the 304L. This may be dueto the carbide inclusions observed in the SEM work.
Table 7: Cladding Composition
Sample Ni Mn Cr Mo Fe316L Specs 10-15 % 2 % max 16-18 % 2-3 % Bal.304L Specs 8-13 % 2 % max 18-20 % 0 % Bal#6 Bar 11.1 % 1.3 % 18 % 0 % ~70 %#10 Bar 10 % 1.2 % 17.1 % 2.3 % ~67 %
#10 bar also contained about 2.5% Si
Corrosion Testing
Due to problems in delivery of SSC rebar to be tested, a revised testing protocol was devised toenable recommendations to be made by the deadline of the technical panel meeting of June 30, 2000.As no other sample was available, a test sample of SSC rebar that had been given by Stelax, Ltd. toSDDOT as a demonstration piece was used for initial corrosion testing. This piece was supposed tobe clad with 316 stainless steel. Subsequent analysis indicated that this sample was actually clad intype 304 stainless. Substitution of 304 for 316 stainless steel was also found by the Ontario Ministryof Transportation (MOT) in Canada when using SSC rebar for a bridge deck. The Ontario MOT alsosupplied SDDOT with samples of #6 size SSC rebar for mechanical testing, as the #10 size barwould not work in the SDDOT testing machines.
Description of Polarization Resistance Tests
Polarization resistance (PR) testing of metals to determine their corrosion resistance is a well-established practice with roots going back nearly 50 years. PR testing has proven to be the most
SD2000-04 Final Report 26 November 2001
useful method for determining corrosion rates in both research and practical application areas. PRtesting is fast (usually only a few minutes per test), highly sensitive, and nondestructive. Thus,repeated tests can be performed on the same sample and acceleration methods are often unnecessary.
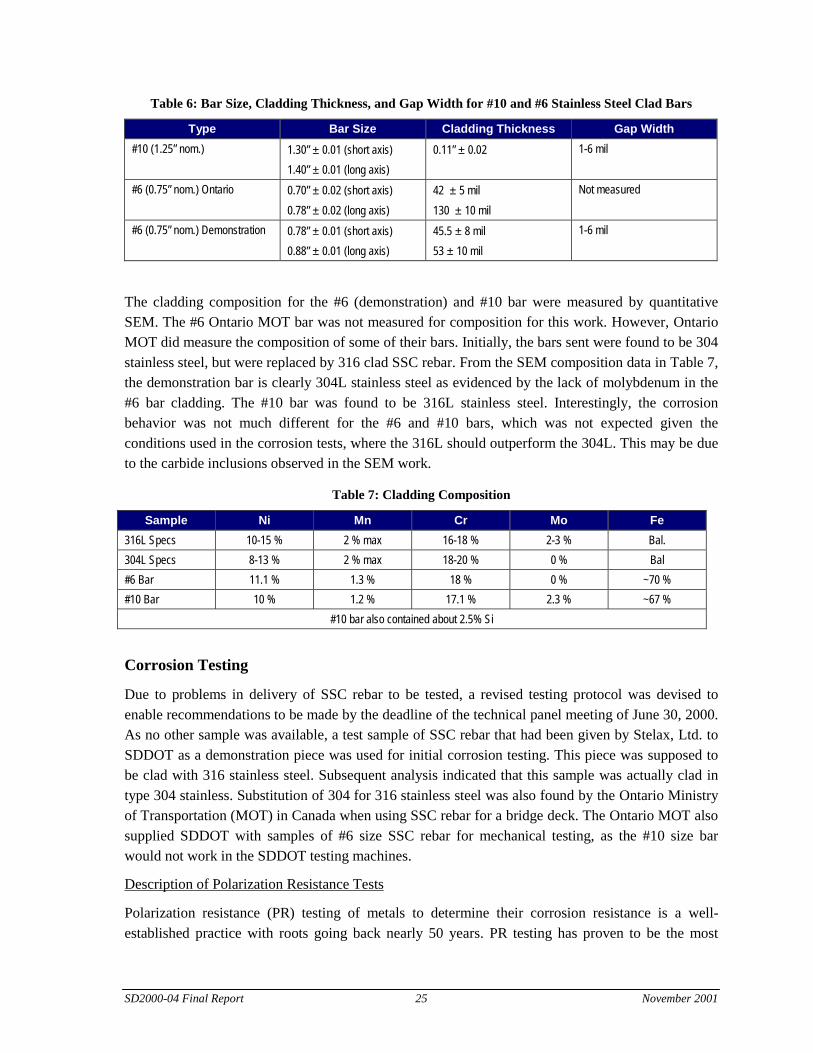
The rebar samples (both unclad and stainless steel clad) were cut into 1-inch long sections by RPMand Associates using a chop saw. The cut samples were examined for any surface irregularitiescaused by the cutting process and, when found, these irregularities were removed by grinding. Next,the flat section of the cladding surface (see Figure 7 and Figure 20) was located and a 5/8” diameterhole was drilled partway into the cladding (Figure 8). The cladding was not drilled completelythrough in this case, to minimize any possible problems that might be caused by internal galvanicinteractions at the core/cladding interface.
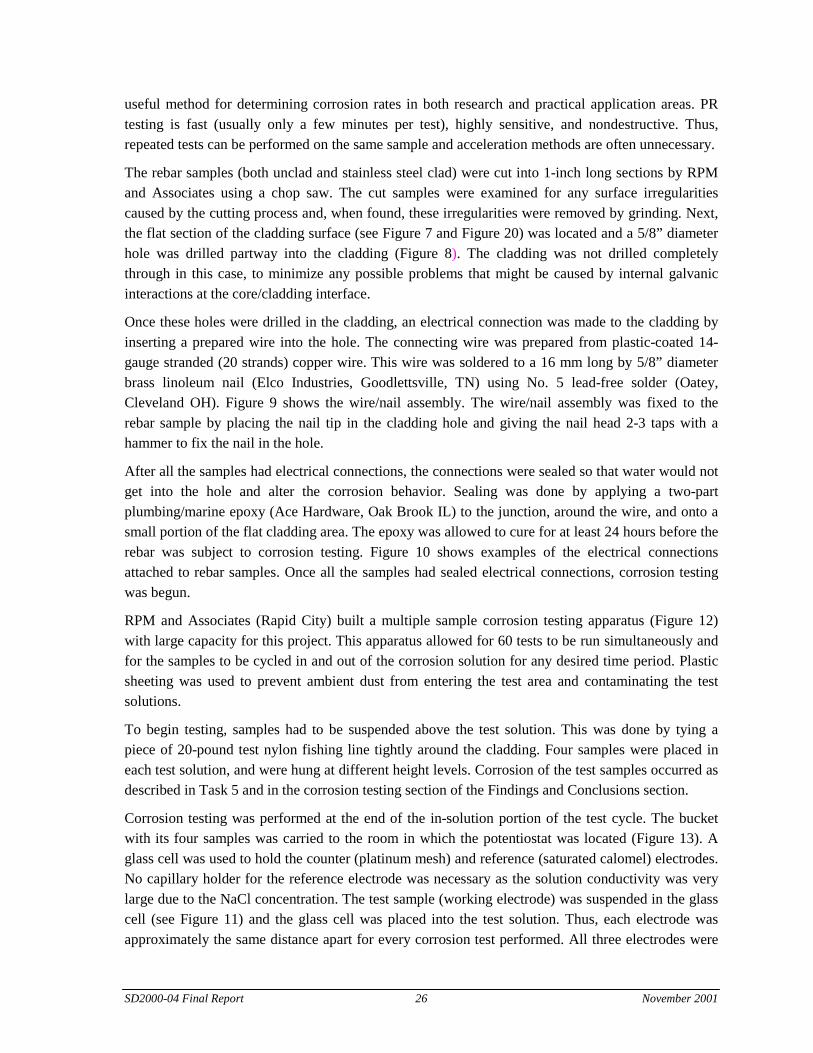
Once these holes were drilled in the cladding, an electrical connection was made to the cladding byinserting a prepared wire into the hole. The connecting wire was prepared from plastic-coated 14-gauge stranded (20 strands) copper wire. This wire was soldered to a 16 mm long by 5/8” diameterbrass linoleum nail (Elco Industries, Goodlettsville, TN) using No. 5 lead-free solder (Oatey,Cleveland OH). Figure 9 shows the wire/nail assembly. The wire/nail assembly was fixed to therebar sample by placing the nail tip in the cladding hole and giving the nail head 2-3 taps with ahammer to fix the nail in the hole.
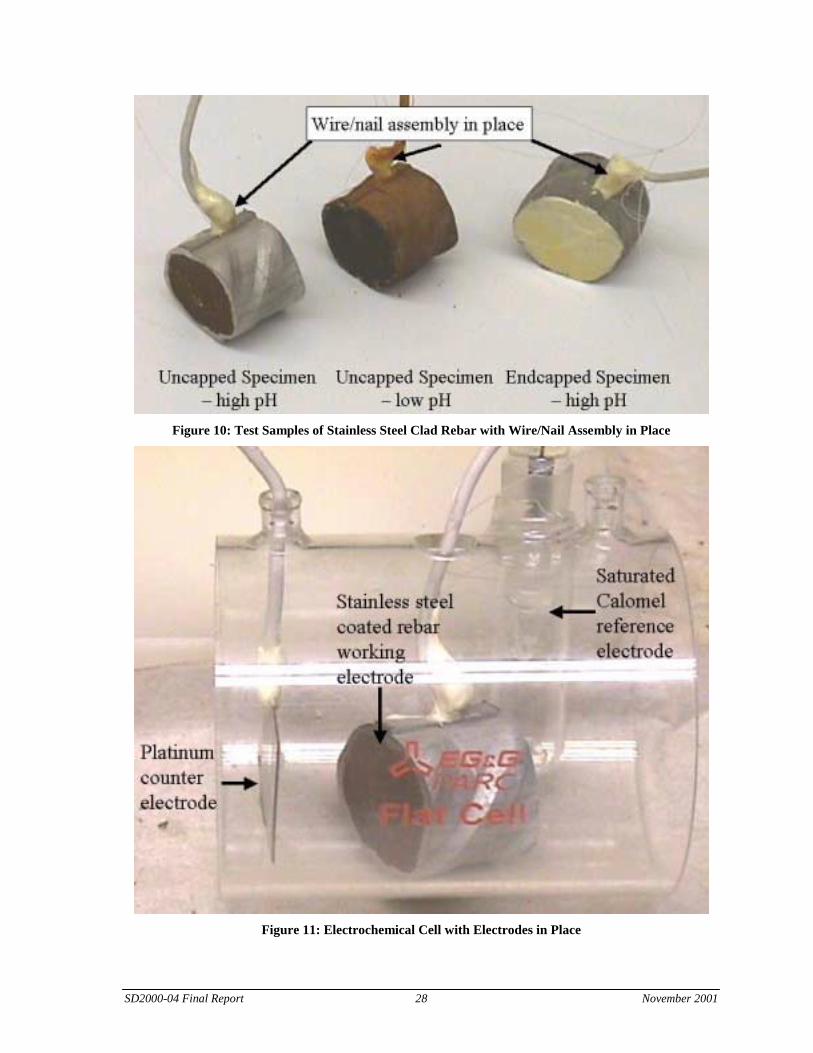
After all the samples had electrical connections, the connections were sealed so that water would notget into the hole and alter the corrosion behavior. Sealing was done by applying a two-partplumbing/marine epoxy (Ace Hardware, Oak Brook IL) to the junction, around the wire, and onto asmall portion of the flat cladding area. The epoxy was allowed to cure for at least 24 hours before therebar was subject to corrosion testing. Figure 10 shows examples of the electrical connectionsattached to rebar samples. Once all the samples had sealed electrical connections, corrosion testingwas begun.
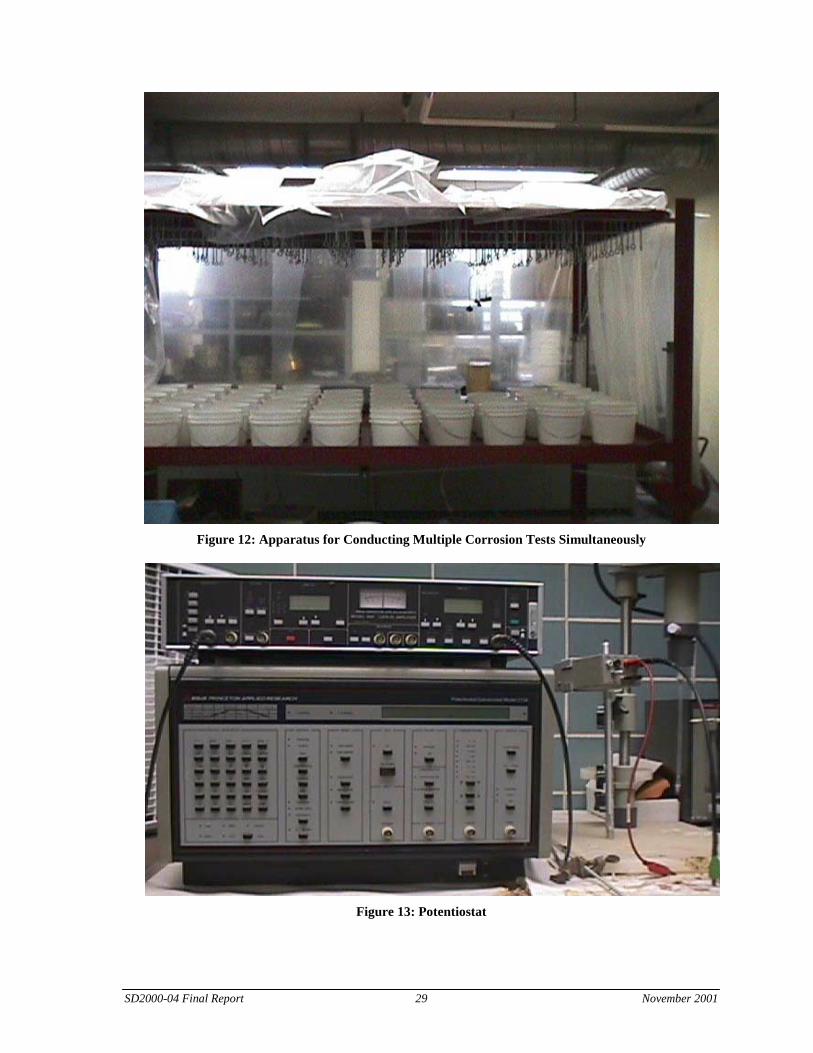
RPM and Associates (Rapid City) built a multiple sample corrosion testing apparatus (Figure 12)with large capacity for this project. This apparatus allowed for 60 tests to be run simultaneously andfor the samples to be cycled in and out of the corrosion solution for any desired time period. Plasticsheeting was used to prevent ambient dust from entering the test area and contaminating the testsolutions.
To begin testing, samples had to be suspended above the test solution. This was done by tying apiece of 20-pound test nylon fishing line tightly around the cladding. Four samples were placed ineach test solution, and were hung at different height levels. Corrosion of the test samples occurred asdescribed in Task 5 and in the corrosion testing section of the Findings and Conclusions section.
Corrosion testing was performed at the end of the in-solution portion of the test cycle. The bucketwith its four samples was carried to the room in which the potentiostat was located (Figure 13). Aglass cell was used to hold the counter (platinum mesh) and reference (saturated calomel) electrodes.No capillary holder for the reference electrode was necessary as the solution conductivity was verylarge due to the NaCl concentration. The test sample (working electrode) was suspended in the glasscell (see Figure 11) and the glass cell was placed into the test solution. Thus, each electrode wasapproximately the same distance apart for every corrosion test performed. All three electrodes were
SD2000-04 Final Report 27 November 2001
connected to the potentiostat and the system was given a few minutes to come to rest. After the restpotential was obtained, the polarization resistance test protocol was begun, and the polarizationresistance curves were obtained. This procedure was followed for all samples on which polarizationtesting was performed.
Figure 8: Stainless Steel Clad Rebar Showing Hole Drilled in Flat Portion of Cladding
Figure 9: Wire/Nail Assembly Before and After Soldering.
SD2000-04 Final Report 28 November 2001
Figure 10: Test Samples of Stainless Steel Clad Rebar with Wire/Nail Assembly in Place
Figure 11: Electrochemical Cell with Electrodes in Place
SD2000-04 Final Report 29 November 2001
Figure 12: Apparatus for Conducting Multiple Corrosion Tests Simultaneously
Figure 13: Potentiostat
SD2000-04 Final Report 30 November 2001
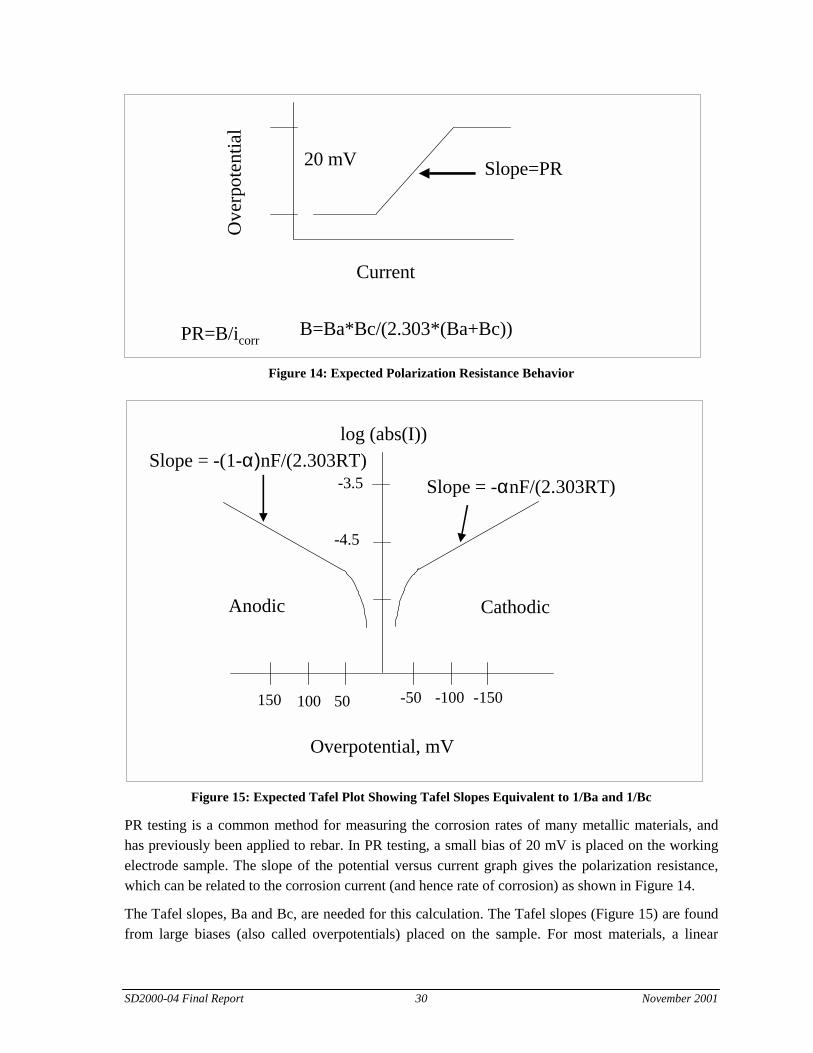
Figure 14: Expected Polarization Resistance Behavior
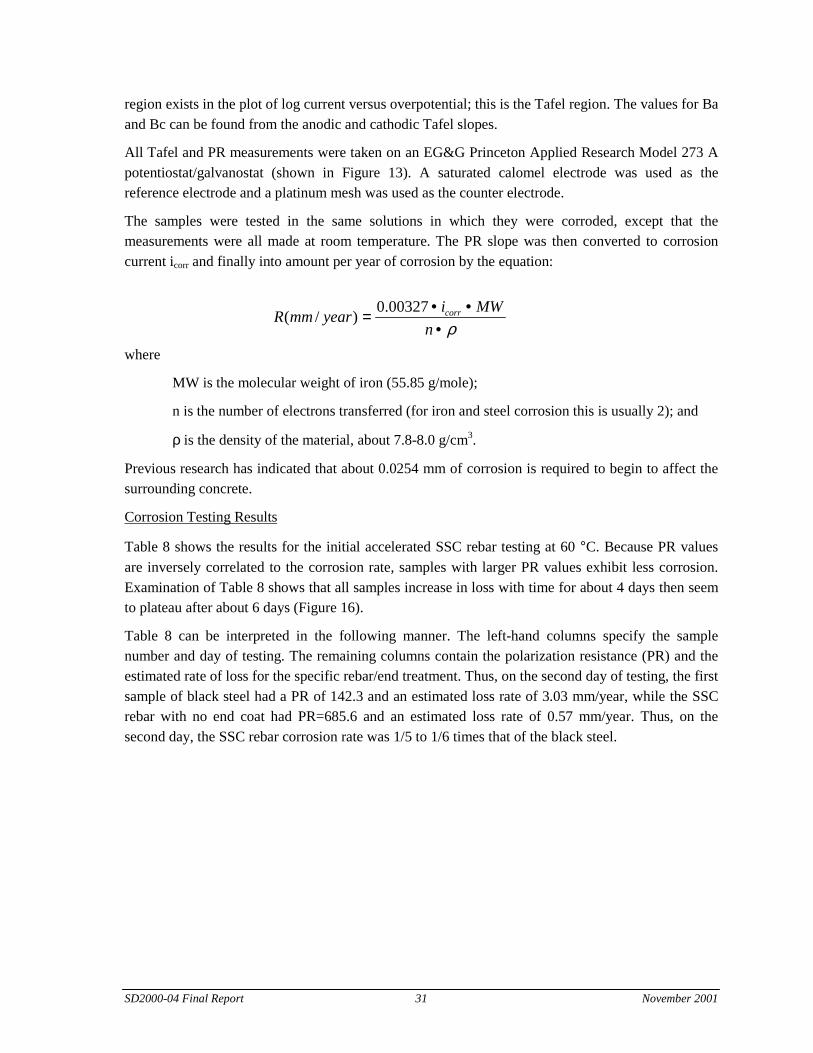
Figure 15: Expected Tafel Plot Showing Tafel Slopes Equivalent to 1/Ba and 1/Bc
PR testing is a common method for measuring the corrosion rates of many metallic materials, andhas previously been applied to rebar. In PR testing, a small bias of 20 mV is placed on the workingelectrode sample. The slope of the potential versus current graph gives the polarization resistance,which can be related to the corrosion current (and hence rate of corrosion) as shown in Figure 14.
The Tafel slopes, Ba and Bc, are needed for this calculation. The Tafel slopes (Figure 15) are foundfrom large biases (also called overpotentials) placed on the sample. For most materials, a linear
Ove
rpot
entia
l
Current
20 mV Slope=PR
PR=B/icorrB=Ba*Bc/(2.303*(Ba+Bc))
log (abs(I))
Overpotential, mV
Slope = -αnF/(2.303RT)-3.5
-4.5
Slope = -(1-α)nF/(2.303RT)
-50 -100 -150150 100 50
Anodic Cathodic
SD2000-04 Final Report 31 November 2001
region exists in the plot of log current versus overpotential; this is the Tafel region. The values for Baand Bc can be found from the anodic and cathodic Tafel slopes.
All Tafel and PR measurements were taken on an EG&G Princeton Applied Research Model 273 Apotentiostat/galvanostat (shown in Figure 13). A saturated calomel electrode was used as thereference electrode and a platinum mesh was used as the counter electrode.
The samples were tested in the same solutions in which they were corroded, except that themeasurements were all made at room temperature. The PR slope was then converted to corrosioncurrent icorr and finally into amount per year of corrosion by the equation:
where
MW is the molecular weight of iron (55.85 g/mole);
n is the number of electrons transferred (for iron and steel corrosion this is usually 2); and
ρ is the density of the material, about 7.8-8.0 g/cm3.
Previous research has indicated that about 0.0254 mm of corrosion is required to begin to affect thesurrounding concrete.
Corrosion Testing Results
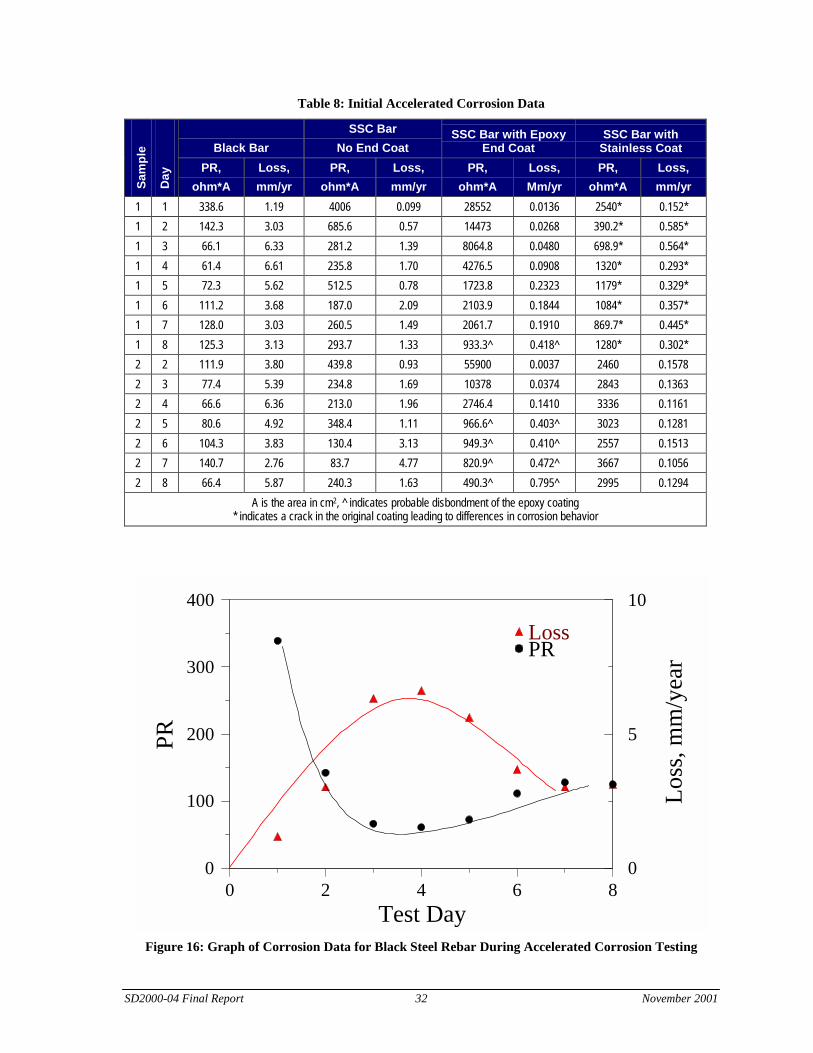
Table 8 shows the results for the initial accelerated SSC rebar testing at 60 °C. Because PR valuesare inversely correlated to the corrosion rate, samples with larger PR values exhibit less corrosion.Examination of Table 8 shows that all samples increase in loss with time for about 4 days then seemto plateau after about 6 days (Figure 16).
Table 8 can be interpreted in the following manner. The left-hand columns specify the samplenumber and day of testing. The remaining columns contain the polarization resistance (PR) and theestimated rate of loss for the specific rebar/end treatment. Thus, on the second day of testing, the firstsample of black steel had a PR of 142.3 and an estimated loss rate of 3.03 mm/year, while the SSCrebar with no end coat had PR=685.6 and an estimated loss rate of 0.57 mm/year. Thus, on thesecond day, the SSC rebar corrosion rate was 1/5 to 1/6 times that of the black steel.
ρ•••=
nMWiyearmmR corr00327.0)/(
SD2000-04 Final Report 32 November 2001
Table 8: Initial Accelerated Corrosion Data
Black BarSSC Bar
No End CoatSSC Bar with Epoxy
End CoatSSC Bar with
Stainless CoatSa
mpl
e
Day
PR,ohm*A
Loss,mm/yr
PR,ohm*A
Loss,mm/yr
PR,ohm*A
Loss,Mm/yr
PR,ohm*A
Loss,mm/yr
1 1 338.6 1.19 4006 0.099 28552 0.0136 2540* 0.152*1 2 142.3 3.03 685.6 0.57 14473 0.0268 390.2* 0.585*1 3 66.1 6.33 281.2 1.39 8064.8 0.0480 698.9* 0.564*1 4 61.4 6.61 235.8 1.70 4276.5 0.0908 1320* 0.293*1 5 72.3 5.62 512.5 0.78 1723.8 0.2323 1179* 0.329*1 6 111.2 3.68 187.0 2.09 2103.9 0.1844 1084* 0.357*1 7 128.0 3.03 260.5 1.49 2061.7 0.1910 869.7* 0.445*1 8 125.3 3.13 293.7 1.33 933.3^ 0.418^ 1280* 0.302*2 2 111.9 3.80 439.8 0.93 55900 0.0037 2460 0.15782 3 77.4 5.39 234.8 1.69 10378 0.0374 2843 0.13632 4 66.6 6.36 213.0 1.96 2746.4 0.1410 3336 0.11612 5 80.6 4.92 348.4 1.11 966.6^ 0.403^ 3023 0.12812 6 104.3 3.83 130.4 3.13 949.3^ 0.410^ 2557 0.15132 7 140.7 2.76 83.7 4.77 820.9^ 0.472^ 3667 0.10562 8 66.4 5.87 240.3 1.63 490.3^ 0.795^ 2995 0.1294
A is the area in cm2, ^ indicates probable disbondment of the epoxy coating* indicates a crack in the original coating leading to differences in corrosion behavior
86420Test Day
400
300
200
100
0
PR
10
5
0
Loss
, mm
/yea
r
LossPR
Figure 16: Graph of Corrosion Data for Black Steel Rebar During Accelerated Corrosion Testing

SD2000-04 Final Report 33 November 2001
As the data in Table 8 and Figure 16 are for accelerated corrosion conditions, they cannot be directlyused to estimate the time required to lose 0.0254 mm, the amount which would affect the concrete. Ifeven the lowest rate were used, the bridge would begin to fail after 1 year.
A better way of interpreting these numbers is to compute a ratio the SSC rebar data to the black steeldata. Under normal conditions black steel will last about one year before cracking the concrete.Therefore, the ratio of corrosion rates of the SSC rebar and the black steel will provide an estimate ofthe number of years to concrete damage when SSC rebar is used (Table 9). Due to the small amountof sample available, only three types of samples were examined:
� SSC rebar with no end treatment, which exposes the core to the corroding solution (3%NaCl, pH6 and 60 °C)
� SSC with epoxy-coated end-treatment to limit the exposure to the cladding
� SSC with stainless steel end coating. The particular stainless steel coating method usedmade a relatively porous coating through which solution could penetrate. Also, thecoating was observed to be cracked in some cases.
For the uncoated SSC rebar, the samples appeared to be about 2-5 times better than black steel.Epoxy coating the ends resulted in an increase in the improvement over black steel of about 30-70times better. The epoxy end-coating eventually disbonded from the SSC rebar causing the corrosionbehavior to approach that of the SSC rebar without endcoating. The disbonded epoxy coating wasslightly better than the uncoated piece, most likely due to problems with solution ingress and perhapssome of the epoxy still adhering to the SSC rebar. The stainless steel coating worked approximatelythe same as the epoxy-coated end (see sample 2) when no cracks were formed. When the coatingwas cracked, the corrosion resistance was about the same as the debonded epoxy sample, about 10times that of the black steel.
Table 9: Comparison of Time to Concrete Failure for SSC and Black Steel Under Accelerated Corrosion
Estimated Years to Concrete FailureSample Sample 1 Sample 2
Black Steel 11 11SSC Uncoated 13.5 11.9
SSC Epoxy-coated 47.1 78.7SSC Epoxy-coated, After Disbondment 20.0 18.0
SSC Stainless Coated 21.0 46.1
This data indicates that the SSC rebar (in this case 304 stainless clad rebar), should last 50-70 yearsin a bridge deck before concrete damage occurs. This figure comes from the corrosion resistancegiven above and the estimation that approximately 10 years is necessary for the buildup of salts inthe concrete to induce corrosion.
Following receipt of the #10 bar from Stelax, Ltd., testing was begun on the original test matrix. Theseries of tests performed used pHvalues of 5 and 12, 3% NaCl and room temperature. Samples wereprepared from #6 black steel and #10 SSC rebar. The SSC rebar was used with no end treatment,
SD2000-04 Final Report 34 November 2001
epoxy-coated ends and a variety of welded and spray coated treatments. In particular, 316 stainlesssteel spray coating such as that used in the initial experimentation, a T-55 weld material, which is aNi-Fe alloy with 55% Ni, a 309 stainless steel weld material and a mixed weld of the end treatmentused by the manufacturer and a T-55 weld material on the other end. The epoxy-coated and uncoatedSSC rebar samples also had their cladding abraded by brushing with a Dremel hard-wire tool brushand had a 1/16” hole drilled through the cladding into the core. In all cases, four samples of eachtype were tested simultaneously for each combination of pHand end treatment/cladding treatment.
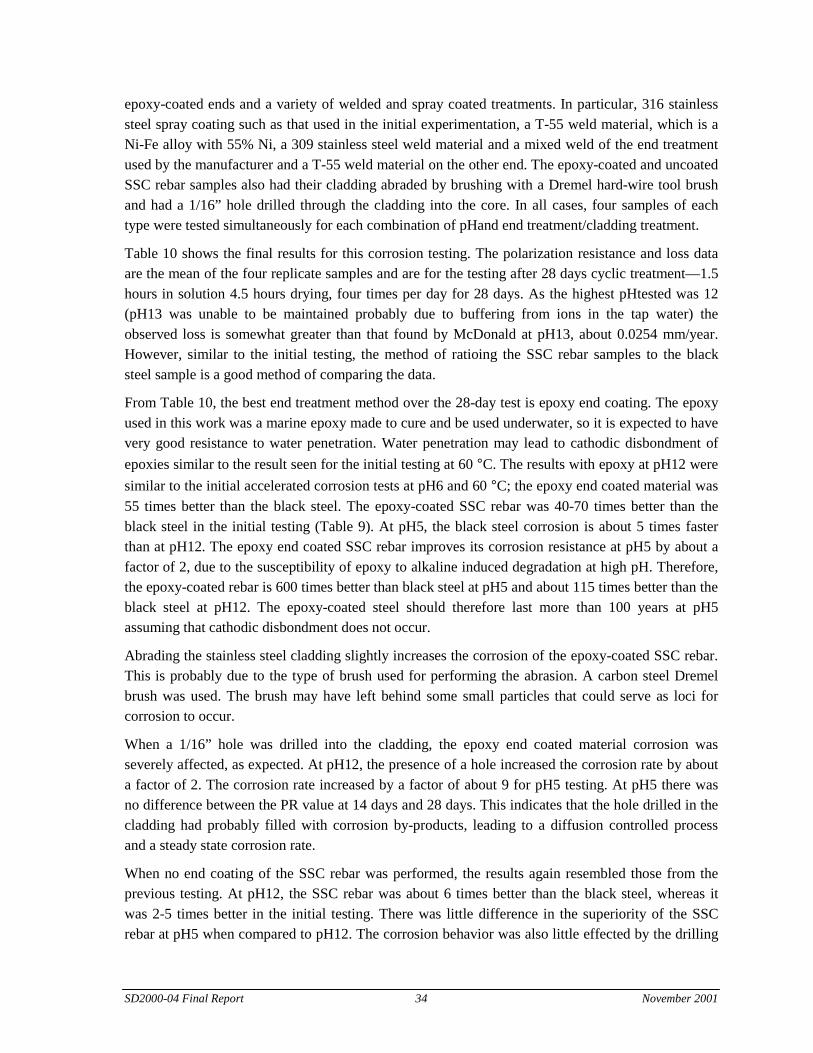
Table 10 shows the final results for this corrosion testing. The polarization resistance and loss dataare the mean of the four replicate samples and are for the testing after 28 days cyclic treatment—1.5hours in solution 4.5 hours drying, four times per day for 28 days. As the highest pHtested was 12(pH13 was unable to be maintained probably due to buffering from ions in the tap water) theobserved loss is somewhat greater than that found by McDonald at pH13, about 0.0254 mm/year.However, similar to the initial testing, the method of ratioing the SSC rebar samples to the blacksteel sample is a good method of comparing the data.
From Table 10, the best end treatment method over the 28-day test is epoxy end coating. The epoxyused in this work was a marine epoxy made to cure and be used underwater, so it is expected to havevery good resistance to water penetration. Water penetration may lead to cathodic disbondment ofepoxies similar to the result seen for the initial testing at 60 °C. The results with epoxy at pH12 weresimilar to the initial accelerated corrosion tests at pH6 and 60 °C; the epoxy end coated material was55 times better than the black steel. The epoxy-coated SSC rebar was 40-70 times better than theblack steel in the initial testing (Table 9). At pH5, the black steel corrosion is about 5 times fasterthan at pH12. The epoxy end coated SSC rebar improves its corrosion resistance at pH5 by about afactor of 2, due to the susceptibility of epoxy to alkaline induced degradation at high pH. Therefore,the epoxy-coated rebar is 600 times better than black steel at pH5 and about 115 times better than theblack steel at pH12. The epoxy-coated steel should therefore last more than 100 years at pH5assuming that cathodic disbondment does not occur.
Abrading the stainless steel cladding slightly increases the corrosion of the epoxy-coated SSC rebar.This is probably due to the type of brush used for performing the abrasion. A carbon steel Dremelbrush was used. The brush may have left behind some small particles that could serve as loci forcorrosion to occur.
When a 1/16” hole was drilled into the cladding, the epoxy end coated material corrosion wasseverely affected, as expected. At pH12, the presence of a hole increased the corrosion rate by abouta factor of 2. The corrosion rate increased by a factor of about 9 for pH5 testing. At pH5 there wasno difference between the PR value at 14 days and 28 days. This indicates that the hole drilled in thecladding had probably filled with corrosion by-products, leading to a diffusion controlled processand a steady state corrosion rate.
When no end coating of the SSC rebar was performed, the results again resembled those from theprevious testing. At pH12, the SSC rebar was about 6 times better than the black steel, whereas itwas 2-5 times better in the initial testing. There was little difference in the superiority of the SSCrebar at pH5 when compared to pH12. The corrosion behavior was also little effected by the drilling
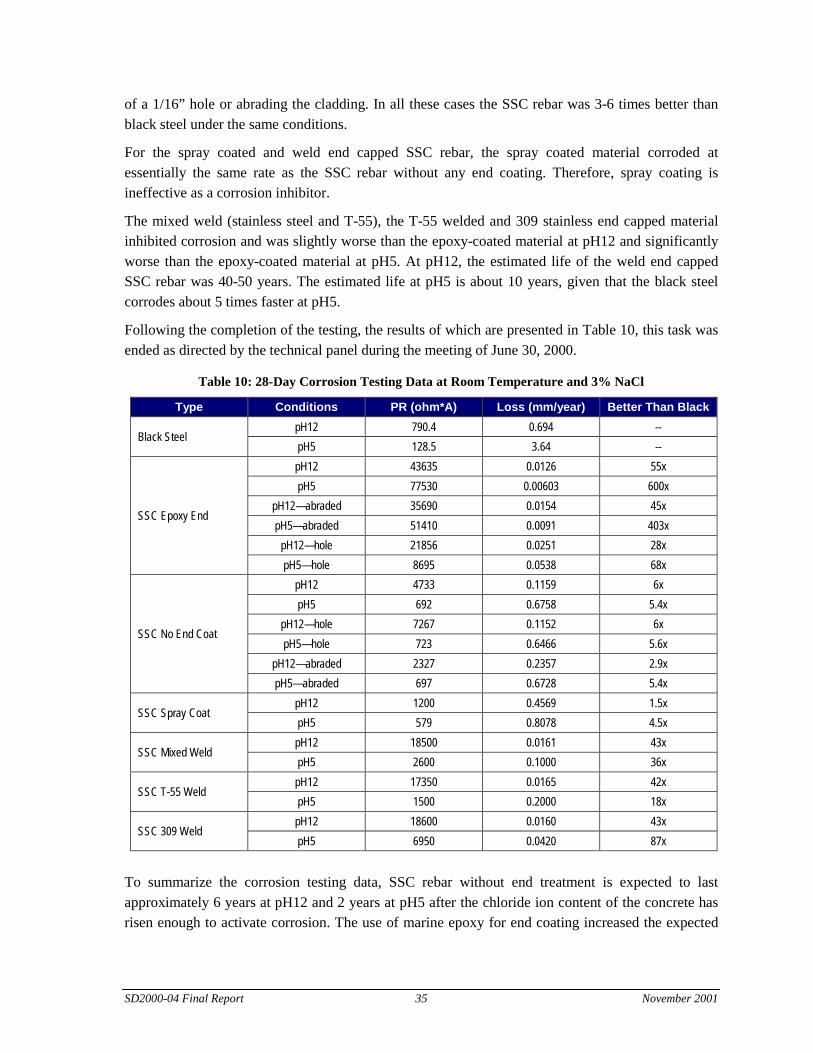
SD2000-04 Final Report 35 November 2001
of a 1/16” hole or abrading the cladding. In all these cases the SSC rebar was 3-6 times better thanblack steel under the same conditions.
For the spray coated and weld end capped SSC rebar, the spray coated material corroded atessentially the same rate as the SSC rebar without any end coating. Therefore, spray coating isineffective as a corrosion inhibitor.
The mixed weld (stainless steel and T-55), the T-55 welded and 309 stainless end capped materialinhibited corrosion and was slightly worse than the epoxy-coated material at pH12 and significantlyworse than the epoxy-coated material at pH5. At pH12, the estimated life of the weld end cappedSSC rebar was 40-50 years. The estimated life at pH5 is about 10 years, given that the black steelcorrodes about 5 times faster at pH5.
Following the completion of the testing, the results of which are presented in Table 10, this task wasended as directed by the technical panel during the meeting of June 30, 2000.
Table 10: 28-Day Corrosion Testing Data at Room Temperature and 3% NaCl
Type Conditions PR (ohm*A) Loss (mm/year) Better Than BlackpH12 790.4 0.694 --
Black SteelpH5 128.5 3.64 --pH12 43635 0.0126 55xpH5 77530 0.00603 600x
pH12—abraded 35690 0.0154 45xpH5—abraded 51410 0.0091 403x
pH12—hole 21856 0.0251 28x
SSC Epoxy End
pH5—hole 8695 0.0538 68xpH12 4733 0.1159 6xpH5 692 0.6758 5.4x
pH12—hole 7267 0.1152 6xpH5—hole 723 0.6466 5.6x
pH12—abraded 2327 0.2357 2.9x
SSC No End Coat
pH5—abraded 697 0.6728 5.4xpH12 1200 0.4569 1.5x
SSC Spray CoatpH5 579 0.8078 4.5xpH12 18500 0.0161 43x
SSC Mixed WeldpH5 2600 0.1000 36xpH12 17350 0.0165 42x
SSC T-55 WeldpH5 1500 0.2000 18xpH12 18600 0.0160 43x
SSC 309 WeldpH5 6950 0.0420 87x
To summarize the corrosion testing data, SSC rebar without end treatment is expected to lastapproximately 6 years at pH12 and 2 years at pH5 after the chloride ion content of the concrete hasrisen enough to activate corrosion. The use of marine epoxy for end coating increased the expected
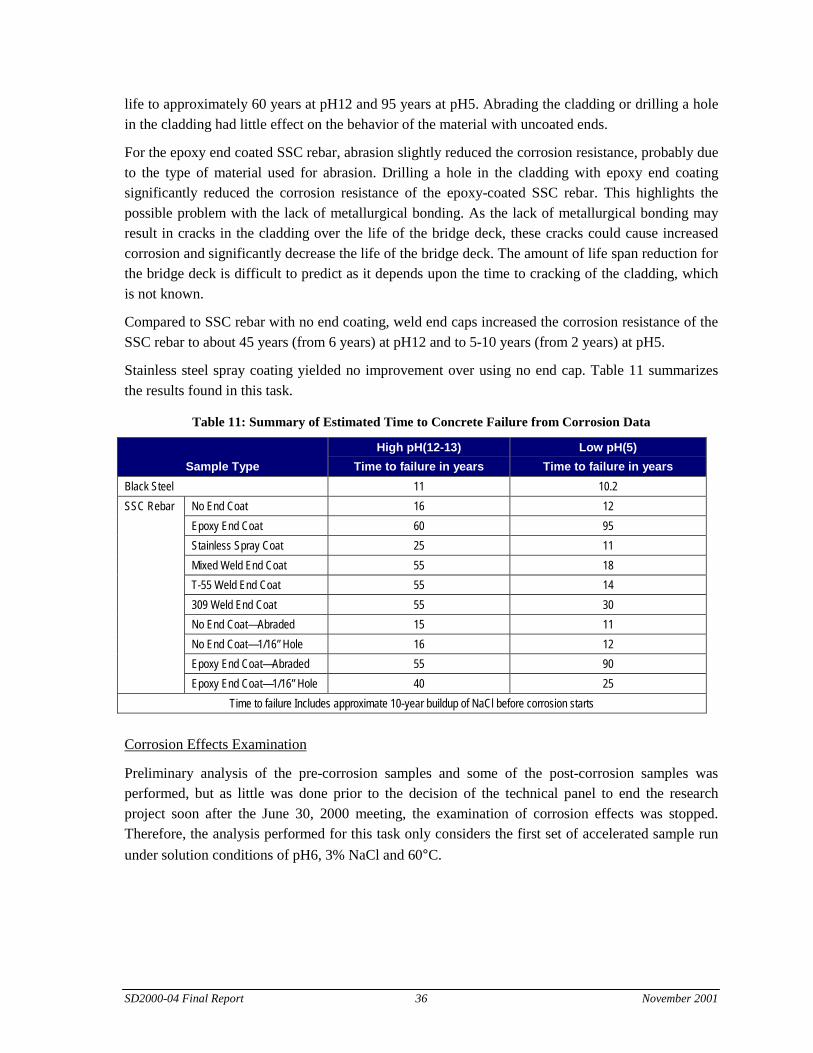
SD2000-04 Final Report 36 November 2001
life to approximately 60 years at pH12 and 95 years at pH5. Abrading the cladding or drilling a holein the cladding had little effect on the behavior of the material with uncoated ends.
For the epoxy end coated SSC rebar, abrasion slightly reduced the corrosion resistance, probably dueto the type of material used for abrasion. Drilling a hole in the cladding with epoxy end coatingsignificantly reduced the corrosion resistance of the epoxy-coated SSC rebar. This highlights thepossible problem with the lack of metallurgical bonding. As the lack of metallurgical bonding mayresult in cracks in the cladding over the life of the bridge deck, these cracks could cause increasedcorrosion and significantly decrease the life of the bridge deck. The amount of life span reduction forthe bridge deck is difficult to predict as it depends upon the time to cracking of the cladding, whichis not known.
Compared to SSC rebar with no end coating, weld end caps increased the corrosion resistance of theSSC rebar to about 45 years (from 6 years) at pH12 and to 5-10 years (from 2 years) at pH5.
Stainless steel spray coating yielded no improvement over using no end cap. Table 11 summarizesthe results found in this task.
Table 11: Summary of Estimated Time to Concrete Failure from Corrosion Data
Sample TypeHigh pH(12-13)
Time to failure in yearsLow pH(5)
Time to failure in yearsBlack Steel 11 10.2
No End Coat 16 12Epoxy End Coat 60 95Stainless Spray Coat 25 11Mixed Weld End Coat 55 18T-55 Weld End Coat 55 14309 Weld End Coat 55 30No End Coat—Abraded 15 11No End Coat—1/16” Hole 16 12Epoxy End Coat—Abraded 55 90
SSC Rebar
Epoxy End Coat—1/16” Hole 40 25Time to failure Includes approximate 10-year buildup of NaCl before corrosion starts
Corrosion Effects Examination
Preliminary analysis of the pre-corrosion samples and some of the post-corrosion samples wasperformed, but as little was done prior to the decision of the technical panel to end the researchproject soon after the June 30, 2000 meeting, the examination of corrosion effects was stopped.Therefore, the analysis performed for this task only considers the first set of accelerated sample rununder solution conditions of pH6, 3% NaCl and 60°C.
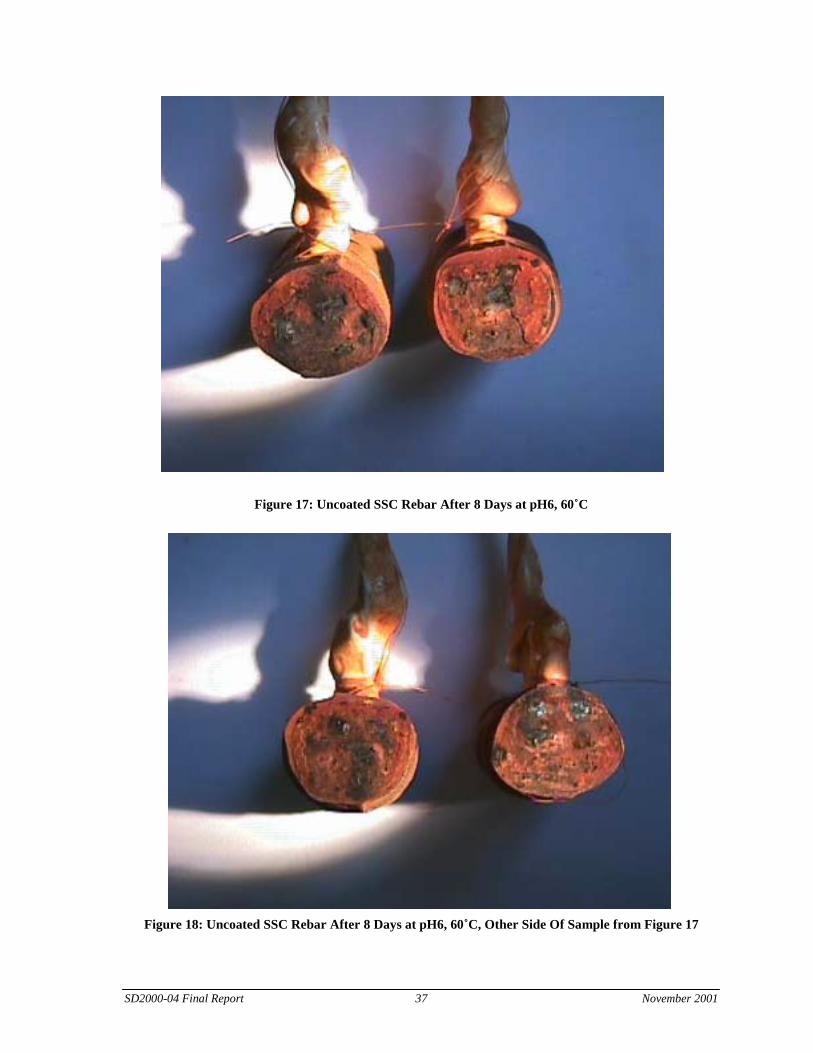
SD2000-04 Final Report 37 November 2001
Figure 17: Uncoated SSC Rebar After 8 Days at pH6, 60˚C
Figure 18: Uncoated SSC Rebar After 8 Days at pH6, 60˚C, Other Side Of Sample from Figure 17
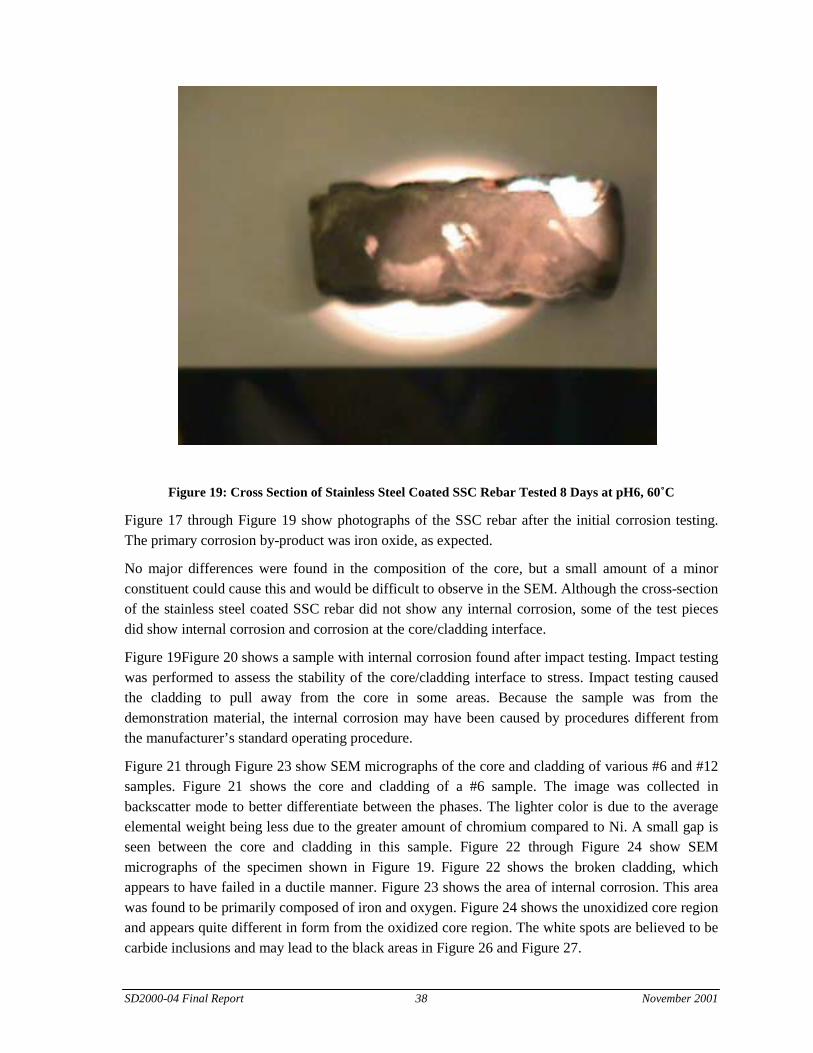
SD2000-04 Final Report 38 November 2001
Figure 19: Cross Section of Stainless Steel Coated SSC Rebar Tested 8 Days at pH6, 60˚C
Figure 17 through Figure 19 show photographs of the SSC rebar after the initial corrosion testing.The primary corrosion by-product was iron oxide, as expected.
No major differences were found in the composition of the core, but a small amount of a minorconstituent could cause this and would be difficult to observe in the SEM. Although the cross-sectionof the stainless steel coated SSC rebar did not show any internal corrosion, some of the test piecesdid show internal corrosion and corrosion at the core/cladding interface.
Figure 19Figure 20 shows a sample with internal corrosion found after impact testing. Impact testingwas performed to assess the stability of the core/cladding interface to stress. Impact testing causedthe cladding to pull away from the core in some areas. Because the sample was from thedemonstration material, the internal corrosion may have been caused by procedures different fromthe manufacturer’s standard operating procedure.
Figure 21 through Figure 23 show SEM micrographs of the core and cladding of various #6 and #12samples. Figure 21 shows the core and cladding of a #6 sample. The image was collected inbackscatter mode to better differentiate between the phases. The lighter color is due to the averageelemental weight being less due to the greater amount of chromium compared to Ni. A small gap isseen between the core and cladding in this sample. Figure 22 through Figure 24 show SEMmicrographs of the specimen shown in Figure 19. Figure 22 shows the broken cladding, whichappears to have failed in a ductile manner. Figure 23 shows the area of internal corrosion. This areawas found to be primarily composed of iron and oxygen. Figure 24 shows the unoxidized core regionand appears quite different in form from the oxidized core region. The white spots are believed to becarbide inclusions and may lead to the black areas in Figure 26 and Figure 27.
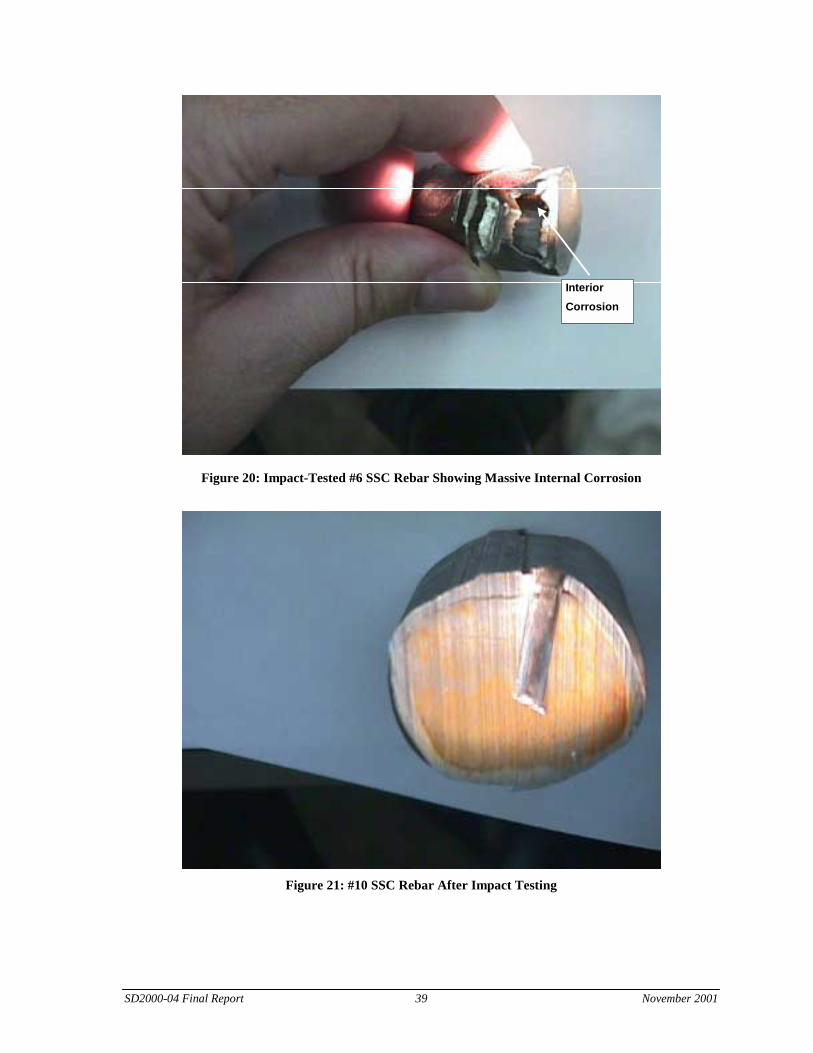
SD2000-04 Final Report 39 November 2001
InteriorCorrosion
Figure 20: Impact-Tested #6 SSC Rebar Showing Massive Internal Corrosion
Figure 21: #10 SSC Rebar After Impact Testing
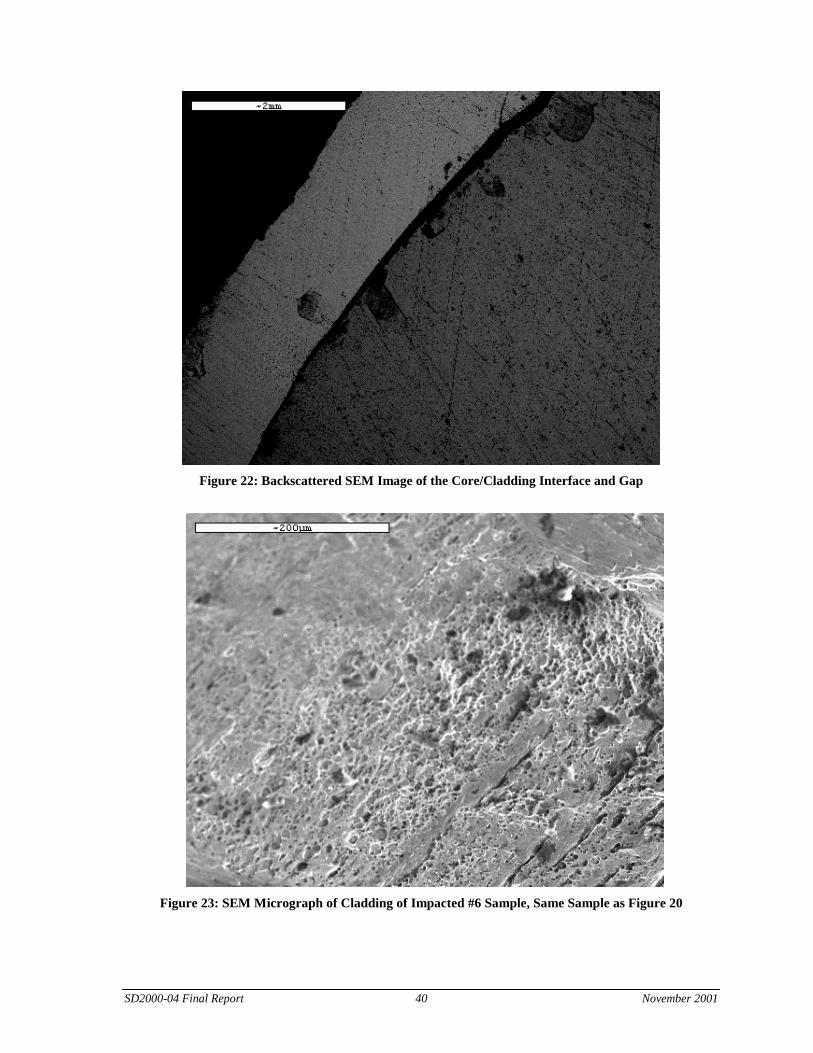
SD2000-04 Final Report 40 November 2001
Figure 22: Backscattered SEM Image of the Core/Cladding Interface and Gap
Figure 23: SEM Micrograph of Cladding of Impacted #6 Sample, Same Sample as Figure 20
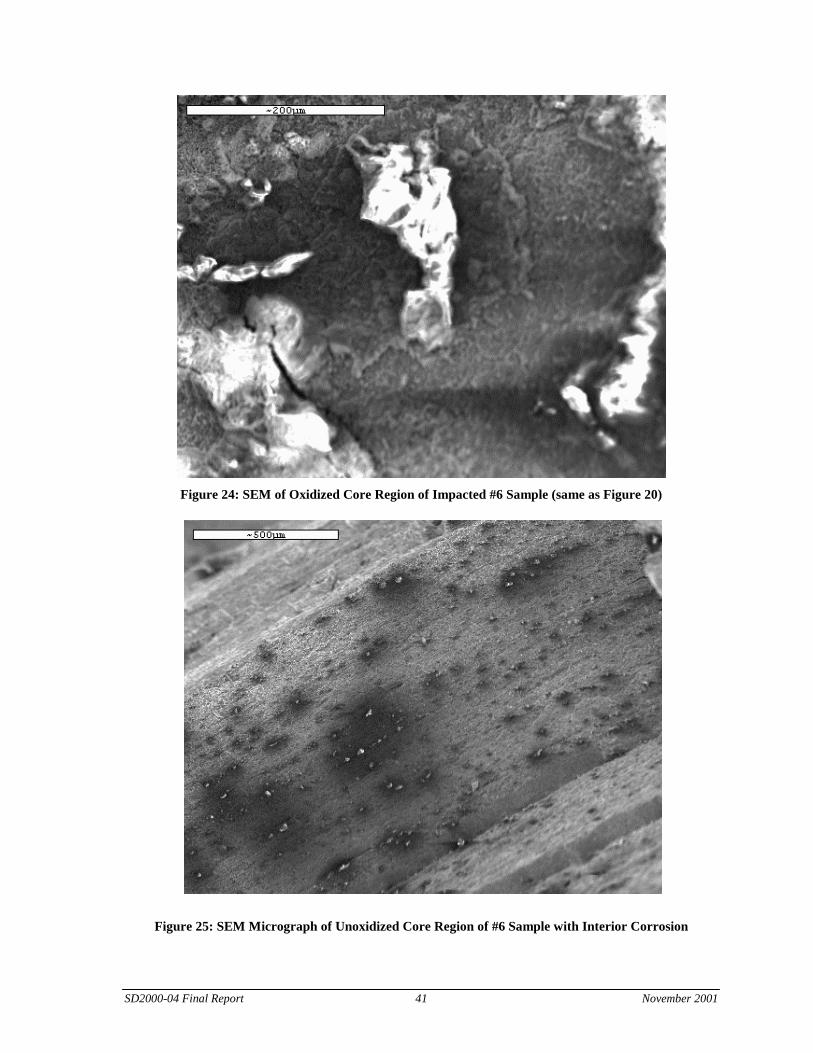
SD2000-04 Final Report 41 November 2001
Figure 24: SEM of Oxidized Core Region of Impacted #6 Sample (same as Figure 20)
Figure 25: SEM Micrograph of Unoxidized Core Region of #6 Sample with Interior Corrosion
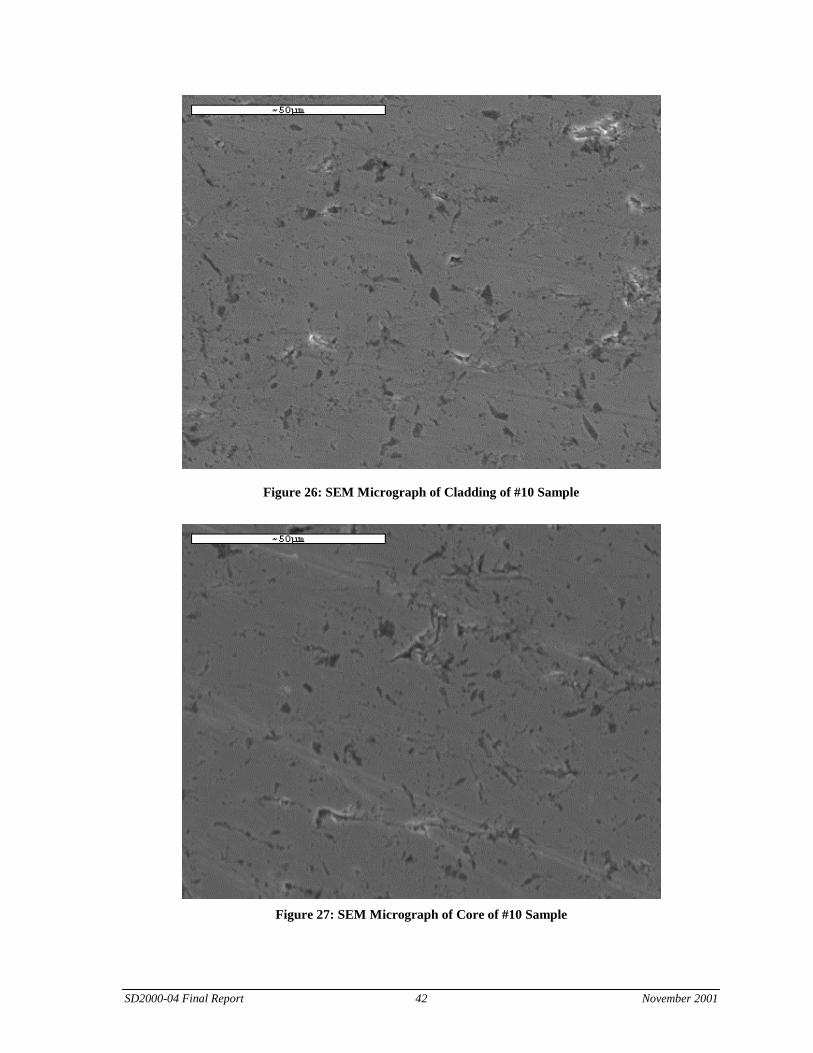
SD2000-04 Final Report 42 November 2001
Figure 26: SEM Micrograph of Cladding of #10 Sample
Figure 27: SEM Micrograph of Core of #10 Sample

SD2000-04 Final Report 43 November 2001
Figure 26 and Figure 27 show the core and cladding of the #10 sample. The dark shapes may becarbide inclusions or they may be voids with polishing particles in the void. They did show a largecarbon presence, but differentiation was not made prior to the end of the research.

SD2000-04 Final Report 44 November 2001

SD2000-04 Final Report 45 November 2001
CONCLUSIONS
The material exhibited several problems that may have serious consequences in both the short- andlong-term:
• Lack of metallurgical bond between core and cladding—This problem can lead to voids atthe core-cladding interface. The full effect of these voids is hard to predict, but they couldlead to premature cracking of the cladding and significantly reduce the resistance of thematerial to corrosion. All samples examined displayed a continuous gap at the core-claddinginterface. These gaps were 30 to 150 µm (about 1-5 mils) in thickness. As the samples werecut prior to examination, the interfacial gap may be due to the cutting process. A sample wasprocessed by cutting the cladding in one position and then pulling the cladding off with apliers. The cladding was removed easily and the now exposed core-cladding interfaceindicated only 2-3 areas of core-cladding contact, making up 10-20% of the total possiblecontact area.
• Failure to supply proper size samples and any size sample in a timely fashion—At the outsetof this project, the supplier promised to deliver 40 feet of #6 material in early April 2000, asa shipment of #6 stainless steel clad rebar was being made for the Florida DOT. AlthoughFlorida received material, SDDOT did not. The supplier then promised 40 feet of #8 sizematerial in May. This material also was not shipped. Finally, 40 feet of #10 stainless steelclad rebar was received on June 9, 2000, far too late for much of the original planned testingto be finished by the June 23, 2000 deadline. Virginia DOT reported a similar problem thatforced them to get samples from a finished bridge project in Ontario, Canada.
• Quality control of material—In particular, the cladding thickness varied by 30-50% (asmeasured by coefficient of variation). One area was found to be out of specification (lessthan 0.5 mm), although this may have been due to cutting the material. Furthermore, neitherthe #10 bar sent in June nor the demonstration piece of #6 material met the nominal sizespecification. The bars sent averaged about 10% greater in size than the ASTMspecifications for #6 and #10 size bars. Also, conversations with the Ontario MOT indicatedthat it had received a mixture of 304 clad and 316L clad rebar when only the 316L cladmaterial had been ordered. The 316L clad material is superior to the 304 in corrosionresistance but is more expensive. These concerns may be alleviated by the presence of aninspector during material production.
• Possibility of internal corrosion—During testing, one sample of the #6 demonstration barwas found to have a large area of internal corrosion within the black steel core. This internalcorrosion did not appear to be linked to corrosion at the core-cladding interface. The internalcorrosion created a weak spot that broke under an impact load of approximately 250 psi.Examination of other tested #6 samples indicated a few areas of minor internal corrosion.Internal corrosion was not observed on cut faces of the #10 material. The cause of theinternal corrosion is not known at the present time. If the internal corrosion were present dueto poor manufacturing, the presence of an inspector might help alleviate this problem. Also,
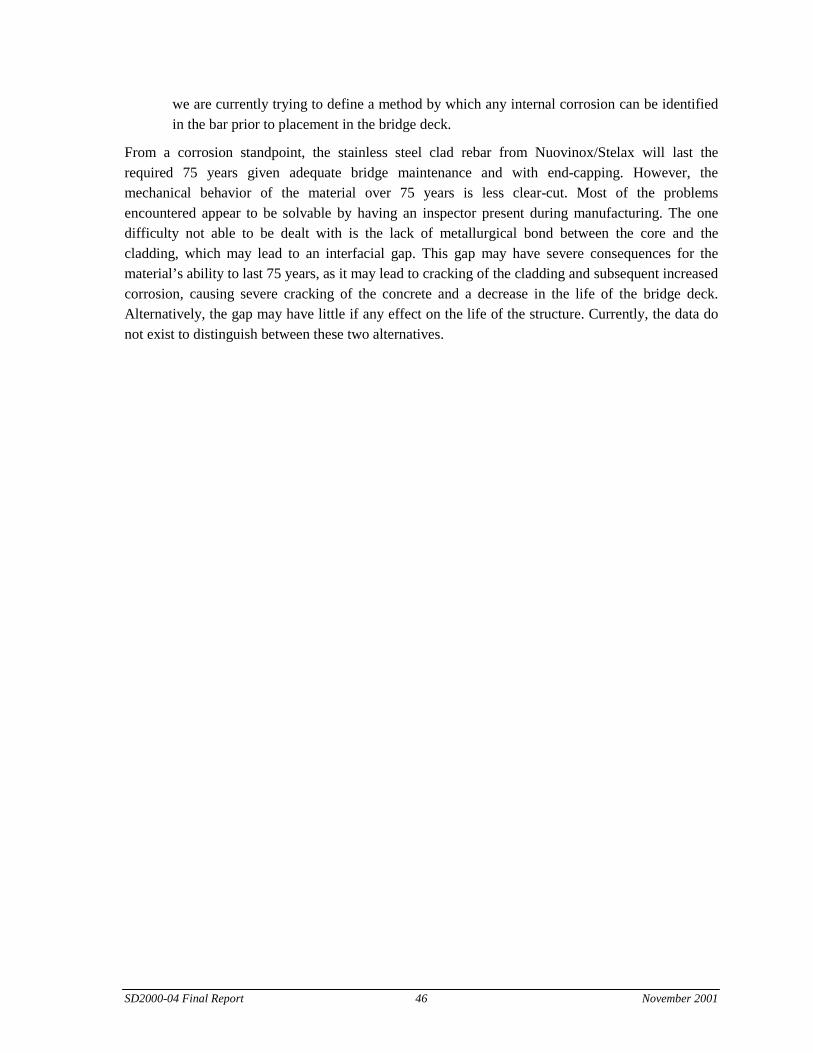
SD2000-04 Final Report 46 November 2001
we are currently trying to define a method by which any internal corrosion can be identifiedin the bar prior to placement in the bridge deck.
From a corrosion standpoint, the stainless steel clad rebar from Nuovinox/Stelax will last therequired 75 years given adequate bridge maintenance and with end-capping. However, themechanical behavior of the material over 75 years is less clear-cut. Most of the problemsencountered appear to be solvable by having an inspector present during manufacturing. The onedifficulty not able to be dealt with is the lack of metallurgical bond between the core and thecladding, which may lead to an interfacial gap. This gap may have severe consequences for thematerial’s ability to last 75 years, as it may lead to cracking of the cladding and subsequent increasedcorrosion, causing severe cracking of the concrete and a decrease in the life of the bridge deck.Alternatively, the gap may have little if any effect on the life of the structure. Currently, the data donot exist to distinguish between these two alternatives.
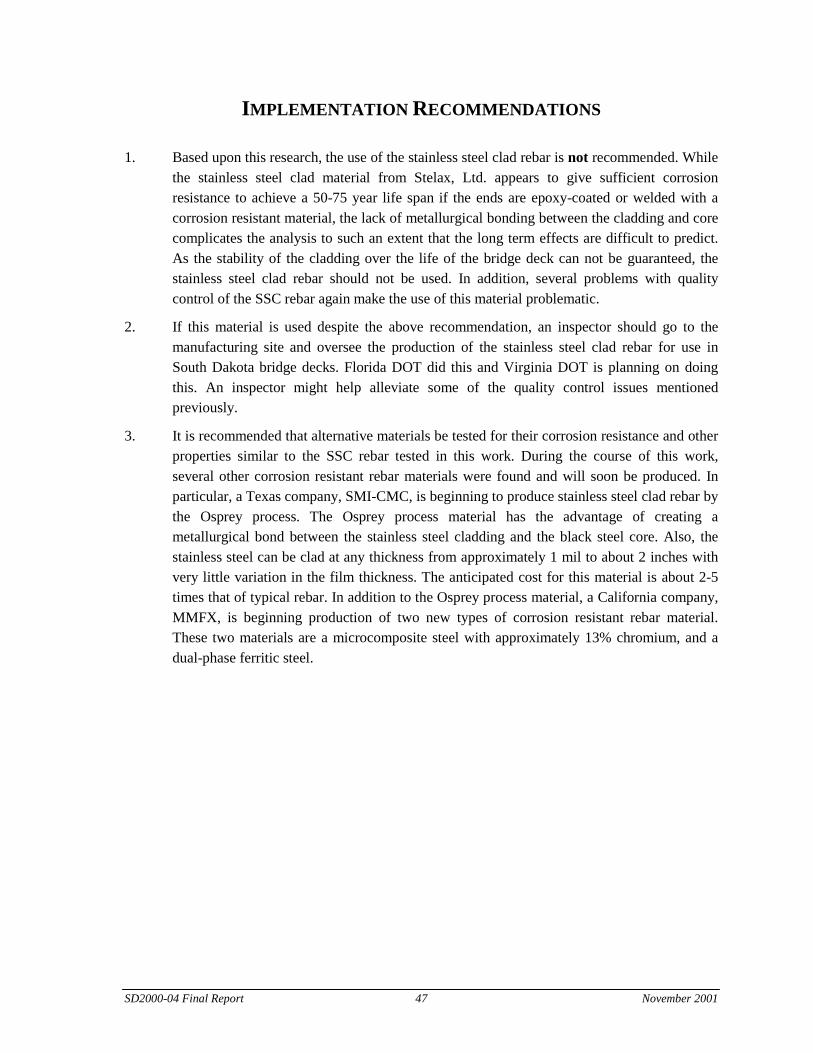
SD2000-04 Final Report 47 November 2001
IMPLEMENTATION RECOMMENDATIONS
1. Based upon this research, the use of the stainless steel clad rebar is not recommended. Whilethe stainless steel clad material from Stelax, Ltd. appears to give sufficient corrosionresistance to achieve a 50-75 year life span if the ends are epoxy-coated or welded with acorrosion resistant material, the lack of metallurgical bonding between the cladding and corecomplicates the analysis to such an extent that the long term effects are difficult to predict.As the stability of the cladding over the life of the bridge deck can not be guaranteed, thestainless steel clad rebar should not be used. In addition, several problems with qualitycontrol of the SSC rebar again make the use of this material problematic.
2. If this material is used despite the above recommendation, an inspector should go to themanufacturing site and oversee the production of the stainless steel clad rebar for use inSouth Dakota bridge decks. Florida DOT did this and Virginia DOT is planning on doingthis. An inspector might help alleviate some of the quality control issues mentionedpreviously.
3. It is recommended that alternative materials be tested for their corrosion resistance and otherproperties similar to the SSC rebar tested in this work. During the course of this work,several other corrosion resistant rebar materials were found and will soon be produced. Inparticular, a Texas company, SMI-CMC, is beginning to produce stainless steel clad rebar bythe Osprey process. The Osprey process material has the advantage of creating ametallurgical bond between the stainless steel cladding and the black steel core. Also, thestainless steel can be clad at any thickness from approximately 1 mil to about 2 inches withvery little variation in the film thickness. The anticipated cost for this material is about 2-5times that of typical rebar. In addition to the Osprey process material, a California company,MMFX, is beginning production of two new types of corrosion resistant rebar material.These two materials are a microcomposite steel with approximately 13% chromium, and adual-phase ferritic steel.