stakeholder management in construction projects: a …
TRANSCRIPT

i
STAKEHOLDER MANAGEMENT IN CONSTRUCTION
PROJECTS: A LIFE CYCLE BASED FRAMEWORK
By
JURBE JOSEPH MOLWUS B.Sc., M.Sc. (UniJos), MNIOB, Registered Bldr. (CORBON)
A thesis submitted in partial fulfilment of the requirements for the award of
Doctor of Philosophy in Construction, of Heriot Watt University, Edinburgh
October, 2014
The copyright in this thesis is owned by the author. Any quotation from the thesis
or use of any of the information contained in it must acknowledge this thesis as the
source of the quotation or information.
i
ABSTRACT
Although stakeholder management has long been acknowledged as a means of
increasing the propensity for successful delivery of construction projects, the full
benefits of stakeholder management have yet to be tapped. Previous research efforts
indicate lack of comprehensive stakeholder management process since the existing
frameworks in construction either focussed on a particular construction stage or failed to
incorporate important considerations such as the impact of procurement routes, internal
stakeholder collaboration, responsibility for stakeholder management and project life
cycle.
This research aims to develop a comprehensive framework for stakeholder management
in construction projects in order to enable the industry tap the full benefits of
stakeholder management. In order to achieve this aim, previous work on stakeholder
management is reviewed. The current practice of stakeholder management within the
construction industry, the effects of procurement routes and contract forms on
stakeholder management process, the relationship among the critical success factors for
stakeholder management in construction projects are investigated using an industry
survey among construction professionals practicing within the United Kingdom. Data
collected is analysed using a combination of qualitative approach and appropriate
statistical techniques including structural equation modelling (SEM) to investigate the
current practice of stakeholder management in construction projects, effects of
procurement routes and contract conditions on stakeholder management process, and
the interrelationships among the critical success factors for stakeholder management in
construction projects.
Based on a combination of the findings from literature review and data analyses, a life
cycle based framework for stakeholder management in construction projects is
developed using Integrated Defiinition0 (IDEF0) modelling. The framework is
validated by practising industry professionals and is identified as a comprehensive guide
to construction industry practitioners for carrying out stakeholder management in
construction projects.

ii
DEDICATION
To the blessed memory of my late father Nde Joseph Kassem Pakgyit Molwus who laid
the foundation for my education but could not live to see me achieve its peak and all
others who have departed this world.
To all, whose lives have been cut short by acts of terrorism in different parts of the
world.
To all, who do and promote the will of God Almighty in the entire human race.

iii
ACKNOWLEDGEMENTS
One’s efforts alone cannot achieve this research work and preparation of thesis. Many
individuals and organisations have contributed directly or indirectly, knowingly and
willingly or otherwise, acknowledging them therefore, is inevitably necessary.
I would like to start by expressing my sincere appreciation to my primary supervisor,
Dr. Bilge Erdogan who through unconditional, sacrificial and untiring constructive
criticisms, guided and encouraged me to accomplish this study. My sincere gratitude
also goes to my second supervisor, Prof. S. O. Ogunlana, for his supportive guide
including moral support and prayers. I am also grateful to Dr. Derek Thomson who got
me started on the study.
I would like to thank the school of Built Environment, Heriot Watt University,
Edinburgh, for funding my tuition throughout the study. I also thank the University of
Jos for approving my study leave. I am also grateful to Dr. S. A. Oyegoke, Dr. Roshani
Palliyaguru, Prof. Bayo Adeloye, Mr. Angus Kennedy, Rev. Dr. Alistair Donald, Rev.
Frs: Giani, Kevin and Ian; Bldrs. D. D. Jambol, E. P. Datok and K. Attsar; Mrs Christy
Wakjissa (my mother in-law), Prof. David L. Wonnang, Augustine Ajijelek, Isah Jabil,
Yususf Nakaka and Smart Habila Bako for their support to me in different ways. I also
thank the Head and entire staff of the Department of Building, University of Jos,
Nigeria for their encouragement.
To the Nigerian community and other friends in Heriot Watt University and Edinburgh
at large, I am grateful for your company, friendship and encouragement. To my
colleagues in SBE who sincerely shared their experiences and encouraged me, I remain
indebted in gratitude. To the administrative/support staff at SBE who were always there
to help in times of need, many thanks for your help and smiles. To all my friends whose
support and encouragement regardless of physical distance, never ceased, I am grateful.
My mother (Mrs Helen Nnang Joseph), Sisters, cousins, aunts, uncles and my entire
extended family (including friends I consider part of my family) have been wonderfully
supportive in different ways, I appreciate them all. To my loving Wife: Delmwa and
kids: Jurritka and Nenrin, I appreciate your support, encouragement, patience and
understanding throughout my absence on account of this study. I am grateful to my In-
laws for their support to me in many ways.

iv
Lastly but one, I whole heartedly appreciate all those whose names I have not
mentioned here, even though their contributions have added up in making this work
possible; especially those who helped in data collection.
Finally and above all, I give God Almighty the glory for His unfailing grace, love and
mercies throughout the study period and my entire life.

v
DECLARATION STATEMENT
ACADEMIC REGISTRY
Research Thesis Submission
Stakeholder Management in Construction Projects: A life Cycle Based Framework
Name: Jurbe Joseph Molwus
School/PGI: School of the Built Environment/CofEx
Version: (i.e. First,
Resubmission, Final) Final Degree Sought
(Award and
Subject area)
PhD (Construction)
Declaration In accordance with the appropriate regulations I hereby submit my thesis and I declare that:
1) the thesis embodies the results of my own work and has been composed by myself
2) where appropriate, I have made acknowledgement of the work of others and have made reference
to work carried out in collaboration with other persons
3) the thesis is the correct version of the thesis for submission and is the same version as any
electronic versions submitted*.
4) my thesis for the award referred to, deposited in the Heriot-Watt University Library, should be
made available for loan or photocopying and be available via the Institutional Repository, subject
to such conditions as the Librarian may require
5) I understand that as a student of the University I am required to abide by the Regulations of the
University and to conform to its discipline.
* Please note that it is the responsibility of the candidate to ensure that the correct version of the
thesis is submitted.
Signature of
Candidate:
Date:
Submission
Submitted By (name in capitals):
JURBE JOSEPH MOLWUS
Signature of Individual Submitting:
Date Submitted:
For Completion in the Student Service Centre (SSC)
Received in the SSC by (name in
capitals):
Method of Submission
(Handed in to SSC; posted through
internal/external mail):
E-thesis Submitted (mandatory for
final theses)
Signature:
Date:

vi
TABLE OF CONTENTS
ABSTRACT …………………………………………………………….i
DEDICATION…………………………………………………………..ii
ACKNOWLEDGEMENT……………………………………………..iii
DECLARATION STATEMENT………………………………………v
TABLE OF CONTENTS……………………………………………….vi
LIST OF TABLES……………………………………………………..xiii
LIST OF FIGURES……………………………………………………xvi
Method of Submission ................................................................................................... v
E-thesis Submitted (mandatory for final theses) .......................................................... v
1. CHAPTER ONE: INTRODUCTION ................................................. 1
1.1 Background ........................................................................................................ 1
1.1.1 Who are construction project stakeholders ................................................. 1
1.1.2 Link between stakeholder management and project success in construction
2
1.1.3 Stakeholder management process ............................................................... 4
1.1.4 Justification for the research ....................................................................... 5
1.2 Research Questions ............................................................................................ 6
1.3 Research Aim and Objectives ............................................................................ 7
1.4 Research Methodology ....................................................................................... 8
1.5 Thesis structure ................................................................................................. 11
2. CHAPTER TWO: LITERATURE REVIEW ON
STAKEHOLDER MANAGEMENT IN CONSTRUCTION
PROJECTS ................................................................................................ 15
2.1 Introduction ...................................................................................................... 15
2.2 Stakeholders Definition .................................................................................... 15
2.3 Stakeholders’ Classification ............................................................................. 17
2.3.1 Classification according to Stakeholders’ attributes (Power, Legitimacy,
Proximity and Urgency) .......................................................................................... 17
2.3.2 Classification according to vested interest-impact index (viii) ................. 20
2.3.3 Classification according to contractual relationship ................................ 23
2.3.4 Classification according to stakeholder attitudes towards the project ...... 23
2.4 Construction Projects’ Stakeholders and Their Interests ................................. 25

vii
2.5 Need to Manage/Engage Stakeholders in Construction Projects ..................... 27
2.6 Critical Success Factors (CSFs) for Stakeholder Management/ Engagement in
Construction Projects .................................................................................................. 30
2.7 Stakeholder Management Approaches/Frameworks ........................................ 41
2.8 Tools and Techniques for Stakeholder Management ....................................... 51
2.8.1 Design Charrette........................................................................................ 51
2.8.2 Contingent Value Method ......................................................................... 52
2.8.3 Delphi Technique ...................................................................................... 53
2.8.4 Strategic Needs Analysis........................................................................... 53
2.8.5 Stakeholder cycle ...................................................................................... 55
2.8.6 Public hearing ................................................................................................... 56
2.9 Chapter Summary ............................................................................................. 56
3. CHAPTER THREE: LIFE CYCLE, SUCCESS, PROCUREMENT
ROUTES; AND STAKEHOLDER COLLABORATION IN
CONSTRUCTION PROJECTS .............................................................. 58
3.1 Introduction ...................................................................................................... 58
3.2 Project Life Cycle ............................................................................................. 58
3.3 Project Success and Key Performance Indicators in Construction Projects .... 61
3.4 Procurement Routes in Construction ................................................................ 67
3.5 Relating Stakeholder Management (SM) to the Procurement Routes ............. 71
3.5.1 Stakeholder Management vs. Traditional method .................................... 71
3.5.2 Stakeholder Management vs. Integrated procurement methods ............... 72
3.5.3 Stakeholder Management vs. Management oriented procurement methods
73
3.6 Stakeholders’ Collaboration in Construction ................................................... 77
3.7 Conceptual Measurement and Structural Models of Critical Success Factors for
Stakeholder Management in Construction .................................................................. 80
3.8 Chapter Summary ............................................................................................. 86
4. CHAPTER FOUR: RESEARCH METHODOLOGY.................... 89
4.1 Introduction ...................................................................................................... 89
4.2 Research Design Concepts ............................................................................... 89
4.2.1 Research philosophy ................................................................................. 94
4.2.2 Research Approaches ................................................................................ 97
4.2.3 Research Strategies ................................................................................... 98
4.2.4 Research Choices .................................................................................... 101
4.2.5 Time Horizons ......................................................................................... 103
4.2.6 Data Collection and Data Analysis ......................................................... 104
4.3 Research Design (Methodology) Adopted ..................................................... 104
4.3.1 Literature Review .................................................................................... 105
4.3.2 Research Design ...................................................................................... 106
4.3.3 Validity and Reliability of Research Design ........................................... 111

viii
4.4 Data Analyses Techniques ............................................................................. 112
4.4.1 Mean rating ............................................................................................. 112
4.4.2 Kruskal-Wallis Test ................................................................................ 112
4.4.3 Mann-Witney U Test............................................................................... 113
4.4.4 Correlation............................................................................................... 113
4.4.5 Structural equation modelling (SEM) ............................................................ 113
4.4.5.1 Basic principles and Justification for using SEM ............................ 113
4.4.5.2 Model fit indices in SEM ................................................................. 118
4.4.5.3 Sample size ...................................................................................... 120
4.5 Summary ........................................................................................................ 121
5. CHAPTER FIVE: CURRENT PRACTICE OF STAKEHOLDER
MANAGEMENT IN CONSTRUCTION PROJECTS ....................... 123
5.1 Introduction .................................................................................................... 123
5.2 Stakeholder Management Decisions and responsibilities .............................. 123
5.2.1 Stakeholder management decisions ........................................................ 123
5.2.2 Change of Stakeholders’ Interests/Disposition towards Projects ................. 124
5.2.3 Stakeholder management collaboration .................................................. 127
5.2.4 Stakeholder management leadership/coordination ................................. 129
5.3 Techniques for Stakeholder Engagement/Management ................................. 132
5.4 Qualitative Responses (general comments) on Ways to Improve Stakeholder
Management in Construction Projects ...................................................................... 133
5.5 Chapter Summary ........................................................................................... 135
6. CHAPTER SIX: EFFECTS OF PROCUREMENT ROUTES
RELATED CHARACTERISTICS OF STAKEHOLDER
MANAGEMENT AND CONTRACT FORMS ON STAKEHOLDER
MANAGEMENT PROCESS IN CONSTRUCTION PROJECTS .... 137
6.1 Introduction .................................................................................................... 137
6.2 Investigating the effects of procurement routes related characteristics on
stakeholder management process .............................................................................. 137
6.3 Correlation analysis of procurement routes related characteristics of
stakeholder management process .............................................................................. 139
6.4 Investigating relationships between client type and procurement routes related
characteristics of stakeholder management ............................................................... 140
6.5 Investigating relationships between years of experience and procurement
routes related characteristics of stakeholder management ........................................ 142
6.6 Assessing the effects of forms of contracts on stakeholder management process
145
6.6.1 Forms of contract used by respondents ................................................... 145
6.6.2 Effects of forms of contract on stakeholder management process in
construction projects .............................................................................................. 146

ix
6.6.3 Investigating client type difference in the extent to which forms of
contract influence stakeholder management in construction projects ................... 147
6.7 Investigating relationships between forms of contract and procurement routes
related characteristics of stakeholder management ................................................... 149
6.8 Discussion of Results ..................................................................................... 154
6.9 Summary and Conclusions ............................................................................. 156
7. CHAPTER SEVEN: MODELLING THE
INTERRELATIONSHIPS AMONG THE CRITICAL SUCCESS
FACTORS (CSFs) FOR STAKEHOLDER MANAGEMENT IN
CONSTRUCTION PROJECTS ............................................................ 159
7.1 Introduction .................................................................................................... 159
7.2 Measurement Model of Critical Success Factors for Stakeholder Management
in Construction .......................................................................................................... 159
7.2.1 Preliminary analysis for consistency checks ........................................... 160
7.2.2 Evaluation of Measurement Model of Critical Success Factors for
Stakeholder Management in Construction Projects ............................................... 162
7.3 Evaluation of the Structural Model of Critical Success Factors for Stakeholder
Management in Construction Projects and Hypothesis Testing ................................ 168
7.4 Discussion of Results and Conclusions .......................................................... 174
8. CHAPTER EIGHT: DEVELOPMENT OF LIFE CYCLE BASED
FRAMEWORK FOR STAKEHOLDER MANAGEMENT IN
CONSTRUCTION PROJECTS ............................................................ 179
8.1 Introduction .................................................................................................... 179
8.2 Overview of the Life Cycle Based Framework for Stakeholder Management in
Construction .............................................................................................................. 179
8.2.1 Background to framework development ................................................. 179
8.2.2 Framework development approach-IDEF0 ............................................. 181
8.2.2.1 IDEF Techniques ............................................................................. 181
8.2.2.2 IDEF0 Technique ............................................................................. 182
8.3 Features of the Framework ............................................................................. 185
8.3.1 Conceptual framework ............................................................................ 185
8.3.2 Actors in the framework.......................................................................... 187
8.3.2.1 Project Director (PD) ....................................................................... 187
8.3.2.2 Stakeholder management leader (SML) .......................................... 187
8.3.2.3 Stakeholder management team (SMT) ............................................ 187
8.3.2.4 Regulatory authorities ...................................................................... 187
8.3.3 Framework for stakeholder management in construction – idef0 process
modelling overview ............................................................................................... 188
8.4 IDEF0 Model of SMIS ................................................................................... 196

x
8.4.1 Identify stakeholder characteristics and project characteristics - SMIS/A1
197
8.4.1.1 Define stakeholder management mission ........................................ 197
8.4.1.2 Identify project stakeholders and their characteristics ..................... 198
8.4.1.3 Constitute stakeholder management team ....................................... 198
8.4.1.4 Identify stakeholder characteristics and prepare preliminary
classification ....................................................................................................... 198
8.4.2 Carryout stakeholder analyses – SMIS/A2 ............................................. 198
8.4.2.1 Classify stakeholders ....................................................................... 199
8.4.2.2 Draw up stakeholder maps/matrices ................................................ 199
8.4.2.3 Identify possible conflicts and coalition among stakeholders ......... 199
8.4.3 Map stakeholder dynamism – SMIS/A3 ................................................. 200
8.4.3.1 Draw up stakeholder relationships maps/matrices at IS .................. 200
8.4.3.2 Draw up change in stakeholder interests maps at IS .............................. 200
8.4.3.3 Draw up change in stakeholder influence map at IS ....................... 201
8.4.4 Plan stakeholder engagement/empowerment strategies – SMIS/A4 ...... 201
8.4.4.1 Draw up stakeholder engagement/communication plan at IS ......... 201
8.4.4.2 Plan change tracking and feedback mechanisms at IS .................... 202
8.4.5 Implement stakeholder management plan – SMIS/A5 ........................... 202
8.4.5.1 Do feedback and change tracking report ......................................... 203
8.4.5.2 Prepare SMIS evaluation report ....................................................... 203
8.5 IDEF0 Model of SMDS ................................................................................. 203
8.5.1 Identify stakeholder characteristics and project characteristics - SMDS/A1
203
8.5.1.1 Update stakeholder management mission at DS.............................. 204
8.5.1.2 Update stakeholder list at DS........................................................... 204
8.5.1.3 Update stakeholder characteristics and profile at DS ...................... 204
8.5.2 Carryout stakeholder analyses – SMDS/A2 ............................................ 205
8.5.2.1 Update stakeholder classification at DS .......................................... 205
8.5.2.2 Update general stakeholder maps/matrices at DS ............................ 205
8.5.2.3 Update possible conflicts and coalition report at DS ....................... 206
8.5.3 Map stakeholder dynamism – SMDS/A3 ............................................ 206
8.5.3.1 Update stakeholder relationships maps/matrices at DS ................... 206
8.5.3.2 Update change in stakeholder interests maps/matrices at DS.......... 207
8.5.3.3 Update change in stakeholder influence maps/matrices at DS ........ 207
8.5.4 Plan stakeholder engagement/empowerment strategies – SMDS/A4 ..... 207
8.5.4.1 Plan stakeholder consultation at DS ................................................ 208

xi
8.5.4.2 Assign engagement responsibilities at DS ....................................... 208
8.5.4.3 Plan change tracking and feedback mechanisms at DS ................... 208
8.5.5 Implement stakeholder management plan – SMDS/A5 .......................... 209
8.5.5.1 Prepare change tracking and feedback report for DS ...................... 209
8.5.5.2 Prepare SMDS evaluation report ..................................................... 209
8.6 IDEF0 Model of SMCS .................................................................................. 210
8.6.1 Identify stakeholder characteristics and project characteristics - SMCS/A1
210
8.6.1.1 Prepare report on potential impact of construction activities on
stakeholders ........................................................................................................ 210
8.6.1.2 Update stakeholder list and profiles at CS ....................................... 211
8.6.1.3 Prepare preliminary stakeholder priority list at CS ......................... 211
8.6.2 Carryout stakeholder analyses – SMCS/A2 ........................................ 211
8.6.2.1 Update stakeholder classification at CS........................................... 212
8.6.2.2 Prepare stakeholder priority and impact report at CS ...................... 212
8.6.2.3 Prepare updated stakeholder maps/matrices at CS .......................... 212
8.6.3 Map stakeholder dynamism – SMCS/A3 ................................................ 213
8.6.3.1 Update change in stakeholder relation map at CS ........................... 213
8.6.3.2 Update change in stakeholder interests’ map at CS ......................... 214
8.6.3.3 Update change in stakeholder influence map at CS ........................ 214
8.6.4 Plan stakeholder engagement/empowerment strategies – SMCS/A4 ..... 214
8.6.4.1 Plan stakeholder engagement/communication strategies at CS ....... 215
8.6.4.2 Plan change tracking and feedback mechanisms at CS ................... 215
8.6.5 Implement stakeholder management decisions – SMCS/A5 .............. 215
8.6.5.1 Prepare feedback and change tracking report for CS ...................... 216
8.6.5.2 Prepare SMDS evaluation report at CS ........................................... 216
8.7 IDEF0 Model of SMOS ................................................................................. 217
8.7.1 Identify stakeholder characteristics and project characteristics at –
SMOS/A1 .............................................................................................................. 217
8.7.1.1 Prepare end product use/management plan ..................................... 217
8.7.1.2 Prepare preliminary end users’ classification .................................. 218
8.7.1.3 Prepare preliminary end users’ expectation report .......................... 218
8.7.2 Carryout stakeholder analyses – SMOS/A2 ............................................ 218
8.7.2.1 Prepare final end-users’/stakeholders’ expectation report at OS ........... 219
8.7.2.2 Finalise end users’ classification at OS ........................................... 219
8.7.2.3 Prepare possible conflicts and coalition report at OS ...................... 219
8.7.3 Map stakeholder dynamism – SMOS/A3 ............................................... 220

xii
8.7.3.1 Map possible change in stakeholder expectation at OS ................... 220
8.7.3.2 Draw up change in stakeholder relation map/matrices at OS .......... 221
8.7.4 Plan stakeholder engagement/empowerment strategies – SMOS/A4 ..... 221
8.7.4.1 Plan end-users’/stakeholders’ consultation/communication strategies
at OS 221
8.7.4.2 Plan stakeholder assessment strategies at OS .................................. 222
8.7.4.3 Plan change tracking and feedback mechanisms at OS ................... 222
8.7.5 Implement stakeholder management decisions - SMOS/A5 .................. 222
8.7.5.1 Do users’ satisfaction report at OS......................................................... 223
8.7.5.2 Do owners/financiers’ satisfaction report at OS .............................. 223
8.7.5.3 Prepare SMOS evaluation report ..................................................... 223
8.8 Chapter Summary ........................................................................................... 224
9. CHAPTER NINE: VALIDATION/EVALUATION OF THE
FRAMEWORK FOR STAKEHOLDER MANAGEMENT IN
CONSTRUCTION PROJECTS ............................................................ 225
9.1 Introduction .................................................................................................... 225
9.2 Aim and Objectives of Framework Validation/Evaluation ............................ 225
9.3 Methodology Adopted for Framework Validation/Evaluation ...................... 226
9.4 Results of Framework Validation/Evaluation ................................................ 231
9.4.1 Quantitative Results ................................................................................ 231
9.4.2 Qualitative Results .................................................................................. 235
9.4.2.1 Main benefits of the framework....................................................... 236
9.4.2.2 Barriers to the use of the framework ............................................... 236
9.4.2.3 Recommended improvements for the framework ........................... 237
9.5 Chapter Summary ........................................................................................... 238
10. CHAPTER TEN: SUMMARY, CONCLUSIONS AND
RECOMMENDATIONS ........................................................................ 239
10.1 Introduction .................................................................................................... 239
10.2 Summary of the Overall Research .................................................................. 239
10.3 Conclusions and Recommendations for Practice ........................................... 244
10.4 Limitations of the Research ............................................................................ 245
10.5 Recommendations for Further Research ........................................................ 246
References ................................................................................................ 247
Appendices ............................................................................................... 264
List of publications .................................................................................. 292

xiii
LIST OF TABLES
Table 1.1 Mapping of objectives with corresponding data collection and analysis
Techniques ............................................................................................................... 10
Table 2.1 Summary of stakeholder classification ........................................................... 25
Table 2.2 Critical Success Factors (CSFs) for Stakeholder Management in Construction
Projects..................................................................................................................... 32
Table 2.3 Stakeholder salience shaping strategies (adopted from Aaltonen et al., 2008)
................................................................................................................................. 36
Table 2.4 Summary of Stakeholder management processes actions in construction
projects ..................................................................................................................... 42
Table 2.5 Approaches for engaging stakeholders (Chinyio and Akintoye 2008) ........... 48
Table 3.1 Categorisation of construction procurement routes ........................................ 70
Table 3.2 Summary of stakeholder management related characteristics of procurement
routes ........................................................................................................................ 76
Table 3.3 Constructs and indicators of conceptual measurement model of CSFs for
stakeholder management in construction ................................................................. 82
Table 4.1 Comparison of consideration in the four research design models .................. 94
Table 4.2 Comparison of four branches of research philosophies (Saunders et al., 2009)
................................................................................................................................. 96
Table 4.3 The logics of Inductive and Deductive research approaches (Blaikie, 2007) . 98
Table 4.4 Quantitative, Mixed and Qualitative methods (Creswell, 2009) .................. 102
Table 4.5 Quantitative, Qualitative and Mixed methods approaches (Creswell, 2009) 106
Table 4.6 Respondents' profiles .................................................................................... 121
xiv
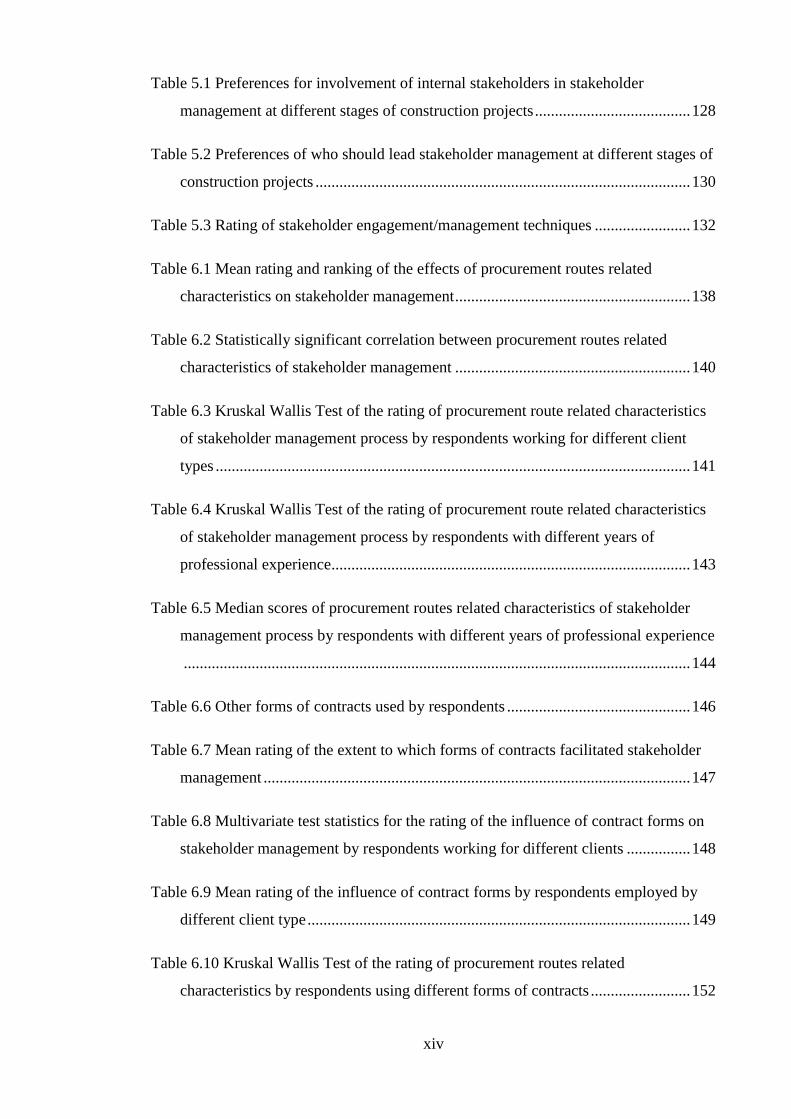
Table 5.1 Preferences for involvement of internal stakeholders in stakeholder
management at different stages of construction projects ....................................... 128
Table 5.2 Preferences of who should lead stakeholder management at different stages of
construction projects .............................................................................................. 130
Table 5.3 Rating of stakeholder engagement/management techniques ........................ 132
Table 6.1 Mean rating and ranking of the effects of procurement routes related
characteristics on stakeholder management ........................................................... 138
Table 6.2 Statistically significant correlation between procurement routes related
characteristics of stakeholder management ........................................................... 140
Table 6.3 Kruskal Wallis Test of the rating of procurement route related characteristics
of stakeholder management process by respondents working for different client
types ....................................................................................................................... 141
Table 6.4 Kruskal Wallis Test of the rating of procurement route related characteristics
of stakeholder management process by respondents with different years of
professional experience.......................................................................................... 143
Table 6.5 Median scores of procurement routes related characteristics of stakeholder
management process by respondents with different years of professional experience
............................................................................................................................... 144
Table 6.6 Other forms of contracts used by respondents .............................................. 146
Table 6.7 Mean rating of the extent to which forms of contracts facilitated stakeholder
management ........................................................................................................... 147
Table 6.8 Multivariate test statistics for the rating of the influence of contract forms on
stakeholder management by respondents working for different clients ................ 148
Table 6.9 Mean rating of the influence of contract forms by respondents employed by
different client type ................................................................................................ 149
Table 6.10 Kruskal Wallis Test of the rating of procurement routes related
characteristics by respondents using different forms of contracts ......................... 152

xv
Table 6.11 Mean ranks of the rating of procurement routes related characteristics by
respondents using different forms of contracts ...................................................... 153
Table 7.1 Mean rating and ranking of Critical Success Factors for Stakeholder
Management........................................................................................................... 161
Table 7.2 Result of GOF measures for both Conceptual and best fitting measurement
models of the CSFs for stakeholder management in construction......................... 164
Table 7.3 Standardised path coefficients of observed variables’ loading on latent
variables ................................................................................................................. 166
Table 7.4 Standardised correlation and covariance coefficients of the best fitting
measurement model of CSFs for stakeholder management in construction .......... 167
Table 7.5 Realigned critical success factors for stakeholder management in construction
projects ................................................................................................................... 168
Table 7.6 Final indicators of the constructs of the structural model of CSFs for
stakeholder management in construction projects ................................................. 170
Table 7.7 Standardised path coefficients of the conceptual structural model of the
interrelations among CSFs for stakeholder management in construction ............. 173
Table 7.8 Result of GOF measures for both Conceptual and best fitting structural
models .................................................................................................................... 174
Table 8.1 IDEF Techniques and their Purposes (Aguilar-Saven, 2004) ....................... 182
Table 8.2 Table 8.2 IDEF0 Interfaces and their Meanings ........................................... 183
Table 8.3 Node Index for SMIS Process Model ........................................................... 195
Table 9.1 Background information of the validators .................................................... 229
Table 9.2 Validation responses on scoring of key aspects of the framework ............... 233
Table 9.3 Percentage scores of the key aspects of the framework based on the scale
points ...................................................................................................................... 234

xvi
LIST OF FIGURES
Figure 1.1 Relationships among the objectives of the study ............................................. 8
Figure 1.2 Thesis Structure ............................................................................................. 11
Figure 2.1 Categories stakeholders based on their attributes (Mitchell et al., 1997) ...... 19
Figure 2.2 Stakeholder matrices ...................................................................................... 22
Figure 2.3 Categorisation of stakeholders (Winch, 2010). ............................................. 24
Figure 2.4 Strategic stakeholder management chart (Manowang and Ogunlana, 2010) 46
Figure 2.5 Framework for successful stakeholder management in construction (Yang et
al., 2009) .................................................................................................................. 49
Figure 2.6 Diagram of Delphi Technique process (Orndoff, 2005) ................................ 53
Figure 2.7 Problem solving stages and the Strategic Needs Analysis process (Smith and
Love, 2004) .............................................................................................................. 55
Figure 3.1 Grouping of Construction project success factors (adopted and modified
from Long et al., 2004) ............................................................................................ 65
Figure 3.2 Framework for factors affecting project success (adopted and modified from
Chan et al., 2004). .................................................................................................... 66
Figure 3.3 Grouping of construction procurement routes ............................................... 70
Figure 3.4 Conceptual Measurement Model of CSFs for Stakeholder Management in
Construction ............................................................................................................. 81
Figure 3.5 Hypothesised structural model of critical success factors for stakeholder
management in construction .................................................................................... 86
Figure 4.1 Nested research model (Kagioglou et al., 2000)............................................ 90
Figure 4.2 The research 'onion' (Saunders, et al., 2009) ................................................. 91
Figure 4.3 Research 'Choices' (Blaikie, 2007) ................................................................ 92

xvii
Figure 4.4 Framework for research design (Creswell, 2009) .......................................... 93
Figure 4.5 Research choices (Saunders et al., 2009)..................................................... 103
Figure 4.6 The research process .................................................................................... 105
Figure 4.7 Research design for this study ..................................................................... 107
Figure 5.1 Reasons for change in stakeholders' interests .............................................. 125
Figure 5.2 Means of tracking changes in stakeholders' interests .................................. 126
Figure 6.1 Mean rating of procurement routes related characteristics of stakeholder
management by respondents of different client types and years of experience ..... 142
Figure 6.2 Forms of contracts used by respondents ...................................................... 145
Figure 6.3 Mean ratings of procurement routes related characteristics of stakeholder
management by respondents of different years of experience and forms of contract
............................................................................................................................... 154
Figure 7.1 Conceptual Measurement Model of CSFs for Stakeholder Management in
Construction ........................................................................................................... 160
Figure 7.2 The Best Fit Measurement Model of CSFs for SM in Construction ........... 165
Figure 7.3 Hypothesised structural model of critical success factors for stakeholder
management in construction projects .................................................................... 172
Figure 7.4 Final structural model of critical success factors for stakeholder management
in construction projects .......................................................................................... 173
Figure 8.1 IDEF0 Box and Arrow Graphics (adapted from IDEF0, 2003) .................. 183
Figure 8.2 Decomposition of IDEF0 Diagram .............................................................. 184
Figure 8.3 Conceptual life cycle based framework for stakeholder management in
construction projects .............................................................................................. 186
Figure 8.4 Overall stakeholder management in construction projects Model SM/A-0
Process ................................................................................................................... 188

xviii
Figure 8.5 Life cycle based framework for stakeholder management in construction
projects – SM/A0 Process ...................................................................................... 189
Figure 8.6 SMIS Model – A0 Process .......................................................................... 191
Figure 8.7 SMDS – A0 Process .................................................................................... 192
Figure 8.8 SMCS – A0 Process .................................................................................... 193
Figure 8.9 SMOS – A0 Process .................................................................................... 194
Figure 8.10 Identify stakeholder characteristics and project characteristics - SMIS/A1
............................................................................................................................... 197
Figure 8.11 Carryout stakeholder analyses – SMIS/A2 ................................................ 199
Figure 8.12 Map stakeholders’ dynamism – SMIS/A3 ................................................. 200
Figure 8.13 Plan stakeholder engagement/empowerment strategies – SMIS/A4 ......... 201
Figure 8.14 Implement stakeholder management plan – SMIS/A5 .............................. 202
Figure 8.15 Identify stakeholder characteristics and project characteristics - SMDS/A1
............................................................................................................................... 204
Figure 8.16 Carryout stakeholder analyses – SMDS/A2 .............................................. 205
Figure 8.17 Map stakeholders’ dynamism – SMDS/A3 ............................................... 206
Figure 8.18 Plan stakeholder engagement/empowerment strategies – SMDS/A4 ....... 208
Figure 8.19 Implement stakeholder management plan – SMDS/A5 ............................ 209
Figure 8.20 Identify stakeholder characteristics and project characteristics - SMCS/A1
............................................................................................................................... 210
Figure 8.21 Carryout stakeholder analyses – SMCS/A2 .............................................. 212
Figure 8.22 Map stakeholders’ dynamism – SMCS/A3 ............................................... 213
Figure 8.23 Plan stakeholder engagement/empowerment strategies – SMCS/A4 ........ 215
Figure 8.24 Implement stakeholder management decisions – SMCS/A5..................... 216

xix
Figure 8.25 Identify stakeholder characteristics and project characteristics at –
SMOS/A1............................................................................................................... 217
Figure 8.26 Carryout stakeholder analyses – SMOS/A2 .............................................. 219
Figure 8.27 Map stakeholders’ dynamism – SMOS/A3 ............................................... 220
Figure 8.28 Plan stakeholder engagement/empowerment strategies – SMOS/A4 ....... 221
Figure 8.29 Implement stakeholder management decisions - SMOS/A5 ..................... 223
Figure 9.1 Framework Validation Process .................................................................... 230
1
1. CHAPTER ONE: INTRODUCTION
1.1 Background
Construction projects are traditionally divided into series of activities or operations
undertaken by different individuals or groups who may have different levels of interest
and or involvement in the project (Egan, 1998). Construction projects are generally
unique in nature based on their fragmentation, processes and interaction with numerous
parties; and just like any other venture, are constrained by time and resources (both
human and material) which are needed for the projects to be delivered (Ibrahim and
Nissen, 2003; Bourne, 2005; Olander, 2006). Therefore, the lengthy process of design
and execution of construction projects constitutes a complex system which involves
collaboration and negotiations among many stakeholders which may include but not
limited to the clients, designers, contractors, local authorities and the general project
environment (Cheeks, 2003; Winch, 2010). The different parties involved both directly
and indirectly on the project are referred to as the project stakeholders whose
management is vital to achieving project success (Cleland, 2002). Stakeholder
management therefore, has been recognised as an important strategy for achieving
project success in construction projects.
1.1.1 Who are construction project stakeholders
Knowing the stakeholders and their characteristics relative to the project is an important
step in stakeholder management (Cleland, 2002) but this can only be achieved through
an adequate definition of stakeholders. However, despite the recognition of stakeholder
management as an important strategy for achieving project success, the definition of
stakeholders is not clearly certain as project stakeholders have been defined in different
ways (see section 2.2 for more details). While some definitions of project stakeholders
are criticised for being too narrow (Smith, et al., 2001; Smith and Love (2004);
Olander, 2007; Walker et al., 2008), others suffer criticisms for being too broad
(Freeman, 1984; Juliano, 1995; Awakul and Ogunlana, 2002; PMI, 2004; Takim, 2009;
Winch, 2010). Relying on the too narrow definition will expose the project management
team to the risk of leaving out some important stakeholders. Similarly, relying on the
too broad definition will expose the project management team to the risk of involving
too many stakeholders including those who are not important to the project (Leung and

2
Olomolaiye, 2010). Therefore, the following definition has been coined out of the
different definitions for the purpose of this study:
“Construction project stakeholders are individuals or groups/organisations who have
some aspects of right or ownership in the project and can contribute to it; or will incur
or justifiably perceive they will incur a direct benefit or loss as a result of either the
works during the project or the outcome of the project.”
This definition will be used for this study and the term “stakeholder” will be used to
refer to stakeholders both as individuals and as group(s) of individuals.
Different classifications have also been adopted for stakeholders by scholars (Mitchell
et al., 1997; Newcombe, 2003; Bourne and Walker, 2005; Olander, 2007; Aaltonen et
al., 2008; Chinyio and Akintoye, 2008; Winch 2010) depending on their possession of
certain attributes and disposition towards the project. Winch (2010) for instance,
classify construction project stakeholders into two categories according to their
relationship with the client: (1) internal stakeholders which are those who are in legal
contract with the client and (2) external stakeholders which also have direct interest in
the project though not necessarily having direct contracts with the client. He further
broke them down as follows: internal stakeholders into those (stakeholders) clustered
around the client on the demand side and those on the supply side, while external
stakeholders are broken down into private and public actors. The stakeholder
classification by Winch (2010) is used as a guide throughout the study.
1.1.2 Link between stakeholder management and project success in construction
The focus of construction project management over the years has been on the processes
leading to the effective planning and management of the complex series of activities
involved in delivering successful projects (Morris 1994). According to Takim (2009),
the complex interaction and interrelationships that take place among the parties
involved in a construction project determine the overall successful completion of the
project. Furthermore, project success has been linked to the effective continuous
engagement/management of all the project’s stakeholders (Cleland, 1999; Bourne and
Walker, 2005; Olander, 2007; Aaltonen et al., 2008; Ward and Chapman, 2008; Chinyio
and Akintoye, 2008). The traditional perception of project success being judged based
on cost quality and time has changed over time to include; micro and macro viewpoints,
reduced conflicts and disputes, environmental friendliness and stakeholder satisfaction

3
(Lim and Mohamed, 1999; Cookie-Davies, 2002; Bryde and Brown 2005; Low and
Chuan 2006; Toor and Ogunlana 2010). Previous researches have attributed project
failures to either lack of or in adequate stakeholder management during the project
(Black, 1995; Akintoye et al. 2003; Bourne, 2005; Olander and Landin, 2008).
Therefore, in order to achieve project success and in line with the current perception of
construction project success, it is important to engage/manage stakeholders effectively
in the course of carrying out the project. The question however, still remains of how
effective stakeholder management can be carried out in construction projects.
The following have been identified to be among the causes of project failure: poor scope
and work definition; in adequate resources assigned to the project; unforeseen
regulatory changes; and negative community reaction to the project (Black, 1995). Most
of these could be associated with either uninformed or ineffective stakeholder
management on the project; for instance, the early involvement and considerations of
the interests of stakeholders is vital to being able to clearly define and set out the project
scope and goals which could also help to avert negative community reaction to the
project. Mere involvement of these key stakeholders is however, not a guarantee for
achieving a successful project; it also needs to be properly done.
Furthermore, the success or failure of a project is influenced very strongly by the
expectations and perceptions of the stakeholders involved on the project and failure to
balance and or address the concerns of the stakeholders has resulted in many projects
failing (Bourne, 2005; Chinyio, 2010). Similarly, differing or conflicting objectives
among the project stakeholders are among the factors that impede the achievement of
best value in construction projects (Akintoye et al. 2003). Therefore, involving the
stakeholders at the front end planning and further integrating them into the project team
can help to avoid/overcome problems associated with stakeholder issues. Such problems
could be in the form of conflicts and controversies which can obstruct the project
implementation process and consequently lead to delays, cost overruns, dissatisfaction
and claims (Faniran et al., 1999; Jergeas et al., 2000; Karlsen, 2002; Olander and
Landin, 2005; Yu et al., 2007; Yang et al., 2011). For instance, Jeargeas et al., (2000)
found that problems caused by stakeholders due to their lack of involvement in the
project could negatively affect projects in terms of budget, schedules and relationship
with the stakeholders. Therefore, managing stakeholders becomes a vital skill for
construction project management team since the successful completion of projects
depends on among other things, meeting the expectations of the stakeholders and

4
ensuring a smooth running of the project (Cleland, 1995; Vinten, 2000; Newcombe,
2003; Bourne 2005; Aaltonen et al., 2008).
Stakeholders’ interests and influences are not constant and can vary from one stage to
another and even from time to time in a particular stage of the project lifecycle (Cleland,
1995; Jergeas et al., 2000; Olander, 2007; Aaltonen et al., 2008; Ward and Chapman,
2008;). This is an indication of the dynamic relationships that exist among the
stakeholders themselves as well as between the stakeholders and the project which also
shows that events and actions are interdependent on each other (Pajunen, 2006; Olander,
2007; Nash et al., 2010). The stakeholders involved may have their respective
expectations from the project and satisfying the expectations of project stakeholders
throughout the life cycle of the project is instrumental to the successful completion of
construction projects (Atkin and Skitmore, 2008). In pursuing their interests and
expectations on projects, stakeholders can behave in different ways including
cooperative potential, competitive threats, opposite position and neutral attitude (Yang
et al., 2014). Therefore, stakeholder involvement and management should not stop at
the front end project planning stage or at any stage at all but continue throughout the
entire lifecycle of the project (Takim, 2009). Olander and Landin (2008) argued that “if
there is no clear strategy for how to manage and involve stakeholders in the project
implementation process, the project manager will end up in a rearguard action, fending
off claims from stakeholders”. However, the suggestion that the project manager is
responsible for stakeholder management is arguable; as this will depend substantially on
the procurement route being used, the stage at which the project is and other project
characteristics.
1.1.3 Stakeholder management process
The main steps involved in stakeholder management in construction projects include
stakeholder identification, stakeholder analysis, stakeholder classification and
formulating/adopting stakeholder management strategy (Cleland, 1999). Moreover, the
effective use of communication, negotiations, intuition, incentives, concessions, and
workshops/meetings are useful operational principles for managing stakeholders
(Chinyio and Akintoye, 2008). In line with these, scholars (Newcombe, 2003; Bourne
and Walker, 2005; Olander, 2007; Reed et al., 2009 etc) have proposed approaches for
stakeholder identification and analysis but less attention has been paid to the practical
use of these approaches except in the works of (Smith and Love, 2004; Chinyio and
Akintoye, 2008; Jepsen and Eskerod, 2009). Consequently, project managers for

5
instance, have been reported to be having difficulties in analysing the stakeholders
adequately before adopting a stakeholder management strategy (Jepsen and Eskerod,
2009). This indicates the need to study the current practice of stakeholder management
in construction projects.
The emphasis of stakeholder management in construction projects has been on
procurement and site management related activities which are mainly based on the
internal stakeholder relationships (Atkin and Skitmore, 2008). Rwelamila (2010)
suggested either the use of hybrid traditional procurement methods or a different
procurement method that enables cooperation and collaboration between the teams and
among the team members to improve stakeholder management in construction projects.
However, there is a paucity of empirical evidence of studying the impact of
procurement routes on the process of stakeholder management in construction projects.
1.1.4 Justification for the research
It is necessary to carryout stakeholder management from the inception stage and
continue throughout the project in order to minimize problems of protest and delays in
construction projects (Smith and Love, 2004; Chinyio and Olomolaiye 2010). The need
for a formally coherent approach for stakeholder management in construction projects
has been raised in previous research (Cleland, 1999; Karlsen, 2002; Olander and
Landin, 2005; Chinyio and Akintoye, 2008) and has yet to be addressed. This coherent
approach needs to span from the project inception stage to design and construction to
operation stage focussing on ensuring collaboration between the design professionals
and the construction management professionals as well as the facility management
organisation.
Previous research efforts in the field of stakeholder management in construction
projects have focussed on the aspects of identifying, analysing, classifying, visualising,
predicting and managing the stakeholders. However, very little research has focused on
the formulation of a comprehensive framework for stakeholder management in
construction except the work of Yang et al. (2009) which is discussed in section 2.7.
Furthermore, previous studies have identified and studied the critical success factors
(CSFs) for stakeholder management in construction projects (Jergeas et al., 2000;
Chinyio and Akintoye, 2008; Olander and Landing, 2008; Yang et el., 2009; Jepsen and
Eskerod, 2009; Li et al., 2011). For instance, Yang et al. (2009) explored and grouped

6
15 CSFs for stakeholder management and Li et al., (2011) studied the hierarchical
groupings of 16 CSFs for stakeholder management. More details on these factors are
given in section 2.6. It is hereby argued that to study the relationships (or
interdependencies) among these factors in order to understand how they affect and or
influence each other is necessary to inform a holistic and coherent stakeholder
management.
The review of previous studies on stakeholder management in construction projects
points to the existence of a number of problems (gaps) in stakeholder area management
in construction projects including: Lack of continuity in the stakeholder management
process, lack of clear definition or agreement as to who should be responsible for
stakeholder management, lack of a comprehensive framework that covers all the stages
in the construction process, lack of clear delineation of the relationships between the
critical success factors for stakeholder management in construction projects, lack of
recognition of the influence of procurement routes and form of contracts on stakeholder
management process.
Therefore, it is necessary to explore the relationships amongst groups of critical success
factors for stakeholder management in construction; to investigate the current practice
of stakeholder management in construction projects; to investigate the impact of
procurement routes and contracts on the stakeholder management process; to identify
who should be responsible for stakeholder management; and to create collaboration
between the internal stakeholders at all stages in carrying out stakeholder management
in order to ensure continuity in the process.
1.2 Research Questions
The main research question is: How can stakeholder management be improved to
enhance the propensity of achieving successful construction projects execution? The
sub research questions are as follows:
1. What is the current practice (is stakeholder management done as a personal
intuitive initiative or based on a conscious strategy for doing so) of stakeholder
management in construction projects?
2. What are the critical success factors for stakeholder management and how could
they be used to improve stakeholder management?

7
3. How are the critical success factors for stakeholder management in construction
projects related?
4. What are the techniques and tools for stakeholder management in construction
projects and to what extent are they used?
5. How do procurement route and contract forms affect stakeholder management in
construction projects?
6. Who is (or should be) responsible for doing stakeholder management in
construction projects?
7. How can stakeholder management be carried out throughout the project lifecycle
in construction projects with multiple stakeholders?
1.3 Research Aim and Objectives
The overall aim of this study is to explore the formulation of a comprehensive
framework for stakeholder management in construction projects with demanding
stakeholder issues (projects with multiple and diverse stakeholders and interests), which
integrates and links the different stages of the project life cycle considering the effects
of the procurement route. In pursuing this aim, the following objectives which are
related as shown in Figure 1.1 are set:
1. To review previous work on stakeholder management in construction projects.
2. To empirically investigate the current practice of stakeholder management
within the construction industry.
3. To empirically assess the effect of procurement routes and contract conditions
on stakeholder management process.
4. To model the relationship among the critical success factors for stakeholder
management in construction projects.
5. To develop a comprehensive life cycle based framework for stakeholder
management in construction projects.
6. To validate/evaluate the framework.

8
Objective 1:
Literature on
stakeholder management
in construction projects
and other related topics
Objective 4:To model the
relationship among the
critical success factors
for stakeholder
management in
construction projects
Objective 3:To assess the effect of
procurement routes and
contract conditions on
stakeholder management
process
Objective 2:To investigate the
current practice of
stakeholder management
within the construction
industry
Objective 5:To develop a life cycle
based framework for
stakeholder management
in construction projects
Objective 6:To validate/evaluate the
framework
Aim:Life cycle based framework
for stakeholder management
in construction projects
Data collection & analysis
Framework development & validation
Figure 1.1 Relationships among the objectives of the study
1.4 Research Methodology
There are different ways to design research to achieve the aim and objectives of any
research venture. According to Blaikie (2007), there are two ways to solving research
problem(s); either to adopt one approach or explore a combination of appropriate
approaches for the research depending on the nature of the problem(s) to be
investigated. In other words, research problems can be addressed either by using
qualitative, quantitative or mixed methods research design (Creswell, 2009).
Given the complex nature of the issues associated with construction project stakeholder
management, it is difficult to adopt a single research strategy towards achieving the aim
and objectives of this study. The issues to be addressed in this research are considered

9
complex because they involve different interdependent aspects as shown in Figure 1.1
to be addressed. Moreover, in a complex system, sequences of interaction will normally
involve feedback loops, on the long and short terms as well as positive and negative;
while the positive feedbacks stimulate or enhance the activities of the system, the
negative feedbacks inhibits or restricts the activities of the system (Cilliers, 2005).
Similarly, complex systems have the potentials of producing unpredictable and novel
outcomes from the interactions that take place between the parts that make them up to
be complex (Blaikie, 2007). It is therefore necessary to adopt appropriate strategies as
would enable the research objectives to be achieved leading to viable solutions to the
research questions.
The methodology adopted to achieve the aim and objectives of this research (see
Chapter four for more details) consist of the combination of the following methods:
literature reviews, questionnaire survey, framework development and
validation/evaluation.
The literature review consists of the following reviews: review of previous studies on
construction stakeholder management, review of construction project success and key
performance indicators (KPIs), procurement routes, the review of collaborative working
in construction and review of literature on research methodology. These reviews were
based mainly on secondary documentation and sources of information such as journal
papers, conference papers, books; and primary sources of information such as PhD
theses. The literature review was used to establish the research gaps and identify critical
success factors (CSFs) for stakeholder management in construction projects.
In order to investigate the current practice of stakeholder management in construction, a
questionnaire administered to practitioners in the industry within the United Kingdom
was used to survey the opinions and experience of respondents regarding the current
practice and who should be responsible for leading stakeholder management at the
various stages of the construction project life cycle. The respondents were construction
professionals with relevant industry experience of at least five years.
The identified critical success factors for stakeholder management in construction were
evaluated through the same questionnaire. This was done with the view to ascertaining
any causal or interdependent relationship among the critical success factors for
stakeholder management in construction projects. The data obtained was analysed using

10
structural equation modelling (SEM) to explore the interrelationships among the CSFs
based on their groupings and between them and project success. The same questionnaire
was used to explore the influence of procurement routes and contracts type as well as
other project characteristics on stakeholder management process.
Based on the results obtained from the above processes (literature review and industry
survey), a comprehensive framework for construction projects’ stakeholder
management was developed. The framework was developed using integrated definition
(IDEF0) process modelling.
To evaluate/validate the framework, a survey was carried out with selected industry
practitioners using structured interview and questionnaire. The quantitative and
qualitative data collected from the validation interview sessions were analysed using
appropriate statistical techniques and thematic analyses respectively.
Table 1.1 shows a mapping of the objectives of the study with their corresponding data
collection techniques and analysis tools.
Table 1.1 Mapping of objectives with corresponding data collection and analysis
Techniques
Methods
Objectives
Lit
eratu
re R
evie
w
Qu
esti
on
nair
e
Str
uct
ure
d I
nte
rvie
w
Des
crip
tive
Sta
tist
ics
Th
emati
c an
aly
sis
Para
met
ric
an
d n
on
-
Para
met
ric
Sta
tist
ics
CF
A
SE
M
IDE
F0 P
roce
ss M
od
elli
ng
Objective 1 √
Objective 2 √ √ √
Objective 3 √ √ √
Objective 4 √ √ √ √
Objective 5 √ √ √
Objective 6 √ √ √ √

11
1.5 Thesis structure
The thesis is presented in ten chapters. This section gives a brief introduction of the
chapters in order to outline the chronological flow (Figure 1.2) of the different parts of
the thesis.
CHAPTER 2
Literature Review on Stakeholder
Management in Construction
Projects
CHAPTER 3
Literature Review on Project
Success, Life Cycle, Procurement
Routes and Stakeholder
Collaboration
CHAPTER 4
Research Methodology
CHAPTER 7
Interrelationships among
Critical Success Factors
for Stakeholder
Management in
Construction Projects
CHAPTER 6
Effects of Procurement
Routes and Contract
Forms on Stakeholder
Management Process in
Construction
CHAPTER 5
Current Practice of
Stakeholder Management
in Construction Projects
CHAPTER 10
Summary, Conclusions and Recommendations
CHAPTER 9
Framework Validation
CHAPTER 8
Development of Life Cycle Based Framework for
Stakeholder Management in Construction Projects
CHAPTER 1
Introduction covering Background, Aim and
Objectives, Research Methodology and Thesis
Structure
Pre
– F
ield
Work
Act
ivit
ies
Post
- F
ield
Work
Act
ivit
ies
Figure 1.2 Thesis Structure

12
Chapter One: Introduction
This chapter presents an introduction to the study by giving background to the research
topic; research questions; aim and objectives; brief statement of methodology and
structure of the thesis.
Chapter Two: Stakeholder management
This chapter presents the findings of a literature review on stakeholder management in
construction covering: stakeholder definition; stakeholder classification; need to manage
stakeholders in construction projects; critical success factors for successful stakeholder
management in construction; and stakeholder management approaches.
Chapter Three: Project success, procurement routes, project life cycle and
stakeholder collaboration
This chapter presents a literature review on construction project life cycle, construction
project success, construction procurement routes and stakeholder collaboration in
construction. It also presents the conceptual models of CSF for stakeholder management
in construction identified in chapter 2.
Chapter Four: Research methodology
This chapter discusses the research methodology for this study. It starts by giving a
general background and comparison of the concepts guiding research design, explains
the main components of the research design model found most suitable and adopted in
this study for guiding research design and then presents the research design and
methodology adopted for the study reported in this thesis as well as research validity
and reliability.
Chapter Five: Current practice of stakeholder management in construction
projects
This chapter presents data analysis results obtained in respect of investigation the
current practice of stakeholder management in construction projects covering
stakeholder management decision, responsibilities, collaboration and techniques. Data
obtained from the questionnaire about stakeholder management decisions and
responsibilities; change in stakeholder interests/disposition towards the project;
stakeholder collaboration; stakeholder dynamics; techniques for stakeholder

13
engagement/management; and general comments of respondents were analysed and
presented. Finally, a summary of findings and conclusions drawn from these results are
highlighted.
Chapter Six: Effects of procurement routes related characteristics on stakeholder
management in construction projects
This chapter presents the results of data analyses in respect of investigating the effects
of procurement routes alongside contract forms on stakeholder management in
construction projects. Firstly, the extent to which procurement routes related
characteristics of stakeholder management can influence stakeholder management
process in projects is analysed and presented followed by relationships between client
type and procurement routes related characteristics, relationships between contract
forms and procurement route related characteristics and effects of forms of contracts on
stakeholder management in construction projects.
Chapter Seven: modelling the relationships among CSFs for stakeholder
management in construction projects
This chapter addresses the evaluation of the conceptual measurement and structural
models of the critical success factors for stakeholder management developed in chapter
3.
Chapter Eight: Development of life cycle based framework for stakeholder
management in construction projects
This chapter presents the development of the framework for stakeholder management in
construction resulting from this study. The chapter starts with an overview of the
framework for stakeholder management followed by framework development approach,
features of the framework, IDEF0 process models of framework for stakeholder
management and then chapter summary.
Chapter Nine: Framework validation/evaluation
This chapter presents the validation/evaluation of the life cycle based framework for
stakeholder management in construction projects presented in chapter 8. It begins with
an explanation of the aim and objectives of validating/evaluating the framework
followed by an explanation of the methodology adopted for the validation/evaluation.

14
Next is presentation of the analyses of the data collected during the framework
validation/evaluation process. Following this, the suggested improvements, barriers to
the use of the framework and further development of the framework are presented. The
results obtained are then discussed and the chapter summary is presented.
Chapter Ten: Conclusions, Limitations and Recommendations for further
research
This chapter summarises the overall research undertaken in pursuing the research aim
and evaluates it against the specific research objectives set out. The conclusions reached
are then presented and the research limitations are discussed. The Chapter also presents
recommendations for practice and further research.

15
2. CHAPTER TWO: LITERATURE REVIEW ON STAKEHOLDER
MANAGEMENT IN CONSTRUCTION PROJECTS
2.1 Introduction
This chapter presents the findings of a literature review on stakeholder management in
construction covering: stakeholder definition; stakeholder classification; need to manage
stakeholders in construction projects; critical success factors for successful stakeholder
management in construction; and stakeholder management approaches.
2.2 Stakeholders Definition
This section critically reviews different views on the meaning and definitions of
“stakeholders” and coins a definition for this study.
In seeking to improve project delivery and success/performance, stakeholder
management offers a great opportunity; hence it is an important consideration.
However, despite its growing popularity, there is no common definition for
“stakeholders” agreed by all researchers. Different authors have defined stakeholders
differently, though mostly similar, depending on the nature of their stakes. According to
Freeman (1984) stakeholders are any group or individual who can affect or are affected
by the achievement of the cooperation’s purpose. He traced this back to a memo of
Stanford research institute in 1963, which states that stakeholders are those groups
without whose support the organisation will cease to exist. Similarly, Juliano (1995)
argued that stakeholders could be an individual, individuals, team or teams affected by
the project. Smith, et al. (2001) define stakeholders as representatives, direct and
indirect, who may have an interest and can contribute to the proposed project. Awakul
and Ogunlana (2002) defined construction project stakeholders in similar vein but they
argued, non-governmental organisations, government officials, academics and other
interested stakeholders should be added to the list of parties that are likely to be
involved in a large construction project. Smith and Love (2004) are of the view that
stakeholders are direct and indirect representatives of interests who can make
contributions to the proposed project, and may include:
Owner/client,

16
Senior managers/executives, facilities managers, project managers,
Staff or employees,
Purchasers, subcontractors, suppliers, and other process or service providers,
Tenants, residents, community representatives, neighbours,
Visitors, customers (potential and future), users, partners, or other interest
groups,
Design team members (if appropriate) and
Others, depending on the project and attitude of the organization to participation
and involvement in the process.
Olander (2007) defined project’s stakeholders as a person or group of people who has a
vested interest in the success of the project and the environment within which the
project operates. He further referred to them as, representatives of the various interests
that will be affected during the different stages of the construction project from
initiation to handover both positively and negatively. Walker et al. (2008) defined
stakeholders as individuals or groups who have an interest or some aspect of rights or
ownership in the project, and can contribute to or be impacted by, either the work or the
outcomes of the project. The PMI (2004) refer to stakeholders as individuals or
organisations who are actively involved in the project or whose interests may be
affected as a result of the project execution or completion.
Takim (2009) define stakeholders as those who can influence the activities/final results
of the project, whose life or environment are positively or negatively affected by the
project, and who receive direct and indirect benefits from it. He limited these to five
groups namely: client, consultant, contractor, end-users and the community of the
project.
Winch (2010) defined it as those actors which will incur or perceive they will incur a
direct benefit or loss as a result of the project. Li et al. (2012) defined stakeholders as
“those who can influence the project process and/or final results, whose living
environments are positively or negatively affected by the project and who receive
associated direct and indirect benefits and or losses”.
17
The definitions of (Freeman, 1984; Juliano, 1995; Awakul and Ogunlana, 2002; PMI,
2004; Takim, 2009; Winch, 2010) can be criticized for being broad because they merit
everyone at all to be considered as stakeholders on a project. On the other hand, the
definitions of (Smith, et al., 2001; Smith and Love (2004); Olander, 2007; Walker et al.,
2008) can be criticized for being narrow because they tend to exclude some relevant
group of stakeholders. The narrow definition of stakeholders is only useful for
identifying those stakeholders with direct stakes and economic relationships with the
project and excludes those without direct economic relationships but may be capable of
influencing the project implementation process (Leung and Olomolaiye, 2010). This
means that relying on the broad definitions alone for identifying project stakeholders
will lead to including those who do not really have any stake in the project and relying
on the narrow definitions alone will also lead to the exclusion of some important
stakeholders both of which situations can be dangerous to the smooth running of the
project. With both views having their strengths and weaknesses, it is important for this
study to adopt a definition that will guide further considerations of who stakeholders
are. The following definition is therefore coined:
“Construction project stakeholders are individuals or groups/organisations who have
some aspects of right or ownership in the project and can contribute to it; or will incur
or justifiably perceive they will incur a direct benefit or loss as a result of either the
works during the project or the outcome of the project.”
This definition combines the features of both the narrow and broad definitions of
stakeholders. The next section discusses the different classification of stakeholders.
2.3 Stakeholders’ Classification
This section discusses different stakeholders’ classifications according to their
possession of certain attributes, contractual relationships with the project and with each
another and attitudes towards the project; these are discussed in the following sub
sections:
2.3.1 Classification according to Stakeholders’ attributes (Power, Legitimacy,
Proximity and Urgency)
Stakeholders possess certain attributes that determine their relationship and ability to
make claims and impose their will on the project. These are power, legitimacy,

18
proximity and urgency (Mitchell et al., 1997; Walker et al., 2008). These attributes are
defined as follows:
1. Power: The capacity of a stakeholder to influence the action of other
stakeholders either positively or negatively or the decision making process of the
project. This can be acquired and it can also be lost.
2. Legitimacy: The perceived validity of stakeholders’ claim. It can also be defined
in terms of stakeholders bearing some risks in relation to the project which could
either be beneficial or detrimental to the project.
3. Proximity: this refers to the level of association of the stakeholders with the
project. Depending on their proximity, they can have direct involvement on the
project or operate remotely from the project.
4. Urgency: The degree to which stakeholders’ claim requires immediate attention.
The use of the attribute of proximity instead of legitimacy could be more helpful
because proximity as an attribute is easier to operationalise whereas the attribute of
legitimacy is imprecise and difficult to explain (Yang et el., 2009).
Mitchell et al. (1997) categorised stakeholders (Figure 2.1) based on whether or not
they possess the power to influence decision and progress, legitimacy in relation to
other stakeholders and Urgency of claim on the project. They classify stakeholders in
terms of their possession of any one or combination of these attributes as follows:
Power only: Dormant;
Legitimacy only: Discretionary;
Urgency only: Demanding;
Power and Legitimacy: Dominant;
Power and Urgency: Dangerous;
Urgency and Legitimacy: Dependent and
Power, Legitimacy and Urgency: Definitive.

19
Power
Urgency
Definitive
Dominant
Dangerous Dependent
Discretionary
Demanding
Dormant
Legitimacy
Figure 2.1 Categories stakeholders based on their attributes (Mitchell et al., 1997)
These different classes of stakeholders are defined as follows:
1. Dormant stakeholders: Although they have the power to exert their will, they
lack the legitimacy and urgency to make any claim on the project. Their power
therefore will remain unused and may not exert any pressure on the project.
2. Discretionary stakeholders: They have the attribute of legitimacy but do not
have power and urgency hence cannot mount pressure on the project
management team to actively engage them. However, when they form alliance
with other stakeholders, they could mount some pressure on the project.
3. Demanding stakeholders: This class of stakeholders have the attribute of
urgency but lack the attributes of power and legitimacy. The demanding nature
of their stakes makes them to require management attention because they could
become more problematic when they are able to form alliance with other
stakeholders.
4. Dominant stakeholders: These stakeholders have the attributes of both power
and legitimacy and lack the attribute of urgency of claim, thereby making them
to occupy an important place in management’s consideration of stakeholders’
needs.
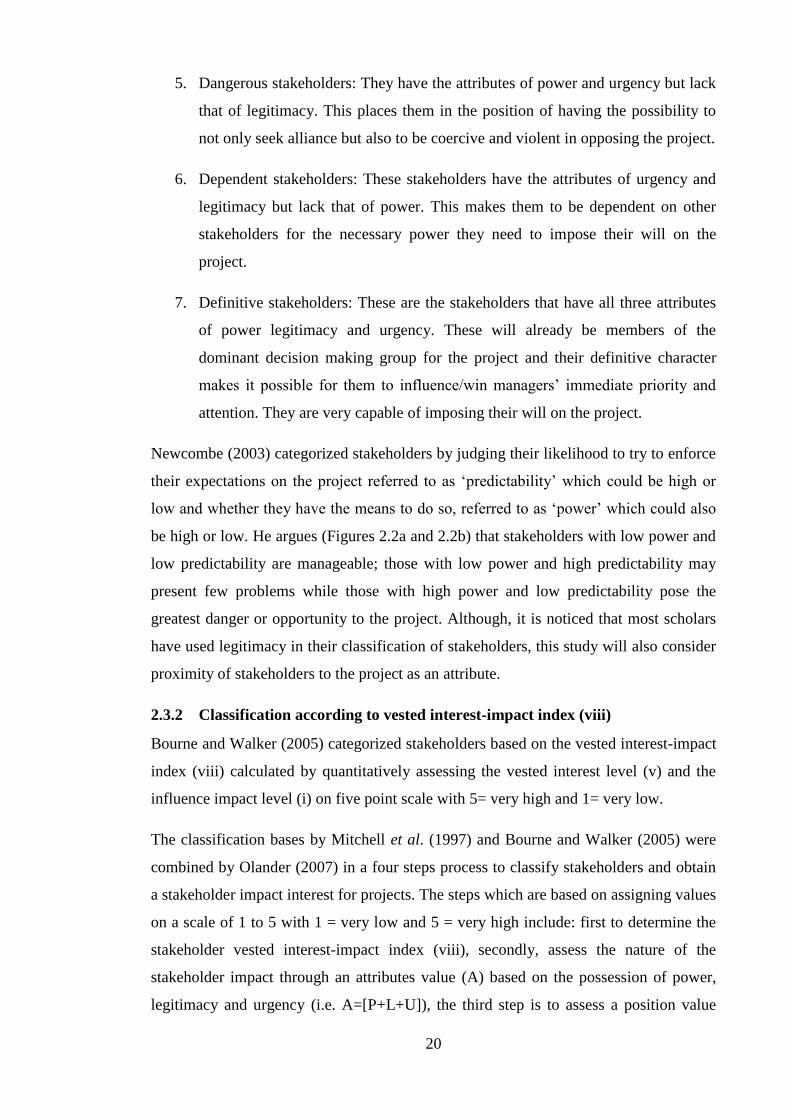
20
5. Dangerous stakeholders: They have the attributes of power and urgency but lack
that of legitimacy. This places them in the position of having the possibility to
not only seek alliance but also to be coercive and violent in opposing the project.
6. Dependent stakeholders: These stakeholders have the attributes of urgency and
legitimacy but lack that of power. This makes them to be dependent on other
stakeholders for the necessary power they need to impose their will on the
project.
7. Definitive stakeholders: These are the stakeholders that have all three attributes
of power legitimacy and urgency. These will already be members of the
dominant decision making group for the project and their definitive character
makes it possible for them to influence/win managers’ immediate priority and
attention. They are very capable of imposing their will on the project.
Newcombe (2003) categorized stakeholders by judging their likelihood to try to enforce
their expectations on the project referred to as ‘predictability’ which could be high or
low and whether they have the means to do so, referred to as ‘power’ which could also
be high or low. He argues (Figures 2.2a and 2.2b) that stakeholders with low power and
low predictability are manageable; those with low power and high predictability may
present few problems while those with high power and low predictability pose the
greatest danger or opportunity to the project. Although, it is noticed that most scholars
have used legitimacy in their classification of stakeholders, this study will also consider
proximity of stakeholders to the project as an attribute.
2.3.2 Classification according to vested interest-impact index (viii)
Bourne and Walker (2005) categorized stakeholders based on the vested interest-impact
index (viii) calculated by quantitatively assessing the vested interest level (v) and the
influence impact level (i) on five point scale with 5= very high and 1= very low.
The classification bases by Mitchell et al. (1997) and Bourne and Walker (2005) were
combined by Olander (2007) in a four steps process to classify stakeholders and obtain
a stakeholder impact interest for projects. The steps which are based on assigning values
on a scale of 1 to 5 with 1 = very low and 5 = very high include: first to determine the
stakeholder vested interest-impact index (viii), secondly, assess the nature of the
stakeholder impact through an attributes value (A) based on the possession of power,
legitimacy and urgency (i.e. A=[P+L+U]), the third step is to assess a position value

21
(Pos) and fourth is to calculate the impact index for each stakeholder using Viii*A*Pos
and then sum up the overall for stakeholders to obtain the stakeholder impact index for
the project. They classified them based on their final position value as follows: active
opposition- Pos = -1; passive opposition- Pos = -0.5; not committed- Pos = 0; passive
support- Pos = 0.5 and active opposition- Pos = 1. This means that stakeholders that are
found to have position values less than zero (0) are likely to oppose the progress of the
project whereas, stakeholders with position values above zero (0) are likely to support
the project.

22
High Low
Predictability
Low
High
Few problemsUnpredictable
but manageable
Powerful but
predictable
Greatest danger or
opportunities
Figure 2.2a: Stakeholder power/predictability matrix
(Newcombe, 2003).
Power
High Low
Level of interest
Power
High
Low
Minimal effort Keep informed
Keep satisfied Key players
Figure 2.2b: Stakeholder power/interest matrix
(Newcombe, 2003).
Figure 2.2 Stakeholder matrices

23
2.3.3 Classification according to contractual relationship
Winch (2010) uses the contractual relationship between them and the client to
classifying construction project stakeholders into internal and external stakeholders
(Figure 2.3). Internal stakeholders are those who have legal contractual relationship
with the project owner and are grouped into demand and supply sides stakeholders.
External stakeholders do not have any contractual relationship with the project owner,
but have some rights and interests in the project and are grouped into private and public
sides’ stakeholders. Stakeholders can also be classified based on their relationships with
and proximity to the project: Those directly involved in the decision making and
operations of the project are considered as primary or direct stakeholders whilst those
who do not have any direct relationship and are operating remotely from the project are
considered secondary or indirect or outside stakeholders (Newcombe, 2003; Smith and
Love, 2004).
2.3.4 Classification according to stakeholder attitudes towards the project
Olander (2007) view stakeholders as being either proponents or opponents of the project
and similarly (Aaltonen et al., 2008; Chinyio and Akintoye, 2008) consider stakeholders
as being supportive, neutral or anti to the project. These are very important for the
purpose of decision making and resource allocation by the project management
especially to be able to convert the neutral, opponents/anti to supportive stakeholders.

24
Construction project
stakeholders
Internal Stakeholders
Demand side
Client
Financiers
Client's employees
Client's customers
Client's tenants
Clients suppliers
Supply side
Architects
Engineers
Principal contractors
Trade contractors
Material suppliers
External Stakeholders
Private
Local residents
Local landowners
Environmentalists
Conservationists
Archaeologists
Non-governmental organisations(NGOs)
Media
Public
Regulatory agencies
local governments
regional governments
National government
International government agencies
Figure 2.3 Categorisation of stakeholders (Winch, 2010).

25
These classifications (summarised in Table 2.1) indicate the various views that exist on
how scholars perceive project stakeholders. Their diversities notwithstanding, each of
the classifications is vital to stakeholder management as they are mostly based on the
stakeholders’ interests and relationship with the project. The next section presents
construction stakeholders and their interests.
Table 2.1 Summary of stakeholder classification
According to Categories Defining Characteristics
Stakeholder
attributes
Dormant
Discretionary
Demanding
Dominant
Dangerous
Dependent
Definite
Power only
Legitimacy only
Urgency only
Power and Legitimacy
Power and Urgency
Legitimacy and Urgency
All three attributes
Stakeholder vested
interest-impact index
(viii)
Active opposition
Passive opposition
Not committed
Passive support
Active support
Pos = -1
Pos = -0.5
Pos = 0
Pos = 0.5
Pos = 1
Contractual
relationship on the
project
Internal
External
Having a contractual link with the
project
Having no contract but could affect or be
affected by the project
Attitudes towards the
project
Proponent
Neutral
opponent
In support of project
Indifferent
Against the project
2.4 Construction Projects’ Stakeholders and Their Interests
The specific groups of stakeholders involved in construction and their interests may
differ with some projects. However, Leung and Olomolaiye, (2010) considered
construction projects stakeholders under five main groups and interests as follows:
1. Clients: these include public and private clients. The interests of the public
clients include: to ensure the project will support the organisation’s strategy; to
ensure the effective and economic use of resources; provide financial support;

26
and to ensure the construction product is successfully and profitably procured.
The interests of the clients include: to ensure public funds is properly used; to
allocate funds to the project; to serve the public interest in line with the
organisation’s objectives; ensure it can be financed and there will be return on
investment; and ensure the construction product is successfully procured.
2. Consultants (project professionals): these could either be in-house or out-of-
house and they include: Architect, Quantity surveyor, Engineer, construction
manager and other consultants relevant to the requirements of the project. Their
primary interest is carrying out their respective professional duties to their
employers.
3. Contractors: these usually include the main and sub-contractors and their
employees; and the suppliers. The primary interest of the main contractor is to
carry out the work successfully as designed and perform other contractual duties
assigned to them in the contracts. The sub-contractors carry out work assigned
by the main contractor and or the client depending on the contract terms and
conditions. Similar to the sub-contractor, the suppliers’ primary interest is to
supply and install all materials and equipment as required of them. In the end,
the main interest of the contractors is to get the job done, get paid and move on
to the next job.
4. External public parties: these include Government authorities, consultation
bodies such as district board, labour union (employers’ association), General
public, the media, and institutional forces/nationalised industries (professional
bodies). Government authorities ensures that the project complies with
established laws and regulations; consultation bodies ensure that the project
reflects the local communities’ requirements; labour union protect the rights and
influence the conducts of its members; general public contribute to the
governance process by participating directly or indirectly; the media inform and
influence the perception of people about the reputation of the project; and
institutional forces influence professional bodies and the activities of their
members through education, rules of conduct, conditions of engagement and
scales of fees.
5. External private parties: these include local residents/neighbouring communities,
local landowners, archaeologists, environmentalists/conservationists,
27
competitors, the media, and others. The primary interest of local residents is how
the project affects their amenity and immediate environment; local land owners
are interested in making sure that their interest will not be hurt by the project;
the environmentalists are interested in protecting the environment from pollution
and or destruction; the competitors try to gain competitive advantage by their
actions; the media influence the perception of people about the reputation of the
project; and others include those whose connection to the project is not
immediately clear but whose support may be helpful to the success of the
project.
These five groups of interests which are similar to the classification of Winch, (2010)
discussed in section 2.3.3, are also divided into internal and external stakeholders: the
clients, consultants and contractors are considered as the internal stakeholders whereas
the external public and external private parties are considered as the external
stakeholders in construction projects. However it is possible for a government authority
to be an internal stakeholder on one project for which it is the procuring entity; and at
the same time an external stakeholder on another project which it is only regulating
through policy and control.
In summary, construction projects involve a diverse range of stakeholders all or some of
which may have differing interests throughout the project life cycle. These interests may
conflict given their diversity; therefore stakeholder management is necessary for
construction projects. The next section reviews the need to carry out stakeholder
management in construction projects.
2.5 Need to Manage/Engage Stakeholders in Construction Projects
The previous section discusses construction projects stakeholders and their interests.
Given the diversity of stakeholders and their interests in construction projects; the aim
of stakeholder management in projects is to attain the desired and successful
implementation of the project and avoid unnecessary conflicts and controversies with
the project stakeholders (Olander and Landin, 2008). The PMI (2004) defines project
stakeholder management as “the systematic identification, analysis and planning of
actions to communicate with and influence stakeholders”. Almost every word in this
definition is a key word requiring careful consideration in the process of stakeholder
management. Identification, evaluation and analysis of stakeholder demands and

28
influence should be considered as necessary and important steps in the planning,
implementation, and completion of any construction project. But stakeholders’ base of
influence is not static, hence there is need to conduct and update stakeholder analysis
during the entire life cycle of the project (Cleland, 2002; Olander and Landin, 2005).
This can be useful in gaining knowledge about the potential influence various
stakeholders have at different stages of the project. Stakeholders related issues/problems
have been reported in construction management research. These issues are either within
or around the projects and range from delay in planning and execution of projects, cost
and conflicts escalating to litigation and claims (Karlsen, 2002; Olander and Landin,
2005; Olander, 2007; Smyth, 2008; Chinyio and Akintoye, 2008; Ward and Chapman,
2008; Winch, 2010). Most of these are either because the stakeholders’ interests and
inputs were not considered from the inception of the project or they changed in the
course of the project which could also be due to the inadequacy of stakeholder
management strategies.
The need has been raised for stakeholders to be engaged at the very inception of every
construction project (Faniran et al., 1999; Smith and Love, 2004; Aaltonen and Kujala,
2010); and they must be involved in the design process so that the values relevant to
each construction project can be identified and understood so that assumptions are not
made about stakeholders’ requirements or expectations (Thomson et al., 2003).
Stakeholder engagement focus should be on identifying those who are affected (or
likely to be affected) by the project and actively involving them in project design and
delivery in order to ensure that the project is sensitive and responsive to the local needs
and conditions (Mathur et al., 2008). This could, in addition to being sensitive and
responsive to the local needs, engender a sense of ownership among the project
stakeholders and attract their supports thereby fostering smooth running of the project.
Furthermore, the fact that stakeholders are dynamic and their influences on the project
change over time depending on the issues being considered, can lead to uncertainties in
any project if the stakeholders and their needs and potential influence are not carefully
indentified and managed (Freeman, 1984; Newcombe, 2003; Chinyio, 2010). The
failure to acknowledge the concerns of opposing external stakeholders will result in a
prolonged and delayed planning and design process due to the combined powerbase of
opposing stakeholders working against the progress of the project as a result of
perceived non-involvement and consideration of their interests (Olander, 2007). It is
worth noting that the dynamism of stakeholders’ interest has resulted in delays in the

29
planning and implementation of some major construction projects such as the BAA’s
London Heathrow Airport Terminal 5 and the Ilisu Dam in the Kurdish region of
Turkey (Winch, 2010). The London Heathrow Airport Terminal 5 which was proposed
on a 121-ha green belt site faced opposition from various groups including: Local
inhabitants; community groups; Local councils; west London friends of the earth
(WLFoE); and Heathrow association of control of aircraft noise (HACAN). The issues
advanced ranged from noise and environmental pollution to increased levels of traffic
which lead to a long planning period starting from May 1995 to March 1999. The Ilisu
Dam proposal of which started in 1954 was to flood 15 towns and 52 villages displacing
approximately 78,000 Kurdish people. The Ilisu Dam project has gone through a lot of
power play between proponents and opposition such that it never got underway. It was
revived in 2005 and is still subjected to opposition.
Similarly, Smith and Love (2004) based on a study on stakeholder management during
project inception using strategic needs analysis in a case study, concluded that if
stakeholder management/engagement is to be of significant benefit; then it must identify
and involve all stakeholders and continue through all the stages of the project. They
found that the delay encountered in the planning process of the project was due to
objections relating to local planning issues from neighbours and local council who were
not involved in the workshops/meetings at the strategic needs analysis (inception) stage.
Major decisions about the project were made at the inception stage but unfortunately,
the stakeholder management process did not continue to the design and subsequent
stages attracting criticisms and actions leading to delay of the project completion.
Managing construction project stakeholders has become much more challenging over
the last few decades due to two reasons (Winch, 2010):
1. Because external stakeholders now have more powers in the process as
manifested in both the growing institutionalisation of external stakeholders’
rights through an ever tightening regulatory context, and, the rise of
environmental activism which followed the collapse of socialist mass
movements.
2. Because there is a shift to concession contracting securing finance on the asset
being created by the project, due to which financiers now pay much more
attention to the definition of the project mission to ensure that their investment
will actually yield the desired return.
30
This lends support to the need for stakeholders to be engaged with throughout the entire
project life cycle in order for project mission definition to be given the much desired
attention. This will require that, all relevant stakeholders must come on board early
enough and remain as much as they have some contributions to make towards the
project goal. This means that the design and construction team will need to work
together right from the start of the project while the external stakeholders are also
carried along where and when necessary.
Therefore, there is need to identify, recognise and honour the expectations of
construction project stakeholders in order to minimise their negative impact for the
project to run smoothly to successful completion and where it is not possible for the
expectations of stakeholders to be respected and honoured, trade-offs could be used
(Chinyio and Akintoye, 2008). The reasons therefore, for undertaking stakeholder
management on projects includes obtaining the support and contributions of
stakeholders towards the project, achieving the best possible results, and making efforts
to pay attention across a range of stakeholders rather than limit attention to a few
stakeholders (Jepsen and Eskerod, 2009).
This section focused on discussing the need to manage stakeholders in construction
projects revealing that stakeholders’ base of influence changes with time in the course
of the project. It also revealed the need to start the stakeholder management process
early enough and carry on till the end of the project. The question however still remains
of how stakeholder management should be done to enhance the likelihood of achieving
success in construction projects. The design and construction teams need to work in
collaboration with each other in engaging/managing the project stakeholders, part of
which they are. However, it is not enough to do stakeholder management, it needs to be
done effectively; the next section will then focus on identifying from literature, the
critical success factors for stakeholder management/engagement in construction
projects.
2.6 Critical Success Factors (CSFs) for Stakeholder Management/ Engagement
in Construction Projects
The preceding section reviewed the need and justification to undertake stakeholder
management in construction projects and points to the need for the critical success
factors for stakeholder management to be identified as they constitute important
31
ingredients of stakeholder management in construction projects. Critical success factors
according to Rockart, (1979) are “areas, in which results, if they are satisfactory, will
ensure successful competitive performance for the organisation; they are the few key
areas where things must go right for the business to flourish”. Similarly, understanding
of stakeholder related factors can enable appropriate decision making strategies during
project execution (Yang et al., 2014). Therefore, CSFs should be given constant and
careful attention. Past studies (Jepsen and Eskerod, 2009; Olander and Landin, 2008;
Chiyio and Akintoye, 2008; Jerges et al., 2000) have identified some factors considered
to be critical to the success of stakeholder management in construction projects. For
example Jepsen and Eskerod, (2009) found; stakeholder identification and classification
as well as predicting the expectations of stakeholders through stakeholder analysis to be
critical to the stakeholder management process. Similarly, Olander and Landin, (2008)
identified four factors affecting stakeholder management process: Analysis of
stakeholders’ concern and needs; communication of both potential benefits and negative
impacts to stakeholders; evaluation of alternative solutions; project organisation and
relationship with the media. Stakeholder management process can be improved in
construction projects through effectively communicating with stakeholders and setting
of common goals and priorities among them for the project (Jerges et al., 2000).
Furthermore, providing top level management support; responding to power interest
dynamism; maintaining existing relationship; being proactive; negotiations and
tradeoffs among others are necessary considerations for stakeholder
management/engagement to be successfully carried out (Chinyio and Akintoye, 2008).
In summary, Table 2.2 presents a list of identified CSFs for stakeholder management in
construction. Moreover, other past studies have focussed on studying the critical success
factors for stakeholder management in construction projects. Notable and most recent
are the studies of Yang et al., (2009) and Li et al., (2011): Yang et al., explored and
grouped 15 critical success factors for stakeholder management in construction using
factor analysis into five principal components (see Fig. 2.5) namely: precondition,
information inputs, stakeholder estimation, decision making and sustainable support. Li
et al. (2011) in addition identified flexible project organisation as a critical success
factor for stakeholder management in construction projects.
From the review of extant literature on stakeholder management/engagement in
construction, the following factors (Table 2.2) have been found to have significant

32
influence on stakeholder engagement/management and are considered as critical to the
success of stakeholder management in construction projects:
Table 2.2 Critical Success Factors (CSFs) for Stakeholder Management in
Construction Projects
S/N CSF Source 1 Clearly formulating the project mission Jerges et al., (2000); Akintoye et
al. (2003) Thomson et al.,
(2003); Chinyio and Akintoye,
(2008)
2 Ensuring the use of a favourable procurement method Atkin and Skitmore, (2008);
Rwelamila, (2010)
3 Carefully identifying and listing the project stakeholders Mathur et al., (2008); Jepsen and
Eskerod, (2009)
4 Ensuring flexible project organisation Olander and Landin, (2008);
Chinyio and Akintoye, (2008);
Li et al., (2011)
5 Identifying and understanding stakeholders’ areas of interests
in the project
Jepsen and Eskerod, (2009);
Olander and Landin, (2008);
Yang et al., (2009)
6 Determining and assessing the power (capacity to influence
the actions of other stakeholders); urgency (degree to which
stakeholders’ claims requires immediate attention); legitimacy
(perceived validity of claims); and proximity (level of
association or closeness with the project) of stakeholders
Mitchell et al., (1997); Yang et
al., (2009); Aaltonen and Kujala,
(2010)
7 Appropriately classifying stakeholders according to their
attributes/characteristics
Karlsen, (2002); Mitchell et al.,
(1997)
8 Predicting and mapping stakeholders’ behaviours (supportive,
opposition, neutral etc)
Freeman (1984)Yang et al.,
(2009); Aaltonen and Kujala,
(2010)
9 Predicting stakeholders’ potential influence on each other Pajunen, (2006); Jepsen and
Eskerod, (2009)
10 Predicting stakeholders’ potential influence on the project Pajunen, (2006); Jepsen and
Eskerod, (2009)
11 Identifying and analysing possible conflicts and coalitions
among stakeholders
Jepsen and Eskerod, (2009);
Yang et al., (2009)
12 Resolving conflicts among stakeholders effectively Yang et al., (2009) Chinyio and
Akintoye, (2008)
13 Managing the change of stakeholders’ interests Jergeas et al., (2000); Jepsen and
Eskerod, (2009)
14 Managing the change of stakeholders’ influence Jergeas et al., (2000); Olander
(2006)
15 Managing the change of relationship among stakeholders Pajunen, (2006); Chinyio and
Akintoye, (2008)
16 Managing change of stakeholders’ attributes Mitchell, et al., (1997) Olander
(2006)
17 Managing how project decisions affect stakeholders Chinyio and Akintoye, (2008);
Aaltonen and Kujala, (2010)
18 Predicting stakeholders’ likely reactions for implementing
project decisions
Chinyio and Akintoye, (2008);
Yang et al., (2009)
19 Involving relevant stakeholders to redefine (refine) project
mission
Jerges et al., (2000); Yang et al.,
(2009); Aaltonen and Kujala,
(2010)
20 Formulating appropriate strategies to manage/engage different
stakeholders
Chinyio and Akintoye, (2008);
Yang et al., (2009)
21 Keeping and promoting positive relationships among the
stakeholders
Olander and Landin, (2008);
Yang et al., (2009); Aaltonen
and Kujala, (2010)
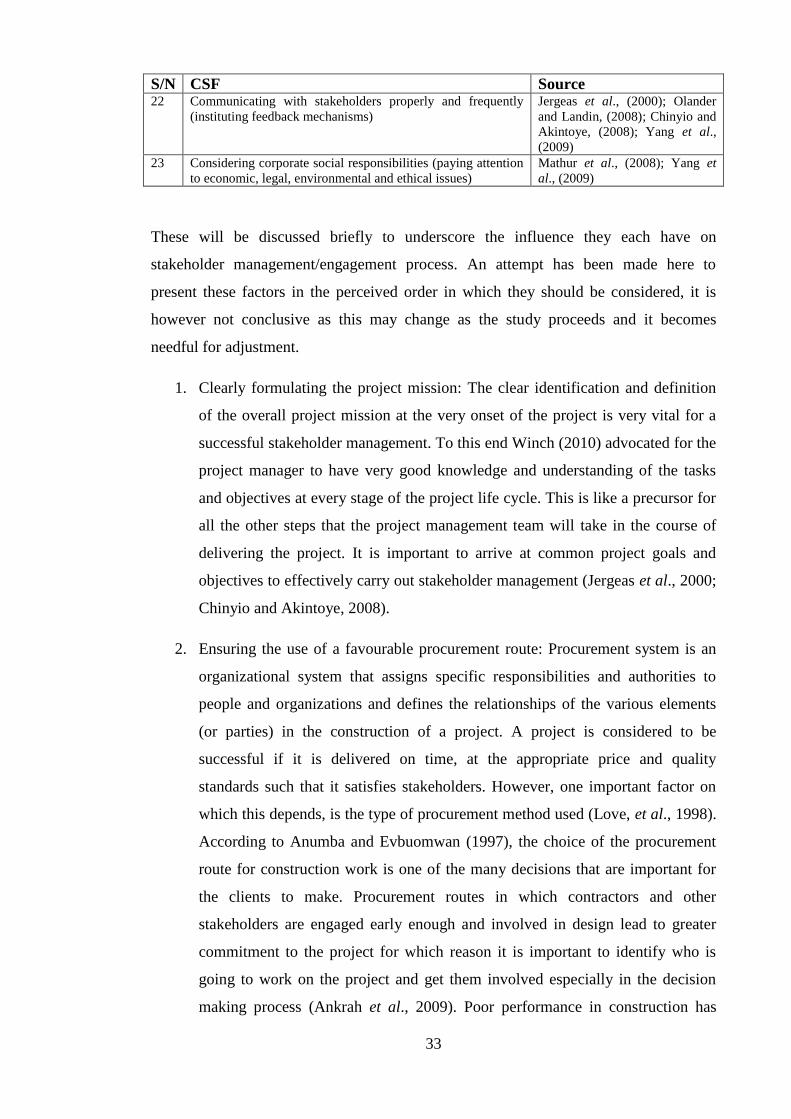
33
S/N CSF Source 22 Communicating with stakeholders properly and frequently
(instituting feedback mechanisms)
Jergeas et al., (2000); Olander
and Landin, (2008); Chinyio and
Akintoye, (2008); Yang et al.,
(2009)
23 Considering corporate social responsibilities (paying attention
to economic, legal, environmental and ethical issues)
Mathur et al., (2008); Yang et
al., (2009)
These will be discussed briefly to underscore the influence they each have on
stakeholder management/engagement process. An attempt has been made here to
present these factors in the perceived order in which they should be considered, it is
however not conclusive as this may change as the study proceeds and it becomes
needful for adjustment.
1. Clearly formulating the project mission: The clear identification and definition
of the overall project mission at the very onset of the project is very vital for a
successful stakeholder management. To this end Winch (2010) advocated for the
project manager to have very good knowledge and understanding of the tasks
and objectives at every stage of the project life cycle. This is like a precursor for
all the other steps that the project management team will take in the course of
delivering the project. It is important to arrive at common project goals and
objectives to effectively carry out stakeholder management (Jergeas et al., 2000;
Chinyio and Akintoye, 2008).
2. Ensuring the use of a favourable procurement route: Procurement system is an
organizational system that assigns specific responsibilities and authorities to
people and organizations and defines the relationships of the various elements
(or parties) in the construction of a project. A project is considered to be
successful if it is delivered on time, at the appropriate price and quality
standards such that it satisfies stakeholders. However, one important factor on
which this depends, is the type of procurement method used (Love, et al., 1998).
According to Anumba and Evbuomwan (1997), the choice of the procurement
route for construction work is one of the many decisions that are important for
the clients to make. Procurement routes in which contractors and other
stakeholders are engaged early enough and involved in design lead to greater
commitment to the project for which reason it is important to identify who is
going to work on the project and get them involved especially in the decision
making process (Ankrah et al., 2009). Poor performance in construction has

34
been attributed to the continued use of procurement practices that do not
encourage integration, coordination and communication among the parties
involved (Love et al., 1998). Procurement route and contract agreement
involving all the project stakeholders is the basis for how project stakeholders
relate, hence it plays a vital role in determining how stakeholder management
should be done on projects (Atkin and Skitmore, 2008; Rwelamila, 2010).
3. Carefully identifying and listing the project stakeholders: The number of
stakeholders in a construction project can be large presenting numerous
interfaces that have to be managed. The significant importance of identifying
project stakeholders at the beginning (initiation) of the project have been pointed
out in studies relating to stakeholder management/engagement (Mathur et al.,
2008; Faniran et al., 1999). A conceptual scheme for identifying stakeholders
should have recognition for a player’s power to influence the legitimacy of
relationship between players, and the urgency of a stakeholder’s claim such that
a detailed identification of project stakeholders is achieved (Mitchell et al.,
1997; Jepsen and Eskerod, 2009).
4. Ensuring the use of a flexible project organisation: A flexible project
organisation is necessary within a dynamic process such as stakeholder
management in construction projects. This is coupled with the complex and
uncertain nature of construction projects generally (Olander and Landin, 2008).
This will enable easy adjustment of responsibilities in responding to any changes
encountered as a result of change in stakeholders’ stance within the project.
5. Identifying and understanding stakeholders’ areas of interests in the project: Due
to the various and divergent stakeholders’ interests in a typical construction
project arising from the fragmented and complex nature of construction it is
important to identify and assess stakeholders’ areas of interests (Jepsen and
Eskerod, 2009; Karlsen, 2002; Freeman et al. 2007; Reed et al., 2009). For
example, the interest of the project contractor may be to complete the project as
quickly as possible and the construction method they adopt may be a noisy one
which will attract the attention of members of the immediate community of the
project who otherwise may have very low or no interest in the project. Similarly,
the contractor may be interested in completing the project on schedule to deploy
their staff and equipment to another project hence may not be positively inclined

35
to any variation orders from the client (Olander and Landin, 2008; Nash and
Chinyio, 2010). It is therefore, necessary for construction stakeholders to be
engaged in a dialogue of value delivery in order to expose stakeholders’ personal
values which are reflected in their beliefs, attitudes and behaviours and to
understand what they need from their product and or role in the project
(Thomson et al., (2003).
6. Determining and assessing stakeholders’ attributes: Stakeholders have been said
to possess the attributes of ‘power’, ‘urgency’ and ‘legitimacy’ which they rely
on and use to control resources, gain attention and impact the project (Mitchell
et al., 1997). Power is the capacity to influence the actions of other stakeholders;
urgency is the degree to which stakeholders’ claims require urgent attention; and
legitimacy is the perceived validity of stakeholders’ claims. ‘Proximity’ to the
project is also an important attribute of stakeholders which could be rated based
on stakeholders’ proximity in terms of either working directly in the project or
remote from the project (Bourne, 2005; Kujala, 2010).
7. Appropriately classifying stakeholders according to their attributes: After
identifying and understanding the various stakeholders and their areas of
interests, they need to be classified in order to enable a successful stakeholder
management/engagement during the project (Karlsen, 2002). Scholars in
stakeholder management support the view that properly classifying project
stakeholders is important in stakeholder management and have proposed some
classification models (Mitchel et al., 1997; Olaner, 2007; Walker et al., 2008;
Winch, 2010); these are discussed in section 2.3.
8. Predicting and mapping stakeholders’ behaviours: There are different ways in
which stakeholders behave to express their concerns and exert their importance
to the project. Freeman (1984) categorised stakeholders’ behaviour into:
Observed behaviour, cooperative potentials and competitive threats.
Stakeholders generally have the tendency to act as proponents, neutral or
opponents to the project objectives. They in order to exert their salience to the
project, exhibit their behaviour or stand towards the project through the
following strategies: Direct withholding strategy, indirect withholding strategy,
resource building strategy, coalition building strategy, conflict escalation
strategy, creditability building strategy, communication strategy and direct

36
action strategy (Table 2.3) (Aaltonen et al., 2008). They could do so by
mobilising in support, against or remain indifferent to the project (Olaner, 2007;
Aaltonen et al., 2008). The need for project managers or whoever is responsible
for stakeholder management to clearly understand the different ways
stakeholders behave and how they react in the process of project execution has
been emphasized (Freeman et al., 2007).
Table 2.3 Stakeholder salience shaping strategies (adopted from Aaltonen et al.,
2008)
Type of strategy Description
Direct
withholding
strategy
Stakeholders restrict project’s access to critical resources which
are controlled by the stakeholder to increase their perceived
power
Indirect
withholding
strategy
Stakeholders influence project’s access to resources that are not
directly controlled by the specific stakeholder to increase their
perceived power
Resource
building
strategy
Stakeholders acquire and recruit critical and capable resources to
their group to increase their perceived power
Coalition
building
strategy
Stakeholders build alliances with other project stakeholders to
increase their perceived power or legitimacy
Conflict
escalation
strategy
Stakeholders attempt to escalate the conflict beyond initial project
related causes (e.g. political). Through this process the project
may become an arena for non-project related battles. This may
introduce a new institutional environment in which stakeholders’
claims are perceived as more legitimate
Credibility
building
strategy
Stakeholders increase their perceived legitimacy by acquiring
credible and capable resources, for example, capable individuals
with good reputation or networks
Communication
strategy
Stakeholders use different types of media to communicate and
increase the perceived legitimacy and urgency of their claims
Direct action
strategy
Stakeholders organize protests, road blockades, etc. to increase
the perceived urgency of stakeholder claims
9. Predicting stakeholders’ potential influence on each other: The fact that the
different individuals and groups of stakeholders can influence the outcome of
projects is no longer in doubt and scholars have pointed out the need to
recognize the different stakeholders’ base of influence so as to plan and execute
a successful stakeholder management (Karlsen, 2002; Olander and Landin,
2005; Chinyio and Akintoye, 2008).
10. Predicting stakeholders’ potential influence on the project: Since stakeholders’
base of influence is not static, there is need to conduct and update stakeholder

37
analysis during the entire life cycle of the project, with the purpose of among
other things, gaining knowledge about the potential influence various
stakeholders have at different stages of the project (Pajunen, 2006; Jepsen and
Eskerod, 2009). Furthermore, an evaluation of stakeholder demands and
influence on the project should be considered as a necessary and important step
in the planning, implementation, and completion of any construction project
(Olander and Landin, 2005). This further supports the need for project managers
to predict stakeholders influence base in order to evolve appropriate measures to
handle them.
11. Identifying and analysing possible conflicts and coalitions among stakeholders:
According to Freeman (1984) analysing the conflicts and coalitions that exist or
are likely to occur among the project stakeholders is a very important step in
stakeholder management process. Different types of conflicts have been
acknowledged in literature which range from conflicts among stakeholders to
conflicts between the stakeholders’ and the project’s objectives (Awakul and
Ogunlana, 2002; Jepsen and Eskerod, 2009). According to Newcombe (2003) a
powerful individual stakeholder may have a significant influence on project
decisions but it is usually groups of stakeholders, who combine to form
temporary coalitions, who are the most influential in shaping the strategy of the
project. These groups have expectations which the project is under pressure to
fulfil; and these often conflict with the expectations of different groups of
stakeholders (Yang et al., 2009). For example the needs of the local authority
may conflict with that of the designer and client of a proposed project in the
same way as the construction methods and techniques adopted in the project
may not be acceptable to the local residents and general public.
12. Resolving conflicts among stakeholders effectively: It is very necessary in
stakeholder management to strive to strike a balance between conflict resolution
and stakeholder satisfaction of the overall outcome thereof at the same time
compromising conflicts among stakeholders is important for project managers to
achieve (Freeman 1984). The use of incentives, trade-off and the institution of a
no blame culture has been advocated by (Yang at al., 2009; Chinyio and
Akintoye, 2008) in recognition of this factor.
38
13. Managing the change of stakeholders’ interests: The dynamism of stakeholders
and their interest is a source of serious concern in construction projects such that
previous researches have advocated the need for a continuous stakeholder
engagement throughout the project’s life cycle (Jergeas et al., 2000; Walker et
al., 2008; Newcombe, 2003; Chinyio and Akintoye, 2008). Due to the fact that
stakeholders are dynamic and their interests on the project change over time
depending on the issues being considered and how they relate to their powers to
influence projects either positively or negatively (Freeman, 1984). Therefore, the
interests of stakeholders should not be assumed from previous projects but
should be analysed based on the current project (Nash and Chinyio, 2010;
Jepsen and Eskerod, 2009). Being sensitive and responsive to stakeholders’
expectations/interests is a skill that managers will need to develop to manage
construction projects successfully (Jergeas et al., 2000; Newcombe, 2003).
14. Managing the change of stakeholders’ influence: As the interests of stakeholders
change during the project, their influence on one another and on the project is
likely to change so also their relationship with one another and with the project
(Jergeas et al., 2000). Since stakeholders’ base of influence is not static, there is
the need to conduct and update stakeholder analysis during the entire life cycle
of the project (Olander and Landin, 2005, Olander, 2006). For instance some
project stakeholders can be in the supporting side of the project at the beginning
and then become either indifferent or in the opposing side as the project
progresses.
15. Managing the change of relationship among stakeholders: The relationships
amongst stakeholders and between stakeholders and the project could be either
adversarial or cooperative (Pajunen, 2006). And this can change from time to
time as the project progresses. It is important to ensure that good relationships
are kept not only among the stakeholders but also between the stakeholders and
the project (Chinyio and Akintoye, 2008). The introduction of collaborative
climate amongst the key stakeholders can help to achieve a cooperative
relationship between the stakeholders and the project (Erikson and Westerberg,
2011).
16. Managing change of stakeholders’ attributes: stakeholder attributes change as
the project progresses (Mitchell, et al., 1997). The need to analyse and estimate
39
these attributes continuously to enhance the understanding of the changes in
stakeholders attributes and drive towards successful stakeholder management
has been raised (Mitchell et al., 1997; Bourne, 2005; Bourne and Walker, 2005;
Olander, 2007; Yang et al., 2009). Specifically deciding the appropriate
stakeholder management processes depend on what attributes the stakeholders
have (Olander, 2007) and this could change as the project progresses. The
stakeholders’ attributes should not be assumed from previous projects but should
be assessed based on the current project (Nash and Chinyio, 2010).
17. Managing how project decisions affect stakeholders: it is important to make sure
project decisions do not affect stakeholders and cause them to oppose the
progress of the project (Aaltonen and Kujala, 2010). For instance if some
stakeholders know that they have been classified as having low interest,
influence, power or legitimacy on the project, it may stir up ill feelings and
cause them to begin to form coalitions with other stakeholders in other to exert
themselves (Chinyio and Akintoye, 2008). Moreover the construction methods
adopted could cause some stakeholders to protest against the project. These
could in addition to affecting the project, create a bad publicity for the project.
18. Predicting stakeholders’ likely reactions for implementing project decisions: As
it is the case with every human endeavour, stakeholders are likely to react in
protest to the so formulated stakeholder management/engagement strategies, it is
therefore necessary for project managers to be able to predict stakeholders’
likely reactions in this respect (Yang et al., 2009). This would enable
stakeholder management to minimise stakeholders’ negative impacts and ensure
that they do not hinder the successful completion of the project (Chinyio and
Akintoye, 2008; Chinyio and Olomolaiye, 2010).
19. Involving relevant stakeholders to redefine (refine) project mission: Good
project management at the early stages of a project has been found to provide
potentially significant opportunities for eliminating several problems that
prevent the achievement of project success. It is therefore important to adjust the
project mission to reflect on the knowledge obtained on stakeholders and their
stakes/interests, influence, attributes etc (Faniran et al. 1999; Jergeas et al.,
2000). This can be achieved by making sure that their most important and
achievable expectations are adequately captured and reflected in the project

40
mission. Stakeholders should therefore, be involved in the design process so that
the values relevant to each construction project can be identified and understood
and assumptions should not be made about stakeholders’ requirements or
expectations about the project (Thomson, et al., 2003; Yang et al., 2009;
Aaltonen and Kujala, 2010).
20. Formulating appropriate strategies to manage/engage stakeholders: The PMI
(2004) defines project stakeholder management as “the systematic identification,
analysis and planning of actions to communicate with and influence
stakeholders”. The importance of formulating appropriate strategies to
manage/engage stakeholders has been emphasized by different scholars
(Karlsen, 2002; Chinyio and Akintoye, 2008; Aaltonen and Sivonen, 2009;
Yang et al., 2009). Mathur et al., (2008) observed that stakeholder engagement
process, if designed appropriately, can deliver a wide range of outcomes ranging
from the capture of different forms of knowledge to social learning in addition to
enhancing project success.
21. Keeping and promoting positive relationships among the stakeholders: positive
relationship among project stakeholders would deliver a smooth running of the
project through consensus decision making (Eriksson and Westerberg, 2011).
This can be achieved through building trust and commitment with the
stakeholders throughout the project and the use of incentives when necessary
(Chinyio and Akintoye, 2008, Aaltonen and Kujala, 2010). Maintaining good
relationships among stakeholders and between stakeholders and the project can
help to build trust, commitment and loyalty which enable project managers to
meet stakeholders’ expectations (Jergeas et al., 2000; Bourne, 2005; Karlsen et
al., 2008).
22. Communicating with stakeholders properly and frequently (instituting feedback
mechanisms): Communication is a basic ingredient needed to maintain the
support, commitment and loyalty of the project stakeholders. It is important for a
project management team to manage their differing demands through good
communication in the early stages of a project once the stakeholders have been
identified (Olander and landin 2008, Yang et al., 2009). This could provide
potentially significant opportunities for eliminating several problems that could
prevent the achievement of project success as well as averting or reducing the

41
effect of stakeholder interests’ related conflicts which is likely to be more costly
if allowed to occur when the project is already underway (Faniran et al., 1999).
Communication is so important that it will require communicating to the
stakeholders both beneficial and detrimental effects of the proposed project and
associated actions and progress being made as the project get underway (Jergeas
et al., 2000). The use of different appropriate means of communication for
stakeholders or groups of stakeholders is very important (Chinyio and Akintoye,
2008). Stakeholders could be communicated as deemed appropriate through the
media, project website, newsletters, signpost/flyers, public engagement etc.
23. Considering corporate social responsibilities (paying attention to economic,
legal, environmental and ethical issues): Project managers have been implored to
always try to manage stakeholders with corporate social responsibilities
covering economic, environmental, legal and ethical issues (Mathur et al., 2008;
Yang et al., 2009). It was recommended by Smyth (2008) for stakeholder
management theory to move away from the approaches of power based analysis
towards recognition of responsibilities for ethical care employing proactive
management. According to Bourne (2005), stakeholder management needs to
balance competing claims on resources between different parts of the project,
between the project and other projects and between the project and the
organisation. Economic, environmental, legal and ethical issues are sources of
influence on the stakeholders’ competing demands on the project.
2.7 Stakeholder Management Approaches/Frameworks
The previous section identified and explained a list of critical success factors for
stakeholder engagement/management in construction projects and points to the need for
a more in-depth understanding of the relationships among them. This section reviews
the proposed stakeholder management approaches in construction focusing on their
strengths and weaknesses and suggesting improvement needs.
Scholars have proposed stakeholder management approaches by indicating different
actions that should be involved in the process; this is summarized in Table 2.4. It shows
the stakeholder management process actions recommended by the scholars as ticked
under their columns against the process actions: for instance, identifying stakeholders,
analysing the characteristics of stakeholders and then communicating and sharing

42
information with stakeholders are the basic actions required for stakeholder
management (Karlsen, 2002). Similarly, identification of stakeholders, gathering
information about stakeholders and analysing the influence of stakeholders are basic
steps/actions for stakeholder management in construction (Young, 2006). Table 2.4
shows how the recommendations of selected scholars continued to improve by being
more detailed over the years.
Table 2.4 Summary of Stakeholder management processes actions in construction
projects
Scholars and Years of publication Stakeholder management
process actions.
Karlsen
(2002)
Young
(2006)
Bourne
and
Walker
(2005)
Olander
(2006)
Walker
et al.
(2008)
Chinyio
and
Akintoye
(2008)
Yang
et al
(2011)
Identification of
stakeholders
√ √ √ √ √ √ √
Analysing the characteristics
of stakeholders
√ √ √
Communicating and sharing
information with
stakeholders
√ √ √ √
Gathering information about
stakeholders
√ √
Prioritizing stakeholders √ √
Determining stakeholder
strength and weaknesses
√ √
Monitor stakeholder
saliency continuously
√
Analysing the influence of
stakeholders
√ √
Put in place a stakeholder
forum to measure feedback
periodically
√
Institute a no-blame culture
and dispute resolution
agreement
√
Identifying stakeholder
mission
√ √
Predicting stakeholder
behaviour
√
Monitoring effectiveness of
communication.
√
Visualising stakeholders √
Engage stakeholders through
“frontline”&“underlying”
approaches
√
Identifying stakeholder
management strategy
√ √
Develop stakeholder
management/engagement
strategy strategies
√
Implementing stakeholder
management strategy
√ √ √ √
Carry out analyses of the √
43
impact of stakeholder
relationship network on the
project
Although all the scholars cited in Table 2.4 recognise stakeholder identification as an
important step, it appears there is no agreement on the best set of approaches to use.
Stakeholder management needs to balance competing claims on resources between
different parts of the project, between the project and other projects and between the
project and the organisation (Bourne, 2005). These approaches need to be carefully
harnessed in order to carry out stakeholder management in construction projects
effectively.
There are three distinct approaches for conceptualizing stakeholder
management/engagement in construction projects (Mathur, et al., 2008). These relate to
viewing stakeholder engagement as; a management technique, an ethical requirement,
or a forum for dialogue to facilitate mutual social learning. Stakeholder
engagement/management process, if designed appropriately, can deliver a wide range of
outcomes ranging from the capture of different forms of knowledge to social learning.
Stakeholder management should ensure collaboration but bringing about collaboration
between project managers and influential stakeholders depends a lot on the workers
ability and willingness to share knowledge which requires a great amount of team effort
to be engendered (Bourne, 2005). Furthermore, knowledge should be sought on the
activities at all stages and corresponding stakeholders; types of decision that need to be
made at each stage; and the consequences of change in decision on the process. This
will help in forming a formidable team by appreciating the efforts needed for each stage
and allocating appropriate resources and responsibilities to them (Tzortzopoulos et al.,
2006).
Furthermore, the appropriate stakeholder management processes depend on what
attributes the stakeholders possess. First, to the legitimate stakeholders there is a moral
obligation to include their interest in the decision-making process. Secondly, there is a
necessary obligation to the powerful stakeholders, who must be monitored in the
stakeholder management process in order to be proactive in managing the potential
impact that they may have. Thirdly, there is a timely obligation to attend to the need of
the urgent stakeholders. Furthermore, these obligations will consequently be combined
for those stakeholders that possess two or more attributes. To the definitive
stakeholders, the project manager has all of the obligations of moral, necessary and

44
timely considerations of the stakeholders’ interests (Olander, 2007). Smyth (2008 pg.
641) recommended that “stakeholder management theory needs to move away from
approaches underpinned by skewed utility and from self-interested power-based
analysis towards recognition of responsibilities for ethical care employing proactive
management, which for projects would most easily be achieved in practice by making
the transition from relational contracting to relationship management”. This means
that attention will also need to be focussed on the relationships that influence the
stakeholders rather than rely only on the attributes of the stakeholders.
Based on a study of the management of stakeholders needs and expectations , Takim
(2009) found that government and consultants are of the view that social and political
matters are of great importance, whereas the private sector puts a great deal of emphasis
on forming project coalitions and lobby tactics mechanisms in managing the
stakeholders needs and expectations. Takim suggested the involvement of project
stakeholders throughout the project life cycle, particularly in the front end project
planning and that overall communication with the various stakeholders are to be
emphasised in order to achieve alignment and feedback between them. Similarly, good
project management at the early stages of a project has been found to provide
potentially significant opportunities for eliminating several problems that prevent the
achievement of project success (Faniran et al. 1999). However, in order for this to be
effectively done, it is necessary for the project managers to identify and analyse the
various stakeholders they need to manage.
Project managers are facing some challenges in using the current guidelines for
stakeholder analysis at the construction stage the result of which is vital for deciding
stakeholder management approach. It takes them very long time to conduct stakeholder
analysis due to the difficulty in accessing some of the stakeholders who have been
identified to be important to the project, hence they end up deciding and implementing a
stakeholder management strategy without gathering the much needed information
(Jepsen and Eskerod, 2009). The difficulty may be because they did not carry out
stakeholder analysis at the preceding stages before the construction stage. In other to
overcome this challenge, there is the need to investigate the reason why it is difficult to
carryout stakeholder analysis focusing not only on the construction stage but also from
the initial stages of the project.

45
Relying on the forgoing discussions, scholars (Manowang and Ogunlana, 2010; Chinyio
and Akintoye, 2008; Yang et al., 2009; Yang and Shen, 2014; Bourne, 2005; El-Gohary
et al., 2006) have proposed frameworks for carrying out stakeholder management.
These are discussed as follows:
Manowang and Ogunlana (2010) developed a strategic stakeholder management chart
(Fig 2.4) in which stakeholder management objectives are considered to include: to do a
formalised stakeholder analysis (SA); strengthen stakeholders’ relationships (SR);
sustain stakeholders’ commitment (SC); and increase stakeholders’ satisfaction (SS).

46
Manage construction stakeholders effectively
Formalise stakeholder analysis (SA)
Strengthen stakeholders’ relationships (SR)
Sustain stakeholders’ commitment (SC)
Increase stakeholders’ satisfaction (SS)
Internal/primary External/secondary
SA: identified, classified and prioritised as key
stakeholders
SR: relationships effectively managed
SC: fully engaged and committed to project goals
SS: successful project completion with achieved targets
of time, cost and quality
SA: clear identification and classification of stakeholder
potentials and expectations
SR: Building and maintaining good relationship through
effective communication
SC: attain high effective commitment for high
performance
SS: assure maximum satisfaction with project
management
SA: use power/interest and influence/importance matrices
SR: face-to-face meetings
SC: use managers’ social and political skills, create trust
and credibility, provide active involvement and
communicate early
SS: identify factors critical to satisfaction with project
management process
SA: do not exclude any stakeholders
SR: proactive relationship development uses relationship
matrices with clear communication plans and channels
SC: active response to stakeholders’ requirement is
essential
SS: satisfying one stakeholder may make others
dissatisfied
SA: be formally recognised by the project
management
SR: formation of a network of relationships
SC: be concentrated for support at different stages of
the project
SS: interests and expectations are considered and
incorporated into project’s decision
SA: investigating stakeholders’ perceptions,
expectations, and their potentials for support or
opposition to the project
SR: providing opportunity for two-way
communication
Attaining stakeholders support to execute the project
SS: satisfying key external stakeholders according to
their level of power/interest and influence/importance
SA: use power/interest and influence/importance
matrices
SR: Employ public participation techniques at the
stages of project
SC: create sense of project ownership/partnership
SS: integrating stakeholders’ interests into project
management and keep them informed of project
information and decision making
SA: needs early recognition and attention
SR: mutual respect and trust are crucial
External feedback system is helpful
Provide involvement programs at appropriate level
throughout the project life cycle
Core objective
Stakeholder
management
objectives
Stakeholders
Needs/
expectations
Strategies
Tactics
Tips
Figure 2.4 Strategic stakeholder management chart (Manowang and Ogunlana,
2010)
The chart indicates the strategies, tactics and tips to use in order to attend to the
needs/expectations of both internal/primary and external/secondary stakeholders. Most
of these are directly related to the critical success factors for stakeholder management in
construction projects.

47
Chinyio and Akintoye (2008) in a study of practical approaches for managing/engaging
stakeholders identified several approaches for managing construction stakeholders.
They grouped them under the two categories of underlying (overarching) and frontline
(operational) approaches shown in Table 2.5. They describe the underlying approaches
as relatively medium to long-term guides that influence the actions of employees and
can be viewed as ‘overarching’, ‘higher order’ or ‘behind-the-scene’ principles that
inform practice and are used constantly. While the frontline approaches are the
operational techniques that are used regularly depending on the prevailing
circumstances. For example, from the operational approaches, effective communication
can be used to maintain existing relationships, understand the expectations of
stakeholders from the project and to keep them adequately informed. The means for
communication can vary from time to time and from stakeholder to stakeholder,
depending on the stakeholders’ attributes. Negotiation can in turn play a vital role in
resolving differences and settling claims whenever they arise in the course of the
project. Project managers’ ability to have the intuition to assess the power and interest
of stakeholders can inform them on the stakeholders becoming either less or more
interested than they previously were in imposing their will on the project as the project
progresses. Furthermore, incentives and concessions can be used separately or together
to douse or counteract the concerns of opposing/protesting stakeholders. Workshops and
meetings can be used to engage with stakeholders in the course of the project. They
argue that project managers should be capable of using these principles to ensure
successful projects. Their study also concentrated on how issues with external
stakeholders are handled which may only work if all is well among the internal
stakeholders. But project managers may not be around early enough in the course of the
project depending on the procurement route of the project. This brings to the fore the
need to connect the design and construction stages and consider the concerns of both
internal and external stakeholders in formulating and adopting stakeholder management
strategy.
Although, the identified approaches could be useful, this study concentrated on the
relationship dealing with external stakeholders and did not pay attention to the
interactions among the internal stakeholders. The study also did not establish any
coherent interconnections between the identified approaches which are necessary for an
effective practical application of the approaches.

48
Table 2.5 Approaches for engaging stakeholders (Chinyio and Akintoye 2008)
Overarching approaches Operational approaches; Use of:
-Systematic approach
-Providing top-level support
-Being proactive
-Maintaining existing relationship
-Responding to power-interest dynamism
-Effective communication
-People skills - management
-People skills - negotiations
-Trade offs
-Incentives
-Concessions
-Workshops and meetings
-Intuition
Yang et al. (2011), proposed a framework (Figure 2.5) for successful stakeholder
management in construction projects based on the grouping of critical success factors
for stakeholder management into 5: precondition factor, information inputs, stakeholder
estimation, decision making and sustainable support. It is suggested in the framework
that, information should be obtained first based on which stakeholders could be
estimated to enable decisions to be made about the appropriate strategies for stakeholder
management and sustainable support (from top management) is needed throughout the
stakeholder management process. This framework is a very useful contribution in the
area of stakeholder management research however; it fell short of considering the
procurement route and the need to classify the stakeholders in the factors that formed
the basis for the framework. The study also did not obtain information from design
professionals and hence may not have considered the issues relating particularly to
stakeholder management at the inception and design stages. This is necessary because
the activities and level of involvement of stakeholders are different across the stages
depending also on the procurement route adopted for the project. More so, if
stakeholders are not adequately involved at the early stages of the project, it could
portend danger at the later stages of the project.

49
PRECONDITION
Social (economic, legal an ethical) responsibilities
INFORMATION INPUTS
Project missions
Full list of stakeholders
Areas of stakeholder interest
Their needs in the project
STAKEHOLDER ESTIMATION
Stakeholder attributes
Stakeholder behaviour
Potential influence
Conflicts and coalitions
DECISION MAKING
Resolving conflicts
Formulating appropriate
strategy
Predicting the reaction of
stakeholders
SUSTAINABLE SUPPORT
Change of stakeholder influence and relationship
A steady relationship with stakeholders
Communicating with stakeholders properly and frequently
Figure 2.5 Framework for successful stakeholder management in construction
(Yang et al., 2009)
Yang and Shen (2014) building on the framework (Fig. 2.5) developed by Yang et al.
(2011) presented a framework known as “systematic framework for stakeholder
management in construction” in which they added a box for “action and evaluation”.
Their framework is more detailed than Yang et al.’s but did not capture the construction
life cycle perspective as well as responsibility for stakeholder management. It assumes
the project manager is responsible disregarding the different stages, peculiarity of
construction projects and effects of procurement routes.
Bourne (2005) developed a tool referred to as the stakeholder management cycle for
identifying, visualising and mapping stakeholder influence on projects. The stakeholder
cycle is made up of five steps:
Step 1 – identification of stakeholders;
Step 2 – prioritize the stakeholders;
Step 3 – visualize the stakeholders;
50
Step 4 – engage the stakeholders; and
Step 5 – monitor the outcome.
The stakeholder cycle however, is a general tool that could be used to trigger proactive
stakeholder management approach in any project and not meant specifically for
construction project. It acknowledges the need to pay attention to the different phases
involved in the project by repeating the steps depending on the outcome from
monitoring and especially when progressing from one phase to another. The stakeholder
circle is made of concentric circle lines that indicate the distance of stakeholders from
the project; patterns of stakeholder entities which indicate their homogeneity or
heterogeneity in presenting an interest; the size and relative area covered by the
stakeholder block of the circle, which is an indication of their scale and scope of
influence on the project; and the colour density which is an indication of the degree of
impact. This tool is not specifically for construction project but is meant to be used for
any project with appropriate adjustment or modification. The “stakeholder circle” tool
has been tested using case studies (Bourne and Walker, 2006; Walker et al., 2008) and
found to be useful for project stakeholder analysis. Although this has been accepted as
an important contribution, it leaves the project managers or whoever is responsible for
stakeholder management on the project with the task of deciding how to carryout
stakeholder management. It also assumes that the project manager is responsible for
stakeholder management which may not be applicable for all construction projects
depending on the procurement routes and other project characteristics.
El-Gohary et al., (2006) developed a semantic model for capturing and incorporating
stakeholder inputs in the design of project. The model which is for public private
partnerships (infrastructure) projects consist of five major entities: process, products,
constraints, actors and resources. Each of these major entities is made up of different
processes and considerations of inputs leading to the final project design. Although this
model which has the potential to act as a means for knowledge representation is an
important contribution within the domain of stakeholder management in construction, it
is limited to the events and considerations preceding and leading to the final design of
the project.
Although it is evident that previous research acknowledges the need to carryout
stakeholder management throughout the project lifecycle in construction projects, there
is little research covering how this can be achieved. Consequently, previous researches

51
observe the need to develop a coherent framework for stakeholder management in
construction. Towards this, previous frameworks have either concentrated on specific
stages of the construction project or failed to incorporate the other stages in the research
leading to the development of the frameworks. To carryout stakeholder management
throughout the project lifecycle, there is the need for a comprehensive framework for
stakeholder management that spans the entire lifecycle of the project. This research
therefore, will address this need by considering and incorporating all the stages of a
construction project in a new framework for stakeholder management in construction
projects. Following the review of the existing approaches for stakeholder management
in construction projects, the next section will discuss the tools and techniques that could
be applied for stakeholder management.
2.8 Tools and Techniques for Stakeholder Management
Some tools and techniques have been identified as useful for carrying out stakeholder
engagement/management in construction projects. They include design charrette,
contingent valuation method, Delphi technique, strategic needs analyses and stakeholder
cycle. These are discussed as follows.
2.8.1 Design Charrette
A charrette is a series of workshop held at the pre-design stage of projects in order to
obtain and integrate the interests and contributions of the project stakeholders into the
eventual design of the project. The aim of the charrette is to seek to understand all
design related issues from the stakeholders’ perspective and identify solutions all of
which are presented in the form of a report to guide the final design of the project
(Sutton and Kemp, 2006). It can take varying length of time depending on the nature
and scope of the project, level of understanding of the stakeholders involved and
resources available. The duration of a design charrette could range from half-day to two
or more days.
The charrette sessions require some human and material resources to be effectively
carried out, these include; a facilitator, an agenda for the session(s), project summary
and or brief, site plan, etc. The role of the facilitator who is normally expected not to be
involved with the design is very important for the success of charrette. Participants at
the design charrette should be drawn from the following: members of the design team,

52
project owner or competent representative(s), representatives of relevant interest groups,
users/occupants if different from the owners, any relevant specialists, etc.
Design charrettes have been successfully used in construction projects. For example, the
Scottish sustainable communities initiative (SSCI) is led by the Scottish government to
encourage the creation of places in different locations in Scotland, which are designed
and built to last, where a high quality of life can be achieved to the satisfaction of all
stakeholders (Scottish sustainable communities initiative charrette series, 2008).
2.8.2 Contingent Value Method
This is a widely accepted method in environmental economics and urban planning for
evaluating the monetary value of assets and or infrastructure which cannot be traded in
the market (Portney, 1994). It seeks to achieve a common ground between the
organisation and its stakeholders by capturing the total economic value (TEV) which is
composed of the direct use value (DUV) and non-use value (NUV) of the proposed
project. DUV is the market value such as in: access fees, adjacent property value, and
people who use but do not pay for the facility directly whereas the NUV is the value
that cannot be captured in the market which include the future use potential and
existence value of the asset. The total economic value therefore, is the sum of the direct
use value and the non-use value (TEV=DUV+NUV). Before this, the value of the
project is assessed in two dimensions from the users’ perspective. Prior to the
commencement of the project, the users’ willingness to pay (WTP) is assessed;
whereas, willingness to accept (WTA) is assessed when the project is completed. WTP
is a measure of how much the user is willing to pay for the service rendered by the
project and WTA is a measure of how much the user is willing to accept for not having
the facility or service of the project.
The basic steps involved in the CVM include:
1. Setting up a hypothetical market;
2. Obtaining bids
This has been used to obtain stakeholder buy in for infrastructure construction projects
(Fonta et al., 2007) and has proven to be a very useful tool especially for engaging with
and securing the support of project stakeholders at the early stages of the project when
the investment decision is being made.
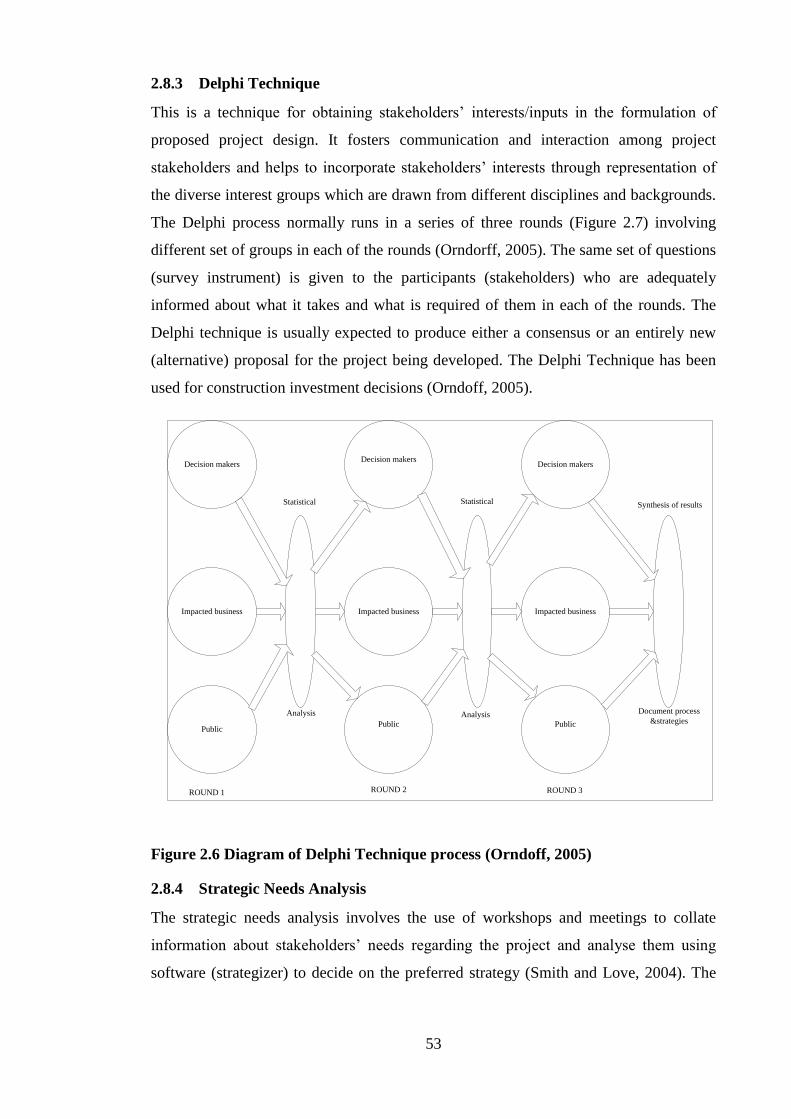
53
2.8.3 Delphi Technique
This is a technique for obtaining stakeholders’ interests/inputs in the formulation of
proposed project design. It fosters communication and interaction among project
stakeholders and helps to incorporate stakeholders’ interests through representation of
the diverse interest groups which are drawn from different disciplines and backgrounds.
The Delphi process normally runs in a series of three rounds (Figure 2.7) involving
different set of groups in each of the rounds (Orndorff, 2005). The same set of questions
(survey instrument) is given to the participants (stakeholders) who are adequately
informed about what it takes and what is required of them in each of the rounds. The
Delphi technique is usually expected to produce either a consensus or an entirely new
(alternative) proposal for the project being developed. The Delphi Technique has been
used for construction investment decisions (Orndoff, 2005).
Decision makers
Impacted business
Public
Decision makers
Impacted business
Public
Decision makers
Impacted business
Public
ROUND 1 ROUND 2 ROUND 3
Statistical Statistical
Analysis Analysis
Synthesis of results
Document process
&strategies
Figure 2.6 Diagram of Delphi Technique process (Orndoff, 2005)
2.8.4 Strategic Needs Analysis
The strategic needs analysis involves the use of workshops and meetings to collate
information about stakeholders’ needs regarding the project and analyse them using
software (strategizer) to decide on the preferred strategy (Smith and Love, 2004). The

54
strategic needs analysis process which involves five major stages is shown in Figure
2.8. These stages are as follows:
1. Collection of information to understand the nature of the problem (preliminary
information seminar);
2. Discuss and analyse the problem (stage two, workshop one);
3. Develop options for solving the problem(stage two, workshop one) ;
4. Choose a preferred option (stage two, workshop two) and
5. Recommend the implementation of the decision based on the workshop
activities (stage two, workshop two).
In a study that focussed on stakeholder management during project inception, Smith and
Love (2004) explored the use of strategic needs analysis at the briefing stage of the
project to involve stakeholders in identifying and proposing a range of strategic options
for a proposed project.

55
Preliminary
Information
seminar
3 to 5
Day
Break
Stage one
Workshop one
One, One and half or Two days
3 to 5
Day
Break
Stage two
Workshop two
Half to one day
Identification of
problems and
issues with
documentation.
Distribution of an
information pack
Identification of
alternative strategies
Options selection
Scoring of
options by
stakeholders
Decide on
preferred
strategy
Problem
definition Ab
sorb
Info
rmat
ion
Ref
lect
on
op
tio
ns
Options
generationOptions
scoring
Strategic
decision
Problem solving stages
Figure 2.7 Problem solving stages and the Strategic Needs Analysis process (Smith
and Love, 2004)
The work of Smith and Love (2004) which is limited to briefing, found that stakeholder
management at the briefing stage of construction projects is useful although it observed
but failed to capture the need for continuity and sustenance of the process which effect
was felt in the case used for the research. The assumption that once some stakeholders
have been involved at the briefing stage leading to the final decision on the project is
sufficient to address stakeholder related issues could be misleading as evidenced in the
concerns expressed by some of the stakeholders at the later stages in the case project.
2.8.5 Stakeholder cycle
Bourne (2005) developed a tool referred to as the stakeholder management cycle for
identifying, visualising and mapping stakeholder influence on projects. The stakeholder
cycle is made up of five steps:
Step 1 – identification of stakeholders;
Step 2 – prioritize the stakeholders;

56
Step 3 – visualize the stakeholders;
Step 4 – engage the stakeholders; and
Step 5 – monitor the outcome.
The stakeholder cycle can be used for stakeholder identification and engagement in
construction. This has been tested in construction projects (Yang and Shen, 2014).
2.8.6 Public hearing
Public hearing is a means of bringing stakeholders together to exchange views,
negotiate different interests and identify mutual goals in construction projects. It can
further be used to decide rights, obligations and arrangements for decision making in
the project (Rowe and Frewer, 2005). Although public hearing has proven beneficial in
stakeholder engagement it can be problematic if not properly carried out. Public hearing
involves engaging the general public together with all key stakeholders of the project in
an open forum where views are freely and systematically exchanged and captured in the
project’s final scheme (Li et al., 2012). This is mostly applicable for projects of public
interests.
2.9 Chapter Summary
This chapter has presented the outcome of a literature review on stakeholder
management in construction projects. Previous research has indicated the need for a life
cycled based stakeholder management in construction projects as lack of or inadequate
stakeholder management have been found to be directly responsible for project failure
in construction. Other gaps identified from the literature review include:
Important steps in stakeholder management include stakeholder identification
and classification. The identification of stakeholders is guided by stakeholder
definition but there is need to coin a definition that combines the broad and
narrow definitions found in the current literature on stakeholder management.
Furthermore, 23 critical success factors for stakeholder management in
construction projects have been identified with the need to gain deeper
understanding of how they are related and can be used to improve stakeholder

57
management in construction projects as well as how they are related to project
success.
Stakeholders and their interests in projects are dynamic hence there is need to
understand why stakeholders’ interests change and track same during the
execution of projects.
The current frameworks for stakeholder management in construction projects do
not address the need for a life cycle based stakeholder management framework.
There is the need for the assignment of responsibility for leading the stakeholder
management process, internal stakeholder collaboration, understanding the
effect of procurement route on the stakeholder management process and the
current understanding of project success in construction projects. An
understanding of the effectiveness of the tools and techniques for stakeholder
engagement is also needed.
The next chapter presents literature review on construction project life cycle; project
success; effects of procurement routes on stakeholder management process; stakeholder
collaboration; and the conceptual model of critical success factors for stakeholder
management in construction projects.

58
3. CHAPTER THREE: LIFE CYCLE, SUCCESS, PROCUREMENT
ROUTES; AND STAKEHOLDER COLLABORATION IN
CONSTRUCTION PROJECTS
3.1 Introduction
As necessitated by some of the findings in chapter two, this chapter presents a literature
review on construction project life cycle, construction project success, construction
procurement routes and stakeholder collaboration in construction. It also presents the
conceptual models of CSF for stakeholder management in construction identified in
chapter 2.
3.2 Project Life Cycle
Understanding the different stages involved in construction projects is vital to the
current study owing to the need for stakeholder management to be carried out
throughout the project’s life cycle. In this section, project life cycle is discussed in terms
of construction investment project and specific stages involved in generic construction
projects.
Researchers have distinguished between the project and the product life cycle; while the
project life cycle refers to the construction period from conception to completion, the
product life cycle refers to the entire service life of the created facility up to close down
(Jugdev and Muller, 2005; Bordass and Leaman, 2005). Aaltonen and Kujala (2010) in
their study of project lifecycle perspective on stakeholder influence strategies in global
projects divided the lifecycle of an investment project (construction) into three main
phases: the investment preparation, project execution and the operation phases. The
main decisions (proposals and design) relating to the project are made at the investment
preparation phase after which follows the project execution phase during which works
are carried out on site to realise the project objectives based on the decisions and
choices made during the design. After the execution phase is the operation phase during
which the benefits of the project are expected to be derived. The different phases of the
project no doubt will see stakeholders coming and going as well as having one thing or
the other to do with either the project or other stakeholders, involved in the project.
Furthermore, the investment preparation phase includes: feasibility, planning and design
phases. At the feasibility phase, decisions are made on the project size, funding,

59
location, organisation and schedule of activities. While at the planning and design
phases, technical definition is widened, and schedule of activities, budget and funding
are refined. Particular technology and specification are also decided and permit
applications are made. Similarly, Kagioglou et al. (2000) presented the stages of
construction project to include preproject stage, preconstruction stage, construction
stage and post completion/construction stage.
Specific Stages Involved in Construction Projects:
The RIBA outline plan of work 2007, organizes the process of designing and managing
building projects into a number of key work stages. It should be noted that the RIBA
plan of work 2013, provides an updated coverage of procurement routes without
changing the work stages. However, the work stages are the main focus of this review.
These include; preparation, design, pre-construction, construction and use. Under each
of the work stages there are further breakdown of specific tasks to be undertaken: under
the preparation stage, there are the appraisal and design brief; the design stage includes
the concept, design development and technical design; the pre-construction stage
includes production information, tender documentation and tender action; the
construction stage includes mobilisation and construction to practical completion; the
use stage involves the post practical completion considerations. The key tasks involved
in these are discussed under their respective headings.
1. Preparation stage
A. Appraisal: the tasks involved at this stage include; identification of the
clients’ needs and objectives including business case and possible constraints
to the proposed development. It also involves feasibility studies and
assessment of options to guide the clients’ decision of whether or not to go
ahead with the development.
B. Design brief: this task is to prepare a general outline of requirements and
constraints as well as planning of future actions needed by the client or on
behalf of the client with the client’s confirmation. It also involves identifying
the appropriate/suitable procurement method, procedures, organisation
structure and range of consultants and others to be engaged in the project.
2. Design stage

60
C. Concept: here the design brief is implemented alongside preparation of
additional data which leads to the preparation of concept design together
with outline proposal for structural and building services systems, outline
specifications and preliminary cost plan. The procurement method is also
reviewed here.
D. Design development: at this stage the concept design is developed to include
structural and building services systems, updated outline specifications and
cost plan. By this the project brief is completed, therefore application is
made for detailed planning permission.
E. Technical design: this involves the preparation of technical design(s) and
specifications, sufficient to coordinate the different components and
elements of the project and information for statutory standards and
construction safety
3. Pre-construction stage
F. Production information: the first step here is the preparation of detailed
production information that will enable tender(s) to be obtained. Application
is also made for statutory approvals. Secondly, it involves the preparation of
further information for the construction works required under the building
contract.
G. Tender documentation: this involves the preparation and collation of tender
documentation in sufficient detail to enable tender(s) to be obtained for the
project. It should be noted that this is more relevant to traditional form of
procurement.
H. Tender action: here potential contractors including specialist contractors of
necessary are identified for the project. Tenders are then obtained and
appraised based on which recommendations are submitted to the client.
4. Construction stage
I. Mobilisation:
J. Mobilisation: here the contractor is appointed and issued information and
arrangements are made to hand over site to the contractor.

61
K. Construction to practical completion: this stage involves the administration
of the building contract to practical completion, provision of further
information to the contractor as and when reasonably required and review of
information provided by contractors and specialists.
5. Use stage
L. Post practical completion: this stage is in three phases; first is the
administration of the building contract after practical completion and making
final inspections; second is to assist the occupants or building user during
initial occupation period and third is to review the project performance in
use.
In view of this, the current research will pay attention to the inception, design,
construction and operation stages of construction projects in considering stakeholder
engagement/management. The inception stage will cover the preparation phase in the
RIBA plan; the design stage will cover the design and pre-construction phase of the
RIBA plan; the construction stage will cover the construction phase of the RIBA plan;
and the operation stage will cover the use stage in the RIBA plan. This is because not all
construction projects follow the RIBA plan and the activities and parties involved in a
construction project depend on the procurement route adopted for executing the project.
3.3 Project Success and Key Performance Indicators in Construction Projects
The ultimate goal of stakeholder management in construction projects is to achieve
successful projects but the meaning and measure of project success in construction have
transformed over the years. This section therefore, reviews how previous studies have
viewed the transformation of project success in terms of criteria for measuring it and
what the key performance indicators are for construction projects.
A project is usually regarded as successful if it is completed on time, within budget and
to the specified standard of quality by the client at the beginning of the project (Chan
and Kumaraswami, 1997; Chan, et al., 2003). This has however been criticized as not
adequate, since it is possible for a project to fail its intended purpose(s) and yet be
considered successful from the project management point of view (Ojiako et al., 2008).
Similarly, a project that failed in terms of project management (not completed within
time, budget and specified quality) can still serve its intended purpose(s).

62
Limiting project success indicators to time, cost and conformance to specifications takes
success as providing the solutions to the briefing and design problems and ignores the
differing interests of the project stakeholders (Winch, 2010). Further, this is an
execution based approach not a total life cycle approach, hence, there is a need to
develop a more sophisticated(all encompassing) definition that allows for the differing
interests of project stakeholders and places the project mission at the heart of the
definition of success (Winch, 2010; Long et al., 2004).
The debate on construction project success has been ongoing but unfortunately due to
many reasons, high project performance and project success are not commonplace in the
construction industry. Key among the reasons are lack of definitive model for either
predicting or explaining performance and lack of a strong consensus as to the factors to
be used , what their definition should be, how best to express outcomes for them, or
what the relationship among factors is, if any (Korde, et al., 2005). Moreover, success
in construction has meant different things to different stakeholders involved on the
project (Bryde and Brown 2005; Toor and Ogunlana 2008). The traditional perception
of project success being judged based on cost quality and time has changed over time to
include; micro and macro viewpoints, stakeholder satisfaction, reduced conflicts and
disputes and environmental friendliness (Lim and Mohamed, 1999; Cookie-Davies,
2002; Bryde and Brown 2005; Low and Chuan 2006; Toor and Ogunlana 2010).
However, there is some level of agreement among researchers that a successful
construction project performance is achieved when stakeholders meet their
requirements, individually and or collectively (Takim, 2009; Long et al., 2004;
Wateridge, 1998; Atkinson et al., 1997). Similarly, project success is attained in
construction when the project outcome (realised asset) fully matches the client’s needs
at the time of realisation. Project mission should therefore, be well defined because
among other benefits, a well-defined project mission enables the communication of
strategic intent to the diverse project stakeholders; both those whose active participation
is required to realise the facility and those who have the power to disrupt the project
delivery process (Winch, 2010). To achieve this, it is necessary for an effective
stakeholder management process to be used from the start of the project. It is important
to note that previous research efforts have suggested what managers need to do to
achieve success in construction projects (Jugdev and Muller, 2005); grouped
construction project success factors (Long et al., 2004); and developed a conceptual

63
framework of factors affecting project success in construction (Chan et al., 2004). These
are discussed in the succeeding paragraphs.
Projects are about managing expectations, and these expectations have to do with
stakeholders’ perceptions on success but project success is a complex and ambiguous
concept and it changes over the project and product life cycle. Therefore, project
managers may be more effective at managing projects to successful completion when
they effectively do the following (Jugdev and Muller, 2005):
1. Think about critical success factors (CSFs) at the onset and consider using the
categories within a specific framework to guide the development of appropriate
indicators to use for various project and product phases.
2. Develop a list of key stakeholders at the beginning of the project and determine
which success category each stakeholder fits into.
3. Avoid using single point indicators of project success and ensure that their
project success indicators include both efficiency and effectiveness measures
over the span of the project/product life cycle and that there are CSFs that
address all key stakeholders needs and wants. They noted here that this does not
mean that all stakeholder wants will be addressed over the course of the project,
but helps to discuss them and place appropriate boundaries on what is
reasonably manageable on the project.
4. Remain mindful that success measures change over the project and product life
cycle and that some of the indicators used at the initial project phases may not
be the ones assessed at the closeout phase. The indicators identified should be
assessed/measured using simple and appropriate measures. It is better to use a
few measure and measure them well than to have a laundry list and not address
them properly.
5. Develop and maintain good relationships and effective communications with
key stakeholders, and in particular, project sponsors because their
understanding, involvement, commitment and appropriate decisions for the
project will be essential to achieve project success.
Long et al. (2004) grouped construction project success factors into five principal
components (Fig. 3.1) comprising: comfort, competence, commitment and
64
communication which they refer to as the four COMs. They argue that the comfort
components emphasizes that resources in terms of money, efforts and leadership should
be available throughout the project in other for construction projects to run smoothly.
This was presented in a table by the authors and stakeholder involvement and feedback
mechanisms have been added to the factors under communication. The need for
constant cash flow cannot be overemphasized but it needs to be balanced with adequate
efforts and leadership in terms of continuing involvement of the project stakeholders to
ensure proper control and support. The component of competence emphasizes the need
for capable manpower to carry out all the tasks involved in the project if success is to be
attained at the end of the project. The component of commitment points out that all
project stakeholders should be interested in the goals of the project. Lastly, an effective
communication system is required and is essential to ensure good decision and
integration throughout the project. The modifications made to the four COMs are in the
“competence” component in which adopting the right procurement route is introduced
and in the “communication” component in which community involvement is changed to
community/stakeholder involvement and feedback mechanism is introduced.

65
Figure 3.1 Grouping of Construction project success factors (adopted and modified
from Long et al., 2004)
Chan et al. (2004) developed a conceptual framework of factors affecting project
success after identifying and grouping the factors into five: project management actions,
project related factors, external environment, project procedures and human related
factors. Variables in each group are interrelated and interrelated such that variables in
one group influence themselves and can influence variables in the other groups. This
framework is adopted with slight modification and presented in Figure 3.2; the
modification done is the introduction of arrows to show the directions of influence
between the major groups of factors. The external environment and project procedures
are modified by the addition of external stakeholders and local planning issues
respectively. The study however did not suggest to what extent these factors affect
project success but it is important that it presents a detailed idea of the factors. In each
of the five groups, at least there is a factor that hinges on stakeholder related
considerations to influence project success.
Influencing components
Principal components
Project SUCCES FACTORS
COMFORT
Adequate funding
Comprehensive contract doccumentation
Availability of resources
Continuing involvement of stakeholders
Competent project managers
COMPETENCE
Up to date technology utilization
Proper emphacis on past experience
Adopting the right procurement route
Multidisciplinsry/competent project team
Awarding bids to the right designer/contractor
COMMITMENT
Clear objectives and scope
Commitment to the project
Top management support
COMMUNICATION
Community/stakeholder involvement
Clear information/communication channels
Frequent progress meeting
Feed back mechanism

66
Project procedures Procurement method
Tendering method
Regulatory authorities
Local planning isues
External environment Economic environment
Social environment
Political environment
Physical environment
Industrial relations
environment
Technological advancement
External stkeholdrs
Project success
Project management
actions Communication system
Control mechanism
Feedback capabilities
Planning effort
Developing an appropriate
organisation structure
Implementing and effective
safety program
Implementing an effective
quality assurance program
Control of sub-contractors’ work
Overall managerial actions
Project related
factors Type of project
Nature of project
Number of floors of
the project
Complexity of project
Size of project
Human related factors Client’s experience
Nature of client (private or Public)
Size of client’s organisation
Client’s emphasis on low
construction cost
Client’s emphasis on high quality of
construction
Client’s emphasis on quick
construction
Client’s ability to brief
Client’s ability to make decision
Client’s ability to define roles
Client’s contribution to design
Client’s contribution to construction
Project team leader’s experience
Technical skills of the project team
leaders
Planning skills of the project team
leaders
Organizing skills of the project
team leaders
Coordinating skills of the project
team leaders
Motivating skills of the project team
leaders
Project team leaders’ commitment
to meet cost, time and quality
Project team leaders’ early and
continued involvement in the
project
Project team leaders’ adaptability
to changes in the project plan
Project team leaders’ working
relationship with others
Support and provision of resources
from project team leaders’ parent
company
Figure 3.2 Framework for factors affecting project success (adopted and modified
from Chan et al., 2004).
Key Performance Indicators (KPIs):
The group of factors that comprise the success criteria in the construction industry are
currently called key performance indicators (KPIs). Key performance indicators provide
a useful framework for measuring and comparing the performance of projects and
furnish project managers, clients and other stakeholders with useful information needed
to implement a project to a successful completion (Chan and Chan 2004).
Egan's report 'Rethinking Construction', which was prepared in response to the
challenging state of the UK construction industry where projects were observed to be
consistently running over time, over budget, and short of meeting client expectations,
presented the first set of KPIs (Egan, 1998).

67
Although, initially focused on cost and on-time performance, the KPIs have been
expanded to include benchmarks for environmental performance, employee satisfaction,
and project safety, to name just a few (Glenigan, 2011). All of these are strongly related
to the latest thinking of construction projects’ success which includes meeting the time
cost and quality (the golden triangle) as well as stakeholders’ satisfaction criteria.
Furthermore, the ultimate goal of procuring any construction project is to achieve
strategic fit between the client’s primary business objectives and secondary procurement
strategy. There is need to meet KPIs in order to achieve strategic fit between client
business need and procurement strategy which will in turn result into project success
(Winch, 2010).
The KPIs are used by construction firms as a benchmark to monitor and improve overall
project performance, continuously improve client satisfaction, and in the case of
government to measure the effectiveness of contractors in the construction
industry. Glenigan (2011) reports among others a slight decline in the level of client
satisfaction with services received from contractors indicative of failure to attain project
success within the construction industry in the UK.
Based on the review of the current perception of project success and key performance
indicators in construction projects, the main success indicators in construction projects
include completion of project on time, completion on budget, completion to specified
standards/qualities and completion to the satisfaction of a majority of the project
stakeholders. An effective stakeholder management should therefore be able to deliver
on these indicators.
3.4 Procurement Routes in Construction
The choice of the procurement route for construction work is one of the many decisions
that are important for project clients to make since project success depends among other
factors on the procurement route used (Anumba and Evbuomwan, 1997; Love, et al.,
1998). Moreover, construction KPIs are concerned with the predictability of design cost
and time as well as construction cost and time which can be regarded as procurement
oriented (Takim and Akintoye, 2002). Stakeholders are likely to have different
perception about the performance of a project when different procurement strategies are
adopted (Toor and Ogunlana, 2010). Therefore, the appropriateness and/or effectiveness
of the procurement method adopted for any construction project plays a vital role in the
68
success or failure of the project. For example, Chan and Chan (2004) in a study of key
performance indicators for measuring construction success found that the completion
time as it relates to speed of a project depended on the procurement method adopted for
the project. They attributed the slow speed (delay) observed in one of the projects
studied to be due to the use of the traditional procurement method. They however,
acknowledge the possibility of other factors playing a part as it was observed that the
project which suffered delay, performed better in terms of cost compared to those
procured through the design and build method. Similarly, Newcombe (1996) compared
the traditional and construction management procurement paths in terms of the power
base and the process used by the project manager. He argues that the traditional system
represents the old class-based division between management and workers where
position power based on a hierarchy of command is exercised by the project manager,
i.e., the Architect; while the construction management is based on the modern
management principle of empowerment or power equalisation and reflects the trend
towards a more pluralistic project environment. These however depend on many factors
such as the form of contract used, the people involved, the environment of the project,
the nature of and complexity of the project, the client (public or private), etc.
Furthermore, procurement routes where contractors and other key stakeholders are
engaged early enough and involved in design lead to greater commitment to the project
hence it is important to identify who is going to work on the project and get them
involved especially in the decision making process (Ankrah et al., 2009).
Past research (Cheung et al., 2001; Ng et al., 2002; Fewings, 2005) suggest
procurement selection criteria to include: desired project completion speed; cost
certainty; time certainty, level of quality required of the end product; complexity
relating to the suitability of the procurement route in executing the project; risk
avoidance/allocation by the parties involved on the project; the level of clarity in the
delineation of responsibilities; the degree of price competition associated with the
procurement options; the ability and authority of the client to effect changes on the
project; tendering process(single or two stage, open or selective, close or negotiated);
degree of collaborative practice or partnering required. All of these are concerned
mainly and more directly with the internal stakeholders those who are directly involved
in the project execution process. None the less, it is important to understand the
different procurement routes that are being used for construction projects.

69
Past studies, for example (Oyegoke, 2001; Dorsey, 2004) have shown that most project
use the traditional procurement route from the early 1900s through to most part of the
first half of the twentieth century; this was followed by the emergence of the
construction management (CM) procurement route between the 1960s and 1970s; the
design and build (D&B) and programme management method came to lime light
between the 1970s and 1980s. Other management oriented approaches such as
partnering and framework agreements (FA) which are based on and geared towards
integrated teamwork and collaborative arrangements emerged between the 1990s and
2000s (McDermott and Khalfan, 2006). In the bid for the continuous improvement of
procurement process, the evolving construction procurement routes have been modified.
Over the years, different categorisations of procurement routes have been advanced by
different scholars. Recently, Oyegoke et al. (2009) based on an extensive literature
review, categorised construction projects procurement routes into four groups which
include: categorisation based on the ways project are organised; categorisation based on
financial issues; categorisation based on the conditions of contracts; and categorisations
based on management process, relational contracting and integrated working
arrangement (Table 3.1). Although this represents a good picture of the various
construction procurement routes, it does not provide clear points of demarcation
between the different categorisations for example between categorisation based on
project organisation and categorisation based on management process.
For a more comprehensive presentation, the procurement routes have been grouped into:
separated procurement routes; integrated procurement routes and management based
procurement routes (Figure 3.3). Separated procurement routes: these are unique for the
separation of design and construction processes, allow full completion of design and
project documentation (in most cases) before tendering, take longer time and guarantee
cost certainty. Variants include: two stage selective tendering contracts, negotiated
contracts and cost-reimbursable contracts which is further divided into cost plus and
target cost contracts. Integrated procurement routes: these basically seek to improve the
level of integration among the internal stakeholders and reduce the level of conflicts in
projects. Therefore, an integrated procurement route ensures that the design,
construction, operation and maintenance of projects are considered as a whole; it also
ensures that the delivery team work together as an integrated project team (OGC, 2008).
These include design and build (package deal, turnkey, and develop and construct) and
public private partnership (DBO, DBOM, BOT, BOO, DBOT, BOOT, BBO, LDO,

70
DBFO, PFI, PSI). Management based procurement routes: this provides a single point
of contact in the project manager (management organisation) for the project. These
include management contracting, construction management and design and manage.
Table 3.1 Categorisation of construction procurement routes
Scholar(s)/Year Categorisation
bases
Categories
Mohsini (1993),
Masterman (2002),
Walker and Hampson
(2003)
Project
organisation
Traditional, D&B, MC & CM
Cox (2001),
Graham (2001),
Best and Valence
(2002),
Miller (2002)
Financial issues
DBO, DBOM, BOT, BOO, DBOT,
BOOT, BBO, LDO, DBFO, PPP/PFI,
PSI
Akintoye (1994),
RICS (2004)
Conditions of
contract
JCT-DB
Oyegoke (2001),
Masterman (2002),
Walker and Hampson
(2003),
McDermott and
Khalfan (2006),
Rwelamila (2010)
Management
process
Partnering & strategic alliance, FA, PC,
MC, CM, D&B
Separated Integrated Management Oriented
Traditional Methods Design & BuildPublic Private
PartnershipsManagement
Contracting
Construction
Management
Design &
Manage
DBO, DBOM, BOT, BOO,
DBOT, BOOT, BBO, LDO,
DBFO, PPP/PFI, PSI
Package deal,
Turnkey, Develop
& construct
Figure 3.3 Grouping of construction procurement routes

71
Delineation of responsibilities depends to a large extent on the procurement route
adopted for the project which is what determines when the project manager comes in
and raises and or try to answer the question of who does stakeholder management
especially at the design stage if the project manager is not involved yet and after the
project have been completed and handed over or is put to use. Understanding the
relationships between stakeholder management and construction procurement routes is
therefore very important and to this we now turn in the next section.
3.5 Relating Stakeholder Management (SM) to the Procurement Routes
This section presents a comparison of different procurement routes against stakeholder
management process. It is important before going into the comparison, to note that
procurement route and contracts have been interchangeably used, while procurement
route is the means of ‘purchasing’ the project, contract is the legal framework that guide
the procurement process and clearly assign responsibilities to the different stakeholders
(especially internal) of the project (Harris, 2010). However, the scope and therefore,
focus of this section is not contract but procurement, although reference will be made to
contracts type from time to time when necessary for the sake of clarity and ease of
understanding.
It has been found from previous research that the following characteristics of
procurement routes are necessary for stakeholder management to be effectively done:
Early involvement of contractor, Contractor involvement in design, Single point of
responsibility, Integration of design and construction process, Separation of design and
construction roles, Clear line of control and communication, Easy stakeholder
identification, Cooperation among the internal stakeholders, External stakeholders
identification/involvement, Opportunities for dispute avoidance/resolution,
Opportunities to accommodate changes, Clear assignment of responsibility. A
comparison is therefore, done based on these stakeholder management related
characteristics with the three groups of procurement routes (Figure 3.3).
3.5.1 Stakeholder Management vs. Traditional method
The traditional method is unique for the separation of design and construction
responsibilities which inhibits cooperation among the professionals involved in the
process. Although the variants may enable cooperation between the design and
construction teams, they do not change the separated nature of the design and

72
construction responsibilities. It allows full completion of design before tenders are
invited. This may aid or give sufficient time for stakeholder (internal and external)
identification as well as aid their inputs and assessment of the project. The big question
for this procurement route about stakeholder management is that of connecting design
and construction and hence ensuring continuity of the process. Rwelamila (2010)
suggested either the use of hybrid traditional procurement methods or a different
procurement method that enables cooperation and collaboration between the teams and
among the team members. The other options under the traditional procurement method
include: two stage selective tendering; negotiated contracts; cost-reimbursable contracts
(cost plus or target cost).
The structure of the two stage selective tendering helps to reduce variations and helps to
secure earlier involvement of the contractor where works commence on site before
detailed design is completed.
For the negotiated contracts, there is the possibility of appointing the contractor early
enough in the design which facilitates clear statement of the construction method and
buildability as well as value engineering of the entire project. While this is likely to lead
to stakeholder satisfaction, it could also facilitate conflicts as work may already have
been underway before some issues will manifest during negotiation (Chan and Chan,
2004).
Cost-reimbursable contracts enable the equitable sharing of financial and practical risks
among the key stakeholders of the project but there is no contractual commitment from
the contractor(s). Although this may secure the commitment of the stakeholders through
their assigned risks and responsibilities, it could negatively affect efficient use of
resources and public accountability thereby affecting the relationship among the project
stakeholders negatively (Oyegoke et al., 2009).
3.5.2 Stakeholder Management vs. Integrated procurement methods
Design and build (D&B): here one contractor takes the responsibilities for design and
construction processes in the project. Stakeholder identification could be made easier
and the possibilities of the project stakeholders working as a team are high due to the
single point of responsibility. Lines of communication and control could be more easily
defined but there is the question of who will be responsible for stakeholder management
since the design and construction teams though within the same organisation are likely
to be separated (Oyegoke, 2001).

73
Package deals (PD): this is similar to the D&B in relating to SM but involves in-house
designers.
Turnkey method (TM): this also involves one organisation undertaking the whole
process leading to the project outcome. This also has the tendencies to facilitate smooth
relationship among the project stakeholders but again the design and construction
responsibilities could still differ within the same contracting organisation.
Develop and construct (D&C): this differs from the D&B in the sense that the client’s
consultant prepares the conceptual drawings (sketch design) and site layout based on
which the contractors produce detailed design with specifications and submit along with
their bids. This may enable early stakeholder involvement but just as in most other
procurement routes does provide for the consideration of external stakeholders (Chan
and Chan, 2004).
3.5.3 Stakeholder Management vs. Management oriented procurement methods
Management contracting (MC): here the management contractor is appointed as a
consultant early in the project to be involved in the design providing construction
expertise as well as to coordinate and manage the work packages at the design and
construction. This method is very flexible hence enables cooperation and easy handling
of issues and changes when they arise (Toor and Ogunlana, 2010). Because of the single
point of responsibility assumed by the management contractor, this may enable
effective communication and control of the project execution process leading to
stakeholders’ satisfaction in the end. However the contractors responsible for the
various work packages having not been involved in the design could negatively affect
cost and quality control and hence relationship among the stakeholders involved
(Rwelamila, 2010).
Construction management (CM): here the construction manager instead of management
contractor as in (MC) is appointed as client’s consultant at the initial stage with equal
status as the other internal stakeholders involved in the design of the project. This
enables the client and designers to make collective timely decisions towards the project
goal. Teamwork is made possible here but still there is the question of not involving the
external stakeholders and depending on the nature of the project, this could be
dangerous (McDermott and Khalfan, 2006).
74
Design and mange D&M): here a single organisation is appointed to undertake both
design and management of the construction operations employing package contractors
to carry out the actual works. This method allows works to commence on site before
final design is completed and design personnel to be present on site to ensure further
detailed design and clarify existing design details as well as cooperate with works
contractors for buildability in liaison with the client’s representative. There could be
enhanced communication among the internal stakeholders. Except guaranteed
maximum price (GMP) which itself could be breached, financial accountability can be a
problem among the internal stakeholders which will make it more difficult for external
stakeholders to be managed (Rwelamila, 2010).
From the foregoing review and comparison between stakeholder management process
and procurement routes, it can be concluded that there is no single procurement route
that provides an adequately conducive environment for stakeholder management in
construction projects, as they mostly focussed on the relationship among the internal
stakeholders. Table 3.2 (where: √ represents enable, ± represents neutral and no
selection means it does not enable) shows which procurement routes enable the different
procurement route related characteristics of stakeholder management in construction
projects. However, it can be said that the integrated and management oriented
approaches are more disposed to supporting internal stakeholder management, the
traditional approach may give more room for identifying and involving external
stakeholders in projects especially at the inception stage. There may also be need for
collaboration among the project stakeholders, especially the internal stakeholders who
are directly involved in and responsible for the project execution/management process
in order to ensure the continuity of the stakeholder management process. The next
section will therefore review stakeholder collaboration in construction projects.
It should be noted before moving to the next section that after adopting procurement
route for projects, the appropriate contract conditions also need to be adopted. The
contract conditions define the contractual relationships among the parties involved. It
describes their duties and obligations on the project, the allocation of risks, how
problems will be overcome, how the parties will work together to influence their
relationship and ultimately the success of the project (OGC, 2007). The contract
conditions are capable of influencing stakeholder management process on the project
hence it is necessary to adopt the most stakeholder friendly contract conditions
applicable to the project. The major forms of contract commonly used include the joint

75
contract tribunal suits (JCT), new engineering contract suits (NEC) and bespoke
contracts (Oyegoke, et al., 2009).
Furthermore, the professional bodies regulating the practice of construction professional
seek to regulate their relationships with one another, with the general public and with
the project environment. These are in line with the principles of stakeholder
management and would enable the professionals to carry out stakeholder management
in construction projects. For example, the Royal Institute of British Architects (RIBA,
2005) code of professional conduct mandates them to: respect the beliefs and opinions
of others, recognise social diversity and treat everyone fairly, have proper concern and
due regards for the effects of their work on its end users and the local community, be
aware of the environmental impact of their work and put in place procedures for dealing
with disputes and complain promptly and appropriately. Similarly members of the
Royal Institute of Chartered Surveyors (RICS) shall at all times act with integrity and
avoid conflict of interests when discharging their professional duties (RICS, 2013).
Moreover, The Chartered Institute of Building’s Code of Practice for Project
Management for Construction and Development provides instructive guide on the
principles of strategic planning, detailed programming and monitoring, range of
possible procurement options resource allocation and effective risk management, to
guide its members in their professional practice (CIOB, 2008).

76
Table 3.2 Summary of stakeholder management related characteristics of procurement routes
Procurement routes
Stakeholder management
related characteristics
Tra
dit
ional
met
hod
2-s
tage
sele
ctiv
e
tender
ing
Neg
oti
ated
contr
acts
Cost
-rei
mburs
able
Des
ign &
Buil
d
Pac
kag
e d
eals
Turn
key
Dev
elop &
const
ruct
PP
P/P
FI
Man
agem
ent
contr
acti
ng
Const
ruct
ion
man
agem
ent
Des
ign &
man
age
Early involvement of contractor √ √ √ √ √ √ √ √ √
Contractor involvement in design √ √ √ √ √ ± ± ±
Single point of responsibility √ √ √ √ √
Integration of design and
construction process
√ √ √ √ √ ± ± √
Separation of design and
construction roles
√ √ √ ± ±
Clear line of control and
communication
√ √ √ √ √ √
Easy stakeholder identification √ √ √
Cooperation among the internal
stakeholders
√ √ √
External stakeholders
identification/involvement
√ √ ± ± ±
Opportunities for dispute
avoidance/resolution
√ √ √ √ √
Opportunities to accommodate
changes
± √ √ ± √ √ √
Clear assignment of
responsibility
√ √ √ √ √ √ ± ± ± ±

77
3.6 Stakeholders’ Collaboration in Construction
Managing construction project stakeholders to achieve successful project requires team
work- collaboration between the client, design and construction teams and sharing of
individual skills and expertise to elicit support from all available sources. This section
therefore starts by reviewing collaborative working in construction in general before
moving into stakeholder collaboration in particular. The main aim of this section is to
identify the enablers and barriers of stakeholder collaboration.
Collaboration is a creative process embarked upon by two or more individuals or
groups, sharing their collective skills, expertise, information (knowledge) and
understanding in an atmosphere of openness, mutual respect, honesty and trust to jointly
deliver the best solution that meets their common goal (According to Wilkinson, 2005).
In other words, collaboration means joint working by two or more stakeholders of a
venture to achieve a common goal that neither can achieve individually (Gray, 1985).
From these definitions, it is clear that certain conditions need to be satisfied by all
involved in the collaboration in order for the desired goal of the venture to be achieved.
Even though this definition talks only about individuals and not groups, it is considered
very comprehensive because it touches on most of the important factors that any
collaborative venture relies upon.
The multi organizational and geographically dispersed nature of construction make the
requirement for collaboration in construction very high and there is need for a detailed
organizational change in management approach in order to control all the factors
affecting the success of collaboration environments (Erdogan et al., 2008). They
identified the following reasons for the failure in achieving the full benefits expected
from the implementation of collaboration systems: Poor capture of user requirements,
lack of strategic approaches, lack of proper planning/project management, user
resistance to change, lack of user involvement and technical characteristics. They
however noted that failure in the implementation of collaboration environments for
construction are scarcely due to technical issues but mainly due to organizational and
people related issues. Therefore, apart from being able to successfully execute the
project in terms of cost, quality and time, project partners should be able to effectively
mobilize their capabilities to interact, coordinate and collaborate to effectively deliver
the project both individually and as a team (Rahman and Kumaraswamy, 2005).

78
However, the success or failure of collaboration in construction projects is contingent
upon certain factors.
Akintoye and Main (2007) identified the success and failure factors for collaborative
relationships in construction within the construction environment. The main success
factors are commitment of adequate resources from the parties involved, equity of
relationship, recognition of the importance of non – financial benefits and clarity of
objectives whereas the failure factors are lack of trust and consolation and lack of
experience and business fit. Furthermore, collaborative relationships are important for
dealing with conflicts and adversarial relationships in the construction environment and
for attaining and maintaining a competitive advantage. There is need to combine trust
building arrangements, price control and clearly defined lines of authority in order to
achieve efficient procurement transactions (Eriksson and Laan, 2007). However, the
fragmented approach to construction project procurement have led to project teams
having lack of transparency, adversarial relationship and mistrust leading to a situation
in which the various team members try to minimise their level of exposure to the project
risks instead of working together as a team with the spirit of cooperation, trust and
collaboration (Baiden et al., 2005). Therefore, for any genuine collaborative working to
succeed there is the need for significant changes to both the culture of the teams
involved and the tools they use to manage their information and communications
(Wilkinson, 2005).
It can be summarised that the enablers of collaborative working include: having shared
vision on the project; clearly defining lines of authorities and responsibilities; having
mutual trust and respect for each other; being able to communicate effectively; being
able to use the available process and technologies. And the barriers include: poor
capture of user requirements which may be a result of their lack of or inadequate
involvement; lack of strategic approaches; lack of proper planning/project management;
user resistance to change especially when they are not adequately informed about the
changes. Although these barriers were identified for construction collaboration
environment in general (Erdogan et al., 2008) their application in the current study will
be within the context of collaboration among the internal stakeholders and where
necessary with key external stakeholders to ensure smooth stakeholder management
process in construction projects. It is argued that collaboration between the design and
construction teams will improve and sustain the process of stakeholder management.
79
This could facilitate better management of both internal and external stakeholders of
construction projects leading to more successful delivery of projects.
Construction projects involve many stakeholders, some internal and some external.
Owing to the fragmented nature of construction projects, the stakeholders play different
roles at different stages during and after the project execution. The project Architect or
designers, construction manager, facilities manager, client, regulatory bodies, media, etc
all play different roles on the project. Collaboration between these stakeholders is
essential for projects to be delivered successfully.
According to Jamal and Getz, (1995) stakeholder collaboration is a process of collective
decision making among key internal stakeholders of a project to avoid or address
stakeholder issues in the project. The aim of stakeholder collaboration is to build a
consensus among internal stakeholders. It should however be noted that the right to
participate in stakeholder collaboration does not automatically translate to the ability to
perform effectively. It would be necessary to determine when stakeholders should be
involved and who should coordinate stakeholder management process at different stages
of the project.
The need for stakeholder collaboration in construction can be described using the
following metaphor: “imagine a group of people putting up a tent (the phenomenon of
interest) on a hill-side, each with a different kind of peg or stake (metal ones, different
coloured plastics ones, wooden ones, angled ones, etc.). each person is holding a
different stake (their interest), and trying to drive their points home as they push their
stakes into the ground. But the stakeholders who have mallets have the power to drive
their points home more effectively than others. Working alone, the tent might take on
the shape determined by the guy-ropes secured by the mallet-holders, and is likely to
collapse in the first wind. But knowing who they are working with, the mallet-holders
can work together to position their stakes so the tent stays up. They may even be able to
help some of the other stakeholders who do not have mallets to secure their stakes. By
working together in this way it is more likely that the tent will withstand the storm.”
(Reed et al., 2009 Pg 1947). Similarly, stakeholders involved in a construction project
can have different stakes. The client and Architect may be interested in an aesthetic and
functional product; with the client being additionally interested in obtaining this within
the lowest possible cost they are likely to disagree with the Architect on any aspects of
the design that unnecessarily add to the total cost of the project. The project Quantity
80
Surveyor is likely to align with and work towards the clients’ interest of achieving their
goal with the lowest cost. Also, the construction method adopted by the contractor or
project manager may not be acceptable or favourable to the residents around the project
site who may not be having anything directly to do with the project; this may arouse
their interest and possible conflicts with the project. Furthermore, the introduction of
any time adding variations to the project may not be acceptable to the contractor who
would like to finish and move on to the next project unless the variations adds
significantly to their profit and does not adversely affect their future plans. In the same
vein, government control agencies at different levels would be interested in seeing that
the project design and construction meet established standards and regulations. Working
alone may lead to only the powerful stakeholders being able to achieve their interest
with disregard to the others in which case the project may end up failing; but by
working together and accommodating each other’s interest, they would be able to define
an all-encompassing project mission and be more likely to achieve a successful project
“withstand the storm”.
From the foregoing review on collaborative working in construction projects, internal
stakeholders in construction projects can collaborate to carryout stakeholder
management. To achieve the aim of carrying out stakeholder management they need to
build mutual trust and respect, share their individual knowledge and expertise, share a
common goal in the project and be committed to their assigned responsibilities
throughout the process.
3.7 Conceptual Measurement and Structural Models of Critical Success
Factors for Stakeholder Management in Construction
Identifying the critical success factors for stakeholder management in construction and
grouping them are good initial steps towards ensuring successful stakeholder
management in construction projects (Yang et al., 2009). Clear understanding of the
relationships among the groupings of these factors is necessary to further inform and
equip industry practitioners to carryout stakeholder management. This section discusses
the conceptual (theoretical) model of the interrelationships among the CSFs for
stakeholder management in construction and their latent variables (constructs) drawn
from the extant literature. During the development of the conceptual model, the
following assumptions were made: 1) Obtaining detailed information about the projects
and its stakeholders is considered the first major step of stakeholder management which

81
in turn informs stakeholder analysis (Chinyio and Akintoye, 2008; Yang et al., 2009). 2)
Being able to obtain such information entails knowing the characteristics of the project
and its stakeholders. 3) The outcome of an informed stakeholder analysis/estimation
would lead to the understanding of possible stakeholder dynamism and prediction of
their likely behaviours on the basis of which appropriate stakeholder
management/engagement strategies can be decided (Jepsen and Eskerod, 2009).
As shown in Figure 3.4, the measurement model based on the above theoretical
relationships proposes a positive correlation between the four constructs (SCPC, SA,
SD and SE; explained in the sub-sections below) and direct positive measurement of the
constructs by their indicators.
Figure 3.4 Conceptual Measurement Model of CSFs for Stakeholder Management
in Construction
The four constructs are individually and collectively considered as enablers of
stakeholder management. These four enablers (constructs or latent variables) of
stakeholder management process are measured by the CSFs for stakeholder
management in construction projects identified in chapter 2. The four latent variables
(constructs) and their indicators are presented in Table 3.3 and explained in the
following sub sections. The last row of Table 3.3 also shows the project success (PS)

82
construct which is part of the structural model with its indicators identified in Section
3.3. Furthermore, the hypotheses based on which the structural model of the
interrelationships among CSFs for stakeholder management in construction is built are
stated under the relevant constructs.
Table 3.3 Constructs and indicators of conceptual measurement model of CSFs for
stakeholder management in construction
Constructs Indicators
Stakeholder characteristics and
project characteristics (SCPC)
Clearly formulating the project mission;
Ensuring the use of a favourable procurement method;
Carefully identifying and listing the project stakeholders;
Ensuring flexible project organisation;
Identifying and understanding stakeholders’ areas of
interests in the project.
Stakeholder analysis (SA)
Determining and assessing the power (capacity to
influence the actions of other stakeholders); urgency
(degree to which stakeholders’ claims requires
immediate attention); legitimacy (perceived validity of
claims); and proximity (level of association or closeness
with the project) of stakeholders;
Appropriately classifying stakeholders according to their
attributes/characteristics;
Predicting and mapping stakeholders’ behaviours
(supportive, opposition, neutral etc);
Predicting stakeholders’ potential influence on each
other;
Predicting stakeholders’ potential influence on the
project;
Identifying and analysing possible conflicts and
coalitions among stakeholders;
Stakeholder dynamics (SD)
Resolving conflicts among stakeholders effectively;
Managing the change of stakeholders’ interests;
Managing the change of stakeholders’ influence;
Managing the change of relationship among
stakeholders;
Managing change of stakeholders’ attributes;
Managing how project decisions affect stakeholders;
Predicting stakeholders’ likely reactions for
implementing project decisions.
Stakeholder
engagement/empowerment (SE)
Involving relevant stakeholders to redefine (refine)
project mission;
Formulating appropriate strategies to manage/engage
different stakeholders;
Keeping and promoting positive relationships among the
stakeholders;
Communicating with stakeholders properly and
frequently (instituting feedback mechanisms);
Considering corporate social responsibilities (paying
attention to economic, legal, environmental and ethical
issues).
Project Success (PS)
Completion of project on time;
Completion on budget;
Completion to specified standards/qualities;
Completion to the satisfaction of a majority of the
project stakeholders.

83
Stakeholder Characteristics and Project Characteristics (SCPC)
Clear understanding of projects’ and stakeholders’ characteristics would avail the
project management team sufficient information concerning the project and its
stakeholders. Project characteristics include size, location, type of client, funding
source, procurement issues, and objectives of the projects. Project characteristics as well
as its potential impact should be clearly identified and documented at the early stages of
the project in order to inform adequate stakeholder identification and analysis (Olander
and Landin, 2005; Aaltonen et al., 2008; Jepsen and Eskerod, 2009). Stakeholder
characteristics refer to stakeholders’ stakes and interests, bases of involvement (direct or
indirect), sources of power and other attributes (Mitchell, et al., 1997; Winch, 2010).
Without such information, it would be very difficult to proceed with stakeholder
management (Mitchell et al., 1997; Bourne and Walker, 2005). Therefore, the
conceptual measurement model hypothesised that stakeholder characteristics and project
characteristics is dependent upon the project management team’s ability to clearly
formulate the project mission; adopt a favourable procurement route for the project;
carefully identify and list the project stakeholders; ensure the use of flexible project
organisation; and identifying and understanding stakeholder areas of interest.
Under this construct, the following hypotheses are stated:
Hypothesis 1: Obtaining adequate information on stakeholder characteristics and project
characteristics (SCPC) influences the impact of stakeholder management on
construction project success (PS).
Hypothesis 2: Obtaining adequate information on stakeholder characteristics and project
characteristics (SCPC) enables stakeholder analysis (SA).
Hypothesis 3: Obtaining adequate information on stakeholder characteristics and project
characteristics (SCPC) enables the understanding of stakeholder dynamism (SD).
Stakeholder Analysis (SA)
Stakeholder analysis consists of systematically determining stakeholders’ areas and
levels of interests; expected contributions; expected levels of power and influence; and
level of importance; with respect to the project (Karlsen, 2002; Jepsen and Eskerod,
2009). It is important for project managers or responsible professionals to analyse the
powers, needs and concerns of all project stakeholders, both internal and external to the

84
project. If the needs and concerns of project stakeholders are not carefully analysed and
addressed, conflicts and confrontations can arise among the stakeholders or between the
stakeholders and the project and consequently hamper the successful delivery of the
project (Aaltonen et al., 2008; Olander and Landin, 2008; Li et al., 2012). The results of
stakeholder analysis will inform and shape decisions on stakeholder management for the
project (Jepsen and Eskerod, 2009). Therefore, this construct (latent variable) is
hypothesised to be indicated by the project management’s ability to determine and
assess stakeholders’ attributes; appropriately classifying stakeholders according to their
attributes; predicting and mapping stakeholders’ behaviours; predicting stakeholders’
potential influence on each other and on the project; and identifying and analysing
possible conflicts and coalition among stakeholders.
Under this construct, the following hypotheses are stated:
Hypothesis 4: Stakeholder analysis (SA) influences the overall impact of stakeholder
management on construction project success (PS).
Hypothesis 5: Stakeholder analysis (SA) enables effective stakeholder
engagement/empowerment (SE).
Stakeholder Dynamics (SD)
The stakes and interests of construction stakeholders can be as diverse as the
stakeholders themselves and these are dynamic over the life cycle of projects (Chinyio
and Akintoye, 2008). For example the primary interest of local residents is how the
project affects their amenity and immediate environment; local land owners are
interested in making sure that their interest will not be hurt by the project; the
environmentalists are interested in protecting the environment from pollution and or
destruction; the competitors try to gain competitive advantage by their actions; the
media influence the perception of people about the reputation of the project; and others
include those whose connection to the project is not immediately clear but whose
support may be helpful to the success of the project (Leung and Olomolaiye, 2010).
These interests can change as the project progresses because stakeholders’ ability to
influence and control project decisions and actions depend on their level of power and
other associated attributes in the project. These can change from stage to stage and even
from time to time within the same stage during the projects’ life cycle (Nash et al.,
2010). Unless appropriate strategies are adopted for engaging and managing

85
stakeholders based on their prevailing stance throughout the project’s life cycle, they
can spring up with surprises and hinder the progress of the project (Olander and Landin,
2005). In order to adopt the appropriate strategy for engaging stakeholders, it is
necessary to understand the changing (dynamic) nature of stakeholders’ attributes
during the project. It should be noted that understanding stakeholders’ dynamism
depends largely on careful stakeholder analysis (Aaltonen et al., 2008). Therefore, this
construct is indicated by project management’s ability to effectively resolve conflicts
among stakeholders; manage change of stakeholders’ interest and influence; manage
change of stakeholders’ attributes; manage change of relationships among stakeholders;
predict stakeholders’ likely reaction for implementing project decisions and manage
how project decisions affect stakeholders.
Under this construct, the following hypotheses are stated:
Hypothesis 6: Understanding stakeholder dynamism (SD) influences the overall impact
of stakeholder management on construction project success (PS).
Hypothesis 7: Stakeholder analysis (SA) enables the understanding of stakeholder
dynamism (SD).
Hypothesis 8: Understanding stakeholder dynamism (SD) enables effective stakeholder
engagement/empowerment (SE).
Stakeholder Engagement/Empowerment (SE)
Given their dynamic nature and lengthy process of construction, stakeholders adopt
different strategies at different stages of project to exert their interests on the project
(Aaltonen et al., 2008), hence different appropriate strategies should be used for
engaging/managing stakeholders at different stages of the project depending on the
prevailing circumstances. Using the most appropriate strategies for engaging project
stakeholders will enable project success to be achieved (Chinyio and Akintoye, 2008).
For instance, while some stakeholders can be communicated to using letters/flyers about
project decision others must be contacted directly through meetings/workshops or
project website to get their inputs about the project depending on their classification in
the project. Therefore, this construct is indicated by the project management’s ability to
involve relevant stakeholders in refining project mission whenever necessary; formulate
appropriate strategies to manage/engage different stakeholders; keep and promote
positive relationships among the stakeholders; communicating with stakeholders

86
properly and frequently with feedback mechanisms; and considering all social
responsibility issues surrounding the project.
Under this construct, the following hypotheses are stated:
Hypothesis 9: Effective stakeholder engagement/empowerment (SE) influences the
impact of stakeholder management on construction project success (PS).
Hypothesis 10: Obtaining adequate information on stakeholder characteristics and
project characteristics (SCPC) enables effective stakeholder engagement/empowerment
(SE).
The conceptual structural model of the relationships among the critical success factors
based on the hypotheses stated is shown in Figure 3.5.
Stakeholder
Dynamism
Stakeholder
Characteristics &
Project
Characteristics
Stakeholder
Analyses
Project Success
Stakeholder
Engagement/
empowerment
H3H7
H2
H6
H1
H9
H4
H8
H5
H10
Figure 3.5 Hypothesised structural model of critical success factors for stakeholder
management in construction
3.8 Chapter Summary
This chapter has reviewed topics necessitated by the review on stakeholder management
in construction projects presented in chapter 2. They include project life cycle,
87
construction project success, construction procurement routes and stakeholder
collaboration in construction.
The review identified a distinction between project and project life cycle which hitherto
have been confused, one for another. The project life cycle refers to the period from
inception to practical completion and the product life cycle refers to the entire service
life (operation) of the created facility up to close down. It was decided to combine these
two views in developing a life cycle based framework for stakeholder management in
construction projects. Therefore, four stages including inception, design, construction
and operation are used.
The review on construction project success perception revealed that project success and
project management success have been used interchangeably. While project
management success refers to the achievement of completion to cost quality and time
(the golden triangle), project success encompasses the golden triangle and stakeholder
satisfaction with the created facility. Project management can be successful and yet the
project may be considered a failure if it fails to serve its purpose to stakeholders’
satisfaction. Conversely, project management can fail and yet the created facility is able
to serve its intended purpose to stakeholders’ satisfaction. Four key success indicators
have been identified including completion of project on budget, completion on
schedule, completion to specified standards/qualities and completion to stakeholders’
satisfaction.
The review also identified procurement route as an important consideration in
stakeholder management. Three groups of procurement routes including traditional,
integrated and management based procurement routes have been related with
stakeholder management process. 12 procurement routes related characteristics of
stakeholder management have been identified with the need to investigate how they
influence the stakeholder management process.
The review on stakeholder collaboration in construction projects revealed that it is
necessary for internal stakeholder to collaborate in carrying out stakeholder
management in construction projects. Internal stakeholders need to build mutual trust
and respect with themselves and other stakeholders, share their individual knowledge
and expertise, share in the common goal of stakeholder management and be committed
to their assigned responsibilities throughout the process.
88
Using the findings of the review on stakeholder management presented in Chapter 2
combined with the review presented in this chapter, conceptual measurement and
structural models have been developed to enable the investigation of the
interrelationships among the critical success factors for stakeholder management in
construction projects and how they are related to project success. The next chapter
presents the research methodology adopted for the overall study presented in this thesis.
89
4. CHAPTER FOUR: RESEARCH METHODOLOGY
4.1 Introduction
Research practices are generally influenced by knowledge bases underpinned by
philosophical ideas or philosophical worldviews based on which there are different
options of research methods available for researchers of different disciplines (Creswell,
2009). It is necessary for researchers to choose from these to explain the choices they
make in designing their research. This chapter discusses the research methodology for
this study. It starts by giving a general background and comparison of the concepts
guiding research design, explains the main components of the research design model
found most suitable and adopted in this study for guiding research design and then
presents the research design and methodology adopted for the study reported in this
thesis as well as research validity and reliability.
4.2 Research Design Concepts
Researches generally are characterised by diversity of approaches to identifying and
solving problems and there exist an extensive literature on the strengths and weaknesses
as well as adoptability/suitability of these approaches for addressing research questions.
Therefore, there are different ways to go about research design to achieve the aim and
objectives of any research venture. According to Blaikie (2007), there are two ways to
solving this problem of research design; either to adopt one approach or explore a
combination of appropriate approaches for the research. It is important for researchers
to instead of focussing on method only, focus on the problems in order to employ the
most or all suitably available approaches (“tailor made design”) to address the research
question(s) (Rossman and Wilson, 1985; Patton, 1990; Morgan, 2007).
Therefore, for the purpose of adopting appropriate research design for this study, a
comparison of four research design models including Nested model (Kagioglou, et al.,
2000); Research ‘onion’ (Saunders, et al., 2009); ‘Choices’ (Blaikie, 2007); and
research design ‘framework’ (Creswell, 2009) is presented.
Kagioglou et al. (2000) proposed a nested approach to modelling research design shown
in Fig. 4.1. The nested design model is based on three circles in a ring with the research
techniques and research approaches respectively forming the inner and middle circles

90
which are guided by research philosophy in the outer circle. While research philosophy
is the bases for the development of knowledge, research approach is the method used to
generate and test theory such as case study, survey, action research and experiment and
research techniques refer to the data collection means which include interview,
questionnaire, observation or focus group workshop.
text
RESEARCH
PHILOSOPHY
RESEARCH
APPROACHES
RESEARCH
TECHNIQUES
Figure 4.1 Nested research model (Kagioglou et al., 2000)
The research ‘onion’ (Saunders, et al., 2009) shown in Fig. 4.2, has six layers and is
referred to as the research ‘onion’ because the six layers constituting the model
resemble the rings of an onion. Each of these layers (research philosophies, research
approaches, research strategies, time horizons, choices and data collection and data
analysis offers a number of options from which to choose in order to achieve the aim
and objectives of the research. While research philosophies form the outer ring, data
collection and data analysis form the innermost (core) ring of the research ‘onion’
suggestive of the need to gradually peal the layers of the ‘onion’ one after the other
starting from the outer (research philosophies) ring before arriving at appropriate
research design.
According to Blaikie (2007), research strategies or logic of inquiries are associated to
one or more research paradigms based on which researchers have to make some basic
‘choices’ in carrying out any research project (Fig. 4.3). Figure 4.3 shows, as indicated
by the vertical arrows, that decision and choices on the research problem, questions,
strategies and paradigms are interrelated such that it may become necessary for
researchers to move back and forth between them before final decisions are made on

91
which option(s) or combination(s) to adopt. The horizontal arrows indicate the basic
categories among which to choose for each step in designing and conducting research.
PHILOSOPHIES
APPROACHESSTRATEGIES
TECNIQUES
AND
PROCEDURES
Data collection
and data analysis
Experiment
Survey
Case study
Action research
Grounded
theory
Archival
research
Deductive
Inductive
Positivism
Realism
Interpretivism
Pragmatism
Cross sectional
CHOICES
Multi-methodLongitudinal
Mixed
methods
TIME
HORIZONS
Mono method
Ethnography
Figure 4.2 The research 'onion' (Saunders, et al., 2009)

92
RESEARCH
PARADIGMS
Positivism
Critical Rationalism
Classical Hermeneutics
Interpretivism
Critical Theory
Social Science Realism
Contemporary Hermeneutics
Ethno methodology
Structuration Theory
Feminism
Researcher’s
stance
Outside expert
Inside learner
Conscientizer
Epistemology
Empiricism
Rationalism
Falsification
Neo-realism
Constructionism
Conventionalism
Ontology
Shallow realist
Conceptual realist
Cautious realist
Depth realist
Idealist
Subtle realist
Top down
Bottom upRESEARCH
STRATEGIES
Inductive
Deductive
Retroductive
Abductive
‘What’ questions
‘Why’ questions
‘How’ questions
Research
Questions
Research
Problem
Figure 4.3 Research 'Choices' (Blaikie, 2007)
Creswell (2009) proposed a framework for research design based on the interconnection
of worldviews, strategies of enquiry and research methods. Based on this framework
(Fig. 4.4), arriving at research design involves determining the intersection of
philosophies (philosophical world views), strategies of inquiry and specific methods in
relation to the research question(s) to be addressed. Worldview refer to the basic set of
beliefs that guides action otherwise referred to as epistemology and ontology (Crotty,
1998); research paradigms (Blaikie, 2007) while strategies are the types of qualitative,
quantitative and mixed method that specifically direct procedures in research design and
research methods are the specific steps involved in data collection, analysis and
interpretation. This framework is hinged on the need for researchers to think through
the philosophical worldview assumptions they rely upon, the strategies of inquiry that
are related to this worldview and the specific research methods or procedures that put
the approach into practice.
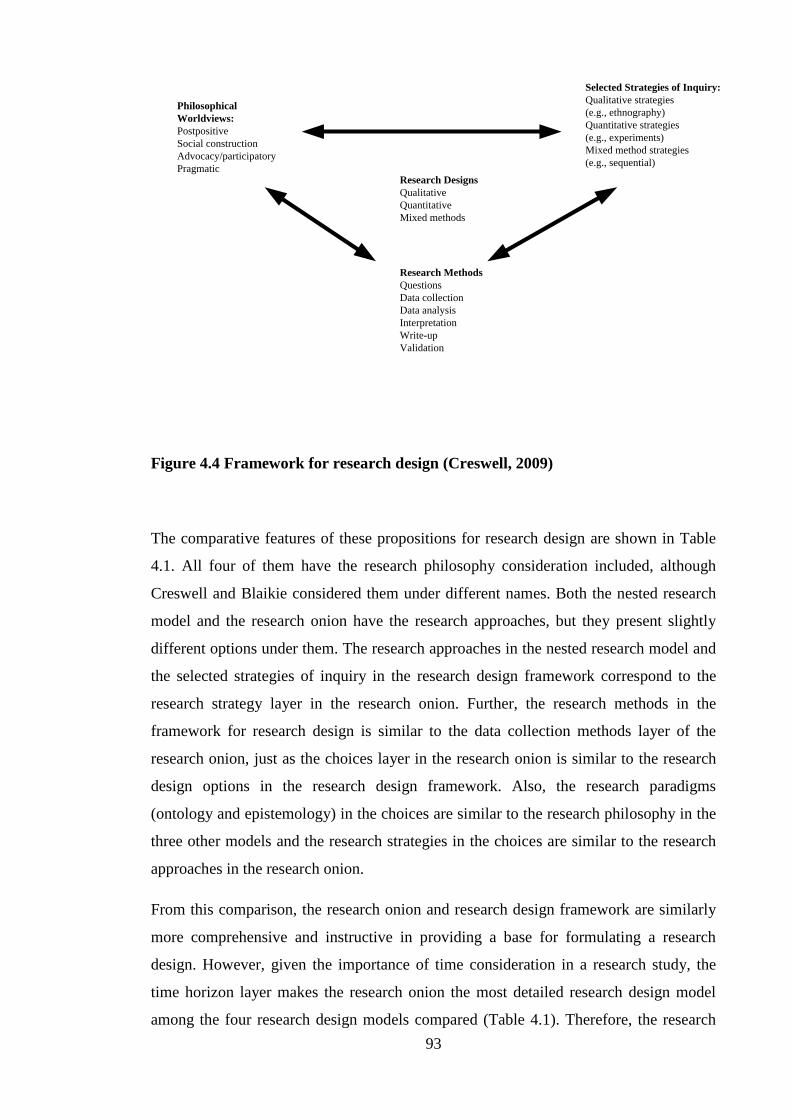
93
Selected Strategies of Inquiry:
Qualitative strategies
(e.g., ethnography)
Quantitative strategies
(e.g., experiments)
Mixed method strategies
(e.g., sequential)
Philosophical
Worldviews:
Postpositive
Social construction
Advocacy/participatory
Pragmatic
Research Methods
Questions
Data collection
Data analysis
Interpretation
Write-up
Validation
Research Designs
Qualitative
Quantitative
Mixed methods
Figure 4.4 Framework for research design (Creswell, 2009)
The comparative features of these propositions for research design are shown in Table
4.1. All four of them have the research philosophy consideration included, although
Creswell and Blaikie considered them under different names. Both the nested research
model and the research onion have the research approaches, but they present slightly
different options under them. The research approaches in the nested research model and
the selected strategies of inquiry in the research design framework correspond to the
research strategy layer in the research onion. Further, the research methods in the
framework for research design is similar to the data collection methods layer of the
research onion, just as the choices layer in the research onion is similar to the research
design options in the research design framework. Also, the research paradigms
(ontology and epistemology) in the choices are similar to the research philosophy in the
three other models and the research strategies in the choices are similar to the research
approaches in the research onion.
From this comparison, the research onion and research design framework are similarly
more comprehensive and instructive in providing a base for formulating a research
design. However, given the importance of time consideration in a research study, the
time horizon layer makes the research onion the most detailed research design model
among the four research design models compared (Table 4.1). Therefore, the research
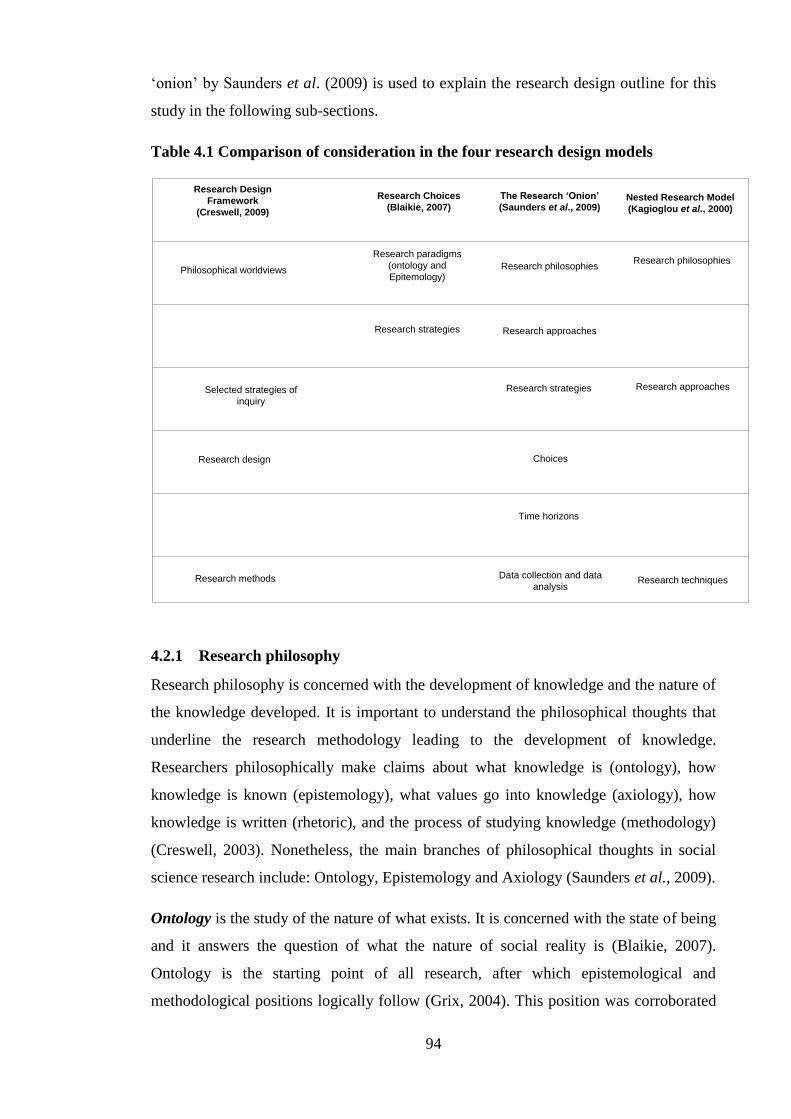
94
‘onion’ by Saunders et al. (2009) is used to explain the research design outline for this
study in the following sub-sections.
Table 4.1 Comparison of consideration in the four research design models
Research Design
Framework
(Creswell, 2009)
Research Choices
(Blaikie, 2007)
The Research ‘Onion’
(Saunders et al., 2009)Nested Research Model
(Kagioglou et al., 2000)
Philosophical worldviews
Research paradigms
(ontology and
Epitemology)Research philosophies
Research philosophies
Research strategies Research approaches
Selected strategies of
inquiry
Research strategies Research approaches
Choices
Time horizons
Data collection and data
analysisResearch techniques
Research design
Research methods
4.2.1 Research philosophy
Research philosophy is concerned with the development of knowledge and the nature of
the knowledge developed. It is important to understand the philosophical thoughts that
underline the research methodology leading to the development of knowledge.
Researchers philosophically make claims about what knowledge is (ontology), how
knowledge is known (epistemology), what values go into knowledge (axiology), how
knowledge is written (rhetoric), and the process of studying knowledge (methodology)
(Creswell, 2003). Nonetheless, the main branches of philosophical thoughts in social
science research include: Ontology, Epistemology and Axiology (Saunders et al., 2009).
Ontology is the study of the nature of what exists. It is concerned with the state of being
and it answers the question of what the nature of social reality is (Blaikie, 2007).
Ontology is the starting point of all research, after which epistemological and
methodological positions logically follow (Grix, 2004). This position was corroborated
95
by Blaikie (2007) who posited that all research paradigms embody a world view
underpinned by ontologically driven assumptions. Furthermore, while ontology
embodies understanding what is, epistemology tries to understand what it means to
know (Gray, 2009). Therefore, it is important to note that ontological and
epistemological issues tend to emerge together (Crotty, 2003). There are two main
ontological assumptions namely: Objectivism (realism) and Subjectivism (idealism)
(Saunders et al., 2009; Blaikie, 2007). Objectivism is based on the believe that the
existence of social entities is in reality external to the social actors concerned with their
existence; and subjectivism is based on the believe that social phenomena are created by
the perceptions, thoughts and consequent actions of the social actors concerned with
their existence. Similarly, Blaikie (2007) explains the idealist and realist ontological
assumptions as follows: “An idealist theory assumes that what we regard as the external
world is just appearances and has no independent existence apart from our thoughts. In
a realist theory, both natural and social phenomena are assumed to have an existence
that is independent of the activities of the human observer.”
Epistemology, is the theory or science of the nature of knowledge; which deals with its
possibility, scope and general basis (Crotty, 2003; Blaikie, 2007). In other words,
epistemology is concerned with what is considered as acceptable knowledge in a given
field of study (Saunders et al., 2009). Furthermore, epistemology is concerned with the
provision of philosophical bases for establishing what kinds of knowledge are possible
to be known and how to decide that what have been known are both adequate and
legitimate knowledge (Crotty, 2003). Similarly, Vogt et al., (2012) argued that
epistemology is the study of the origin and justification of knowledge and its claims.
Epistemology determines the stance of the researcher in the development of knowledge.
The main epistemological stances a researcher can take include positivist and
interpretivist stance. Positivism is based on the idea that only observable phenomena
can lead to acceptable data, collection of which is based on hypotheses derived from
existing theory. The positivist researcher is concerned with facts and that the conduct of
research should be value-free such that neither the subject of the research nor the
researcher influences each other. Interpretivism advocates the need for the researcher to
understand differences between humans in their roles as social actors. The interpretivist
researcher armed with the view that the world is subjective and socially constructed is
actively involved in what is being studied (Saunders et al., 2009).
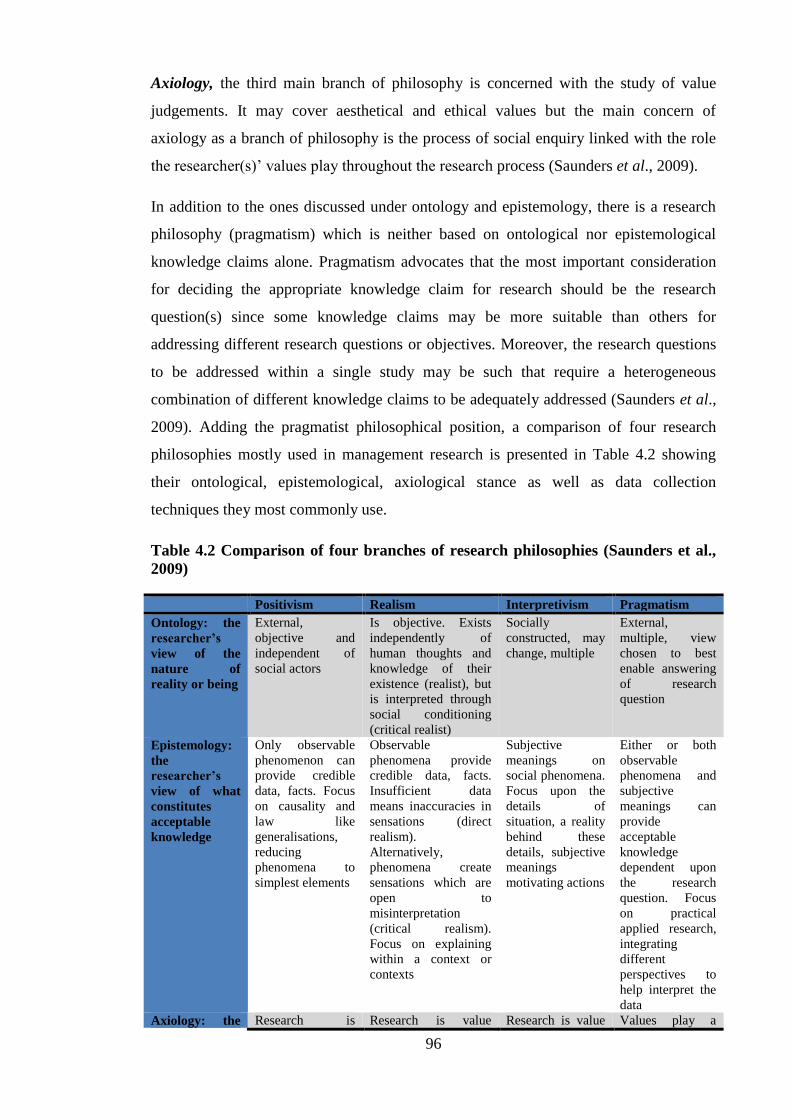
96
Axiology, the third main branch of philosophy is concerned with the study of value
judgements. It may cover aesthetical and ethical values but the main concern of
axiology as a branch of philosophy is the process of social enquiry linked with the role
the researcher(s)’ values play throughout the research process (Saunders et al., 2009).
In addition to the ones discussed under ontology and epistemology, there is a research
philosophy (pragmatism) which is neither based on ontological nor epistemological
knowledge claims alone. Pragmatism advocates that the most important consideration
for deciding the appropriate knowledge claim for research should be the research
question(s) since some knowledge claims may be more suitable than others for
addressing different research questions or objectives. Moreover, the research questions
to be addressed within a single study may be such that require a heterogeneous
combination of different knowledge claims to be adequately addressed (Saunders et al.,
2009). Adding the pragmatist philosophical position, a comparison of four research
philosophies mostly used in management research is presented in Table 4.2 showing
their ontological, epistemological, axiological stance as well as data collection
techniques they most commonly use.
Table 4.2 Comparison of four branches of research philosophies (Saunders et al.,
2009)
Positivism Realism Interpretivism Pragmatism
Ontology: the
researcher’s
view of the
nature of
reality or being
External,
objective and
independent of
social actors
Is objective. Exists
independently of
human thoughts and
knowledge of their
existence (realist), but
is interpreted through
social conditioning
(critical realist)
Socially
constructed, may
change, multiple
External,
multiple, view
chosen to best
enable answering
of research
question
Epistemology:
the
researcher’s
view of what
constitutes
acceptable
knowledge
Only observable
phenomenon can
provide credible
data, facts. Focus
on causality and
law like
generalisations,
reducing
phenomena to
simplest elements
Observable
phenomena provide
credible data, facts.
Insufficient data
means inaccuracies in
sensations (direct
realism).
Alternatively,
phenomena create
sensations which are
open to
misinterpretation
(critical realism).
Focus on explaining
within a context or
contexts
Subjective
meanings on
social phenomena.
Focus upon the
details of
situation, a reality
behind these
details, subjective
meanings
motivating actions
Either or both
observable
phenomena and
subjective
meanings can
provide
acceptable
knowledge
dependent upon
the research
question. Focus
on practical
applied research,
integrating
different
perspectives to
help interpret the
data
Axiology: the Research is Research is value Research is value Values play a

97
Positivism Realism Interpretivism Pragmatism
researcher’s
view of the role
of values in
research
undertaken in a
value-free way,
the researcher is
independent of the
data and maintains
an objective
stance
laden; the researcher
is biased by world
views, cultural
experiences and
upbringing. These will
impact on the research
bound, the
researcher is part
of what is being
researched, cannot
be separated and
so will be
subjective
large role in
interpreting
results, the
researcher
adopting both
objective and
subjective points
of view
Data collection
techniques
most often used
Highly structured,
large samples,
measurement,
quantitative but
can use qualitative
Methods chosen must
fit the subject matter,
quantitative or
qualitative
Small samples, in-
depth
investigations,
qualitative
Mixed or
multiple methods
designs,
quantitative and
qualitative
4.2.2 Research Approaches
The research approaches that guide and direct the procedures in a research design
occupy the second layer of the research ‘onion’ (Fig 4.2). It is important for researchers
to after adopting research philosophy decide which research approach is suitable for
their research (Saunders et al., 2009). There are two research approaches; these include
inductive and deductive approaches the logics of which are shown in Table 4.3.
Inductive approach to research aims to establish a universal generalisation to be used as
pattern of explanations; by first accumulating data to produce generalisations which are
then used as patterns to explain further observations. Deductive approach to research on
the other hand, aims to test existing theories, to eliminate false ones and corroborate the
survivor; by identifying a regularity to be explained, constructing a theory and or
deducing hypotheses which are then tested by matching them with empirical data
(Blaikie, 2007). In other words, while the inductive approach is aimed at building
theory and is based mainly on the collection of qualitative data; the deductive approach
is aimed at testing theory and is based mainly on the collection of quantitative data.
Furthermore, inductive approach requires a prolonged period of data collection and
analysis as ideas emerged gradually; whereas, deductive approach takes shorter time
provided care is taken to adequately set up the study before going into data collection
and analysis (Saunders et al., 2009).

98
Table 4.3 The logics of Inductive and Deductive research approaches (Blaikie,
2007)
Inductive Deductive
Aim: To establish universal generalisation to
be used as pattern explanations
To test theories to eliminate false
ones and corroborate the survivor
Start: Accumulate observations or data
Produce generalisations
Identify a regularity to be explained
Construct a theory and deduce
hypotheses
Finish: Use these ‘laws’ as patterns to explain
further observations
Test the hypotheses by matching
them with data
Research approaches have elsewhere, been referred to as qualitative and quantitative
approaches instead of inductive and deductive approaches respectively; and mixed
method when both qualitative and quantitative approaches are used (Tashakkori and
Teddlie, 1998; Creswell, 2009; Walker, 2010; Creswell and Clark, 2011). Inductive
(qualitative) and deductive (quantitative) approaches to research each have their
weaknesses hence, it is possible to use a combination of these in a single research and
take advantage of their strengths thereby minimizing their weaknesses (Blaikie, 2007).
Some possible combinations (Figure 4.5) are discussed in section 4.2.4.
4.2.3 Research Strategies
There are seven different research strategies from which researchers can chose to use to
answer their research questions and meet their research objectives (see the third layer of
the research ‘onion’- Figure 4.2). These include: experiment; survey; case study; action
research; grounded theory; ethnography and archival research strategies (Saunders et
al., 2009). The choice of appropriate research strategies should be guided by the
research questions and aim, the extent of existing knowledge on the subject, the amount
of time and other resources available to the researcher, and the researcher’s
philosophical standpoint. It is also important to note that the use of these strategies is
not mutually exclusive and a suitably appropriate combination of two or more strategies
can be adopted for one research. The different research strategies outlined in the
research ‘onion’ are explained as follows.
a) Experiment
Experiment is a research strategy that is rooted in natural science laboratory-based
research but is occasionally used in social science research if found applicable.
99
Experimental researches aim to ascertain the influence of a specific treatment on the
behaviour of the study population or sample. This could be either based on random
or non-random sampling and simple or complex (Walker, 2010). Whereas simple
experiments consider whether there is a link between two or more variables, more
complex experiments consider the type of link between them and the relative
importance of two or more variables. Experiment research strategy can be used to
answer the ‘how’ and ‘why’ questions in exploratory and explanatory research
(Saunders et al., 2009).
b) Survey
The survey strategy is usually associated to the deductive approach to research and
is mostly used to answer the ‘who’, ‘what’, ‘where’, ‘how much’ and ‘how many’
research questions (Saunders et al., 2009). Survey researches quantitatively or
numerically describe the opinions, trends or attitudes of a population after studying
a sample of the population. Survey strategy allows the collection of data in a
representative sample in a highly economical way (Fellows and Liu, 2003). Data
collection in survey strategy can be by questionnaire, structured observation or
structured interviews (Newman, 2006; Saunders et al., 2009). All of these could
allow the collection of quantitative data which can be analysed using inferential and
descriptive statistics. It can be used to suggest possible relationships between
different variables as well as produce models of these relationships. It is important
to invest time in designing and piloting data collection instruments when using
survey research strategy to avoid the need to collect another set of data for lack of
the luxury of time (Saunders et al., 2009).
c) Case Study
In case studies research, the researcher set out to explore in depth, a particular
program, event, activity, process, project, or one or more individuals. Researchers
use different procedures to obtain detailed information about the case(s) over
sustained period of time (Creswell, 2009). Case study research strategy enables
researchers to answer the ‘why’, ‘what’ and ‘how’ questions in their research and is
most often employed in exploratory and explanatory research. Different data
collection techniques including interviews, observations, documentary analysis and
if necessary, questionnaires can be used in case study research. They could be used
either separately or in combinations to address research question(s) in a single

100
research (Saunders et al., 2009). There are two two-dimensional categories of case
studies, depending on either the number of cases or unit of analysis used. These
include single case or multiple cases; and holistic case or embedded case (Yin,
2003). A single case is selected to study a phenomenon when it represents a critical
case or alternatively an extreme or unique case. Additionally, a single case may be
used if it justifiably gives the researcher a unique opportunity to study a scarcely
considered phenomenon. Multiple cases is a case study strategy in which more than
one case studies are used in order to establish whether or not the findings from the
first case occur in the subsequent cases and consequently generalise the findings or
otherwise. If the researcher’s only concern is the organisation as a whole, the case
study strategy is referred to as a holistic case. Whereas, if the researcher, even
though, using a single organisation, examines a number of logical sub-units within
the organisation, then the strategy is referred to as an embedded case. Case study is
a very worthwhile strategy for exploring existing theory and can enable the
researcher to challenge existing theory if well-constructed (Saunders et al., 2009).
d) Action Research
Action research strategy begins with the aim of finding a tentative solution to an
already defined problem. It is distinct from other research strategies due to its
explicit focus on action aimed at promoting change within an organisation. Here, the
researcher is directly involved in the action and subsequent application of
knowledge gained. Furthermore, action research strategy draws strength from its
focus on change, recognition of the need to devote time for diagnosing, planning,
taking action, evaluating and involvement of employees (practitioners) throughout
the research process (Fellows and Liu, 2003; Saunders et al., 2009).
e) Grounded Theory
Grounded theory involves the collection of data across multiple stages and the
refinement and interrelationship of the different categories of information obtained.
The information so obtained is then used to derive a general abstract theory of the
process, action or interactions grounded in the views of the research participants
(Creswell, 2009). Grounded theory is concerned with in-depth systematic
investigation of phenomena with the aim of constructing a theory inductively (from
the ground). It follows a process of iterative data collection and analysis at multiple
stages during the research in order to gradually construct a theoretical understanding
of the data set (Vogt et al., 2012). Grounded research strategy starts to collect data

101
without building an initial theoretical framework to guide the process. The data so
generated from all stages of the research are then used to develop theories which are
then tested in further observations (Saunders et al., 2009). Collection of data in
grounded theory research can be done using any or a combination of interviews,
observations, documents, historical information, videotapes and any other sources of
information relevant to the research question(s).
f) Ethnography
Ethnography primarily involves the collection of data using interviews and
observations over a prolonged period of time within a social/cultural group in a
natural setting (Creswell, 2007). In ethnographic research, the researcher is
completely immersed in the social world being studied as much as possible in order
to enable extensive observation and description as well as explanation of the
phenomenon being studied (Saunders et al., 2009). The researcher being part of the
social world being studied enables the collection of all available data relating to the
research question(s) (Flick, 2006). Before using the ethnographic research strategy,
it is necessary for the researcher to first identify a suitable setting and secure the
trust of the participants as well as prepare to spend the much needed time for the
research questions to be adequately addressed (Saunders et al,. 2009).
g) Archival Research
Archival research strategy is that in which research questions that focus on the past
as well as changes over time are answered. Archival research strategy principally,
uses administrative records and documents as sources of data to address research
questions which may be exploratory, descriptive or explanatory in nature (Saunders
et al., 2009).
4.2.4 Research Choices
Research choices which occupies the fourth layer of the research ‘onion’, refers to how
researchers chose to combine the use of quantitative and qualitative data collection and
analysis techniques and tools in the same research. Researchers can choose to use a
single data collection technique and corresponding data analysis tool or use more than
one techniques and tools to collect and analyse data in addressing their research
problem(s) (Saunders et al., 2009). A comparison of single and mixed methods is
presented in Table 4.4, indicating how qualitative and quantitative methods converge
into mixed methods.

102
Table 4.4 Quantitative, Mixed and Qualitative methods (Creswell, 2009)
Quantitative methods Mixed methods Qualitative methods
Pre-determined
Instrument based
questions
Performance data,
observation data,
and census data
Statistical analysis
Statistical
interpretation
Both pre-
determined and
emerging methods
Both open- and
closed-ended
questions
Multiple forms of
data drawing on
all possibilities
Statistical and text
analysis
Across databases
interpretation
Emerging methods
Open-ended
questions
Interview data,
observation data,
document data and
audio-visual data
Text and image
analysis
Themes, pattern
interpretation
More detailed possible options of research choices are shown on Figure 4.5. The use of
a single technique is called mono method and the use of more than one technique is
called multiple methods. The multiple methods are further divided into multi-method
and mixed-methods. It is referred to as multi-method when researchers decide to use
more than one quantitative or alternatively, qualitative data collection and analysis
techniques and procedures restrictively (see Figure 4.5) in a single research design.
When both quantitative and qualitative techniques and procedures are used for data
collection and analysis, the research design choice made is referred to as mixed methods
approach. Mixed methods research choices are further subdivided into mixed-method
research and mixed-model research. Mixed method research is when quantitative and
qualitative data collection techniques and analysis tools are used either at the same time
(in parallel) or in turns (sequentially) (Tashakkori and Teddlie, 1998; Saunders et al.,
2009). Depending on what the research seeks to achieve, the researcher using mixed-
methods is able to switch between qualitative and quantitative methods or use both of
them at the same time do achieve different and or related aspects of the research
(Walker, 2010). On the other hand, mixed-model research is that in which,
combinations of quantitative and qualitative data collection techniques and analysis
tools are used such that; quantitative data can be converted to narratives and be analysed
qualitatively or qualitative data can be operationally converted to numerical codes and
be analysed statistically.
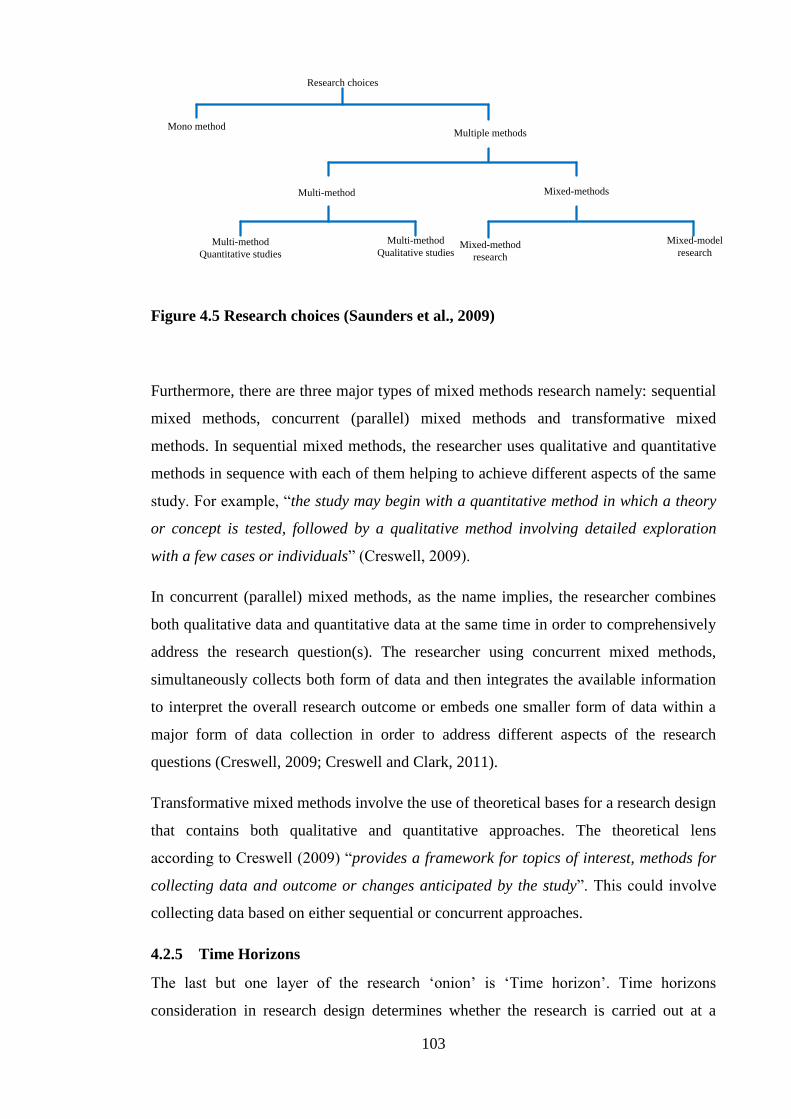
103
Research choices
Mono method
Multi-method Mixed-methods
Multiple methods
Multi-method
Quantitative studies
Multi-method
Qualitative studiesMixed-method
research
Mixed-model
research
Figure 4.5 Research choices (Saunders et al., 2009)
Furthermore, there are three major types of mixed methods research namely: sequential
mixed methods, concurrent (parallel) mixed methods and transformative mixed
methods. In sequential mixed methods, the researcher uses qualitative and quantitative
methods in sequence with each of them helping to achieve different aspects of the same
study. For example, “the study may begin with a quantitative method in which a theory
or concept is tested, followed by a qualitative method involving detailed exploration
with a few cases or individuals” (Creswell, 2009).
In concurrent (parallel) mixed methods, as the name implies, the researcher combines
both qualitative data and quantitative data at the same time in order to comprehensively
address the research question(s). The researcher using concurrent mixed methods,
simultaneously collects both form of data and then integrates the available information
to interpret the overall research outcome or embeds one smaller form of data within a
major form of data collection in order to address different aspects of the research
questions (Creswell, 2009; Creswell and Clark, 2011).
Transformative mixed methods involve the use of theoretical bases for a research design
that contains both qualitative and quantitative approaches. The theoretical lens
according to Creswell (2009) “provides a framework for topics of interest, methods for
collecting data and outcome or changes anticipated by the study”. This could involve
collecting data based on either sequential or concurrent approaches.
4.2.5 Time Horizons
The last but one layer of the research ‘onion’ is ‘Time horizon’. Time horizons
consideration in research design determines whether the research is carried out at a

104
particular time or over a given period of time. It always depends on the research
questions the researcher seeks to address and the amount of time available, regardless of
which research strategies are methods are chosen. Time horizon can be considered to be
either cross-sectional or longitudinal (Saunders et al., 2009). Cross-sectional time
horizon is said to be the case if the research is undertaken at a particular point in time
(i.e as a ‘snapshot’). On the other hand, longitudinal time horizon is said to be the case
if the research is carried out over a given period of time.
4.2.6 Data Collection and Data Analysis
Occupying the last layer but at the centre of the research ‘onion’ are the data collection
and data analysis considerations in research design. There are many techniques and
tools for collecting and analysing data respectively depending on the nature of questions
to be addressed in the research (Saunders et al., 2009; Cresswell, and Clark, 2011). Data
collection techniques include observation, questionnaires, interviews, experiments, etc
and the corresponding data analysis tools will depend on the type of data collected,
whether it is quantitative or qualitative. These are discussed in section 4.3.
4.3 Research Design (Methodology) Adopted
The current research is aimed at developing a framework for carrying out stakeholder
management in construction projects. In order to achieve this aim, six objectives
(presented in section 1.3 of chapter 1) constituting major stages were set out for the
study. The first is to review previous research on stakeholder management in
construction projects, in order to identify research gaps and define the focus of the
study. The outcome of the first stage gave rise to the need to review related topics such
as project success, procurement routes, project life cycle, and stakeholder collaboration
as part of the first stage before moving on to the second stage. The subsequent stages of
the study were based on the findings from the first stage. The second stage was to
investigate current practice of stakeholder management in construction projects
followed by the need to assess the effects of procurement routes and forms of contracts
on stakeholder management in construction projects. The fourth stage of the study was
to model the interrelationships among critical success factors for stakeholder
management in construction projects and relate them to project success. The fifth stage
was to develop a comprehensive framework for stakeholder management in
construction projects based on the outcome of the four preceding stages and the sixth
stage was to test the framework developed. The methods adopted to address the stages

105
of the study include literature review (for stage one), survey using questionnaire for
stages (two, three and four), process modelling was used for stage five and structured
interview and questionnaire for stage six. The research process is shown in Figure 4.6.
Review of previous work on stakeholder management
in construction projects
Review on:
Project success; procurement routes; project life cycle; and
stakeholder collaboration in construction projects
Research Methodology
Modelling the relationships among
CSFs for SM and linking to project
success in construction projects
Investigating effects of procurement
routes and forms of contract on SM in
construction
Survey of current practice of SM
in construction projects
Development of framework for stakeholder management in construction projects
Framework validation
Research Gaps and
Focus
Lit
erat
ure
Rev
iew
Dat
a C
oll
ecti
on a
nd A
nal
ysi
sF
ram
ework
Dev
elopm
ent
and V
alid
atio
n
Figure 4.6 The research process
4.3.1 Literature Review
The research process commenced with literature review on stakeholder management in
construction. Key among the outcome of the literature review include identification of
critical success factors for stakeholder management in construction projects, need to
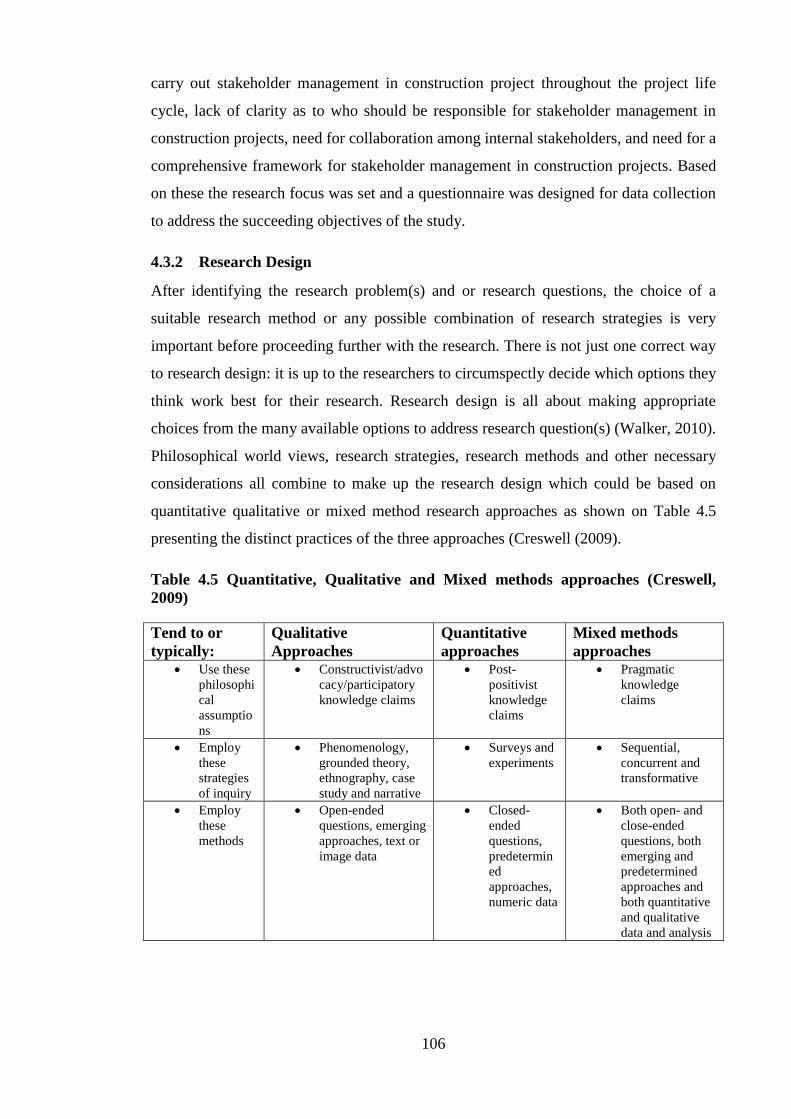
106
carry out stakeholder management in construction project throughout the project life
cycle, lack of clarity as to who should be responsible for stakeholder management in
construction projects, need for collaboration among internal stakeholders, and need for a
comprehensive framework for stakeholder management in construction projects. Based
on these the research focus was set and a questionnaire was designed for data collection
to address the succeeding objectives of the study.
4.3.2 Research Design
After identifying the research problem(s) and or research questions, the choice of a
suitable research method or any possible combination of research strategies is very
important before proceeding further with the research. There is not just one correct way
to research design: it is up to the researchers to circumspectly decide which options they
think work best for their research. Research design is all about making appropriate
choices from the many available options to address research question(s) (Walker, 2010).
Philosophical world views, research strategies, research methods and other necessary
considerations all combine to make up the research design which could be based on
quantitative qualitative or mixed method research approaches as shown on Table 4.5
presenting the distinct practices of the three approaches (Creswell (2009).
Table 4.5 Quantitative, Qualitative and Mixed methods approaches (Creswell,
2009)
Tend to or
typically:
Qualitative
Approaches
Quantitative
approaches
Mixed methods
approaches Use these
philosophi
cal
assumptio
ns
Constructivist/advo
cacy/participatory
knowledge claims
Post-
positivist
knowledge
claims
Pragmatic
knowledge
claims
Employ
these
strategies
of inquiry
Phenomenology,
grounded theory,
ethnography, case
study and narrative
Surveys and
experiments
Sequential,
concurrent and
transformative
Employ
these
methods
Open-ended
questions, emerging
approaches, text or
image data
Closed-
ended
questions,
predetermin
ed
approaches,
numeric data
Both open- and
close-ended
questions, both
emerging and
predetermined
approaches and
both quantitative
and qualitative
data and analysis

107
Tend to or
typically:
Qualitative
Approaches
Quantitative
approaches
Mixed methods
approaches Use these
practices
of
research
as the
researcher
Positions him- or
herself
Collects participant
meanings
Focuses on a single
concept or
phenomenon
Brings personal
values into the
study
Studies the context
or setting of
participants
Validates the
accuracy of
findings
Makes
interpretations of
the data
Creates an agenda
for change or
reform
Collaborates with
the participants
Tests or
verifies
theories or
explanations
Identifies
variables to
be studied
Relates
variables in
questions or
hypotheses
Uses
standards of
validity and
reliability
Observes
and
measures
information
numerically
Uses
unbiased
approaches
Employs
statistical
procedures
Collects both
qualitative and
quantitative data
Develops a
rationale for
mixing
Integrates the
data at different
stages of inquiry
Presents visual
pictures of the
procedures in the
study
Employs the
practices of both
qualitative and
quantitative
research
Based on the research design model (Figure 4.2) chosen to guide this research, the
research design components found suitable and adopted for this study are shown in
Figure 4.7.
PHILOSOPHY
APPROACHESSTRATEGY
TECNIQUES
AND
PROCEDURES
Data collection
and data analysis
SurveyDeductive
Inductive
Pragmatism
Cross sectional
CHOICES
Mixed
methods
TIME
HORIZON
Figure 4.7 Research design for this study

108
Research philosophy: The research philosophy adopted for this study is pragmatism. A
pragmatic approach which is based on actions, situations and consequences and allows
the use of both quantitative and qualitative assumptions as well as a combination of
both (mixed method) was adopted for this study (Creswell, 2009). The objectives of this
study required the use of both qualitative and quantitative data/information both of
which are explained by different knowledge claims as discussed in section 4.2.1 and
shown on Table 4.2. Objectives 1 and 6 were based on qualitative data whereas
objectives 2, 3 and 4 were based mainly on quantitative data.
Research Approach: Both qualitative and quantitative approaches are adopted to
address different aspects of this study. Quantitative approaches were used to model the
relationship between critical success factors for stakeholder management in construction
projects and to assess the effects of procurement routes on stakeholder management
process. Combinations of qualitative and quantitative approaches were used to
investigate the current practice of stakeholder management in construction projects and
to validate the framework developed for stakeholder management in construction
projects.
Research Strategies: The main research strategy is survey research strategy. Survey
strategy was chosen because it allows the collection of large amount of data within
constrained time and resources yet ensuring credible data are obtained (Saunders et al.,
2009). In the survey, the same questionnaire was used to collect mostly quantitative data
and a bit of qualitative data to address objectives 2 to 4 (see section 1.3) and structured
interviews was used to collect data for the purpose of validating the framework.
Research Choices: The qualitative and quantitative techniques were used in a
complementary manner in order to address all aspects of the study which would have
normally not been adequately addressed by either of the techniques if it was used alone
in the study. This was very necessary in this study because, while some of the objectives
can be addressed using qualitative techniques others can only be addressed through the
use of qualitative techniques of data collection (information retrieval). Several reasons
have been advanced for using mixed methods strategy in research, these include:
triangulating data sources to obtain convergence between qualitative and quantitative
methods, to integrate and or connect qualitative and quantitative data, to use the results
from qualitative data and quantitative data side by side to complement or reinforce each
other because one source may be insufficient, when there is need to generalise

109
exploratory findings, when there is need to explain initial results (Creswell, 2009;
Creswell and Clark, 2011). Literature review was used to address objective 1.
Questionnaire survey was used to obtain quantitative and qualitative data to address
objectives 2, 3 and 4. IDEF0 process (explained in Chapter 8) was used to address
objective 5. Questionnaire/interviews were used to address objective 6.
Time Horizons: Time horizons form an important consideration in the study due to time
limitations. The cross-sectional time horizon option guided the conduct of both the
quantitative and qualitative aspects of the study. The objectives of the research as
outlined in section 1.3 do not require a longitudinal study to be addressed since the
study was not designed to observe any change over a period of time.
Data Collection method: The main data collection technique was questionnaire survey
administered among experienced construction professionals practicing in the UK
construction industry. A questionnaire can easily be completely quantitative, completely
qualitative or a suitable combination of both quantitative and qualitative, because each
question in a questionnaire seeks to obtain one type of data or the other (Walker, 2010).
The questionnaire used in this study was designed predominantly to collect quantitative
data with ample opportunity provided for the respondents to make comments in order to
elicit any information that may have been missed by the questions and options provided.
Structured interviews/questionnaires were used to collect qualitative and quantitative
data to validate/evaluate the framework.
Questionnaire: The survey conducted to collect data for this study used a close ended
questionnaire with an opportunity provided for respondents to make comments freely. A
questionnaire survey (Appendix A) was designed under three sections covering the
research objectives to elicit responses from construction professionals within the United
Kingdom. The first section collected background information of the respondents; the
second section collected data on the critical success factors for stakeholder management
and the effect of procurement routes on stakeholder management process; and the third
section collected data on the current practice of stakeholder management in construction
projects. Professionals in architecture, construction management, quantity surveying,
engineering, facility management, etc with at least five years of relevant professional
experience were targeted to participate in the survey. The survey respondents were
asked to respond to the questions based on their most recently completed project. The
questionnaire also gathered background information of the respondents in order to

110
ensure that they have the required background and years of professional experience to
take part in this survey. A minimum of 5 years relevant professional experience was set
for sampling the respondents to ensure they have participated in some projects up to
completion so that they can have practical knowledge of stakeholder management
issues.
For the purpose of sampling, a minimum of 50 responses was required to achieve the
objectives of the current study (Iacobucci, 2010). Using an estimated response rate of
25% based on the average response rate obtainable in similar research in construction
management, the sample population for the current study was determined as follows:
[(50 × 100) ÷ 25] = 200 (Saunders, et al. 2009). The survey link was sent to 200
professionals practicing within the United Kingdom. After two reminders (at one
month’s interval each) a total of 74 responses were received representing 37% of the
total number of respondents to whom the link to the survey was emailed. Out of the 74
responses received, only 61 (30.5% of respondents contacted) were found suitable and
accepted for analysis; 13 were rejected for having less than 5 years of professional
experience in construction and/or for incomplete responses.
The following steps were taken in order to facilitate high response rate:
Including a cover/invitation letter in which details about the research and
researcher are provided encouraging participants to voluntarily complete the
questionnaire with the assurances of anonymity and confidentiality in collating
and handling their responses.
The questionnaire was divided into three relevant groups. The questions were
made closed very clear with all of them having options except the last question
where respondents were required to comment freely.
The observations from the pilot study carried out were taken into account before
the questionnaire was sent out to respondents. Reminders were sent out twice to
respondents.
Framework Development and validation/evaluation: The framework development was
based on the outcome of the survey data analysis. The results of the data analysis were
combined with important indications from literature review to form the components and
structure of the framework. The life cycle based framework for stakeholder
management in construction covers four stages including stakeholder management at
inception, design, construction and operation stages. More details on the methodologies

111
adopted for framework development and validation/evaluation are presented in chapters
8 and 9 respectively.
Data analyses: Regarding data analyses tools, different statistical techniques were used
to analyse data collected aimed at addressing different objectives. Structural equation
modelling (SEM) which was used to model the interrelationships among critical success
factors for stakeholder management and other corresponding data analysis tools are
discussed in section 4.4.
4.3.3 Validity and Reliability of Research Design
Validity is the extent to which a test measures what it set out to measure and reliability
is the extent to which a test can consistently measure something. The need for validity
applies to all stages of a research project including design, data collection and analysis.
The literature on research methods refers to four main tests of validity including
external validity, internal validity, construct validity and evidence-inference validity (or
reliability) (Saunders et al., 2009; Creswell and Clark, 2011; Vogt et al., 2012). These
tests are discussed below indicating the steps taken in this research to ascertain them.
External validity: External validity is concerned with the generalisability of the findings
of the research and is the main criterion for deciding the quality of the populations and
samples selected for the study (Saunders et al., 2009). In order to attain external validity
in the current research, the survey respondents were ensured to be very relevantly
experienced professionals practicing in the construction industry within the United
Kingdom-the study site (Iacubucci, 2009). Furthermore, the purpose of the research was
clearly stated in the invitation sent to respondents to participate in the survey.
Additionally, a minimum threshold was set for the number of responses required for
analysis.
Internal validity: Internal validity has to do with the extent to which the research design
and data collected are able to adequately address the research question(s). The test of
internal validity is applicable for explanatory and causal studies (Yin, 2003). Internal
validity was ensured through the extensive review of relevant theories leading to a
carefully drawn research design (presented in section 4.3.2). In designing the research, it
was ensured that appropriate choices were made of data collection instruments and
analysis techniques to adequately address the research objectives.

112
Construct validity: Construct validity is concerned with data coding which determines
the extent to which the operationalisation of the constructs and concepts in the data
collection instruments are true and appropriate for addressing the research question(s)
(Saunders et al., 2009). Two steps were taken to ensure construct validity in the current
research including pilot study of the questionnaire and validation of the results with
selected industry practitioners. The pilot study was undertaken after ensuring that all the
objectives of the research had questions aiming to address them. The aim of the pilot
study was to ensure that the questionnaire was unambiguous, intelligible, easy to
answer, as well as to ascertain the average time taken by respondents to complete the
questionnaire (Saunders et al., 2009).
Evidence-inference validity: Evidence-inference validity borders on the appropriateness
of the data analyses techniques used in the research and the extent to which they lead to
reliable interpretations of results obtained (Creswell and Clark, 2011). To attain
evidence-inference validity also known as reliability in the current research, the data
collection analysis techniques were carefully selected. Very importantly, to address the
objective of modelling the relationships between the CSFs for stakeholder management
in construction, structural equation modelling was used because of its advantages over
other multivariate data analysis tools as explained in section 4.4.
4.4 Data Analyses Techniques
Different data analyses techniques were employed to address the objectives of this study
including mean rating, Kruskal-Wallis test, Mann-Witney test, correlation and structural
equation modelling (SEM). These are explained in the following sub-sections:
4.4.1 Mean rating
Mean rating uses the numerical values assigned to factors or propositions to calculate
their mean scores by all the respondents of the survey. This statistical technique was
used to analyse respondents’ rating in different questions included in the questionnaire.
For example, mean rating was used to analyse respondents rating of the importance of
critical success factors for stakeholder management and procurement routes related
characteristics of stakeholder management process in construction (Pallant, 2007).
4.4.2 Kruskal-Wallis Test
The Kruskal-Wallis test is used to test for differences between the opinions of different
(more than two) independent groups within the data set. It converts scores to ranks and
113
the mean ranks for each group are compared (Pallant, 2007). The requirement for using
Kruskal-Wallis test is that, there must be different people in each of the groups. This
was used to explore differences across respondents with different years of professional
experiences, professional field of practice, those employed by different types of clients
and those using different forms of contracts within the data set.
4.4.3 Mann-Witney U Test
The Mann-Witney U test is useful for testing differences between two independent
groups only on a continuous measure. It is similar to the Kruskal-Wallis test except that
it cannot compare more than two independent groups (Pallant, 2007). It was used in this
study as a complementing analysis to explore differences between pairs of independent
groups where significant difference was found after using the Kruskal-Wallis test.
4.4.4 Correlation
Correlation analysis is used to examine the strength and sign of linear relationship
between two variables. There are different options available in SPSS depending on the
nature of data and level of measurement. The most commonly sued options include
Pearson product-moment correlation coefficient and Spearman correlation coefficient.
The Pearson product-moment correlation coefficient deals with intervals variables or a
combination of interval and dichotomous variables. While the Spearman correlation
coefficient deals with ordinal level or ranked data (Pallant, 2007). Since the data in this
study involved continuous variable on a Likert scale, the Pearson product-moment
correlation coefficient was used to examine the linear relationships between the
procurement routes related characteristics of stakeholder management in construction
projects.
4.4.5 Structural equation modelling (SEM)
4.4.5.1 Basic principles and Justification for using SEM
Different multivariate statistical methods are available for analysing relationships
among variables (dependent and independent) in research, popular among these include:
Regression analysis (simple and multiple regression analysis); Path analysis (PA);
factor analysis (FA); and Structural equation modelling (SEM). Each of these is
discussed in the following sub-sections.
Regression Analyses (RA): These are statistical tools used to address research problems
concerned with either single measure dependent variables or more than one independent

114
variable. The former is referred to as simple regression analysis (SRA) while the latter
is referred to as multiple regression analysis (MRA). The scope of the current research
however is not concerned with SRA. Therefore only MRA is of interest in this
discussion. Multiple regression analysis is a statistical technique used to analyse the
relationship between a single dependent variable and a set of independent variables.
There is an underlying assumption in MRA that the sample population from which the
data is collected and the resulting data are normally distributed. It also assumes that the
dependent and independent variables are directly observable hence are easy to measure
during data collection (Hair, et al., 1998). Although it is capable of simultaneously
analysing the relationships between the dependent variable and each of the independent
variables, the weakness of MRA is that it does not accommodate any linear
relationships (or multicolinearity) among the independent variables of the model and
does not account for measurement errors.
Path Analysis (PA): Path analysis involves the measurement of more than one
dependent variable simultaneously, which makes it more advanced than MRA in which
only one dependent variable is measured at a time. In path analysis, some variables can
be dependent on other observed variables and at the same time they are independent on
different other observed variables within the same model (Norman and Streiner, 2003).
It however, does not measure the interrelations among latent variables
(constructs/factors) and therefore, is not suitable for analysing research problems
involving interrelationships.
Factor Analysis (Exploratory) (FA): There are two types of factor analysis: Principal
component analysis (PCA) and common factor analysis (FA) both of which are used to
explore the relationships among many interrelated variables in order to reduce or group
them into smaller number of factor groupings (factors/constructs) and to explain the
variables in terms of their common underlying dimensions (factors/constructs) (Hair, et
al., 1998; Ozorhon et al., 2011). Furthermore, factor analysis is useful for determining
how measured variables are explained through a smaller number of factors which are
also referred to as latent variables or constructs. FA does not measure the relationships
among the smaller groups (i.e. latent variables or constructs) which may be of interest to
the researcher. The objective of factor analysis is to reduce the information originally
contained in a number of variables into smaller groups without significant loss of
information in an exploratory manner (Hair, et al., 1998). If a study requires a method
that can in addition to what factor analysis does, simultaneously assess the validity and

115
reliability of the relationships between the indicator (observed) and latent (unobserved)
variables and test the interrelationships among latent (unobserved) variables of the
model; FA will not be adequate.
Structural equation modelling (SEM): The use of structural equation modelling (SEM)
in research has expanded steadily over the past two decades in a wide range of
disciplines especially for researches in which most of the key concepts are not directly
observable (Westland, 2012). It is a multivariate method of analysis used in examining
interrelationships using operational data. It is capable of assessing the direct and indirect
effects and relationships among the variables of a model. The underlying premise for
SEM is that some very important variables to the researcher are not directly observable
(latent variables) therefore they need to be observed or measured through other factors
which can be measured operationally (Molenaar et al., 2000). Furthermore, SEM is a
statistical technique that simultaneously combines a measurement model (confirmatory
factor analysis) and structural model (regression or path analysis). The measurement
model (confirmatory factor analysis (CFA)) is used to test hypothesised relationships
between observed variables and their underlying latent variables (constructs or factors),
that is how well the indicators measure the latent variables; and the structural model is
used to test the interrelationships among the latent variables based on the researcher’s
knowledge of extant theory or empirical research in the subject area (Wong and
Cheung, 2005; Byrne, 2010). Although it is not within the scope of the current paper, it
should be noted that there are different software packages and approaches available for
SEM users and details on these can be found in (Yuan et al., 2010; Byrne, 2010; Kline,
2010; Westland, 2012).
Before discussing the features and process of SEM further, it is worthwhile to present
its comparative advantages over other multivariate analysis techniques (Hair et al.,
1998; Byrne, 2010) which include the following:
1. It adopts a confirmatory rather than exploratory approach to data analysis and
can still address aspects of the exploratory approach to data analysis. This is
achieved by requiring that the pattern of intervariable relationships be
hypothesised. Whereas most other multivariate methods are descriptive in their
approach making it difficult for them to be used for theoretical hypotheses
testing;

116
2. It provides explicit estimates of the error variance parameters especially of the
independent variables which the older and traditional multivariate methods are
not capable of doing;
3. It incorporates both observed and unobserved (latent) variables in data analysis
but the other traditional methods are based only on observed variables; and
4. It has the unique features for modelling multivariate relationships and for
estimating point as well as interval effects among variables in relationships
simultaneously.
Given these advantages, SEM has become an increasingly popular methodology for
non-experimental research and has been widely used by construction management
researchers (Molenaar et al., 2000; Mohamed, 2002; Islam and Faniran, 2005; Chinda
and Mohamed, 2008; Wong et al., 2008; Cho et al., 2009; Doloi, 2009; Doloi et al.,
2011; Doloi et al., 2012a); to investigate different issues (see section 3.2 for more).
To examine the groupings of the critical success factors for stakeholder management in
construction, confirmatory factor analysis (also known as the measurement component
of SEM) can be used. Whereas, to investigate the interrelationships among the CSFs
through their constructs; different forms of regression analysis can be used in a step by
step fashion. However, the hypothesised models in the current study require the
interrelationships to be explored simultaneously in a holistic manner so that errors of
measurement can be adequately taken into account. To achieve this objective structural
equation modelling (SEM) was considered most appropriate. SEM was chosen as the
data analysis method among the other multivariate statistical analysis methods due to its
ability for the simultaneous examination of relationships among a number of dependent
(Latent) and independent (observed) variables (Hair et al., 1998). Another reason for
choosing SEM was its ability to take into account the measurement errors inherent in
subjective operational measurement and to define and explain the entire set of
relationships in the hypothesised model (Byrne, 2010).
SEM like other multivariate statistical techniques involves the indicators (observed
variables) and latent variables (constructs or factors) with the indicators being the
variables through which the latent variables are measured. It should also be noted that
there are two types of latent variables possible in a SEM model; exogenous and
endogenous latent variables. The exogenous latent variables can also be referred to as
independent variables. They give rise to fluctuations in the values of other latent
variables and changes in them are not explained in the model because they are normally

117
not included in the model specification. Endogenous latent variables are influenced by
the exogenous latent variables either directly or indirectly. Changes in the values of
endogenous latent variables are explained in the model since all latent variables that
influence them are normally included in the model specification (Byrne, 2010).
The development of SEM usually goes through some stages (Hair et al., 1998) which
include:
1. Identify and define (operationally) the structural and measurement components
(which include latent variables, measured variables and any other variables)
based on theory. The measurement component of SEM deals with the
relationships between the latent variables and their indicators whereas, the
structural component deals with the relationships among the latent variables in
the model;
2. Set up a hypothetical model (model specification) which sometimes may involve
setting up more than one models (competing models) depending on the
theoretical bases and aim of the research;
3. Assess the validity of the structural model using data collected based on the
operationalised components (variables) of the model by evaluating model
estimates and goodness of fit; and
4. Identify potential model changes and modify the model with theoretical
justification.
It is vital during model specification, for researchers to ensure model identification. A
model is said to be identified if a unique solution for the values of the structural
parameters in the model can be found. This is an indication of whether or not the model
parameters can be estimated to enable testing the model through empirical evaluation.
There are three levels of identification possible for structural models specified in SEM:
Under-identified, just-identified and over-identified model (Byrne, 2010). The level of
identification is indicated by the “degrees of freedom” which is the result of subtracting
the number of parameters to be estimated from the total data points. An under-identified
model is that in which the number of parameters to be estimated is more than the
number of data points (variances and covariances of the observed variables) in the
model. This gives rise to negative degrees of freedom, indicating there is insufficient
information for evaluation in the model. A just-identified model is that in which the
number of parameters to be estimated equals the data points in the model. Therefore the
degrees of freedom for just identified models is zero, hence there is no chance for

118
rejection. An over-identified model is one in which the number of data points is in
excess of the number parameters to be estimated in the model. This obviously gives rise
to positive degrees of freedom which indicates the existence of a unique solution for the
structural parameters in the specified model, allowing the model to be either accepted or
rejected in the end (Byrne, 2010). Under-identified and just identified models are
usually considered to be of no statistical importance due mainly to their inability to give
rise to a unique set of solutions for the unknown parameters to enable the model to be
empirically evaluated.
By going through these stages, SEM uses its structural and measurement component
identified and defined during the first stage to determine and validate the
appropriateness of the hypothetical model(s) and show the optimum causal relationships
among the variables of the model. The appropriateness of SEM models referred to as
the model fit can be tested using various model fit indices; to these we now turn in the
next section.
4.4.5.2 Model fit indices in SEM
The results of structural equation modelling are required to be evaluated using model fit
indices. Three main categories of fit indices are used to determine model fit in SEM.
These are absolute fit indices, incremental fit indices and parsimony fit indices. These
are discussed in the following sub-sections.
Absolute Fit Indices: These are used to determine how pre specified models fit the
sample data on which the analysis is based and indicate which model has the best fit
where candidate models are specified. Absolute fit indices indicate how well the
hypothesised theory fits the data. This category of fit indices include chi-square (X2),
root mean square error of approximation (RMSEA), standardised root mean square error
of approximation (SRMSEA), goodness-of-fit statistics (GFI), adjusted goodness-of-fit
statistics (AGFI), root mean square residual (RMR), and standardised root mean square
residual (SRMR) (Hooper et al. 2008).
The chi-square (X2) measure for evaluating overall model fit is sensitive to sample size;
it indicates the amount of discrepancy between the sample and fitted covariance
matrices (Hu and Bentler, 1999). Low values of X2 relative to degrees of freedom with
an insignificant P-value (P>0.05) are considered acceptable. This is because it is a
statistical significance test and it always almost rejects the model when large samples
are used. Conversely, when small samples are used, the chi-square statistics may not
119
distinguish or discriminate between good fitting and poor fitting models (Kenny and
McCoach 2003). It should be noted that what constitute a large or small sample size is
still debatable. In order to address its sensitivity to sample size, relative X2 values are
used, these are the ratios of X2 to degrees of freedom (X2/df) in the model being
assessed. Opinions differ on the acceptable values for these ratios; for instance,
Tabachnik and Fidell (2007) recommend 2:1 and Kline (2005) recommend 3:1 whereas,
Wheaton et al. (1977) recommend 5:1 as acceptable thresholds for the relative chi-
square.
The goodness-of-fit (GFI) statistics is also affected by sample size. It ranges from 0 – 1
and increases with larger samples. The GFI has a downward bias when there are a large
number of degrees of freedom in the model (which is a function of the model
complexity) in comparison to sample size. Values greater than 0.95, are considered
acceptable as higher values indicate better fit. This can be adjusted based on the number
of parameters in the model to give rise to the adjusted goodness-of-fit index (AGFI) for
which values can fall outside the 0 – 1 range (Hooper et al. 2008).
The root mean square error of approximation (RMSEA) is also sensitive to the number
of estimated parameters in the model. It favours parsimony in that it will choose the
model with the lesser number of parameters as the best fitting model. The lower limit is
close to 0 while the upper limit is close to 0.07 and values less than 0.03 indicate
excellent fit (Steiger 2007).
The root mean square residual (RMR) and standardised root mean square residual
(SRMR) are affected by the scale of each indicator in the model such that varying or
inconsistent levels of scale makes their interpretation difficult. Good models have small
values of RMR and SRMR which is easier to interpret, is found to be lower in models
with high number of parameters as well as in models based on large sample size (Kline,
2005). Values of RMR and SRMR less than 0.08 are considered acceptable and values
closer to 0 represent excellent fits (Tabachnik and Fidell 2007).
Incremental Fit Indices: These are also known as comparative or relative fit indices.
They compare the chi-square statistics to a baseline model based on the null hypothesis
that all variables are uncorrelated. They include normal fit index (NFI), non-normed fit
index (NNFI) and comparative fit index (CFI). The NFI is sensitive to sample size such
that it underestimates fits for samples less than 200 (Kline 2005). The CFI which is the
revised version of NFI takes sample size into account. The CFI performs well even

120
when small sample sizes are used (Tabachnick and Fidell 2007). The range of values for
these is also 0 – 1 and values greater than 0.95 are considered excellent and acceptable
for all three of them except that for NNFI values can fall outside the range and it
favours parsimony. Furthermore, the NFI assess model fit relative to a baseline model
which assumes there is no covariance between the observed variables and has the
tendency to overestimate fit when sample size is small (Hooper et al. 2008).
Parsimony Fit Indices: These have been developed to overcome the situation in which
a less rigorous theoretical model produces better fit indices among candidate models.
These include the parsimony goodness-of-fit index (PGFI), parsimonious normal fit
index (PNFI), Akaike information criteria (AIC), consistent Akaike information criteria
(CAIC). The PGFI and PNFI are based on the GFI and NFI respectively. Both of them
adjust for degree of freedom and penalise for model complexity which results in lower
parsimonious fit indices values than other goodness of fit indices. Given the numerous
model fit indices in SEM, it is important for researchers to decide which appropriate fit
indices should be reported for their models, as it is not realistic to include every fit
index in the output (Hooper et al. 2008).
However, deciding which indices to report also depends on the options available to the
researcher in the analysis software program (Byrne, 2010) which can be restrictive in
some cases. The extant literature indicates that the most commonly and frequently
reported model fit indices are the CFI, GFI, NFI, NNFI, RMR, SRMR, RMSEA and
PNFI. It is not necessarily good practice to go by the popular fit indices therefore it was
ensured that fit indices that satisfy the required level of statistical sophistication in
assessing the models are reported in this study.
4.4.5.3 Sample size
Although larger samples sizes (from 100 to 400) are generally recommended for SEM
analyses, there is no consensus on the acceptable thresholds among researchers that
used SEM. Construction management researchers (for example; Doloi et al., 2012a;
Doloi, 2009; Erikson and Pesamaa, 2007; Ozorhon et al., 2007; Islam and Faniran,
2005, Mohammed, 2002) have used smaller samples than those recommended, giving
different reasons for doing so. Furthermore, if the model is not overly complex, its
constructs are well defined and supported by theory, and the data is collected from
reliable source; sample size of 50 can be enough for SEM analysis (Iacobucci, 2010). A
questionnaire survey (Section 4.3.2) was used to obtain data to empirically test the

121
conceptual model of the interrelations among CSFs for stakeholder management in
construction.
The 61 responses in the current study having been collected from well experienced
respondents with relevant professional backgrounds to whom the research objectives
were clearly explained are considered reliable. Furthermore, the spread across
construction professionals among the respondents, adds to the reliability of the data for
investigating critical success factors for stakeholder management in construction. Table
4.6 presents the respondents’ profiles in terms of their years of professional experience
and professional field of practice with all of them, having relevant experience of at least
5 years and over 78% of them having 10 years and above experience. Moreover, all the
targeted respondents are known to have worked on projects with multi parties and had
to collaborate or engage with all or most of the parties. Given the inherent difficulty to
collect questionnaire data in construction management research and coupled with the
characteristics sought in the targeted respondents which limit the number of eligible
respondents, 61 is a good sample size for this study.
Table 4.6 Respondents' profiles
Professional Field
Years of Professional Experience
From 6 to
10 years
From 11
to 15
years
From 16
to 20
years
From 21
years and
above
Total %Total
Architecture 5 4 1 2 12 19.67
Construction
Management 1 6 3 8 18 29.51
Quantity
Surveying 3 3 3 5 14 22.95
Engineering 3 3 1 3 10 16.39
Facility
Management 1 3 1 2 7 11.48
Total 13 19 9 20 61 100
%Total 21.31 31.15 14.75 32.79 100
4.5 Summary
This chapter has presented the general basic principles of research design discussing
how the specific research design for this study was drawn. The chapter covers a
comparison of four research design concepts and justified the research design adopted
for this study discussing its components. Moreover, the data collection and analyses
techniques have been discussed.

122
The next Chapter presents the first data analysis results aimed at addressing the second
objective of the study.

123
5. CHAPTER FIVE: CURRENT PRACTICE OF STAKEHOLDER
MANAGEMENT IN CONSTRUCTION PROJECTS
5.1 Introduction
The need to study the current practice of stakeholder management in construction
projects was identified from the literature review as one of the objectives of the study.
This chapter presents the analysis of survey results on the current practice of
stakeholder management in construction projects. Data obtained from the questionnaire
about stakeholder management decisions and responsibilities; change in stakeholder
interests/disposition towards the project; internal stakeholder collaboration; stakeholder
dynamics; techniques for stakeholder engagement/management; and general comments
of respondents were analysed and presented. Finally, the results were discussed and
conclusions drawn from these results are highlighted.
5.2 Stakeholder Management Decisions and responsibilities
This section presents the analysis results and findings on stakeholder management
decisions, change of stakeholders’ interests, internal stakeholder collaboration and
stakeholder management responsibility. These are presented in the following sub-
sections.
5.2.1 Stakeholder management decisions
In order to investigate the current practice of stakeholder management in the
construction industry; survey respondents were asked to respond to the questions in
section C of the questionnaire (see Appendix A) based on their experience on a recently
completed project in which they were involved. Asked whether stakeholder
management was carried out on the project; 23 representing 37.7% of the respondents
said they carried out stakeholder management and 38 representing 62.3% said they did
not carry out stakeholder management. Out of the 37% that said they carried out
stakeholder management, 91% said no funding was provided on the projects for
stakeholder management and 9% said funding was provided but did not say how much
or what percentage of the project sum was committed for carrying out stakeholder
management. Asked whether stakeholder management responsibility was assigned on
the project, 30% said yes and 70% (of those who said they carried out stakeholder

124
management) said no stakeholder management responsibility was assigned on the
project.
From the results presented in this section, it can be concluded that stakeholder
management is yet to be fully embraced by construction organisations as a deliberate
strategy in the management of construction projects in the UK. The challenge for
embracing stakeholder management can be said to be the inability of firm or client to set
aside some funds to support stakeholder management process. Furthermore, the results
revealed the need for firms to assign the responsibilities for stakeholder management to
specific professionals in addition to deciding to undertake stakeholder management in
construction projects.
5.2.2 Change of Stakeholders’ Interests/Disposition towards Projects
The respondents were asked to indicate whether or not they noticed any changes in
stakeholders’ interests/disposition towards the project. The result indicates that 45
representing 73.8% of the respondents said they noticed some changes in stakeholder
interests during the project whereas 16 representing 26.2% said they did not notice any
change in stakeholder interests. The respondents were also asked to indicate from a list
of causes identified from the literature of changes in stakeholder interests during the
project. This question was intended to find out the most likely causes of change in
stakeholder interests/disposition in projects. The frequency of selection of each of the
causes was used for analysing this question. A quick look at the numbers will indicate
that the total frequency is more than the number of respondents (61) in the survey; this
is because respondents had the opportunity to choose as many causes as applicable to
them. Their responses (see Figure 5.1) indicate that “acquisition of information
previously not available to them” is the most common reason why stakeholders’
interests changed followed by “gaining confidence and trust in the project”; “change in
project mission”; “perceived non-involvement”; “loss of confidence in the project”; and
“loss of confidence in the project team”, in decreasing order of popularity. From the
open option given to the respondents, other reasons for change in stakeholders’
interests/disposition towards the project provided by the respondents include media
influence and when stakeholders get to understand other stakeholder’s interests on the
project. Stakeholders getting to understand other stakeholders’ interests on the project

125
can be said to be the same as acquisition of information previously not available to
them.
Figure 5.1 Reasons for change in stakeholders' interests
Similarly, the respondents were asked to indicate from a list of means identified from
the literature through which they monitored or tracked changes in stakeholders’
interests/disposition towards the project and their answers are as shown in Figure 5.2
with “feedback mechanisms” being the most popular followed by “early warning sings”
and “checklist” with recorded frequencies of 32 (55.17%), 15 (25.86%) and 11
(18.97%) respectively. Furthermore, the option was given to the respondents in the
questionnaire to indicate other means of tracking change in stakeholders’
interests/disposition. Their answers indicate that the other means of tracking changes in
stakeholders’ interests/disposition towards the project is through reports during periodic
project meetings which some of them referred to as “feedback at meetings”, “feedback
gained at stakeholder meetings” and “informally during meetings”. Some of the
respondents reported that they did not monitor any change in stakeholder
interests/disposition towards the project at all but this is negligible as only two of the
respondents shared this experience.
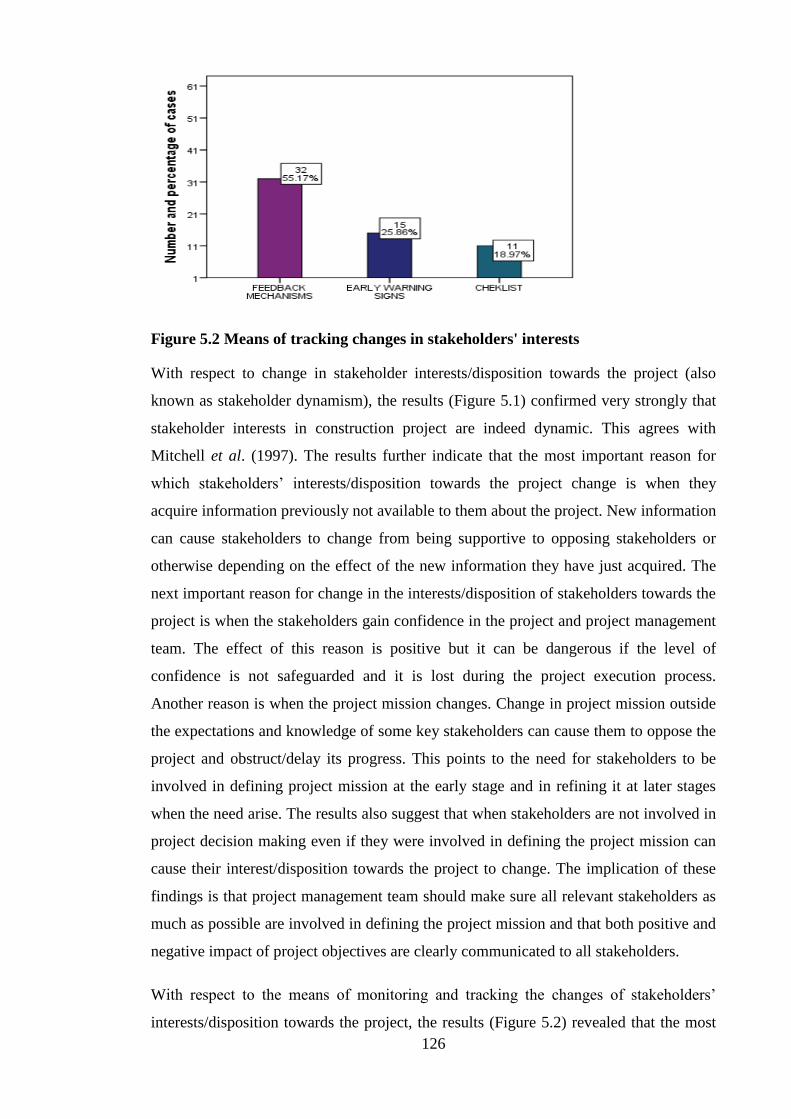
126
Figure 5.2 Means of tracking changes in stakeholders' interests
With respect to change in stakeholder interests/disposition towards the project (also
known as stakeholder dynamism), the results (Figure 5.1) confirmed very strongly that
stakeholder interests in construction project are indeed dynamic. This agrees with
Mitchell et al. (1997). The results further indicate that the most important reason for
which stakeholders’ interests/disposition towards the project change is when they
acquire information previously not available to them about the project. New information
can cause stakeholders to change from being supportive to opposing stakeholders or
otherwise depending on the effect of the new information they have just acquired. The
next important reason for change in the interests/disposition of stakeholders towards the
project is when the stakeholders gain confidence in the project and project management
team. The effect of this reason is positive but it can be dangerous if the level of
confidence is not safeguarded and it is lost during the project execution process.
Another reason is when the project mission changes. Change in project mission outside
the expectations and knowledge of some key stakeholders can cause them to oppose the
project and obstruct/delay its progress. This points to the need for stakeholders to be
involved in defining project mission at the early stage and in refining it at later stages
when the need arise. The results also suggest that when stakeholders are not involved in
project decision making even if they were involved in defining the project mission can
cause their interest/disposition towards the project to change. The implication of these
findings is that project management team should make sure all relevant stakeholders as
much as possible are involved in defining the project mission and that both positive and
negative impact of project objectives are clearly communicated to all stakeholders.
With respect to the means of monitoring and tracking the changes of stakeholders’
interests/disposition towards the project, the results (Figure 5.2) revealed that the most

127
popular and effective means of monitoring and tracking the changes in stakeholders’
interests/disposition towards the project is through “feedback mechanism” followed by
early “warning signs”. This means it is necessary for project management team to put in
place feedback mechanism and early warning signs when undertaking stakeholder
management in construction projects. Furthermore, attention should be paid to any
stakeholder issues that may come up during periodic project meetings. This would
enable the tracking of any changes missed by the change tracking mechanisms put in
place.
5.2.3 Stakeholder management collaboration
When asked whether there is a need for collaboration among internal stakeholders in
carrying out stakeholder management in construction projects, an overwhelming
acceptance was identified with 95.1% of the respondents agreeing to this. In order to
further address the need to know who should be involved in the stakeholder
collaboration at various stages of projects, a further question was asked. The
respondents were asked to indicate in a matrix the internal stakeholders they think
should be involved in stakeholder management collaboration at the various stages of
construction projects based on their experience with their most recently completed
projects. The result obtained from this is presented in Table 5.1. The result indicates the
frequency of choice for each of the internal stakeholders who should be involved in
internal stakeholder collaboration at the various stages in carrying out stakeholder
management in construction projects. Table 5.1 indicates that the client (CL) has the
highest frequency (59) of choice to be involved in internal stakeholder collaboration at
the inception stage (IS) followed by design organisation (DO) and quantity surveyor
(QS) with selection frequencies of 58 and 40 respectively. Main contractor has the least
selection frequency of 9. At the design stage (DS), quantity surveyor (QS) has the
highest frequency (53) of selection to be involved in internal stakeholder collaboration
followed by design organisation (DO) and project management organisation (PMO)
with 51 selection frequency each. The internal stakeholder with the least frequency of
selection for involvement in internal stakeholder collaboration at the design stage was
contract administrator (CA) with 25. For involvement in internal stakeholder
collaboration at the construction stage (CS), project management organisation (PMO),
quantity surveyor (QS), main contractor (MC) and the client (CL) each has selection
frequency of 51 being the highest followed by contract administrator (CA) with 50,
design organisation (DO) with 43 and lastly facility management organisation (FMO)
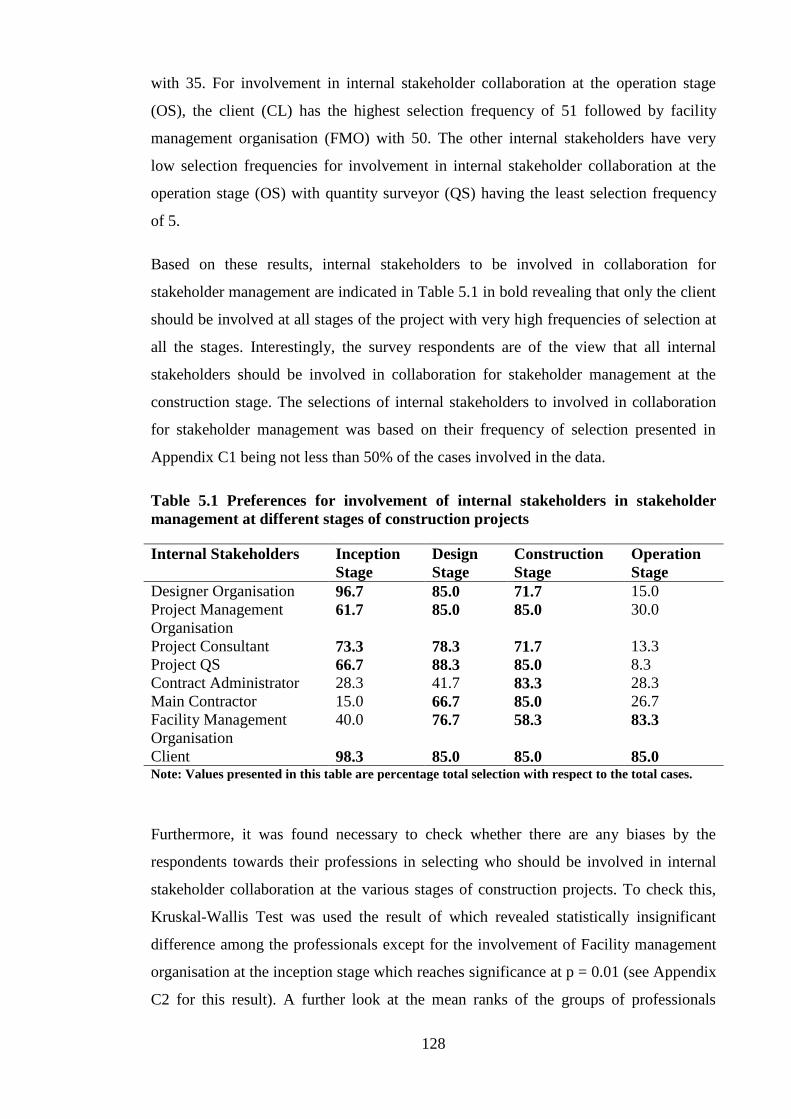
128
with 35. For involvement in internal stakeholder collaboration at the operation stage
(OS), the client (CL) has the highest selection frequency of 51 followed by facility
management organisation (FMO) with 50. The other internal stakeholders have very
low selection frequencies for involvement in internal stakeholder collaboration at the
operation stage (OS) with quantity surveyor (QS) having the least selection frequency
of 5.
Based on these results, internal stakeholders to be involved in collaboration for
stakeholder management are indicated in Table 5.1 in bold revealing that only the client
should be involved at all stages of the project with very high frequencies of selection at
all the stages. Interestingly, the survey respondents are of the view that all internal
stakeholders should be involved in collaboration for stakeholder management at the
construction stage. The selections of internal stakeholders to involved in collaboration
for stakeholder management was based on their frequency of selection presented in
Appendix C1 being not less than 50% of the cases involved in the data.
Table 5.1 Preferences for involvement of internal stakeholders in stakeholder
management at different stages of construction projects
Internal Stakeholders Inception
Stage
Design
Stage
Construction
Stage
Operation
Stage
Designer Organisation 96.7 85.0 71.7 15.0
Project Management
Organisation 61.7 85.0 85.0 30.0
Project Consultant 73.3 78.3 71.7 13.3
Project QS 66.7 88.3 85.0 8.3
Contract Administrator 28.3 41.7 83.3 28.3
Main Contractor 15.0 66.7 85.0 26.7
Facility Management
Organisation
40.0 76.7 58.3 83.3
Client 98.3 85.0 85.0 85.0 Note: Values presented in this table are percentage total selection with respect to the total cases.
Furthermore, it was found necessary to check whether there are any biases by the
respondents towards their professions in selecting who should be involved in internal
stakeholder collaboration at the various stages of construction projects. To check this,
Kruskal-Wallis Test was used the result of which revealed statistically insignificant
difference among the professionals except for the involvement of Facility management
organisation at the inception stage which reaches significance at p = 0.01 (see Appendix
C2 for this result). A further look at the mean ranks of the groups of professionals

129
revealed a lower selection of the involvement of facility management organisation at the
inception stage by the facility managers themselves. However, the facility managers
recorded a higher selection of involvement at the design through to operation stage.
Regarding whether or not there is need for collaboration among internal stakeholders in
carrying out stakeholder management in construction projects, it can be concluded
based on the results presented in this section that there is a strong need for internal
stakeholders to collaborate in undertaking stakeholder management in construction
projects. Since it is not possible for all stakeholders to be involved at all the stages, it
was also investigated which of eight internal stakeholders should be involved in
stakeholder collaboration at the various stages of construction projects. The findings
presented in Table 5.1 show that: the design organisation, project management
organisation, project consultant, quantity surveyor and the client should be involved at
the inception stage; all the internal stakeholders except the contract administrator should
be involved at the design stage; all the internal stakeholders should be involved at the
construction stage; and only the facility management organisation and client should be
involved in internal stakeholder collaboration at the operation stage. However, the
involvement of internal stakeholders will depend on among other things, the
procurement route being used for the project. For example if the traditional procurement
route is being used, it will not be possible to involve the main contractor at the inception
and design stages of the project. It is necessary to set out the process of transition from
one stage to the other by clearly indicating the link between successive stages.
5.2.4 Stakeholder management leadership/coordination
The questionnaire survey contained another question on who should lead/coordinate
stakeholder management process at the various stages of construction projects. The
respondents were asked who should instead of who is currently leading because not all
organisations have embraced stakeholder management in construction hence it was
decided to ask their preferences based on their experience (Chinyio and Olomolaiye,
2010). The respondents were asked to indicate in a matrix form which internal
stakeholders should be saddled with the responsibilities of leading stakeholder
management at the various stages of construction projects. The frequencies of their
responses are presented in Appendix C3. The result indicates the frequency of choice
for each of the internal stakeholders who should be responsible for leading/coordinating
stakeholder management at the various stages in construction projects. The results
indicates that the client (CL) has the highest frequency of selection to lead/coordinate

130
stakeholder management at the inception stage (IS) with 44, distantly followed by
project management organisation (PMO) with 17. Main contractor (MC) and facility
management organisation (FMO) both have no selection. For leading stakeholder
management at the design stage (DS), the design organisation (DO) has the highest
frequency of selection 38 followed by the project management organisation (PMO) with
20 and the client with 15. For leading stakeholder management at the construction stage
(CS), the project management organisation (PMO) has the highest selection frequency
of 48 distantly followed by the main contractor (MC) with 13. For leading stakeholder
management at the operation stage (OS), the facility management organisation has the
highest frequency of selection 39 followed by the client with 19.
From these results the suggested responsibilities for leading stakeholder management in
construction projects are indicated in Table 5.2 in bold showing the internal
stakeholders that have been selected down the columns as suitable for leading and
coordinating stakeholder management process at the respective stages across the rows.
The final decision was based on the internal stakeholders with the highest frequency of
selection by the respondents to lead/coordinate stakeholder management at the various
stages in construction projects.
Table 5.2 Preferences of who should lead stakeholder management at different
stages of construction projects
Internal Stakeholders
Inception
Stage
Design
Stage
Construction
Stage
Operation
Stage
Designer Organisation 18.3 63.3 5.0 5.0
Project Management
Organisation
28.3 33.3 80.0 18.3
Project Consultant 20.0 5.0 1.7 3.3
Project QS 6.7 1.7 3.3 3.3
Contract Administrator 3.3 6.7 15.0 6.7
Main Contractor 0.0 1.7 21.7 3.3
Facility Management
Organisation
0.0 0.0 0.0 65.0
Client 73.3 25.0 20.0 31.7 Note: Values presented in this table are percentage total selection with respect to the total cases.
Furthermore, it was found necessary to check whether there are any biases by the
respondents towards their professions in selecting who should lead the stakeholder
management process at the various stages of construction projects. To check this,
Kruskal-Wallis Test was used and the result revealed statistically insignificant

131
difference among the professionals in selecting who should lead stakeholder
management at the various stages of construction projects as none of them had a Sig P
values less than 0.05 (see Appendix C4 for the results). This indicates a strong
agreement in the opinions of respondents regarding who should lead the stakeholder
management process in the various stages of construction projects.
The results presented in Table 5.2 show that: the responsibility of leading and
coordinating stakeholder management at the inception stage rests with the client; the
design organisation should lead/coordinate stakeholder management at the design stage;
the project management organisation should lead/coordinate stakeholder management at
the construction stage; and facility management organisation should be responsible for
leading/coordinating stakeholder management at the operation stage. This means that
the client organisation would appoint a suitable representative to lead/coordinate
stakeholder management at the inception stage. In the case of an inexperienced
individual client they would need to employ the services of a suitable internal
stakeholder. Similarly, the design organisation would appoint a suitable member of staff
to lead/coordinate stakeholder management at the design stage as would the project and
facility management organisations at the construction and operation stages respectively.
The results also suggest that the client and facility management organisation are the
only internal stakeholders that can practically be available at the operation stage. Hence,
it can also be concluded that the client and facility management organisation would
need to relate with each other very closely for carrying out stakeholder management at
the operation stage. It should be noted that the suggestion of stakeholder management
leaders at the various stages based on these result (Table 5.2) is only a guide hence
adequate care should be taken to ensure that a suitably qualified member of the internal
stakeholders is assigned the role of leading/coordinating stakeholder management at the
respective stages of construction projects. The stakeholder management leader should
have a proven track record of carrying out the steps involved in the stakeholder
management process at the respective stages in addition to having a full understanding
of the entire process. Furthermore, the person should be given the authority and powers
to make stakeholder management related decisions and allocate resources for same. It
should be noted that previous research has suggested that the project manager or client
should be responsible for leading stakeholder management process (Olander and
Landing, 2008). But this will not apply in all project circumstances and stages
depending on the procurement route and other characteristics of the project.

132
5.3 Techniques for Stakeholder Engagement/Management
The analysis presented in this section was aimed at assessing the level of awareness and
effectiveness of various stakeholder engagement/management techniques by the
respondents. Six stakeholder management/engagement techniques were identified from
literature review and included in the questionnaire in which respondents were asked to
indicate their awareness of and rate the effectiveness of these techniques in stakeholder
engagement/management in construction projects. They were asked to rate on a five
point-Likert scale and the mean ratings of the techniques by the respondents were used
to analyse the levels of awareness and effectiveness of the techniques as shown in Table
5.5. The respondents were asked to rate the effectiveness of the techniques only if they
are aware of them. Hence their ratings represent both level of awareness and level of
effectiveness.
Table 5.5 indicates the respondents’ ratings and awareness of stakeholder engagement
techniques. The mean rating values reveal that “public hearing” with mean rating of
3.93 is the most effective technique for engaging construction project stakeholders. This
was closely followed by “design charrette” with mean rating of 3.90. Conversely,
“Contingent Valuation Method” with mean rating of 3.38 is the least effective technique
for engaging construction project stakeholders.
Table 5.3 Rating of stakeholder engagement/management techniques
Stakeholder Engagement Techniques Mean Rank
Public Hearing
Design Charrette
3.93
3.90
1
2
Strategic Needs Analysis 3.85 3
Delphi Technique 3.79 4
Stakeholder Cycle 3.46 5
Contingent Valuation Method 3.38 6
The results of analyses of the respondents’ awareness and rating of the effectiveness of
stakeholder management techniques suggest that “public hearing” and “design
charrette” are the most popular and effective stakeholder management/engagement
techniques. “Strategic needs analysis” and “Delphi technique” are also considered

133
effective. It can be concluded that the choice of which techniques to use would depend
on the prevailing circumstances and knowledge of the techniques by the project team. It
could also depend on their reason for engaging the stakeholders and the stage of project
at which the stakeholders are engaged.
5.4 Qualitative Responses (general comments) on Ways to Improve
Stakeholder Management in Construction Projects
In order to afford respondents the opportunity to fully express their views without
restricting them to the questions included in the survey, respondents were asked to make
free comments and suggestions of ways to improve the practice of stakeholder
management in construction projects. The aim of this question was to enable the
collection of any other information that may not have been captured in the questionnaire
and to facilitate deeper and more holistic understanding of the issues. 22 respondents
made comments and suggestions in response to this part of the survey. Their comments
revealed the following points/opinions:
1. Stakeholder management is not deliberately carried out in projects until there are
objections to planning permission; hence changes in stakeholders’ interests are
addressed as they arise.
2. Effective communication and collaborative environment are necessary
ingredients for stakeholder management process to succeed in construction
projects.
3. Avoid changes or keep them to the barest minimum as much as possible (engage
everyone early enough on the project including facility managers and eventual
insurers of the product.
4. Use appropriate procurement routes and contracts and ensure that project risks
and responsibilities are properly allocated to the parties involved. For example a
respondent wrote: “Use Design and Build contract with terms passing risk to
contractor awarded when the design is at circa 85% stage to ensure Client gets
the building he wants and Client budget is protected by the contractor signing
up to both design and construction risk, with Client keeping changes to an
absolute minimum.”
5. It is necessary to adopt a framework for stakeholder relationship at the outset of
projects.

134
6. Media influence should be given adequate attention throughout the project life
cycle.
7. Government policies could be made to encourage the practice of stakeholder
management in construction project.
Some of the points highlighted above corroborate the findings from the quantitative data
obtained from the closed questions included in the questionnaire. For example, point 1
agrees with the results presented in section 5.2.1 that 68% of the respondents said they
did not carry out stakeholder management in their projects. Point 2 agrees with the
results presented in section 5.2.2 where 95.1% of the respondents agreed that there is
the need for internal stakeholders to collaborate in carrying out stakeholder management
in construction projects. Furthermore, points 3 to 6 are in agreement with the critical
success factors identified from literature and presented in chapter 2. Interestingly, point
7 which highlights the need for government policies to encourage stakeholder
management in construction projects indicates the need for further research to
investigate this area. However, this point can be said to have shed more light to the
findings that stakeholder management is mostly an afterthought in construction projects.
The qualitative data also confirms the need for assignment of responsibility and
continuity of stakeholder management in construction projects. for example, a
respondent wrote:
“Involving stakeholders early enough is a good idea, however one should bear in mind
that this can slow things down. Also considering the dynamic nature of construction
projects (from inception to completion) this might be difficult, if not impossible in
certain instances. A one size fits all approach to dealing with this is not always feasible.
However the link of this to assigning tasks to these 'early involved stakeholder' is useful
and could move things faster, but the issue still remains as to who will be really needed
as the project progresses. The issue of involving stakeholders might take an oscillatory
form.” An interesting finding from the qualitative response is suggestion of the need for
a policy driven motivation for construction firms/organisations and client to make
stakeholder management a part of their strategies and agenda. Another interesting
finding from the qualitative data is the suggestion that risk allocation and stakeholder
management responsibility are related. The researcher would suggest this for further
research.
135
5.5 Chapter Summary
This chapter has presented the data analysis results of part of the survey that
investigated the current practice of stakeholder management practice in construction
projects in UK. The conclusions reached from the results discussed in the foregoing
section of the chapter, are summarised as follows:
Stakeholder management is yet to be fully embraced as a deliberate strategy in
the management of construction projects in the UK.
The main challenge for embracing stakeholder management can be said to be the
inability of firm or client to set aside some funds to support stakeholder
management process. Therefore, it is recommended that some financial
provisions should be made in agreement between the client and key project team.
Especially for stakeholder management related issues that may not be included in
the project bill.
There is need for firms to assign the responsibilities for leading stakeholder
management to specific professionals in addition to deciding to undertake
stakeholder management in construction projects. This should be done for each
of the main stages of construction project as well as for the overall process of
stakeholder management on the projects.
There is a strong need for internal stakeholders to collaborate in undertaking
stakeholder management in construction projects.
Construction professionals perceive dynamics in stakeholder position as
important and gaining new information is explanatory for that, but not loss of
confidence in the project team.
Public hearings and design charrettes are considered the most important
stakeholder engagement instruments.
There is need for a policy driven support for stakeholder management to be
carried out in construction projects.
Finally, the involvement of internal stakeholders in stakeholder management
collaboration and assignment of responsibilities for leading/coordinating stakeholder

136
management process at the various stages will be greatly influenced by the procurement
routes being used to execute the project. The next chapter presents the analysis of the
effects of procurement routes and form of contracts on stakeholder management
process.
137
6. CHAPTER SIX: EFFECTS OF PROCUREMENT ROUTES
RELATED CHARACTERISTICS OF STAKEHOLDER
MANAGEMENT AND CONTRACT FORMS ON
STAKEHOLDER MANAGEMENT PROCESS IN
CONSTRUCTION PROJECTS
6.1 Introduction
This chapter presents the effects of procurement routes alongside contract forms on
stakeholder management in construction projects. The need to investigate the effects of
procurement routes on stakeholder management process in construction projects was
identified during the literature review stage and is one of the objectives of this study.
Twelve procurement routes related characteristics of stakeholder management were
identified from literature review as shown in chapter 3 and included in the questionnaire
survey. Firstly, the extent to which procurement routes related characteristics of
stakeholder management can influence stakeholder management process in projects is
analysed and presented followed by relationships between client type and procurement
routes related characteristics, relationships between contract forms and procurement
route related characteristics and effects of forms of contracts on stakeholder
management in construction projects.
6.2 Investigating the effects of procurement routes related characteristics on
stakeholder management process
This section presents the results of the opinions of the respondents on the effects of
procurement routes related characteristics of stakeholder management in construction
projects. Survey respondents were asked to rate the effects of twelve procurement routes
related characteristics of stakeholder management process on a five point Likert scale
where 1 represent very negatively and 5 very positively. The data obtained from this
question was analysed using the mean rating of each of the characteristics to identify the
ones that influence stakeholder management positively or negatively the most. The
analysis results for respondents’ rating of the extent to which procurement routes related
characteristics of stakeholder management can influence stakeholder management
indicate a varying degree of agreement across the characteristics. Their mean ratings
presented in Table 6.1 range from 2.74 to 4.39 indicating varying degrees of positive
influence ratings for all the characteristics except PROCC5 (separation of design and

138
construction roles) that has the lowest mean rating of 2.74 which is below the
acceptable lower threshold of 3.5. Table 6.1 indicates that PROCC12 (Clear assignment
of responsibilities) influences stakeholder management more positively than the other
procurement routes related characteristics of stakeholder management process followed
by PROCC8 (Cooperation among the internal stakeholders), PROCC6 (clear lines of
control and communication), PROCC1 (Early involvement of contractor) and PROCC9
(External stakeholder identification/involvement) being the top five characteristics.
PROCC5 (Separation of design and construction roles) is the only characteristics rated
as affecting stakeholder management negatively. This result presented in Table 6.1
suggests the characteristics that should be sought in decreasing order of importance
when selecting procurement routes that favour stakeholder management in construction
projects.
Table 6.1 Mean rating and ranking of the effects of procurement routes related
characteristics on stakeholder management
Code Procurement Route Related Characteristics of SM Mean Rank
PROCC12
PROCC8
Clear assignment of responsibilities
Cooperation among the internal stakeholders
4.39
4.28
1
2
PROCC6
PROCC1
Clear lines of control and communication
Early involvement of contractor
4.20
4.11
3
4
PROCC9 External stakeholders identification/involvement 4.07 5
PROCC4 Integration of design and construction process 4.00 6
PROCC11 Opportunities to accommodate changes 3.97 7
PROCC7 Easy stakeholder identification 3.97 7
PROCC10 Opportunities for dispute avoidance/resolution 3.95 9
PROCC2 Contractor involvement in design 3.92 10
PROCC3 Single point of responsibility 3.66 11
PROCC5 Separation of design and construction roles 2.74 12
Notes: 1 = Very Negatively and 5 = Very Positively

139
Furthermore, it was found necessary to check whether the respondents’ professional
field of practice influenced their opinions. Kruskal-Wallis Test was used and the results
revealed statistically insignificant influence of professional field of practice for all the
procurement route related characteristics except for “cooperation among the internal
stakeholders” for which there is a significant difference at P = 0.047 (the result is shown
in Appendix C5). A further look at the mean ranks of the rating by different groups of
professionals revealed that facility managers rated the effect of “cooperation among the
internal stakeholders” highest and quantity surveyors rated it lowest with mean ranks of
38.00 and 22.54 respectively. This means that facility managers had the highest overall
ranking corresponding to the highest scale 5. However, this is not a problem as the Sig p
value is only slightly smaller than the threshold and Table 6.1 shows that cooperation
among internal stakeholders is rated second with a mean rating of 4.28. Furthermore,
facility managers are not the majority among the respondents and cannot have a
domineering opinion over others.
6.3 Correlation analysis of procurement routes related characteristics of
stakeholder management process
Correlation analysis was used to investigate the relationships between pairs of
procurement route related characteristics and the results obtained are shown in
(Appendix C6). The aim of this analysis was to investigate whether there are any
statistically significant correlations between the procurement routes related
characteristics of stakeholder management in construction projects. Preliminary
analyses were carried out to make sure there are no violations of the assumptions of
normality, linearity and homoscedasticity before performing the correlation analysis.
The result revealed 24 statistically significant correlations out of 144 possible
correlations as shown in Appendix C6. The statistically significant correlations are
indicated in Table 6.2 with a double headed arrow. The double headed arrow shows that
the procurement route related characteristics intersecting at the box in which the arrow
is indicated can be supported by the same procurement routes. Interestingly, PROCC5
“separation of design and construction roles” which recorded the least mean rating of
2.74 indicating it influences stakeholder management negatively does not correlate with
any other procurement route related characteristics of stakeholder management.

140
Table 6.2 Statistically significant correlation between procurement routes related
characteristics of stakeholder management
PR
OC
C1
PR
OC
C2
PR
OC
C3
PR
OC
C4
PR
OC
C5
PR
OC
C6
PR
OC
C7
PR
OC
C8
PR
OC
C9
PR
OC
C1
0
PR
OC
C1
1
PR
OC
C1
2
PROCC1
PROCC2
PROCC3
PROCC4
PROCC5
PROCC6
PROCC7
PROCC8
PROCC9
PROCC10
PROCC11
PROCC12
6.4 Investigating relationships between client type and procurement routes
related characteristics of stakeholder management
Kruskal-Wallis Test was used to investigate if there exist any differences among the
ratings of the procurement routes related characteristics of stakeholder management
process by respondents working for different clients (public, private and both public and
private). The result presented in Table 6.3 revealed that there is statistically insignificant
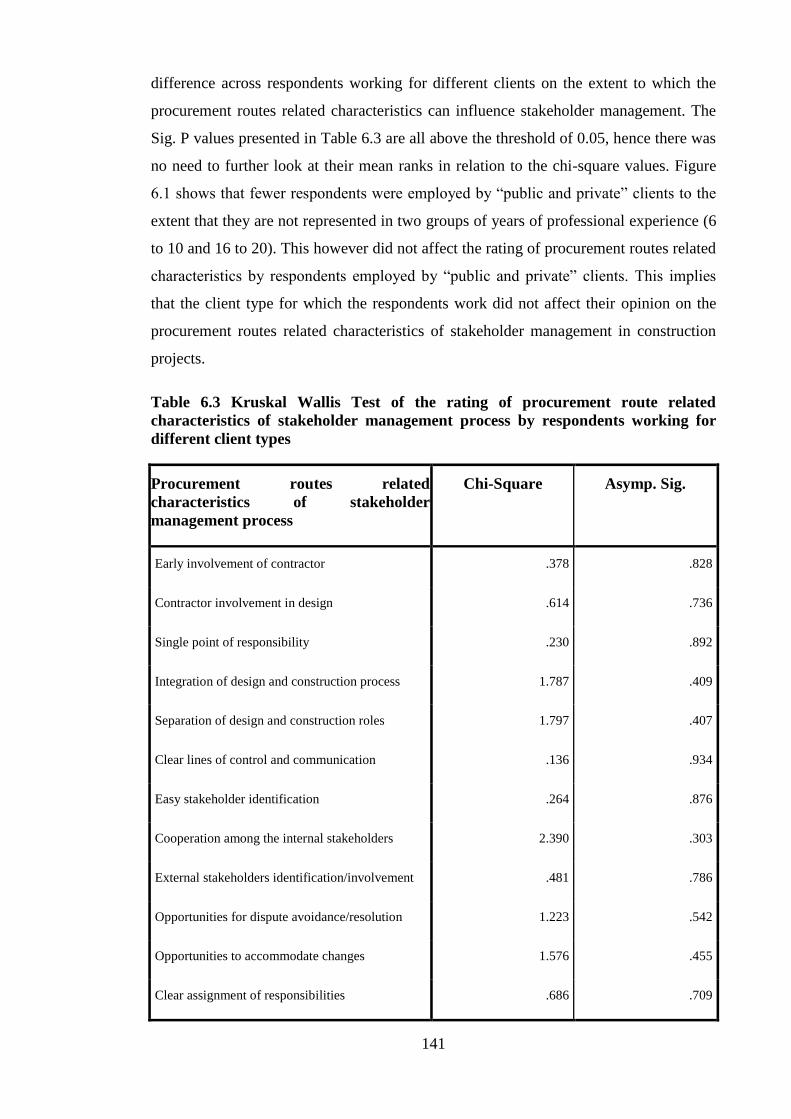
141
difference across respondents working for different clients on the extent to which the
procurement routes related characteristics can influence stakeholder management. The
Sig. P values presented in Table 6.3 are all above the threshold of 0.05, hence there was
no need to further look at their mean ranks in relation to the chi-square values. Figure
6.1 shows that fewer respondents were employed by “public and private” clients to the
extent that they are not represented in two groups of years of professional experience (6
to 10 and 16 to 20). This however did not affect the rating of procurement routes related
characteristics by respondents employed by “public and private” clients. This implies
that the client type for which the respondents work did not affect their opinion on the
procurement routes related characteristics of stakeholder management in construction
projects.
Table 6.3 Kruskal Wallis Test of the rating of procurement route related
characteristics of stakeholder management process by respondents working for
different client types
Procurement routes related
characteristics of stakeholder
management process
Chi-Square Asymp. Sig.
Early involvement of contractor .378 .828
Contractor involvement in design .614 .736
Single point of responsibility .230 .892
Integration of design and construction process 1.787 .409
Separation of design and construction roles 1.797 .407
Clear lines of control and communication .136 .934
Easy stakeholder identification .264 .876
Cooperation among the internal stakeholders 2.390 .303
External stakeholders identification/involvement .481 .786
Opportunities for dispute avoidance/resolution 1.223 .542
Opportunities to accommodate changes 1.576 .455
Clear assignment of responsibilities .686 .709

142
Figure 6.1 Mean rating of procurement routes related characteristics of
stakeholder management by respondents of different client types and years of
experience
6.5 Investigating relationships between years of experience and procurement
routes related characteristics of stakeholder management
Kruskal-Wallis Test was carried out to investigate the relationships between years of
professional experience and procurement routes related characteristics. The results
presented in Table 6.4 revealed statistically insignificant difference in the rating of the
procurement routes related characteristics by respondents with different years of
professional experience. The exception here is (Table 6.4) only “single point of
responsibility” which reaches significance at approximately 0.04 (which is very close to
the threshold of 0.05). This was investigated further by obtaining the median scores
presented in Table 6.5 for each group (years of professional experience) which revealed
that respondents with years of experience from 6 to 10 years recorded a median rating

143
of 3 compared to 4 recorded by all the respondents with older years of professional
experience. This implies that the years of professional experience of the respondents did
not significantly affect their opinion on the procurement routes related characteristics of
stakeholder management process. However, the result suggests that respondents with
more years of professional experience rated the procurement routes related
characteristics of stakeholder management process more positively than those with less
years of professional experience.
Table 6.4 Kruskal Wallis Test of the rating of procurement route related
characteristics of stakeholder management process by respondents with different
years of professional experience
Procurement routes related
characteristics of stakeholder
management process
Chi-Square Asymp. Sig.
Early involvement of contractor 1.574 .665
Contractor involvement in design 2.318 .509
Single point of responsibility 8.434 .038
Integration of design and construction process .582 .901
Separation of design and construction roles 2.019 .568
Clear lines of control and communication .614 .893
Easy stakeholder identification .820 .845
Cooperation among the internal stakeholders 2.041 .564
External stakeholders identification/involvement .536 .911
Opportunities for dispute avoidance/resolution 6.258 .100
Opportunities to accommodate changes 1.451 .694
Clear assignment of responsibilities .935 .817

144
Table 6.5 Median scores of procurement routes related characteristics of
stakeholder management process by respondents with different years of
professional experience
Procurement routes
related
characteristics of
stakeholder
management process
YEARS OF PROFESIONAL EXPERIENCE
From 6 to
10 years
From 11
to 15 years
From 16
to 20
years
From 21
years and
above
Total
N Median N Median N Median N Median N Median
Early involvement of
contractor 13 4.00 19 4.00 9 4.00 20 4.00 61 4.00
Contractor involvement in
design 13 4.00 19 4.00 9 4.00 20 4.00 61 4.00
Single point of
responsibility 13 3.00 19 4.00 9 4.00 20 4.00 61 4.00
Integration of design and
construction process 13 4.00 19 4.00 9 4.00 20 4.00 61 4.00
Separation of design and
construction roles 13 3.00 19 3.00 9 2.00 20 2.00 61 2.00
Clear lines of control and
communication 13 4.00 19 4.00 9 4.00 20 4.00 61 4.00
Easy stakeholder
identification 13 4.00 19 4.00 9 4.00 20 4.00 61 4.00
Cooperation among the
internal stakeholders 13 4.00 19 4.00 9 4.00 20 4.00 61 4.00
External stakeholders
identification/involvement 13 4.00 19 4.00 9 4.00 20 4.00 61 4.00
Opportunities for dispute
avoidance/resolution 13 4.00 19 4.00 9 4.00 20 4.00 61 4.00
Opportunities to
accommodate changes 13 4.00 19 4.00 9 4.00 20 4.00 61 4.00
Clear assignment of
responsibilities 13 5.00 19 4.00 9 4.00 20 5.00 61 4.00
N = Frequency of responses.

145
6.6 Assessing the effects of forms of contracts on stakeholder management
process
6.6.1 Forms of contract used by respondents
Before assessing the effects of forms of contract on stakeholder management process,
the respondents were asked to indicate the forms of contract they used for their most
recently completed projects based on which they have been urged to complete the
research survey. The results show that 86.9% of the respondents indicated using a
specific form of contract (JCT, NEC or Bespoke) whereas, 13.1% indicated using other
forms of contract. Among those who indicated using a specific form of contract;
52.46% used JCT, 27.87% used NEC and 6.56 used bespoke contracts as shown in
Figure 6.2. Other forms of contract used by the respondents presented in Table 6.6
include one each of: design and construct, frameworks, ICE, JCT with some
amendments, Negotiated/partnering, RTI, SBCC, and one said all of JCT, NEC and
Bespoke. It can be observed that about four of these could be considered as JCT while
the rest could be considered as some form of bespoke contracts which will not change
the statistics in Figure 6.2 significantly.
Figure 6.2 Forms of contracts used by respondents

146
Table 6.6 Other forms of contracts used by respondents
OTHER CONTRACT FORMS Frequency Percent
All the above 1 1.64
Design and construct 1 1.64
Frameworks 1 1.64
ICE 1 1.64
JCT with some amendments 1 1.64
negotiated/partnering 1 1.64
RT13 1 1.64
SBCC 1 1.64
Total 8 13.11
6.6.2 Effects of forms of contract on stakeholder management process in
construction projects
The respondents were asked in a further question to rate the extent to which they think
each of the three forms of contract included in the questionnaire might facilitate
stakeholder management based on their experience with their most recently completed
project. The result shown in Table 6.7 indicate that NEC form of contract facilitated
(influenced) stakeholder management more positively with mean rating of 3.95 than
JCT and Bespoke contracts with mean ratings 3.67 and 3.54 respectively. Further, their
mean ratings all indicated positive influences with the lowest being 3.54 (Bespoke
contract) which is just above the minimum threshold of acceptable rating 3.5. It can be
interestingly observed that the respondent considered NEC form of contract to have
facilitated stakeholder management more positively even though, a majority of them
(52.46) said they used JCT in their most recently completed projects. This could have
been so because of some industry based culture or policy which has a lot to do with
their years of professional experience and type of clients they work for.

147
Table 6.7 Mean rating of the extent to which forms of contracts facilitated
stakeholder management
Forms of Contracts Mean rating N Std. Deviation
JCT 3.67 61 .625
NEC 3.95 61 .825
BESPOKE CONTRACT 3.54 61 .765
Notes: 1 = Very Negatively and 5 = Very Positively
6.6.3 Investigating client type difference in the extent to which forms of contract
influence stakeholder management in construction projects
One-way between groups multivariate analysis was carried out to investigate client type
differences in the extent to which forms of contract influence stakeholder management
process in construction projects. It was necessary to perform preliminary tests to check
for normality, linearity, univariate and multivariate outliers, homogeneity of variance-
covariance matrices, and multicolinearity after which no serious violation was observed.
A value of 0.058 was obtained for Box’s M sig indicating that the data set did not
violate the assumption of homogeneity. If Box’s M sig value is greater than 0.001 then
the assumption of homogeneity of variance – covariance matrices has not been violated
(Tabachnich and Fidel, 2007; Pallant, 2007). Similarly, assumption of equality of
variance for all the variables were not violated except for NEC which has a significance
value of 0.014 which is less than the minimum threshold of 0.05 (Pallant, 2007).
However, based on Tabachnich and Fidell’s (2007) suggestion of setting a more
conservative alpha level of either 0.025 or 0.01 rather than the conventional 0.05; this
can also be said not to have violated equality of variance assumption for NEC
(considered in the multivariate F-test).
Table 6.8 indicates that there is no statistically significant difference among respondents
working for different clients on their rating of the influence of contract forms on
stakeholder management process based on the following results: F(6,110) = 1.23, P =
0.298; Wilk’s Lambda = 0.88; partial eta square = .063. There was no need to
investigate each of the variables further since no statistically significant difference was
found (as Wilk’s Lamda is greater than 0.05) among respondents working for different
clients and with different years of professional experience. Therefore it can be said that
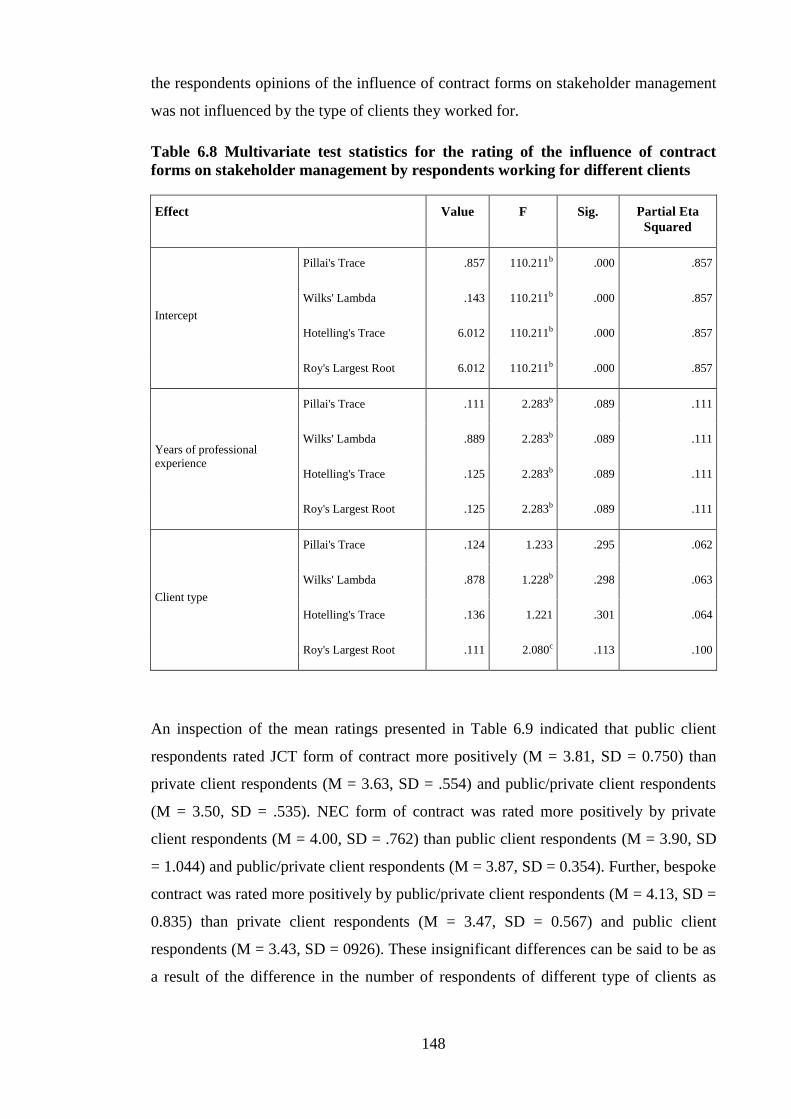
148
the respondents opinions of the influence of contract forms on stakeholder management
was not influenced by the type of clients they worked for.
Table 6.8 Multivariate test statistics for the rating of the influence of contract
forms on stakeholder management by respondents working for different clients
Effect Value F Sig. Partial Eta
Squared
Intercept
Pillai's Trace .857 110.211b .000 .857
Wilks' Lambda .143 110.211b .000 .857
Hotelling's Trace 6.012 110.211b .000 .857
Roy's Largest Root 6.012 110.211b .000 .857
Years of professional
experience
Pillai's Trace .111 2.283b .089 .111
Wilks' Lambda .889 2.283b .089 .111
Hotelling's Trace .125 2.283b .089 .111
Roy's Largest Root .125 2.283b .089 .111
Client type
Pillai's Trace .124 1.233 .295 .062
Wilks' Lambda .878 1.228b .298 .063
Hotelling's Trace .136 1.221 .301 .064
Roy's Largest Root .111 2.080c .113 .100
An inspection of the mean ratings presented in Table 6.9 indicated that public client
respondents rated JCT form of contract more positively (M = 3.81, SD = 0.750) than
private client respondents (M = 3.63, SD = .554) and public/private client respondents
(M = 3.50, SD = .535). NEC form of contract was rated more positively by private
client respondents (M = 4.00, SD = .762) than public client respondents (M = 3.90, SD
= 1.044) and public/private client respondents (M = 3.87, SD = 0.354). Further, bespoke
contract was rated more positively by public/private client respondents (M = 4.13, SD =
0.835) than private client respondents (M = 3.47, SD = 0.567) and public client
respondents (M = 3.43, SD = 0926). These insignificant differences can be said to be as
a result of the difference in the number of respondents of different type of clients as

149
respondents of “public and private” client with the smallest number of respondents
recorded the lowest mean rating except for bespoke contract.
Table 6.9 Mean rating of the influence of contract forms by respondents employed
by different client type
Contract form
Client type Mean Std. Deviation Number
of
response
JCT
Public 3.81 .750 21
Private 3.63 .554 32
Public and Private 3.50 .535 8
Total 3.67 .625 61
NEC
Public 3.90 1.044 21
Private 4.00 .762 32
Public and Private 3.87 .354 8
Total 3.95 .825 61
BESPOKE CONTRACT
Public 3.43 .926 21
Private 3.47 .567 32
Public and Private 4.13 .835 8
Total 3.54 .765 61
6.7 Investigating relationships between forms of contract and procurement
routes related characteristics of stakeholder management
Kruskals-Wallis Test was employed to investigate the effect of forms of contract on
procurement routes related characteristics of stakeholder management in construction
projects. The result revealed there is no statistically significant difference in the rating
of procurement routes related characteristics across respondents using different forms of
contracts (JCT, NEC and Bespoke contracts) except for the rating of “clear lines of
control and communication” for which there is statistically significant difference among

150
respondents using different forms of contract at 0.012 presented in Table 6.10.
Therefore, it was necessary to examine further, the mean ranks of the groups
(respondents using different forms of contract) for “clear lines of responsibilities and
communication” to see the extent of the difference. An inspection of the mean ranks for
the groups presented in Table 6.11 indicates that respondents using bespoke contract
reported the highest rating while those using NEC reported the lowest rating for “clear
lines of controls and communications”. This shows that respondents using bespoke
contracts rated “clear lines of controls and communication” higher (more positively)
than those using JCT and NEC. Furthermore, Mann-Whitney U test was carried out to
examine the size of difference between the rating of “clear lines of controls and
communications” by respondents using different forms of contract. The result revealed
the following using Cohen’s (1998) criteria that if r = 0.1 then the effect of the
difference is small; if r = 0.3 then the effect of the difference is medium; and if r = 0.5
then the effect of the difference is large:
A small insignificant difference between JCT and NEC (U = 198.5, z = -1.690, p
= 0.09, r = 0.24).
A large significant difference between NEC and bespoke (U = 6.00, z = -2.684,
p = 0.007, r = 0.58).
A medium significant difference between JCT and bespoke (U = 24, z = -2.217,
p = 0.027, r = .36).
The results of the Mann-Whitney U test presented above is an indication of the effect of
the difference between respondents using different forms of contract of “clear lines of
controls and communication”. It indicates that the difference between the opinion of
those using JCT and NEC; and those using JCT and bespoke are medium and the
difference between those using NEC and bespoke is large. The implication of this is that
the use of bespoke contract is more likely to enable clear lines of controls and
communication in the process of stakeholder management.
Furthermore, comparing the ratings of procurement routes related characteristics of
stakeholder management by respondents using different forms of contract with different
years of professional experience (Figure 6.3) revealed no significant difference in their
pattern of ratings across the years of experience. These are indications of strong
agreement in the opinions of the respondents on the influence of the procurement route
related characteristic of stakeholder management.

151
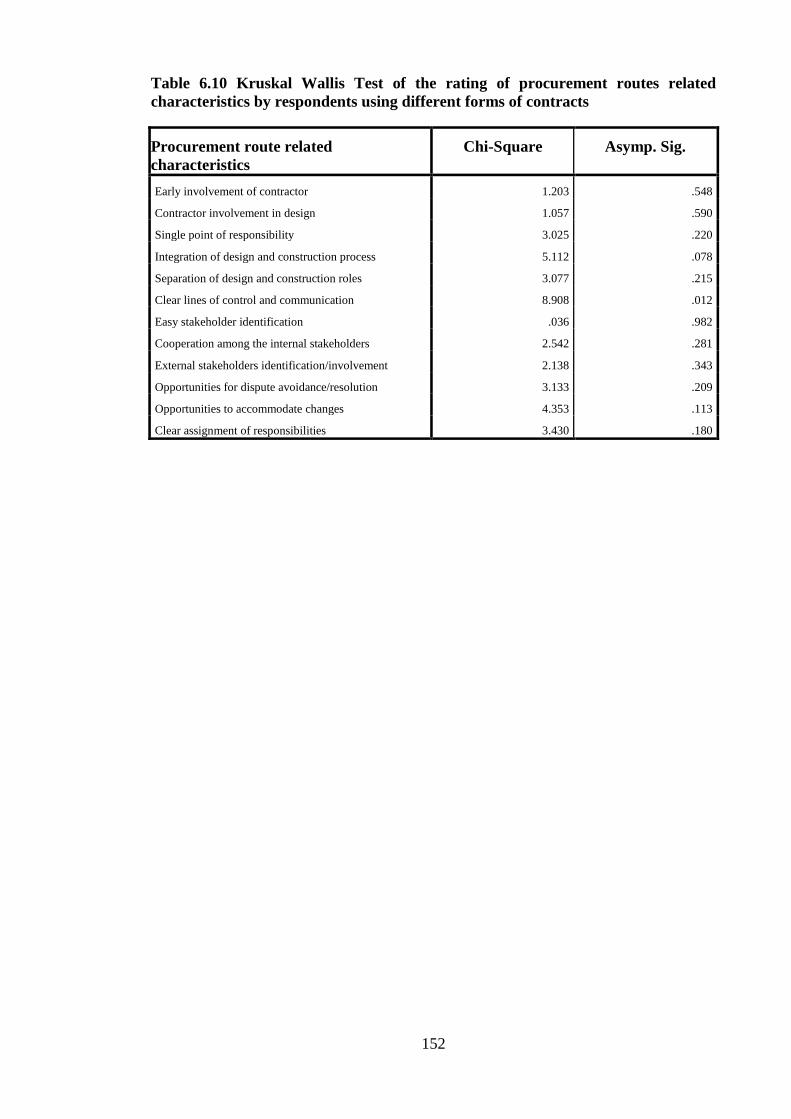
152
Table 6.10 Kruskal Wallis Test of the rating of procurement routes related
characteristics by respondents using different forms of contracts
Procurement route related
characteristics
Chi-Square Asymp. Sig.
Early involvement of contractor 1.203 .548
Contractor involvement in design 1.057 .590
Single point of responsibility 3.025 .220
Integration of design and construction process 5.112 .078
Separation of design and construction roles 3.077 .215
Clear lines of control and communication 8.908 .012
Easy stakeholder identification .036 .982
Cooperation among the internal stakeholders 2.542 .281
External stakeholders identification/involvement 2.138 .343
Opportunities for dispute avoidance/resolution 3.133 .209
Opportunities to accommodate changes 4.353 .113
Clear assignment of responsibilities 3.430 .180

153
Table 6.11 Mean ranks of the rating of procurement routes related characteristics
by respondents using different forms of contracts
Procurement route related
characteristics
Contract Forms Number of
response
Mean Rank
Early involvement of contractor
JCT 32 25.81
NEC 17 27.65
Bespoke 4 33.75
Total 53
Contractor involvement in design
JCT 32 27.47
NEC 17 24.79
Bespoke 4 32.63
Total 53
Single point of responsibility
JCT 32 24.80
NEC 17 28.71
Bespoke 4 37.38
Total 53
Integration of design and construction
process
JCT 32 27.61
NEC 17 22.68
Bespoke 4 40.50
Total 53
Separation of design and construction
roles
JCT 32 29.16
NEC 17 22.00
Bespoke 4 31.00
Total 53
Clear lines of control and
communication
JCT 32 28.05
NEC 17 21.03
Bespoke 4 44.00
Total 53
Easy stakeholder identification
JCT 32 27.30
NEC 17 26.53
Bespoke 4 26.63
Total 53
Cooperation among the internal
stakeholders
JCT 32 25.41
NEC 17 27.68
Bespoke 4 36.88
Total 53
External stakeholders
identification/involvement
JCT 32 27.98
NEC 17 27.09
Bespoke 4 18.75
Total 53
Opportunities for dispute
avoidance/resolution
JCT 32 29.50
NEC 17 22.24
Bespoke 4 27.25
Total 53
Opportunities to accommodate
changes
JCT 32 30.23
NEC 17 21.91
Bespoke 4 22.75
Total 53
Clear assignment of responsibilities
JCT 32 24.27
NEC 17 30.41
Bespoke 4 34.38
Total 53

154
Figure 6.3 Mean ratings of procurement routes related characteristics of
stakeholder management by respondents of different years of experience and
forms of contract
6.8 Discussion of Results
The results of investigating the effects of procurement route related characteristics of
stakeholder management in construction projects have been presented in the preceding
sections. The results indicate that all the procurement route related characteristics of
stakeholder management (Table 6.1) influence stakeholder management positively
except “separation of design and construction roles” which was found to have negative
influence on stakeholder management process. This connotes that if different
organisations are responsible for the design and construction of the projects it will have
a negative impact on stakeholder management. In such situations more, efforts and
resources will need to be committed towards stakeholder management than if one
organisation is responsible. Furthermore, the five most important characteristics to be
sought when selecting a procurement route that favours stakeholder management in
construction projects are Clear assignment of responsibilities; Cooperation among the
internal stakeholders; Clear lines of control and communication; Early involvement of

155
contractor; and External stakeholders’ identification/involvement. The results presented
in Table 6.1 indicate that all the procurement route related characteristics of stakeholder
management should be given adequate attention except the separation of design and
construction roles which is rated as having negative impact on stakeholder management.
Furthermore, the results also indicate that the JCT forms of contract is the most popular
among the respondents followed by the NEC forms and then bespoke contracts for
which there is a comparatively low rate of usage. But surprisingly, the results revealed
that the NEC forms facilitate stakeholder management more positively than the others
even though it was not the most popularly used.
The following implications can be inferred from the results of correlation analysis of the
procurement route related characteristics presented in section 6.3:
1. Procurement routes that allow “early involvement of contractor” will enable
“contractor involvement in design” and vice versa. This can be said to be
applicable to 2-stage selective tendering, negotiated contracts, design and build,
turnkey, develop and construct, management contracting and construction
management procurement routes as presented in chapter 3.
2. Procurement route that allow “early involvement of contractor” will enable
“integration of design and construction process” and vice versa. This can be said
to be applicable to cost-reimbursable, design and build, turnkey, develop and
construct, management contracting and construction management procurement
routes as presented in chapter 3.
3. Procurement route that allow “integration of design and construction process”
will enable “contractor involvement in design” and vice versa. This can be said
to be applicable to design and build, turnkey, develop and construct,
management contracting, construction management and design and manage
procurement routes as presented in chapter 3.
4. Procurement routes that allow for “external stakeholder
identification/involvement” will enable “easy stakeholder identification” and
vice versa. This is applicable to PPP/PFI and management contracting as
presented in chapter 3.
5. Procurement routes that allow “opportunities to accommodate changes” will
enable “opportunities for dispute avoidance/resolutions” and vice versa. This is
applicable to traditional method, management contracting, construction

156
management and design and manages as presented in chapter 3. However,
previous research warns that the traditional procurement route and management
contracting do not support contractor collaboration in the design process
(Rwelamila, 2010) hence they should not be used if internal stakeholder
collaboration is to be used. Furthermore, the design and manage option should
be used with caution due to its lack of guarantee of financial outcome which can
lead to claims and consequently conflicts between stakeholders.
The result presented in section 6.4 indicates that the type of client does not significantly
influence the effects of procurement routes related characteristics of stakeholder
management. Moreover, the result presented in section 6.5 revealed that years of
experience has some influence on the effects of procurement route related
characteristics of stakeholder management especially for single point of responsibility
which was rated lower by respondents with years of experience from 6 to 10. This
provides a strong evidence to conclude that the more experienced professional shave a
more positive view of the procurement route related characteristics. Furthermore, the
results presented in section 6.6 revealed that NEC is the most stakeholder management
friendly for of contract followed by JCT and then bespoke contract although all of them
have been found to have positive influence on stakeholder management. An interesting
finding is that bespoke contract despite having been rated the least stakeholder
management friendly contract form, is more likely to enable clear lines of controls and
communication than NEC and JCT.
Finally, there is strong evidence to conclude that choosing the appropriate procurement
route will enable the process of stakeholder management in construction projects
provided the responsible persons are well experience and knowledgeable enough and
the adopted contract form is followed.
6.9 Summary and Conclusions
This chapter has presented the results of data analyses carried out in order to investigate
the effects of procurement routes and forms of contract on stakeholder management in
construction projects. The summary of findings and conclusions from these analyses are
presented in this section.
Based on the findings presented in section 6.2 and the result of literature review
presented in chapter 3, a summary of the procurement routes related characteristics of

157
stakeholder management that should be sought in decreasing order of importance when
selecting procurement routes that favour stakeholder management in construction
projects is presented in Table 6.1 in which Clear assignment of responsibilities;
Cooperation among the internal stakeholders; and Clear lines of control and
communication are the three topmost characteristics to be sought. Conversely,
separation of design and construction roles is to be avoided as much as possible.
Other important findings are summarised as follows:
The type of client for the project will not affect stakeholder management process
provided the appropriate procurement route is selected and the form of contract
is followed.
The more experienced the professionals responsible for stakeholder management
are, the more effective it will be in terms of making appropriate stakeholder
management decisions in construction projects.
All forms of contract influence stakeholder management positively but the NEC
form of contract have the highest positive effect on stakeholder management
process in construction projects.
Among the procurement routes related characteristics of stakeholder
management, only “clear lines of controls and communication” is affected by the
form of contracts used. This suggests the need for the form of contract to support
the allocation of responsibilities and communication flow among the
stakeholders involved.
The top three procurement routes that mostly favour stakeholder management in
construction projects are Management Contracting, PPP/PFI and Design and
Build.
Lastly, procurement route and contract condition will serve as control in the process of
the life cycle based framework for stakeholder management in construction projects to
be presented in Chapter 8. The choice of procurement route for a project depends on the
project characteristics and issues at stake such as contractor collaboration in design,
internal stakeholder collaboration throughout the project, cost control, price guarantee
and quality level desired. Even if the appropriate procurement route that favours
stakeholder management is selected, it would be necessary for the project management
team to have full understanding of the critical success factors for stakeholder
management in construction projects. The next chapter presents the analyses of the

158
interrelationships among the critical success factors for stakeholder management in
construction projects.

159
7. CHAPTER SEVEN: MODELLING THE
INTERRELATIONSHIPS AMONG THE CRITICAL SUCCESS
FACTORS (CSFs) FOR STAKEHOLDER MANAGEMENT IN
CONSTRUCTION PROJECTS
7.1 Introduction
The literature review findings on stakeholder management in construction projects
revealed that the interrelationships among the critical success factors for stakeholder
management in construction projects are yet to be understood. The critical success
factors have been identified during the literature review and presented in chapter 2. This
chapter addresses the evaluation of the conceptual measurement and structural models
of the critical success factors for stakeholder management developed in chapter 3.
Structural equation modelling (SEM), which was explained in detail in Chapter 4, was
used to analyse the collected data to reveal these relationships. The Chapter first
presents the evaluation of the measurement model of the critical success factors before
presenting the evaluation of the structural model after which the discussion of results
and conclusions are presented.
7.2 Measurement Model of Critical Success Factors for Stakeholder
Management in Construction
In order to empirically investigate the interrelationships among the CSFs, it was
necessary to develop a conceptual measurement model, portrayed in Figure 7.1 first
presented in chapter 3 based on the extant literature. The conceptual measurement
model presented in Chapter 3, is a representation of the theoretical interrelationships
among the CSFs for stakeholder management in construction and their latent variables
(constructs) drawn from the extant literature. This section first presents the analysis
result of the measurement model also known as confirmatory factors analysis (CFA)
including preliminary analysis. Preliminary (consistency) analyses including mean
ratings of the CSFs, un-rotated principal component factor analysis and standardised
Cronbach’s alpha coefficient were performed using IBM SPSS 20. Finally, structural
equation modelling with IBM AMOS 20 software was used to test the hypothesised
measurement model of the interrelations among the CSFs and their latent variables.

160
Figure 7.1 Conceptual Measurement Model of CSFs for Stakeholder Management
in Construction
7.2.1 Preliminary analysis for consistency checks
It was necessary to carry out some consistency tests to make sure that there are no
issues of consistency associated with the data set as explained in section 7.2. The mean
ratings of the CSFs were obtained to check for acceptance of the CSFs by the
respondents; un-rotated principal component factor analysis was performed to check for
commonality within the data set; and standardised Cronbach’s alpha coefficient was
used to check for reliability of measurement within the data set. The results are
presented as follows:
Acceptance if critical success factors for stakeholder management in construction
projects:
The result of mean rating presented in Table 7.1 reveals high level of agreement that the
CSFs are important for stakeholder management in construction projects. The factor

161
with the highest rating by all respondents is “involving relevant project stakeholders at
the inception stage and whenever necessary to refine project mission” (SE1) with mean
rating of 4.43 and the factor with the lowest rating is “ensuring the use of flexible
project organisation” (SCPC4) with mean rating of 3.85.
Table 7.1 Mean rating and ranking of Critical Success Factors for Stakeholder
Management
Code Critical Success factors for Stakeholder Management Meana Rank
SE1 Involving relevant project stakeholders at the inception stage and whenever
necessary to refine project mission
4.43 1
SCPC5 Identifying and understanding stakeholders’ areas of interests in the project 4.33 2
SE4 Communicating with stakeholders properly and frequently 4.33 2
SD6 Managing how project decisions affect stakeholders 4.30 4
SD1 Resolving conflicts among stakeholders effectively 4.28 5
SE3 Keeping and promoting positive relationships among stakeholders 4.21 6
SCPC3
SCPC1
Carefully identifying and listing the project stakeholders from the on set
Clearly formulating the project mission
4.18
4.15
7
8
SCPC2 Ensuring the use of a favourable procurement route 4.13 9
SA6 Identifying and analysing possible conflicts and coalitions among stakeholders 4.11 10
SD7 Predicting stakeholders’ likely reactions for implementing project decisions 4.07 11
SE2 Formulating appropriate strategies to manage/engage different stakeholders 4.07 11
SA5 Predicting stakeholders’ potential influence on the project 4.03 13
SD3 Managing the change of stakeholders’ influence 4.03 13
SA1 Determining and assessing the attributes (Power, Urgency, Legitimacy and
proximity) of stakeholders in/to the project
4.03 15
SE5
SA2
Considering corporate social responsibilities (paying attention to Economic,
legal, environmental, and ethical issues)
Appropriately classifying stakeholders according to their attributes
4.03
4.03
15
15
SD4 Managing the change of relationship among stakeholders 4.02 18
SD2 Managing the change of stakeholders’ interests 4.00 19
SA3 Predicting and mapping stakeholders’ behaviours (Supportive, Opposition,
Neutral, etc)
3.95 20
SA4 Predicting stakeholders’ potential influence on each other 3.93 21
SD5 Managing change of stakeholders’ attributes 3.92 22
SCPC4 Ensuring the use of flexible project organisation 3.85 23
Notes: a: 1= Strongly Disagree and 5= Strongly Agree.
Commonality (common variance) check within the data set:

162
Un-rotated principal component factor analysis was used to check for commonality
within the data set. If the results of un-rotated principal component factor analysis
reveal the existence of only one factor, then it suggests that commonality is an issue
meaning the factors in the data set are likely to fall into the same group (Schriesheim,
1979). The result of un-rotated principal component analysis shows items loading on
more than one component which indicates the existence of more than one factor. In all
six factors were extracted accounting for 65.48% of the total variance in the data set
(Appendices C7a and C7b). These suggest that commonality is not an issue within the
data.
Reliability of measurement test results:
Cronbach’s alpha coefficient was used to test the reliability of measured variables
within the data set. Alpha values should be at least 0.70 with values closer to 1.0,
indicating better reliability (Nunnally and Bernstein, 1994; Hair et al., 2008).
Standardised Cronbach’s alpha coefficient of 0.907 was obtained for the measured
variables indicating high reliability. Having confirmed the acceptance of all the CSFs,
absence of commonality and reliability, the measurement model was then tested.
7.2.2 Evaluation of Measurement Model of Critical Success Factors for
Stakeholder Management in Construction Projects
IBM SPSS AMOS 20 software was used to empirically test the hypothetical
measurement model of critical success factors (CSFs) for stakeholder management in
construction. To achieve this, the measurement model component of structural equation
modelling (SEM) was used to investigate the appropriateness and strength of the
relationships between the observed and latent variables as well as to measure if there are
any, correlations/co-variances among the four latent variables.
Using confirmatory factor analysis (CFA) also known as “measurement model”, the
assessment of fit between the data collected and the theoretically conceptual model
(portrayed in Figure 7.1) of the relationships between observed and latent variables was
done. The latent variables in the hypothetical model include: stakeholder characteristics
and project characteristics (SCPC); stakeholder analysis (SA); stakeholder dynamics
(SD); and stakeholder engagement/empowerment (SE); and their indicators (measured
variables) are the CSFs presented in chapter 2.

163
SEM uses goodness-of-fit (GOF) indices shown in Table 7.2 from the output obtained
in AMOS in order to assess how well the hypothesised model fits the data set. The GOF
indices shown in Table 7.2 include the root mean square residual (RMR), comparative
fit index (CFI), incremental fit index (IFI), Tucker-Lewis index (TLI), goodness of fit
index (GFI), ratio of minimum discrepancy to the degrees of freedom (CMIN/DF) and
root mean square error of approximation (Anderson and Gerbing, 1984; Kline, 2004;
Iacobucci, 2010). The RMR computes the residual differences between the data set and
model prediction and take the square root of the result. It ranges from 0 – 1 with smaller
values indicating better fit. The CFI compares the fit of a baseline model to the data
with the fit of the hypothesised model to the same data. It also ranges from 0 – 1 but
with larger values indicating better fit. IFI is the ratio of the difference between the
discrepancy and degrees of freedom of the hypothesised model and that of the baseline
model. It also ranges from 0 – 1 with larger values showing better fit. The TLI
compares the discrepancy and degrees of freedom for the hypothesised model with
those of the baseline model. It also ranges from 0 – 1 with larger values indicating better
fit. The GFI is a test if the maximum likelihood estimate of the hypothesised model fit
to the data set. It also ranges from 0 – 1 and higher values indicate better fit. The
CMIN/DF adjusts the chi-square by computing the ration of the minimum discrepancy
to degrees of freedom. It ranges from 1- 2 with vales closer to 1 indicating closer fit.
Measurement model modification:
After analysing the hypothesised measurement model, the path coefficients as well as
the GOF revealed the need to refine/modify the measurement model. Three main
considerations are used to modify models in SEM (Kline, 2005): looking for and
eliminating paths with very low factor loadings; removing variables indicated by the
modification indices as having multi-co-linearity; and removing observed variables with
very high values in the standardised residual correlation matrix. Additionally, model
refinement/modification should lead to the selection of a fitting model which satisfies
not only the GOF measures but also falls within and satisfies the theoretical expectation
(Molenaar, et al., 2000; Byrne, 2010). After going through the refinement/modification
steps, seven observed variables were dropped from the hypothesised measurement
model for showing signs of multi-co-linearity and having high standardised residual
correlations above 0.4: three from SCPC (SCPC1, SCPC4, and SCPC5); three from SD
(SD1, SD6, and SD7) and one from SE (SE4). Furthermore, three observed variables
(SA1, SA2, and SE1) have been relocated to another construct and all the correlations

164
among the latent variables were retained (Table 7.3). For details about the full meanings
of observed variables refer to Table 7.1. The resultant best fitting measurement model is
portrayed in Figure 7.2 as further refinement/modification failed to improve the model
fit. The GOF indices for both the conceptual measurement model and the fitting
measurement model are presented in Table 7.2.
Table 7.2 Result of GOF measures for both Conceptual and best fitting
measurement models of the CSFs for stakeholder management in construction
Goodness-of-fit (GOF)
measures
Recommended level of
GOF measures
Conceptual
measurement
model
Best fitting
measurement
model
CMIN/DF 1 (very good) – 2
(threshold)
1.41 1.18
Root mean sq. Error of
approx. (RMSEA)
>0.05 (Very good) – 0.1
(threshold)
0.08 0.05
Root mean sq. Residual
(RMR)
0 – 1 (Smaller values =
better fit)
0.44 0.35
Goodness-of-fit index
(GFI)
0 (no fit) – 1 (perfect fit) 0.72 0.82
Comparative-fit index
(CFI)
0 (no fit) – 1 (perfect fit) 0.83 0.95
Incremental-fit index (IFI) 0 (no fit) – 1 (perfect fit) 0.84 0.95
Tucker-Lewis index (TLI) 0 (no fit) – 1 (perfect fit) 0.80 0.94

165
Figure 7.2 The Best Fit Measurement Model of CSFs for SM in Construction
Path coefficient of observed variables’ loading on latent variables:
The strength with which the observed variables measure the latent variables in the best
fit measurement model, is indicated by their standardised path coefficients (also known
as factor loading) which are shown in Table 7.3. The path coefficients of the influence
of the observed variables on the latent variables ranged from 0.54 to 0.89 (Table 7.3),
indicating that the retained observed variables significantly measure the latent variables.
Moreover, all the path coefficients are positive and statistically significant at level P <
0.05, therefore, they are supported. Values of factor loading equal to or greater than
0.40 with significant P value <0.05 indicate strong measurement with values closer to 1
indicating stronger measurement (Li et al., 2005; Akson and Hadikusumo, 2008). This
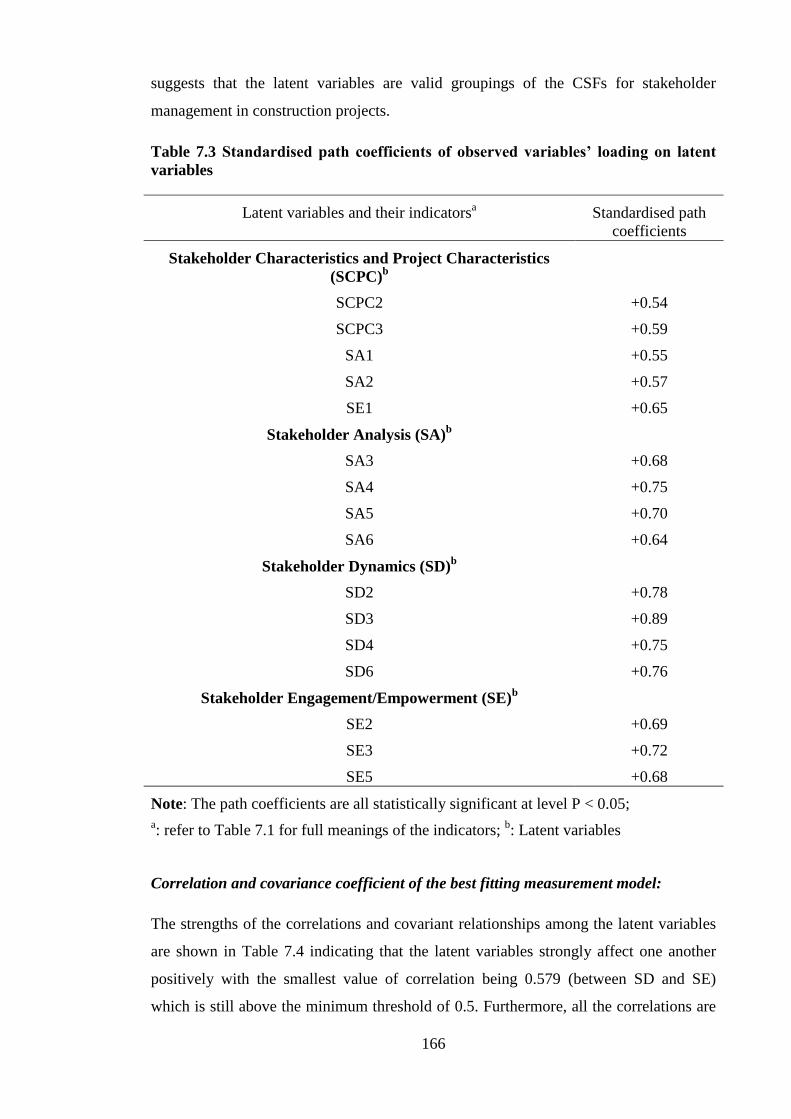
166
suggests that the latent variables are valid groupings of the CSFs for stakeholder
management in construction projects.
Table 7.3 Standardised path coefficients of observed variables’ loading on latent
variables
Latent variables and their indicatorsa Standardised path
coefficients
Stakeholder Characteristics and Project Characteristics
(SCPC)b
SCPC2 +0.54
SCPC3 +0.59
SA1 +0.55
SA2 +0.57
SE1 +0.65
Stakeholder Analysis (SA)b
SA3 +0.68
SA4 +0.75
SA5 +0.70
SA6 +0.64
Stakeholder Dynamics (SD)b
SD2 +0.78
SD3 +0.89
SD4 +0.75
SD6 +0.76
Stakeholder Engagement/Empowerment (SE)b
SE2 +0.69
SE3 +0.72
SE5 +0.68
Note: The path coefficients are all statistically significant at level P < 0.05;
a: refer to Table 7.1 for full meanings of the indicators;
b: Latent variables
Correlation and covariance coefficient of the best fitting measurement model:
The strengths of the correlations and covariant relationships among the latent variables
are shown in Table 7.4 indicating that the latent variables strongly affect one another
positively with the smallest value of correlation being 0.579 (between SD and SE)
which is still above the minimum threshold of 0.5. Furthermore, all the correlations are

167
statistically significant at level P < 0.05 and the covariance estimates are all below the
maximum threshold of 0.3. The standard errors (S.E.) do not present with any outliers
(i.e. any extremely large or small values) same as the critical ratios (C.R.). Therefore, all
the hypothesised correlations among the latent variables are supported and the specific
interrelationships among them can be investigated in a structural component of SEM.
Furthermore, the strong correlation estimates presented in Table 7.4 point to the
existence of some interrelationships direct or indirect among the constructs of CSFs for
stakeholder management in construction (SCPC, SA, SD and SE).
Table 7.4 Standardised correlation and covariance coefficients of the best fitting
measurement model of CSFs for stakeholder management in construction
Covariance
links
Correlation
Estimate
Covariance
Estimate S.E. C.R. Sig(P)
SCPC <--> SA +0.773 0.147 0.049 2.980 0.003
SCPC <--> SD +0.696 0.187 0.061 3.069 0.002
SCPC <--> SE +0.768 0.135 0.046 2.963 0.003
SA <--> SD +0.782 0.212 0.064 3.319 ***
SA <--> SE +0.730 0.130 0.044 2.963 0.003
SD <--> SE +0.579 0.145 0.051 2.835 0.005
Interestingly, the CSFs excluded from the measurement model have been strongly
accepted by the respondents based on their mean ratings presented in Table 7.1.
Therefore, they have been compared with and realigned into other factors that have been
retained in the final measurement model. The reason is to avoid losing too much of the
CSFs and care was taken to ensure that the final CSFs constituting the measured
variables (indicators) in the best fitting model are still consistent with the extant
theoretical postulations. This led to the merging of CSFs presented in Table 7.5 based
on which the final measurement and structural models were analysed.

168
Table 7.5 Realigned critical success factors for stakeholder management in
construction projects
Critical Success Factors for Stakeholder Management
Codea Old name New name
SE1 +
SCPC1
Involving relevant project stakeholders at
the inception stage and whenever
necessary to refine project mission
Involving relevant project stakeholders at the
inception stage and whenever necessary to
formulate and refine project mission
SE3 Keeping and promoting positive
relationships among stakeholders
None
SCPC3 +
SCPC5
Carefully identifying and listing the
project stakeholders from the on set
Carefully identifying and listing the project
stakeholders and their areas of interests from
the on set
SCPC2 +
SCPC4
Ensuring the use of a favourable
procurement route
Ensuring the use of a favourable procurement
route and flexible project organisation
SA6 +
SD1
Identifying and analysing possible
conflicts and coalitions among
stakeholders
Identifying, analysing and resolving possible
conflicts and coalitions among stakeholders
SE2 +
SE4
Formulating appropriate strategies to
manage/engage different stakeholders
Formulating appropriate communication
strategies to manage/engage different
stakeholders
SA5 Predicting stakeholders’ potential
influence on the project
None
SD3 Managing the change of stakeholders’
influence
None
SA1
Determining and assessing the attributes
(Power, Urgency, Legitimacy and
proximity) of stakeholders in/to the project
None
SE5
Considering corporate social
responsibilities (paying attention to
Economic, legal, environmental, and
ethical issues)
None
SA2 Appropriately classifying stakeholders
according to their attributes
None
SD4 +
SD6
Managing the change of relationship
among stakeholders
Managing the change of relationship among
stakeholders and how project decisions affect
them
SD2 Managing the change of stakeholders’
interests
None
SA3 +
SD7
Predicting and mapping stakeholders’
behaviours (Supportive, Opposition,
Neutral, etc)
Predicting and mapping stakeholders’
behaviours (Supportive, Opposition, Neutral,
etc) and reactions for implementing project
decisions
SA4 Predicting stakeholders’ potential
influence on each other
None
SD5 Managing change of stakeholders’
attributes
None
Note: a: affected CSFs are presented in bold in the first column
7.3 Evaluation of the Structural Model of Critical Success Factors for
Stakeholder Management in Construction Projects and Hypothesis Testing
Based on the outcome of an extensive literature review on stakeholder management in
construction projects presented in chapter 2 and project success presented in chapter 3,

169
it was hypothesised that adequately obtaining information on stakeholder characteristics
and project characteristics (SCPC); carrying out informed stakeholder analysis (SA);
understanding stakeholder dynamics (SD); and effective stakeholder
engagement/empowerment (SE) affect the impact of stakeholder management on
construction projects success. These have been discussed in Chapter three. In line with
these, the following specific hypotheses have been stated (portrayed in Figure 7.3) to
further investigate the relationships among the critical success factors for stakeholder
management in construction:
Hypothesis 1: Obtaining adequate information on stakeholder characteristics and project
characteristics (SCPC) influences the impact of stakeholder management on
construction project success (PS).
Hypothesis 2: Obtaining adequate information on stakeholder characteristics and project
characteristics (SCPC) enables stakeholder analysis (SA).
Hypothesis 3: Obtaining adequate information on stakeholder characteristics and project
characteristics (SCPC) enables the understanding of stakeholder dynamism (SD).
Hypothesis 4: Stakeholder analysis (SA) influences the overall impact of stakeholder
management on construction project success (PS).
Hypothesis 5: Stakeholder analysis (SA) enables effective stakeholder
engagement/empowerment (SE).
Hypothesis 6: Understanding stakeholder dynamism (SD) influences the overall impact
of stakeholder management on construction project success (PS).
Hypothesis 7: Stakeholder analysis (SA) enables the understanding of stakeholder
dynamism (SD).
Hypothesis 8: Understanding stakeholder dynamism (SD) enables effective stakeholder
engagement/empowerment (SE).
Hypothesis 9: Effective stakeholder engagement/empowerment (SE) influences the
impact of stakeholder management on construction project success (PS).
Hypothesis 10: Obtaining adequate information on stakeholder characteristics and
project characteristics (SCPC) enables effective stakeholder engagement/empowerment
(SE).
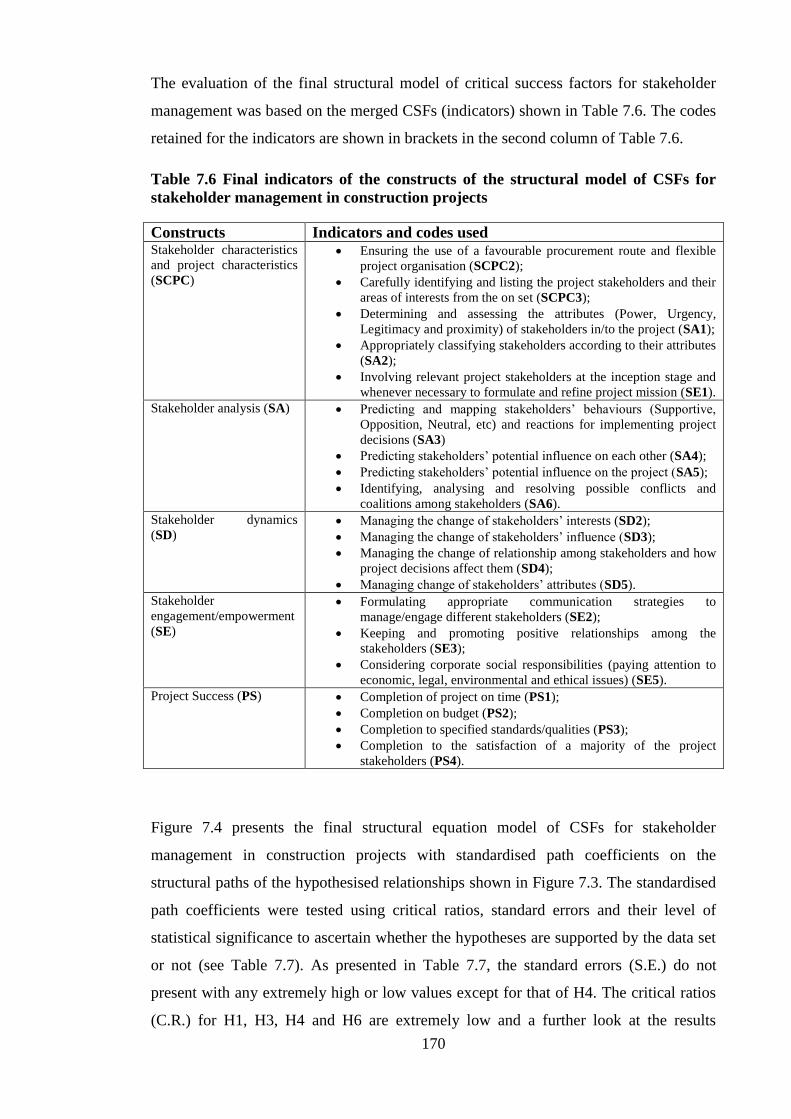
170
The evaluation of the final structural model of critical success factors for stakeholder
management was based on the merged CSFs (indicators) shown in Table 7.6. The codes
retained for the indicators are shown in brackets in the second column of Table 7.6.
Table 7.6 Final indicators of the constructs of the structural model of CSFs for
stakeholder management in construction projects
Constructs Indicators and codes used Stakeholder characteristics
and project characteristics
(SCPC)
Ensuring the use of a favourable procurement route and flexible
project organisation (SCPC2);
Carefully identifying and listing the project stakeholders and their
areas of interests from the on set (SCPC3);
Determining and assessing the attributes (Power, Urgency,
Legitimacy and proximity) of stakeholders in/to the project (SA1);
Appropriately classifying stakeholders according to their attributes
(SA2);
Involving relevant project stakeholders at the inception stage and
whenever necessary to formulate and refine project mission (SE1).
Stakeholder analysis (SA) Predicting and mapping stakeholders’ behaviours (Supportive,
Opposition, Neutral, etc) and reactions for implementing project
decisions (SA3)
Predicting stakeholders’ potential influence on each other (SA4);
Predicting stakeholders’ potential influence on the project (SA5);
Identifying, analysing and resolving possible conflicts and
coalitions among stakeholders (SA6).
Stakeholder dynamics
(SD) Managing the change of stakeholders’ interests (SD2);
Managing the change of stakeholders’ influence (SD3);
Managing the change of relationship among stakeholders and how
project decisions affect them (SD4);
Managing change of stakeholders’ attributes (SD5).
Stakeholder
engagement/empowerment
(SE)
Formulating appropriate communication strategies to
manage/engage different stakeholders (SE2);
Keeping and promoting positive relationships among the
stakeholders (SE3);
Considering corporate social responsibilities (paying attention to
economic, legal, environmental and ethical issues) (SE5).
Project Success (PS) Completion of project on time (PS1);
Completion on budget (PS2);
Completion to specified standards/qualities (PS3);
Completion to the satisfaction of a majority of the project
stakeholders (PS4).
Figure 7.4 presents the final structural equation model of CSFs for stakeholder
management in construction projects with standardised path coefficients on the
structural paths of the hypothesised relationships shown in Figure 7.3. The standardised
path coefficients were tested using critical ratios, standard errors and their level of
statistical significance to ascertain whether the hypotheses are supported by the data set
or not (see Table 7.7). As presented in Table 7.7, the standard errors (S.E.) do not
present with any extremely high or low values except for that of H4. The critical ratios
(C.R.) for H1, H3, H4 and H6 are extremely low and a further look at the results
171
presented in Table 7.7 reveal that only four hypothesised relationships are supported at
the statistical significance level of P<0.05. The relationship path between stakeholder
characteristics and project characteristics (SCPC) and stakeholder dynamism (SD) with
insignificant P value of 0.322 and low path coefficient of 0.255 does not support
Hypothesis 3. Similarly the paths between stakeholder analysis (SA) and project success
(PS) with insignificant P value of 0.721 and a negative low path coefficient of -0.125;
stakeholder dynamism (SD) and project success (PS) with insignificant P value of 0.902
and a low path coefficient of 0.041; stakeholder characteristics and project
characteristics (SCPC) and project success (PS) with insignificant P value 0.968 and
low path coefficient of 0.012 failed to support Hypotheses 4, 6, 1 respectively.
Conversely, the relationship path between stakeholder characteristics and project
characteristics (SCPC) and stakeholder analysis (SA) with P value of 0.002 and path
coefficient of 0.772 strongly sup-ports Hypothesis 2. Other hypotheses supported by the
results presented in Table 7.7 include Hypotheses 7, 8 and 9. They are supported by the
paths between stakeholder analysis (SA) and stakeholder dynamism (SD) with
significant P value of 0.025 and acceptable path coefficient of 0.608; stakeholder
dynamism (SD) and stakeholder engagement/empowerment (SE) with very significant P
value and acceptable path coefficient of 0.634; and stakeholder
engagement/empowerment (SE) and project (PS) with significant P value of 0.008 and
acceptable path coefficient of 0.695; respectively. Table 7.8 presents the GOF measures
for the conceptual and best fitting structural models of critical success factors for
stakeholder management in construction. Figure 7.4 indicates improvement in the
strengths of the supported hypothesis after deleting the hypotheses not supported as
shown in Table 7.7.

172
Stakeholder
Dynamism
Stakeholder
Characteristics &
Project
Characteristics
Stakeholder
Analyses
Project Success
Stakeholder
Engagement/
empowerment
H3H7
H2
H6
H1
H4
H9
H8
H5
H10
Figure 7.3 Hypothesised structural model of critical success factors for stakeholder
management in construction projects

173
SD
SCPC
SA
PS
SE
SD2
SD3
SD4
SD5
SCPC2
SCPC3
SA1
SA2
SE1
SA3
SA4
SA5
SA6
PS1
SE2
SE3
SE5
PS4
PS3
PS2
0.830.62
0.65
0.81
Figure 7.4 Final structural model of critical success factors for stakeholder
management in construction projects
Table 7.7 Standardised path coefficients of the conceptual structural model of the
interrelations among CSFs for stakeholder management in construction
Hypothesised
relationships
Path
coefficient S.E. C.R. Sig(P) Interpretation
H1:PS <--- SCPC +0.012 0.389 0.040 0.968 Not supported
H2:SA <--- SCPC +0.772 0.244 3.165 0.002 Supported
H3:SD <--- SCPC +0.255 0.372 0.991 0.322 Not supported
H4:PS <--- SA -0.125 0.435 0.357 0.721 Not supported
H5:SE <--- SA +0.393 0.332 1.069 0.285 Not supported
H6:PS <--- SD +0.041 0.283 0.123 0.902 Not supported
H7:SD <--- SA +0.608 0.391 2.249 0.025 Supported
H8:SE <--- SD +0.634 0.117 3.507 *** Supported

174
Hypothesised
relationships
Path
coefficient S.E. C.R. Sig(P) Interpretation
H9:PS <--- SE +0.695 0.346 2.667 0.008 Supported
H10:SE <--- SCPC +0.528 0.324 1.503 0.133 Not supported
The goodness of fit indices for conceptual and best fitting structural models are
presented in Table 7.8. The GOF indices indicate some improvements over the
conceptual structural model after deleting the hypothesised relationships not supported
by the data set.
Table 7.8 Result of GOF measures for both Conceptual and best fitting structural
models
Goodness-of-fit (GOF)
measures
Recommended level of
GOF measures
Conceptual
structural
model
Best fitting
structural
model
CMIN/DF 1 (very good) – 2
(threshold)
1.27 1.24
Root mean sq. Error of
approx. (RMSEA)
>0.05 (Very good) – 0.1
(threshold)
0.07 0.06
Root mean sq. Residual
(RMR)
0 – 1 (Smaller values =
better fit)
0.05 0.04
Goodness-of-fit index
(GFI)
0 (no fit) – 1 (perfect fit) 0.77 0.82
Comparative-fit index
(CFI)
0 (no fit) – 1 (perfect fit) 0.90 0.92
Incremental-fit index (IFI) 0 (no fit) – 1 (perfect fit) 0.91 0.92
Tucker-Lewis index (TLI) 0 (no fit) – 1 (perfect fit) 0.89 0.90
7.4 Discussion of Results and Conclusions
This chapter investigated the interrelationships among the CSFs for stakeholder
management in construction projects based on four latent variables drawn from previous
research. The results indicate acceptance of the CSFs for stakeholder management in
construction by the survey respondents as well as the existence of statistically

175
significant relationships between the measured (CSFs) and latent variables and among
the latent variables (SCPC, SA, SD and SE).
The findings based on the measurement model indicate that SE1 “Involving relevant
project stakeholders at the inception stage and whenever necessary to refine project
mission” is the most accepted CSF by the respondents with mean rating of 4.43
followed by SCPC5 “Identifying and understanding stakeholders’ areas of interests in
the project”, SE4 “Communicating with stakeholders properly and frequently”, SD6
“Managing how project decisions affect stakeholders” and SD1 “Resolving conflicts
among stakeholders effectively” with mean ratings 4.33, 4.33, 4.30 and 4.28
respectively. SCPC4 “Ensuring the use of flexible project organisation” has the least
mean rating 3.85 which is still way above the acceptable rating for a five-point Likert
scale being 3.5. This connotes that the survey respondents considered all the 23 CSFs as
vital for the success of stakeholder management in construction which is partly in line
with the findings of Yang et al., (2009) except for the additional CSFs. Furthermore,
Yang et al. (2009) found that SE5 (Considering corporate social responsibilities (paying
attention to Economic, legal, environmental, and ethical issues)) was the most important
CSF and could not be grouped under any of the constructs and identified it as the
precondition factor of stakeholder management in construction projects. However, the
findings in the current study grouped SE5 under stakeholder engagement (SE) with a
factor loading of 0.68.
Additionally, the most important CSF in the current study is SE1 (Involving relevant
project stakeholders at the inception stage and whenever necessary to refine project
mission) which was initially hypothesised to be under the construct stakeholder
engagement/empowerment (SE) but the result of the measurement model analysis
moved it to the construct stakeholder characteristics and project characteristics (SCPC).
As reported in the preceding section, the results of the “measurement model” reduced 7
CSFs from the best fitting measurement model including SCPC1, SCPC4, SCPC5, SD1,
SD6, SD7 and SE4 which were merged with other retained CSFs during model
modification (see Tables 7.5 and 7.6: for the mergers and their final meanings/retained
codes respectively).
Another important revelation of the measurement model is that, the strong correlation
estimates presented in Table 7.4 point to the existence of some interrelationships direct
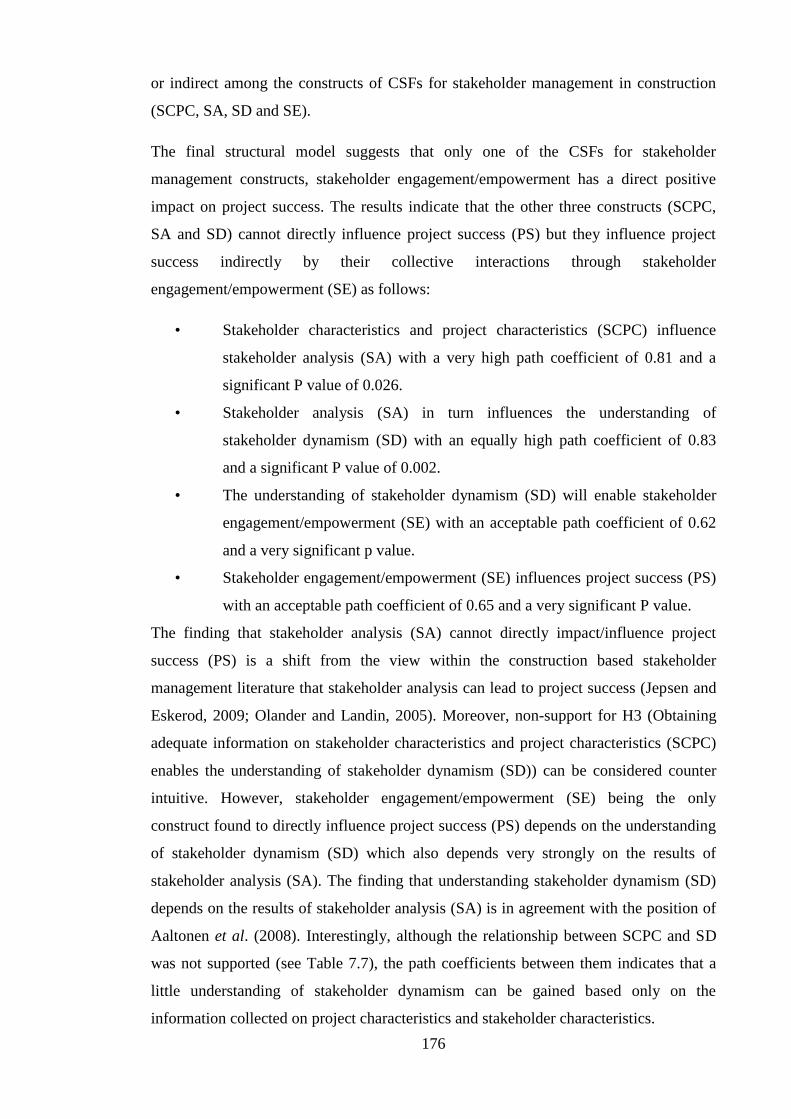
176
or indirect among the constructs of CSFs for stakeholder management in construction
(SCPC, SA, SD and SE).
The final structural model suggests that only one of the CSFs for stakeholder
management constructs, stakeholder engagement/empowerment has a direct positive
impact on project success. The results indicate that the other three constructs (SCPC,
SA and SD) cannot directly influence project success (PS) but they influence project
success indirectly by their collective interactions through stakeholder
engagement/empowerment (SE) as follows:
• Stakeholder characteristics and project characteristics (SCPC) influence
stakeholder analysis (SA) with a very high path coefficient of 0.81 and a
significant P value of 0.026.
• Stakeholder analysis (SA) in turn influences the understanding of
stakeholder dynamism (SD) with an equally high path coefficient of 0.83
and a significant P value of 0.002.
• The understanding of stakeholder dynamism (SD) will enable stakeholder
engagement/empowerment (SE) with an acceptable path coefficient of 0.62
and a very significant p value.
• Stakeholder engagement/empowerment (SE) influences project success (PS)
with an acceptable path coefficient of 0.65 and a very significant P value.
The finding that stakeholder analysis (SA) cannot directly impact/influence project
success (PS) is a shift from the view within the construction based stakeholder
management literature that stakeholder analysis can lead to project success (Jepsen and
Eskerod, 2009; Olander and Landin, 2005). Moreover, non-support for H3 (Obtaining
adequate information on stakeholder characteristics and project characteristics (SCPC)
enables the understanding of stakeholder dynamism (SD)) can be considered counter
intuitive. However, stakeholder engagement/empowerment (SE) being the only
construct found to directly influence project success (PS) depends on the understanding
of stakeholder dynamism (SD) which also depends very strongly on the results of
stakeholder analysis (SA). The finding that understanding stakeholder dynamism (SD)
depends on the results of stakeholder analysis (SA) is in agreement with the position of
Aaltonen et al. (2008). Interestingly, although the relationship between SCPC and SD
was not supported (see Table 7.7), the path coefficients between them indicates that a
little understanding of stakeholder dynamism can be gained based only on the
information collected on project characteristics and stakeholder characteristics.

177
Furthermore, the findings suggest that obtaining information on project characteristics
and stakeholder characteristics is a major precondition step in the process of stakeholder
management. This finding is in line with the opinion canvassed by a faction of the
extant literature (Mitchell et al., 1997; Chinyio and Akintoye, 2008) and disagrees with
the position of Yang et al. (2009) that the precondition factor for stakeholder
management in construction projects is “considering corporate social responsibilities”
which by the findings of the current study is an indicator of stakeholder
engagement/empowerment (SE).
Conclusion: The objective of this chapter was to understand the interrelations among
the critical success factors for stakeholder management in construction through their
relationships with the latent variables as well as the causal interrelations among the
latent variables; and to examine the fit between extant theoretical standing and the
survey data collected for the current study. Based on the goodness-of-fit indices shown
in Table 7.2, it can be concluded with high level of confidence that the measurement
model portrayed in Figure 7.2 fits the sample data fairly well and therefore is accepted.
This implies that all stakeholder management decisions made in the four distinct
processes shown in the latent variables (obtaining information on project characteristics
and stakeholder characteristics; undertaking stakeholder analysis; understanding
stakeholder dynamism; and stakeholder engagement/empowerment) affect each other
directly or indirectly.
The results of the structural model portrayed in Figure 7.4 support the following:
The ability of the project management team to clearly obtain adequate
information on stakeholder characteristics and project characteristics will
influence and aid their ability to carry out stakeholder analysis.
Understanding stakeholder dynamism depends on the results of stakeholder
analysis to inform decision on how to effectively engage/empower stakeholders
during construction projects.
Effective stakeholder engagement/empowerment will facilitate project success.
Further implication is that being able to carry out effective stakeholder management in
construction is contingent upon understanding of the interrelationships among the CSFs
with obtaining information about project characteristics and stakeholder characteristics
(SCPC) being the precondition factor (construct). Failure to adequately and holistically
address the critical success factors for stakeholder management in construction projects

178
will prevent stakeholder management efforts from achieving the desired results-project
success. The findings presented in this chapter provide a logical guide for carrying out
stakeholder management in construction projects and are used in developing the
framework presented in the next Chapter (8).

179
8. CHAPTER EIGHT: DEVELOPMENT OF LIFE CYCLE BASED
FRAMEWORK FOR STAKEHOLDER MANAGEMENT IN
CONSTRUCTION PROJECTS
8.1 Introduction
Literature review findings on stakeholder management in construction projects revealed
that project failure is linked to lack of or inadequate stakeholder management process.
The review also identified the need for stakeholder management to be carried out
throughout the life cycle of construction projects but the current frameworks fail to
address this need. It has been shown that there is need for a framework for stakeholder
management in construction that provides a comprehensive and coherent guide for
carrying out stakeholder management in construction and thereby increases the
propensity for achieving project success in construction. This chapter presents the
development of the framework for stakeholder management in construction resulting
from this study aimed at addressing this need. The chapter starts by giving an overview
of the life cycle based framework for stakeholder management followed by framework
development approach, features of the framework, IDEF0 process models of framework
for stakeholder management and then chapter summary.
8.2 Overview of the Life Cycle Based Framework for Stakeholder Management
in Construction
8.2.1 Background to framework development
The framework for stakeholder management in construction was developed by using the
analysis results presented in Chapters 5, 6 and 7 in combination with theoretical
findings from literature review presented in Chapters 2 and 3. These findings constitute
the components of the framework developed. The framework was developed using
process modelling in line with the PMI’s (2004) definition of project stakeholder
management as “the systematic identification, analysis and planning of actions to
communicate with and influence stakeholders”.
Investigation of current practice of stakeholder management in construction presented in
chapter 5 revealed the following:
180
There is need to assign specific responsibilities for stakeholder management in
construction projects as currently no specific responsibility is assigned for
stakeholder management in construction projects.
Construction companies/organisations should make stakeholder management a
part of their organisational agenda/policy/strategy.
When reasons for change in stakeholder interests/disposition were investigated,
it was found that all relevant stakeholders should be involved as much as
possible in defining project mission in order to avoid the impact of change.
Both negative and positive impacts of project objectives should be
communicated to the stakeholders in order to secure their trust.
There is need to put in place feedback mechanisms and early warning signs to
track change in stakeholder interests/disposition throughout the project.
The results further confirmed the need for internal stakeholder collaboration in
carrying out stakeholder management and identified the internal stakeholders
that should be involved in such collaboration at the various stages of the project.
The results also identified the internal stakeholders that should lead/coordinate
stakeholder management at various stages in construction projects.
The results also identified the most effective/popular techniques for stakeholder
engagement.
Investigation- of the effects of procurement routes and forms of contract on stakeholder
management process in construction projects presented in chapter 6 revealed the
following:
The procurement routes that favour procurement routes related characteristics of
stakeholder management in the project are adopted.
It should be ensured that the project contract supports clear allocation of
responsibilities and communication flow among the key/internal stakeholders of
the project.
Investigation- of the interrelationships among the critical success factors for stakeholder
management in construction presented in chapter 7 identified the important lines of
influence/relationships among the groups of CSFs indicating areas that should be given
closer attention to achieve project success.

181
From the literature review, the stages of construction projects were mapped out. These
include inception, design, construction and operation stages which were used to design
the questionnaires with respect to life cycle related questions.
The framework for stakeholder management in construction is developed to address the
need for a comprehensive guide for carrying out stakeholder management in
construction projects. It is intended that the framework should be used by construction
professionals and other relevant stakeholders working at different stages of construction
projects. Specifically, the client, designers, construction managers, contractors, quantity
surveyors, facility managers and some end users are potential users of the framework.
8.2.2 Framework development approach-IDEF0
The IDEF0 technique has been chosen to model the framework for stakeholder
management in construction because it allows different levels of details through the
process and sub process to be presented very clearly in parent and child diagrams.
Moreover, it enables consensus decision making which is vital to the stakeholder
management process. Furthermore, its simplified graphical presentation would enable
the construction professionals and other relevant stakeholders to easily understand and
follow the stages for successful stakeholder management in construction projects.
8.2.2.1 IDEF Techniques
The Integrated Definition for Function Modelling is a family of methods that support a
paradigm that is able to address the modelling needs of an enterprise and its business
areas. It is abbreviated as IDEF (representing Integrated DEFinition). IDEF originated
when the US Air Force, in response to the identified need for improving manufacturing
operations, developed the Integrated Computer-Aided Manufacturing (ICAM) in the
mid-1970s (IDEF, 2003). The IDEF family has different techniques developed to suit
different purposes and applications. The most important techniques of the IDEF family
include IDEF0, IDEF1, IDEF1X, IDEF2, IDEF3, IDEF4 and IDEF5. Their respective
applications are summarised in Table 8.1.
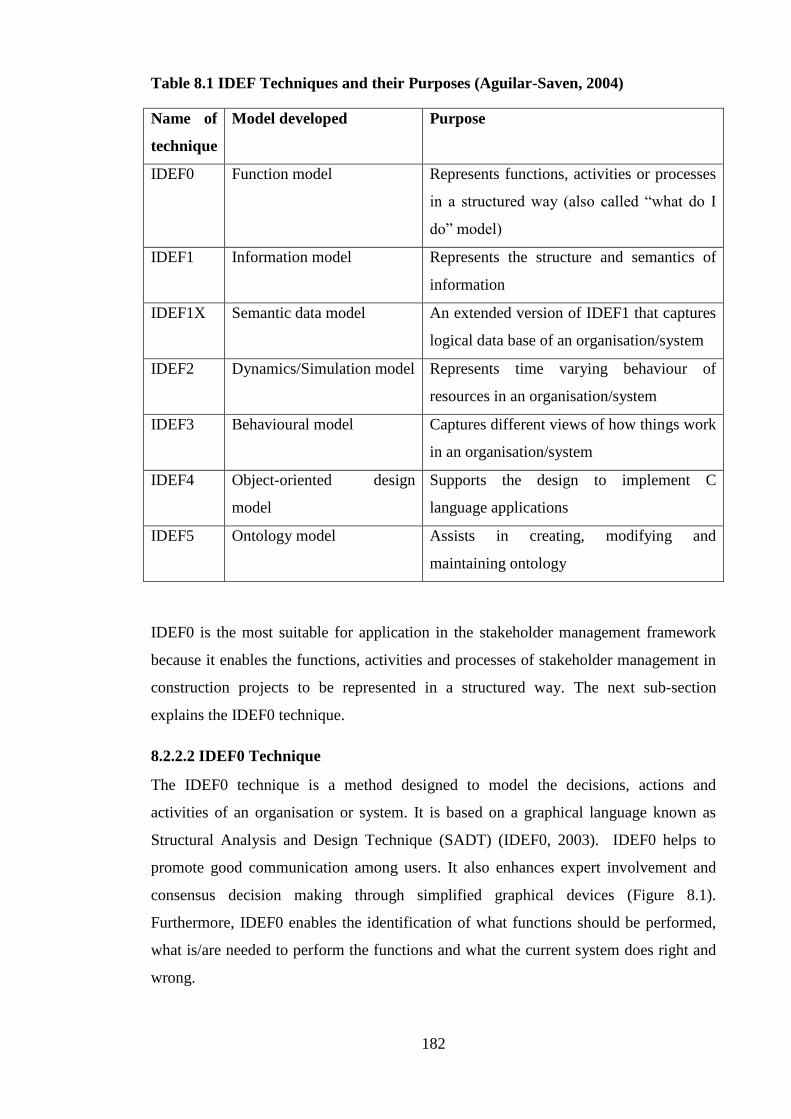
182
Table 8.1 IDEF Techniques and their Purposes (Aguilar-Saven, 2004)
Name of
technique
Model developed Purpose
IDEF0 Function model Represents functions, activities or processes
in a structured way (also called “what do I
do” model)
IDEF1 Information model Represents the structure and semantics of
information
IDEF1X Semantic data model An extended version of IDEF1 that captures
logical data base of an organisation/system
IDEF2 Dynamics/Simulation model Represents time varying behaviour of
resources in an organisation/system
IDEF3 Behavioural model Captures different views of how things work
in an organisation/system
IDEF4 Object-oriented design
model
Supports the design to implement C
language applications
IDEF5 Ontology model Assists in creating, modifying and
maintaining ontology
IDEF0 is the most suitable for application in the stakeholder management framework
because it enables the functions, activities and processes of stakeholder management in
construction projects to be represented in a structured way. The next sub-section
explains the IDEF0 technique.
8.2.2.2 IDEF0 Technique
The IDEF0 technique is a method designed to model the decisions, actions and
activities of an organisation or system. It is based on a graphical language known as
Structural Analysis and Design Technique (SADT) (IDEF0, 2003). IDEF0 helps to
promote good communication among users. It also enhances expert involvement and
consensus decision making through simplified graphical devices (Figure 8.1).
Furthermore, IDEF0 enables the identification of what functions should be performed,
what is/are needed to perform the functions and what the current system does right and
wrong.

183
The main features of an IDEF0 diagram are boxes and arrows (Figure 8.1). An IDEF0
diagram shows the function (activity) as a box and the interfaces to or from the function
as arrows entering or leaving the box. Depending on their positions, the arrows
represent Inputs, Controls, Outputs and Mechanisms (ICOMs) or call outs which are
explained in Table 8.2.
FUNCTION
(ACTIVITY)
CONTROLS
OUTPUTS
MECHANISMS CALL OUTS
INPUTS
Figure 8.1 IDEF0 Box and Arrow Graphics (adapted from IDEF0, 2003)
Table 8.2 Table 8.2 IDEF0 Interfaces and their Meanings
Interface Meaning/Explanation
Inputs These are the data or objects that are transformed by the function into
outputs
Controls These define the conditions/restrictions required to produce the right
outputs
Outputs These are the results, data or objects produced by the function
Mechanisms These are the means (resources) required to perform the function
Call outs These are extra interfaces which enable the sharing of vital details
between models or within a model
Furthermore, IDEF0 models are made up of several diagrams with each describing in
more details a box from a more general diagram as the models are read in a top-down

184
fashion. The process of describing a diagram/box in more details is known as
decomposing a function. The more general diagram is known as the parent and the more
detailed diagram is known as the child with particular reference to a given parent
diagram. Each diagram is identified by a diagram node number shown at the lower left
corner of the frame, whereas each activity is identified (numbered) at the lower right
corner of the box. The top level diagram referred to as the context and numbered A-0
diagram, summarises the overall function of the system represented by a single box.
Following the context diagram, is the A0 diagram, which represents the first
decomposition of the system. All subsequent diagrams are identified using their
respective numbers following their parent diagrams’ numbers as shown in Figure 8.2.
A-0
A12
A1
A0
0
1
3
1
2
2
2
3
1
More General
More Detailed
This diagram is the parent of...
This diagram
Figure 8.2 Decomposition of IDEF0 Diagram
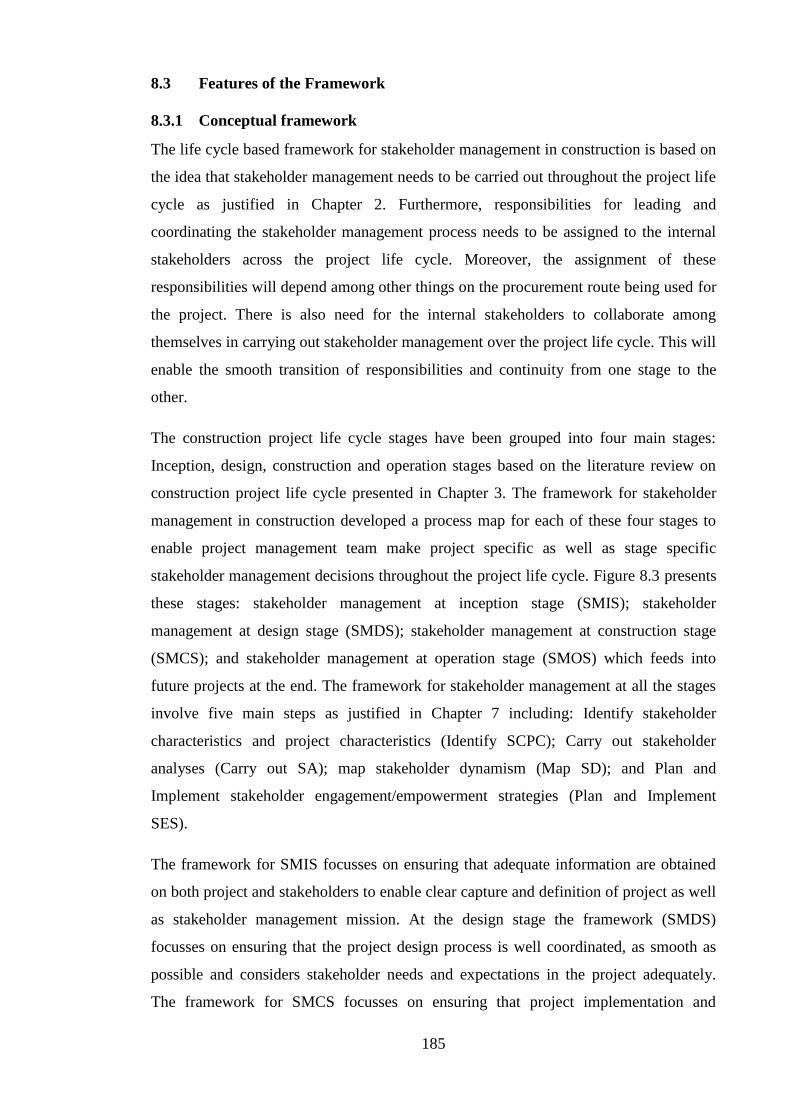
185
8.3 Features of the Framework
8.3.1 Conceptual framework
The life cycle based framework for stakeholder management in construction is based on
the idea that stakeholder management needs to be carried out throughout the project life
cycle as justified in Chapter 2. Furthermore, responsibilities for leading and
coordinating the stakeholder management process needs to be assigned to the internal
stakeholders across the project life cycle. Moreover, the assignment of these
responsibilities will depend among other things on the procurement route being used for
the project. There is also need for the internal stakeholders to collaborate among
themselves in carrying out stakeholder management over the project life cycle. This will
enable the smooth transition of responsibilities and continuity from one stage to the
other.
The construction project life cycle stages have been grouped into four main stages:
Inception, design, construction and operation stages based on the literature review on
construction project life cycle presented in Chapter 3. The framework for stakeholder
management in construction developed a process map for each of these four stages to
enable project management team make project specific as well as stage specific
stakeholder management decisions throughout the project life cycle. Figure 8.3 presents
these stages: stakeholder management at inception stage (SMIS); stakeholder
management at design stage (SMDS); stakeholder management at construction stage
(SMCS); and stakeholder management at operation stage (SMOS) which feeds into
future projects at the end. The framework for stakeholder management at all the stages
involve five main steps as justified in Chapter 7 including: Identify stakeholder
characteristics and project characteristics (Identify SCPC); Carry out stakeholder
analyses (Carry out SA); map stakeholder dynamism (Map SD); and Plan and
Implement stakeholder engagement/empowerment strategies (Plan and Implement
SES).
The framework for SMIS focusses on ensuring that adequate information are obtained
on both project and stakeholders to enable clear capture and definition of project as well
as stakeholder management mission. At the design stage the framework (SMDS)
focusses on ensuring that the project design process is well coordinated, as smooth as
possible and considers stakeholder needs and expectations in the project adequately.
The framework for SMCS focusses on ensuring that project implementation and
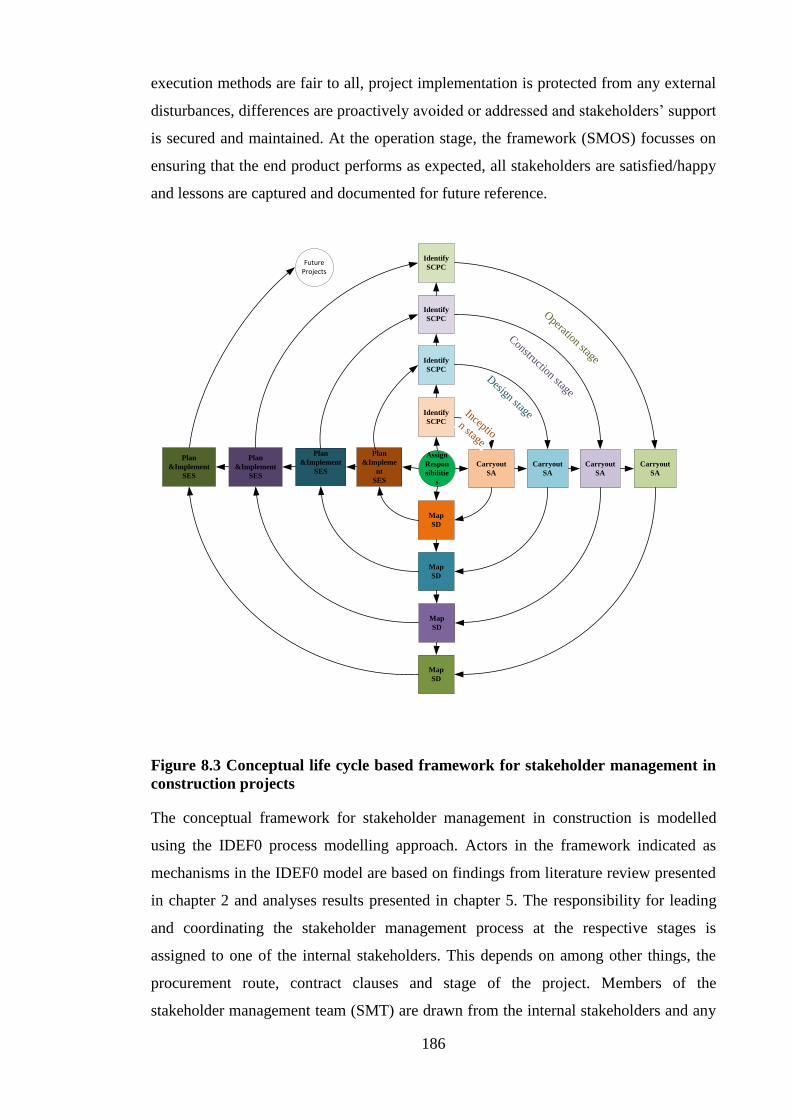
186
execution methods are fair to all, project implementation is protected from any external
disturbances, differences are proactively avoided or addressed and stakeholders’ support
is secured and maintained. At the operation stage, the framework (SMOS) focusses on
ensuring that the end product performs as expected, all stakeholders are satisfied/happy
and lessons are captured and documented for future reference.
Identify
SCPC
Plan
&Impleme
nt
SES
Carryout
SA
Map
SD
Assign
Respon
sibilitie
s
Carryout
SA
Carryout
SA
Carryout
SA
Identify
SCPC
Identify
SCPC
Identify
SCPC
Plan
&Implement
SES
Plan
&Implement
SES
Plan
&Implement
SES
Map
SD
Map
SD
Map
SD
Design stage
Construction stage
Operation stage
Inception stage
Future Projects
Figure 8.3 Conceptual life cycle based framework for stakeholder management in
construction projects
The conceptual framework for stakeholder management in construction is modelled
using the IDEF0 process modelling approach. Actors in the framework indicated as
mechanisms in the IDEF0 model are based on findings from literature review presented
in chapter 2 and analyses results presented in chapter 5. The responsibility for leading
and coordinating the stakeholder management process at the respective stages is
assigned to one of the internal stakeholders. This depends on among other things, the
procurement route, contract clauses and stage of the project. Members of the
stakeholder management team (SMT) are drawn from the internal stakeholders and any

187
other relevant/key stakeholders of the project. It should be noted that the actors in the
framework for stakeholder management in construction are not a replacement for the
entire project management team.
8.3.2 Actors in the framework
8.3.2.1 Project Director (PD)
The project director is the top level manager who leads the execution of construction
projects. The role is responsible for coordinating all the activities of the project and
communicating with all parties throughout the stakeholder management process on the
project. In project where the role of project Director does not exist, the topmost manager
will play this role.
8.3.2.2 Stakeholder management leader (SML)
A suitable leader is appointed to superintend over the entire stakeholder management
process. Additionally, specific responsibilities are assigned to members of the internal
stakeholders for leading/coordinating stakeholder management at various stages of the
project. The stakeholder management leaders at the various stages, report to the overall
stakeholder management leader. The respective stage stakeholder management leaders
liaise with each other throughout the project.
8.3.2.3 Stakeholder management team (SMT)
The stakeholder management team is made up of the stakeholder management leaders,
client representative, and any other key stakeholders as may be found necessary.
Members of the stakeholder management team should ideally cover all relevant interests
and concerns on the project that are capable of presenting their interests and giving
adequate feedbacks. They are responsible for taking and ratifying stakeholder
management decisions and actions throughout the project.
8.3.2.4 Regulatory authorities
As it may become necessary, representatives of regulatory authorities should be invited
to play a role on stakeholder management decisions. Their roles will include shedding
light on grey relevant regulations concerning stakeholder management and advising
against any bad practices. These may be on the impact of construction activities and
rights of external stakeholders. The representatives may include Environmental Health
Officers, community councils, key councillors, MPs, local authorities etc. the regulatory
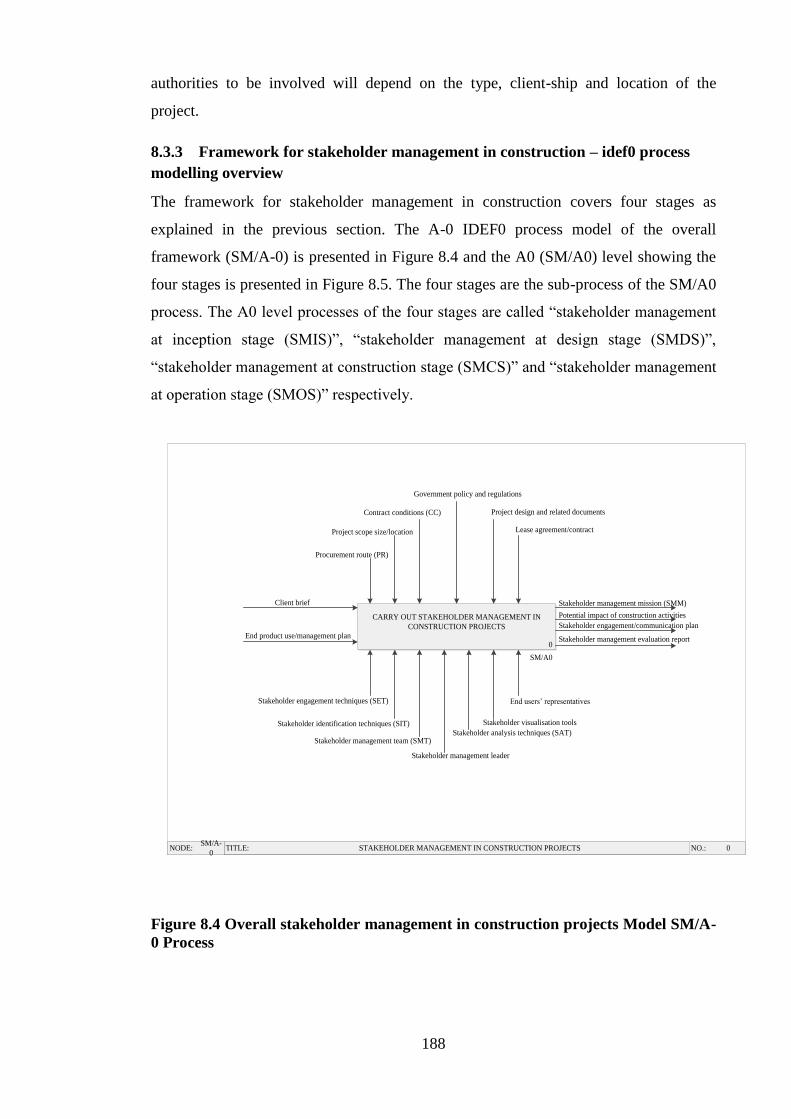
188
authorities to be involved will depend on the type, client-ship and location of the
project.
8.3.3 Framework for stakeholder management in construction – idef0 process
modelling overview
The framework for stakeholder management in construction covers four stages as
explained in the previous section. The A-0 IDEF0 process model of the overall
framework (SM/A-0) is presented in Figure 8.4 and the A0 (SM/A0) level showing the
four stages is presented in Figure 8.5. The four stages are the sub-process of the SM/A0
process. The A0 level processes of the four stages are called “stakeholder management
at inception stage (SMIS)”, “stakeholder management at design stage (SMDS)”,
“stakeholder management at construction stage (SMCS)” and “stakeholder management
at operation stage (SMOS)” respectively.
TITLE:NODE: NO.: 0SM/A-
0STAKEHOLDER MANAGEMENT IN CONSTRUCTION PROJECTS
0
SM/A0
CARRY OUT STAKEHOLDER MANAGEMENT IN
CONSTRUCTION PROJECTS
Client brief
Procurement route (PR)
Project scope size/location
Contract conditions (CC)
Government policy and regulations
Stakeholder management mission (SMM)
Stakeholder engagement techniques (SET)
Stakeholder identification techniques (SIT)
Stakeholder management team (SMT)
Stakeholder management leader
Stakeholder analysis techniques (SAT)
Stakeholder visualisation tools
End users’ representatives
End product use/management plan Stakeholder management evaluation report
Potential impact of construction activities
Stakeholder engagement/communication plan
Project design and related documents
Lease agreement/contract
Figure 8.4 Overall stakeholder management in construction projects Model SM/A-
0 Process

189
TITLE:NODE: NO.: 0SM/AO LIFE CYCLE BASED STAKEHOLDER MANAGEMENT IN CONSTRUCTION PROJECTS
A0
SMIS/A0
STAKEHOLDER
MANAGEMENT AT
INCEPTION STAGE
(SMIS)
A0
SMDS/A0
STAKEHOLDER
MANAGEMENT
AT DESIGN
STAGE (SMDS)
A0
SMCS/A0
STAKEHOLDER
MANAGEMENT
AT
CONSTRUCTION
STAGE (SMCS)
A0
SMOS/A0
STAKEHOLDER
MANAGEMENT
AT OPERATION
STAGE (SMOS)
Procurement route (PR) Government policy and regulations
Client brief
Users’ satisfaction
report
SMOS evaluation
and lessons learned
Contract conditions (CC)
Contract conditions (CC)
Lease agreement/contract
PR
PR
Stakeholder management leader
Stakeholder engagement techniques
Stakeholder analysis techniques
LabelStakeholder
management
team (SMT)
Stakeholder
visualisation
tools (SVT)
SVT
SVT
SVT
Project design and
related documents
SMM
SMIS evaluation report
SMDS evaluation report
Updated SMM
SMCS evaluation report
End product use/management plan
Figure 8.5 Life cycle based framework for stakeholder management in construction projects – SM/A0 Process

190
Furthermore, as explained in the previous section, the framework for stakeholder
management at the four stages involve five key steps which are considered as the main
sub-processes of the A0diagrams for SMIS, SMDS, SMCS and SMOS when developing
the IDEF0 models. The A0 diagrams for SMIS, SMDS, SMCS, and SMOS are shown
in Figures 8.6 – 8.9.
The five main sub-processes are further decomposed into some child diagrams. The
stakeholder management decisions and actions determined through the literature review
and questionnaire survey results were used in developing the sub-processes. These
processes are presented in a node index in Table 8.3 showing all nodes in the respective
IDEF0 process diagrams in an outline order.

191
TITLE:NODE: NO.: 0SMIS/A0 STAKEHOLDER MANAGEMENT AT INCEPTION STAGE
A1
SMIS/A1
IDENTIFY STAKEHOLDER CHARACTERISTICS AND
PROJECT CHARACTERISTICS
A2
SMIS/A2
CARRYOUT STAKEHOLDER ANALYSES
A3
SMIS/A3
MAP STAKEHOLDER DYNAMISM
A4
SMIS/A4
PLAN STAKEHOLDER ENGAGEMENT/EMPOWERMENT
STRATEGIES
A5
SMIS/A5
IMPLEMENT STAKEHOLDER MANAGEMENT DECISIONS
Procurement Route (PR)
Stakeholder engagement Techniques (SET)
Stakeholder identification techniques (SIT)
Stakeholder management leader (SML)
Project scope/size/location
Government Policy and regulations
Stakeholder management mission (SMM)
Stakeholder management team (SMT)
Stakeholder maps/matrices at IS
Stakeholder relation map/matrices at IS
Stakeholder engagement/communication plan at IS
Feedback/tracking plan at IS
Feedback/tracking report at IS
SMIS evaluation report
Stakeholder analyses techniques (SAT)
Stakeholder visualisation tools (SVT)
Stakeholder engagement techniques (SET)
Client brief
SMT
SMT
SMT
SMT
SMT
SMT
SMT
SMT
SML
SML
SML
SML
SML
SML
SML
SML
Stakeholder list at IS
Stakeholder characteristics and preliminary classification at IS
Stakeholder classification at ISPossible conflicts and coalition report at IS
Change in stakeholder interests map at IS Change in stakeholder influence map at IS
Figure 8.6 SMIS Model – A0 Process

192
TITLE:NODE: NO.: 0SMDS/
A0STAKEHOLDER MANAGEMENT AT DESIGN STAGE
A1
SMDS/A1
IDENTIFY STAKEHOLDER CHARACTERISTICS AND
PROJECT CHARACTERISTICS
A2
SMDS/A2
CARRYOUT STAKEHOLDER ANALYSES
A3
SMDS/A3
MAP STAKEHOLDER DYNAMISM
A4
SMDS/A4
PLAN STAKEHOLDER ENGAGEMENT/EMPOWERMENT
STRATEGIES
A5
SMDS/A5
IMPLEMENT STAKEHOLDER MANAGEMENT DECISIONS
SML
SML
SML
SML
SMT
SMT
SMT
SMT
Procurement Route
Contract Conditions
Government policy and regulations
SA Techniques
SV Tools
SE Techniques
SMT
SMT
SMT
SML
SML
SML
SML
SMT
SMM
Updated SMM at DS
Updated stakeholder list at DS
Updated stakeholder characteristics and attributes at DS
Updated stakeholder maps at DS
Updated possible conflicts and coalition report at DS
Updated stakeholder classification at DS
Updated stakeholder relation maps/matrices at DS
Updated change in stakeholder interest map at DS
Updated change in stakeholder influence map at DS
Feedback/tracking report at DS
Updated stakeholder consultation plan at DS
Stakeholder management responsibilities at DS
Feedback/tracking plan at DS
SMDS evaluation report
SMIS evaluation report
Stakeholder engagement techniques
Figure 8.7 SMDS – A0 Process

193
TITLE:NODE: NO.: 0SMCS/
A0STAKEHOLDER MANAGEMENT AT CONSTRUCTION STAGE
A1
SMCS/A1
IDENTIFY STAKEHOLDER CHARACTERISTICS AND
PROJECT CHARACTERISTICS
A2
SMCS/A2
CARRYOUT STAKEHOLDER ANALYSES
A3
SMCS/A3
MAP STAKEHOLDER DYNAMISM
A4
SMCS/A4
PLAN STAKEHOLDER ENGAGEMENT/EMPOWERMENT
STRATEGIES
A5
SMCS/A5
IMPLEMENT STAKEHOLDER MANAGEMENT DECISIONS
Procurement Route
Project design and related documents
Contract Conditions
SML
SMT
SMT
SMT
SMT
SMT
SMT
SMT
SMT
SML
SML
SML
SML
Feedback/tracking report at CS
SMCS evaluation report
SMDS evaluation report
SA Techniques
SV Tools
SE Techniques
Updated SMM at DS
Feedback/tracking report at DS
Report on potential impact of construction activities on stakeholders
Preliminary stakeholder priority list at CS
Updated stakeholder list at CS
Updated stakeholder classification at CS
Stakeholder priority and impact report at CS
Updated stakeholder maps/matrices at CS
Updated change in stakeholder relation map at CS
Updated change in stakeholder interest map at CS
Updated change in stakeholder influence map at CS
Stakeholder engagement/communication plan at CS
Feedback/tracking plan at CS
Updated stakeholder map
Figure 8.8 SMCS – A0 Process

194
TITLE:NODE: NO.: 0SMOS/
A0STAKEHOLDER MANAGEMENT AT OPERATION STAGE
A1
SMOS/A1
IDENTIFY STAKHEOLDER CHARACTERISTICS AND
PROJECT CHARACTERISTICS
A2
SMOS/A2
CARRYOUT STAKEHOLDER ANALYSES
A3
SMOS/A3
MAP STAKEHOLDER DYNAMISM
A4
SMOS/A4
PLAN STAKEHOLDER ENGAGAGEMENT/EMPOWERMENT
STRATEGIES
A5
SMOS/A5
IMPLEMENT STAKEHOLDER MANAGEMENT PLANN
Lease agreement/contract
Government policy/regulations
SMCS evaluation report
Feedback/tracking report at CS
End product use/management plan at OS
Preliminary end users’ expectation report at OS
Preliminary end users’ classification at OS
Updated stakeholder classification
Stakeholders’ expectation report at OS
Possible conflicts and coalition report at OS
End users’ classification at OS
Possible change in end users’ expectation map at OS
End users’ relation map/matrices at OS
Users’ consultation plan at OS
Owner/Financiers'’ assessment plan at OS
Stakeholder engagement/communication plan
Feedback/tracking plan at OS
Users’ satisfaction report at OS
Owner/Financiers’ satisfaction report at OS
SMOS evaluation report
SML
SML
SML
SML
SML
End users
End users
End users
End users
End users
SA Techniques
SV Tools
SE Techniques
Figure 8.9 SMOS – A0 Process

195
Table 8.3 Node Index for SMIS Process Model
Diagram
Reference
Description and Activities Included
SMIS/A0 Stakeholder Management at Inception Stage
SMIS/A1 Identify Stakeholder Characteristics and Project Characteristics
A11 Define stakeholder management mission
A12 Identify stakeholder, their characteristics and preliminary
classification
A13 Constitute stakeholder management team
SMIS/A2 Carryout Stakeholder Analyses
A21 Classify stakeholders
A22 Draw up stakeholder maps/matrices
A23 Identify possible conflicts and coalition among stakeholders
SMIS/A3 Map Stakeholder Dynamism
A31 Draw stakeholder relation map/matrices
A32 Draw change in stakeholder interests map
A33 Draw change in stakeholder influence map
SMIS/A4 Plan Stakeholder Engagement/Empowerment Strategies
A41 Draw up stakeholder engagement and communication plan
A42 Plan how to track changes and get feedback at IS
SMIS/A5 Implement Stakeholder Management Decisions
A51 Do change tracking and feedback report at IS
A52 Evaluate SMIS
SMDS/A0 Stakeholder Management at Design Stage
SMDS/A1
Identify Stakeholder Characteristics and Project Characteristics
A11 Update stakeholder management mission
A12 Update stakeholder list
A13 Update stakeholder interests, characteristics and profile
SMDS/A2
Carryout Stakeholder Analyses
A21 Update stakeholder classification
A22 Update stakeholder map/matrices
A23 Update possible conflicts and coalition report
SMDS/A3
Map Stakeholder Dynamism
A31 Update stakeholder relation maps/matrices
A32 Update change in stakeholder interests maps/matrices
A33 Update change in stakeholder influence maps/matrices
SMDS/A4
Plan Stakeholder Engagement/Empowerment Strategies
A41 Draw up stakeholder consultation plan at DS
A42 Specify responsibilities for SMT members at DS
A43 Plan how to track changes and get feedback at DS
SMDS/A5
Implement Stakeholder Management Decisions
A51 Do change tracking and feedback report at DS
A52 Evaluate SMDS
SMCS/A0
Stakeholder Management at Construction Stage
SMCS/A1 Identify Stakeholder Characteristics and Project Characteristics
A11 Identify potential impact of construction activities on
stakeholders at CS
A12 Update stakeholder list and profile at CS
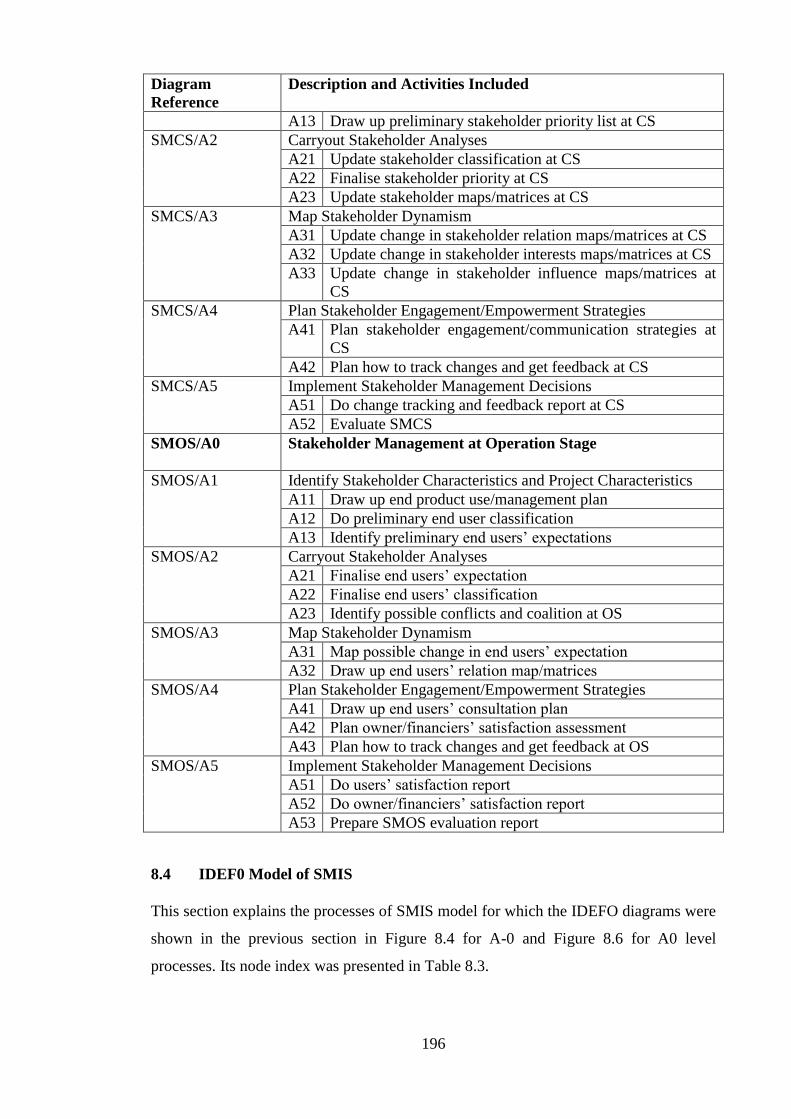
196
Diagram
Reference
Description and Activities Included
A13 Draw up preliminary stakeholder priority list at CS
SMCS/A2
Carryout Stakeholder Analyses
A21 Update stakeholder classification at CS
A22 Finalise stakeholder priority at CS
A23 Update stakeholder maps/matrices at CS
SMCS/A3
Map Stakeholder Dynamism
A31 Update change in stakeholder relation maps/matrices at CS
A32 Update change in stakeholder interests maps/matrices at CS
A33 Update change in stakeholder influence maps/matrices at
CS
SMCS/A4
Plan Stakeholder Engagement/Empowerment Strategies
A41 Plan stakeholder engagement/communication strategies at
CS
A42 Plan how to track changes and get feedback at CS
SMCS/A5
Implement Stakeholder Management Decisions
A51 Do change tracking and feedback report at CS
A52 Evaluate SMCS
SMOS/A0
Stakeholder Management at Operation Stage
SMOS/A1 Identify Stakeholder Characteristics and Project Characteristics
A11 Draw up end product use/management plan
A12 Do preliminary end user classification
A13 Identify preliminary end users’ expectations
SMOS/A2
Carryout Stakeholder Analyses
A21 Finalise end users’ expectation
A22 Finalise end users’ classification
A23 Identify possible conflicts and coalition at OS
SMOS/A3
Map Stakeholder Dynamism
A31 Map possible change in end users’ expectation
A32 Draw up end users’ relation map/matrices
SMOS/A4
Plan Stakeholder Engagement/Empowerment Strategies
A41 Draw up end users’ consultation plan
A42 Plan owner/financiers’ satisfaction assessment
A43 Plan how to track changes and get feedback at OS
SMOS/A5
Implement Stakeholder Management Decisions
A51 Do users’ satisfaction report
A52 Do owner/financiers’ satisfaction report
A53 Prepare SMOS evaluation report
8.4 IDEF0 Model of SMIS
This section explains the processes of SMIS model for which the IDEFO diagrams were
shown in the previous section in Figure 8.4 for A-0 and Figure 8.6 for A0 level
processes. Its node index was presented in Table 8.3.

197
8.4.1 Identify stakeholder characteristics and project characteristics - SMIS/A1
This is the first sub-process of SMIS and initiates the stakeholder management process.
It is aimed at identifying stakeholder characteristics and project characteristics at the
inception stage of the project. It consists of three sub-processes the IDEF0 diagram of
which is presented in Figure 8.10. The three sub-processes are explained in the
following sub-sections.
TITLE:NODE: NO.: 0SMIS/
A1IDENTIFY STAKEHOLDER CHARACTERISTICS AND PROJECT CHARACTERISTICS
1
DEFINE STAKEHOLDER
MANAGEMENT MISSION
2
IDENTIFY STAKEHOLDERS
AND THEIR
CHARACTERISTICS
3
CONSTITUTE
STAKEHOLDER
MANAGEMENT TEAM
Stakeholder management mission (SMM)
Project scope/size/locationProcurement route
Client brief
Stakeholder list at IS
Stakeholder characteristics and preliminary classification
Stakeholder management team at IS
Stakeholder identification techniquesStakeholder management
leader at IS
Stakeholder engagement techniques
Figure 8.10 Identify stakeholder characteristics and project characteristics -
SMIS/A1
8.4.1.1 Define stakeholder management mission
This process is coordinated by the stakeholder management leader (as discussed in
Section 8.3.2.2) who is also a member of the stakeholder management team. During this
process the need for and aim of stakeholder management in the project is agreed and
established. This is guided by the procurement route chosen for the project, the contract
clauses of the project, project location, project size and scope. The client brief provide
specific project information that determine very strongly what constitute the stakeholder
management mission at the inception stage as explained in section 8.3. To carry out this
process, stakeholder engagement techniques (SET) are used to communicate with and
elicit key stakeholders’ inputs on the project. The output from this process is

198
stakeholder management mission (SMM) which serves as control in SMIS/A2,
SMIS/A3, SMIS/A4 and SMIS/A5 as shown in Figure 8.6.
8.4.1.2 Identify project stakeholders and their characteristics
At this step, the entire stakeholders apart from the internal stakeholders who are directly
involved and are part of the project/stakeholder management team, of the project are
identified by the responsible members of the stakeholder management team using
stakeholder engagement techniques. The output from this sub-process is stakeholder
list.
8.4.1.3 Constitute stakeholder management team
The stakeholder management team is constituted depending on the procurement route
chosen for the project and contract clauses and conditions. Specific responsibilities are
assigned to members of the stakeholder management team one of whom takes the role
of coordinating the entire process of stakeholder management (stakeholder management
leader-SML) at the inception stage. This would ideally comprise of the internal
stakeholders of the project such as the project manager, contractor, designers,
consultants, project quantity surveyors, contract administrators and client or client’s
representative and as it becomes necessary any other vital stakeholders.
8.4.1.4 Identify stakeholder characteristics and prepare preliminary classification
After identifying the stakeholders, their interests, concerns, and attributes with respect
to the project are identified. Based on these characteristics a preliminary classification
of the stakeholders is done. Therefore, the output from this sub-process is stakeholder
characteristics and preliminary classification.
8.4.2 Carryout stakeholder analyses – SMIS/A2
This is the second sub-process of stakeholder management at inception stage aimed at
carrying out stakeholder analyses. Here, the stakeholders’ characteristics are analysed in
order to enable stakeholder categorisation and inform further stakeholder management
steps. It consists of three sub-processes namely draw up stakeholder maps/matrices,
finalise stakeholder classification and draw up possible conflicts and coalition report
(Figure 8.11). These are explained in the following sub-sections.

199
TITLE:NODE: NO.: 0SMIS/
A2CARRY OUT STAKEHOLDER ANALYSES
1
CLASSIFY
STAKEHOLDERS
2
DRAW UP
STAKEHOLDER MAPS/
MATRICES
3
IDENTIFY POSSIBLE
CONFLICTS & COALITION
AMONG STAKEHOLDERS
Stakeholder classification at IS
Stakeholder management mission
Stakeholder
characteristics
&preliminary
classification
Stakeholder list at IS
General stakeholder maps/matrices
Possible conflicts
& coalitions at IS
Stakeholder management
leader at ISStakeholder
visualisation toolsStakeholder analyses techniques
Stakeholder management mission
Figure 8.11 Carryout stakeholder analyses – SMIS/A2
8.4.2.1 Classify stakeholders
The responsible member of the stakeholder management team uses the preliminary
stakeholder classification and general stakeholder maps/matrices to finalise stakeholder
classification. Therefore the main output from this sub-process is stakeholder
classification.
8.4.2.2 Draw up stakeholder maps/matrices
Based on the stakeholder characteristics and preliminary classification identified in
SMIS/A1, their, level of power, position and influence in the project are determined and
plotted into general maps or matrices. Stakeholder analyses techniques such as power
and predictability index, position index, interest/influence index are used to achieve this
and the output is general stakeholder map/matrices.
8.4.2.3 Identify possible conflicts and coalition among stakeholders
Using the stakeholder maps/matrices, possible conflicts and coalition among the project
stakeholders are predicted and documented. This is necessary to enable proactive
decisions on any surprises that the project may face due to stakeholders having
conflicting interests or forming coalitions to exert their interests as the project
progresses. This helps in the visualisation of stakeholder relationships in the project.

200
8.4.3 Map stakeholder dynamism – SMIS/A3
This is the third sub-process of SMIS which is aimed at visualising stakeholder
dynamism. This consists of three sub-processes including map stakeholder
relationships, map change in stakeholder interests and map change in stakeholder
influence in the project (Figure 8.12). These are explained in the following sub-sections.
TITLE:NODE: NO.: 0SMIS/
A3MAP STAKEHOLDER DYNAMISM
1
DRAW STAKEHOLDER
RELATION MAPS/
MATRICES
2
DRAW CHANGE IN
STAKEHOLDER
INTERESTS MAP
3
DRAW CHANGE IN
STAKEHOLDER
INFLUENCE MAP
Stakeholder
management mission
Stakeholder relation maps/matrices at IS
Change in stakeholder interest map at IS
Change in stakeholder
influence map at IS
Stakeholder
classification at IS
Possible conflicts and
coalition report at IS
General stakeholder
maps/matrices at IS
Stakeholder management leader
Stakeholder visualisation tools
Figure 8.12 Map stakeholders’ dynamism – SMIS/A3
8.4.3.1 Draw up stakeholder relationships maps/matrices at IS
In this sub-process, the relationships between different stakeholders as classified earlier
are mapped to create visual information of the relationships. Stakeholder classification,
general stakeholder maps/matrices and possible conflicts and coalition map are used to
execute this sub-process. Stakeholder visualisation tools are used as mechanism to
execute this process. The output from this sub-process is stakeholder relation
map/matrices.
8.4.3.2 Draw up change in stakeholder interests maps at IS
In order to create visual image of the likely changes in stakeholder interests during the
inception stage, a change in stakeholder interests’ map is created using mainly the
possible conflicts and coalition report. Stakeholder visualisation tools are used as
mechanism to execute this process. The output from this sub-process is the change in
stakeholder interests’ map.

201
8.4.3.3 Draw up change in stakeholder influence map at IS
Similarly, in order to create a visual image of the likely changes of stakeholder
influence during the inception stage, a change in stakeholder influence map is created
using a combination of the general stakeholder maps/matrices and possible conflicts and
coalition report. Stakeholder visualisation tools are used as mechanism to execute this
process. The output from this process is the change in stakeholder influence map.
8.4.4 Plan stakeholder engagement/empowerment strategies – SMIS/A4
This is the fourth sub-process of SMIS which is aimed at planning the appropriate
stakeholder engagement/empowerment strategies to be used in the project. It consists of
two sub-processes including plan stakeholder engagement/communication and plan
change tracking/feedback mechanisms (Figure 8.13). These are explained in the
following sub-sections.
TITLE:NODE: NO.: 0SMIS/
A4PLAN STAKEHOLDER ENGAGEMENT/EMPOWERMENT STRATEGIES
1
DRAW UP STAKEHOLDER
ENGAGEMENT AND
COMMUNICATION PLAN
2
PLAN CHANGE TRACKING AND
FEEDBACK MECHANISMS
Stakeholder management mission
Stakeholder relation
maps/matrices at IS
Change in stakeholder
influence map at IS
Change in stakeholder
interests map at IS
Stakeholder engagement/communication plan at IS
Feedback/change tracking plan at IS
Stakeholder engagement
techniques
Stakeholder management
leader
Feedback/Change
tracking mechanisms
Figure 8.13 Plan stakeholder engagement/empowerment strategies – SMIS/A4
8.4.4.1 Draw up stakeholder engagement/communication plan at IS
This sub-process is aims to decide stakeholder engagement and communication
strategies that are appropriate for the different stakeholders of the projects. As one
strategy appropriate for one stakeholder, may not be appropriate for other stakeholders.
Executing this sub-process depend on the content of stakeholder relation map/matrices,
change in stakeholder interests map and change in stakeholder influence map which are
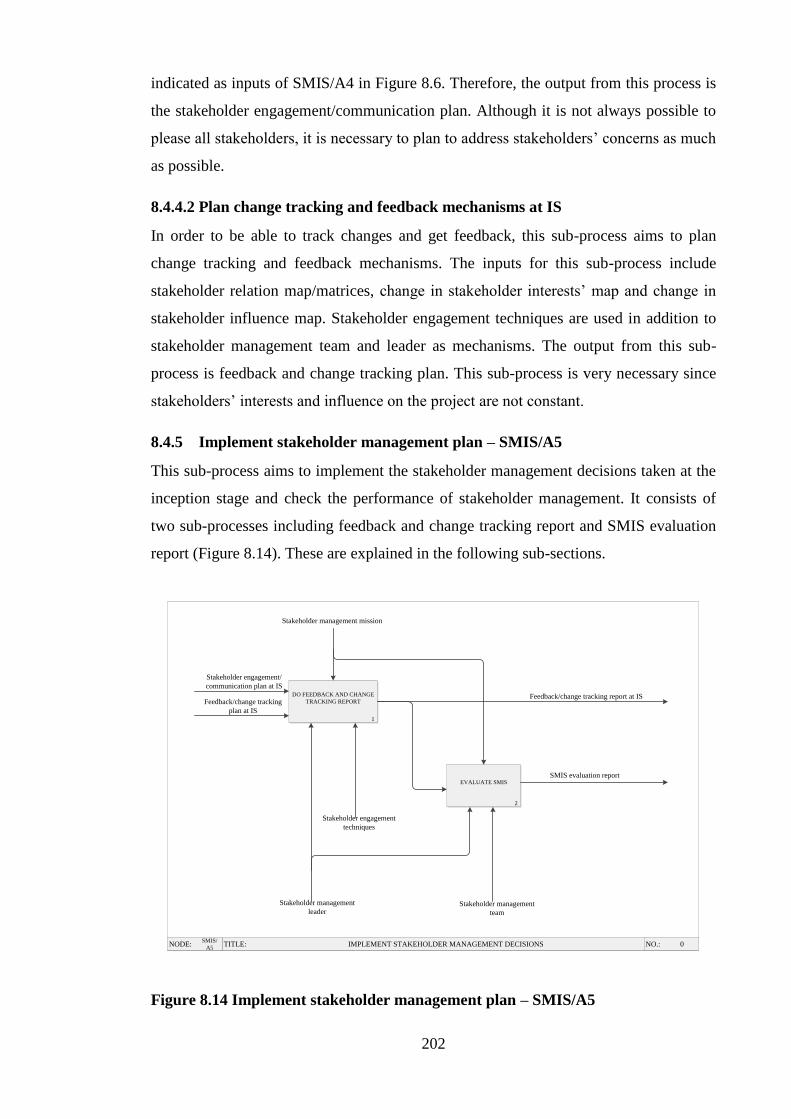
202
indicated as inputs of SMIS/A4 in Figure 8.6. Therefore, the output from this process is
the stakeholder engagement/communication plan. Although it is not always possible to
please all stakeholders, it is necessary to plan to address stakeholders’ concerns as much
as possible.
8.4.4.2 Plan change tracking and feedback mechanisms at IS
In order to be able to track changes and get feedback, this sub-process aims to plan
change tracking and feedback mechanisms. The inputs for this sub-process include
stakeholder relation map/matrices, change in stakeholder interests’ map and change in
stakeholder influence map. Stakeholder engagement techniques are used in addition to
stakeholder management team and leader as mechanisms. The output from this sub-
process is feedback and change tracking plan. This sub-process is very necessary since
stakeholders’ interests and influence on the project are not constant.
8.4.5 Implement stakeholder management plan – SMIS/A5
This sub-process aims to implement the stakeholder management decisions taken at the
inception stage and check the performance of stakeholder management. It consists of
two sub-processes including feedback and change tracking report and SMIS evaluation
report (Figure 8.14). These are explained in the following sub-sections.
TITLE:NODE: NO.: 0SMIS/
A5IMPLEMENT STAKEHOLDER MANAGEMENT DECISIONS
1
DO FEEDBACK AND CHANGE
TRACKING REPORT
2
EVALUATE SMIS
Stakeholder management mission
Stakeholder engagement/
communication plan at IS
Feedback/change tracking
plan at IS
Stakeholder engagement
techniques
Stakeholder management
leaderStakeholder management
team
Feedback/change tracking report at IS
SMIS evaluation report
Figure 8.14 Implement stakeholder management plan – SMIS/A5

203
8.4.5.1 Do feedback and change tracking report
In this sub-process, the stakeholder management decisions are implemented. The
stakeholder engagement/communication plan and feedback/change tracking plan are the
inputs. The outputs are feedback and change tracking reports and SMIS evaluation
report. The feedback and change tracking reports also serve as additional control for
SMIS/A5 in the event of any undesired outcome in the report.
8.4.5.2 Prepare SMIS evaluation report
This sub-process aims at producing an entire evaluation report for stakeholder
management at inception stage. The report compiles an account of what went well and
what did not go well in SMIS and captures vital lessons for the next stage (SMDS). In
doing so the entire actions taken in respect of stakeholder management at the inception
stage of the project are evaluated.
8.5 IDEF0 Model of SMDS
This section explains the processes of SMDS model for which the IDEFO diagrams
were shown in in Figure 8.5 for A0 and Figure 8.7 for A0 level sub-processes. Its node
index was presented in Table 8.3.
8.5.1 Identify stakeholder characteristics and project characteristics - SMDS/A1
This is the first stage of SMDS aimed at updating stakeholder characteristics,
stakeholder list and stakeholder management mission. Therefore the sub-processes are
to update stakeholder list at DS, update stakeholder characteristics at DS and update
stakeholder management mission at DS. The IDEF0 diagram for SMDS/A1 is presented
in Figure 8.15. The three sub-processes of SMDS/A1 are explained in the following
sub-sections.

204
TITLE:NODE: NO.: 0SMDS/
A1IDENTIFY STAKEHOLDER CHARACTERISTICS AND PROJECT CHARACTERISTICS AT DS
1
UPDATE STAKEHOLDER
MANAGEMENT MISSION AT
DS
2
UPDATE
STAKEHOLDER LIST AT
DS
3
UPDATE STAKEHOLDER
CHARACTERISTICS AND
PROFILE AT DS
Government policy and regulations
SMIS evaluation report
Stakeholder
management mission
Procurement route
Updated stakeholder management mission at DS
Updated stakeholder list at DS
Updated stakeholder
characteristics and
attributes
Stakeholder management team Stakeholder management leader
Stakeholder list at IS
Stakeholder engagement
techniques
Figure 8.15 Identify stakeholder characteristics and project characteristics -
SMDS/A1
8.5.1.1 Update stakeholder management mission at DS
In this sub-process the stakeholder management mission is updated in line with the
project scope and client needs to ensure a smooth design process for the project. In
addition to the procurement route and contract conditions, government policies and
regulations relevant to design of construction projects acts as control in this sub-process.
The inputs in this process are SMIS evaluation report and stakeholder management
mission while the output is stakeholder management mission at DS.
8.5.1.2 Update stakeholder list at DS
As stakeholder come and go during the project life cycle, it is crucial to make sure that
stakeholder list is updated and all are consulted while the project is designed. The
output from this sub-process is updated stakeholder list at DS.
8.5.1.3 Update stakeholder characteristics and profile at DS
Similarly, in line with the dynamism of stakeholders, the stakeholder characteristics are
updated in this sub-process. The output from this sub-process is updated stakeholder
characteristics.

205
8.5.2 Carryout stakeholder analyses – SMDS/A2
This is the second process in SMDS which aims to analyse the project stakeholders
based on their updated information. It consists of three sub-processes including updated
stakeholder maps at DS, updated possible conflicts and coalition report and updated
stakeholder classification. The sub-processes are shown in the IDEF0 diagram for
SMDS/A2 (Figure 8.16) and discussed in the following sub-sections.
TITLE:NODE: NO.: 0SMDS/
A2CARRY OUT STAKEHOLDER ANALYSES AT DS
1
UPDATE STAKEHOLDER
CLASSIFICATION AT DS
2
UPDATE GENERAL
STAKEHOLDER MAPS/
MATRICES AT DS
3
UPDATE POSSIBLE
CONFLICTS AND
COALITIONS AT DS
Updated stakeholder management mission at DS
Updated stakeholder list
at DS
Updated stakeholder
characteristics & attributes
at DS
Updated stakeholder classification at DS
Updated general stakeholder maps/matrices at DS
Updated possible conflicts and
coalition report at DS
Stakeholder analyses techniquesStakeholder management leader
Figure 8.16 Carryout stakeholder analyses – SMDS/A2
8.5.2.1 Update stakeholder classification at DS
This sub-process processes the updated stakeholder list and stakeholder characteristics
at the DS as inputs. The out from this sub-process is updated stakeholder classification
at the DS.
8.5.2.2 Update general stakeholder maps/matrices at DS
This sub-process aims to update general stakeholder maps to reflect the objective of
stakeholder management at the design stage of construction projects. The inputs for this
sub-process are updated stakeholder list at DS and updated stakeholder characteristics at
DS. The output from this sub-process is updated stakeholder maps showing their current
relative powers, interests, predictability etc.
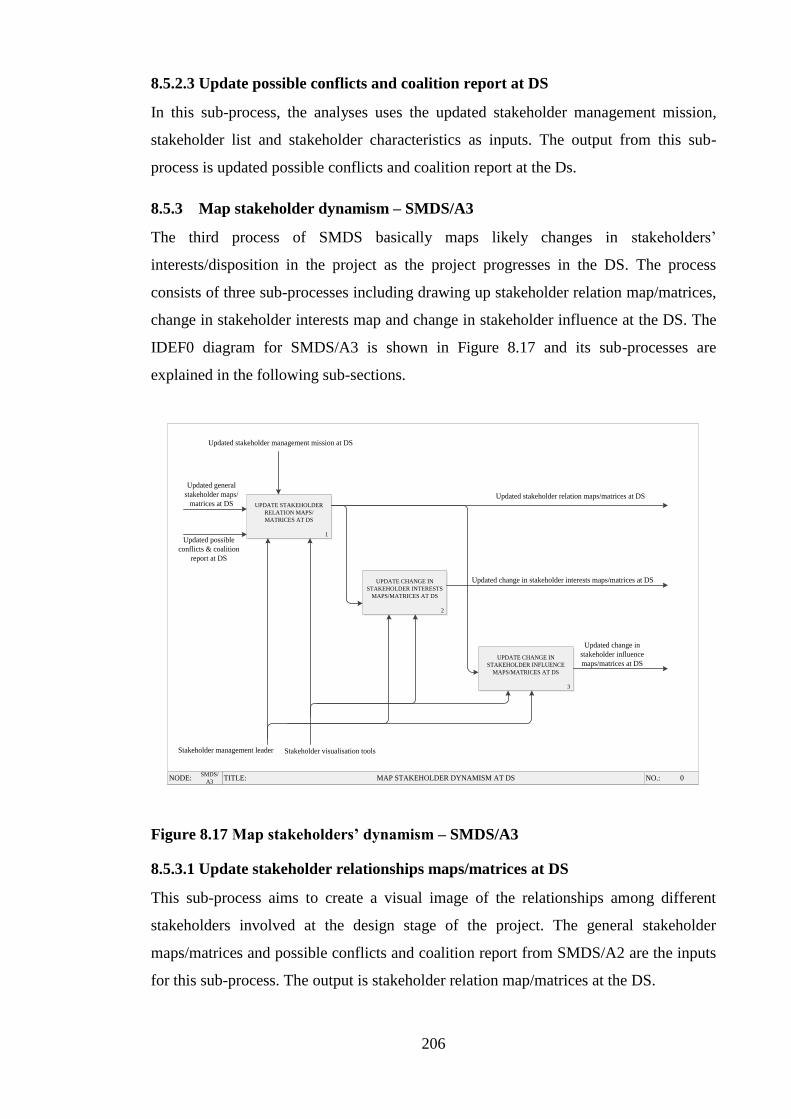
206
8.5.2.3 Update possible conflicts and coalition report at DS
In this sub-process, the analyses uses the updated stakeholder management mission,
stakeholder list and stakeholder characteristics as inputs. The output from this sub-
process is updated possible conflicts and coalition report at the Ds.
8.5.3 Map stakeholder dynamism – SMDS/A3
The third process of SMDS basically maps likely changes in stakeholders’
interests/disposition in the project as the project progresses in the DS. The process
consists of three sub-processes including drawing up stakeholder relation map/matrices,
change in stakeholder interests map and change in stakeholder influence at the DS. The
IDEF0 diagram for SMDS/A3 is shown in Figure 8.17 and its sub-processes are
explained in the following sub-sections.
TITLE:NODE: NO.: 0SMDS/
A3MAP STAKEHOLDER DYNAMISM AT DS
1
UPDATE STAKEHOLDER
RELATION MAPS/
MATRICES AT DS
2
UPDATE CHANGE IN
STAKEHOLDER INTERESTS
MAPS/MATRICES AT DS
3
UPDATE CHANGE IN
STAKEHOLDER INFLUENCE
MAPS/MATRICES AT DS
Updated stakeholder management mission at DS
Updated general
stakeholder maps/
matrices at DSUpdated stakeholder relation maps/matrices at DS
Updated change in stakeholder interests maps/matrices at DS
Updated change in
stakeholder influence
maps/matrices at DS
Stakeholder management leader Stakeholder visualisation tools
Updated possible
conflicts & coalition
report at DS
Figure 8.17 Map stakeholders’ dynamism – SMDS/A3
8.5.3.1 Update stakeholder relationships maps/matrices at DS
This sub-process aims to create a visual image of the relationships among different
stakeholders involved at the design stage of the project. The general stakeholder
maps/matrices and possible conflicts and coalition report from SMDS/A2 are the inputs
for this sub-process. The output is stakeholder relation map/matrices at the DS.

207
8.5.3.2 Update change in stakeholder interests maps/matrices at DS
In this sub-process, the likely changes in stakeholder interests are mapped. The inputs
here are the stakeholder classification and possible conflicts and coalition report from
SMDS/A2. The output from this sub-process is change in stakeholder interests’ map at
the DS.
8.5.3.3 Update change in stakeholder influence maps/matrices at DS
The aim of this sub-process is to map the likely changes in the influence of stakeholders
on each other and on the project. The inputs for this sub-process are stakeholder general
maps, stakeholder classification and possible conflicts and coalition report from
SMDS/A2. The output from this sub-process is change in stakeholder influence
maps/matrices at the DS.
8.5.4 Plan stakeholder engagement/empowerment strategies – SMDS/A4
The aim of this process is to decide and plan appropriate engagement and
communication strategies for the different stakeholders of the project. The process
consists of three sub-processes namely plan stakeholder consultation, assign
responsibilities and plan feedback and change tracking mechanisms. The IDEF0
diagram for this process is shown in Figure 8.18 and the three sub-processes are
explained in the following sub-sections.

208
TITLE:NODE: NO.: 0SMDS/
A4PLAN STAKEHOLDER ENGAGEMENT/EMPOWERMENT STRATEGIES AT DS
1
DRAW UP STAKEHOLDER
CONSULTATION PLAN AT
DS
2
SPECIFY RESPONSIBILITIES
FOR STAKEHOLDER
MANAGEMENT TEAM
MEMBERS
3
PLAN CHANGE TRACKING
AND FEEDBACK
MECHANISMS AT DS
Updated stakeholder management mission at DS
Updated stakeholder consultation plan at DS
Stakeholder management responsibilities at DS
Feedback and change tracking
plan at DS
Change tracking and feedback mechanismsStakeholder management leader
Stakeholder engagement techniques
Updated change in
stakeholder influence
maps/matrices at DS
Updated change in
stakeholder interests
maps/matrices at DS
Figure 8.18 Plan stakeholder engagement/empowerment strategies – SMDS/A4
8.5.4.1 Plan stakeholder consultation at DS
This sub-process aims to appropriate stakeholder consultation strategies for the different
stakeholders of the project. The inputs for this sub-process include change in
stakeholder interests’ map and change in stakeholder influence map. Stakeholder
engagement techniques are used as additional mechanisms as shown in Figure 8.7. The
output from this process is stakeholder consultation plan at DS.
8.5.4.2 Assign engagement responsibilities at DS
The aim of this sub-process is to assign responsibilities to the members of the
stakeholder management team for engaging and consulting different stakeholders at the
DS. The main input for this sub-process is the stakeholder relation map from SMDS/A3.
8.5.4.3 Plan change tracking and feedback mechanisms at DS
The aim of this sub-process is to plan change tracking and feedback mechanisms at the
DS. The inputs for this sub-process include stakeholder relation map/matrices, change
in stakeholder interests’ map and change in stakeholder influence map from SMDS/A3.
Stakeholder engagement techniques are used in addition to stakeholder management
team and leader as mechanisms. The output from this sub-process is feedback and
change tracking plan at DS.
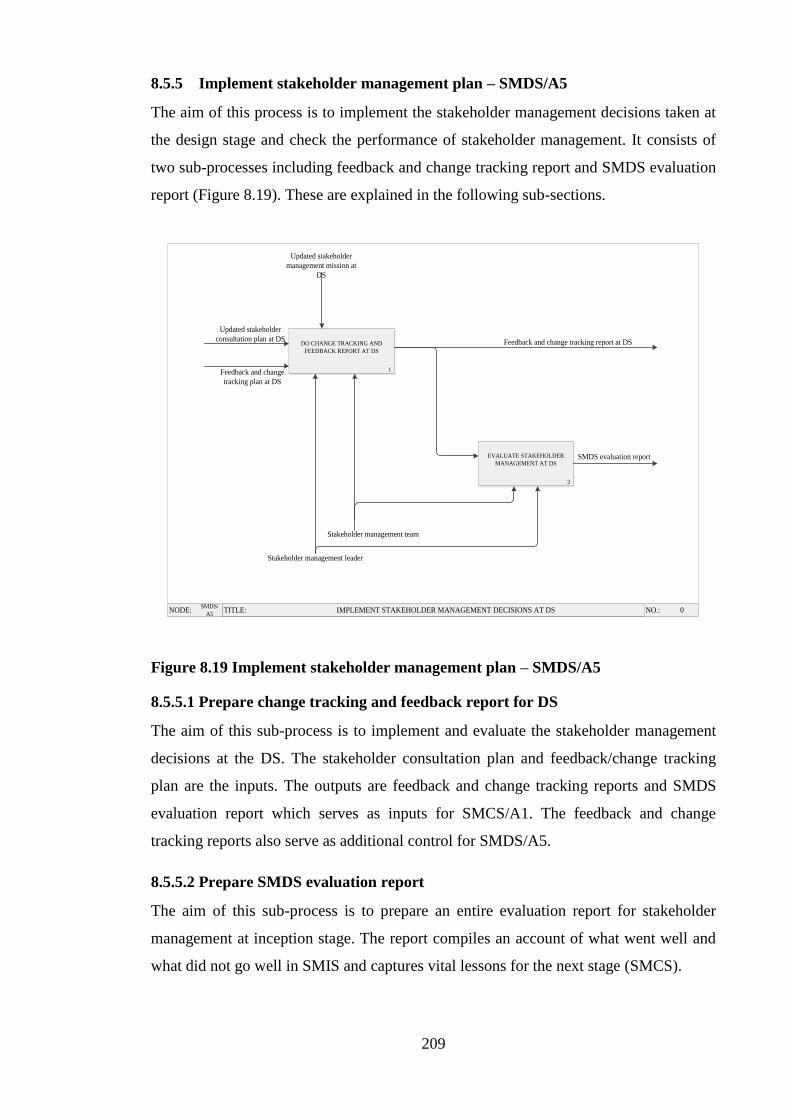
209
8.5.5 Implement stakeholder management plan – SMDS/A5
The aim of this process is to implement the stakeholder management decisions taken at
the design stage and check the performance of stakeholder management. It consists of
two sub-processes including feedback and change tracking report and SMDS evaluation
report (Figure 8.19). These are explained in the following sub-sections.
TITLE:NODE: NO.: 0SMDS/
A5IMPLEMENT STAKEHOLDER MANAGEMENT DECISIONS AT DS
1
DO CHANGE TRACKING AND
FEEDBACK REPORT AT DS
2
EVALUATE STAKEHOLDER
MANAGEMENT AT DS
Updated stakeholder
management mission at
DS
Stakeholder management team
Stakeholder management leader
Feedback and change tracking report at DS
SMDS evaluation report
Feedback and change
tracking plan at DS
Updated stakeholder
consultation plan at DS
Figure 8.19 Implement stakeholder management plan – SMDS/A5
8.5.5.1 Prepare change tracking and feedback report for DS
The aim of this sub-process is to implement and evaluate the stakeholder management
decisions at the DS. The stakeholder consultation plan and feedback/change tracking
plan are the inputs. The outputs are feedback and change tracking reports and SMDS
evaluation report which serves as inputs for SMCS/A1. The feedback and change
tracking reports also serve as additional control for SMDS/A5.
8.5.5.2 Prepare SMDS evaluation report
The aim of this sub-process is to prepare an entire evaluation report for stakeholder
management at inception stage. The report compiles an account of what went well and
what did not go well in SMIS and captures vital lessons for the next stage (SMCS).

210
8.6 IDEF0 Model of SMCS
This section explains the processes of SMCS model for which the IDEFO diagrams
were shown in in Figure 8.5 for A0 processes and Figure 8.8 for A0 level sub-processes.
Its node index was presented in Table 8.3. The five main processes are explained in the
following sub-sections.
8.6.1 Identify stakeholder characteristics and project characteristics - SMCS/A1
This is the first stage of SMCS aimed at updating stakeholder list, drawing up
stakeholder priority list, and writing a report on potential impact of construction
activities on stakeholders. Therefore the sub-processes are updated stakeholder list at
CS, stakeholder priority list and report on potential impact of construction activities on
stakeholders. The IDEF0 diagram for SMCS/A1 is presented in Figure 8.20. The three
sub-processes of SMCS/A1 are explained in the following sub-sections.
TITLE:NODE: NO.: 0SMCS/
A1IDENTIFY STAKEHOLDER CHARACTERISTICS AND PROJECT CHARACTERISTICS AT CS
1
IDENTIFY POTENTIAL
IMPACT OF
CONSTRUCTION
ACTIVITIES
2
UPDATE STAKEHOLDER LIST AND PROFILES AT CS
3
DRAW UP
PRELIMINARY
STAKEHOLDER
PRIORITY LIST
Preliminary stakeholder priority list
Updated stakeholder list and profiles
Report on potential impact of construction activities
Procurement route Contract conditions
Project design and related documents
Feedback and change tracking report at DS
SMDS evaluation report
Stakeholder management leader
Stakeholder management team
Figure 8.20 Identify stakeholder characteristics and project characteristics -
SMCS/A1
8.6.1.1 Prepare report on potential impact of construction activities on
stakeholders
The aim of this sub-process is to make sure that the potential impacts of proposed
construction methods (activities) on the stakeholders are adequately reported. The

211
inputs for this sub-process are updated stakeholder management mission from DS,
SMDS evaluation report and feedback/change tracking report from DS. In addition to
the procurement route and contract conditions, this sub-process is controlled by project
design and production documents. The output from this sub-process is report on
potential impacts of construction activities on stakeholders.
8.6.1.2 Update stakeholder list and profiles at CS
In this sub-process, the stakeholder list is updated to include all stakeholders who were
not there at the inception and design stages of the project. The additional control for this
sub-process is project design and related documents. The output from this sub-process is
updated stakeholder list at CS.
8.6.1.3 Prepare preliminary stakeholder priority list at CS
The aim of this sub-process is to prepare a preliminary priority report on stakeholders. If
a preliminary priority report can be prepared, it will be easier for the stakeholders to be
prioritised during stakeholder analyses. The output from this sub-process is preliminary
stakeholder priority list.
8.6.2 Carryout stakeholder analyses – SMCS/A2
This is the second process in SMCS which aims to analyse the project stakeholders
based on their updated information. It consists of three sub-processes including updated
general stakeholder maps/matrices at CS, updated stakeholder classification at CS and
stakeholder priority and impact report. The sub-processes are shown in the IDEF0
diagram for SMCS/A2 (Figure 8.21) and explained in the following sub-sections.

212
TITLE:NODE: NO.: 0SMCS/
A2CARRY OUT STAKEHOLDER ANALYSES AT CS
1
UPDATE
STAKEHOLDER
CLASSIFICATION
AT CS
2
FINALISE
STAKEHOLDER
PRIORITY AT CS
3
UPDATE
STAKEHOLDER
MAPS AND
MATRICES AT CS
Report on potential
impact of construction
activities
Preliminary stakeholder
priority list
Updated stakeholder
list at CS
Updated stakeholder classification at CS
Stakeholder priority and impact report at CS
Updated general
stakeholder maps/matrices
at CS
Stakeholder analyses
techniques
Stakeholder visualisation toolsStakeholder management
leader
Figure 8.21 Carryout stakeholder analyses – SMCS/A2
8.6.2.1 Update stakeholder classification at CS
The aim of this sub-process is to make sure that and updated stakeholder classification
reflecting all the stakeholders at the construction stage is made. The inputs for this sub-
process are updated stakeholder list at CS and preliminary stakeholder priority list from
SMCS/A1. The output from this sub-process is updated stakeholder classification at CS.
8.6.2.2 Prepare stakeholder priority and impact report at CS
This sub-process aims to finalise stakeholder priority at the CS. The inputs for this sub-
process are report on potential impacts of construction activities on stakeholders and
preliminary stakeholder priority list from SMCS/A1. The output from this sub-process
is stakeholder priority and impact report.
8.6.2.3 Prepare updated stakeholder maps/matrices at CS
This sub-process aims to prepare an update of general stakeholder maps/matrices
showing their levels of power, predictability, interest and influence at the CS. The
inputs for this sub-process include preliminary stakeholder priority list, report on
potential impact of construction activities on stakeholders and updated stakeholder list

213
from SMCS/A1. The output from this sub-process is general stakeholder maps/matrices
at CS.
8.6.3 Map stakeholder dynamism – SMCS/A3
The third process of SMCS basically aims to map likely changes in stakeholders’
interests/disposition in the project as the project progresses in the CS. The process
consists of three sub-processes including drawing up change in stakeholder relation
map/matrices, change in stakeholder interests map and change in stakeholder influence
at the CS. The IDEF0 diagram for SMCS/A3 is shown in Figure 8.22 and its sub-
processes are explained in the following sub-sections.
TITLE:NODE: NO.: 0SMCS/
A3MAP STAKEHOLDER DYNAMISM AT CS
1
UPDATE CHANGE IN
STAKEHOLDER RELATION
MAPS/MATRICES AT CS
2
UPDATE CHANGE IN
STAKEHOLDER INTERESTS
MAPS/MATRICES AT CS
3
UPDATE CHANGE IN
STAKEHOLDER INFLUENCE
MAPS/MATRICES AT CS
Updated change in stakeholder relation maps/matrices at CS
Updated change in stakeholder interests maps/matrices at CS
Updated change in
stakeholder influence
maps/matrices at CS
Stakeholder management leader
Stakeholder visualisation tools
Updated stakeholder
classification at CS
Updated general
stakeholder maps/
matrices at CS
Report on potential impact of construction activities
Figure 8.22 Map stakeholders’ dynamism – SMCS/A3
8.6.3.1 Update change in stakeholder relation map at CS
This sub-process aims to create a visual image of likely changes in the relationships
among different stakeholders involved at the construction stage of the project. The
general stakeholder maps/matrices and stakeholder priority and impact report from
SMCS/A2 are the inputs for this sub-process. The output is change in stakeholder
relation map/matrices at the CS.

214
8.6.3.2 Update change in stakeholder interests’ map at CS
This sub-process aims to map the likely changes in stakeholder interests. The inputs
here are the general stakeholder maps/matrices, updated stakeholder classification and
stakeholder priority and impact report from SMCS/A2. The output from this sub-
process is change in stakeholder interests’ map at the CS.
8.6.3.3 Update change in stakeholder influence map at CS
The aim of this sub-process is to map the likely changes in the influence that
stakeholders would have on each other and on the project at the construction stage. The
inputs for this sub-process are the general stakeholder maps/matrices and stakeholder
priority and impact report from SMCS/A2. The output from this sub-process is change
in stakeholder influence maps/matrices at the CS.
8.6.4 Plan stakeholder engagement/empowerment strategies – SMCS/A4
In this process appropriate engagement and communication strategies for the different
stakeholders of the project at the CS are decided. The process consists of two sub-
processes namely plan stakeholder engagement/communication strategies and plan
feedback and change tracking mechanisms at the CS. The IDEF0 diagram for this
process (SMCS/A4) is shown in Figure 8.23 and the two sub-processes are explained in
the following sub-sections.
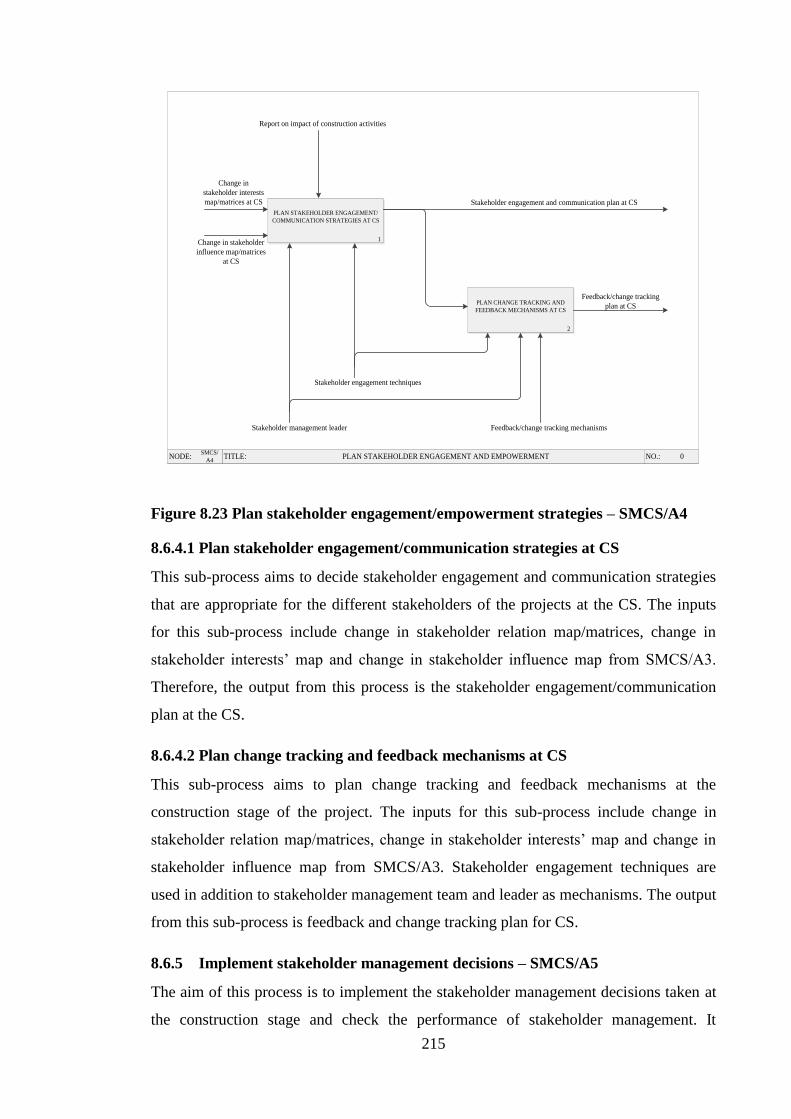
215
TITLE:NODE: NO.: 0SMCS/
A4PLAN STAKEHOLDER ENGAGEMENT AND EMPOWERMENT
1
PLAN STAKEHOLDER ENGAGEMENT/
COMMUNICATION STRATEGIES AT CS
2
PLAN CHANGE TRACKING AND
FEEDBACK MECHANISMS AT CS
Stakeholder engagement and communication plan at CS
Feedback/change tracking
plan at CS
Report on impact of construction activities
Feedback/change tracking mechanisms
Stakeholder engagement techniques
Stakeholder management leader
Change in
stakeholder interests
map/matrices at CS
Change in stakeholder
influence map/matrices
at CS
Figure 8.23 Plan stakeholder engagement/empowerment strategies – SMCS/A4
8.6.4.1 Plan stakeholder engagement/communication strategies at CS
This sub-process aims to decide stakeholder engagement and communication strategies
that are appropriate for the different stakeholders of the projects at the CS. The inputs
for this sub-process include change in stakeholder relation map/matrices, change in
stakeholder interests’ map and change in stakeholder influence map from SMCS/A3.
Therefore, the output from this process is the stakeholder engagement/communication
plan at the CS.
8.6.4.2 Plan change tracking and feedback mechanisms at CS
This sub-process aims to plan change tracking and feedback mechanisms at the
construction stage of the project. The inputs for this sub-process include change in
stakeholder relation map/matrices, change in stakeholder interests’ map and change in
stakeholder influence map from SMCS/A3. Stakeholder engagement techniques are
used in addition to stakeholder management team and leader as mechanisms. The output
from this sub-process is feedback and change tracking plan for CS.
8.6.5 Implement stakeholder management decisions – SMCS/A5
The aim of this process is to implement the stakeholder management decisions taken at
the construction stage and check the performance of stakeholder management. It

216
consists of two sub-processes including feedback and change tracking report and SMCS
evaluation report shown in Figure 8.24. The two sub-processes are explained in the
following sub-sections.
TITLE:NODE: NO.: 0SMCS/
A5IMPLEMENT STAKEHOLDER MANAGEMNET DECISIONS AT CS
1
DO FEEDBACK AND CHANGE
TRACKING REPORT AT CS
2
EVALUATE STAKEHOLDER
MANAGEMENT AT CS
SMCS evaluation report
Feedback/change tracking report at CS
Report on potential
impact of construction
activities
Stakeholder engagement/
communication plan at CS
Feedback/change
tracking plan at CS
Stakeholder management leader
Stakeholder
management team
Figure 8.24 Implement stakeholder management decisions – SMCS/A5
8.6.5.1 Prepare feedback and change tracking report for CS
This sub-process aims to implement and evaluate the stakeholder management decisions
at the CS. The stakeholder engagement/communication plan and feedback/change
tracking plan are the inputs. The output here is feedback and change tracking report at
the CS. The feedback and change tracking reports also serve as additional control for
SMCS/A5.
8.6.5.2 Prepare SMDS evaluation report at CS
The aim of this sub-process is to prepare an evaluation report for stakeholder
management at the construction stage. The report compiles an account of what went
well and what did not go well in SMCS and captures vital lessons for the next stage
(SMOS).

217
8.7 IDEF0 Model of SMOS
This section explains the processes of SMOS model. The IDEFO diagrams for SMOS
are shown in in Figure 8.5 for A0 level and Figure 8.9 for the A0 level sub-processes.
Its node index was presented in Table 8.3. The five main processes are explained in the
following sub-sections.
8.7.1 Identify stakeholder characteristics and project characteristics at –
SMOS/A1
This is the first stage of SMOS aimed at obtaining relevant information about the
stakeholders and end product. It consists of three sub-processes including Preparing end
product use/management plan, preliminary end users’ expectation report and
preliminary end users’ classification. The IDEF0 diagram for SMOS/A1 is presented in
Figure 8.25 and the three sub-processes are explained in the following sub-sections.
TITLE:NODE: NO.: 0SMOS/
A1IDENTIFY STAKEHOLDER CHARACTERISTICS AND PROJECT CHARACTERISITCS AT OS
1
DRAW UP END PRODUCT
USE/MANAGEMENT PLAN
2
DO PRELIMINARY END
USER CLASSIFICATION
3
IDENTIFY PRELIMINARY END
USERS' EXPECTATIONS AT OS
Government policy/regulationsLease agreement/contract
Feedback and change
tracking report at CS
SMCS evaluation
report
Stakeholder management leader
End users’ representative
End product use/management plan
Preliminary end user classification
Preliminary end user
expectations
Figure 8.25 Identify stakeholder characteristics and project characteristics at –
SMOS/A1
8.7.1.1 Prepare end product use/management plan
The aim of this sub-process is to prepare user manual (guide) and end product (Facility)
management plan at the operation stage. The inputs for this sub-process are SMCS
evaluation report and feedback/tracking report from CS. The controls are lease

218
agreement/contract and government policy/regulations. The output from this sub-
process is end product use/management plan.
8.7.1.2 Prepare preliminary end users’ classification
The aim of this process is to identify the end users and prepare their preliminary
classification. The output from this sub-process is therefore preliminary end users’
classification. It helps the facility management team to know the end users of the project
in more depth.
8.7.1.3 Prepare preliminary end users’ expectation report
This sub-process aims to prepare preliminary end users’ expectations from the product
or facility. The input for this sub-process is feedback/change tracking report from CS.
The output from this sub-process is preliminary end users’ expectation report.
8.7.2 Carryout stakeholder analyses – SMOS/A2
This second process in SMOS aims to analyse the project stakeholders based on their
updated information. It consists of three sub-processes including finalised stakeholder
(end users) expectation report at OS, finalised stakeholder (end users) classification at
OS and possible conflicts and coalition report at OS. The sub-processes are shown in
the IDEF0 diagram for SMOS/A2 (Figure 8.26) and explained in the following sub-
sections.

219
TITLE:NODE: NO.: 0SMOS/
A2CARRY OUT STAKEHOLDER ANALYSES AT OS
1
FINALISE END USERS'
EXPECTATIONS
2
FINALISE END USERS'
CLASSIFICATION
3
IDENTIFY POSSIBLE
CONFLICTS AND
COALITION AT OS
End product use/management plan
Preliminary end user
expectations report
Preliminary end user
classification
Stakeholder management leader
End user expectation report
End user classification
Possible conflict and
coalition report at OS
End user representative
Stakeholder analyses
techniques
Figure 8.26 Carryout stakeholder analyses – SMOS/A2
8.7.2.1 Prepare final end-users’/stakeholders’ expectation report at OS
The aim of this sub-process is to prepare a report detailing the expectation of
stakeholders (owners/financiers and end users) from the facility created at the OS. The
inputs of this sub-process are end product use/management plan, preliminary end users’
classification and preliminary stakeholder expectation report from SMOS/A1. The
output from this sub-process is stakeholder expectation report.
8.7.2.2 Finalise end users’ classification at OS
The aim of this sub-process is to finalise the end users’ classification at the OS. The
inputs of this sub-process are preliminary end users’ classification and expectation
report from SMOS/A1. The output from this sub-process is end users’ classification at
OS.
8.7.2.3 Prepare possible conflicts and coalition report at OS
The aim of this sub-process is to prepare a report on the possible conflicts and coalition
among the stakeholders involved at the OS of the project when the end product or
facility created is being put to use. The inputs for this sub-process are preliminary end

220
users’ expectation report and end product use/management plan from SMOS/A1. The
output from this sub-process is possible conflicts and coalition report at OS.
8.7.3 Map stakeholder dynamism – SMOS/A3
This process of SMOS basically aims to map likely changes in stakeholders’ interests
and expectation from the end product (or facility created) as it is being put to use at the
OS. The process consists of two sub-processes including drawing up change in
stakeholder expectation map/matrices and change in stakeholder relation map/matrices.
The IDEF0 diagram for SMOS/A3 is shown in Figure 8.27 and its sub-processes are
explained in the following sub-sections.
TITLE:NODE: NO.: 0SMOS/
A3MAP STAKEHOLDER DYNAMISM AT OS
1
MAP POSSIBLE CHANGE IN
END USERS'
EXPECTATIONS
2
DRAW UP END USERS'
RELATION MAPS/MATRICES
End product use/management plan
Possible conflicts and
coalition report at OS
Stakeholder
expectation report at
OS
Stakeholder management leader
Stakeholder visualisation tools
Possible change in end user expectation map
End user relation maps/matrices
Figure 8.27 Map stakeholders’ dynamism – SMOS/A3
8.7.3.1 Map possible change in stakeholder expectation at OS
The aim of this sub-process is to map possible changes in the end users’ and owners
expectation from the project as its end product is being put to use during the operation
stage. The inputs for this sub-process are stakeholder expectation report and possible
conflicts and coalition report from SMOS/A2. The output from this sub-process is
change in stakeholders’ expectation maps/matrices at OS.
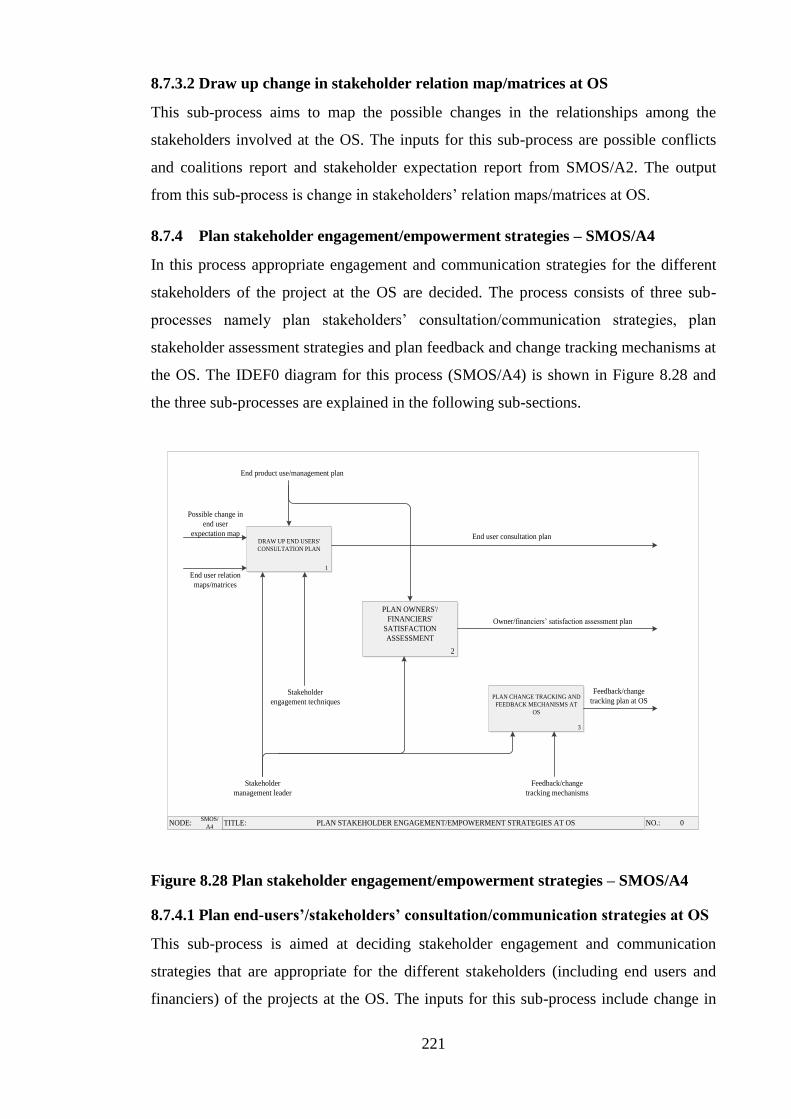
221
8.7.3.2 Draw up change in stakeholder relation map/matrices at OS
This sub-process aims to map the possible changes in the relationships among the
stakeholders involved at the OS. The inputs for this sub-process are possible conflicts
and coalitions report and stakeholder expectation report from SMOS/A2. The output
from this sub-process is change in stakeholders’ relation maps/matrices at OS.
8.7.4 Plan stakeholder engagement/empowerment strategies – SMOS/A4
In this process appropriate engagement and communication strategies for the different
stakeholders of the project at the OS are decided. The process consists of three sub-
processes namely plan stakeholders’ consultation/communication strategies, plan
stakeholder assessment strategies and plan feedback and change tracking mechanisms at
the OS. The IDEF0 diagram for this process (SMOS/A4) is shown in Figure 8.28 and
the three sub-processes are explained in the following sub-sections.
TITLE:NODE: NO.: 0SMOS/
A4PLAN STAKEHOLDER ENGAGEMENT/EMPOWERMENT STRATEGIES AT OS
1
DRAW UP END USERS'
CONSULTATION PLAN
2
PLAN OWNERS'/
FINANCIERS'
SATISFACTION
ASSESSMENT
3
PLAN CHANGE TRACKING AND
FEEDBACK MECHANISMS AT
OS
Feedback/change
tracking mechanisms
End product use/management plan
End user consultation plan
Owner/financiers’ satisfaction assessment plan
Feedback/change
tracking plan at OS
Possible change in
end user
expectation map
End user relation
maps/matrices
Stakeholder
management leader
Stakeholder
engagement techniques
Figure 8.28 Plan stakeholder engagement/empowerment strategies – SMOS/A4
8.7.4.1 Plan end-users’/stakeholders’ consultation/communication strategies at OS
This sub-process is aimed at deciding stakeholder engagement and communication
strategies that are appropriate for the different stakeholders (including end users and
financiers) of the projects at the OS. The inputs for this sub-process include change in
222
stakeholder relation map/matrices and change in stakeholder expectation maps/matrices
from SMOS/A3. Therefore, the output from this process is the stakeholder
consultation/communication plan at the OS.
8.7.4.2 Plan stakeholder assessment strategies at OS
The aim of this sub-process is to plan the strategies through which different
stakeholders of the project involved at the operation stages will be assessed to ascertain
their level of satisfaction with the facility created. The inputs for this sub-process are
change in stakeholder expectation maps/matrices and change in stakeholder relation
maps/matrices from SMOS/A3. The mechanisms of this process include End users,
stakeholder management leader and stakeholder engagement techniques. The output
from this process is stakeholder assessment strategies at OS.
8.7.4.3 Plan change tracking and feedback mechanisms at OS
This sub-process is aimed at planning change tracking and feedback mechanisms at the
operation stage of the project. The inputs for this sub-process include change in
stakeholder expectation map/matrices and change in stakeholder relation map
and/matrices from SMOS/A3. Stakeholder engagement techniques including feedback
and change tracking mechanisms are used in addition to stakeholder management team,
leader and end users as mechanisms. The output from this sub-process is feedback and
change tracking plan for OS.
8.7.5 Implement stakeholder management decisions - SMOS/A5
The aim of this process is to implement the stakeholder management decisions taken at
the operation stage and check the performance and satisfaction of stakeholder with the
created facility. It consists of three sub-processes including users’ satisfaction report,
owner/financiers’ satisfaction report and SMOS evaluation report shown in Figure 8.29.
The two sub-processes are explained in the following sub-sections.

223
TITLE:NODE: NO.: 0SMOS/
A5IMPLEMENT STAKEHOLDER MANAGEMENT DECISIONS AT OS
1
DO USERS' SATISFACTION
REPORT
2
DO OWNERS'/FINACIERS'
SATISFACTION REPORT
3
EVALUATE STAKEHOLDER
MANAGEMENT AT OS
Feedback/change
tracking plan at OS
End user
consultation plan
End product use/management plan
Users’ satisfaction report
Owners/financiers’ satisfaction report
SMOS evaluation
report
Stakeholder
management leader
Stakeholder management
team
Figure 8.29 Implement stakeholder management decisions - SMOS/A5
8.7.5.1 Do users’ satisfaction report at OS
This sub-process aims to assess users’ satisfaction with the facility created as results of
the project during the operation stage of the project. The inputs for this sub-process are
stakeholder consultation and communication plan and feedback/change tracking plan
from SMOS/A4. It has stakeholder engagement techniques as additional mechanism.
The output from this sub-process is users’ satisfaction report.
8.7.5.2 Do owners/financiers’ satisfaction report at OS
The aim of this sub-process is to assess the level of satisfaction of the owners or
financiers of the project with the facility created at the operation stage. The inputs for
this sub-process are owners’/financiers’ assessment plan and feedback/change tracking
plan from SMOS/A4. The output from this sub-process is owners’/financiers’
satisfaction report at OS.
8.7.5.3 Prepare SMOS evaluation report
The aim of this sub-process which is the last is to prepare an evaluation report for
stakeholder management at the operation stage. The report compiles an account of what
went well and what did not go well in SMOS and captures vital lessons throughout the
project’s lifecycle for future projects.

224
8.8 Chapter Summary
This chapter has presented the life cycle based framework for stakeholder management
in construction projects developed using IDEF0 process modelling, in order to increase
the propensity for achieving success in construction projects. The life cycle based
framework consists of four interdependent parts representing framework for stakeholder
management at Inception (SMIS), Design (SMDS), Construction (SMCS) and
Operation (SMOS) stages of construction projects. These four interdependent and
continuous parts of the framework are aimed at providing a comprehensive, simple and
easy to use guide for stakeholder management throughout the life cycle of construction
projects.
This chapter has explained all processes and their main sub-processes covered in SMIS,
SMDS, SMCS and SMOS using IDEF0 diagrams developed for the processes and their
main sub-process. However, the life cycle based framework for stakeholder
management in construction projects cannot be complete unless it is
validated/evaluated. Therefore, it was decided to validate/evaluate the framework with
practicing construction industry professionals. The results of the framework
validation/evaluation are presented in the next chapter.
225
9. CHAPTER NINE: VALIDATION/EVALUATION OF THE
FRAMEWORK FOR STAKEHOLDER MANAGEMENT IN
CONSTRUCTION PROJECTS
9.1 Introduction
This chapter presents the validation/evaluation of the life cycle based framework for
stakeholder management in construction projects (this would be referred to
subsequently as ‘the framework’) presented in chapter 8. It begins with an explanation
of the aim and objectives of validating/evaluating the framework. The aim and
objectives are based on the intended purposes of the framework which include ensuring
smooth running of projects to successful completion. This is followed by an explanation
of the methodology adopted for the validation/evaluation process including qualitative
and quantitative approaches in face to face interviews with the validators. Next is
presentation of the analyses of the quantitative and qualitative data collected during the
framework validation/evaluation process. Following this, the suggested improvements,
barriers to the use of the framework and further development of the framework are
presented. The results obtained are then discussed and the chapter summary is
presented.
9.2 Aim and Objectives of Framework Validation/Evaluation
The framework validation/evaluation was carried out with the aim of determining the
appropriateness and applicability of the life cycle based framework for stakeholder
management in construction projects by industry practitioners. The specific
validation/evaluation objectives include:
1. To assess the applicability and overall effectiveness of the life cycle based
framework for stakeholder management in construction projects.
2. To assess the extent to which the framework is able to avoid/reduce conflicts
among project stakeholders.
3. To assess the extent to which the framework is able to enable continuity of
stakeholder management process in construction projects.
4. To assess the extent to which the framework is able to inform stakeholder
management decisions in construction projects.

226
5. To assess the extent to which the framework is able to facilitate project success
in construction.
6. To obtain suggestions from the potential end users (construction industry
practitioners) of the framework on the benefits of the framework, barriers to its
use and how to further improve it.
9.3 Methodology Adopted for Framework Validation/Evaluation
Frameworks/models are developed to address specific problems but they cannot be used
with confidence to solve such problems unless they are validated or evaluated.
Framework validation and evaluation are complementary terms that are being used
interchangeably by researchers and framework/model developers. Validation or
evaluation is carried out not to discover new knowledge but to ensure that a framework
or model is able to serve its intended purpose(s). In other words, framework/model
validation is aimed at substantiating the framework/model to ensure that it possesses a
satisfactory range of accuracy and acceptability consistent with its intended purpose
(Schlesinger et al., 1979). Therefore, it is important to adopt appropriate methodology
in validating a framework/model but there is no known formal guide for choosing the
methodology to use in validating a framework/model as each framework development
(modelling) tool has its peculiar challenges. Moreover, each framework or model
developed has its peculiar intended purpose(s) in line with which the validation should
be carried out. If the purpose of the framework/model is to answer a variety of
questions, then its validity should be determined with respect to these questions
(Sargent, 2005). Therefore, the researcher has to figure out the best method to adopt in
validating their framework/model.
There are four basic approaches for deciding whether a framework/model is valid or not
(Sargent, 2005):
1. To make a subjective decision based on the results of the various validity tests
carried out during the framework development process: This means that only the
researcher(s) will be involved in the validation process. It is hardly possible for
the framework/model validated using this approach to be considered valid and
credible unless the researcher(s) is (are) the end users themselves.
2. To involve the end users of the framework together with the researcher(s) in
determining the validity of the framework: In this approach, the focus of who

227
determines the validity of the framework moves from the researcher(s) to the
potential end users of the framework. When this approach is used, the
framework also gains credibility if found valid. Credibility means the end users
have the confidence to accept and use the framework. Although the researcher(s)
may have conducted some validation of the data used in developing the
framework/model, it is always better to involve the potential end users of
developed framework/model in the validation of the framework/model itself
(Martis, 2006).
3. To use a third party separate from the researcher(s) and potential end users to
determine the validity of the framework: This approach is referred to as
independent validation. It can either run concurrently with the framework
development or after the framework has been developed. The credibility of the
framework when this approach is used depends on the level of knowledge and
integrity of the third party used in validating the framework.
4. To use a scoring model: In this approach, scores (or weights) are used to assess
various aspects of the framework developed with respect to the intended purpose
of the framework. The framework is considered valid if the overall scores in the
aspects of the framework assessed are above the minimum acceptable scores.
The minimum acceptable scores depend on the scale of scores used (this for
example is 3.5 for a five-point Likert scale). The credibility of the framework is
high if its scores very high in all the aspects of the framework assessed.
After careful consideration of these four approaches, it was decided to use a
combination of approaches 2 and 4 to validate the framework. In order to gather
feedback from the potential end users of the framework on its intended purpose and to
identify how it can be further improved to achieve its intended purpose. Sargent, (2005)
recommends the use of, a combination of approaches in the validation stage in order to
achieve the best result and return not only a valid framework but a credible one as well.
The life cycle based framework for stakeholder management in construction projects
was developed using the results obtained from industry survey carried out within the
United Kingdom. Therefore it was decided to contact the same industry practitioners
who took part in the survey to validate the framework developed as they will eventually
be the end users of the framework. The survey respondents were chosen from the field
of construction management, architecture, quantity surveying, facility management and
engineering including designers and consultants some of whom work for clients. This

228
was done to ensure coverage of the main professional fields involved in construction
projects as much as possible. It should be noted that during the industry survey, the
target minimum experience was 5 years and this was maintained for the framework
validation. This was to ensure that validators of the framework had sufficient experience
and knowledge of industry practice such that they would have been involved in two or
more construction projects dealing with different stakeholders thereby making the
validation results reliable and acceptable. Furthermore, practitioners that have decision
making and operational roles ranging from site operation to directorship in their
organisations were targeted. The framework validators included practitioners working in
both private and public sectors of the construction industry. A total of 19 validation
interview sessions were conducted. Details on the professionals involved in the
validation process are presented in Table 9.1. It should be noted that the validators’
names and other personal information are not included in Table 9.1 in order to keep the
validators anonymous in line with ethical requirements and assurances given to the
validators before they agreed to take part in the validation. Table 9.1 shows that the
minimum years of experience of the validators is 8 and the maximum years of
experience is 46. Additionally, the average experience for all the validators is
21.11years.

229
Table 9.1 Background information of the validators
Validators
’ No
Company type Job title Speciality Experienc
e (Years)
1 Contractors Site
operations
agent
Civil Engineer 14
2 Architecture/Desig
n
Associate Architect (Healthcare) 12
3 Public sector Principal
Constructio
n Adviser
Architect 24
4 Management and
Consultancy
Senior
Project
Manager
Property development 10
5 Design and
Consultancy
Managing
director
Project management 20
6 Public sector Chief
Surveyor
Property adviser 38
7 Developers Director Property finance 12
8 Developers Project
Manager
Project management 39
9 Engineering
enterprise
Senior
Commercial
Manager
Contractual matters 46
10 Design and
Consultancy
Senior
Building
Services
Engineer
Mechanical engineering 8
11 Engineering
enterprise
Senior
Quantity
Surveyor
Construction/Civil/wate
r
10
12 Contractors Managing
Surveyor
Commercial
management
15
13 Property
management and
Consultancy
Park
Manager
Property management 30
14 Contractors Interface
Manager
Civil Engineer 20
15 Design and
Consultancy
Director Structural Engineer 25
16 Contractors Constructio
n Director
Design & Build projects 35
17 Contractors Quantity
Surveyor
Quantity Surveyor 11
18 Contractors Contracts
Manager
Civil Engineer 22
19 Owner and
Operator of
Infrastructure
Community
liaison
Manager
Community
Engagement
10

230
The validation was carried out using an interview approach in face to face meetings.
Each validation session was designed to last 45 minutes. However, some of the sessions
lasted longer depending on the level and amount of discussion with the validators which
varied from one validator to the other. The validation interviews consisted of four main
parts presented in Figure 9.1. These include:
PRESENTATION OF
SUMMARY OF THE
OVERALL RESEARCH
PRESENTATION OF THE
LIFE CYCLE BASED
FRAMEWORK FOR
STAKEHOLDER
MANAGEMENT IN
CONSTRUCTION PROJECTSDISCUSSIONS
COMPLETION OF
FRAMEWORK SCORING
QUESTIONNAIRE
QUESTIONS AND ANSWERS
QUANTITATIVE
DATA
QUALITATIVE DATA
Figure 9.1 Framework Validation Process
1. A summary of the overall research that led to the development of the framework
was presented to the validators. This involved presenting the aim and objectives
of the research, methodology adopted and preliminary findings in 10 minutes.
2. The life cycle based framework for stakeholder management in construction
projects was presented. This involved explaining the conceptual framework
(Figure 8.3) and the four stages of the framework developed using IDEF0
(Figures 8.8, 8.9, 8.10 and 8.11) in 15 minutes.
3. A 15 minutes time was allowed for discussions (questions and answers)
although the validators were allowed the opportunity to interrupt and ask
questions during the presentations. 17 discussion sessions were recorded
whereas notes were taken in two sessions as the validators declined to be
recorded.
4. An evaluation (scoring) questionnaire was completed by the validators at the end
of the discussions. Most of the validators completed the questionnaire in 5
minutes.
A power point presentation was prepared for each validation session to give the
validators an overview of the overall research before introducing the framework being
validated. During the sessions, three sets of documents were handed out to the
validators including:

231
1. Print outs of power point slides of the presentation. This was because there was
no opportunity to project the presentation at most of the interview venues.
2. A set of IDEF0 diagrams to help them follow through the four stages of the life
cycle based framework for stakeholder management in construction projects.
3. The framework validation questionnaire (Appendix B) which they completed
and returned at the end of the sessions. The validation questionnaire comprised
of three sections. The first section collected data on the background information
of the validators including their names, company name and address, job
title/position, experience of practice in the construction industry in years,
speciality and email or contact number. The second section consisted of 11 close
ended questions aimed at assessing (using a five-point scale) the overall
effectiveness of the framework. The third section consisted of four open ended
questions requesting the validators to comment on the main benefits of the
framework, barriers to its use, suggestions to further improve the framework and
any other comments they wished to add verbally. This part was recorded for all
the validators in order to avoid missing any points made by the validators. But
two of the respondents declined to be recorded hence notes were taken during
their responses.
9.4 Results of Framework Validation/Evaluation
Two sets of data were collected during the framework validation exercise including
quantitative and qualitative data. Using a triangulation of quantitative and qualitative
methods was helpful in the validation process. The quantitative data collection enabled
researcher bias to be avoided and the qualitative data collection enabled the gathering of
more detailed information. This led to a more in-depth understanding of the quantitative
data. This section presents results obtained during the statistical analysis of the
quantitative data and the thematic analysis of the qualitative data.
9.4.1 Quantitative Results
This sub-section presents the analysis of the responses of the framework validators to
the closed questions. The validators were asked to score the framework in relation to the
aim of the framework development (Table 9.2) on a five-point Likert scale where 1
represents ‘Poor’, 2 represents ‘Fair’, 3 represents ‘Satisfactory’, 4 represents ‘Good’
and 5 represents ‘Excellent’. The results from these closed questions are presented in
Tables 9.2 and 9.3. Table 9.2 presents a statistical summary of the validators’ scores on

232
the key aspects of the intended purpose of the framework and Table 9.3 presents the
percentage scores for the key aspects of the framework based on the scoring scale.

233
Table 9.2 Validation responses on scoring of key aspects of the framework
No Validation questions Minimum
Score
Maximum
Score
Mean
Score
Skewness Kurtosis
1 How useful would you rate the overall framework for stakeholder management
in construction?
4 5 4.47 .115 -2.235
2 How easy would it be to follow the IDEF0 process in the framework (clarity of
the framework)?
2 5 3.63 -.921 .719
3 To what extent can following the framework help in carrying out stakeholder
management in construction?
3 5 4.16 .385 1.113
4 How effectively can the framework facilitate the overall success of construction
projects?
3 5 4.05 -.026 .024
5 How effectively does the framework focus on stakeholder management issues
relevant to construction projects?
2 5 3.89 -.498 .302
6 How well does the framework establish links between the stages of construction
projects?
2 5 4.05 -.717 .367
7 How would you rate the applicability of the framework in construction
projects?
3 5 4.05 -.074 -.766
8 How would you rate the logical structure of the framework?
3 5 4.16 .385 1.113
9 How would you rate the comprehensiveness of the framework?
3 5 4.21 -.173 -.311
10 How useful would you consider the framework in decision making?
3 5 4.21 -.173 -.311
11 How useful would you consider the framework in reducing conflicts among
internal stakeholders?
3 5 4.05 -.074 -.766

234
Table 9.3 Percentage scores of the key aspects of the framework based on the scale points
No Validation questions 1
Poor
2
Fair
3
Satisfactor
y
4
Good
5
Excellent
1 How useful would you rate the overall framework for
stakeholder management in construction?
- - - 52.6% 47.4%
2 How easy would it be to follow the IDEF0 process in the
framework (clarity of the framework)?
- 10.4% 21.1% 63.2% 5.3%
3 To what extent can following the framework help in carrying out
stakeholder management in construction?
- - 5.3% 73.6% 21.1%
4 How effectively can the framework facilitate the overall success
of construction projects?
- - 15.7% 63.2% 21.1%
5 How effectively does the framework focus on stakeholder
management issues relevant to construction projects?
- 5.3% 21.1% 52.6% 21.1
6 How well does the framework establish links between the stages
of construction projects?
- 5.3% 15.7% 47.4% 31.7%
7 How would you rate the applicability of the framework in
construction projects?
- - 21.1% 52.6% 26.3%
8 How would you rate the logical structure of the framework?
- - 5.3% 73.6% 21.1%
9 How would you rate the comprehensiveness of the framework?
- - 10.4% 57.9% 31.7%
10 How useful would you consider the framework in decision
making?
- - 10.4% 57.9% 31.7%
11 How useful would you consider the framework in reducing
conflicts among internal stakeholders?
- - 21.2% 52.6% 26.3%

235
An investigation of the results from the closed questions reveals an overall positive
response by the validators on the framework. Table 9.2 shows that none of the 11
questions was scored 1 (poor) by the validators and all of them had a score of 5
(excellent). This can be seen from the 4th
and 5th
columns of Table 9.2 which present the
minimum and maximum scores respectively for each of the 11 closed questions
included in the framework validation questionnaire. The mean scores for all the 11
questions ranged from 3.63 to 4.47, all of them above the acceptable score of 3.5 for a
five-point Likert scale.
Furthermore, the Skewness and Kurtosis values shown in Table 9.2 indicate the
distribution of scores for the 11 closed questions (Pallant, 2007). Positive Skewness
values indicate that scores are clustered around the low values of the scale whereas;
negative Skewness values indicate scores are clustered around the high values of the
scale. Positive Kurtosis values indicate that scores are clustered around the middle of
the scale. A combined look at the Skewness and Kurtosis values shows clustering of
scores from the middle to high values of the scale. This explains the high mean scores
recorded by all 11 questions. In order to see more clearly the pattern of scores, the
percentage scores for the 5 points of the scale were calculated (Table 9.3). The
percentage scores indicate that the validators rated the questions mostly from 3 to 5. A
further look at the individual validators’ scores reveals that no validator continuously
indicated low scores for the questions. But two validators scored the question “how easy
it would be to use the framework” low being the only question with up to two scores of
“2” (fair).
The highest mean score of 4.47 out of 5 was recorded by the question on the overall
usefulness of the framework. Conversely, the lowest mean score of 3.63 out of 5 was
recorded by the question on how easy it would be to follow the IDEF0 process in the
framework. Although this is above the acceptable score, it is comparatively the lowest
score recorded in the framework validation. This is not a surprising result as not all the
validators have used IDEF0 process before although most of them are familiar
with/aware of it.
9.4.2 Qualitative Results
This sub-section presents qualitative results of the framework validators’ responses. The
qualitative results are presented under three main themes including ‘main benefits of the
236
framework’, ‘barriers to the use of the framework’ and ‘recommended improvements on
the framework’.
9.4.2.1 Main benefits of the framework
The validators were asked what they considered the main benefits of the framework. All
validators agreed that the framework provided a logical step by step process for carrying
out stakeholder management in construction projects. Moreover, they agreed that the
life cycle approach to detailing the framework is a great advantage that would enable
continuity of the stakeholder management process in construction projects. Other things
the validators liked about the framework include allocation of responsibility and
constitution of stakeholder management team for all the stages of the framework;
consideration of stakeholder dynamism which would in the words of one of the
validators “prevent any unknowns from developing as the project reaches fruition”;
early and continuous involvement of all relevant stakeholders will help minimise delays
and changes which are very expensive in construction projects; and the provision for
documenting lessons learned for onward consideration in future stages and projects.
From the results of recorded discussions and notes taken during the validation presented
in this section, it can be seen that the main benefit of the life cycle based framework for
stakeholder management in construction projects is that it provides a logical step by step
process to follow in carrying out stakeholder management in construction projects
which was lacking. Moreover, the provision for early and continuous engagement of
stakeholders through the project life cycle stands out as the most liked feature of the
framework.
9.4.2.2 Barriers to the use of the framework
The validators identified the following barriers to the implementation of the life cycle
based framework for stakeholder management in construction projects:
1. End users of the framework may not see the immediate benefits of using the
framework;
2. There is the likelihood that the end users of the framework might be afraid that
it would lead to additional role to be created, paper work and would be time
consuming;
3. Users may hesitate thinking that it would lead to additional cost to implement
the framework and nobody may want to shoulder the extra cost. However, one
validator is of the view that implementing the framework would not actually

237
lead to any extra cost since it is controlled by the procurement route and
contract conditions. Similarly, another validator said stakeholder management
measures such as notification of pedestrian diversions, temporary bridges and
public travel protection are actually part of the project sum. Another validator
said they commit one percent of their profit for stakeholder engagement;
4. The process of implementing the framework may be considered rigid and
maybe difficult to keep to it; and
5. Political pressure on the side of public sector may prevent the implementation
of the framework.
The barriers identified to the implementation of the framework centred on
responsibility, cost and time related concerns. This is not surprising as it is common
practice when executing construction projects to try as much as possible to minimise
time and cost. However, spending time to carryout stakeholder management would
deliver some positive benefits that far outweigh the time and money spent. These
include enabling the smooth running of the project, reduction of delays and changes,
reduction of disputes and claims all of which are very expensive to manage.
Furthermore, professionals/organisations who use such framework and are able to
deliver to clients’ and other stakeholders’ satisfaction, would increase their long term
competitive advantages. Some of the validators noted that organisations are likely to see
it as change which is always resisted. It was also noted that some organisations may
view some external stakeholders as peripheral and may not have the patience to take
time and engage with them.
9.4.2.3 Recommended improvements for the framework
The validators made suggestions towards improving the framework, these include:
1. The framework needs to be made as flexible as possible in order to allow for
different project circumstances to be accommodated;
2. The look of the framework should be simplified to make it more user friendly
for example by the use of colours (as is the case in the spiral conceptual
presentation of the framework shown in Figure 8.3) and other possible means of
distinction;
3. Advanced funding of the whole package should be made clear. It should be
stated who would be responsible between the client and the contractor, for the
funding of any extra cost as a result of the framework implementation; and

238
4. Appending a result of using examples of past projects to say how things would
have gone had this framework been put to use.
The validators have made recommendations for further improvement of the framework
to make its implementation easier. These recommendations centred on the outlook and
flexibility of the framework. The need for flexibility is already taken care of by the
provision for collaboration among the internal stakeholders that serve as either the
stakeholder management leaders at the various stages or as members of the stakeholder
management team. The framework has also been made to enable the consideration of
project specific circumstances through the control from the procurement routes and
contract conditions. The recommendation that the framework should be supported with
examples from real projects would be recommended by the researcher for further
research. Some validators recommended that the framework should be simplified.
However, it was observed from the quantitative data that only two of the validators
rated the question “how easy it would be to follow the IDEF0 process in the
framework” 2 (fair). It was further observed from the qualitative data that these same
validators were among the few who said they were not familiar with the IDEF0
technique and further noted that it would be necessary for some kind of training to be
provided. Moreover, these validators scored the other questions higher than 2.
9.5 Chapter Summary
This chapter has presented the validation of the life cycle based framework for
stakeholder management in construction projects. The validation was carried out using a
combination of quantitative and qualitative data collected in interview sessions with 19
well experienced practicing professionals in the construction industry. Findings from
the validation indicate that the framework is valid and credible hence, it is able to serve
its intended purpose of guiding stakeholder management in construction projects
although there are some recommendations for further improvement on the framework.
The next chapter concludes the study and makes recommendation for further research.

239
10. CHAPTER TEN: SUMMARY, CONCLUSIONS AND
RECOMMENDATIONS
10.1 Introduction
The research presented in this thesis focussed on developing a comprehensive life cycle
based framework for stakeholder management in construction projects. This chapter
summarises the overall research undertaken in pursuing this aim and evaluates it against
the specific research objectives set out. The conclusions reached are then presented and
the limitations of the research are discussed. The chapter concludes with a section on
recommendations for further research.
10.2 Summary of the Overall Research
The overall aim of this study was to explore the formulation of a comprehensive
framework for stakeholder management in construction projects which integrates and
links the different stages of the project life cycle. This aim was pursued by addressing
the following specific research objectives:
1. To review previous work on stakeholder management in construction projects
in particular.
2. To investigate the current practice of stakeholder management within the
construction industry.
3. To assess the effect of procurement routes and contract forms on stakeholder
management process.
4. To model the relationship among the critical success factors for stakeholder
management in construction projects.
5. To develop a comprehensive framework for stakeholder management in
construction projects.
6. To validate/evaluate the framework.
The specific tasks accomplished in the current study are summarised based on the
research objectives as follows:
Objective 1: To review previous work on stakeholder management in construction
projects.

240
The literature review on stakeholder management in construction projects presented in
Chapter 2 revealed that project failure in construction is directly linked to lack of or
inadequate stakeholder management during the project execution. Current frameworks
for stakeholder management were reviewed. The need for a comprehensive framework
for stakeholder management in construction projects was identified as current
frameworks were found to be unable to meet this need. The review also identified the
need for internal stakeholders to collaborate in carrying out stakeholder management
and for responsibility to be assigned for leading/coordinating the process of stakeholder
management at the various stages of construction projects. The review further revealed
that the involvement of stakeholders in collaboration and assignment of responsibility
for leading/coordinating the process can be influenced by the procurement route and
contract forms being used for executing the project. The review also identified the need
to understand why stakeholder interests change in the course of the project and how
such changes could be tracked. The critical success factors for stakeholder management
in construction projects were reviewed leading to the identification of 23 critical success
factors. Furthermore, the need for a deeper understanding of the interrelationships
among these critical success factors and how they can be used to achieve project success
were identified. Tools and techniques for stakeholder engagement were reviewed and 6
stakeholder engagement/management techniques were identified with the need to
understand which, among them are the most effective tools for engaging stakeholders in
construction projects.
As necessitated by the first literature review, another review was carried out on project
life cycle, project success, the relationship between procurement routes and stakeholder
management as well as stakeholder collaboration. This review was presented in Chapter
3. Construction project life cycle stages were reviewed and four key stages including
inception, design, construction and operation stages were identified. The current
understanding of project success in construction was reviewed and four key
performance indicators were identified including timely completion, completion on
budget, completion to specified quality standards and completion to stakeholder
satisfaction. It was found that stakeholder management in construction projects will be
effective/successful if internal stakeholders collaborate in the process throughout the
project’s life cycle. Construction procurement routes were discussed under three main
groups including the traditional, integrated, and management based procurement routes.
The review reveals that no procurement route fully supports the process of stakeholder
241
management in construction projects. At the end, conceptual measurement and
structural models were specified to enable the investigation of the interrelationships
among the critical success factors for stakeholder management in construction projects
and how they lead to project success. The conceptual models had the 23 critical success
factors presented in Chapter 2 and four project success indicators presented in Chapter
3; as indicators of the constructs which include stakeholder characteristics and project
characteristics (SCPC), stakeholder analysis (SA), stakeholder dynamism (SD),
stakeholder engagement/empowerment (SE) and project success (PS).
The literature review concluded that there is currently no framework for stakeholder
management in construction that covers the life cycle of projects. As such, filling this
gap was chosen as the main focus of this research. The specific objectives of the
research were based on a combination of the gaps from the literature review carried out.
Objective 2: To investigate the current practice of stakeholder management within the
construction industry.
An industry survey was carried out to investigate the current practice of stakeholder
management in the UK construction industry. The survey results, presented in Chapter
5, revealed that stakeholder management has yet to be fully embraced among the
construction organisations. The need for internal stakeholders to be involved in
stakeholder collaboration throughout the project life cycle was supported with empirical
evidence and suggestions were made regarding who should be involved in the
collaboration at the various stages of construction projects. Preferences for assignment
of responsibility for stakeholder management at the various stages of construction
projects were identified. Furthermore, the most effective technique for engaging
stakeholders in construction projects was identified to be public hearing. The most
common reason why stakeholder interests change in the course of the project was
identified to be when stakeholders acquire new information previously not available to
them about the project and the means for tracking stakeholder dynamism include
feedback mechanisms, early warning signs and checklist in decreasing order of
popularity.
Objective 3: To assess the effect of procurement routes and contract forms on
stakeholder management process.
242
Chapter 6 presented the results from part of the survey that investigated the effects of
procurement routes and contract forms on stakeholder management process. 12
procurement routes related characteristics of the stakeholder management process were
rated using a five-point Likert scale. The results revealed that Clear assignment of
responsibilities; Cooperation among the internal stakeholders; and Clear lines of control
and communication are the three topmost characteristics to be sought because they
influence stakeholder management in construction more positively than others.
Conversely, separation of design and construction roles is to be avoided as much as
possible because it was found to have negative influence on stakeholder management.
The results also revealed that, the more experienced the professionals responsible for
stakeholder management are, the more effective the propriety of making stakeholder
management decisions in construction projects. All forms of contract influence
stakeholder management positively but the NEC form of contract have the highest
positive effect on stakeholder management process in construction projects.
Objective 4: To model the relationship among the critical success factors for
stakeholder management in construction projects.
This objective was set to understand the interrelations among the critical success factors
for stakeholder management in construction through their relationships with the latent
variables as well as the causal interrelations among the latent variables; and to examine
the fit between extant theoretical standing and the survey data collected for the current
study. This analysis was based on the conceptual models presented in Chapter 3. The
indicators were the 23 CSFs and project success indicators; and the latent variables or
constructs in the model include project characteristics and stakeholder characteristics
(SCPC), stakeholder analysis (SA), stakeholder dynamism (SD), stakeholder
engagement/empowerment (SE) and project success (PS). The results reveal that the
measurement model portrayed in Figure 7.2 fits the sample data fairly well and
therefore is accepted. This implies that all stakeholder management decisions made in
the four distinct processes shown in the latent variables (obtaining information on
project characteristics and stakeholder characteristics; undertaking stakeholder analysis;
understanding stakeholder dynamism; and stakeholder engagement/empowerment)
affect each other directly or indirectly. The findings from the structural model indicate
that stakeholder analysis (SA) cannot directly impact/influence project success (PS).
However, stakeholder engagement/empowerment (SE) being the only construct found
to directly influence project success (PS) depends on the understanding of stakeholder
243
dynamism (SD) which also depends very strongly on the results of stakeholder analysis
(SA). Interestingly, although the relationship between SCPC and SD was not supported,
the path coefficients between them indicates that a little understanding of stakeholder
dynamism can be gained based only on the information collected on project
characteristics and stakeholder characteristics.
Objective 5: To develop a comprehensive framework for stakeholder management in
construction projects.
The literature review revealed the need for a comprehensive framework that spans the
entire project life cycle to guide the process of stakeholder management in construction
projects. The life cycle based framework for stakeholder management in construction
projects has been developed using IDEF0 to address this need. The findings from the
preceding objectives informed the formulation of this framework. The framework
consists of four stages: stakeholder management at inception stage (SMIS), stakeholder
management at design stage (SMDS), stakeholder management at construction stage
(SMCS) and stakeholder management at operation stage (SMOS). Each of these four
stages was further decomposed into sub-processes according to the stakeholder
management process based on the relationships among the CSFs presented in Chapter 7.
The steps follow the sequence of identifying project characteristics and stakeholder
characteristics, carrying out stakeholder analysis, mapping stakeholder dynamism,
planning and implementing stakeholder management/engagement strategies. The overall
framework provides a comprehensive guide for carrying out stakeholder management in
construction projects.
Objective 6: To validate/evaluate the framework.
The life cycle based framework for stakeholder management in construction process
was validated in a survey with practicing construction industry professionals. Chapter 9
of this thesis has presented the validation process and discussion of the evaluation
results. The validation was carried out using a combination of quantitative and
qualitative data collected in interview sessions with 19 well-experienced practicing
professionals in the construction industry. Findings from the validation indicated that
the framework is valid and credible hence, it is able to serve its intended purpose of
guiding stakeholder management in construction projects although there are some
recommendations for further improvement of the framework.

244
10.3 Conclusions and Recommendations for Practice
The research presented in this thesis focussed on improving stakeholder management in
construction projects by developing a comprehensive framework that spans the entire
life cycle of construction projects to guide stakeholder management process in
construction projects. The conclusions drawn from the overall research process are
presented as follows:
Stakeholder management is yet to be fully embraced as a deliberate strategy in
the management of construction projects in the UK.
There is a strong need for internal stakeholders to collaborate in undertaking
stakeholder management in construction projects.
Construction professionals perceive dynamics in stakeholder position as
important and gaining new information is explanatory for that, but not loss of
confidence in the project team. It is necessary for all stakeholders to be
adequately briefed about the project including telling them both the positive and
negative aspects of the project.
There is need to put in place feedback mechanisms and early warning signs to
track change in stakeholder interests/disposition throughout the project.
Public hearings and design charrettes are considered the most important
stakeholder engagement instruments.
The main challenge for embracing stakeholder management can be said to be the
inability of firm or client to agree and or set aside some funds to support
stakeholder management process. Therefore, it is recommended that some
financial provisions should be made in agreement between the client and key
project team. Especially for stakeholder management related issues that are not
included in the project bill.
There is need for firms to assign the responsibilities for leading stakeholder
management to specific professionals in addition to deciding to undertake
stakeholder management in construction projects as currently, no specific
responsibility is assigned for stakeholder management in construction projects.
This should be done for each of the main stages of a construction project as well
as for the overall process of stakeholder management on projects. The

245
procurement routes and contract forms being used should guide this. There is
need for a policy driven support for stakeholder management to be carried out in
construction projects. The government and relevant regulatory authorities as
stakeholders should ensure this is done.
The choice of procurement route for a project depends on the project
characteristics and issues at stake such as contractor collaboration in design,
internal stakeholder collaboration throughout the project, cost control, price
guarantee and quality level desired. Even if the appropriate procurement route
that favours stakeholder management is selected, it would be necessary for the
project management team to have full understanding of the critical success
factors for stakeholder management in construction projects. Some of the critical
success factors can be skipped in some projects depending on their peculiarities.
Four hypotheses have been supported by the data set including: H2 (SCPC
SA), H7 (SA SD), H8 (SD SE) and H9 (SE PS). And the final structural
model is made of 20 indicators including 16 critical success factors for
stakeholder management and 4 project success indicators.
Obtaining information about project characteristics and stakeholder
characteristics (SCPC) has been identified as being the precondition factor
(construct) for carrying out effective stakeholder management in construction.
Failure to adequately and holistically address the critical success factors for
stakeholder management in construction projects will prevent stakeholder
management efforts from achieving the desired results-project success.
The life cycle based framework for stakeholder management in construction
projects provides a smooth methodology to guide the process of stakeholder
management in construction projects. The framework has been evaluated and
found to be credible and acceptable to the construction industry.
10.4 Limitations of the Research
This study like others has its limitations. A real project would have provided better
feedbacks than the validation and the framework could have been further improved. But
due to time limitations as PhD studies are time bound, the framework could not be
implemented practically in a real construction project. The generalisation of the findings

246
in this study is limited to the UK construction industry. Moreover, the results of similar
study in different countries may differ depending on government policies and
regulation, procurement routes, contract conditions, culture and economic climate.
10.5 Recommendations for Further Research
During the study presented in this thesis, some areas for further studies were identified.
These are listed as follows:
The life cycle based framework for stakeholder management developed in this
study is generic for construction projects. Further research could be carried out
to develop similar life cycle based framework for specific construction projects
such as transport, housing, retail, hospitals, etc. to serve as further motivation for
embracing stakeholder management in construction projects.
Further studies using action research should be carried out to implement the life
cycle based framework for stakeholder management in real life construction
projects so that the framework can be further improved and simplified based on
the findings from the action research. Action research will enable the
identification of real life strengths and weaknesses of the framework.
Anecdotal evidence from the current study suggests there is a link between
stakeholder management and risk management in construction projects.
Establishing and understanding this link could improve both stakeholder and
risk management in construction projects. Further research should be carried out
to establish this link and further enhance the propensity for achieving projects
success in construction.
The results of the research reveal the need for policy to support stakeholder
management in construction projects. Further research should be undertaken to
investigate relevant government policies and regulations to identify how they
can be tailored towards supporting stakeholder management in construction
projects

247
References
Aaltonen, K., and Kujala, J. (2010). A project lifecycle perspective on stakeholder
influence strategies in global projects. Scandinavian Journal of Management, 26(4),
381-397.
Aaltonen, K., Jaakko, K. and Tuomas, O. (2008). Stakeholder salience in global project,
International Journal of Project Management, 26, 509-516.
Aaltonen, K., Sivonen, R. (2009). Response strategies to stakeholder pressures in global
projects. International Journal of Project Management, 27 (2), 131–141.
Aguilar-Saven, R. S. (2004). Business process modelling: Review and framework.
International Journal of production economics, 90(2), 129-149.
Aibinu, A. A. and Al-Lawati, A. M. (2010). Using PLS-SEM technique to model
construction organisations’ willingness to participate in e-bidding. Automation in
Construction, 19, 714-724.
Akintoye, A. (1994), Design and build: a survey of construction contractors’ views,
Construction Management and Economics, 12 (2), 155-63.
Akintoye, A., Hardcastle, C., Beck, M., Chinyio, E., and Asenova, D. (2003). Achieving
best value in private finance initiative project procurement, Construction
Management and Economics, 21(5), 461 – 470.
Akintyoye A. and Main J., (2007). Collaborative relationships in construction: the UK
contractors’ perception, collaborative relationships in construction, engineering.
Construction and Architectural Management, 14 (6), 597-617.
Aksorn, T. and Hadikusumo, B. H. W. (2008). Critical success factors influencing
safety program performance in Thai construction projects, Safety Science 46: 709–
727. Doi:10.1016/j.ssci.2007.06.006
Anderson, J. C. and Gerbing, D. W. (1991). Predicting the performance of measures in a
confirmatory factor analysis with a pretest assessment of their substantive validities.
Journal of Applied Psychology, 76(5), 732−740.
Anderson, J. C. and Gerbing, D.W. (1984). The effect of sampling error on
convergence, improper solutions, and goodness-of-fit indices for maximum
likelihood confirmatory factor analysis. Psychometrika, 49, 155−173.

248
Ankrah, N.A., Proverbs, D. and Debrah, Y. (2009). Factors influencing the culture of a
construction project organisation: an empirical investigation. Engineering
Construction and Architectural Management 16 (1), 26–47.
Anumba, C. J., and Evbuomwan, N. F. O. (1997). Concurrent engineering in design-
build projects, Construction Management and Economics, 15: 3, 271 – 281.
Atkin, B. and Skitmore, M. (2008) Editorial: Stakeholder management in construction,
Construction Management and Economics, 26: 6, 549 – 552.
Atkinson, A.A., Waterhouse, J.H. and Wells, R.B. (1997). A stakeholder approach to
strategic performance measurement. Sloan Management Review; Cambridge, 38 (3),
25-37.
Awakul, P. and Ogunlana, S.O. (2002), The effect of attitudinal differences on interface
conflicts on large construction projects: The case of Pak Mun Dam Project,
Environmental Impact Assessment Review, 20, 311-35.
Bagozzi, R. P. (2010). Structural equation models are modelling tools with many
ambiguities: comments acknowledging the need for caution and humility in their
use. Journal of Consumer Psychology 20, 208-214.
Baiden, B. K., Price, A. D. F. and Dainty, A. R. J. (2005). The extent of team
integration within construction projects. International Journal of Project
Management, 24(1), 13-23. DOI: 10.1016/j.ijproman.2005.05.001.
Barrett, P. (2007). Structural Equation modelling: adjudging model fit, Personality and
Individual Differences, 42, 815-824.
Best, R. and Valence, G.D. (2002), Design and Construction Building in Value,
Butterworth Heinemann, Oxford.
Black, K., (1995). Causes of project failure: a survey of professional engineers. PM
Network, November; 21-24.
Blaikie, N. (2007). Approaches to social enquiry: Advancing knowledge. Polity.
Bordass, W. and Leaman, A. (2005) Making feedback and postoccupancy evaluation
routine. 1: A portfolio of feedback techniques. Building Research & Information,
33(4), 347–352.
249
Bourne, L. (2005) Project relationship management and the stakeholder circle, Doctoral
thesis, Graduate School of Business, Melbourne, RMIT University.
Bourne, L. and Walker, D.H.T. (2005). Visualising and mapping stakeholder influence.
Management Decision, 43(5), 649–60.
Bourne, L., Walker, D. (2006). Using a visualizing tool to study stakeholder influence –
two Australian examples. The Project Management Journal, 37 (1), 5–21.
Bryde, D. J. and Brown, D. (2005). The influence of project performance measurement
system on the success of a contract for maintaining motor ways and trunk roads,
Project Management Journal, 35(4), 57 – 65.
Bryde, D. J. and Robinson, L. (2005). Client versus contractor perspectives on project
success criteria, International Journal of Project management, 23, 622 – 629.
Byrne, B. M. (2010). Structural Equation Modelling with AMOS: Basic Concepts,
Applications and Programming, (2nd ed.), Routledge, Taylor and Francis Group,
New York.
Chan, A., Chan, D. and Ho, K. (2003). An empirical study of the benefits of
construction partnering in Hong Kong. Construction Management and Economics
21 (5), 523–533.
Chan, A.P.C., Scott, D. and Chan, A.P.L., (2004). Factors affecting the success of a
construction project, Journal of Construction Engineering and Management, 153.
Chan, D., Kumaraswamy, M. (1997). A comparative study of causes of time overruns in
Hong Kong construction projects. International Journal of Project Management 15
(1), 55–63.
Chan, P. P. C. and Chan, A. P. L. (2004). Key performance indicators for measuring
construction success, Benchmarking: An International Journal, 11(2), 203 – 221.
Doi 10.1108/14635770410532624.
Chartered Institute of Building (2008). Code of practice for project management for
construction and development. LibreDigital.
Cheeks, J. R. (2003). Multistep disputes resolution in design and construction industry.
Journal of Professional Issues in Engineering Education and Practice, ASCE,
129(2), 84-91.

250
Cheung, S. O., Lam, T. I., Leung, M. Y. and Wan, Y. W. (2001). An analytical
hierarchy process based procurement selection method. Construction Management
& Economics, 19(4), 427-437.
Chinda, T. and Mohamed, S. (2008). Structural equation model of construction safety
culture, Engineering, Construction and Architectural Management, 15 (2), 114-131.
Chinyio, E. (2010). Case studies. In: Chinyio, E. and Olomolaiye, P. (Eds.)
Construction Stakeholder Management, John Wiley & Sons Ltd, United Kingdom,
350 – 376.
Chinyio, E. A. and Akintoye, A. (2008). Practical approaches for engaging
stakeholders: findings from the UK, Construction Management and Economics, 26:
6, 591-599.
Chinyio, E. and Olomolaiye, P. (2010). Introducing stakeholder management. In
Chinyio, E. and Olomolaiye, P. (Eds.) (2010). Construction Stakeholder
Management, John Wiley & Sons Ltd, United Kingdom, 1 – 12.
Chinyio, E. and Olomolaiye, P. (Eds.). (2010). Construction stakeholder management.
Blackwell Publishing limited, UK.
Cho, K., Hong, T. and Hyun, C. (2009). Effect of project characteristics on project
performance based on structural equation model. Expert Systems with Applications,
36, 10461-10470.
Cilliers, P. (2005). Knowing complex systems, in K.A. Richardson (ed.), Managing
Organizational Complexity: Philosophy, Theory, and Application, 7-19.
Cleland, D. I. (1995), Leadership and the project management body of knowledge,
International Journal of Project Management, 13(2), 82-8.
Cleland, D. I. (2002) Project Management: Strategic Design and Implementation, 4th
edn, McGraw-Hill, London.
Cleland, D. I., (1999). Project Management Strategic Design and Implementation.
McGraw-Hill, New York.
Cookie-Davies, T., (2002). The real success factors on projects, International Journal of
Project Management 20 (3), 185–190. Cox, D. (2001). Private finance initiate-an
introduction to the structure and concepts of PFI, In the Proceedings of 2001 of
International Conference on Construction, Hong Kong, pp. 501-12.

251
Creswell, J. W. (2003). Research design: Qualitative, quantitative, and mixed
approaches. Sage publications, Thousand Oaks, CA.
Creswell, J. W. (2007). Qualitative inquiry and research method: Choosing among five
approaches. Sage Publications, Thousand Oaks, CA.
Creswell, J. W. (2009). Research design: Qualitative, quantitative, and mixed methods
approaches. SAGE Publications, Incorporated.
Creswell, J. W. and Plano Clark, V. L. (2011). Designing and Conducting Mixed
Methods Research, Sage publications. Thousand Oaks, CA.
Crotty, M. (1998). The foundations of social research: Meaning and perspective in the
research process. Sage publications, Thousand Oaks, CA.
Crotty, M. (2003). The foundations of social research; meaning and perspective in the
research process. SAGE Publications, Los Angeles, London, New Delhi and
Singapore.
Doloi, H, Iyer, K. C. and Sawhney, A. (2011). Structural equation model for assessing
impacts of contractor's performance on project success, International Journal of
Project Management, 29, 687-695.
Doloi, H. (2009). Relational partnerships: the importance of communication, trust and
confidence and joint risk management in achieving project success. Construction
Management and Economics, 27(11), 1099-1109.
Doloi, H., Sawhney, A. and Iyer, K. C. (2012a). Structural equation model for
investigating factors affecting delay in Indian construction projects. Construction
Management and Economics, DOI:10.1080/01446193.2012.717705, 1-16.
Doloi, H., Sawhney, A., Iyer, K.C. and Rentala, S. (2012b) Analysing factors affecting
delays in Indian construction projects. International Journal of Project
Management, 30, 479–89.
Dorsey, R.W. (2004). Project Delivery Systems for Building Construction, 2nd ed.,
Associated General Contractors of America, San Diego, CA.
252
Egan, J., (1998). Rethinking construction: report of the construction task force on the
scope for improving the quality and efficiency of UK construction, Department of
the Environment, Transport and the Region, London.
Erdogan, B., Anumba, C. J., Bouchlaghem, D., and Nielsen, Y. (2008). Collaboration
Environments for Construction: Implementation Case Studies. ASCE Journal of
Management in Engineering, 24(4), 234-244.
Eriksson, P. E. and Laan, A. (2007). Procurement effects on trust and control in client–
contractor relationships. Engineering, Construction and Architectural Management
14 (4), 387–399.
Eriksson, P. E. and Pesamaa, O. (2007). Modelling procurement effects on cooperation.
Construction Management and Economics, 25, 893–901.
Eriksson, P. E. and Westerberg M. (2011). Effects of cooperative procurement
procedures on construction project performance: a conceptual framework.
International Journal of Project Management; 29: 197–208.
Faniran, O. O., Love, P. E. D. and Smith, J. (2000). Effective front-end project
management–a key element in achieving project success in developing countries. In
Proceedings of the Construction Development Conference, Construction Industry
Institute, Bostwana, June 2-16.
Fellows, R. and Liu, A. (2003). Research methods for construction, 2nd Ed., Blackwell
Science, Oxford, U.K.
Fewings, P. (2005). Construction Project management, An Integrated Approach, Taylor
and Francis, London.
Flick, U. (2006). An Introduction to Qualitative Research. SAGE Publications, London.
Fonta, W. M., Ichoku, H. E., Ogujiuba, K. K. and Chukwu, J. O. (2007). Using
contingent valuation approach for improved solid waste management facilities:
Evidence from Enugu State, Nigeria, Journal of African Economics, 17 (2), 277 –
304.
Freeman, R. A. (1984). Strategic Management: a stakeholder approach, pitman press,
Boston.

253
Freeman, R. E., Harrison, J. S. and Wicks, A. C. (2007). Managing for stakeholders:
Survival, reputation, and success. Yale University Press.
Glenigan, (2011). KPI findings. www.glenigan.com/media/kpi_zone.aspx. accessed
16/10/2011.
Graham, J.R. (2001). Benefiting from public private partnerships in Honk Hong, In the
Proceedings of 2001 International Conference on Construction in Hong Kong, pp.
513-23.
Gray, B. (1985). Conditions facilitating interorganizational collaboration. Human
Relations, 38(10):911–936.
Gray, D. E. (2009). Doing Research in the Real World. 2nd Edition, SAGE
Publications, Los Angeles, London, New Delhi, Singapore and Washington DC.
Grix, J. (2004). The Foundations of Research. Palgrave Macmillan, New York.
Hair, J.F., Anderson, R.E., Tatham, R.L. and Black, W.C. (2008). Multivariate Data
Analysis, (7th ed.). Prentice Hall Publisher, Upper Saddle River, New Jersey.
Harris, F. (2010). A historical overview of stakeholder management. Wiley-Blackwell,
Oxford, UK.
Hooper, D., Coughlan, J. and Mullen, M. (2008). Structural equation modelling:
guidelines for determining model fit. Electronic Journal of Business Research
Methods, 6 (1) 53-60.
Hu, LI-tze, and Bentler, P. M. (1999). Cutoff criteria for fit indexes in covariance
structure analysis: Conventional criteria versus new alternatives. Structural
Equation Modeling, 6, 1−55.
Iacobucci, D. (2009). Everything you always wanted to know about SEM (structural
equations modeling) but were afraid to ask. Journal of Consumer Psychology, 19,
673−680.
Iacobucci, D. (2010). Structural equations modelling: Fit indices, sample size, and
advanced topics. Journal of Consumer Psychology, 20, 90-98.
Ibrahim, R. and Nissen, M., (2003). Emerging Technology to Model Dynamic
Knowledge Creation and Flow among Construction Industry Stakeholders during
the Critical Feasibility-Entitlements Phase. Proceedings of the American Society of

254
Civil Engineers (ASCE) 4th Joint Symposium on IT in Civil Engineering. ASCE,
Nashville, TN, pp. 1–14. Nov. 15-16.
IDEF (2003). Family of Methods web page: http://www.idef.com. Last accessed 20th
April, 2014.
Isik, Z., Arditi, D., Dikmen, I. and Birgonul, M.T. (2009). Impact of corporate
strengths/weaknesses on project management competencies, International Journal
of Project Management 27, 629–637.
Islam, M. D. M. and Faniran, O. O. (2005). Structural equation model of project
planning effectiveness, Construction Management and Economics, 23, 215–23.
Jackson, D. L. (2003). Revisiting sample size and number of parameter estimates: Some
support for the N:q hypothesis. Structural Equation Modeling, 10(1), 128−141.
Jamal, B. T. and Getz, D. (1995). Collaboration theory and community tourism
planning. Annals of Tourism Research, 22(1), 186-204.
Jepsen, A. L. and Eskerod, P. (2009). Stakeholder analysis in projects: challenges in
using current guidelines in the real world, International Journal of Project
Management 27, 335 – 345.
Jergeas, G.E., Williamson, E., Skulmoski, G.J. and Thomas, J.L., (2000). Stakeholder
management on construction projects. AACE International Transactions 12, 1–5.
Jugdev, K. and Muller, R. (2005). A retrospective look at our evolving understanding of
project success, Project management Journal, 36: 4, 19-31.
Juliano, W. J. (1995) External Communication as an Integral Part of Project Planning,
PM Network 18–20.
Kagioglou, M., Cooper, R., Aouad, G. and Sexton, M. (2000). Rethinking construction:
the generic design and construction process protocol. Engineering construction and
architectural management, 7(2), 141-153.
Kagioglou, M., Cooper, R., Aouad, G. and Sexton, M. (2000). Rethinking construction:
the generic design and construction process protocol. Engineering construction and
architectural management, 7(2), 141-153.
Karlsen, J. T. (2002). Project stakeholder management, Engineering Management
Journal, 14: 4, 19-24.

255
Karlsen, J. T., Graee, K. and Massaoud, M. J. (2008). The role of trust in project-
stakeholder relationships: a study of a construction project. International Journal of
Project Organisation and Management, 1(1), 105-118.
Kenny, D. A. and McCoach, B. D. (2003). Effect of the number of variables on
measures of fit in structural equation modeling. Structural Equation Modeling,
10(3), 333−351.
Kline, R. B. (2005). Principles and Practice of Structural Equation Modelling:
Methodology in the Social Sciences. Guilford Press, New York.
Kline, R. B. (2010). Principles and Practice of Structural Equation Modelling. (3rd
ed.), the Guilford Press, New York
Korde, T., Li, M. and Russell, A. D. (2005). State-of-the-art review of construction
performance models and factors. In Broadening Perspectives: Construction
Research Congress, April.
Kujala, J. (2010). Corporate responsibility perceptions in change: Finnish managers’
views on stakeholder issues from 1994 to 2004. Business Ethics: A European
Review, 19 (1), 14–34.
Lee, S. K. and Yu, J. H. (2012). Success model of project management information
system in construction. Automation in Construction, 25, 82-93.
Leung, M. and Olomolaiye, P. (2010). Risk and construction stakeholder management.
In: Chinyio, E. and Olomolaiye, P. (Eds.) Construction Stakeholder Management,
John Wiley & Sons Ltd, United Kingdom, 75 – 98.
Li, B.; Akintoye, A.; Edwards, P. J. and Hardcastle, C. (2005). Critical success factors
for PPP/PFI projects in the UK construction industry, Construction Management
and Economics 23: 459–471.
Li, T. H. Y., Ng, T. S. and Skitmore, M. (2012). Conflict or consensus: An investigation
of stakeholder concerns during the participation process of major infrastructure and
construction projects in Hong Kong, Habitat International, 36, 333 – 342.
Li, Y., Lu, Y. and Peng, Y. (2011). Hierarchical structuring success factors of project
stakeholder management in construction organizations, African Journal of Business
Managemnet 5(22), 9705 – 9713. http:/www.academicjournals.rog/AJBM.
256
Lim, C. S. and Mohamed, M. Z., (1999). Criteria of project success: an exploratory re-
examination, International Journal of Project Management 17 (4), 243–248.
Long, N. D., Ogunlana, S., Quang, T. and Lam, K. C. (2004). Large construction
projects in developing countries: a case study from Vietnam, International Journal
of Project management, 22: 553-561.
Love, P. E. D., Skitmore, N. and Earl, G. (1998). Selecting a suitable procurement
method for a building project, Construction Management and Economics 16, 221-
233.
Low, S.P. and Chuan, Q.T. (2006). Environmental factors and work performance of
project managers, International Journal of Project Management 21 (1), 24–37.
Manowang, E. and Ogunlana, S. (2010). Strategies and tactics for managing
construction stakeholders. In: Chinyio, E. and Olomolaiye, P. (Eds.) Construction
Stakeholder Management, John Wiley & Sons Ltd, United Kingdom, Pg 121 – 137.
Martis, M. S. (2006). Validation of simulation based models: a theoretical outlook. The
Electronic Journal of Business Research Methods, 4(1), 39-46.
Masterman, J. W. E. (2002). Introduction to Building Procurement Systems, 2nd ed.,
Spon Press, London.
Mathur, V. N., Price, A. D. F. and Austin, S. (2008). Conceptualizing stakeholder
engagement in the context of sustainability and its assessment, Construction
Management and Economics, 26: 6, 601-609.
McDermott, P. and Khalfan, M. M. A. (2006), “Achieving supply chain integration
within construction industry”, The Australian Journal of Construction Economics
and Building, 6 (2), pp. 44-54.
Miller, J. B. (2002). Case Studies in Infrastructure Delivery, Kluwer Academic,
London.
Mitchel, R. K., Agle, B. R. and Wood, D. J. (1997). Toward a theory of stakeholder
identification and salience: defining the principle of who and what really counts,
Academy management review, vol 22 no 4.
Mohamed, S. (2002). Safety Climate in Construction Site Environments. Journal of
Construction Engineering and Management, ASCE, 128(5), pp. 375-384.
257
Mohsini, R. A. (1993). Knowledge-based design of project-procurement process,
Journal of Computing in Civil Engineering, Vol. 7 No. 1, pp. 107-22.
Molenaar, K., Washington, S. and Diekmann, J. (2000). Structural equation model of
construction contract dispute potential. J. Constr. Eng. Manage., 126 (4), 268–277.
Morgan, D. L. (2007). Paradigms lost and pragmatism regained methodological
implications of combining qualitative and quantitative methods. Journal of mixed
methods research, 1(1), 48-76.
Morris, P.W.G. (1994). The Management of Projects: A New Model, Thomas Telford,
London.
Nash, S., Chinyio, E., Gameson, R. and Suresh, S. (2010). The dynamism of
stakeholders’ power in construction projects. In: Egbu, C. (Ed) procs 26th
Annual
ARCOM conference, 6 – 8 September, Leeds, UK, Association of Researchers in
Construction Management, 471 – 480.
Neuman, W.L. (2006) Social Research Methods: Qualitative and Quantitative
Approaches. Boston: Pearson.
Newcombe, R. (1996). Empowering the project team, International Journal of Project
Management, 14(2), 75–80.
Newcombe, R. (2003). From client to project stakeholders: a stakeholder mapping
approach, Construction Management and Economics, 21: 8, 841-848.
Ng, T., Rose, T., Mak, M. and Chen, S.E. (2002). Problematic issues associated with
project partnering – the contractor perspective. International Journal of Project
Management 20 (6), 437–449.
Norman, G. R., and Streiner, D.L (2003). PDQ Statistics (3rd ed.). B C Decker Inc.
Nunnally, J. C. and Bernstein, I. H. (1994) Psychometric Theory, McGraw-Hill, New
York.
OGC (2008), Review of government construction procurement strategies, The Final
Report of the Public Sector Construction Clients’ Forum, Office of Government
Commerce, Shanghai.

258
Ojiako, U., Johnson, E. and Greenwood, D. (2008). A qualitative re-construction of
project management criteria, Industrial Management and Data Systems, 108: 3, 405-
417.
Oke, A. E. Ogunsami, D. R. and Ogunlana, S. O. (2012). Establishing a common
ground for the use of structural equation modelling for construction related research
studies, Australasian Journal of Construction Economics and Building, 12 (3) 89-
94.
Olander, S. (2006) External stakeholder management, Unpublished PhD thesis, Lund
University.
Olander, S. (2007). Stakeholder impact analysis in construction project management,
Construction Management and Economics, 25: 3, 277-287.
Olander, S. and Landin, A. (2005). Evaluation of Stakeholder influence in the
implementation of construction projects, International Journal of Project
Management, 23, 321-328.
Olander, S. and Landin, A. (2008). A comparative studies of factors affecting the
external stakeholder management process, Construction Management and
Economics, 26(6), 553. doi:10.1080/01446190701821810.
Orndoff, C. J. W. (2005). Promising new tool for stakeholder interaction. Journal of
Architectural Engineering, 11(4), 139–46.
Oyegoke, A. S. (2001). UK and US Construction management contracting procedures
and practices: a comparative study, Journal of Engineering Construction and
Architectural Management, Vol. 8, Nos. 5/6, 403-417.
Oyegoke, A. S., Dickinson, M., Khalfan, M. M., McDermott, P. and Rowlinson, S.
(2009). Construction project procurement routes: an in-depth critique. International
Journal of Managing Projects in Business, 2(3), 338-354.
Ozorhon, B., Arditi, D., Dikmen, I. and Birgonul, M. T. (2007). Structural equation
modelling applications in construction management. International journal of project
management, 25, 799-806.

259
Ozorhon, B., Arditi, D., Dikmen, I. and Birgonul, M.T. (2011). Toward a
Multidimensional Performance Measure for International Joint Ventures in
Construction, J. Constr. Eng. Manage. 137(6):403-411.
Ozorhon, B., Dikmen, I. and Birgonul, M. T. (2009). Effects of host country and project
conditions in international construction joint ventures. In (Abott, C., Aouad, G.,
Kagioglou, M. and Pathmeswaran; eds.): International Research Symposium, the
Lowry, Salford Quays, greater Manchester, UK, 27th
-28th
January, 175-188.
Pajunen, K. (2006), Stakeholder influences in organisational survival, Journal of
Management Studies, 43(6), 1261-88.
Pallant, J., (2007). Survival manual: A step by step guide to data analysis using SPSS
for windows, 3rd
Edition, Open University press, McGraw-Hill, Uk.
Patton, M. Q. (1990). Qualitative evaluation and research methods . SAGE Publications,
inc, Thausand Oaks, CA.
Pesamaa, O., Erikson, P. E. and Hair, J. F. (2009). Validating a model of cooperative
procurement in the construction industry. International Journal of Project
Management, 27, 552-559.
PMI (2004) A Guide to the Project Management Body of Knowledge, 3rd edn, Project
Management Institute, Sylva, NC.
Portney, K. (2005). Civic engagement and sustainable cities in the United States. Public
Administration Review, 65(5), 579-591.
Portney, P. R. (1994). The contingent valuation debate: why economists should care.
The Journal of Economic Perspectives, 3-17.
Rahman, M. M. and Kumaraswamy, M. M. (2005). Relational Selection for
Collaborative Working Arrangements. Journal of Construction Engineering and
Management., 131(10), 1087–1098.
Reed, M. S., Graves, A., Dandy, N., Posthumus, H., Hubacek, K., Morris, J. and
Stringer, L. C. (2009). Who's in and why? A typology of stakeholder analysis
methods for natural resource management. Journal of environmental management,
90(5), 1933-1949.

260
RIBA (2005). Code of professional conducts for Architect. Royal Institute of British
Architect.
RIBA, (2007). The RIBA Outline Plan of Work, Royal Institute of British Architects.
RICS (2004). Contracts in Use – A Survey of Building Contracts in Use During 2004,
Royal Institution of Chartered Surveyors, Coventry.
RICS (2013). Rules of conduct for members. Royal Institute of Chartered Surveyors.
Rockart, J.F., (1979). Chief executives define their own data needs. Harvard Business
review; 57(2): 81–93.
Rossman, G. B. and Wilson, B. L. (1985). Numbers and Words Combining Quantitative
and Qualitative Methods in a Single Large-Scale Evaluation Study. Evaluation
review, 9(5), 627-643.
Rowe, G., and Frewer, L. J. (2005). “A typology of public engagement mechanisms.”
Sci. Tech. Hum. Values, 30(2), 251–290.
Rwelamila, P. D. (2010). Impact of procurement on stakeholder management. In:
Chinyio, E. and Olomolaiye, P. (Eds.) Construction Stakeholder Management, John
Wiley & Sons Ltd, United Kingdom, 193 – 215.
Sargent, R. G. (2005, December). Verification and validation of simulation models. In
Proceedings of the 37th conference on Winter simulation (pp. 130-143). Winter
Simulation Conference.
Saunders, M., Lewis P. and Thornhill, A. (2009). Research Methods for Business
Students. Financial Times Prentice Hall Inc., London.
Schlesinger, et al. (1979). Terminology for model credibility. Simulation 32 (3): 103-
104.
Schriesheim, C.A. (1979). The similarity of individual directed and group directed
leader behavior descriptions. Academy of Management Journal, 22, 345–55.
Scottish sustainable communities initiative (SSCI), (2008). Charrette series report,
http://www.scotland.gov.uk/Resource/Doc/260590/0105938.pdf. Last accessed 15th
March 2013.
Smith, J. and Love, P.E.D. (2004). Stakeholder management during project inception:
strategic needs analysis. Journal of Architectural Engineering, 10(1), 22–33.
261
Smith, J., Love, P. E. D. and Wyatt, R. G. (2001). To build or not to build? Assessing
the strategic needs of construction industry clients and their stakeholders. Structural
Survey, 19(2), 121–32.
Smyth, H. (2008). The credibility gap in stakeholder management: ethics and evidence
of relationship management. Construction Management and Economics, 26(6), 633-
643.
Steiger, J. H. (2007). Understanding the limitations of global fit assessment in structural
equation modelling. Personality and Individual Differences, 42 (5), 893-898.
Sutton, S. E. and Kemp, S. P. (2006). Integrating social science and design inquiry
through interdisciplinary design charrettes: an approach to participatory community
problem solving. American Journal of Community Psychology, 38(1-2), 125-139.
Tabachnick, B. G. and Fidell, L. S. (2007). Using multivariate statistics 5th
ed. New
York: Allyn and Bacon.
Takim, R. (2009). The Management of Stakeholders’ Needs and Expectations in the
Development of Construction Projects in Malaysia, Modern Applied Science, vol. 3
No. 5 pp 167-175, www.ccsenet.org/journal.html, available 17/11/2010.
Takim, R. and Akintoye, A., (2002). Performance indicators for successful construction
project performance. In: Greenwood, D. (Ed.), 18th
Annual ARCOM Conference, 2-
4 September, University of Northumbria Association of Researchers in Construction
Management, 2, 545-555.
Tashakkori, A. and Teddlie, C. (1998). Mixed methodology: Combining qualitative and
quantitative approaches. Sage publications, Thousand Oaks, CA.
Thomson, D. S., Austin, S. A., Devine-Wright, H. and Mills, G. R. (2003). Managing
value and quality in design. Building Research & Information, 31(5), 334-345.
Toor, S.R. and Ogunlana, S.O., (2008). Critical COMs of success in large-scale
construction projects: evidence from Thailand construction industry, International
Journal of Project Management 26 (4), 420–430.
Toor, S.R. and Ogunlana, S.O., (2010). Beyond the ‘iron triangle’: Stakeholder
perception of key performance indicators (KPIs) for large-scale public sector
development projects International Journal of Project Management 28, 228–236.

262
Tzortzopoulos, P., Cooper, R., Chan, P. and Kagioglou, M. (2006). Clients' activities at
the design front-end. Design Studies, 27(6), 657-683.
Vinten, G. (2000). The stakeholder manager. Management Decision, 38(6), 377-383.
Vogt, W. P., Gardner, D. C. and Haeffele, L. M. (2012). When to use what research
design. Guilford Press, NY.
Walker, D. H. T. and Hampson, K. D. (2003). Procurement Strategies: A Relationship
Based Approach, Blackwell, Oxford.
Walker, D. H. T., Bourne, L. M. and Rowlinson, S. (2008). Stakeholder and the supply
chain, In: Walker, D.H.T, Rowlinson, S. (Eds.), Procurement Systems: A Cross-
industry Project Management Perspective. Taylor & Francis, UK, 70–100.
Walker, I. (2010). Research Methods and statistics. Palgrave Macmillan.
Ward, S. and Chapman, C. (2008). Stakeholders and uncertainty management in
projects, Construction Management and Economics, 26: 6, 563-577.
Wateridge, J. (1998). How can IS/IT projects be measured for success. International
Journal of Project Management, 16 (1), 59-63.
Westland, J. C. (2012). Modern Path Analysis & Structural Equation Models.
CreateSpace Independent Publishing Platform.
Wheaton, B., Muthen, B., Alwin, D. F. and Summers, G. (1977). Assessing reliability
and stability in panel models. Sociological Methodology, 8 (1), 84-136.
Wilkinson, P. (2005). Construction collaboration technologies: the extranet evolution.
Taylor & Francis, US.
Winch, G. M., (2010). Managing Construction projects: an information processing
approach, 2nd Edition, Wiley-Blackwell, West Sussex, UK.
Wong, P.S.P. and Cheung, S. (2005). Structural equation model of trust and partnering
success. ASCE Journal of Management in Engineering, 21(2), 70–80.
Wong, W.K., Cheung, S.O., Yiu, T.W. and Pang, H.Y. (2008). A framework for trust in
construction contracting, International Journal of Project Management 26, 821–
829.

263
Yang, J., Shen, G. Q., Ho, M., Drew, D. S. and Chan, A. P. (2009). Exploring critical
success factors for stakeholder management in construction projects. Journal of civil
engineering and management, 15(4), 337-348.
Yang, J., Shen, G. Q., Ho, M., Drew, D. S. and Xue, X. (2011). Stakeholder
management in construction: An empirical study to address research gaps in
previous studies. International Journal of Project Management, 29(7), 900-910.
Yang, L. R., Chen, J. H. and Wang, H. W. (2012). Assessing impacts of information
technology on project success through knowledge management practice. Automation
in Construction, 22, 182–191.
Yang, R. J. and Shen, G. Q. P. (2014). Framework for stakeholder management in
construction projects, Journal of Management in Engineering, DOI:
10.1061/(ASCE)ME.1943-5479.0000285.
Yang, R. J., Wang, Y. and Jin, X-H. (2014). Stakeholders’ attributes, behaviours, and
decision-making strategies in construction projects: Importance and correlation in
practice. Project Management Journal, 45 (3), 74 – 90.
Yin, R. (2003). K.(2003). Case study research: Design and methods. Sage publications,
Inc, 5, 11.
Young, T. L. (2006). Successful Project Management, Second Edition. Kogan Page,
UK.
Yu, T.W., Shen, Q.P., Kelly, J. and Hunter, K. (2007). An empirical study of the
variables affecting construction project briefing/architectural programming,
International Journal of Project Management, 25(2), 198-212.
Yuan, K., Wu, R. and Bentler, P. M. (2010). Ridge structural equation modelling with
correlation matrices for ordinal and continuous data, British Journal of Mathematical
and Statistical Psychology, 64, 107-133.

264
Appendices
Appendix A: Questionnaire survey instrument.
INVESTIGATING CURRENT PRACTICE AND CRITICAL SUCCESS FACTORS
FOR STAKEHOLDER MANAGEMENT IN CONSTRUCTION PROJECTS
This survey is being carried out as part of my PhD research aimed at developing a
comprehensive framework for carrying out stakeholder management in construction
projects. The survey is aimed at investigating current practice and critical success
factors for stakeholder management.
Your time in filling this questionnaire will be appreciated. Please click next to
continue and complete the survey and remember to click submit at the end.
There are 26 questions in this survey
SECTION A (1 OF 3): BACKGROUND INFORMATION
1. Please indicate your years of professional experience in construction.
Please choose only one of the following:
From 1 to 5
From 6 to 10
From 11 to 15
From 16 to 20
From 21 and above
2. Please indicate your profession (field of work)
Please choose all that apply:
Architecture
Construction management
Quantity surveying
Engineering
Facility management
Other:

265
3. Please indicate your Job title.
Please choose only one of the following:
Project director
Project manager/ Construction manger
Contract administrator
Assistant manager
Site manager
Project engineer
Designer/consultant
Other
4. Please indicate your highest academic qualification
Please choose only one of the following:
ND/NC
HND/HNC
B.Sc/B.Eng/B.Tech
M.Sc/M.Eng/M.Tech/P.Dip
PhD/D.Eng
Other
5. Please indicate your professional body (ies) membership. Choose more than one if
applicable.
Please choose all that apply:
RIBA
CIOB
RICS

266
RICE
RISE
CIBSE
Other:
SECTION B (2 OF 3): INVESTIGATING CSFS FOR STAKEHOLDER
MANAGEMENT (SM) IN CONSTRUCTION PROJECTS.
6. Please indicate your level of agreement with the following statements about
stakeholder management: on "stakeholder characteristics and project characteristics
related actions"
1 = Strongly Disagree; 2 = Disagree; 3 = Neutral; 4 = Agree; 5 = Strongly Agree
Please choose the appropriate response for each item:
1 2 3 4 5
Clearly formulating the project mission will enable effective
stakeholder management
Ensuring the use of a favourable procurement method will enable
effective stakeholder management
Carefully identifying and listing the project stakeholders will
enable effective stakeholder management
Ensuring flexible project organisation will enable effective
stakeholder management
Identifying and understanding stakeholders' areas of interests in
the project will enable effective stakeholder management
7. Please indicate your level of agreement with the following statements about
stakeholder management: on "stakeholder analysis related actions"
1 = Strongly Disagree; 2 = Disagree; 3 = Neutral; 4 = Agree; 5 = Strongly
Agree
Please choose the appropriate response for each item:
1 2 3 4 5
Determining and assessing the power (capacity to influence the
actions of other stakeholders); urgency (degree to which

267
1 2 3 4 5
stakeholders’ claims requires immediate attention); legitimacy
(perceived validity of claims); and proximity (level of association
or closeness with the project) of stakeholders will enable effective
stakeholder management
Appropriately classifying stakeholders according to their
attributes/characteristics (Power, legitimacy, urgency, proximity,
level of interest, etc) will enable effective stakeholder
management
Predicting and mapping stakeholders’ behaviours (supportive,
opposition, neutral, etc) will enable effective stakeholder
management
Predicting stakeholders’ potential influence on each other will
enable effective stakeholder management
Predicting stakeholders’ potential influence on the project will
enable effective stakeholder management
Identifying and analysing possible conflicts and coalitions among
stakeholders will enable effective stakeholder management
8. Please indicate your level of agreement with the following statements about
stakeholder management: on "stakeholder dynamics related actions"
1 = Strongly Disagree; 2 = Disagree; 3 = Neutral; 4 = Agree; 5 = Strongly
Agree
Please choose the appropriate response for each item:
1 2 3 4 5
Resolving conflicts among stakeholders effectively will enable
effective stakeholder management
Managing the change of stakeholders’ interests will enable
effective stakeholder management
Managing the change of stakeholders’ influence will enable
effective stakeholder management
Managing the change of relationship among stakeholders will
enable effective stakeholder management
Managing change of stakeholders’ attributes will enable effective
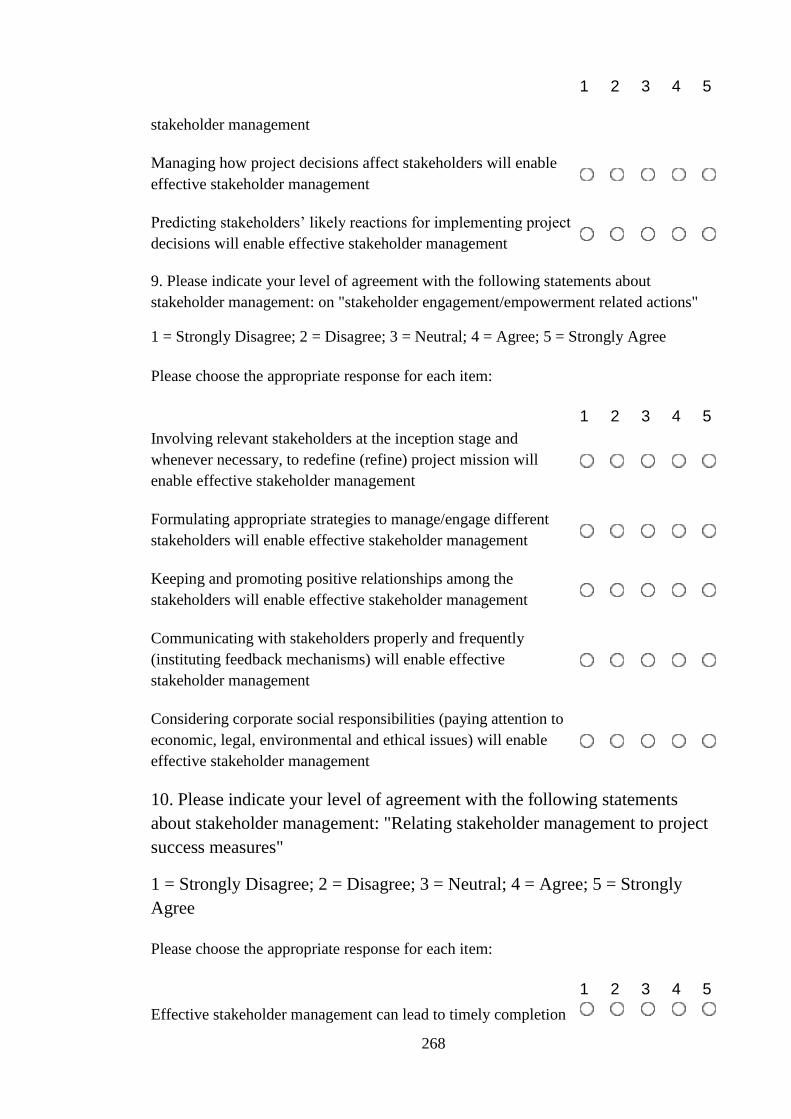
268
1 2 3 4 5
stakeholder management
Managing how project decisions affect stakeholders will enable
effective stakeholder management
Predicting stakeholders’ likely reactions for implementing project
decisions will enable effective stakeholder management
9. Please indicate your level of agreement with the following statements about
stakeholder management: on "stakeholder engagement/empowerment related actions"
1 = Strongly Disagree; 2 = Disagree; 3 = Neutral; 4 = Agree; 5 = Strongly Agree
Please choose the appropriate response for each item:
1 2 3 4 5
Involving relevant stakeholders at the inception stage and
whenever necessary, to redefine (refine) project mission will
enable effective stakeholder management
Formulating appropriate strategies to manage/engage different
stakeholders will enable effective stakeholder management
Keeping and promoting positive relationships among the
stakeholders will enable effective stakeholder management
Communicating with stakeholders properly and frequently
(instituting feedback mechanisms) will enable effective
stakeholder management
Considering corporate social responsibilities (paying attention to
economic, legal, environmental and ethical issues) will enable
effective stakeholder management
10. Please indicate your level of agreement with the following statements
about stakeholder management: "Relating stakeholder management to project
success measures"
1 = Strongly Disagree; 2 = Disagree; 3 = Neutral; 4 = Agree; 5 = Strongly
Agree
Please choose the appropriate response for each item:
1 2 3 4 5
Effective stakeholder management can lead to timely completion
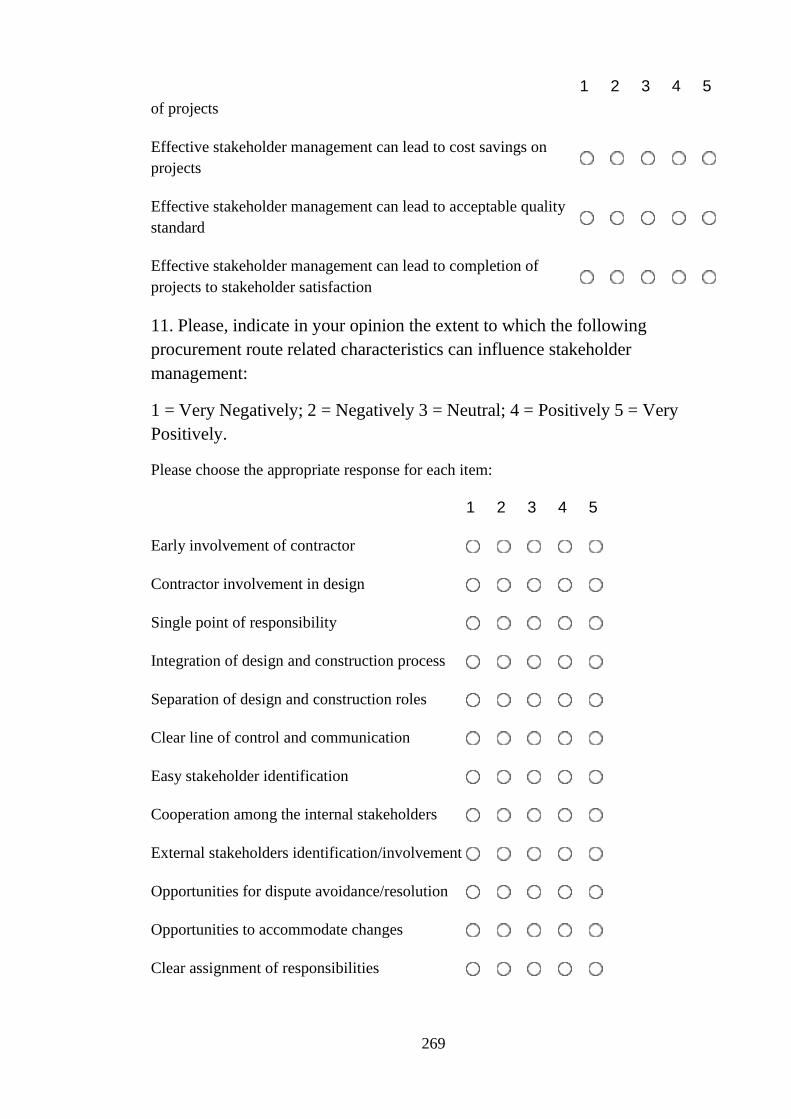
269
1 2 3 4 5
of projects
Effective stakeholder management can lead to cost savings on
projects
Effective stakeholder management can lead to acceptable quality
standard
Effective stakeholder management can lead to completion of
projects to stakeholder satisfaction
11. Please, indicate in your opinion the extent to which the following
procurement route related characteristics can influence stakeholder
management:
1 = Very Negatively; 2 = Negatively 3 = Neutral; 4 = Positively 5 = Very
Positively.
Please choose the appropriate response for each item:
1 2 3 4 5
Early involvement of contractor
Contractor involvement in design
Single point of responsibility
Integration of design and construction process
Separation of design and construction roles
Clear line of control and communication
Easy stakeholder identification
Cooperation among the internal stakeholders
External stakeholders identification/involvement
Opportunities for dispute avoidance/resolution
Opportunities to accommodate changes
Clear assignment of responsibilities

270
Section C (3 of 3): Current practice of stakeholder management in
construction.
Please answer the questions in this section based on your experience with a recently
completed project.
12. Type of client for the project
Please choose only one of the following:
Public
Private
Public and private
13. What forms of contract did you use for the project?
Please choose only one of the following:
Standard form JCT
NEC
Bespoke contracts
Other
14. How would you rate the extent to which the form of contracts facilitated stakeholder
management on this project?
1 = Very Negatively; 2 = Negatively 3 = Neutral; 4 = Positively 5 = Very Positively
Please choose the appropriate response for each item:
1 2 3 4 5
Standard form JCT
NEC
Bespoke contracts
15. Did you have stakeholder management on the project? Yes or No, if No, please go
to question 19.
Please choose only one of the following:
Yes

271
No
16. Were there any funds allocated for stakeholder management? Yes or No, if Yes,
please answer the next question.
Please choose only one of the following:
Yes
No
17. If answer to 16 is Yes, please indicate as a percentage of project cost to take care of
responsible personnel and associated cost in the box provided. For example, if answer is
5%, enter 05 in the box.
Please write your answer here:
----------------------------------
18. Was anyone specifically assigned the overall responsibility of stakeholder
management on the project?
Please choose only one of the following:
Yes
No
19. Was/were there any noticeable change(s) in the interest/disposition of stakeholders
towards the project as the project progressed? Yes or No, if No, please, go to Question
22. (For example, supportive stakeholders changing to opposing ones).
Please choose only one of the following:
Yes
No
20. In your opinion what made stakeholders’ interest/dispositions towards the project to
change as the project progressed? Please indicate as many as applicable among the
following:
Please choose all that apply:
Change in project mission
Perceived non involvement
Loss of confidence and trust in the project team

272
Loss of confidence and trust in the project
Gaining confidence and trust in the project
Acquisition of information previously not available to them
Other:
21. How did you monitor and track the changes in stakeholders’ interest/disposition
towards the project? Indicate if more than one are applicable.
Please choose all that apply:
By feedback mechanisms
By early warning signs
By check list
Other:
22. Do you agree that there should be collaboration among internal stakeholders at all
the stages in carrying out stakeholder management? Yes ( ) No ( ). If Yes please
indicate by ticking those you think should be involved at the respective stages in
questions 23.
Please choose only one of the following:
Yes
No
23. Please indicate by ticking all who you think should be involved in collaboration at
the various stages in carrying out stakeholder management. (Note:* Project consultant is
anybody other than the Designer, project manager, project QS and Contract
administrator employed by the client to perform a specific role on the project).
Inception
stage
Design
stage
Construction
stage
Operation
stage
Designer organisation
Project management
organisation

273
Inception
stage
Design
stage
Construction
stage
Operation
stage
Project consultant*
Project QS
Contract Administrator
Main Contractor
Facility management
organisation
Client
24. In your opinion who should lead stakeholder management at the various stages of a
project? Please indicate by ticking as many as you think applicable. (Note:* Project
consultant is anybody other than the Designer, project manager, project QS and
Contract administrator employed by the client to perform a specific role on the project).
Inception
stage
Design
stage
Construction
stage
Operation
stage
Designer organisation
Project management
organisation
Project consultant*
Project QS
Contract Admisitrator
Main Contractor
Facility management
organisation
Client
25. Please rate the extent to which you agree that these techniques would be effective in
stakeholder engagement/management if you are aware of them:
1 = Strongly Disagree; 2 = Disagree; 3 = Neutral; 4 = Agree and 5 = Strongly Agree,
NA = No Answer
Please choose the appropriate response for each item:

274
1 2 3 4 5
Design charrette
Delphi technique
Strategic needs analysis
Contingent valuation method
Stakeholder cycle
Public hearing
26. Please give any suggestions on how to improve stakeholder management in
construction projects in the space below:
Please write your answer here: --------------------------------------------------------------------
----------------------------------------------------------------------------------------------------------
----------------------------
Thank you for your kind help in completing this survey. Your time is sincerely
appreciated.
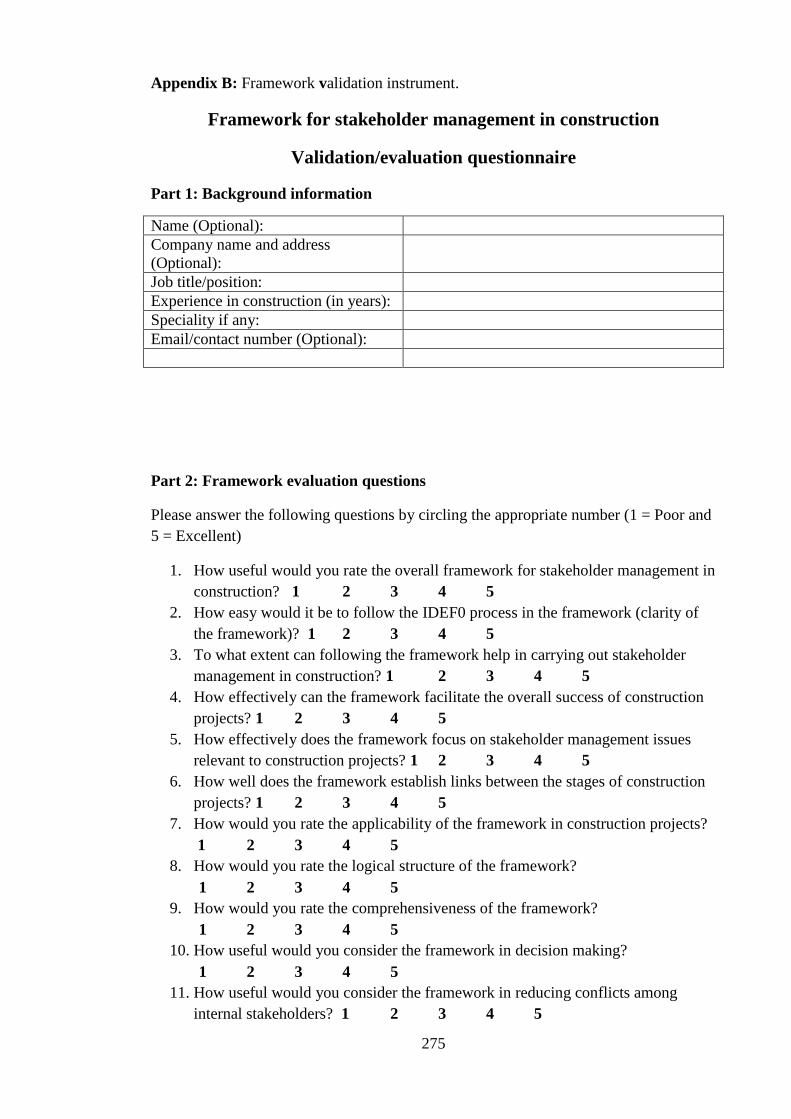
275
Appendix B: Framework validation instrument.
Framework for stakeholder management in construction
Validation/evaluation questionnaire
Part 1: Background information
Name (Optional):
Company name and address
(Optional):
Job title/position:
Experience in construction (in years):
Speciality if any:
Email/contact number (Optional):
Part 2: Framework evaluation questions
Please answer the following questions by circling the appropriate number (1 = Poor and
5 = Excellent)
1. How useful would you rate the overall framework for stakeholder management in
construction? 1 2 3 4 5
2. How easy would it be to follow the IDEF0 process in the framework (clarity of
the framework)? 1 2 3 4 5
3. To what extent can following the framework help in carrying out stakeholder
management in construction? 1 2 3 4 5
4. How effectively can the framework facilitate the overall success of construction
projects? 1 2 3 4 5
5. How effectively does the framework focus on stakeholder management issues
relevant to construction projects? 1 2 3 4 5
6. How well does the framework establish links between the stages of construction
projects? 1 2 3 4 5
7. How would you rate the applicability of the framework in construction projects?
1 2 3 4 5
8. How would you rate the logical structure of the framework?
1 2 3 4 5
9. How would you rate the comprehensiveness of the framework?
1 2 3 4 5
10. How useful would you consider the framework in decision making?
1 2 3 4 5
11. How useful would you consider the framework in reducing conflicts among
internal stakeholders? 1 2 3 4 5

276
Part 3: General comments (to be recorded during question and answer
discussions)
1. What do you consider the main benefits of the framework for stakeholder
management in construction or what do you particularly like about the
framework? ...
2. What improvements would you suggest for the framework? ...
3. What do you think are the likely obstacles to the use of the framework for
stakeholder management in construction projects? ...
4. Please make any other comments….
Thanks a lot for your valuable help.
Jurbe Joseph Molwus.
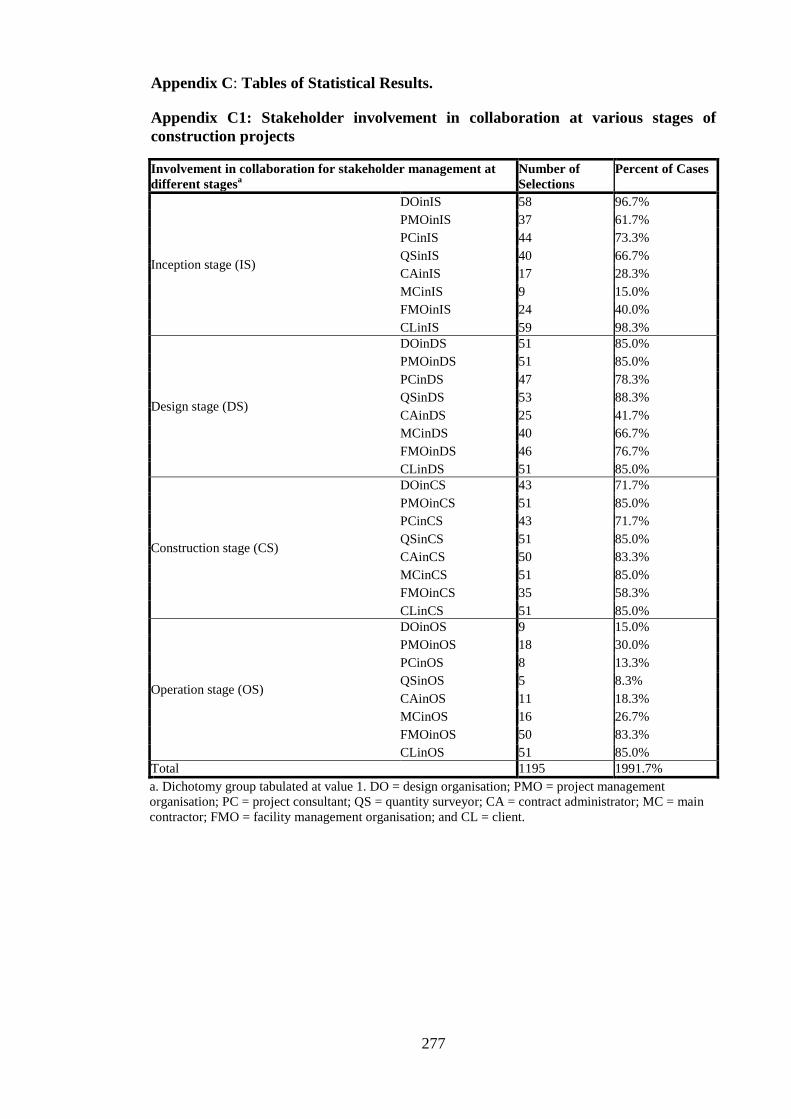
277
Appendix C: Tables of Statistical Results.
Appendix C1: Stakeholder involvement in collaboration at various stages of
construction projects
Involvement in collaboration for stakeholder management at
different stagesa
Number of
Selections
Percent of Cases
Inception stage (IS)
DOinIS 58 96.7%
PMOinIS 37 61.7%
PCinIS 44 73.3%
QSinIS 40 66.7%
CAinIS 17 28.3%
MCinIS 9 15.0%
FMOinIS 24 40.0%
CLinIS 59 98.3%
Design stage (DS)
DOinDS 51 85.0%
PMOinDS 51 85.0%
PCinDS 47 78.3%
QSinDS 53 88.3%
CAinDS 25 41.7%
MCinDS 40 66.7%
FMOinDS 46 76.7%
CLinDS 51 85.0%
Construction stage (CS)
DOinCS 43 71.7%
PMOinCS 51 85.0%
PCinCS 43 71.7%
QSinCS 51 85.0%
CAinCS 50 83.3%
MCinCS 51 85.0%
FMOinCS 35 58.3%
CLinCS 51 85.0%
Operation stage (OS)
DOinOS 9 15.0%
PMOinOS 18 30.0%
PCinOS 8 13.3%
QSinOS 5 8.3%
CAinOS 11 18.3%
MCinOS 16 26.7%
FMOinOS 50 83.3%
CLinOS 51 85.0%
Total 1195 1991.7%
a. Dichotomy group tabulated at value 1. DO = design organisation; PMO = project management
organisation; PC = project consultant; QS = quantity surveyor; CA = contract administrator; MC = main
contractor; FMO = facility management organisation; and CL = client.

278
Appendix C2: Kruskal-Wallis test on the influence of respondents’ professions in
selecting who should be involved in stakeholder collaboration at the various stages
of construction projects.
Internal
stakeholders
Professional field of practice N Mean Rank Asymp. Sig.
DOinIS Architecture
Construction management
Quantity surveying
Engineering
Facility management
Total
11
18
13
10
6
58
29.50
29.50
29.50
29.50
29.50
1.00
DOinDS Architecture
Construction management
Quantity surveying
Engineering
Facility management
Total
12
14
11
9
6
52
27.00
27.00
27.00
24.11
27.00
0.311
DOinCS Architecture
Construction management
Quantity surveying
Engineering
Facility management
Total
12
12
9
7
4
44
23.00
23.00
23.00
19.86
23.00
0.259
DOinOS Architecture
Construction management
Quantity surveying
Engineering
Facility management
Total
5
2
1
4
2
14
8.60
6.50
10.00
6.50
6.50
0.795
PMOinIS Architecture
Construction management
Quantity surveying
Engineering
Facility management
Total
9
11
7
8
4
39
18.83
21.00
18.21
21.00
21.00
0.552
PMOinDS Architecture
Construction management
Quantity surveying
Engineering
Facility management
Total
11
16
10
8
6
51
26.00
26.00
26.00
26.00
26.00
1.000
PMOinCS Architecture
Construction management
Quantity surveying
Engineering
Facility management
Total
12
14
11
8
6
51
26.00
26.00
26.00
26.00
26.00
1.000
PMOinOS Architecture
Construction management
Quantity surveying
Engineering
Facility management
Total
7
7
1
4
4
23
11.21
12.86
14.50
11.63
11.63
0.949
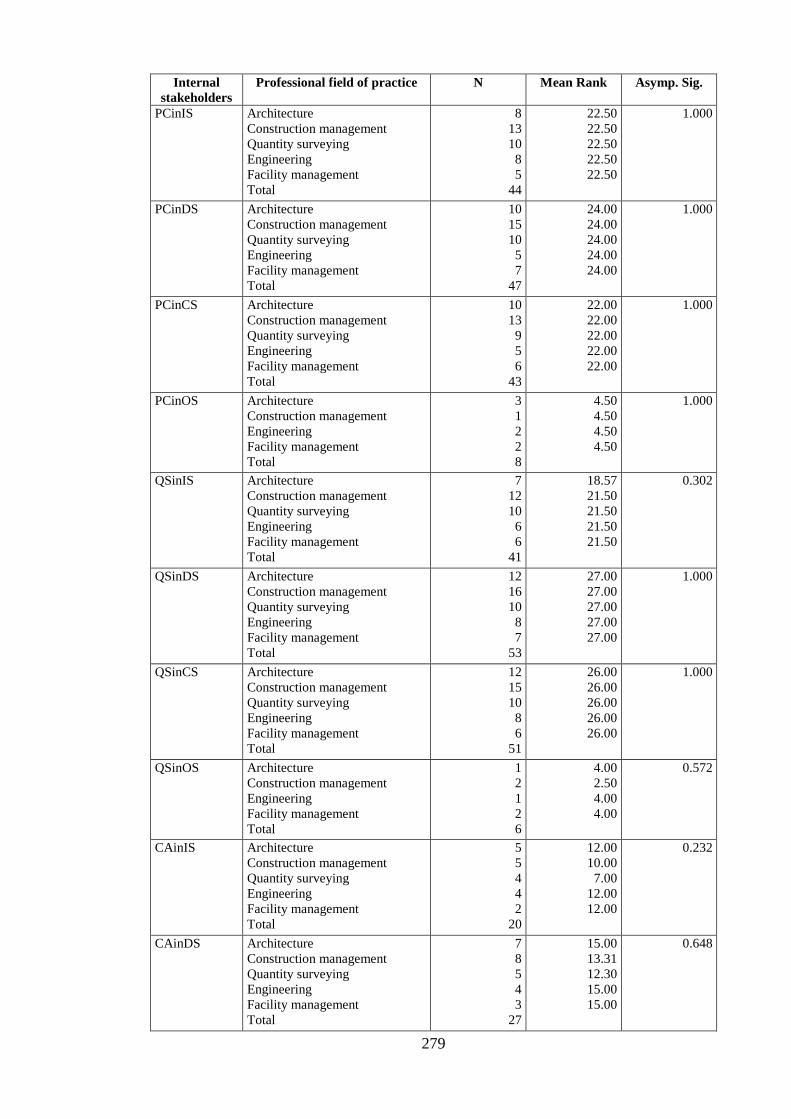
279
Internal
stakeholders
Professional field of practice N Mean Rank Asymp. Sig.
PCinIS Architecture
Construction management
Quantity surveying
Engineering
Facility management
Total
8
13
10
8
5
44
22.50
22.50
22.50
22.50
22.50
1.000
PCinDS Architecture
Construction management
Quantity surveying
Engineering
Facility management
Total
10
15
10
5
7
47
24.00
24.00
24.00
24.00
24.00
1.000
PCinCS Architecture
Construction management
Quantity surveying
Engineering
Facility management
Total
10
13
9
5
6
43
22.00
22.00
22.00
22.00
22.00
1.000
PCinOS Architecture
Construction management
Engineering
Facility management
Total
3
1
2
2
8
4.50
4.50
4.50
4.50
1.000
QSinIS Architecture
Construction management
Quantity surveying
Engineering
Facility management
Total
7
12
10
6
6
41
18.57
21.50
21.50
21.50
21.50
0.302
QSinDS Architecture
Construction management
Quantity surveying
Engineering
Facility management
Total
12
16
10
8
7
53
27.00
27.00
27.00
27.00
27.00
1.000
QSinCS Architecture
Construction management
Quantity surveying
Engineering
Facility management
Total
12
15
10
8
6
51
26.00
26.00
26.00
26.00
26.00
1.000
QSinOS Architecture
Construction management
Engineering
Facility management
Total
1
2
1
2
6
4.00
2.50
4.00
4.00
0.572
CAinIS Architecture
Construction management
Quantity surveying
Engineering
Facility management
Total
5
5
4
4
2
20
12.00
10.00
7.00
12.00
12.00
0.232
CAinDS Architecture
Construction management
Quantity surveying
Engineering
Facility management
Total
7
8
5
4
3
27
15.00
13.31
12.30
15.00
15.00
0.648

280
Internal
stakeholders
Professional field of practice N Mean Rank Asymp. Sig.
CAinCS Architecture
Construction management
Quantity surveying
Engineering
Facility management
Total
12
15
10
7
6
50
25.50
25.50
25.50
25.50
25.50
1.000
CAinOS Architecture
Construction management
Quantity surveying
Engineering
Facility management
Total
3
3
3
2
1
12
7.00
5.00
7.00
7.00
7.00
0.558
MCinIS Architecture
Construction management
Quantity surveying
Engineering
Total
2
3
2
3
10
6.00
6.00
3.50
6.00
0.261
MCinDS Architecture
Construction management
Quantity surveying
Engineering
Facility management
Total
11
13
6
6
6
42
22.50
20.88
22.50
22.50
19.00
0.526
MCinCS Architecture
Construction management
Quantity surveying
Engineering
Facility management
Total
12
15
11
8
6
52
27.00
25.27
27.00
27.00
27.00
0.651
MCinOS Architecture
Construction management
Quantity surveying
Engineering
Facility management
Total
5
4
3
4
1
17
9.50
7.38
9.50
9.50
9.50
0.517
FMOinIS Architecture
Construction management
Quantity surveying
Engineering
Facility management
Total
8
8
7
2
1
26
14.50
14.50
12.64
14.50
1.50
0.010
FMOinDS Architecture
Construction management
Quantity surveying
Engineering
Facility management
Total
11
14
8
8
6
47
24.50
24.50
21.56
24.50
24.50
0.300
FMOinCS Architecture
Construction management
Quantity surveying
Engineering
Facility management
Total
7
11
8
5
5
36
19.00
19.00
16.75
19.00
19.00
0.478

281
Internal
stakeholders
Professional field of practice N Mean Rank Asymp. Sig.
FMOinOS Architecture
Construction management
Quantity surveying
Engineering
Facility management
Total
12
14
11
8
6
51
26.50
26.50
24.18
26.50
26.50
0.457
CLinIS Architecture
Construction management
Quantity surveying
Engineering
Facility management
Total
12
18
13
10
7
60
31.00
31.00
31.00
31.00
26.71
0.109
CLinDS Architecture
Construction management
Quantity surveying
Engineering
Facility management
Total
12
14
11
8
6
51
26.00
26.00
26.00
26.00
26.00
1.000
CLinCS Architecture
Construction management
Quantity surveying
Engineering
Facility management
Total
12
14
11
9
6
52
27.00
27.00
27.00
27.00
22.67
0.105
CLinOS Architecture
Construction management
Quantity surveying
Engineering
Facility management
Total
12
14
11
8
6
51
26.00
26.00
26.00
26.00
26.00
1.000
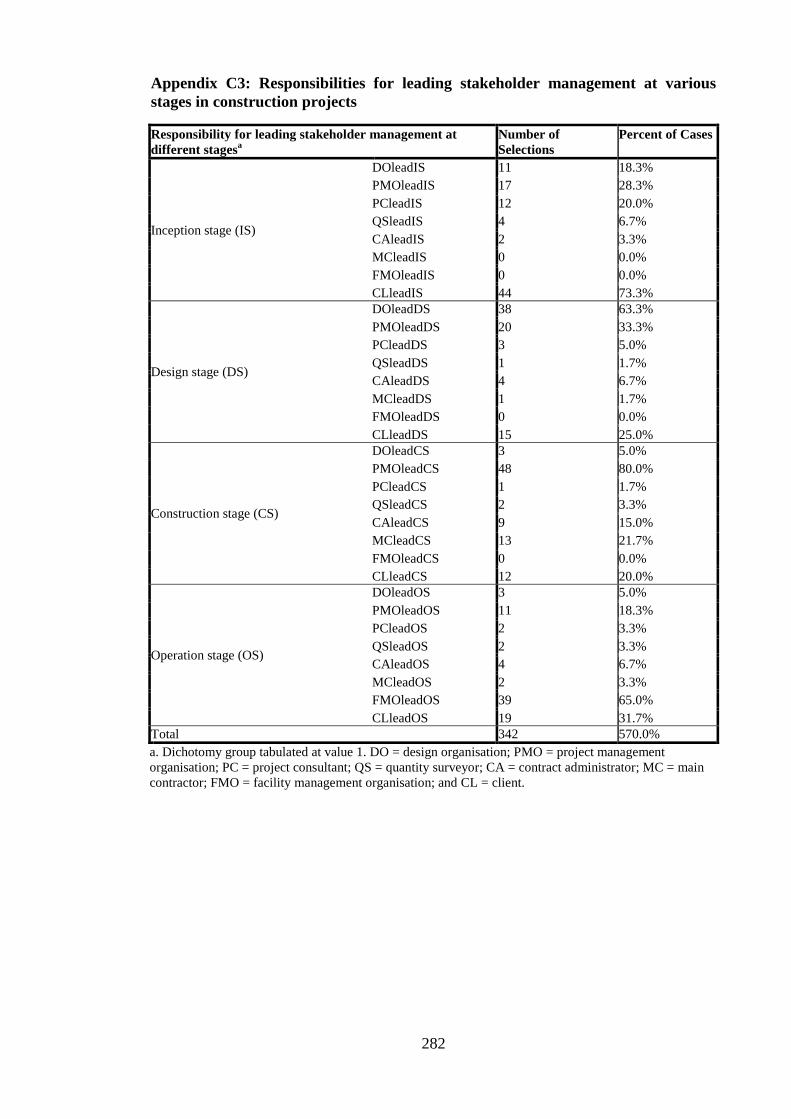
282
Appendix C3: Responsibilities for leading stakeholder management at various
stages in construction projects
Responsibility for leading stakeholder management at
different stagesa
Number of
Selections
Percent of Cases
Inception stage (IS)
DOleadIS 11 18.3%
PMOleadIS 17 28.3%
PCleadIS 12 20.0%
QSleadIS 4 6.7%
CAleadIS 2 3.3%
MCleadIS 0 0.0%
FMOleadIS 0 0.0%
CLleadIS 44 73.3%
Design stage (DS)
DOleadDS 38 63.3%
PMOleadDS 20 33.3%
PCleadDS 3 5.0%
QSleadDS 1 1.7%
CAleadDS 4 6.7%
MCleadDS 1 1.7%
FMOleadDS 0 0.0%
CLleadDS 15 25.0%
Construction stage (CS)
DOleadCS 3 5.0%
PMOleadCS 48 80.0%
PCleadCS 1 1.7%
QSleadCS 2 3.3%
CAleadCS 9 15.0%
MCleadCS 13 21.7%
FMOleadCS 0 0.0%
CLleadCS 12 20.0%
Operation stage (OS)
DOleadOS 3 5.0%
PMOleadOS 11 18.3%
PCleadOS 2 3.3%
QSleadOS 2 3.3%
CAleadOS 4 6.7%
MCleadOS 2 3.3%
FMOleadOS 39 65.0%
CLleadOS 19 31.7%
Total 342 570.0%
a. Dichotomy group tabulated at value 1. DO = design organisation; PMO = project management
organisation; PC = project consultant; QS = quantity surveyor; CA = contract administrator; MC = main
contractor; FMO = facility management organisation; and CL = client.

283
Appendix C4: Kruskal-Wallis test on the influence of respondents’ professions in
selecting who should lead/coordinate stakeholder management at the various
stages of construction projects.
Internal stakeholders Professional field of practice N Mean Rank Asymp. Sig.
DOleadIS Architecture
Construction management
Quantity surveying
Engineering
Facility management
Total
2
8
2
2
3
17
12.00
9.88
7.75
7.75
6.33
0.566
DOleadDS Architecture
Construction management
Quantity surveying
Engineering
Facility management
Total
8
14
8
5
4
39
20.50
20.50
20.50
20.50
15.63
0.068
DOleadCS Architecture
Quantity surveying
Total
2
2
4
3.00
2.00
0.317
DOleadOS Architecture
Construction management
Quantity surveying
Total
1
1
1
3
2.00
2.00
2.00
1.000
PMOleadIS Architecture
Construction management
Quantity surveying
Engineering
Facility management
Total
5
6
1
2
3
17
9.00
9.00
9.00
9.00
9.00
1.000
PMOleadDS Architecture
Construction management
Quantity surveying
Engineering
Facility management
Total
7
4
5
1
4
21
11.50
11.50
9.40
11.50
11.50
0.525
PMOleadCS Architecture
Construction management
Quantity surveying
Engineering
Facility management
Total
12
17
8
5
6
48
24.50
24.50
24.50
24.50
24.50
1.000
PMOleadOS Architecture
Construction management
Quantity surveying
Engineering
Facility management
Total
2
5
2
1
1
11
6.00
6.00
6.00
6.00
6.00
1.000
PCleadIS Architecture
Construction management
Quantity surveying
Engineering
Facility management
Total
2
4
3
3
2
14
8.50
6.75
6.17
8.50
8.50
0.689
PCleadDS Quantity surveying
Engineering
Total
2
1
3
2.00
2.00
1.000

284
Internal stakeholders Professional field of practice N Mean Rank Asymp. Sig.
PCleadCS Architecture
Quantity surveying
Total
1
1
2
2.00
1.00
0.317
PCleadOS Architecture
Construction management
Total
1
1
2
1.50
1.50
1.000
QSleadIS Construction management
Quantity surveying
Engineering
Total
1
1
2
4
2.50
2.50
2.50
1.000
QSleadCS Architecture
Construction management
Total
1
1
2
1.50
1.50
1.000
QSleadOS Architecture
Construction management
Total
1
1
2
1.50
1.50
1.000
CAleadIS Engineering
Total
2
2a
1.50 -
CAleadDS Quantity surveying
Engineering
Facility management
Total
2
1
1
4
2.50
2.50
2.50
1.000
CAleadCS Architecture
Construction management
Quantity surveying
Engineering
Facility management
Total
1
1
4
1
2
9
5.00
5.00
5.00
5.00
5.00
1.000
CAleadOS Construction management
Quantity surveying
Engineering
Total
2
1
1
4
2.50
2.50
2.50
1.000
MCleadCS Architecture
Construction management
Quantity surveying
Engineering
Total
2
5
3
3
13
7.00
7.00
7.00
7.00
1.000
MCleadOS Architecture
Construction management
Total
1
1
2
1.50
1.50
1.000
FMOleadIS Architecture
Construction management
Quantity surveying
Total
1
1
1
3
2.00
2.00
2.00
1.000
FMOleadOS Architecture
Construction management
Quantity surveying
Engineering
Facility management
Total
9
12
9
4
5
39
20.00
20.00
20.00
20.00
20.00
1.000
CLleadIS Architecture
Construction management
Quantity surveying
Engineering
Facility management
Total
7
16
11
7
4
45
23.50
23.50
23.50
20.29
23.50
0.246

285
Internal stakeholders Professional field of practice N Mean Rank Asymp. Sig.
CLleadDS Architecture
Construction management
Quantity surveying
Engineering
Total
4
8
2
2
16
9.00
9.00
5.00
9.00
0.072
CLleadCS Architecture
Construction management
Quantity surveying
Engineering
Total
2
6
2
2
12
6.50
6.50
6.50
6.50
1.000
CLleadOS Architecture
Construction management
Quantity surveying
Engineering
Facility management
Total
4
6
3
4
2
19
10.00
10.00
10.00
10.00
10.00
1.000
a. There is only one non-empty group. Kruskal-Wallis Test cannot be performed.

286
Appendix C5: Kruskal-Wallis test on the influence of respondents’ profession on
their rating of the procurement route related characteristics of stakeholder
management in construction projects
Procurement route related
characteristics
Professional field of practice N Mean Rank Asymp.
Sig.
Early involvement of contractor Architecture 12 26.38 0.491
Construction management 18 30.33
Quantity surveying 14 34.57
Engineering 10 27.90
Facility management 7 37.93
Total 61
Contractor involvement in
design
Architecture 12 23.46 0.294
Construction management 18 30.86
Quantity surveying 14 37.79
Engineering 10 30.00
Facility management 7 32.14
Total 61
Single point of responsibility Architecture 12 33.08 0.591
Construction management 18 29.44
Quantity surveying 14 32.36
Engineering 10 35.20
Facility management 7 22.71
Total 61
Integration of design and
construction process
Architecture 12 29.00 0.982
Construction management 18 32.00
Quantity surveying 14 30.25
Engineering 10 32.90
Facility management 7 30.64
Total 61
Seperation of design and
construction roles
Architecture 12 30.96 0.215
Construction management 18 35.44
Quantity surveying 14 34.57
Engineering 10 25.00
Facility management 7 21.07
Total 61
Clear lines of control and
communication
Architecture 12 31.58 0.413
Construction management 18 31.06
Quantity surveying 14 33.96
Engineering 10 33.70
Facility management 7 20.07
Total 61
Easy stakeholder identification Architecture 12 39.42 0.107
Construction management 18 34.28
Quantity surveying 14 26.75
Engineering 10 27.30
Facility management 7 21.93
Total 61
Cooperation among the internal
stakeholders
Architecture 12 31.33 0.047
Construction management 18 37.56
Quantity surveying 14 22.54
Engineering 10 25.75
Facility management 7 38.00
Total 61
External stakeholders
identification/involvement
Architecture 12 39.96 0.153
Construction management 18 30.36
Quantity surveying 14 28.71

287
Procurement route related
characteristics
Professional field of practice N Mean Rank Asymp.
Sig.
Engineering 10 26.35
Facility management 7 28.50
Total 61
Opportunities for dispute
avoidance/resolution
Architecture 12 33.88 0.368
Construction management 18 31.89
Quantity surveying 14 34.82
Engineering 10 27.10
Facility management 7 21.71
Total 61
Opportunities to accomodate
changes
Architecture 12 31.50 0.409
Construction management 18 32.81
Quantity surveying 14 34.36
Engineering 10 22.10
Facility management 7 31.50
Total 61
Clear assignment of
responsibilities
Architecture 12 23.00 0.096
Construction management 18 28.56
Quantity surveying 14 34.18
Engineering 10 40.90
Facility management 7 30.50
Total 61

288
Appendix C6: Correlation of procurement route related characteristics of stakeholder management
PROCC1 PROCC2 PROCC3 PROCC4 PROCC5 PROCC6 PROCC7 PROCC8 PROCC9 PROCC10 PROCC11 PROCC12
PROCC1 Pearson Correlation 1 .730**
.012 .502**
-.103 .117 -.026 .250 .227 .012 .107 .076
Sig. (2-tailed) .000 .930 .000 .428 .368 .845 .052 .079 .929 .410 .558
N 61 61 61 61 61 61 61 61 61 61 61 61
PROCC2 Pearson Correlation .730**
1 .128 .509**
-.071 .139 -.062 .073 .012 -.066 .110 .175
Sig. (2-tailed) .000 .325 .000 .587 .285 .635 .574 .929 .615 .398 .177
N 61 61 61 61 61 61 61 61 61 61 61 61
PROCC3 Pearson Correlation .012 .128 1 .176 .010 .279* .207 .116 .048 .085 .065 .268
*
Sig. (2-tailed) .930 .325 .176 .937 .030 .110 .372 .714 .513 .617 .037
N 61 61 61 61 61 61 61 61 61 61 61 61
PROCC4 Pearson Correlation .502**
.509**
.176 1 -.155 .231 .208 .158 .146 .151 .089 .061
Sig. (2-tailed) .000 .000 .176 .234 .074 .108 .223 .261 .245 .495 .642
N 61 61 61 61 61 61 61 61 61 61 61 61
PROCC5 Pearson Correlation -.103 -.071 .010 -.155 1 -.118 .136 -.121 -.029 -.096 -.013 -.069
Sig. (2-tailed) .428 .587 .937 .234 .367 .294 .354 .823 .461 .920 .597
N 61 61 61 61 61 61 61 61 61 61 61 61
PROCC6 Pearson Correlation .117 .139 .279* .231 -.118 1 .305
* .266
* .289
* .417
** .273
* .442
**
Sig. (2-tailed) .368 .285 .030 .074 .367 .017 .039 .024 .001 .033 .000
N 61 61 61 61 61 61 61 61 61 61 61 61
PROCC7 Pearson Correlation -.026 -.062 .207 .208 .136 .305* 1 .377
** .622
** .371
** .165 .301
*
Sig. (2-tailed) .845 .635 .110 .108 .294 .017 .003 .000 .003 .204 .019
N 61 61 61 61 61 61 61 61 61 61 61 61

289
Appendix C6 Continued
PROCC1 PROCC2 PROCC3 PROCC4 PROCC5 PROCC6 PROCC7 PROCC8 PROCC9 PROCC10 PROCC11 PROCC12
PROCC8 Pearson Correlation .250 .073 .116 .158 -.121 .266* .377
** 1 .434
** .285
* .234 .413
**
Sig. (2-tailed) .052 .574 .372 .223 .354 .039 .003 .000 .026 .070 .001
N 61 61 61 61 61 61 61 61 61 61 61 61
PROCC9 Pearson Correlation .227 .012 .048 .146 -.029 .289* .622
** .434
** 1 .385
** .335
** .313
*
Sig. (2-tailed) .079 .929 .714 .261 .823 .024 .000 .000 .002 .008 .014
N 61 61 61 61 61 61 61 61 61 61 61 61
PROCC10 Pearson Correlation .012 -.066 .085 .151 -.096 .417**
.371**
.285* .385
** 1 .507
** .355
**
Sig. (2-tailed) .929 .615 .513 .245 .461 .001 .003 .026 .002 .000 .005
N 61 61 61 61 61 61 61 61 61 61 61 61
PROCC11 Pearson Correlation .107 .110 .065 .089 -.013 .273* .165 .234 .335
** .507
** 1 .301
*
Sig. (2-tailed) .410 .398 .617 .495 .920 .033 .204 .070 .008 .000 .019
N 61 61 61 61 61 61 61 61 61 61 61 61
PROCC12 Pearson Correlation .076 .175 .268* .061 -.069 .442
** .301
* .413
** .313
* .355
** .301
* 1
Sig. (2-tailed) .558 .177 .037 .642 .597 .000 .019 .001 .014 .005 .019
N 61 61 61 61 61 61 61 61 61 61 61 61
**. Correlation is significant at the 0.01 level (2-tailed).
*. Correlation is significant at the 0.05 level (2-tailed).

290
Appendix C7a: Un-rotated principal component analysis of critical success factors
for stakeholder management in construction projects.
Component Matrixa
Factor
Component
1 2 3 4 5 6
SCPC1 .351 .593 -.219 .525 -.307 .279
SCPC2 .385 -.032 -.459 .682 .457 .315
SCPC3 .488 .145 .684 -.082 .064 -.211
SCPC4 .131 -.454 .584 -.347 .368 .407
SCPC5 .536 .177 .552 .258 -.080 -.138
SA1 .427 -.097 -.267 .267 .417 -.510
SA2 .512 -.227 .174 .498 .233 -.160
SA3 .625 -.357 .223 -.060 .096 .094
SA4 .677 -.219 .158 .205 -.011 .201
SA5 .645 -.121 .356 .271 -.217 -.060
SA6 .671 .088 -.136 .279 .017 .341
SD1 .479 .613 .265 -.219 -.086 .208
SD2 .742 -.045 -.138 -.027 -.338 .092
SD3 .756 -.246 -.316 -.096 -.348 .010
SD4 .689 -.460 -.118 -.167 -.053 -.107
SD5 .636 -.549 -.069 -.224 -.166 -.051
SD6 .724 .008 -.144 -.322 .175 -.221
SD7 .619 .136 -.136 -.375 -.028 -.227
SE1 .609 .181 -.154 .151 -.180 -.174
SE2 .638 .288 .164 -.580 .193 .014
SE3 .638 .417 .006 -.182 .295 .147
SE4 .510 .550 -.172 -.122 -.003 -.065
SE5 .662 .217 -.037 -.075 .092 .131
Extraction Method: Principal Component Analysis.
a. 6 components extracted.

291
Appendix C7b: Total variance of principal component analysis of the critical
success factors for stakeholder management in construction projects.
Total Variance Explained
Component
Initial Eigenvalues Extraction Sums of Squared Loadings
Total
% of
Variance
Cumulative
% Total
% of
Variance
Cumulative
%
1 7.996 34.764 34.764 7.996 34.764 34.764
2 1.960 8.520 43.284 1.960 8.520 43.284
3 1.442 6.269 49.553 1.442 6.269 49.553
4 1.359 5.908 55.461 1.359 5.908 55.461
5 1.204 5.234 60.694 1.204 5.234 60.694
6 1.100 4.783 65.478 1.100 4.783 65.478
7 .998 4.339 69.817
8 .926 4.027 73.844
9 .782 3.398 77.242
10 .773 3.362 80.604
11 .670 2.912 83.516
12 .607 2.641 86.157
13 .507 2.204 88.361
14 .497 2.161 90.521
15 .402 1.748 92.270
16 .376 1.634 93.904
17 .352 1.529 95.433
18 .294 1.279 96.712
19 .225 .976 97.688
20 .172 .748 98.436
21 .138 .602 99.037
22 .112 .487 99.524
23 .109 .476 100.000
Extraction Method: Principal Component Analysis.
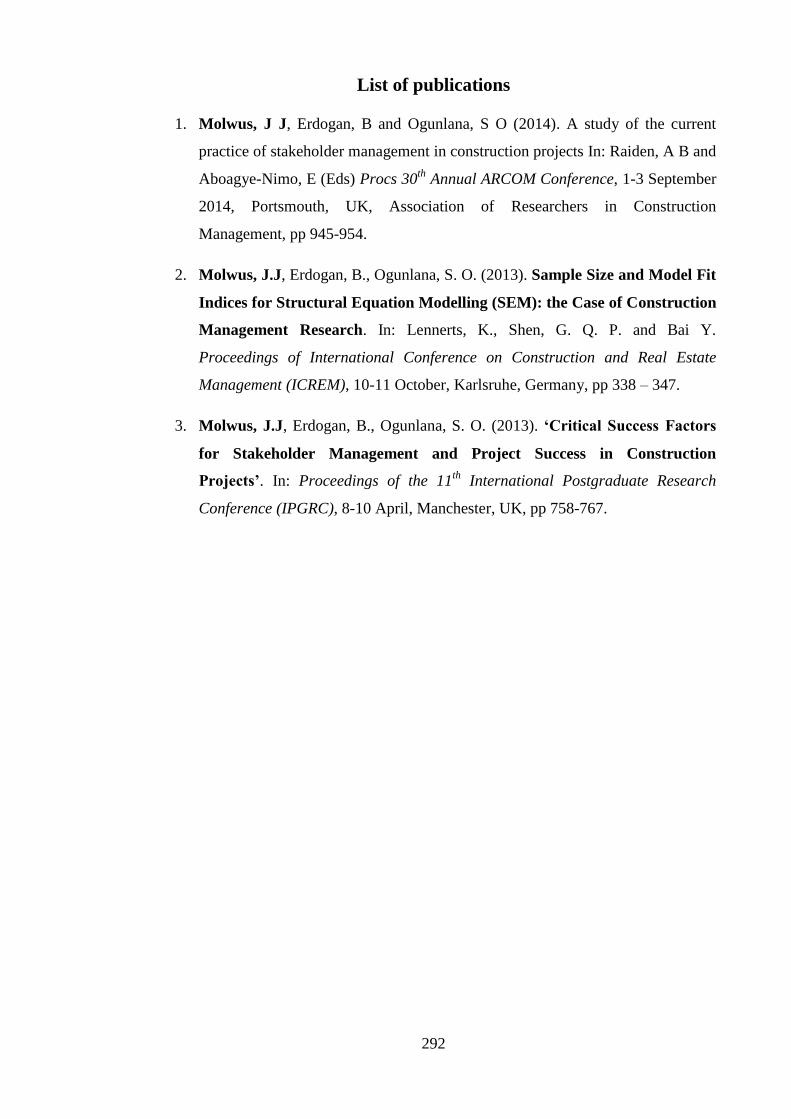
292
List of publications
1. Molwus, J J, Erdogan, B and Ogunlana, S O (2014). A study of the current
practice of stakeholder management in construction projects In: Raiden, A B and
Aboagye-Nimo, E (Eds) Procs 30th
Annual ARCOM Conference, 1-3 September
2014, Portsmouth, UK, Association of Researchers in Construction
Management, pp 945-954.
2. Molwus, J.J, Erdogan, B., Ogunlana, S. O. (2013). Sample Size and Model Fit
Indices for Structural Equation Modelling (SEM): the Case of Construction
Management Research. In: Lennerts, K., Shen, G. Q. P. and Bai Y.
Proceedings of International Conference on Construction and Real Estate
Management (ICREM), 10-11 October, Karlsruhe, Germany, pp 338 – 347.
3. Molwus, J.J, Erdogan, B., Ogunlana, S. O. (2013). ‘Critical Success Factors
for Stakeholder Management and Project Success in Construction
Projects’. In: Proceedings of the 11th
International Postgraduate Research
Conference (IPGRC), 8-10 April, Manchester, UK, pp 758-767.

vi