stakeholders empowerment services ......stakeholders empowerment services cals ltd 1 | p a g e...
TRANSCRIPT

Stakeholders’ Education | Corporate Governance Research | Corporate Governance Score | Proxy Advisory
STAKEHOLDERS EMPOWERMENT SERVICES HINDUSTAN ORGANIC CHEMICALS LTD
www.hocl.gov.in
1 | P A G E
SECTOR: CHEMICAL REPORTING DATE: 14TH AUGUST, 2017
Hindustan Organic Chemicals Ltd NSE Code - HOCL TABLE 1 - MARKET DATA (STANDALONE) (AS ON 10TH AUGUST, 2017)
Sector - Chemicals NSE Market Price (`) 19.25 NSE Market Cap. (₹ Cr.) 128.29
Face Value (`) 10.00 Equity (` Cr.) 67.17
Business Group - Government of India 52 week High/Low (₹) 35.20/15.10 Net worth (₹ Cr.)* -790.73
Year of Incorporation - 1960 TTM P/E (TTM) N.A. Traded Volume (Shares) 29,325
TTM P/BV N.A. Traded Volume (lacs) 5.65
Registered Office - Source - Capitaline, TTM - Trailing Twelve Months, N.A -Not Applicable, *As on 30th September, 2016.
P O Rasayani, COMPANY BACKGROUND
Raigad – 410 207, Maharashtra Hindustan Organic Chemicals Ltd was incorporated in the year 1960 by the Government
of India. The company was established with the objective of attaining self-reliance in
basic organic chemical’s needs. Initially, the company started as small chemical unit, has
now acquired the status of a multiunit company with two fast growing units and one
subsidiary unit.
In April 1971, the company established their R&D unit at Rasayani in Dist. Raigad,
Maharashtra State. The unit was recognized by DSIR, Ministry of Science and
Technology, Government of India. The unit was set-up to undertake development work
to utilize a number of by-products and to increase the profitability of operations by
improving the yields and raw material and utility consumption norms and to develop
the processes identified for Long Range Growth.
Tel: +91 2192 250041/42
Company Website:
www.hocl.gov.in
Revenue and Profit Performance
The revenue of the Company decreased from ₹ 27.02 crores to ₹
26.92 crores from quarter ending Sep’15 to quarter ending
Sep’16. The Company made a loss of ₹ 46.00 crores in quarter
ending Sep’16 vis-a-vis making a loss of ₹ 48.08 crores in quarter
ending Sep’15.
Source: Money Control
Performance vis-à-vis Market
TABLE 2- Returns
1-m 3-m 6-m 12-m
Hindustan Organic Chem. Ltd -24.51% -55.58% -17.38% -20.12%
Nifty -0.67% 3.00% 12.56% 12.97%
Source: Capitaline
-
0.50
1.00
1.50
2.00
2.50
Aug 16 Oct 16 Dec 16 Feb 17 Apr 17 Jun 17
Hindustan Organic Chemicals Ltd NIFTY
26.9211.74
27.02
-46.00 -41.24 -48.08
-100
-50
0
50
Sep'16 Mar'16 Sep'15
Quarterly revenue and Profit (₹ CRORE)
Revenue Profit
Stakeholders’ Education | Corporate Governance Research | Corporate Governance Score | Proxy Advisory
STAKEHOLDERS EMPOWERMENT SERVICES HINDUSTAN ORGANIC CHEMICALS LTD
www.hocl.gov.in
2 | P A G E
SECTOR: CHEMICAL REPORTING DATE: 14TH AUGUST, 2017
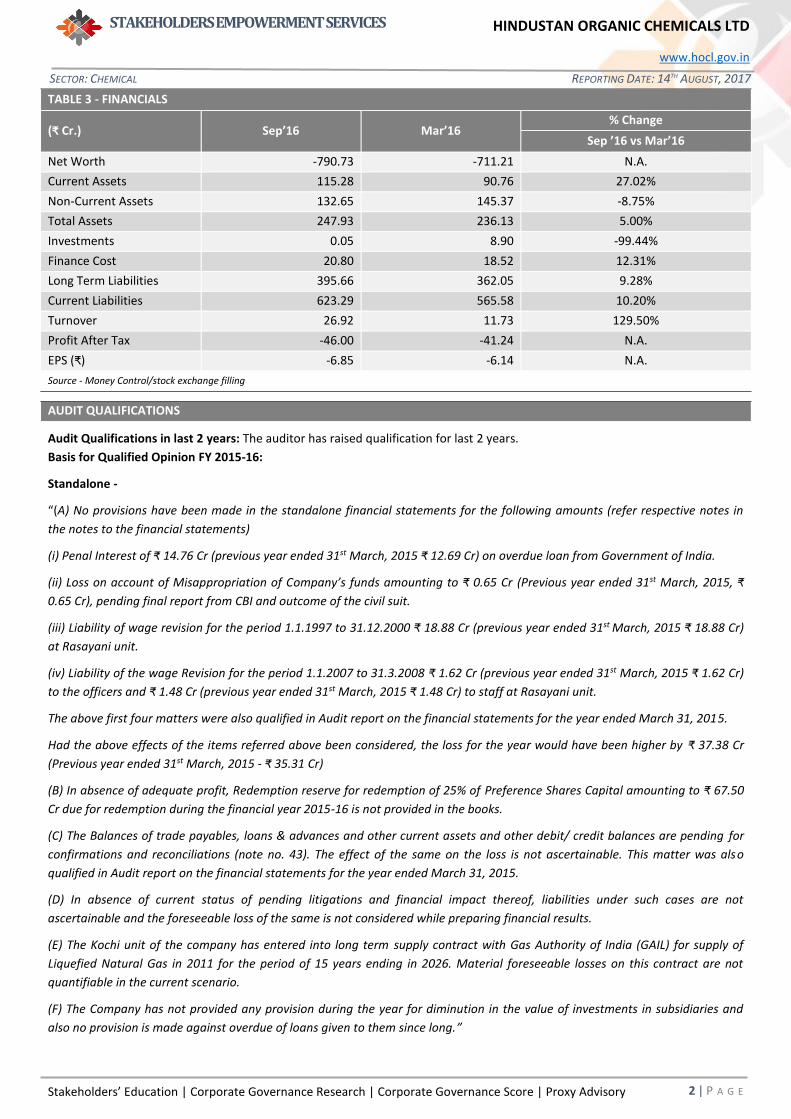
TABLE 3 - FINANCIALS
(₹ Cr.) Sep’16 Mar’16 % Change
Sep ’16 vs Mar’16
Net Worth -790.73 -711.21 N.A.
Current Assets 115.28 90.76 27.02%
Non-Current Assets 132.65 145.37 -8.75%
Total Assets 247.93 236.13 5.00%
Investments 0.05 8.90 -99.44%
Finance Cost 20.80 18.52 12.31%
Long Term Liabilities 395.66 362.05 9.28%
Current Liabilities 623.29 565.58 10.20%
Turnover 26.92 11.73 129.50%
Profit After Tax -46.00 -41.24 N.A.
EPS (₹) -6.85 -6.14 N.A.
Source - Money Control/stock exchange filling
AUDIT QUALIFICATIONS
Audit Qualifications in last 2 years: The auditor has raised qualification for last 2 years.
Basis for Qualified Opinion FY 2015-16:
Standalone -
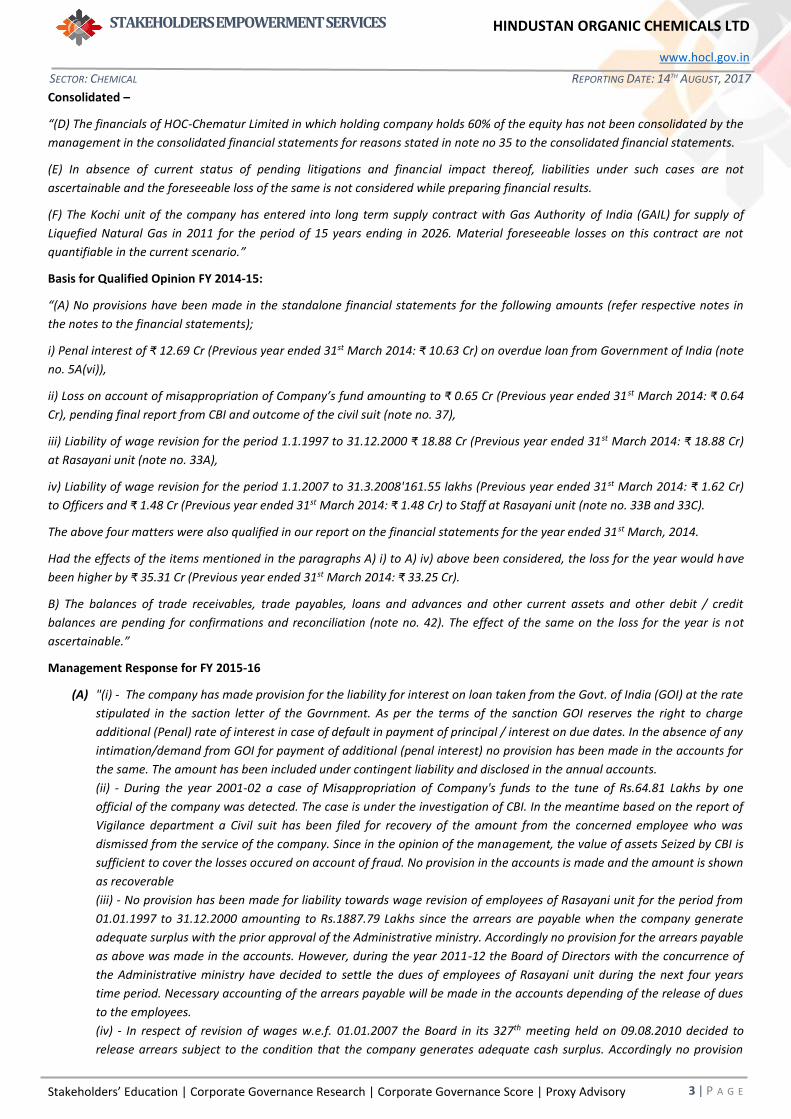
“(A) No provisions have been made in the standalone financial statements for the following amounts (refer respective notes in
the notes to the financial statements)
(i) Penal Interest of ₹ 14.76 Cr (previous year ended 31st March, 2015 ₹ 12.69 Cr) on overdue loan from Government of India.
(ii) Loss on account of Misappropriation of Company’s funds amounting to ₹ 0.65 Cr (Previous year ended 31st March, 2015, ₹
0.65 Cr), pending final report from CBI and outcome of the civil suit.
(iii) Liability of wage revision for the period 1.1.1997 to 31.12.2000 ₹ 18.88 Cr (previous year ended 31st March, 2015 ₹ 18.88 Cr)
at Rasayani unit.
(iv) Liability of the wage Revision for the period 1.1.2007 to 31.3.2008 ₹ 1.62 Cr (previous year ended 31st March, 2015 ₹ 1.62 Cr)
to the officers and ₹ 1.48 Cr (previous year ended 31st March, 2015 ₹ 1.48 Cr) to staff at Rasayani unit.
The above first four matters were also qualified in Audit report on the financial statements for the year ended March 31, 2015.
Had the above effects of the items referred above been considered, the loss for the year would have been higher by ₹ 37.38 Cr
(Previous year ended 31st March, 2015 - ₹ 35.31 Cr)
(B) In absence of adequate profit, Redemption reserve for redemption of 25% of Preference Shares Capital amounting to ₹ 67.50
Cr due for redemption during the financial year 2015-16 is not provided in the books.
(C) The Balances of trade payables, loans & advances and other current assets and other debit/ credit balances are pending for
confirmations and reconciliations (note no. 43). The effect of the same on the loss is not ascertainable. This matter was also
qualified in Audit report on the financial statements for the year ended March 31, 2015.
(D) In absence of current status of pending litigations and financial impact thereof, liabilities under such cases are not
ascertainable and the foreseeable loss of the same is not considered while preparing financial results.
(E) The Kochi unit of the company has entered into long term supply contract with Gas Authority of India (GAIL) for supply of
Liquefied Natural Gas in 2011 for the period of 15 years ending in 2026. Material foreseeable losses on this contract are not
quantifiable in the current scenario.
(F) The Company has not provided any provision during the year for diminution in the value of investments in subsidiaries and
also no provision is made against overdue of loans given to them since long.”
Stakeholders’ Education | Corporate Governance Research | Corporate Governance Score | Proxy Advisory
STAKEHOLDERS EMPOWERMENT SERVICES HINDUSTAN ORGANIC CHEMICALS LTD
www.hocl.gov.in
3 | P A G E
SECTOR: CHEMICAL REPORTING DATE: 14TH AUGUST, 2017
Consolidated –
“(D) The financials of HOC-Chematur Limited in which holding company holds 60% of the equity has not been consolidated by the
management in the consolidated financial statements for reasons stated in note no 35 to the consolidated financial statements.
(E) In absence of current status of pending litigations and financial impact thereof, liabilities under such cases are not
ascertainable and the foreseeable loss of the same is not considered while preparing financial results.
(F) The Kochi unit of the company has entered into long term supply contract with Gas Authority of India (GAIL) for supply of
Liquefied Natural Gas in 2011 for the period of 15 years ending in 2026. Material foreseeable losses on this contract are not
quantifiable in the current scenario.”
Basis for Qualified Opinion FY 2014-15:
“(A) No provisions have been made in the standalone financial statements for the following amounts (refer respective notes in
the notes to the financial statements);
i) Penal interest of ₹ 12.69 Cr (Previous year ended 31st March 2014: ₹ 10.63 Cr) on overdue loan from Government of India (note
no. 5A(vi)),
ii) Loss on account of misappropriation of Company’s fund amounting to ₹ 0.65 Cr (Previous year ended 31st March 2014: ₹ 0.64
Cr), pending final report from CBI and outcome of the civil suit (note no. 37),
iii) Liability of wage revision for the period 1.1.1997 to 31.12.2000 ₹ 18.88 Cr (Previous year ended 31st March 2014: ₹ 18.88 Cr)
at Rasayani unit (note no. 33A),
iv) Liability of wage revision for the period 1.1.2007 to 31.3.2008'161.55 lakhs (Previous year ended 31st March 2014: ₹ 1.62 Cr)
to Officers and ₹ 1.48 Cr (Previous year ended 31st March 2014: ₹ 1.48 Cr) to Staff at Rasayani unit (note no. 33B and 33C).
The above four matters were also qualified in our report on the financial statements for the year ended 31st March, 2014.
Had the effects of the items mentioned in the paragraphs A) i) to A) iv) above been considered, the loss for the year would have
been higher by ₹ 35.31 Cr (Previous year ended 31st March 2014: ₹ 33.25 Cr).
B) The balances of trade receivables, trade payables, loans and advances and other current assets and other debit / credit
balances are pending for confirmations and reconciliation (note no. 42). The effect of the same on the loss for the year is not
ascertainable.”
Management Response for FY 2015-16
(A) "(i) - The company has made provision for the liability for interest on loan taken from the Govt. of India (GOI) at the rate
stipulated in the saction letter of the Govrnment. As per the terms of the sanction GOI reserves the right to charge
additional (Penal) rate of interest in case of default in payment of principal / interest on due dates. In the absence of any
intimation/demand from GOI for payment of additional (penal interest) no provision has been made in the accounts for
the same. The amount has been included under contingent liability and disclosed in the annual accounts.
(ii) - During the year 2001-02 a case of Misappropriation of Company's funds to the tune of Rs.64.81 Lakhs by one
official of the company was detected. The case is under the investigation of CBI. In the meantime based on the report of
Vigilance department a Civil suit has been filed for recovery of the amount from the concerned employee who was
dismissed from the service of the company. Since in the opinion of the management, the value of assets Seized by CBI is
sufficient to cover the losses occured on account of fraud. No provision in the accounts is made and the amount is shown
as recoverable
(iii) - No provision has been made for liability towards wage revision of employees of Rasayani unit for the period from
01.01.1997 to 31.12.2000 amounting to Rs.1887.79 Lakhs since the arrears are payable when the company generate
adequate surplus with the prior approval of the Administrative ministry. Accordingly no provision for the arrears payable
as above was made in the accounts. However, during the year 2011-12 the Board of Directors with the concurrence of
the Administrative ministry have decided to settle the dues of employees of Rasayani unit during the next four years
time period. Necessary accounting of the arrears payable will be made in the accounts depending of the release of dues
to the employees.
(iv) - In respect of revision of wages w.e.f. 01.01.2007 the Board in its 327th meeting held on 09.08.2010 decided to
release arrears subject to the condition that the company generates adequate cash surplus. Accordingly no provision

Stakeholders’ Education | Corporate Governance Research | Corporate Governance Score | Proxy Advisory
STAKEHOLDERS EMPOWERMENT SERVICES HINDUSTAN ORGANIC CHEMICALS LTD
www.hocl.gov.in
4 | P A G E
SECTOR: CHEMICAL REPORTING DATE: 14TH AUGUST, 2017
has been made for arrears payable for the period from 01.01.2007 to 31.03.2008 amounting to Rs.161.55 Lakhs in
respect of Officers and Rs.148.26 Lakhs to Staff of Rasayani unit. Necessary accounting will be made in subsequent years
as and when the above dues are paid to the employees.
(B) As stated in Note No.2B the Board has authorised the company to request the government for further extension of the
redemption date by another four years. The consultant has recommended for conversion of preference shares into
equity in the revival report submitted to the government. Pending above the redemption reserve has not been created in
the books.
(C) These are running account balances and the company continues to followup with the parties for reconciliation of their
balances. Any consequential adjustments will be carried out in the books of accouts during the next year.
(D) The pending litigations are pending with statutory authorities / different courts and the matters are subjudice. The
liability if any will be known only on the final order on the respective cases are issued.
(E) Necessary provision for the liability towards GAIL as per the contract for supply of LNG is being made in the books of
accounts on monthly basis.
(F) The subsidiary company has submitted a revival proposal which is under consideration of the ministry. Pending above no
provision has been made for the temporary diminution in the value of investments in the subsidiary.”
Management Response for FY 2014-15:
(i) “The Company has provided the liability for Interest on loan received from the Government of India at the rate
stipulated in the Sanction letter of the Government. As per the terms of sanction, Govt. of India (GOI) reserves the
right to charge additional (penal) rate of Interest in case of default in payment of Principal/ Interest on due dates. In
the absence of any intimation/demand from GOI for payment of additional (penal) interest, no provision was made
in the accounts towards the same.
(ii) During 2001-02 a case of misappropriation of Company's funds to the tune of Rs 64.81 lacs by one official of the
company was detected. The case is under investigation of CBI. In the meantime, based on the report of Vigilance
Department, a civil suit has been filed for recovery of the amount from the concerned employee who was dismissed
from the service of the company. Since in the opinion of the Management the value of assets seized by CBI is
sufficient to cover the losses occurred on account of fraud, no provision in the accounts is made and the amount is
shown as recoverable.
(iii) No provision has been made for liability towards wage revision of employees of Rasayani Unit for the period from
01/01/1997 to 31/12/2000 amounting to ₹ 23.08 Cr, since the arrears are payable when the company generate
adequate surplus with the prior approval of administrative Ministry. Accordingly, no provision for the arrears
payable as above was made in the accounts. However, during the year 2011-12 the Board of directors with the
concurrence of the administrative Ministry have decided to settle the dues of employees of Rasayani Unit during the
next 4 years time period. Accordingly necessary accounting of the arrears payable will be made in the accounts
depending on the release of dues in the next 4 years.
(iv) In respect of revision of wages with effect from 01.01.2007, the Board in its 327th Meeting held on 9-8-2010 decided
to release arrears subject to the condition that the Company generates adequate cash surplus. Accordingly, no
provision has been made for arrears payable for the period 01.01.2007 to 31.03.2008 amounting to ₹ 2.79 Cr in
respect of officers & ₹ 2.46 Cr to staff of Rasayani Unit. Necessary accounting will be made as and when the above
dues are paid to the employees.”
Response Comment
Frequency of Qualifications 2 years, FY 2014-15 & FY 2015-16
Have the auditors made any adverse remark in last
3 years? No
-
Are the material accounts audited by the Principal
Auditors? No
The proportion of 60% total assets & 82% total revenue as
per the consolidated accounts, which have not been
audited by statutory Auditors represent significant amount
of the total assets & turnover.
Do the financial statements include material
unaudited financial statements? No
-

Stakeholders’ Education | Corporate Governance Research | Corporate Governance Score | Proxy Advisory
STAKEHOLDERS EMPOWERMENT SERVICES HINDUSTAN ORGANIC CHEMICALS LTD
www.hocl.gov.in
5 | P A G E
SECTOR: CHEMICAL REPORTING DATE: 14TH AUGUST, 2017
TABLE 4: BOARD PROFILE (AS PER ANNUAL REPORT 2015-16)
Regulatory Norms Company
% of Independent Directors on the Board 50% 25%
% of Promoter Directors on the Board - 40%
Number of Women Directors on the Board At least 1 1
Classification of Chairman of the Board - Executive Director
Is the post of Chairman and MD held by the same person? - Yes
Average attendance of Directors in the Board meetings (%) - 94.44%
Composition of Board: As per Regulation 17(1)(b) of the Listing Regulations, 2015, the Company should have at least 50%
Independent Directors as the Chairman of the Board is an Executive Director. The Company has 25% of Independent Directors
and hence, it does not meet the regulatory requirement.
Board Diversity: The Company has 4 directors out of which 3 are male and 1 is women.
TABLE 5 - FINANCIAL RATIOS
Ratios Sep’16 Mar’16 % Change
Sep ’16 vs Mar’16
Turn
ove
r
Rat
ios
Inventory Turnover 0.75 0.37 101.57%
Debtors Turnover 1.82 1.83 -0.60%
Fixed asset Turnover 0.20 0.08 151.50%
Current Asset Turnover 0.23 0.13 80.68%
Ret
urn
Rat
ios Operating Profit Margin -90.19% -146.97% N.A.
Net Profit Margin -170.88% -351.58% N.A.
Return on Assets (ROA) N.A. N.A. N.A.
Return on Equity (ROE) N.A. N.A. N.A.
Return on Capital Employed (ROCE) N.A. N.A. N.A.
Liq
uid
ity
Rat
ios
Current Ratio 0.18 0.16 15.26%
Quick Ratio 0.13 0.11 21.55%
Cash Ratio 0.10 0.09 10.92%
Working Capital Turnover ratio N.A. N.A. N.A.
Solv
ency
Rat
ios Debt to equity ratio N.A. N.A. N.A.
Interest Coverage Ratio N.A. N.A. N.A.
Trad
ing
Rat
ios
Market Cap / Sales 4.58 9.45 -51.54%
Market Cap/ Net Worth N.A. N.A. N.A.
Market Cap/PAT N.A. N.A. N.A.
Market Cap/EBITDA N.A. N.A. N.A.
Source - Money Control

Stakeholders’ Education | Corporate Governance Research | Corporate Governance Score | Proxy Advisory
STAKEHOLDERS EMPOWERMENT SERVICES HINDUSTAN ORGANIC CHEMICALS LTD
www.hocl.gov.in
6 | P A G E
SECTOR: CHEMICAL REPORTING DATE: 14TH AUGUST, 2017
TABLE 6 - TRADING VOLUME
Jun’17 Dec’16 Jun’16
% Change
Jun ’17 vs
Dec’16
Dec’16 vs
Jun’15
Trading Volume (shares) (avg. of 1 qtr) 207,403 241,667 107,013 -14.18% 125.83%
Trading Volume (shares) (high in 1 qtr) 2,092,542 1,789,522 1,888,786 16.93% -5.26%
Trading Volume (shares) (low in 1 qtr) 20,992 12,637 8,918 66.12% 41.70%
Ratio - High/low trading volume 99.68 141.61 211.79 -29.61% -33.14%
Ratio - High/average trading volume 10.09 7.40 17.65 36.25% -58.05%
Source: Capitaline
TABLE 7 (A): OWNERSHIP & MANAGEMENT RISKS
Jun'17 Dec'16 Jun'16 Comments
Shar
eho
ldin
g (%
)
Promoter
shareholding 58.78 58.78 58.78 • No new equity shares were issued during the
period from June 16 to June.
• There was no change in the promoter
shareholding during the said period.
• No major change was observed in the
shareholding pattern during the said period.
• The promoters have not pledged any shares.
Public - Institutional
shareholding 0.02 0.02 0.03
Public - Others
shareholding 41.20 41.2 41.19
Non-Promoter Non-
Public Shareholding 0.00 0.00 0.00
Source: NSE
MAJOR SHAREHOLDERS (AS ON 30TH June, 2017)
S. No. Promoters Shareholding
1 President of India 58.78%
Source: NSE
TABLE 7 (B): OWNERSHIP & MANAGEMENT RISKS
Market Activity of Promoters The promoters have not sold/bought any shares in last year.
Preferential issue to promoters No preferential issue of shares was made to the promoters in last year.
Preferential issue to others No preferential issue of shares was made to other shareholders during last year.
GDRs issued by the Company The Company did not issue any GDRs during last one year.
Issue of ESOPs/Issue of shares other
than Preferential allotment
The Company did not issue any shares to the employees under its ESOP Scheme in
last one year.
Source - Annual Report 2015-16
TABLE 8: PRINCIPAL BUSINESS ACTIVITIES OF THE COMPANY
Sr. No. Name and Description of main products / services % to Total turnover of the Company
1 Phenol 40%
2 Acetone 16%
3 Dinitrogen Tetroxide (N2O4) 17%
4 Hydrogen Peroxide (H2O2) 20%
Source - Annual Report 2015-16

Stakeholders’ Education | Corporate Governance Research | Corporate Governance Score | Proxy Advisory
STAKEHOLDERS EMPOWERMENT SERVICES HINDUSTAN ORGANIC CHEMICALS LTD
www.hocl.gov.in
7 | P A G E
SECTOR: CHEMICAL REPORTING DATE: 14TH AUGUST, 2017
Glossary
Equity: The equity shares capital of the Company
Net Worth: The amount by which the Assets exceeds the liabilities excluding shareholders’ funds of the Company
Turnover: The revenue earned from the operations of the Company
EPS: Earning Per Share is net profit earned by the Company per share
𝐸𝑃𝑆 =Profit After Tax
Number of outstanding shares
P/E ratio: It is the ratio of the Company’s share price to earnings per share of the Company
𝑃/𝐸 𝑟𝑎𝑡𝑖𝑜 =Price of each share
Earnings per share
Current Assets: Cash and other assets that are expected to be converted to cash in one year
Fixed Assets: assets which are purchased for long-term use and are not likely to be converted quickly into cash, such as land,
buildings, and equipment
Total Assets: Current Assets + Fixed Assets
Investments: An investment is an asset or item that is purchased with the hope that it will generate income or appreciate in
the future.
Finance Cost: The Financing Cost (FC), also known as the Cost of Finances (COF), is the cost and interest and other charges
incurred during the year in relation to borrowed money.
Long Term Liabilities: Long-term liabilities are liabilities with a maturity period of over one year.
Current Liabilities: A company's debts or obligations that are due within one year.
Inventory Turnover ratio: Inventory Turnover is a ratio showing how many times a company's inventory is sold and replaced
over a period.
𝐼𝑛𝑣𝑒𝑛𝑡𝑜𝑟𝑦 𝑇𝑢𝑟𝑛𝑜𝑣𝑒𝑟 𝑟𝑎𝑡𝑖𝑜 =Sales Turnover
Inventory
Debtors Turnover: Accounts receivable turnover is an efficiency ratio or activity ratio that measures how many times a business
can turn its accounts receivable into cash during a period
𝐷𝑒𝑏𝑡𝑜𝑟𝑠 𝑇𝑢𝑟𝑛𝑜𝑣𝑒𝑟 𝑟𝑎𝑡𝑖𝑜 =Sales Turnover
Accounts recievables
Fixed Asset Turnover: The fixed-asset turnover ratio is a financial ratio of net sales to fixed assets
𝐹𝑖𝑥𝑒𝑑 𝐴𝑠𝑠𝑒𝑡 𝑇𝑢𝑟𝑛𝑜𝑣𝑒𝑟 𝑟𝑎𝑡𝑖𝑜 =Sales Turnover
Fixed Assets
Current Asset Turnover: The current-asset turnover ratio is a financial ratio of net sales to fixed assets
𝐶𝑢𝑟𝑟𝑒𝑛𝑡 𝐴𝑠𝑠𝑒𝑡 𝑇𝑢𝑟𝑛𝑜𝑣𝑒𝑟 𝑟𝑎𝑡𝑖𝑜 =Sales Turnover
Current Assets
Operating Profit Margin: Operating margin is a measurement of what proportion of a Company’s revenue is left over after
paying for variable costs of production such as wages, raw materials etc. It can be calculated by dividing a Company’s operating
income (also known as “operating profit”) during a given period by its sales during the same period.
𝑂𝑝𝑒𝑟𝑎𝑡𝑖𝑛𝑔 𝑃𝑟𝑜𝑓𝑖𝑡 𝑀𝑎𝑟𝑔𝑖𝑛 =Operating profit
Sales Turnover
Net Profit Margin: Net profit margin is the percentage of revenue left after all expenses have been deducted from sales
𝑁𝑒𝑡 𝑃𝑟𝑜𝑓𝑖𝑡 𝑀𝑎𝑟𝑔𝑖𝑛 =Net profit
Sales Turnover

Stakeholders’ Education | Corporate Governance Research | Corporate Governance Score | Proxy Advisory
STAKEHOLDERS EMPOWERMENT SERVICES HINDUSTAN ORGANIC CHEMICALS LTD
www.hocl.gov.in
8 | P A G E
SECTOR: CHEMICAL REPORTING DATE: 14TH AUGUST, 2017
Return on Assets: ROA tells you what earnings were generated from invested capital (assets)
𝑅𝑒𝑡𝑢𝑟𝑛 𝑜𝑛 𝐴𝑠𝑠𝑒𝑡𝑠 =Net profit
Total Assets
Return on equity/net worth: return on equity (ROE) is the amount of net income returned as a percentage of shareholders’
equity.
𝑅𝑒𝑡𝑢𝑟𝑛 𝑜𝑛 𝐸𝑞𝑢𝑖𝑡𝑦 =Net profit
Net worth
Return on Capital Employed: Return on capital employed (ROCE) is a financial ratio that measures a company's profitability
and the efficiency with which its capital is employed.
𝑅𝑒𝑡𝑢𝑟𝑛 𝑜𝑛 𝐶𝑎𝑝𝑖𝑡𝑎𝑙 𝐸𝑚𝑝𝑙𝑜𝑦𝑒𝑑 =Net profit
Total Debt + Equity share capital
Current ratio: The current ratio is a financial ratio that measures whether or not a firm has enough resources to pay its debts
over the next 12 months. It compares a firm's current assets to its current liabilities.
𝐶𝑢𝑟𝑟𝑒𝑛𝑡 𝑟𝑎𝑡𝑖𝑜 =Current Assets
Current Liabilities
Quick ratio: The quick ratio is a measure of how well a Company can meet its short term financial liabilities.
𝑄𝑢𝑖𝑐𝑘 𝑟𝑎𝑡𝑖𝑜 =Current Assets − Inventories
Current Liabilities
Cash ratio: The ratio of the liquid assets of a Company to its current liabilities.
𝑄𝑢𝑖𝑐𝑘 𝑟𝑎𝑡𝑖𝑜 =Current Assets − Inventories − Account Recievables
Current Liabilities
Working Capital Turnover ratio: The working capital turnover ratio is also referred to as net sales to working capital. It indicates
a Company's effectiveness in using its working capital.
𝑊𝑜𝑟𝑘𝑖𝑛𝑔 𝐶𝑎𝑝𝑖𝑡𝑎𝑙 𝑇𝑢𝑟𝑛𝑜𝑣𝑒𝑟 𝑟𝑎𝑡𝑖𝑜 =𝑆𝑎𝑙𝑒𝑠 𝑇𝑢𝑟𝑛𝑜𝑣𝑒𝑟
Current Assets − Current Liabilities
Debt to Equity ratio: The debt-to-equity ratio (D/E) is a financial ratio indicating the relative proportion of
shareholders' equity and debt used to finance a company's assets.
𝐷𝑒𝑏𝑡 𝑡𝑜 𝐸𝑞𝑢𝑖𝑡𝑦 𝑟𝑎𝑡𝑖𝑜 =𝑆ℎ𝑜𝑟𝑡 𝑇𝑒𝑟𝑚 𝐷𝑒𝑏𝑡 + 𝐿𝑜𝑛𝑔 𝑇𝑒𝑟𝑚 𝐷𝑒𝑏𝑡
𝑁𝑒𝑡 𝑊𝑜𝑟𝑡ℎ
Interest Coverage ratio: The Interest coverage ratio is a debt ratio and profitability ratio used to determine how easily a
Company can pay interest on outstanding debt.
𝐼𝑛𝑡𝑒𝑟𝑒𝑠𝑡 𝐶𝑜𝑣𝑒𝑟𝑎𝑔𝑒 𝑅𝑎𝑡𝑖𝑜 =𝐸𝑎𝑟𝑛𝑖𝑛𝑔 𝐵𝑒𝑓𝑜𝑟𝑒 𝐼𝑛𝑡𝑒𝑟𝑒𝑠𝑡 𝑎𝑛𝑑 𝑇𝑎𝑥
𝐹𝑖𝑛𝑎𝑛𝑐𝑒 𝐶𝑜𝑠𝑡
Market Cap/Sales ratio: Market Cap/sales ratio, Price–sales ratio, P/S ratio, or PSR, is a valuation metric for stocks. It is
calculated by dividing the company's market cap by the revenue in the most recent year; or, equivalently, divide the per-
share stock price by the per-share revenue.
𝑀𝑎𝑟𝑘𝑒𝑡 𝐶𝑎𝑝/𝑆𝑎𝑙𝑒𝑠 𝑟𝑎𝑡𝑖𝑜 =𝑀𝑎𝑟𝑘𝑒𝑡 𝐶𝑎𝑝
𝑆𝑎𝑙𝑒𝑠 𝑇𝑢𝑟𝑛𝑜𝑣𝑒𝑟
Market Cap/ Net Worth ratio: It is a valuation ratio calculated by dividing Company’s market cap to net worth.
𝑀𝑎𝑟𝑘𝑒𝑡 𝐶𝑎𝑝/𝑁𝑒𝑡𝑤𝑜𝑟𝑡ℎ 𝑟𝑎𝑡𝑖𝑜 =𝑀𝑎𝑟𝑘𝑒𝑡 𝐶𝑎𝑝
𝑁𝑒𝑡𝑤𝑜𝑟𝑡ℎ
Market Cap/ PAT ratio: It is a valuation ratio calculated by dividing Company’s market cap to net profit.
𝑀𝑎𝑟𝑘𝑒𝑡 𝐶𝑎𝑝/𝑃𝐴𝑇 𝑟𝑎𝑡𝑖𝑜 =𝑀𝑎𝑟𝑘𝑒𝑡 𝐶𝑎𝑝
𝑛𝑒𝑡 𝑝𝑟𝑜𝑓𝑖𝑡
Market Cap/ EBITDA ratio: It is a valuation ratio calculated by dividing Company’s market cap to EBITDA.

Stakeholders’ Education | Corporate Governance Research | Corporate Governance Score | Proxy Advisory
STAKEHOLDERS EMPOWERMENT SERVICES HINDUSTAN ORGANIC CHEMICALS LTD
www.hocl.gov.in
9 | P A G E
SECTOR: CHEMICAL REPORTING DATE: 14TH AUGUST, 2017
𝑀𝑎𝑟𝑘𝑒𝑡 𝐶𝑎𝑝/𝐸𝐵𝐼𝑇𝐷𝐴 𝑟𝑎𝑡𝑖𝑜 =𝑀𝑎𝑟𝑘𝑒𝑡 𝐶𝑎𝑝
𝐸𝐵𝐼𝑇𝐷𝐴
Trading Volume (shares) (avg. of 1 year): Average number of shares/day traded in 1 year
Trading volume (shares) (high in 1 year): Highest number of shares/day traded in 1 year
Trading volume (shares) (minimum in 1 year): Lowest number of shares traded on any one day in 1 year

Stakeholders’ Education | Corporate Governance Research | Corporate Governance Score | Proxy Advisory
STAKEHOLDERS EMPOWERMENT SERVICES HINDUSTAN ORGANIC CHEMICALS LTD
www.hocl.gov.in
10 |
P A G E
SECTOR: CHEMICAL REPORTING DATE: 14TH AUGUST, 2017
DISCLAIMER
Sources Company Information
Only publicly available data has been used while making the factsheet. Our data sources include: BSE, NSE, SEBI, Capitaline, Moneycontrol, Businessweek, Reuters, Annual Reports, IPO Documents and Company Website.
Analyst Certification
The analysts involved in development of this factsheet certify that no part of any of the research analyst’s compensation was, is, or will be directly or indirectly related to the contents of this factsheet.
Disclaimer
While SES has made every effort and has exercised due skill, care and diligence in compiling this factsheet based on publicly available information, it neither guarantees its accuracy, completeness or usefulness, nor assumes any liability whatsoever for any consequence from its use. This factsheet does not have any approval, express or implied, from any authority, nor is it required to have such approval. The users are strongly advised to exercise due diligence while using this factsheet. This factsheet in no manner constitutes an offer, solicitation or advice to buy or sell securities, nor solicits votes or proxies on behalf of any party. SES, which is a not-for-profit Initiative or its staff, has no financial interest in the companies covered in this factsheet except what is disclosed on its website. The factsheet is released in India and SES has ensured that it is in accordance with Indian laws. Person resident outside India shall ensure that laws in their country are not violated while using this factsheet; SES shall not be responsible for any such violation. All disputes subject to jurisdiction of High Court of Bombay, Mumbai.
SEBI Reg. No. INH000000016
This factsheet or any portion hereof may not be reprinted, sold, reproduced or redistributed without the written consent of Stakeholders Empowerment Services
Contact Information
Stakeholders Empowerment Services
A 202, Muktangan, Upper Govind Nagar,
Malad East, Mumbai – 400 097
Tel +91 22 4022 0322
www.sesgovernance.com
Research Analyst: Sudarshan Shetty