stampa layout 1 - ispra · emitted and which is potentially detrimental to human health. phys-ical...
TRANSCRIPT

5CHAPTER

IntroductionA physical agent is by definition the element that, governed bythe laws of physics, brings about a change in the environmentalconditions of the context in which it is exhibited. Its presence inliving and working environments determines the energy that isemitted and which is potentially detrimental to human health. Phys-ical agents that effect the environment are electromagnetic fields,environmental noise and noise inside working places, ionising radi-ation, vibrations, light pollution and UV (ultraviolet) radiation.Noise pollution is characterized by widespread and an elevateimpact on the environment, on eco-systems and on the popula-tion. The bothersome or disturbing effects it causes have beenwell-documented and are such that the European Community hasbeen persuaded that reducing the number of people living itsmember states exposed to noise must be a primary objectiveachievable by specifying the methods and instruments to beadopted to quantify and manage noise levels. The detailed legis-lation on this subject and the existence of measures devoted topreventing or reducing noise levels, have not however resolvedan environmental issue that remains a priority. There is still greater social concern about electromagnetic pollu-tion however, and the effect it is feared it has on human healthdespite the fact that at national level, the risk connected withprolonged exposure is considered to be low, in part because causeand effect between exposure to electric, magnetic and electro-magnetic fields and any subsequent consequences to health hasnot been established. Legislation regarding this sector has alsoresulted in specific regulations aimed quite clearly at safeguardingthe individual.Ionising radiation consists of particles and/or energy of naturalor artificial origin able to modify the structure of the matter withwhich it interacts.Interaction with biological tissue can result in possible celldamage, in the form of morphological or functional alterations tothe organs concerned, as well as medical consequences that canbe clinically observed in individuals that have suffered exposure.Although there are no nuclear plants in operation in Italy, the pres-sure on the environment caused by ionising radiation continue to
124
A physical agent is thatelement, that governed bythe laws of physics, bringsabout a change in theenvironmental conditions inwhich it exists.
Noise pollution ischaracterized by widespreadand an elevate impact it hason the environment, on eco-systems and on thepopulation and is significantenough to induce the EU topursue as an objective, thereduction of the number ofpeople exposed to noise.
There is still greater socialconcern aboutelectromagnetic pollutionand its effects on humanhealth.
Ionising radiation consists ofparticles and/or energy ofnatural or artificial origin ableto modify the structure of thematter with which it interacts.Interaction with biologicaltissue can result in possiblecell damage, in the form ofmorphological or functionalalterations to the organsconcerned, of those who havebeen subjected to exposure.

be both relevant and numerous: the production and necessarytreatment of radioactive waste brought about by diagnostic and/orradiotherapy procedures carried out in hospitals, the growingproduction and worldwide circulation of radioactive materials andradiation of natural origin (radon and NORM) which continue toconstitute the main source of exposure, call for radiation-protec-tion capacity to remain a key element of the environmental safe-guards and the protection of the population and workers. The risks,deriving from a decrease in the attention and the capacity tocontrol the levels of radioactivity in the environment and in food-stuffs, could inevitably lead to uncontrollable social and economicsituations.Less attention is paid, by both the public at large and legislators,to other agents, and this would seem to be because the impactthey have on man and the environment is perceived differentlyor as being less significant. Vibrations, for example, disturb anextremely limited percentage of individuals and only in very specificsituations (the proximity of certain types of transport infrastruc-tures) and light pollution does not create any easily apparentdiscomfort to the individual. UV radiation warrants separateconsideration as the health implications are particularly notice-able in terms of the damage excessive exposure this type of radi-ation causes to the skin and to the eyes. With the exception ofoccupational exposure to UV rays emitted by artificial sources,exposure to the Sun, the most significant natural source of suchrays, has not yet been formally regulated. Both national and inter-national institutes confine themselves to merely recommending,in opportune notices published in the press, what protective meas-ures should be taken and to providing bulletins about UV levels.These use a number scale to indicate the risk factor incurred bydirect exposure of the skin to the sun’s rays relative to the subse-quent short term effects such as irritation (common sun-burn).The information included suggests the use of protection(sunglasses, protective clothing, creams etc.) and maximum expo-sure time according to skin type (phototype) and the health risksincurred by an individual are not stressed at all. When it comesto long-term effects (skin cancers and malignant melanomas),these cannot be avoided altogether, but they can be limited by
125
The medical consequencesof being exposed to UVradiation are particularlyevident when it comes tothe damage this causes toskin and eyes. To date, noactual laws have beenpassed to regulate exposureto the sun which is themain natural source of thistype of radiation.

minimising exposure as much as possible (and, for melanomas,the number of times an individual suffers sunburn).In any event, it must be borne in mind that corrective measureson this point would be difficult to impose in that these wouldimpinge on an individual’s habits and limit personal behaviour thatis, conversely, a source of satisfaction (for example tanning inthe summer or artificial tanning).
NOISE
The problemHaving identified noise pollution as one of the most significantenvironmental problems, reducing the number of people exposedto noise levels believed to have a detrimental effect on the qualityof life and health of its citizens is now the European Community’smain objective. The data relating to the percentage of the population exposed tonoise levels high enough to create annoyance or disturb revealsthat the number of people exposed is indeed significant. European Directive 2002/49/EU relating to the assessment andmanagement of environmental noise, transposed into Italian legis-lation with Legislative Decree no. 194/2005, defines the methodsand indicators by which noise pollution can be measured andmanaged in order that that the data from all member states isproduced and provided in a comparable and uniform manner. Creating harmonization between the national legislative tools and themethods adopted by the Community is the main task to achievingthe unequivocal identification of the methods and tools to be usedin the planning and management of environmental noise pollution. The control activities carried out by the Environmental AgenciesSystem, per formed primarily in response to complaintspresented by citizens, demonstrate an increased concern withthis environmental issue, and at the same time confirm that thelegal limits are not only succeeded but in many of the situationsreported, even reach critical levels. Out of 100 controlsper formed, 79 result from complaints made by citizens, inpercentages that vary among the different sectors: 86.3% of
126
Noise pollution is one of themost significantenvironmental problems ofall and is such that theEuropean Community hasidentified reducing thenumber of people exposedas a priority objective.
It is obvious that the generalpublic is extremely concernedabout personal andenvironmental safeguards: 79out of 100 complaints aremade by the public and ofthese, 49% of the noisesources reported prove toexceed permitted limits.

these cases involve service or commercial operations and 27.8%transport infrastructures. 47% of the noise sources reported bycitizens prove to exceed the permitted limits showing that thesituation is indeed critical .The data shows the type of noise sources that citizens find partic-ularly disturbing. Of the 3,614 sources checked, the greatestnumber, namely 48.2%, deal with those produced by commercialand service activities, followed by productive activities that accountfor 35.4% and roadway infrastructures at 9.7% (Figure 5.1).
The main sources of noise The main sources of noise, identified as road, rail and air traffic,have all registered a general increase in volume, with distinctivecharacteristics of the rise that are linked to individual sources. Data pertaining to airport traffic in particular showed apercentage variation of +16.8% in 2007 compared to 2004, whilstmotorway traffic registered a percentage increase of approximately
127
The noise sources checkedand that the general publicfind extremely disturbingrelate to commercial andservice activities (48.2%)productive activities (35.4%)and roadway infrastructures.(9.7%).
The main sources of noisethat have registered anincrease in volume havebeen identified as road, railand air traffic.
0.9 % 0.6 %
Roadwayinfrastructures
9 .7%
2.1%
3.1%
48.2 %
0.1%
35.4 %
Railwayinfrastructures
Airportinfrastructures Port
infrastructures
Productiveactivities
Service and / or commercial activities
Short-termevents
Construction sites
Figure 5.1: Distribution of the sources controlled (3,614) amongstthe different types of activities/infrastructures (2007)1
1 Source: ARPA/APPA data processed by ISPRA Note: No data is available on the autonomous province of Bolzano or the regionsof the Veneto, Lazio, Molise and Campania.

61% between 1990 and 2007. As far as passenger rail trafficis concerned, 306 million trains-km travelled on the State Railwaysystem in 2006 (up 2.5% on 2004), whilst rail freight accountedfor 65 million trains-km (up 3.4% on 2004).The requirement for those bodies responsible for running trans-port infrastructures to draft Noise Reduction and Abatement Plans,as set out in the Ministerial Decree of 29 November 2000, doesnot yet appear to have been carried out by all those concerned,although during the course of the previous year many of them havepresented the studies that they have undertaken. The increase in the above-mentioned pressure factors, combinedwith the shortcomings in the legislation plus the lack of synergyand forms of dialogue between the principal players, is an obstacleto the determination of an organic and shared definition of theaction to take. Vehicle traffic represents the main source of urban noise pollu-tion, though other sources should not be forgotten, such as: indus-trial and small-scale production activities, commercial activitieswith all their related plants and systems (air conditioning, refrig-erators etc.) and discotheques, that have a notable impact on theirimmediate surroundings.
Actions to limit noise pollutionThe existing situation is characterised by the fragmented effortsmade to prevent and mitigate the effects of noise pollution, thelack of a coherent approach to legislation and the lack of coor-dination between those involved. The inconsistencies areevident when comparing different sectors characterised by anarticulated number of actions such as transport infrastructuresand other sectors that are paid insufficient attention such asconstruction, territorial and acoustical planning, communicationsand education on environmental issues. Other factors to consider in the present situation are the under-takings set out in Community regulations regarding new toolsspecifically designed to manage noise pollution, the introduc-tion of new noise indicators, the attention now being paid to theissue of providing information and the participation of the publicat large.
128
Shortcomings in thelegislation and the lack ofdialogue between the principalplayers create an obstacle toan organic definition of theaction to take.
There continues to be asituation that ischaracterized by thefragmented efforts beingmade, the lack of acoherent approach tolegislation and the lack ofcoordination between thoseinvolved.

Many initiatives have been formulated in response to the critical stateof affairs described. The national lawmaking corpus is close to comple-tion, with the passing of Framework Law no. 447 of 1995 whichembodies the obligations stipulated in European Directive2002/49/EC. The system currently in force, completed by regional lawsof transposition, sets out elaborate regulatory measures for specificsources and noise-producing activities. It reveals however that thereare considerable inconsistencies in terms of its actual implementa-tion status by the various sectors and in the different territorial contexts.The institutional activities carried out by the Agency System havebeen intensified in response to the increased demands of thegeneral public. Initiatives are underway to raise the awarenessof local government bodies aimed at achieving an accurate andconscious management of preventative measures such as theacoustical classification of municipal territories, and of mitigation,such as the abatement plan, capable of ensuring that all devel-opment is acoustically compatible with the territory. Regrettablyhowever, it must be noted that there has been a contradictoryresponse by local administrations, as although some territorialsituations are functioning, others are totally inadequate. Analysis of the data regarding the fulfilment of the required proce-dures prescribed by the laws governing the different sectors, showsthat in comparison to previous years, the situation in 2007 was stag-nant, with little having been done to tackle the current state of affairs.In particular, the fact that many individual regions have failed to passlaws containing measures to deal with noise pollution, as establishedby the Framework Law, underlines the inadequacy of the responseand a fragmentation that characterises the state of affairs at nationallevel. Based on the available data, there are five regions that havenot yet passed such regional laws: Molise, Campania, Calabria, Sicilyand Sardinia. It should be noted that often, deliberations by RegionalAdministrations have resulted in measures that deal with individualprocedural matters, such as guidelines regarding the drawing up ofan acoustic classification or the procedures for certifying an acoustictechnician, and these circumvent the lack of a systematic approachat regional level. Regarding acoustical classification, the main toolfor establishing how the territory should be used and, therefore thepriority initiative in terms of abatement measures, the percentage of
129
Initiatives are underway toraise the awareness of localgovernments aimed atencouraging preventativemeasures.
Unfortunately, it must benoted that there has been acontradictory response bylocal administrations, asalthough some territorialsituations are functioning,others are totallyinadequate.

Italian municipalities to have approved this classification was equalto 35% in 2007 showing a slight increase over the 31.5% in 2006,while the percentage of the resident population in municipalities thathave approved such zoning was 46.4%, compared to 40.8% in 2006.There are notable distinctions in the different regional situations: inthe Marche, 94% of municipalities have approved acoustical zoningplans, 88% in Tuscany, 85% in Liguria and 69% in Piedmont whilstthe 1% in Sicily, 2% in Abruzzo and 3% in Sardinia are extremely lowpercentages indeed. Available data shows that in Friuli Venezia Giulia,five municipalities have approved a zoning plan, but following anappeal made by a private company, the TAR (Regional AdministrationCourt) overturned the zoning resolution passed by one of these onthe basis that it was passed prior to the issuing of regional criteriaand this rendered the implementation of the zoning plans passed by
130
Acoustical classification of amunicipal area, the maintool in the preventativeprocess, is not evenly usedacross the entire countryand the frequent failure toexplain its usefulnessmeans that the populationconcerned does not receiveaccurate information.
By 2007, the equivalent ofonly 35% of all Italy’smunicipalities had approvedacoustical classifications:Marche (94%),Tuscany (88%), Liguria(85%), Piedmont (69%).
Figure 5.2: Percentage of municipalities that have approvedacoustical classifications out of the total number of munici-palities for each region/autonomous province (2007) 2
2 Source: ARPA/APPA data processed by ISPRA
data n/a

131
With the exception ofMarche, where 94% ofmunicipalities have zoningplans, there has been onlya slight increase in thenumber of such plans in allother regions.
The percentage of thepopulation resident inmunicipalities that haveapproved zoning plansreached 46.4% in 2007,showing an increase inrespect of the previous year.
the other four municipalities impossible. At national level, the terri-torial surface now encompassed by zoning plans approved by localcouncils has reached 32% compared with 27% in 2006 (Figures 5.2,5.3, 5.4). With the exception of Marche, (the only positive note) where94% of municipalities now have zoning plans compared with a mere30% in 2006, all the other regions with active preventative policiesin place for some time show only a slight percentage increase in boththe number of municipalities that have approved acoustic classifica-tion and the percentage of population resident, as well as thepercentage of the municipal territory included in a zoning plan. A nega-tive note arises from the verifiable territorial differences and contrastsand the realization that some thirteen years since the passing of theFramework Law on noise pollution, the principal means of acousticprevention and planning is not yet a tool that has been evenly adoptedthroughout the entire national territory. Its effectiveness is often notpublicized and as a result, the population concerned does not receiveaccurate information.
3 Source: ARPA/APPA data processed by ISPRA
Figure 5.3: Percentage of the population residing in munici-palities with an approved acoustical classification out of thetotal population of each region/autonomous province (2007)3
data n/a

The obligation to draw up a report on the acoustical status of munic-ipalities at two-year intervals, as established by Law 447/95, an impor-tant act for the analysis and management of the problem of noisepollution at municipal level, goes largely unmet, demonstrating the weakresponse of the municipalities to legislative requirements. Out of atotal of 144 municipalities with populations of more than 50,000 inhab-itants, that are therefore required to draw up a report, as of 2007only 21 had approved a report on their acoustical status. Tuscany,with 11 out of 12 compliant municipalities, has produced the mostreports, followed by Lombardy, with 4 out of 14. Implementation ofthe municipal noise abatement plan, as called for under Law 447/95,is not widespread and undoubtedly suffers from insufficient use ofother instruments of acoustical planning, such as the municipalacoustical classification, and the failure to pass regional laws on thesubject. The available data show that 47 noise abatement plans wereadopted, with the highest concentrations in two regions: Tuscany, with38, and Emilia Romagna with 4.
132
The percentage of theterritorial surface area ofmunicipalities that haveapproved classifications is32%, compared with the26.3% in 2006.
Figure 5.4: Percentage of the territorial surface area of the municipali-ties that have approved acoustical classifications out of the total surfacearea of the municipalities in each region/autonomous province (2007)4
4 Source: ARPA/APPA data processed by ISPRA
data n/a
In 2007, the acoustical classification of the areas surroundingairports, called for under Law 447/95 on the subject of airportnoise, was carried out by only 10 of the 39 main national airportsalthough these are being elaborated/evaluated in a further 13airports at this time.There are distinctions in the abatement measures thatmanagers/owners of transportation infrastructures are requiredto take under the Framework Law: in the case of railways and thevast majority of motorways, studies were completed on the crit-ical problems presented within their respective infrastructurenetworks, and an initial series of mitigating actions has beendrawn up and programmed, whilst similar efforts for roadways andairports are decidedly behind schedule. In this current phase, concentrating efforts on the harmonisationand co-existence of methods and instruments introduced by bothCommunity and national legislation to prevent and mitigate noisepollution is what is required, highlighting the conflicts and criticalaspects of the situation and defining the solutions to be adopted,so that existing legislation is rendered effective. In light of theinformation provided above however, the general expectation isthat this is unlikely to happen. The instruments used in the prevention, planning and abatementprocesses contained within national laws must be made moreeffective and incisive. This can be achieved by fully enacting theundertakings set out in European Directive 2002/49/EC, insynergy with other initiatives introduced through community regu-lations.
133
At present, only 10 out of39 airports have anapproved acousticalclassification, the main toolused in planning for airportnoise.
Noise abatement andreduction measuresregarding railways andmotorways is underway,whilst airports androadways are behind in thedrawing up of plans tocontain and abate noise.

ELECTROMAGNETIC FIELDS
The problemA significant environmental issue that has become a morepressing part of our reality in recent years is undoubtedly the pres-ence of electromagnetic fields (EMF) and their relationship withboth the territory and the population.The continual development of new telecommunications systems andthe intensification of the electricity transmission network that resultfrom the increased demand for electric energy, certainly bring aboutan improvement to the quality of life but they also often cause envi-ronmental problems, and with the risk of conflicts between thegeneral public and the institutions, with can lead to social problems.This predicament, made worse by the public perception that itcould be a health risk, must be tackled in a coherent, clear andtransparent manner if pointless panic, a response that currentmedical knowledge would deem unjustifiable, is to be avoided. As of today, despite the huge strides made to safeguard publichealth, both in terms of the legislation passed and in technical-scientific expertise, there continue to be heated social clashesbetween the public and consumer associations on the one hand,and those running the plants on the other, with local governmentadministrators caught in the middle, often along with the controlagencies that act as mediators and provide the public withsupport, without however, losing sight of the rights of plant owners.
The main EMF sourcesThe sources of electromagnetic fields can be divided into two maincategories: low frequency fields (0-300 Hz) or ELF (Extremely LowFrequency) fields, essentially caused by systems for the production,distribution and use of electric energy (electric power lines, substa-tions, home appliances etc.), which, in Italy, are based on theconstant industrial frequency of 50 Hz and high-frequency fields (100kHz - 300 GHz), or RF (Radio Frequency) fields, caused by radio andtelecommunications plants (radio, TV, mobile, radar).In terms of radio and television plants (RTV) and radio basestations (RBS), the environmental impact, meaning electromag-
134
The prolonged exposure toelectromagnetic fields isbelieved to be potentialdangerous.

netic emissions evaluated according to violations of the limitspermitted by the prevailing legislation, show respective increasesof approximately 6% and 17% between 2006 and 2007. Thesepercentages were calculated, for those regions that suppliedcomplete data, by analysing data from the EMF (ElectromagneticFields) Observatory .Analysis of the data regarding the density of RTV and RBS plants(Figure 5.5) shows that the density of the RBS plants is roughlydouble that of RTV plants (respectively 0.29 and 0.13 plants perkm2), whilst the density of RBS sites (0.16 sites per km2) is aroundfive times higher than RTV sites (0.03 sites per km2).
In terms of the overall power of RTV and RBS plants (Figure 5.6),it is clear that the most significant environmental pressureproduced by electromagnetic fields is generated by radio and tele-vision plants; in fact, the total RBS power (1,971 kW) is onlyaround 25% of that generated by RTV plants (7,957 kW). Theoverall lower power levels associated with RBS plants in compar-
135
Between 2006 and 2007,there was a recorded rise inviolations of limits by bothRTV and RBS plants of +6%and 17% respectively.
It can be seen that thedensity of the RBS plants isroughly twice that of theRTV plants. There is asimilar situation regardingthe density of sites as thedensity of RBS sites is fivetimes higher than the RTVsites.
0.13
0.29
0.03
0.16
0.00
0.05
0.10
0.15
0.20
0.25
0.30
0.35
R
Density plants Density sites
TV RBS
n/k
m2
Figure 5.5: Density of plants and sites, a comparison of RTVand RBS for the regions for which full results are available(2007)5
5 Source: ISPRA/ ARPA/APPA (EMF Observatory) data processed by ISPRA

ison to RTV plants means that RBS sites create, as previouslyhighlighted, greater territorial pressure than RTV sites and thisis so that the territorial coverage needed to provide a mobile phoneservice can be guaranteed.
In this context, another significant source of pressure is thatcreated by high and extra-high voltage power lines (Figure 5.7).Based on the regions that have provided complete data for theyears 2006 and 2007, it can be seen that there has been a 27%increase in the number of 200kV and a 2% increase in the numberof 380kV power lines. In contrast, there has been a slightdecrease, equivalent to 4%, in the number of low voltage powerlines carrying less than 40kV and a slight increase, equivalentto 7%, of those carrying between 40kV and 150kV. In 2007, medium and low voltage power lines (<40kV) accountedfor most of Italy’s power grid. The latter represent the final stagesof the production, transmission and distribution of electric energyand are therefore present in far greater numbers than power linescarrying higher voltage electricity (the kilometres of power linescarrying >40kW represent only 5% of the total).
136
The most consistent form ofenvironmental pressure iscaused by RTV plants thatare overall four times morepotent than their RBScounterparts.
7,957
RTV RBS
1,971
0
1,000
2,000
3,000
4,000
5,000
6,000
7,000
8,000
9,000
kW
Figure 5.6: Total power, comparison between RTV and RBSfor regions for which complete results are available (2007)6
6 Source: ISPRA/ARPA/APPA (EMF Observatory) data processed by ISPRA

137
Between 2006 and 2007,there was the equivalent ofa 27% increase in thenumber of 220 kV powerlines and a 2% increase inthose of 380 kV. There wasalso a slight reduction,equivalent to 4%, in thenumber of power linesunder 40kV and a slightincrease, equivalent to 7% ,of those between 40kV and150 kV .
It is important to remember that the intensity of electro andmagnetic fields is, respectively, proportional to the operatingvoltage (which is fixed) and the electric current circulating in theconductors (which varies according to customer demand). Gener-
0
2,000
4,000
6,000
8,000
10,000
12,000
1
kmkm
991
1992
1993
1994
1995
1996
1997
1998
1999
2000
2001
2002
2003
2004
2005
2006
2007
220kV 380 kV
0
5,000
10,000
15,000
20,000
25,000
30,000
35,000
40,000
45,000
1991
1992
1993
1994
1995
1996
1997
1998
1999
2000
2001
2002
2003
2004
2005
2006
2007
40-150kV
Figure 5.7: Trends in the length of high and extra-high elec-tric power lines in Italy7
7 Source: ENEL Terna, ENEL Distribution, DEVAL S.p.A. and the EMF Observatorydata processed by ISPRANote: The data relates only to those regions that have provided full and completeinformation.

ally speaking, higher voltage power lines carry a greater amountof electricity and as a result, the electric and magnetic fields gener-ated by medium-low voltage lines are, on the whole, smaller thanthose created by higher voltage power lines.
Actions to limit electromagnetic pollutionIn terms of both RTV and RBS radio frequencies and extremely lowELF frequencies, control activities are a fundamental part of theoperations carried out by the responsible authorities (ARPA/APPA),and in cases where such initiatives reveal violations of exposurelimits, safety levels and quality targets, those who manage or ownthe plants take whatever clean-up action is necessary. Analysis of the data from the EMF Observatory shows that,between 2006 and 2007, there was a decrease in the numberof preliminary assessments regarding the authorization of bothRBS and RTV plants of 23% and 14% respectively. As to thenumber of controls, both experimental and those using models,there was 19% decrease of those relating to RBS and a slightincrease, of 42%, for RTV (Figure 5.8).
138
Carrying out controls isfundamental when theyreveal that exposure limitshave been exceeded.
Between 2006 and 2007, areduction in the number ofpreliminary assessments isevident for both RBS (-23%)and RTV plants (-14%), alongwith a reduction (-19%) in thenumber of checks carriedout on RBS plants and anotable increase (+42%) ofthose regarding RTV plants.
0
1,000
2,000
3,000
4,000
5,000
6,000
7,000
8,000
9,000
1999 2000 2001 2002 2003 200 4 2005 2006 2007
n.
RTV controls RBS controls Total RF controls
RTV assessments RBS assessments Total RF assessments
Figure 5.8: Assessments and controls carried out on RF plantsin Italy, broken down by source type8
8 Source: ISPRA, ARPA/APPA (EMF Observatory) data processed by ISPRA Note: The data relates only to those regions/autonomous provinces that haveprovided full and complete information.

As to the number of assessments and controls regarding ELF(extremely low frequency) power lines, Figure 5.9 shows that therewas a significant increase, between 2006 and 2007, in thenumber of assessments and the number of controls effected (bothin terms of measures taken and models based on calculations),equivalent to 10.6% and 21.2% respectively.
In terms of the clean-up initiatives undertaken to date regardingviolations identified through control activities, what stands out isthat from 2006 to 2007, in those regions that have all the datapertaining to those two years, there was a 7% increase in thenumber of RTV plants and a 25% increase in RBS plants. It isinteresting to note (Figure 5.10) the differences between the twotypes of sources, RTV and RBS, with regard to the clean-up activ-ities that have been completed and those still underway: for RBSplants, the difference between the percentage of completed clean-up activities and those underway is greater than that relating toRTV plants. This is due to the fact that, in the case of the RTVplants, clean-up activities are technically more complex, gener-ally involve more plants and it frequently proves impossible to
139
The number ofassessments carried outbetween 2006 and 2007increased by 10.6% whilstthe number of checkscarried out increased by21.2%.
Fewer interventions werecompleted on RTV plantsthan on their RBScounterparts because theclean-up process is thatmuch more complex.
0
200
400
600
800
1,000
1,200
1,400
1,600
1,800
1999 2000 2001 2002 2003 2004 200 5 2006 2007
n.
Controls Assessments
Figure 5.9: Trends in the number of assessments and controlsof sources of ELF fields in Italy9
9 Source: ISPRA, ARPA/APPA (EMF Observatory) data processed by ISPRA Note: The data relates only to those regions/autonomous provinces that haveprovided full and complete information.
maintain the quality of service set down in the acts of conces-sion. Conversely, in the case of RBS plants, clean-up activitiesgenerally take place immediately, are technically less demandingand costs are generally more contained.Regions for which data relating to 2006 and 2007 is complete,also show that the number of cases of “clean-up efforts requestedby regional and provincial agencies to safeguard the environmentand no clean-up activities” have been reset at zero as far as RBSplants are concerned and reveal an approximate 8% reduction forRTV plants. This means that there is a marked tendency to dealwith situations in which legal limits are exceeded and not to leavethem unresolved. There is, however, no information available regarding clean-upefforts relating to power lines and this is probably due to the lackof a decree of implementation of Law 36/2001 (article 4, para-graph 4) which does, in fact, set out the criteria to be used informulating such clean-up efforts. The current Italian legislative scenario pivots around the conceptof “prudent avoidance”, which underlines the importance ofavoiding or reducing exposure to an external agent to the minimumpossible should there be any doubts regarding its potential threatto human health. In fact, even in the absence of a confirmedcause-effect connection between exposure to electrical, magneticand electromagnetic fields and any health consequences, thepractice at national level is to consider the potential risk connectedto prolonged low-level exposure over time.At present, 19 regions have regulatory measures in place incompliance with current national legislation. This, combined witha legislative framework that places a special focus on safeguardingthe individual and respecting the environment (the correcturban/environmental development of plants and systems, tech-niques for mitigating the visual impact of the same etc.), meansthat public awareness remains noticeably high and shows no signsof waning, meaning that social attention to the issue continuesto be elevated.
140
Italian legislation is basedon the principle ofprecaution and in fact takesthe possibility of risksrelated to prolongedexposure intoconsideration, even whenthis is at low-levels.

141
In 2007, the clean-upoperations carried out onRBS plants wereconsiderably more thanthose carried out on RTVplants (53%).
RTV
53%
Remediala action requested by
ARPA and APPA and no remedial
action9%
8%
30%
RBS
Completed remedial actions
86%
Scheduled remedial actions
6%
0%
Remedial actions underway
8% Remediala action requested by
ARPA and APPA and no remedial
action
Completed remedial actions
Remedial actions underway
Scheduled remedial actions
Note: a By clean-up action requested, it is those actions requested by ARPA/APPA that is intended, not those programmed by those who own the plants.
Figure 5.10: Status of clean-up activities at sites where aviolation of a limit was recorded on account of RTV or RBSplants (2007)10
10 Source: ISPRA, ARPA/APPA (EMF Observatory) data processed by ISPRA Note: The data relates only to those regions/autonomous provinces that haveprovided full and complete information.

HIGHLIGHT BOX
Ultraviolet radiationUltraviolet radiation takes up the 100 to 400 nanometres (nm)range of the electromagnetic wavelength spectrum. With regardto other wavelengths, UV radiation occurs just beyond (ultra) lightthat is visible at a shorter wavelength perceived by the humaneye to be violet in colour, hence the name “ultraviolet”.UV rays are generally divided into three spectral ranges: • UV-C 100-280 nm: this form of radiation is completely absorbed
by the ozone and oxygen present in the upper layers of theatmosphere. UV-Cs account for 0.5% of the solar energy thataffects the outermost layers of the atmosphere.
• UV-B 280-315 nm: this component represents 1.5% of the solarenergy that affects the outermost layers of the atmosphere.Stratospheric ozone absorbs more UV-B radiation than anythingelse. Thanks to the shielding effect of the ozone layer, only 10%of the UV-Bs produced by the sun reach the earth’s surface.
• UV-A 315-400 nm: is the range of UV rays least absorbed bythe atmosphere. It carries 6.3% of the solar energy that reachesthe outer layers of the atmosphere and more than 95% of allthe UV rays that reach the earth’s surface.
The changes in the middle layers of stratospheric ozone and theozone “hole” above Antarctica make studying ultraviolet solar radi-ation and its effects on the environment and human health evermore topical. The study of UV radiation is carried out within two vastly differentparameters: • the UV-index, which describes the intensity of UV radiation found
in shorter wavelengths that have a higher photon energy level(around 280-320 nm) and its capacity to cause skin irritation.
• UV radiation within the UV-A range which produces rays lesslikely to cause skin irritation but that are overall more active.
The measurements of solar UV radiation taken by the ARPA AostaValley are generally expressed as units of the UV index. Thisnumber, usually somewhere between 1 and 10, has been chosenas the way in which to raise public awareness of the dangers asso-
142

ciated with excessive exposure to the sun, according to individualskin type, and the importance of taking adequate protective meas-ures. Use of the UV index is recommended by important world-wideorganizations such as the World Health Organization (WHO), theUnited Nations Environment Programme (UNEP) the World Mete-orological Organization (WMO) and the International Commissionon Non-Ionizing Radiation Protection (ICNIRP). Exposure to the ultraviolet component of solar radiation has phys-iological benefits to human health – UV-B radiation is in fact funda-mentally important in the endogenous production of Vitamin D3– and also has a tanning effect that is much sought after foraesthetic reasons. That said, it should also be remembered thata tan is a defensive response by the body when faced with progres-sive exposure to the sun’s rays, which is triggered by knowledgeof the harm this causes that is inherent in the DNA contained inskin cells.Solar radiation as a whole (ultraviolet, visible, infra-red) has beenassigned group one classification by the IRAC (International Agencyfor Research on Cancer), or in other words, not only is it certainlycancerous to man, it is believed that it is its UV component thatmakes it so. Monitoring ultraviolet radiation is particularly important in theAosta Valley given the average altitude of the area (UV radiationincreases with height), the noteworthy segment of the populationthat carries out activities at altitude and because of the presenceof snow on the ground for much of the year which, due to its reflec-tive potential (its albedo), effectively increases exposure to ultra-violet radiation. The ARPA Aosta Valley has undertaken a moni-toring programme aimed at: • starting to acquire a series of historic data that can be used
to evaluate the medium and long term tendencies of UV solarradiation on the earth’s surface as related to variations tostratospheric ozone levels.
• obtaining data that can be used to acquire a better knowledgeand understanding of the interaction between the UV compo-nent of solar radiation and the atmosphere that will also leadto greater knowledge of the dynamics of photochemical smog.
143

• evaluating the effect of exposure to solar UV radiation on a largenumber of people who are for either professional or leisurepurposes, involved in activities carried out at altitude.
UV radiation is measured at three locations in the Aosta Valley:– Saint-Christophe (570 m.a.s.l.- meters above sea level)– La Thuile - Les Granges (1,640 m.a.s.l.)– Plateau Rosa (Valtournenche, 3,500 m.a.s.l)These three locations represent three different environmental situ-ations. Saint-Christophe is located on the valley floor, character-ized by its lower height and less frequent occurrences of snowthat settles. La Thuile - Les Granges is a typical mountain loca-tion and its higher altitude is susceptible to climatic conditionsand solar radiation, which is also determined by the more exten-sive presence of snow throughout the year. It is also not far fromthe ski-area that is very busy during the winter season. PlateauRosa, finally, is a typical Alpine glacier area that is subject toextreme climatic conditions and the presence of snow throughoutthe year.
144
11 Source: ARPA Aosta Valley
Figure 5.11: The UV radiation monitoring network of ARPAAosta Valley11
Data entry centerSpectroradiometerBroadband radiometerSpectrofotometer

The choice of sites in which monitoring is carried out is delib-erate, made so that the so-called “altitude effect” - how UV radi-ation increases along with the height - can be studied as fully aspossible. The reason for this effect is that sun rays passingthrough a thinner atmospheric layer are not absorbed to the sameextent, and snow on the ground, which is highly reflective, is ableto increase the levels of radiation received.
145
12 Source: ARPA Aosta Valley13 Source: ARPA Aosta Valleya Note: Some radiometric values in June and July are being calibrated.
0
2
4
6
8
10
12
14
January February March April May Junea Julya August September October November December
Max.
UV in
dex
S aint Chris tophe (570 m m.a.s.l. ) La Thuile (1 ,64 0 m Plateau Ros a (3 ,500 m m.a.s.l. ) m.a.s.l. )
Figure 5.12: UV index, the maximum hourly value by month (2007)12
0
10
20
30
40
50
60
70
80
W/m
2
S aint Chris tophe (570 m Plateau Ros a (3,500 m
January February March April May Junea Julya August September October November December
m.a.s.l. ) m.a.s.l. )
Figure 5.13: UV radiation in the UV-A range, maximum hourlyvalue by month (2007)13

As can be seen, the annual UV index typically registers its lowestlevels in Winter and the highest in Summer, in the same way assolar irradiation. Use of mathematical models makes it possibleto project the measurements taken locally at the three locationsthroughout the entire Aosta Valley area. Below is a typical mapshowing the UV index forecast across the entire Aosta Valley areaon a day when the skies are clear.
The colour scale used for maps of the UV index is that establishedas standard by the WMO. When clear skies are forecast, thefactors listed below are borne in mind as they determine the inten-sity of UV radiation emitted by the sun that reaches ground level:• the inclination of the sun in respect of the vertical axis (zenith
angle), that varies according to season• the altimetrical height• orientation of the slopes• the amount of sky visible above the outline of the mountains,
from all points of view
146
Figure 5.14: Maximum UV index forecast for a clear day in theAosta Valley - 22/04/2008 (at 12:20 Italian summer time)14
14 Source: ARPA Aosta Valley
low moderate high very high extreme
• the total amount of ozone present in the atmosphere• the presence of aerosols in the atmosphere• the ground’s reflection coefficient (albedo) based on the pres-
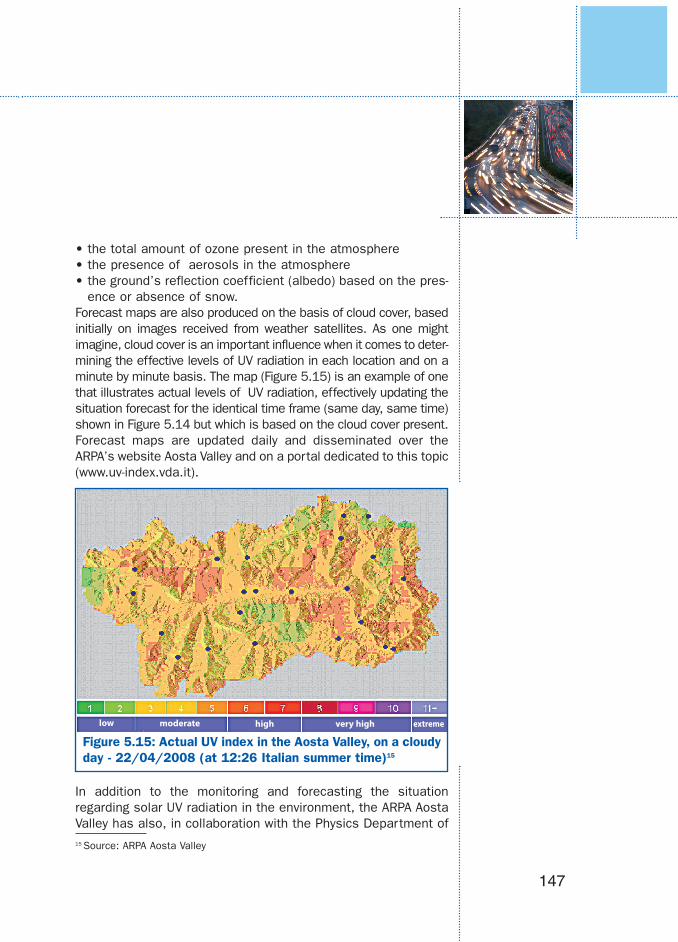
ence or absence of snow.Forecast maps are also produced on the basis of cloud cover, basedinitially on images received from weather satellites. As one mightimagine, cloud cover is an important influence when it comes to deter-mining the effective levels of UV radiation in each location and on aminute by minute basis. The map (Figure 5.15) is an example of onethat illustrates actual levels of UV radiation, effectively updating thesituation forecast for the identical time frame (same day, same time)shown in Figure 5.14 but which is based on the cloud cover present.Forecast maps are updated daily and disseminated over theARPA’s website Aosta Valley and on a portal dedicated to this topic(www.uv-index.vda.it).
In addition to the monitoring and forecasting the situationregarding solar UV radiation in the environment, the ARPA AostaValley has also, in collaboration with the Physics Department of
147
Figure 5.15: Actual UV index in the Aosta Valley, on a cloudyday - 22/04/2008 (at 12:26 Italian summer time)15
15 Source: ARPA Aosta Valley
low moderate high very high extreme

the University of Rome “Sapienza”, carried out research into theUV exposure of individuals in a snowy location. This researchproject, aimed at better determining levels of exposure to solarUV radiation by skiers, was carried out in the La Thuile ski areain April 2006 and February 2007 and involved two groups of volun-teers, skiers and ski instructors from the local school.The research entailed measuring the amount of UV radiationregistered by fixed instruments in specific locations (recordingenvironmental levels) and at the same time, the amount towhich skiers were exposed (recording individual levels). Theinstruments (radiometers), in fact, measure the radiationattracted by a fixed, horizontal sur face, and by skiers who areconstantly on the move and whose bodies are in a vertical posi-tion. The levels to which skiers were exposed were evaluatedby means of chemical dosimeters fixed to the front part of theskiers hats in a vertical position. The dosimeters themselveswere made of a tiny piece (approx. 1 cm2 ) of polysolphone film,a material that has the capacity to alter its properties (photo-degrade itself) and the greater the exposure, the greater thechange. It is characterized by the fact that its sensitivity tochange is similar to that of human skin. Skiers used a speciallydesigned chart to record the length of time the different dosime-ters were exposed and the basic details of the weather condi-tions at the time they were skiing: sunny, overcast or variablesunny/overcast conditions and researchers replaced thedosimeters every 2 hours. The purpose of the research was todetermine the relationship between individual and environmentalexposure (known as the Exposure Ratio or ER). The results of this study highlighted the fact that skiers arefrequently exposed to greater levels of exposure than theirsurrounding environment.Although the average Exposure Ratio recorded was 60% in Februaryand 102% in April, maximum levels as high as 172% were alsorecorded. When skiing in fact, one is exposed to UV radiation emitteddirectly by the sun as well as that reflected off the snow. The conclu-sions drawn by the research will make it possible to update someof the tables used by the World Health Organization that currentlyshow test measurements of Exposure Ratios that are decidedly
148

lower (under 30%), and to introduce appropriate preventativeprogrammes that promote safe exposure to the sun. Analysis hasalso determined the limitations of the current definition of the UVindex as a guide to personal levels of UV exposure.Another important variable of UV radiation is column ozone, thatis to say the ozone contained within a vertical band of the atmos-phere that extends from the earth’s surface to the apex of theatmosphere itself. Ozone, together with oxygen, is one of the mostsignificant absorbents of ultraviolet rays: every decrease in theamount of ozone in the atmosphere causes an increase in theamount of UV radiation that reaches ground level and consequentlyalso increases the risk to human health. Between heights of 15 and 50 km in the stratosphere, the ozoneproduced by UV rays acts as a shield against the actual UV raysthemselves and is therefore of benefit to and a safeguard for theeco-system.Stratospheric ozone accounts for 90% of column ozone, whilst theremaining 10% concerns tropospheric ozone, which is generated inthe lower layers of the atmosphere by the reaction of solar rays topollutants. The amount of column ozone varies according to theseason but that variability is not symmetrical in both hemispheres,as the highest levels of ozone are to be found at higher latitudes andin winter and spring. Furthermore, the greatest amount of ozone isproduced in the tropical stratosphere but is considerably less aroundhigher latitudes and in the lower stratosphere. Meteorologicalphenomena also effect the variability of column ozone – a few daysof low or high pressure conditions can make a noticeable differencein the measurements of ozone levels taken. The primary concernwhen measuring column ozone levels is the rate at which the atmos-phere absorbs ultraviolet radiation emitted by the sun. The path thistakes as it intersects the atmosphere passes through differentheights, latitudes and longitudes before it touches the ground.The ARPA Aosta Valley is part of a worldwide network that monitorsozone levels (www.woudc.org), and creates mathematical models sothat a global map of the situation can be drawn up. There are currentlytwo test sites in Italy that supply the worldwide network with figures,one is that used by the ARPA Aosta Valley whilst the University of Rome“Sapienza” mans the other.
149
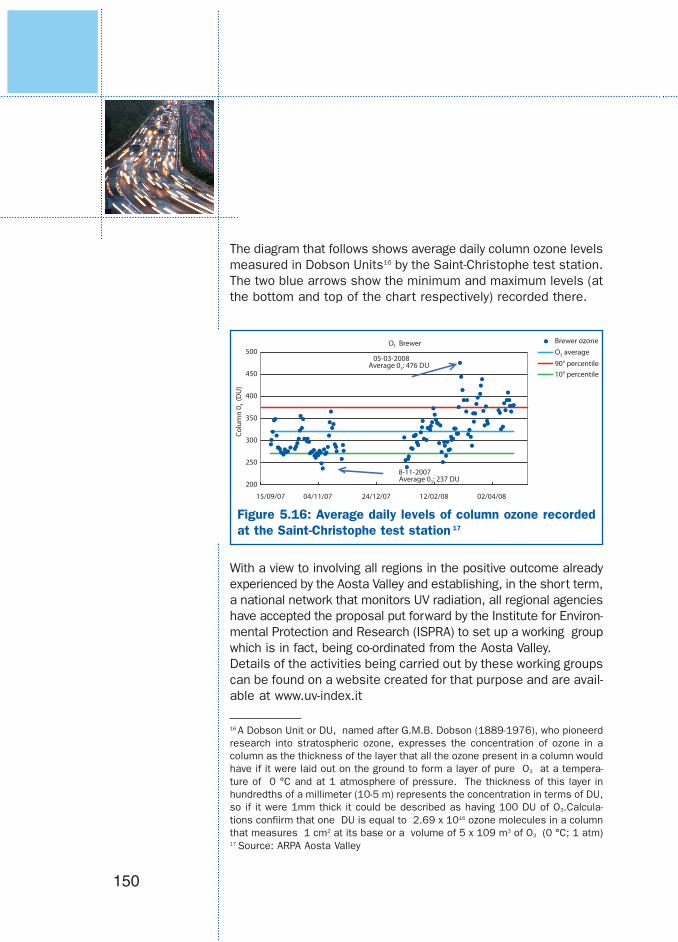
The diagram that follows shows average daily column ozone levelsmeasured in Dobson Units16 by the Saint-Christophe test station.The two blue arrows show the minimum and maximum levels (atthe bottom and top of the chart respectively) recorded there.
With a view to involving all regions in the positive outcome alreadyexperienced by the Aosta Valley and establishing, in the short term,a national network that monitors UV radiation, all regional agencieshave accepted the proposal put forward by the Institute for Environ-mental Protection and Research (ISPRA) to set up a working groupwhich is in fact, being co-ordinated from the Aosta Valley.Details of the activities being carried out by these working groupscan be found on a website created for that purpose and are avail-able at www.uv-index.it
150
O3 Brewer
200
250
300
350
400
450
500
15/09/07 04/11/07 24/12/07 12/02/08 02/04/08
Colu
mn
0 3 (D
U)
90° percentile
Brewer ozoneO3 average
10° percentile
05-03-2008 Average 03: 476 DU
8-11-2007 Average 03: 237 DU
Figure 5.16: Average daily levels of column ozone recordedat the Saint-Christophe test station 17
16 A Dobson Unit or DU, named after G.M.B. Dobson (1889-1976), who pioneerdresearch into stratospheric ozone, expresses the concentration of ozone in acolumn as the thickness of the layer that all the ozone present in a column wouldhave if it were laid out on the ground to form a layer of pure O3 at a tempera-ture of 0 °C and at 1 atmosphere of pressure. The thickness of this layer inhundredths of a millimeter (10-5 m) represents the concentration in terms of DU,so if it were 1mm thick it could be described as having 100 DU of O3.Calcula-tions confiirm that one DU is equal to 2.69 x 10¹⁶ ozone molecules in a columnthat measures 1 cm2 at its base or a volume of 5 x 10⁹ m3 of O3 (0 °C; 1 atm)17 Source: ARPA Aosta Valley

IONISING RADIATION
The problemTo the general public, the term “ionizing radiation” often provokesthe fear associated with effects on health, such as burns resultingfrom extreme exposure similar to those incurred following theexplosion of the nuclear bombs over Hiroshima and Nagasaki.These effects are technically defined as “deterministic” and arethe result of extreme exposure. Other fears concern the effectsof less severe exposure that are not immediately noticeable butthat manifest themselves over time or in future generations andthey are often associated with the risk of cancer . A clear exampleof this are the consequences on the exposed population followingthe accident at the Soviet nuclear reactor in Chernobyl. Theseeffects are technically known as “stochastic”, meaning that theprobability of them to occur depends on the intensity and dura-tion of the exposure.To the general public however, ionizing radiation is nearly alwaysonly associated with the production of nuclear energy, includingthe treatment and disposal of the radioactive waste it generates.The fear this incurs is often caused by a preconceived idea thattotally fails to take into account the costs and benefits associ-ated with this form of energy when compared to other technolog-ical means of energy production.Even so, there are cases when exposure to ionizing radiation isgenerally accepted, such as for medical, diagnostic or therapeuticpurposes. In such cases, any resulting risks are perceived to bemore than outweighed by the benefits that those undergoing suchtreatments experience. “Justification” is one of the fundamental principles adopted insafeguarding the general public and the workforce from radiation.Any activity that subjects either the general public or the work-force to exposure, must in fact be justifiable once costs and bene-fits have been weighed up and other alternatives have beenconsidered. Moreover, the level of exposure must be “optimized”,so that it is as low as possible.A second consideration regards the entity of any exposure tosources generated by anything other than those described above.
151
Ionising radiation is almostalways only associated withthe production of nuclearenergy although in fact,exposure to ionizingradiation is also a medical,diagnostic or therapeuticprocedure. In suchinstances, the risks involvedare considered to be morethan outweighed by thebenefits incurred by thosethat undergo suchtreatments.
In fact, if atomic bombs and nuclear incidents are excluded, thenany exposure that results from activities associated with energyproduction is by far inferior to any that results from naturalsources. Both in the cosmos and in the earth is crust, and evenin our own body, there are sources of ionizing radiation respon-sible for an exposure thousands of times greater than the nuclearindustry.The main source of exposure to ionizing radiation occurs in adomestic setting and in other indoor situations, which is wherepeople spend most of their time. In fact there is a natural gaspresent in the air in all these locations, called radon, which isone of the main risk factors that everyone has to face. Moreover,in some cases, it reaches such high levels of concentration thaton the cost – benefit scale mentioned above, the associated risksare considered unacceptable and taking action to restore healthyconditions to the living environment is highly recommended or evenobligatory.These considerations make the need to find out more andincrease awareness of exposure to sources of ionizing radiationclear. In this way, the assessment of the risks and benefits asso-ciated with all sources of radiation will become less difficult andbetter understood.
Radon exposureThe situation with regard to radon exposure was made clear inthe results of a nationwide investigation carried out in the 80sand 90s, which is still valid for the characteristics of the phenom-enon (Figure 5.17).
152
These considerations makethe need to find out moreand increase awareness ofexposure to ionizingradiation, so that theassessment of the risksand benefits associatedwith all sources of radiationbecomes easier and isbetter understood.

As a consequence of this investigation, the problem of protectingthe workplace from radon exposure was legally addressed withLegislative Decree n. 241/2000, which implements the CouncilDirective 96/29/Euratom and modifies and integrates the earlierDecree n. 230/1995. The decree sets out the obligations of bothemployers and the regions. In particular, the latter are chargedwith identifying the “prone areas” meaning areas with higher prob-ability of high indoor radon concentrations. Pending the determi-nation of the criteria to be used to identify these areas and themethods to be adopted in that process, some regions and someARPA/APPA have started studies and investigations that will permitclassification areas according to the likelihood of high concentra-tions of indoor radon. The regions, in which such studies havebeen started are shown in Figure 5.18.
153
High concentrations ofradon (Rn-222) have beennoted in Lazio andLombardy. The two regionsdiffer from the othersmainly because of theiruranium content and thedifferent permeability oftheir rock and soil beds.
Figure 5.17: Map showing the concentration of Rn-222 presentin homes by region and autonomous province (the choice of scaleused is of purely exemplary value) (1989-1997)18
18 Source: F. Bochicchio, et al., Results of the national survey on radon indoorsin the all the 21 Italian region, Proceedings of Radon in the Living EnvironmentalWorkshop, Athens, April 1999

In conclusion, information on the remedial action carried out inItaly in places where there is a high concentration of radon is stillscarce for both domestic situations and workplaces.
Surveillance of environmental radioactivity in Italy The surveillance of environmental radioactivity in Italy is organ-ized according to Italian law, under Legislative Decree 230/95and its subsequent modifications, as well as European legisla-tion, through a combination of networks that operate at threedistinct levels: local, regional and national.Local networks are in charge of surveillance on nuclear plants,regional networks are in charge of monitoring the level of radioac-
154
Pending the determinationof the criteria to be used toidentify the areas with highconcentrations of radon andthe methods to be adoptedin that process, someregions and someARPA/APPA have startedstudies and investigationsthat will make it possible toclassify areas according tothe likelihood of highconcentrations of radonbeing present.
In Italy, controlling levels ofradioactivity is organized atthree levels: local, regionaland national.
Figure 5.18: The regions (in green) where studies/initiativesaimed to identify radon prone areas have been underway since2002 19
19 Source: ISPRA, ARPA/APPA
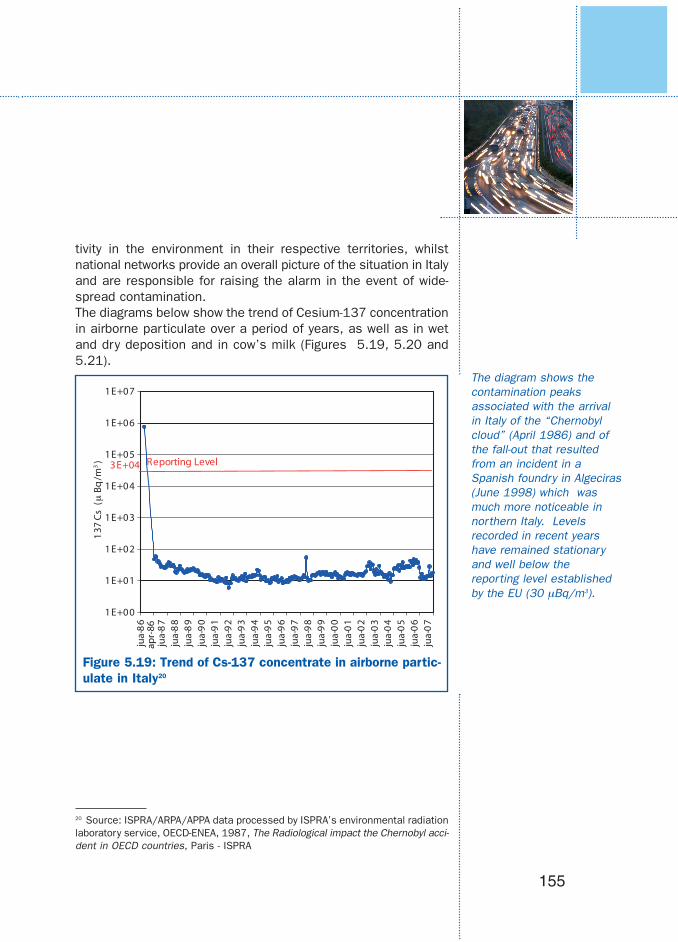
tivity in the environment in their respective territories, whilstnational networks provide an overall picture of the situation in Italyand are responsible for raising the alarm in the event of wide-spread contamination.The diagrams below show the trend of Cesium-137 concentrationin airborne particulate over a period of years, as well as in wetand dry deposition and in cow’s milk (Figures 5.19, 5.20 and5.21).
155
The diagram shows thecontamination peaksassociated with the arrivalin Italy of the “Chernobylcloud” (April 1986) and ofthe fall-out that resultedfrom an incident in aSpanish foundry in Algeciras(June 1998) which wasmuch more noticeable innorthern Italy. Levelsrecorded in recent yearshave remained stationaryand well below thereporting level establishedby the EU (30 µBq/m3).
1E+00
1E+01
1E+02
1E+03
1E+04
1E+05
1E+06
1E+07
jua
apr-
86-86
jua-
87
jua-
88
jua-
89
jua-
90
jua-
91
jua-
92
jua-
93
jua-
94
jua-
95
jua-
96
jua-
97
jua-
98
jua-
99
jua-
00
jua-
01
jua-
02
jua-
03
jua-
04
jua-
05
jua-
06
jua-
07
137
Cs
(μ
Bq
/m3
) 3E+04 Reporting Level
Figure 5.19: Trend of Cs-137 concentrate in airborne partic-ulate in Italy20
20 Source: ISPRA/ARPA/APPA data processed by ISPRA’s environmental radiationlaboratory service, OECD-ENEA, 1987, The Radiological impact the Chernobyl acci-dent in OECD countries, Paris - ISPRA

156
This diagram highlights thelevel of Cs-137 in the falloutassociated with testscarried out in theatmosphere in the 50s and60s as well as the peakthat resulted from theChernobyl accident in 1986.Since then, there has beena steady reduction incontamination levels of dryand wet deposition.
This diagram reveals ever-decreasing levels ofcontamination in cow’s milkthat is today, approximatelytwo orders of magnitudeless than it was in 1987,the year after the falloutfrom Chernobyl. Since 1990Cs-137 contamination levelshave been below thereporting level establishedby the EU (0,5 Bq/l).
1
10
100
1,000
10,000
1960
1962
1964
1966
1968
1970
1972
1974
1976
1978
1980
1982
1984
1986
1988
1990
1992
1994
1996
1998
2000
2002
2004
2006
Bq/
m2
Figure 5.20: Trend of wet and dry deposition of Cs-137 inItaly21
0
5
10
15
20
25
30
1°SE
M 1
987
2°SE
M 1
987
1988
1989
1990
1991
1992
1993
1994
1995
1996
1997
1998
1999
2000
2001
2002
2003
2004
2005
2006
2007
Bq/l
0,50Reporting level
Figure 5.21: Trend showing the concentration of Cs-137 incow’s milk in Italy 22
21 Source: ISPRA/ARPA/APPA data processed by ISPRA’s environmental radiationlaboratory service, OECD-ENEA, 1987, The Radiological impact the Chernobyl acci-dent in OECD countries, Paris - ISPRA22 Source: ISPRA/ARPA/APPA data processed by ISPRA’s environmental radiationlaboratory service, OECD-ENEA, 1987, The Radiological impact the Chernobyl acci-dent in OECD countries, Paris - ISPRA

In terms of response, the situation in Italy can be representedby the level of implementation of the network monitoringprogramme.Table 5.1 shows the scores given during the evaluation of nation-wide monitoring carried out from 1997 onwards that is based onmethodology elaborated for the ECOEHIS (Development of Envi-ronment and Health Indicators for EU countries) project.Annual scores are attributed on the basis of the following matrices:airborne particulate, ambient gamma dose rate, cow’s milk,surface water and drinking water. Each of these matrices was eval-uated according to the frequency of the measurements, the sensi-tivity of the measurements, territorial coverage of controls, regu-larity of monitoring, the organization of and participation in inter-confrontation initiatives on a nationwide basis.
Analysis of the monitoring programme highlighted that coverageof the entire national territory was incomplete and that correc-tive measures must therefore be taken.
157
Analysis of the monitoringprogramme highlighted thatcoverage of the entirenational territory wasincomplete and thatcorrective measures musttherefore be taken.
23 Source: ISPRA/ARPA Emilia Romagna data processed by ISPRA
Table 5.1: Evaluation of the state of monitoring carried outover national networks23
Year Ranking Evaluation
1997 15 satisfactory1998 17 satisfactory1999 13 unsatisfactory2000 17 satisfactory2001 17 satisfactory2002 17 satisfactory2003 17 satisfactory2004 17 satisfactory2005 17 satisfactory2006 17 satisfactory2007 17 satisfactory
Legend: classes of quality : unsatisfactory 0 ≤15 satisfactory 15 ≤21 good 21-25
