standard costing a control tool. 1.how unit input standards are developed 2.why standard cost...
TRANSCRIPT
Standard Costing
A control tool

1. How unit input standards are developed 2. Why standard cost systems are adopted2. Purpose of a standard cost sheet3. Compute direct materials and direct labor
variances, and explain how they are used for control.
4. Compute overhead variances three different ways
ObjectivesObjectivesObjectivesObjectives

Management
Planning:• Determination of
objectives & Attainment of the objectives
• Done through identification of alternatives
• Choosing from alternatives
• Plan is useless, if not achieved
Control: Control function looks
after operation of plan,
Feedback from the system and Corrective measures for deviations

DEFINITIONS
• Standard: Predetermined measurable quantity set in defined conditions.
• Standard cost: “a pre-determined cost which is calculated from management’s standards of efficient operation and the necessary expenditure”
• a standard expressed in money assuming a particular level of efficiency in utilisation resources. Quantity aspect comes from engineering specifications & rate aspect comes from budgets

STANDARD COST V. ESTIMATED COST
• Scientifically determined
• Indicates management’s efficiency view
• Controls cost performance
(what should be)
• Only past data is adjusted for anticipated changes in future
• No such indication• Does not control
(what will be)

Need for standard cost
• ‘What a product should have costed’ is more important than ‘what it did cost’ (a measure of cost performance)
• The need for standard costing emanates from the limitations of historical costing.
• Price based on historical cost may vary from day to day• Actual cost can be known after a long time in some
cases, but cost has to be determined before production in some cases.
• Efficiency cannot be gauged from historical cost• Timely corrective action cannot be taken under historical
costing to reduce losses.

Use of standard cost
• Price fixation
• Cost control through variance analysis
• Facilitates management by exception

SELECTION OF RIGHT TYPE OF STANDARDS • Basic or Bogey standard: a base year is chosen
similar to price index• Ideal standard: in all favourable conditions with
maximum efficiency, what is achievable. [not attainable, variance does not reveal what could have been avoided]
• Normal standards / Expected standard / Attainable standard: what can be achieved under normal operating conditions. If performance is abnormal, it can result in large variances.
• Current standards: forecast of current period costs taking the current output level into consideration. Variance reveals the efficiency or inefficiency in usage of factors of production.
• Kaizen standards reflect a planned improvement and are a type of currently attainable standard.
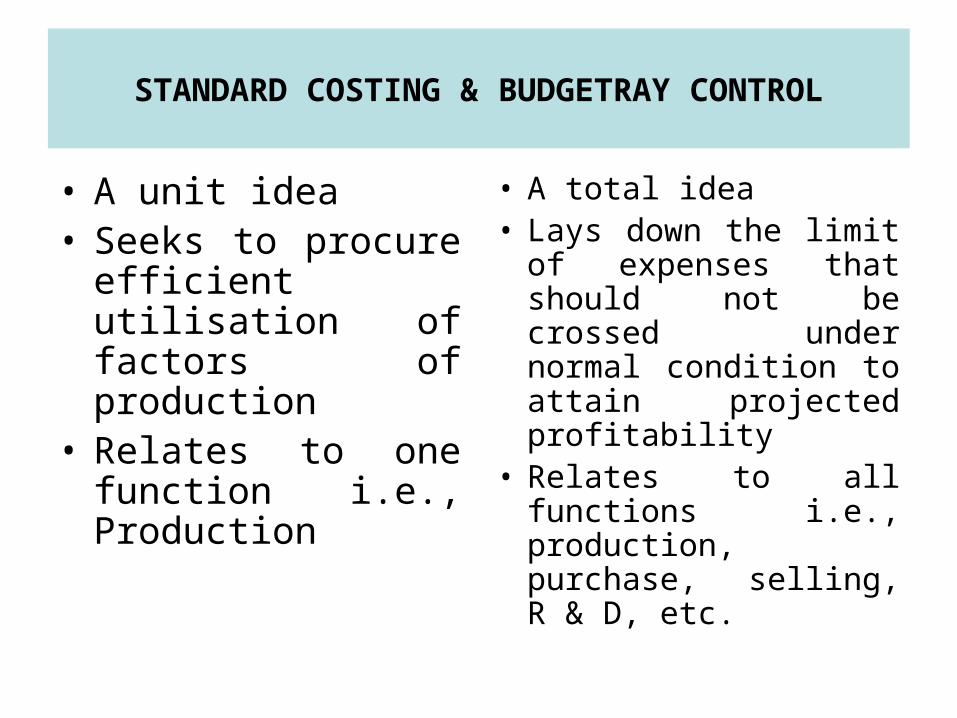
STANDARD COSTING & BUDGETRAY CONTROL
• A unit idea• Seeks to procure
efficient utilisation of factors of production
• Relates to one function i.e., Production
• A total idea• Lays down the limit of
expenses that should not be crossed under normal condition to attain projected profitability
• Relates to all functions i.e., production, purchase, selling, R & D, etc.

ADVANTAGES OF STANDARD COSTING
• Leads to optimum utilisation of resources• Reveals cost performance• By reporting distinct variances, facilitates
management by exception• Helps in planning, control and price fixation• Creates cost consciousness• Sets defined targets to be achieved.• Helps in standardisation of product• Helps cost determination immediately after
production• Encourages cost reduction.

LIMITATIONS OF STANDARD COSTING
• Standard fixation is a highly complex and technical task. Absolutely perfect standards are not found.
• Variances cannot be linked with responsibility. Multiple factors act at the same time.
• Current conditions are always volatile. So standard revision is must – a costly thing to do always.
• Can not be applied where standardisation of job is not possible (Job work)
• Isolating controllable and uncontrollable reasons is very difficult• Achievable standard fixation, if high, creates psychological problems• Depends on management support• Is not that relevant for industries where technological changes are
rapid• Selection of the right type of standard is also a problem.• Effectiveness of standard costing decreases in face of frequent
changes in the following: Changes in price Change in level of output Change in product-mix
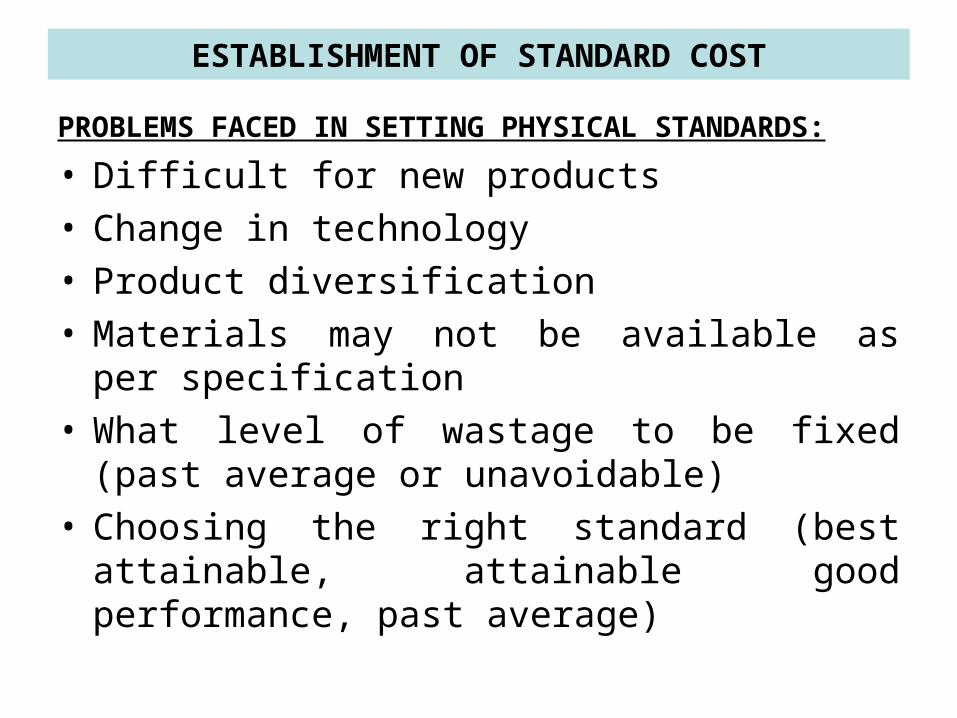
ESTABLISHMENT OF STANDARD COST
PROBLEMS FACED IN SETTING PHYSICAL STANDARDS:
• Difficult for new products• Change in technology• Product diversification• Materials may not be available as per
specification• What level of wastage to be fixed (past average
or unavoidable)• Choosing the right standard (best attainable,
attainable good performance, past average)

Cont…..
Direct Material:
• Standard quantities
• Normal loss based on past experience
• Standard price of all material taking into consideration present stock, future price fluctuation and forward contracts, if any, existing contracts, etc

Cont….
Direct Labour:
• Different grades of labour required
• Processing time gathered from work study
• Rates struck with union

Cont….Variable overhead:• Assumption is that move in sympathy
with production Fixed Overhead:• Total cost of the period• Budgeted production• Number of hours expected to be worked
in the period Then a standard cost sheet is prepared &
actual is compared with the standard
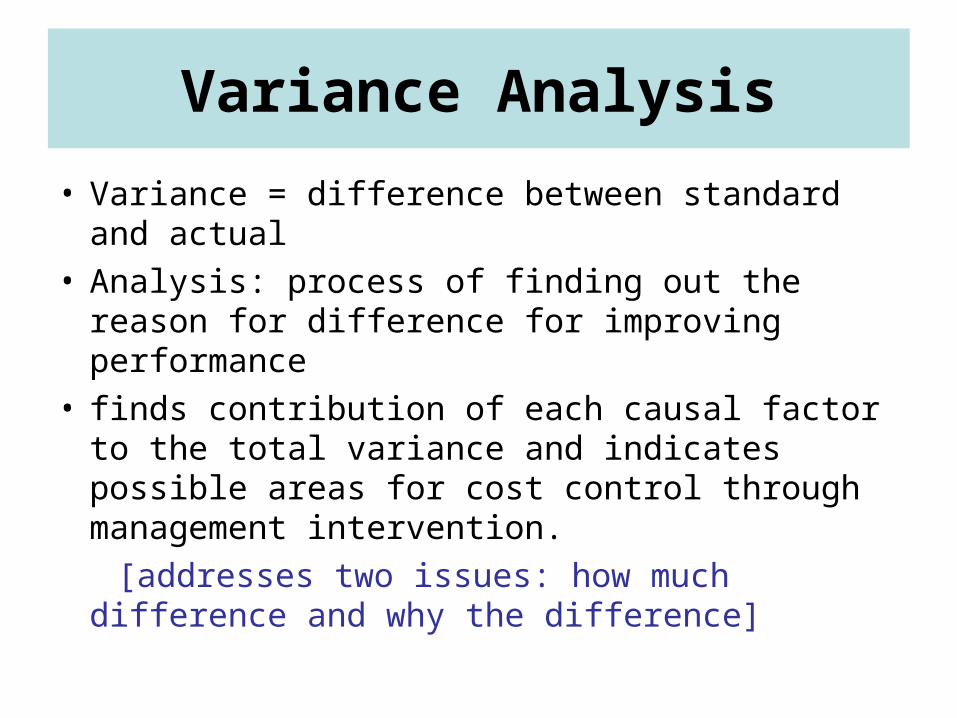
Variance Analysis
• Variance = difference between standard and actual
• Analysis: process of finding out the reason for difference for improving performance
• finds contribution of each causal factor to the total variance and indicates possible areas for cost control through management intervention.
[addresses two issues: how much difference and why the difference]

Causes of variance
efficiency in usage (quantity)
price (due to change in unit price of material or labour or indirect expenses)
change in volume

Different types of variances under different elements of cost
For different components of cost:Efficiency variance
Price variance Volume variance
Material Usage, Mixture, Yield
Price Revision
Labour Efficiency, Idle time
Pay rate
Varibale overhead
Efficiency Expenditure Revision
Fixed Overhead Efficiency Expenditure Capacity
Calendar
Sales Quantity, Mixture
Price

Some terms
• Favourable variance/Unfavourable variance
• Controllable /Uncontrollable variance
• Revision variance: If the standard has to undergo a material change due to unforeseen causes, variance due to this reason has to be separated under revision variance so that it saves time in revising the standard in future. Once revised for effective operation of standard costing, it would not recur.
STANDARD HOUR
In multi-product firms where different products have different volumes, quality, etc. all products are expressed in terms of a common measure called standard hour. It is thus a unit of output, not unit of time.
It refers to the amount of work that has to be performed in one hour’s time.

Cost Assignment ApproachesCost Assignment ApproachesCost Assignment ApproachesCost Assignment Approaches
Actual costing system Actual Actual ActualNormal costing system Actual Actual BudgetedStandard costing system Standard Standard Standard
Manufacturing CostsManufacturing Costs
Direct DirectDirect Direct Materials Labor OverheadMaterials Labor Overhead

Standard Cost SheetStandard Cost SheetStandard Cost SheetStandard Cost SheetDeluxe Strawberry Frozen Yogurt
Standard Standard Standard Standard Standard Standard Description Price Usage Cost SubtotalDescription Price Usage Cost Subtotal
Direct materials:Yogurt $0.020 x 25 oz. = $0.50Strawberries 0.010 x 10 oz. = 0.10Milk 0.015 x 8 oz. = 0.12Whipped cream 0.025 x 4 oz. = 0.10Gelatin 0.010 x 1 oz. = 0.01Container 0.030 x 1 = 0.03 Total direct
materials $0.86ContinuedContinued
Standard Standard Standard Standard Standard Standard Description Price Usage Cost SubtotalDescription Price Usage Cost Subtotal
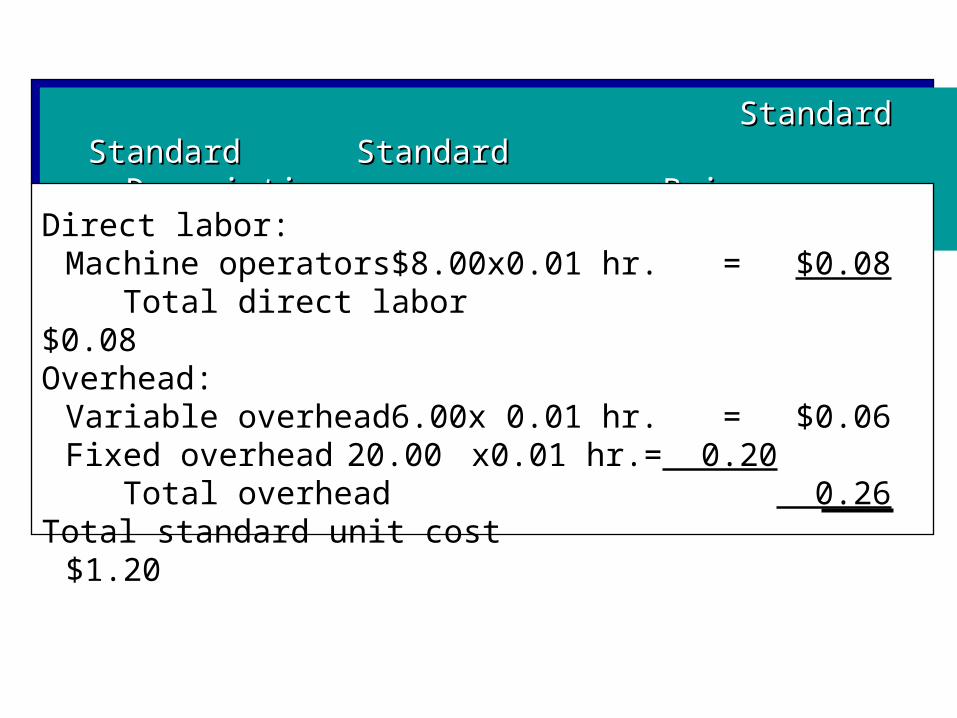
Direct labor:Machine operators $8.00 x 0.01 hr. = $0.08 Total direct labor $0.08
Overhead:Variable overhead 6.00 x 0.01 hr. = $0.06Fixed overhead 20.00 x 0.01 hr. = 0.20 Total overhead 0.26
Total standard unit cost $1.20

Standard Usage AllowedStandard Usage AllowedStandard Usage AllowedStandard Usage Allowed
Standard Quantity (SQ) of Materials Allowed for 20,000 quarts:
SQ = Unit quantity standard x Actual output
= 25 x 20,000
= 500,000 ounces
Standard Hours (SH) of Labor Allowed for 20,000 quarts:
SH = Unit quantity standard x Actual output
= 0.01 x 20,000
= 200 direct labor hours

Price and Usage VariancesPrice and Usage VariancesPrice and Usage VariancesPrice and Usage Variances
Actual production: 30,000 quartsActual yogurt usage: 780,000 ouncesActual price per ounce of yogurt: $0.025Actual direct labor hours: 325 hoursActual wage rate: $8.20 per hour

Price and Usage VariancesPrice and Usage VariancesPrice and Usage VariancesPrice and Usage Variances
AP x AQ AP x AQ (Actual (Actual Quantity at Quantity at Actual Price) (1)Actual Price) (1)
SP x AQSP x AQ (Actual (Actual Quantity at Quantity at Standard Price) (2)Standard Price) (2)
SP x SQ SP x SQ (Standard (Standard Quantity at Quantity at Standard Price) Standard Price) (3)(3)
Price Variance Price Variance (1) –(2)(1) –(2)
Usage Usage Variance (2) – Variance (2) –
(3)(3)
Total Variance (1) – (3)

MPV = (AP – SP)AQ
Material Price VarianceMaterial Price VarianceMaterial Price VarianceMaterial Price Variance
= ($0.025 – $0.020)780,000
= $0.005 x 780,000
= $3,900 U
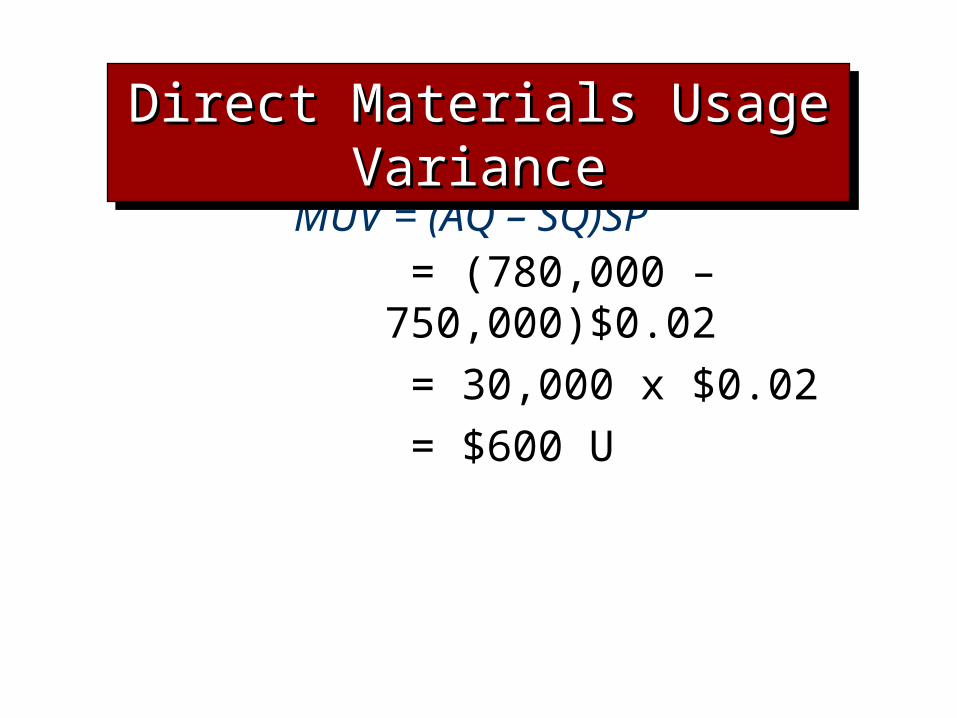
MUV = (AQ – SQ)SP = (780,000 – 750,000)$0.02
= 30,000 x $0.02
= $600 U
Direct Materials Usage VarianceDirect Materials Usage VarianceDirect Materials Usage VarianceDirect Materials Usage Variance

Rate and Efficiency VariancesRate and Efficiency VariancesRate and Efficiency VariancesRate and Efficiency Variances
AH x AR AH x AR (Actual (Actual Hours at Actual Hours at Actual Rate) (1)Rate) (1)
AH x SRAH x SR (Actual (Actual Hours at Standard Hours at Standard Rate) (2)Rate) (2)
SH x SRSH x SR (Standard Hours at (Standard Hours at Standard Rate) (3)Standard Rate) (3)
Rate Variance Rate Variance (1) –(2)(1) –(2)
Efficiency Efficiency Variance Variance
(2) – (3)(2) – (3)
Total Variance (1) – (3)

Labor Rate VariancesLabor Rate Variances Labor Rate VariancesLabor Rate Variances
LRV = (AR – SR)AH = ($8.20 – $8.00)325
= $0.20 x 325
= $65 U
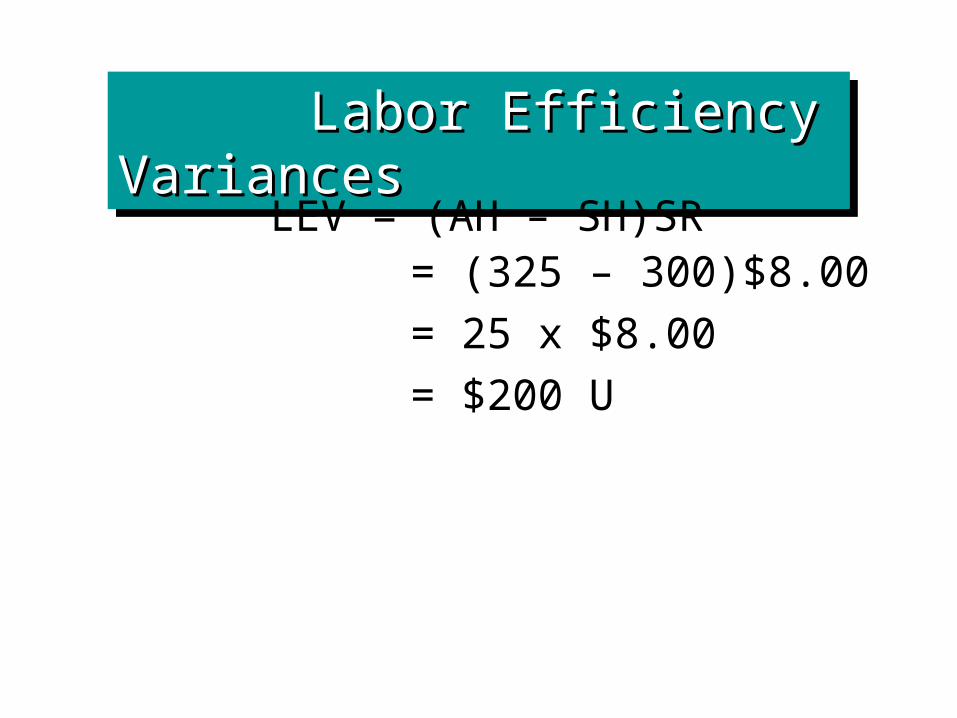
Labor Efficiency VariancesLabor Efficiency Variances Labor Efficiency VariancesLabor Efficiency Variances
LEV = (AH – SH)SR = (325 – 300)$8.00
= 25 x $8.00
= $200 U

Disposition of Direct Materials and Direct Labor Variances
Disposition of Direct Materials and Direct Labor Variances
If material in amountIf material in amount
Prime Costs Percentage of Total
Work in Process $ 0 0 %
Finished Goods 3,480 20
Cost of Goods Sold 13,920 80
Total $17,400 100 %

Disposition of Direct Materials and Direct Labor Variances
Disposition of Direct Materials and Direct Labor Variances
The receiving report and the invoice are used to record the receipt of the
merchandise and to control the payment.
Cost of Goods Sold 3 812 00
Direct Materials Price Variance 3 900 00
Direct Materials Usage Variance 600 00
Direct Labor Rate Variance 65 00
Direct Labor Efficiency Variance 200 00
If material in amountIf material in amount
Finished Goods 953 00

Variable Overhead VariancesVariable Overhead Variances
Variable overhead rate (standard) $6.00/DLH
Actual variable overhead costs $7,540
Actual hours worked 1,300
Quarts of deluxe frozen strawberry
yogurt produced 120,000
Hours allowed for production 1,200
Applied variable overhead $7,200

Variable Overhead VariancesVariable Overhead Variances
Actual Variable Actual Variable Overhead Overhead (1)(1)
Variable Variable Overhead Rate x Overhead Rate x Actual Hours Actual Hours (2)(2)
Variable Variable Overhead Rate x Overhead Rate x Standard Hours Standard Hours (3)(3)
Spending Spending Variance Variance
(1) –(2)(1) –(2)
Efficiency Efficiency Variance Variance
(2) – (3)(2) – (3)
Total Variance (1) – (3)

VOSV = (AVOR x AH) – (SVOR x AH)
Variable Overhead Spending VariancesVariable Overhead Spending Variances
= (AVOR – SVOR)AH
= ($5.80 – $6.00)1,300
= $260 F

VOEV = (AH – SH)SVOR
Variable Overhead Efficiency VariancesVariable Overhead
Efficiency Variances
= (1,300 – 1,200)$6.00
= $600 U

Helado Company, Inc.Helado Company, Inc.Flexible Budget Performance ReportFlexible Budget Performance ReportFor the Month Ended May 31, 2004For the Month Ended May 31, 2004
Cost Formula
Actual Costs Budget
Spending Variance
Natural gas $3.80 $4,400 $4,940 $540 F
Electricity 2.00 2,840 2,600 240 U
Water 0.20 300 260 40 U
Total cost $6.00 $7,540 $7,800 $240 F
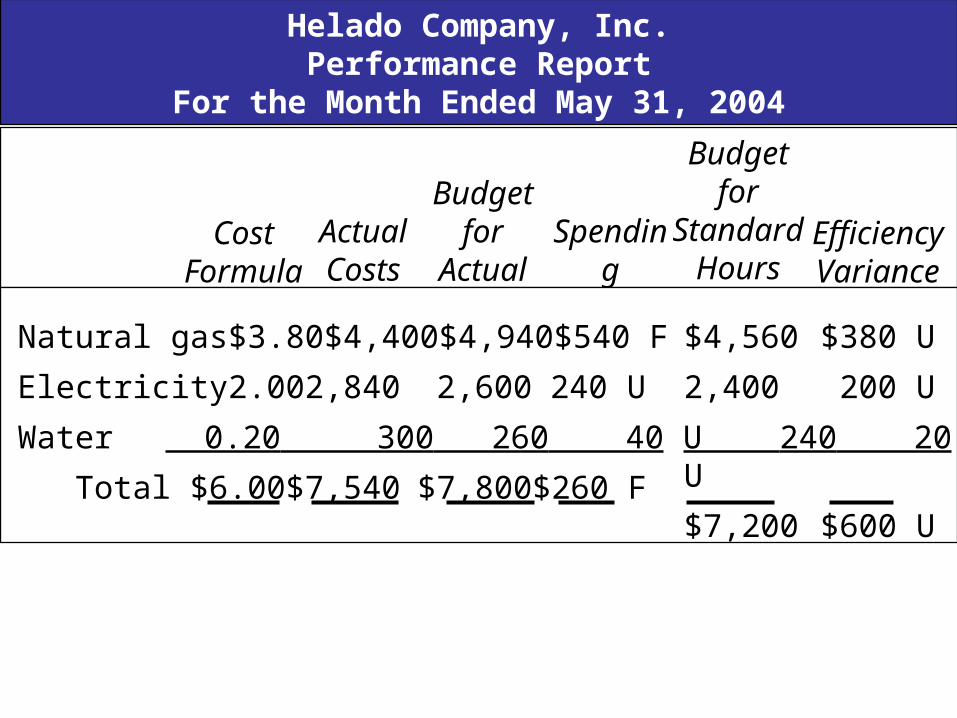
Helado Company, Inc.Performance Report
For the Month Ended May 31, 2004
Cost Formula
Actual Costs
Budget for Actual
HoursSpending Variance
Natural gas $3.80 $4,400 $4,940 $540 F
Electricity 2.00 2,840 2,600 240 U
Water 0.20 300 260 40 U
Total $6.00 $7,540 $7,800 $260 F
Budget for
Standard Hours
EfficiencyVariance
$4,560 $380 U
2,400 200 U
240 20 U
$7,200 $600 U

Fixed Overhead VariancesFixed Overhead Variances
Budgeted fixed overhead $20,000
Expected activity 1,000 direct labor hours
Standard fixed overhead rate $20
Hours allowed to produce 100,000 quarts of frozen yogurt (0.01 x 100,000)
Budgeted or Planned Items (May)
Actual Results
Actual production 120,000 quarts
Actual fixed overhead cost $20,500
Standard hours allowed for actual production (0.01 x 120,000) 1,200
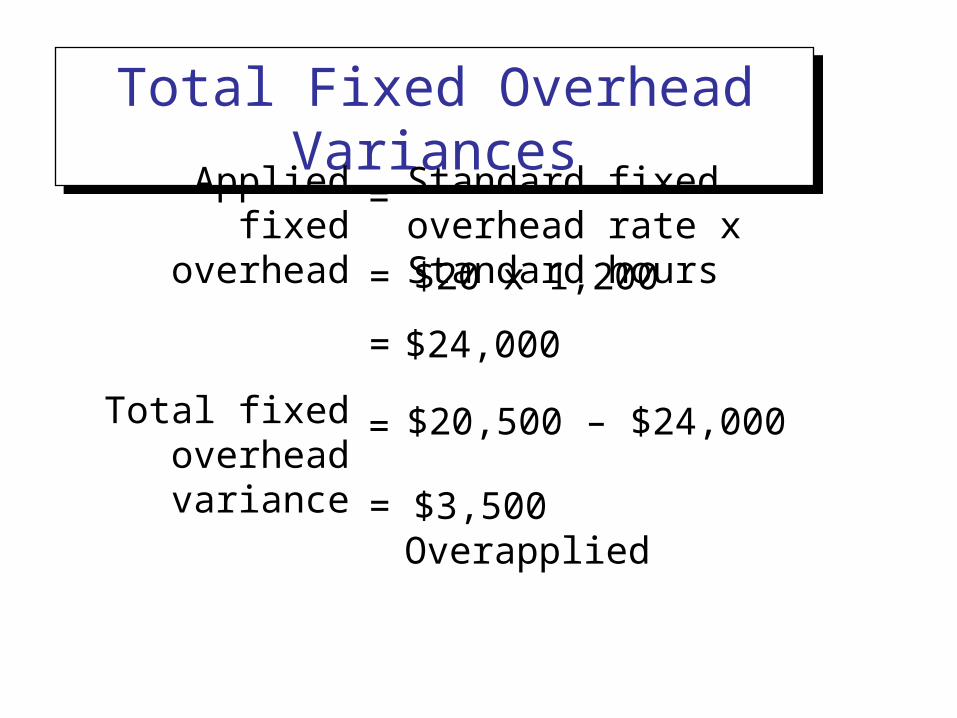
Total Fixed Overhead VariancesTotal Fixed Overhead Variances
Applied fixed overhead
Standard fixed overhead rate x Standard hours
=
= $20 x 1,200
= $24,000
Total fixed overhead variance
$20,500 – $24,000=
= $3,500 Overapplied

Fixed Overhead VariancesFixed Overhead Variances
Actual Fixed Actual Fixed Overhead Overhead (1)(1)
Budgeted Fixed Budgeted Fixed Overhead Overhead (2)(2)
Fixed Overhead Fixed Overhead Rate x Standard Rate x Standard Hours (3)Hours (3)
Spending Spending Variance Variance
(1) – (2)(1) – (2)
Volume Volume Variance Variance
(2) – (3)(2) – (3)
Total Variance (1) – (3)

Fixed Overhead Spending VarianceFixed Overhead Spending Variance
FOSV = AFOH – BFOH
= $20,500 – $20,000
= $500 U

Helado Company, Inc.Performance Report
For the Month Ended May 31, 2004
Actual Cost
Budgeted Cost Variance
Depreciation $ 5,000 $ 5,000 $----
Salaries 13,400 13,000 400 U
Taxes 1,100 1,050 50 U
Insurance 1,000 950 50 U
Total $20,500 $20,000 $500 U
Fixed Overhead Items

Fixed Overhead Volume VarianceFixed Overhead Volume Variance
FOVV = Budgeted fixed overhead – Applied fixed overhead
= $20(1,000 – 1,200)
= $4,000 F
= [Standard fixed overhead rate x SH(D)] – (Standard fixed overheadx SH)
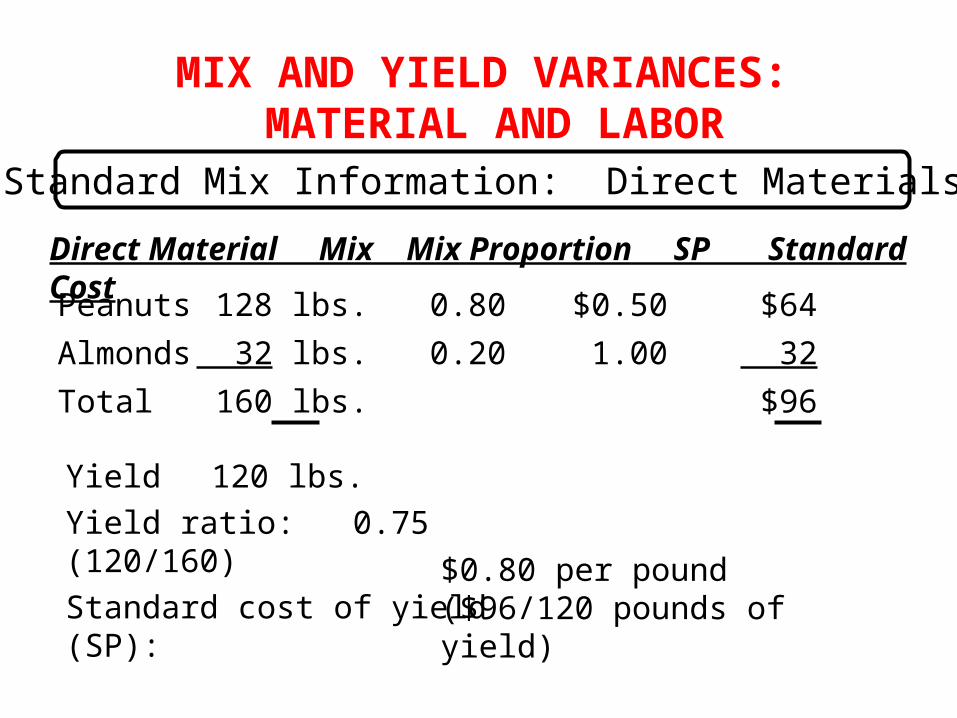
MIX AND YIELD VARIANCES: MATERIAL AND LABOR
Standard Mix Information: Direct Materials
Direct Material Mix Mix Proportion SP Standard Cost
Peanuts 128 lbs. 0.80 $0.50 $64
Almonds 32 lbs. 0.20 1.00 32
Total 160 lbs. $96
Yield 120 lbs.
Yield ratio: 0.75 (120/160)
Standard cost of yield (SP): $0.80 per pound ($96/120 pounds of yield)

Malcom Nut Company produces a batch of 1,600 pounds and produces the following actual results:
Direct Material Actual Mix Percentages
Peanuts 1,120 lbs. 70 %Almonds 480 30Total 1,600 lbs. 100 %
Yield 1,300 lbs. 81.3 %
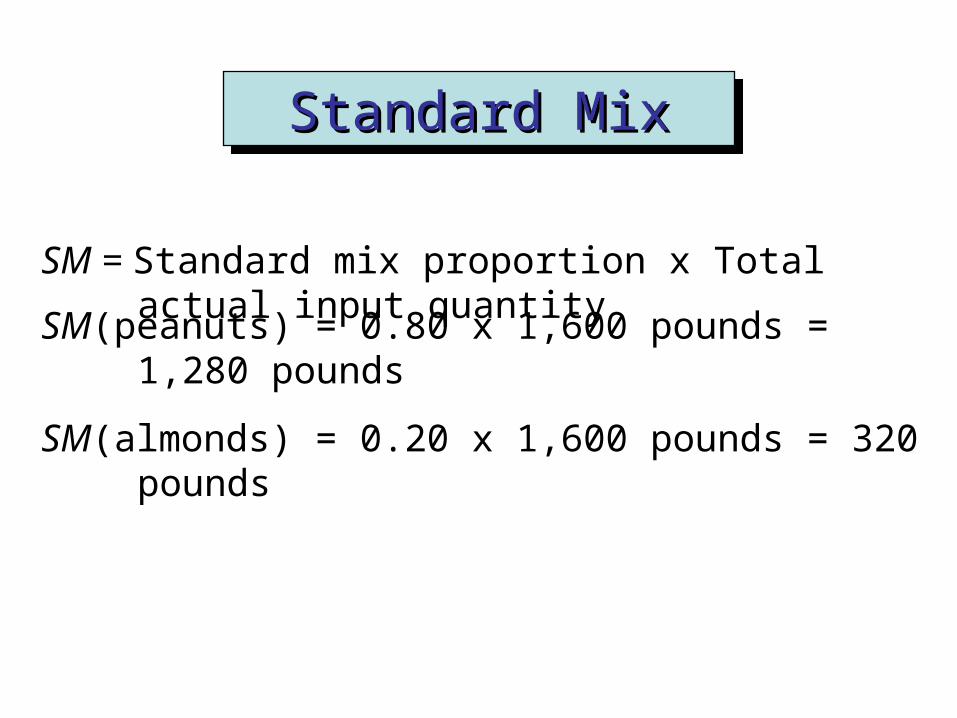
SM = Standard mix proportion x Total actual input quantity
SM(peanuts) = 0.80 x 1,600 pounds = 1,280 pounds
SM(almonds) = 0.20 x 1,600 pounds = 320 pounds
Standard MixStandard MixStandard MixStandard Mix

Mix Variance = 3(AQ – SM)SP
Direct Material AQ SM AQ – SM SP (AQ – SM)SP
Peanuts 1,120 1,280 -160 $0.50 $-80Almonds 480 320 160 1.00 60Mix variance $-80 U
Standard MixStandard MixStandard MixStandard Mix

Standard yield = Yield ratio x Total actual inputs
Direct Materials Yield VarianceDirect Materials Yield Variance
Yield variance = (Standard yield – Actual yield)SPy
Yield variance = (1,200 – 1,300)$0.80
= $80 F

Standard Mix Information
Labor Type Mix Mix Proportion SP Standard Cost
Shelling 3 hrs. 0.60 $ 8.00 $24
Mixing 2 hrs. 0.40 15.00 30
Total 5 hrs. $54
Yield 120 lbs.
Yield ratio: 24 = (120/5), or 2,400%
Standard cost of yield (SP ): $0.45 per pound ($54/120 pounds of yield)
y

Malcom processes 1,600 pounds of nuts and produces the following actual results:
Shelling 20 hrs. 40%
Mixing 30 hrs. 60%
Total 50 hrs. 100%
Yield 1,300 lbs. 2,600%
*Uses 50 hours as the base.
Standard Mix Information
Labor Type Actual Mix Mix Percentages*

Labor Type AH SM AH – SM SP (AH – SM)/SP
Shelling 20 30 -10 $ 8.00 $-80
Mixing 30 20 10 15.00 150
Direct Labor mix variance $-70 U
Direct Labor Mix Variance

Using the standard mix information and the actual results, the yield variance is computed as follows:
Yield variance = (Standard yield – Actual yield)SP= [(24 x 50) – 1,300]$0.45= (1,200 – 1,300)$0.45= $45 F
The yield variance is favorable because the actual yield is greater than the standard yield.
Direct Labor Yield Variance
y

Breaking Sales Volume variance
1. Market size variance =[(Actual Industry Sales in Units – Budgeted Industry Sales in Units) x Budgeted Market Share Percentage] x Budgeted Average Unit
2. Market share variance=[(Actual Market Share Percentage – Budgeted Market Share Percentage) x Actual Industry Sales in Units] x Budgeted Average Unit Contribution Margin
[Size variance is uncontrollable, share variance is controllable]