standard description 2015 - c.ymcdn.com · 75,000 patients with hais died ... infection control in...
TRANSCRIPT


Standard Description 2015
EC.02.06.01Safe environment (O2 cylinders;
ventilation)59%
IC.02.02.01Infection risk reduction assoc.
with equipment, supplies54%
EC.02.05.01 Manage utility risks (ventilation) 53%
LS.02.01.20Means of egress (corridor
clutter)50%
RC.01.01.01 Patient medical records 48%


Major Site of Infection Estimated Number of Infections (2011)
Healthcare-Associated Infections (all)
721,800
Pneumonia 157,500
Gastrointestinal Illness 123,100
Urinary Tract Infection 93,300
Primary Bloodstream Infections 71,900
Surgical Site Infections 157,500
Other infections 118,500

1 in 25 hospital patients has 1 or more HAI
75,000 patients with HAIs died
Many states require hospitals to post their infection rates online


The Joint Commission Guidelines for the Design and Construction of Health
Care Facilities CDC – Guidelines on Environmental Infection Control
in Healthcare Facilities Assoc. for Professionals in Infection Control and
Epidemiology (APIC)

Standard Description 2015
EC.02.06.01Safe environment (O2 cylinders;
ventilation)59%
IC.02.02.01Infection risk reduction assoc.
with equipment, supplies54%
EC.02.05.01 Manage utility risks (ventilation) 53%
LS.02.01.20Means of egress (corridor
clutter)50%
RC.01.01.01 Patient medical records 48%

Breathing easy: The role of HVAC systems in preserving patient safety…EC.02.05.01
Specific concerns:◦ Directing airflow
◦ Managing outside air
◦ Reliable filtration
◦ Keeping systems energy efficient while minimizing risk
A. 0.1%
B. 1%
C. 3%
D. 33%

A. 0.1%
B. 1%
C. 3%
D. 33%◦ 9,582 TB cases (a rate of 3.0 cases per
100,000 persons) were reported in the United States in 2013

Hotel MHong Kong
Guangdong Province,
China A
A
H,J
A
H,J
Hong Kong SAR
95 HCW
>100 close contacts
U.S.A.
1 HCW
I, L,M
I,L,M
KIreland
0 HCWK
Singapore
34 HCW
37 close contacts
C,D,E
C,D,E
B
B
Vietnam
37 HCW
21 close contacts
F,G
Canada
18 HCWF,G
11 close contacts
SARS Epidemic
[www.cdc.gov]

The analysis of SARS transmission, and reports from other outbreaks, unveil a complex scenario in which super-spreading events are shaped by multiple factors, including co-infection with another pathogen, immune suppression, changes in airflow dynamics, delayed hospital admission, misdiagnosis, and inter-hospital transfers.
(RA Stein, International Journal of Infectious Diseases, August, 2011.)

A. 0
B. 1,000
C. 10,000
D. 1,000,000

A. 0
B. 1,000
C. 10,000
D. 1,000,000

"West Africa Ebola 2014 13 Reported Cases per Week" by Malanoqa - Own work. Licensed under CC BY-SA 4.0 via Wikimedia Commons

Thru February 22:◦ 23,729 cases
◦ 9,604 deaths (40%)

27 Fungal outbreaks from construction
Burn, trauma, transplant, oncology, respiratory failure, renal disease, premature infants, etc.
234 total infections
At least 117 deaths(“Construction-related Nosocomial Infections in Patients in Healthcare Facilities,” Canada Communicable Disease Report, Volume 27S2, 7/2001.)


Fungi: 1 to 15 microns◦ Aspergillus spp.: 3.5 microns
◦ Penicillium spp.: 3.3 microns
◦ Stachybotrys spp.: 5.65 microns
Bacteria: 0.23 to 1.25 microns
Viruses: <0.23 microns
[Kowalski et al. 1999]

Construction Project Type
Patient Risk GroupA B C D
Low I II II III/IV
Medium I II III IV
High I II III/IV IV
Highest II III/IV III/IV IV
Adapted from ICRA Matrix developed by J. Bartley, ECSI, Beverly Hills, MI; used with permission

Dust control
Negative pressure of work zone
Containment barriers
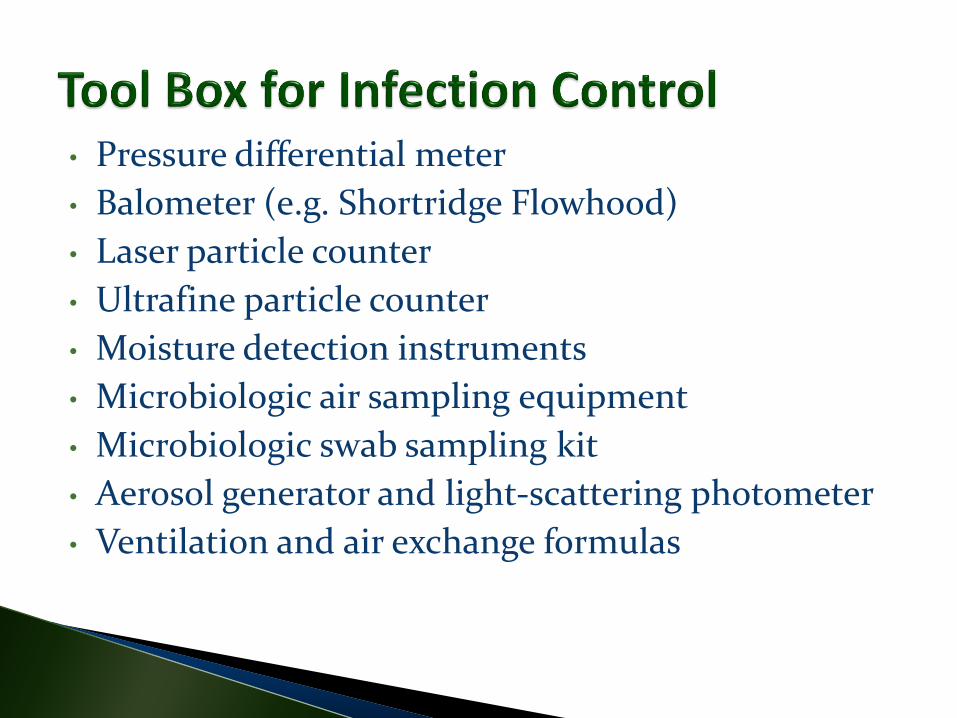
• Pressure differential meter
• Balometer (e.g. Shortridge Flowhood)
• Laser particle counter
• Ultrafine particle counter
• Moisture detection instruments
• Microbiologic air sampling equipment
• Microbiologic swab sampling kit
• Aerosol generator and light-scattering photometer
• Ventilation and air exchange formulas

Commissioning
Determination of existing conditions
Verification of system performance
Epidemiology evaluation

Know what question(s) you want answered
Know how to interpret the results
Develop a sampling plan agreed by all involved
A. Monthly
B. Semi-Annual
C. Annual
D. Before TJC survey
E. Depends

Isolation rooms
Protective environment rooms
Pharmaceutical compounding areas
Building pressurization
Construction work zones
Laboratories
More… [Photo provided by
The Energy Conservatory]


A. Visual Indicator
B. Digital Manometer
C. Both
D. Depends

A. Any negative value
B. 0.001” w.g.
C. 0.01” w.g.
D. 0.02” w.g.
E. Depends

Continuous readouts of all airborne particles
Rank-order comparisons among clean, dirty, and outdoor areas (CDC)


Example Particle Counts Outdoors (clear, spring day) = 10,000 p/L Patient wing corridor = 1,000 p/L HEPA-filtered OR = 100 p/L
p/L = particles greater than 0.5 microns in diameter per liter of air

Total Particles
AspergillusCo
nce
ntr
ati
on
Time

Inpatient and outpatient care
Built 1994
5 stories plus basement
235,000 square feet
AHUs: MERV 8 (35%) + HEPA (99.99%)

Mean Median Min Max Std Dev
Outdoors (n=2) 11,930 7,531 1,716 78,537 14,935
1st floor (Ambulatory Care; n=18)
375 152 1 5,394 597
2nd floor (Inpatient; n= 21) 136 94 0 4,813 233
3rd floor (Surgery and ICU; n=15)
152 65 0 4,749 406
4th floor (BMT; n=12) 122 34 0 6,206 463
[Reference: Old LT, Air Quality Challenges Unique to Healthcare:
Perspectives from the Safety Office. ASHE 2010 Annual Conference]

Mean Median Min Max Std Dev
Outdoors (n=2) 11,930 7,531 1,716 78,537 14,935
Corridors, lobbies, nurses stations (n=43)
222 100 1 6,206 491
Patient treatment and inpatient rooms (n=12)
71 45 0 870 92
Surgery (n=4) 49 35 0 251 49
BMT patient rooms (terminal HEPA; n=3)
44 15 0 368 73
[Reference: Old LT, Air Quality Challenges Unique to Healthcare:
Perspectives from the Safety Office. ASHE 2010 Annual Conference]

Particle counters may be used to evaluate
barrier integrity.
[CDC Environmental Infection Control Guidelines]
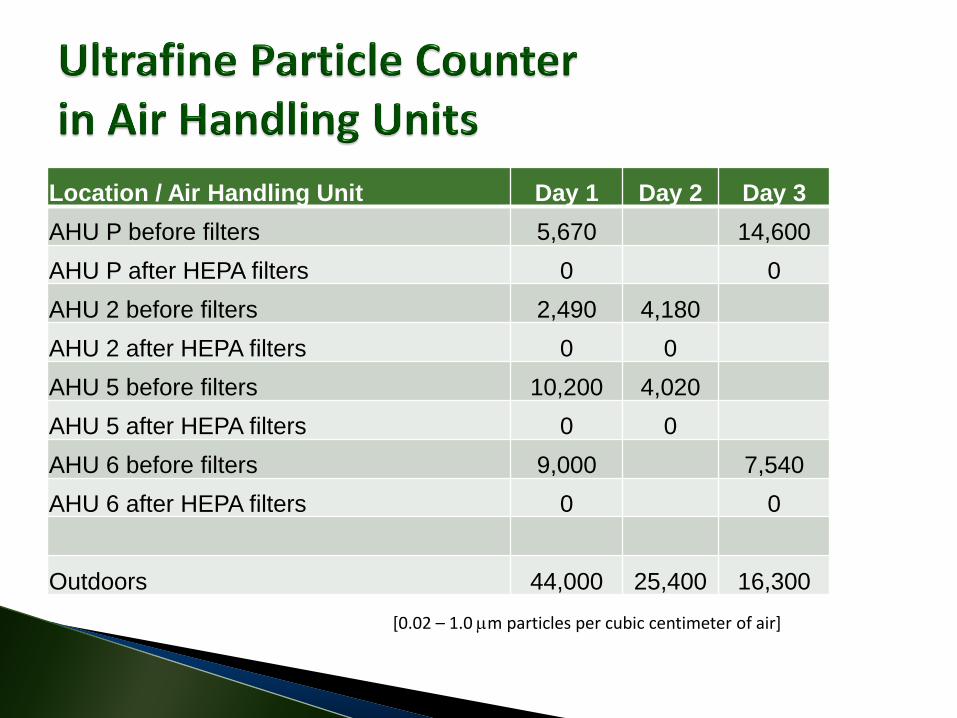
Location / Air Handling Unit Day 1 Day 2 Day 3
AHU P before filters 5,670 14,600
AHU P after HEPA filters 0 0
AHU 2 before filters 2,490 4,180
AHU 2 after HEPA filters 0 0
AHU 5 before filters 10,200 4,020
AHU 5 after HEPA filters 0 0
AHU 6 before filters 9,000 7,540
AHU 6 after HEPA filters 0 0
Outdoors 44,000 25,400 16,300
[0.02 – 1.0 m particles per cubic centimeter of air]


A. Any negative value
B. 0.001” w.g.
C. 0.01” w.g.
D. 0.02” w.g.
E. Depends

A. 2 air changes per hour
B. 4 air changes per hour
C. 10 air changes per hour
D. Depends

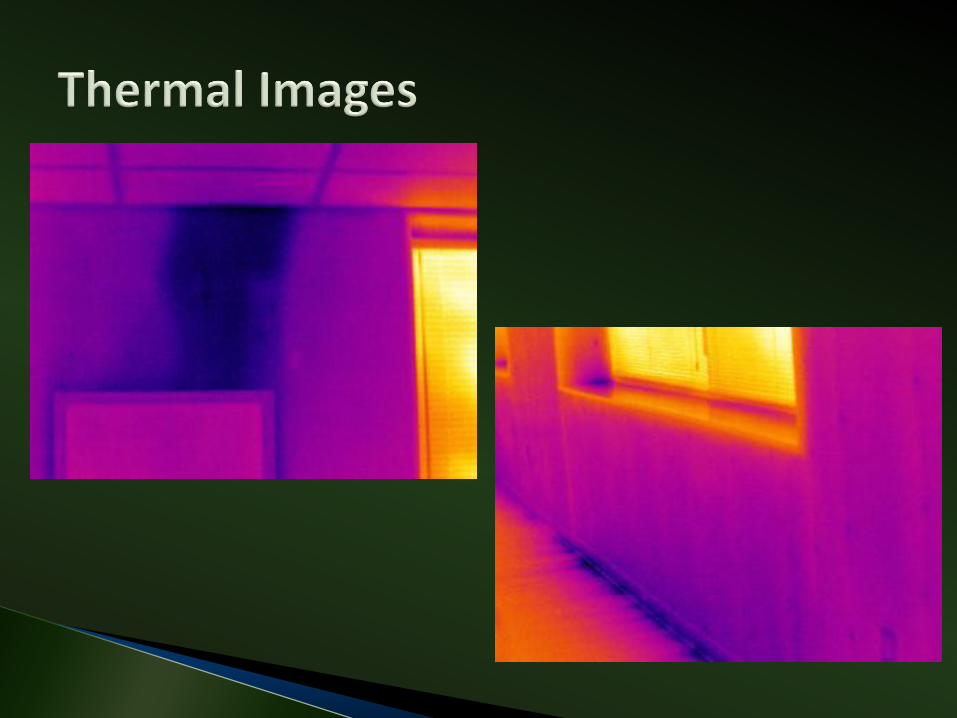
Thermal imaging cameras and moisture meters help detect hidden moisture damage

A. Take sample to determine genus/species
B. Abate
C. No action necessary because less than 5 sq ft
D. Observe regularly to verify not spreading
E. Other

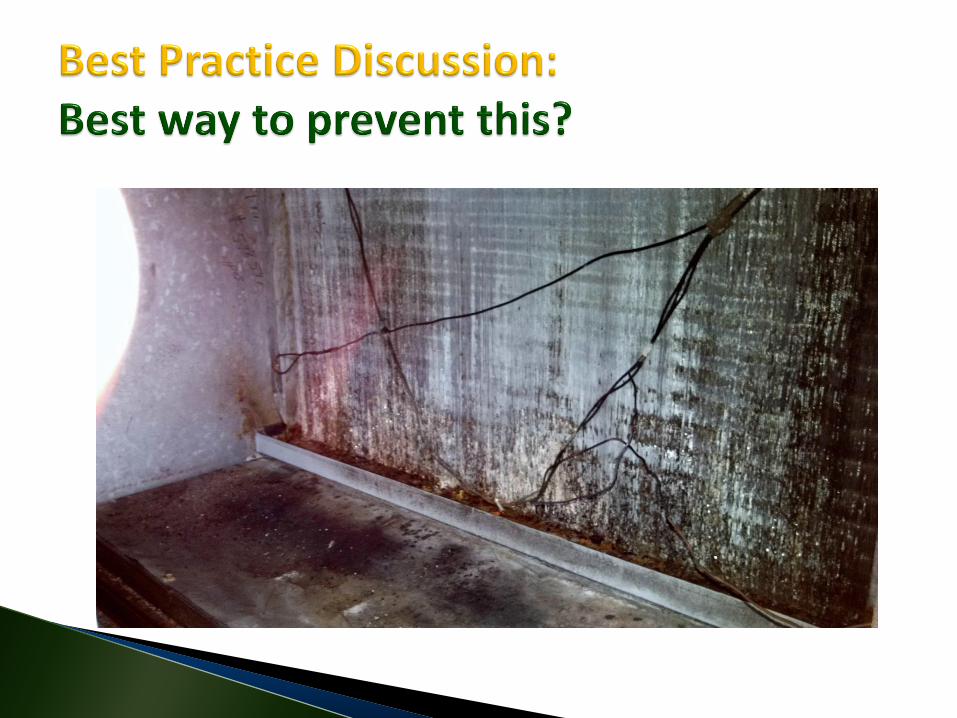
Remove wet absorbent items (e.g., furniture, wallboard, carpeting, etc.) if they cannot be cleaned and dried within 72 hours (i.e., moisture content <20% as determined by moisture meter readings).


Fungi: 1 to 15 microns◦ Aspergillus spp.: 3.5 microns
◦ Penicillium spp.: 3.3 microns
◦ Stachybotrys spp.: 5.65 microns
Bacteria: 0.23 to 1.25 microns
Viruses: <0.23 microns
[Kowalski et al. 1999]


[Kowalski et al. 1999]

A. Annual cleaning
B. Periodic cleaning as recommended by manuf.
C. Ultraviolet germicidal irradiation (UVGI)
D. Cleaning + UVGI
E. Other

During renovation, you discover that the construction work zone is not under negative pressure. The contractor has also not been recording pressure differential readings over the last 2 weeks in accordance with the Infection Control Risk Mitigation Plan. What should you do?

Leo Old
EnSafe Inc.
901-372-7962 (office)
901-232-4415 (cell)