standard life aberdeen plc · pdf filestandard life aberdeen plc is registered in scotland...
TRANSCRIPT

Standard Life Aberdeen plc
Creating a diversified world-class investment company
September 2017

2Bank of America Merrill Lynch 22nd Annual Financials CEO Conference | September 2017
This presentation may contain certain “forward-looking statements” with respect to the financial condition, performance, results, strategy, objectives, plans, goals and expectations of Standard Life Aberdeen plc (“Standard Life Aberdeen”) and its affiliates. These forward-looking statements can be identified by the fact that they do not relate only to historical or current facts. Forward-looking statements are prospective in nature and are not based on historical facts, but rather on current expectations and projections of the management of Standard Life Aberdeen about future events, and are therefore subject to risks and uncertainties which could cause actual results to differ materially from the future results expressed or implied by the forward-looking statements. For example, statements containing words such as “may”, “will”, “should”, “could”, “continue”, “aims”, “estimates”, “projects”, “believes”, “intends”, “expects”, “hopes”, “plans”, “pursues”, “seeks”, “targets” and “anticipates”, and words of similar meaning, may be forward-looking. These statements are based on assumptions and assessments made by Standard Life Aberdeen in light of its experience and its perception of historical trends, current conditions, future developments and other factors it believes appropriate. By their nature, all forward-looking statements involve risk and uncertainty because they are based on information available at the time they are made, including current expectations and assumptions, and relate to future events and depend on circumstances which may be or are beyond Standard Life Aberdeen’s control, including among other things: UK domestic and global political, economic and business conditions (such as the United Kingdom’s exit from the European Union); market related risks such as fluctuations in interest rates and exchange rates, and the performance of financial markets generally; the impact of inflation and deflation; experience in particular with regard to mortality and morbidity trends, lapse rates and policy renewal rates; the impact of competition; the timing, impact and other uncertainties associated with future acquisitions, disposals or combinations undertaken by Standard Life Aberdeen or its affiliates and/or within relevant industries; default by counterparties; information technology or data security breaches; natural or man-made catastrophic events; the failure to attract or retain necessary key personnel; the policies and actions of regulatory authorities; and the impact of changes in capital, solvency or accounting standards, and tax and other legislation and regulations in the jurisdictions in which Standard Life Aberdeen and its affiliates operate. These may for example result in changes to assumptions used for determining results of operations or re-estimations of reserves for future policy benefits. As a result, Standard Life Aberdeen’s actual future financial condition, performance and results may differ materially from the plans, goals, objectives and expectations set forth in the forward-looking statements. Persons receiving this presentation should not place undue reliance on forward-looking statements. Neither Standard Life Aberdeen nor its affiliates assume any obligation to update or correct any of the forward-looking statements contained in this presentation or any other forward-looking statements it or they may make (whether as a result of new information, future events or otherwise), except as required by law. Past performance is not an indicator of future results and the results of Standard Life Aberdeen and its affiliates in this presentation may not be indicative of, and are not an estimate, forecast or projection of, Standard Life Aberdeen’s or its affiliates’ future results.
Standard Life Aberdeen plc is registered in Scotland (SC286832) at Standard Life House, 30 Lothian Road, Edinburgh EH1 2DH. www.standardlifeaberdeen.com © 2017 Standard Life Aberdeen, images reproduced under licence. All rights reserved.

3Bank of America Merrill Lynch 22nd Annual Financials CEO Conference | September 2017
2006Demutualised and listed on the London Stock Exchange
2015Sold Canadian businesses
Aberdeen AssetManagementfounded1983
Listed on theLondon Stock Exchange1991
Acquired the UKand US institutional businesses of Deutsche Asset Management2005
Acquired partsof Credit SuisseGlobal Investors2009
2010Sold SL BankSold SL Healthcare
Acquired parts ofRBS Asset Management2010
2014Acquired Ignis Asset Management
Acquired Scottish Widows Investment Partnership2014
1825Standard Life founded
1998Standard LifeInvestmentsestablished
2017
Creating a diversified world-class investment company

4Bank of America Merrill Lynch 22nd Annual Financials CEO Conference | September 2017
Creating a diversified world-class investment company
Global Investment Management Pensions and Savings
Fee revenue £1,892m and operating profit £736m1
Global active asset manager with total AUM of £583bn
Truly global distribution platform:• Serving clients in over 80 countries• 50 offices2 across Europe, the Americas,
Asia and Australia
Broad range of investment capabilities: equities, fixed income, multi-asset, quantitative, real estate, private markets and funds-of-funds
Fee revenue £861m and operating profit £362m1
Leading UK pensions and savings business with £144bn in fee based products
Including:• Workplace DC pensions with AUA of
£39.0bn and 1.8 million customers• Retail savings and technology platforms to
financial advisers with AUA of £69.5bn
Securing additional assets and revenues for Aberdeen Standard Investments
Operating profit £36m1
35% stake in HDFC Life a leading Indian life insurance business:• 16% share of private market4 and c20
million customers• Proposed IPO
40% stake in HDFC Asset Management3, India’s second largest mutual funds company5
50% stake in Heng An Standard Life
India and China3
1. Based on revenue and operating profit data for 12 months to 31 December 2016 for Standard Life and for 12 months ended 30 September 2016 for Aberdeen. 2. Unique office locations. 3. The results of HDFC Asset Management are reported within Aberdeen Standard Investments. 4. Source: IRDAI. Measured as share of private market premiums for 3 months to 30 June 2017. 5. Source: AMFI. H1 2017 measured as share of average AUM for 3 months to 30 June 2017.
5Bank of America Merrill Lynch 22nd Annual Financials CEO Conference | September 2017
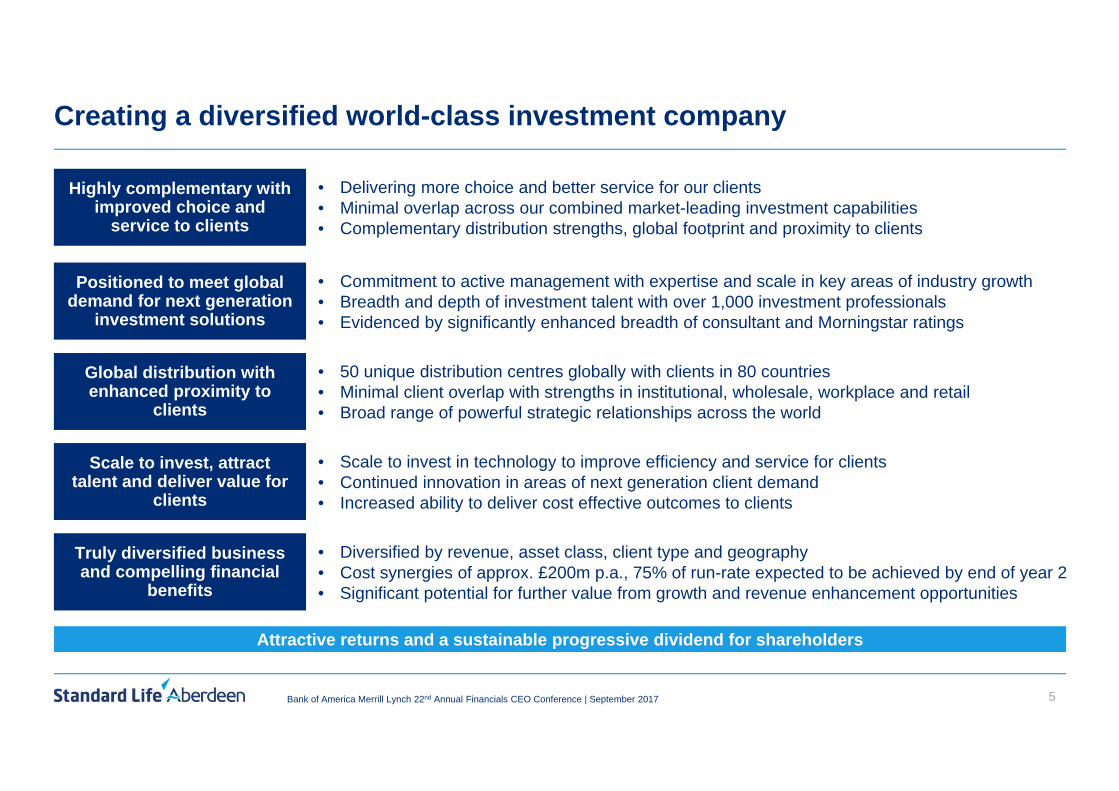
Creating a diversified world-class investment company
Highly complementary with improved choice and
service to clients
Highly complementary with improved choice and
service to clients
• Delivering more choice and better service for our clients• Minimal overlap across our combined market-leading investment capabilities • Complementary distribution strengths, global footprint and proximity to clients
Positioned to meet global demand for next generation
investment solutions
Positioned to meet global demand for next generation
investment solutions
• Commitment to active management with expertise and scale in key areas of industry growth• Breadth and depth of investment talent with over 1,000 investment professionals• Evidenced by significantly enhanced breadth of consultant and Morningstar ratings
Scale to invest, attract talent and deliver value for
clients
Scale to invest, attract talent and deliver value for
clients
• Scale to invest in technology to improve efficiency and service for clients• Continued innovation in areas of next generation client demand• Increased ability to deliver cost effective outcomes to clients
Global distribution with enhanced proximity to
clients
Global distribution with enhanced proximity to
clients
• 50 unique distribution centres globally with clients in 80 countries• Minimal client overlap with strengths in institutional, wholesale, workplace and retail• Broad range of powerful strategic relationships across the world
Truly diversified business and compelling financial
benefits
Truly diversified business and compelling financial
benefits
• Diversified by revenue, asset class, client type and geography• Cost synergies of approx. £200m p.a., 75% of run-rate expected to be achieved by end of year 2• Significant potential for further value from growth and revenue enhancement opportunities
Attractive returns and a sustainable progressive dividend for shareholders

6Bank of America Merrill Lynch 22nd Annual Financials CEO Conference | September 2017
£1.1bnOperating
profit2
AU
M by asset classA
UM
by
geog
raph
yR
even
ueEarnings
£583bnAUM1
Americas11%
APAC5%
ME&A1%
Europe13%
UK70%
£2.8bnRevenue2
Equities25%
Fixed income10%
Multi-asset19%Real Estate
6%
Alternatives4%
Other4%
Spread/risk5%
Pensions and Savings fee
27%
£583bnAUM1
Private Marketsand Hedge Funds
5%DM equities
10%
EM and APACequities
14%
Global equities3%
DM credit14%
DM rates8%EM fixed income
2%
Cash / liquidity7%
Absolute return8%
Other multi-asset (incl. MyFolio)
18%
Standard Life Wealth1%
Quant.4%
Real Estate6%
UK Pensions and Savings
28%
Europe Pensions and Savings
4%
India and China3%
Aberdeen31%
Standard Life Investments
34%
Well diversified business with scale
Positioned for continued profitable growth with enhanced diversification and scale1. Standard Life AUM/AUA data as at 30 June 2017. Aberdeen AUM data as at 31 March 2017. 2. Source: Investor presentation dated 15 May 2017. Standard Life revenue and operating profit data for 12 months to 31 December 2016. For Aberdeen based on 12 months ended 30 September 2016.

A broad and compelling client offering

8Bank of America Merrill Lynch 22nd Annual Financials CEO Conference | September 2017
Transformed breadth and depth of investment capabilities
With real strength, depth and scale across all asset classes to attract talent and meet client needs
Example areas of scale and/or franchise strength:
• Emerging Markets• Asia Pacific• Global• Smaller Companies: US and EM
• Developed Markets • Global• New Active Specialities• Smaller Companies: UK, European and Global
Equities£159bn
27% of AUM
• Quantitative Investment• Balanced/Implemented Solutions• Diversified Growth and Income
• Absolute Return • Balanced/Implemented Solutions• Liability Aware• MyFolio
Solutions£180bn
31% of AUM
Fixed Income£181bn
31% of AUM
• Emerging Market Debt• APAC Fixed Income• Long-dated US Credit
• Developed Market Credit• Global Unconstrained• Inflation-linked
Real Estate£35bn
6% of AUM
• UK Core/ Core Plus• European Value Add
• UK Core/ Core Plus• European (incl. Residential)
• Private Equity• Infrastructure Equity• Hedge Fund Solutions
• Private Equity (incl. Venture)• Private Debt• Infrastructure• Hedge Fund Solutions
Private Markets andHedge Funds
£28bn5% of AUM

9Bank of America Merrill Lynch 22nd Annual Financials CEO Conference | September 2017
52
145
5136
1
2746
13 717
6
865
15
33
9
9
15
90
24
1822
0
20
40
60
80
100
120
DM equities EM andAPAC
equities
Globalequities
DM credit DM rates EM fixedincome
Cash/liquidity AbsoluteReturn
Other multi-asset (incl.MyFolio)
Standard LifeWealth
Quantitative Real Estate PrivateMarkets andHedge Funds
Com
bine
d A
UM
(£bn
)
AberdeenStandard Life
1. Standard Life AUM/AUA data as at 30 June 2017. Aberdeen AUM data as at 31 March 2017.
60
79
20
84
45
10
42 46
103
7
2435
28
Highly complementary investment capabilities with aligned investmentphilosophies and processes
Overview of combined capabilities: Combined AUM of £583bn1 (AUA of £670bn)
Equities£159bn
Fixed Income£181bn
Solutions£180bn
Real Estate and Private Markets
£63bn
World-class breadth and depth of investment capabilities to meet evolving client needs

10Bank of America Merrill Lynch 22nd Annual Financials CEO Conference | September 2017
Minimal overlap across rated investment capabilities helps to ensure smooth integration and continuity of investment processes
£67bn in Morningstar 4/5 Star Rated Funds1,3Consultant Recommendations1,2
1. As at 15 May 2017. 2. Includes strategies with Buy/A/Positive/Recommended/1/Highest Conviction Buy/Soft Buy/B+ ratings from Global, US and UK consultants. 3.Overlap defined as Morningstar global categories where both companies have over £250m AUM in 4 or 5 Star rated funds.
Japan EquityAsia Ex-Japan Equity
Emerging Markets Debt
Global Large Cap
Global Fixed Income
Thai EquityANZ Equity
AUS Fixed Income
US Small Cap
Brazil Equity
Convertibles
India Equity
Nat Resources Equity
Singapore Equity
US Municipal Fixed Income
US Large Cap BlendGEM Equity
RE EquitySterling Fixed
IncomeLatAM Equity
Aggressive Allocation
High Yield Cautious Allocation
UK Small Cap Private EquityEuro Fixed
IncomeGreater China
Equity
Inflation Linked Bonds
Euro Large Cap
Euro Small/Mid Cap
US Large Cap
GrowthGlobal
Small/Mid Cap
Moderate Allocation
Other Asia Equity
Euro Govt.
UK Property
Real AssetsPrivate Equity
GlobalEquities
Total ReturnCredit
EuroProperty
Diversified Growth FundsUS Equities
Infrastructure
Frontier Markets
Equity Long/Short
EM DebtHedge Funds
GEM EquitiesSmall Cap
Hong Kong/ChinaEquity
High Yield
PMMUS Small Cap
GEM Equities
Opportunistic FI
PE Fund of Funds
Asian Equity
ILPSUK Credit UK Equity
CoreLong Lease Property Global Credit
UK Equity Unconstrained
UK Aggregate
Global InflationEuro Credit
Secure Inc. and cashflow
UK Equity High Alpha
ARGBS
GFSEuropean Equity Inc.
EDGF/EDMA
Global Equity Unconstrained
GARS
Quant.
With recognition across institutional and mutual funds
Truly complementary investment expertise
Buy & Maintain

We are well positioned to meet the current and future investment needs of our clients

12Bank of America Merrill Lynch 22nd Annual Financials CEO Conference | September 2017
The investments landscape has shifted since the financial crisis
Positioned to benefit from strong growth in next generation “new active” investment solutions1. Source: BCG, July 2016. 2. Includes hedge funds, private equity, real estate, infrastructure, commodity funds and liquid alternative mutual funds.
2015Alternatives2
Active specialitiesSolutionsTraditional active
Passive / ETFs2008
13% / $9tn
39% / $28tn
22% / $16tn
12% / $8tn
$71tn
15% / $11tn
8% / $4tn
21% / $9tn
11% / $5tn$43tn
10% / $4tn
49% / $21tn
“New
act
ive”
2008-15 CAGR
+7%
+9%
+12%
+4%
+16%
• Global investment management market has grown strongly helped
by rising asset prices
• Demand for passive / ETFs has increased
• However, the market for next generation “new active” solutions has
almost doubled 2008-2015
• “New active” stood at $33tn (or 46% of global AUM) at the end of
2015
• Combined business brings together our respective strengths in
“new active” to create a leader in the provision of next generation
solutions
Global AUM, by product1

13Bank of America Merrill Lynch 22nd Annual Financials CEO Conference | September 2017
And “new active” investment solutions set to be the main driver of client demand
Next generation “new active” investment solutions forecast to outstrip demand for passives
2016-2020 Global estimated net flows1
41%
34%
(19%)
6%
19% Alternatives2
Active specialities
Solutions
Passives / ETFs
Traditional active
Glo
bal n
et in
flow
s
“New
act
ive”
1. Source: BCG, July 2016. Percentages shown are as a proportion of global estimated net inflows into growth categories. 2. Includes hedge funds, private equity, real estate, infrastructure, commodity funds and liquid alternative mutual funds.
New active investment solutions set to be the main driver of global client demand
• Traditional active products will continue to see outflows
• Growth in passives set to continue with just over 1/3 of global net inflows into passives / ETFs
• However next generation “new active” investment solutions forecast to represent almost 2/3rds of global net inflows across:
• Alternatives
• Active specialities
• Solutions
c2/3rds
c1/3rd

14Bank of America Merrill Lynch 22nd Annual Financials CEO Conference | September 2017
We are well positioned in these four key areas of growing globalclient demand
Merger enhances breadth and depth of our capabilities to create “new active” solutions for clients 1. Source: BCG. Excludes areas of negative growth. 2. Including assets classified as Other multi-asset.
2016-2020Global estimated
net flows1
• A UK leader in active solutions and absolute return
• Leading manager of outsourced insurance assets
Solutions • Quantitative strategies capability with
£65bn2 AUM
• Smart Beta multi-factor, minimum variance capability, enhanced index
Passives/ETFs
• UK’s third largest player in alternatives with £28bn AUM including private equity and debt, secondaries, infrastructure, hedge funds
• A leading European real estate platform with £35bn in AUM and global ambitions
Real Estate and Private Markets• Fundamental driven investment
approach geared toward expertise in active specialities
• Strengths in unconstrained, benchmark-agnostic and total return within credit and equities
Active Specialities
6% 19%
34%
41%
c2/3rds
“new active”
c1/3rd
passive
Over 1,000 investment professionals providing investment input globally
Scale and breadth across the asset classes facilitating recruitment and retention of leading talent
Leveraging global distribution

16Bank of America Merrill Lynch 22nd Annual Financials CEO Conference | September 2017
Truly global distribution platform with enhanced proximity to clients
Powerful and truly global distribution reach with unique portfolio of strategic relationships
Aberdeen
Jersey Budapest
CopenhagenHelsinki
Oslo
MiamiPhiladelphia
Sao Paolo
Stamford
BangkokKuala Lumpur
Shanghai
JakartaBandung
Kaohsiung
Melbourne
Surabaya
Taipei
Abu Dhabi
Luxembourg
Unique Aberdeen Location
BirminghamLeeds
Dublin
Geneva
Munich
Potsdam
StuttgartLos Angeles
Beijing
Brussels
Unique Standard Life Location
London
Edinburgh
Bristol
MadridMilan
Paris
Frankfurt
Stockholm
Zurich
Boston
New York
Toronto
Hong Kong
Seoul
SingaporeSydney
Tokyo
Amsterdam
Common Location
Mumbai
Key:
Strategic partners: Mitsubishi UFJ, LBG, HDFC AMC, Heng An, Sumitomo Mitsui, Phoenix Group,
John Hancock, Manulife, Bosera, Challenger
Global Clients: Clients in over 80 countries
Global Coverage: 50 unique distribution locations

17Bank of America Merrill Lynch 22nd Annual Financials CEO Conference | September 2017
Clear opportunity to leverage the strength of existing client relationships
To become an asset manager of choice for clients with global investment needs
Opportunity to leverage complementary distribution strengths:• Sovereign wealth funds and private banks
• Local presence across Asia
• US mutual funds and investment trusts
• China WFOE licence
• LBG and Mitsubishi UFJ relationships
• UK Wholesale
• Liability aware offering for insurers
• Global strategic partnerships
• HDFC AMC for global products into India
• Pension and Savings Retail and Workplace
• Global Institutional
• Luxembourg SICAVs
• Platforms: Wrap, Elevate, Parmenion
• Strong brands
TOP 50 CLIENTS
TOP 50 CLIENTS
4overlap
Overlap
1. Source: Investor presentation dated 15 May 2017.

18Bank of America Merrill Lynch 22nd Annual Financials CEO Conference | September 2017
Benefiting from structural asset growth and leading positioning in UK pensions and savings market
Workplace and Retail attracting steady and resilient flowsAdvised platform and DC pension market expected to grow strongly
WorkplaceDC market1
UK advised platform market2
£1tn
Mar
ket A
UA
£0tn2011
£230bn£170bn
2016
£290bn£350bn
2021E
£685bn£725bn
• Financial advisers are using platforms to drive scalability and efficiency with growing need for advice
• Shift from DB to DC and auto enrolment driving growth inDC pensions
• Delivering steadily growing flows and assets
• Standard Life Investments manages c20% of Wrap AUA and over 70% of Workplace AUA
• Providing increased diversification and sources of flow
1. Source: Spence Johnson. 2. Source: Fundscape. 3. Annualised for H1 2017.
Well-positioned to capture asset growth in pensions and savings market
10%
Net inflow
s3as a
percentage of opening AU
A
£125bn
Wor
kpla
ce a
nd R
etai
l AU
A
2013
£63bn
2014
£69bn
2015
£76bn
2016
£100bn
H1 2017
£109bn
£0bn 0%
+9%
+8% +8%
+7%
+8%

19Bank of America Merrill Lynch 22nd Annual Financials CEO Conference | September 2017
£35m
Recognising the value of our Indian associates
Two fast growing businesses leveraging one of India’s most valuable brands6
HDFC Life – a leading private Indian life insurer HDFC AMC – a profitable and fast growing business
1. Source: IRDAI. Measured as share of private market premiums. For years ended 31 March following the end of each Standard Life financial year. H1 2017 market share for 3 months to 30 June 2017. 2. Source: IRDAI, year to 31 March 2017. 3. Source: AMFI. 2013-16 measured as share of average AUM for final quarter of Standard Life financial year. 4. Source: AMFI. H1 2017 measured as share of average AUM for 3 months to 30 June 2017. 5. In constant currency. 6. Source: WPP, Kantar Millward Brown, 2017.
• Ranked 2nd for new business sales in the private life insurance market2
• Proposed IPO of HDFC Life with offer for sale of up to 15% of the paid up equity share capital including up to 5.43ppt of our 35% stake
• Second largest mutual funds company4 in India with over 6 million accounts
• AUM of £29.5bn with CAGR of 21% over last 5 years5
• Opportunity for distribution of global products in India as the domestic mutual funds industry develops
35% stake
40% stake
Shar
e of
ope
ratin
g pr
ofit
befo
re ta
x (£
m)
£50m
£0m
20%
0%
Market share
3,4
2013
£22m
12.4%
2014
£21m
13.6%
2015
£31m
13.3%
2016
13.1%
Shar
e of
ope
ratin
g pr
ofit
befo
re ta
x (£
m)
£50m
£0m
20%
0%
Share of private life insurance m
arket 1
2013
£12m
13.7%
2014
£16m
15.8%
2015
£21m
15.8%
2016
£34m
17.2%
H1 2017
£27m
16.4%
H1 2017
£20m
12.9%

Compelling financial benefits

21Bank of America Merrill Lynch 22nd Annual Financials CEO Conference | September 2017
Delivering integration whilst maintaining performance and client service
Cost synergies driving material earnings accretion to both sets of shareholders
Integration principles
• Safeguard clients’ interest and minimise disruption during integration process• Focus on retaining key talent • Operate as a global unified investment management business with regional hubs• Take on the best of both organisations in terms of practices and capabilities
Implementation and delivery
• Highly experienced and dedicated integration team• Led by Colin Walklin (COO) and Andrew Laing• Track record of delivery
Financial impacts
• Approximately £200m annualised cost synergies on a pre-tax basis• Cost synergies from: consolidating platforms, reducing third party suppliers, removing overlap in
central functions, premises, investment management and distribution • Minimising impact on investment professionals• One-off integration cash costs of approximately £320m in aggregate
Timing • Full benefit of synergies to be achieved within three years of completion• 75% of run-rate cost synergies expected to be achieved at the end of year two

22Bank of America Merrill Lynch 22nd Annual Financials CEO Conference | September 2017
Strong balance sheet and cash generation supporting progressive per share dividend policy1
Strong cash generation supporting ongoing investment and shareholder returns
£1,000m
£0m
Standard Life
Aberdeen
2016Cash
generation2
£363m£865m
£502m£251m£640m
2016Dividend3
£389m
• More diversified sources of cash generation
• 2016 combined group cash generation of £865m2
• Further benefits from revenue and cost synergies
• Interim dividend of 7.00p will be the first dividend paid to shareholders of the combined group
• Supporting ability to invest in global growth opportunities
• Reduced pro-forma leverage
• Stable Solvency II position
1. The Combined Group intends to adopt Standard Life’s progressive dividend policy with the base dividend being the Standard Life full year dividend of 19.82 pence for the financial year ended 31 December 2016. 2. Based on Standard Life underlying cash generation of £502m for year to 31 December 2016 and Aberdeen core operating cash flow of £363m for year to September 2016. 3. Standard Life based on 2016 interim and final dividends for the year ending 31 December 2016. For Aberdeen, based on interim and final dividends on ordinary shares paid for the year ending 30 September 2016. 4. Implied final dividend based on 5.40p dividend for period from demutualisation to 31 December 2006.
3.60 3.80 4.07 4.15 4.35 4.60 4.90 5.22 5.60 6.02 6.47 7.00
7.20 7.70 7.70 8.09 8.65 9.20 9.8010.58
11.4312.34
13.35
2006 2007 2008 2009 2010 2011 2012 2013 2014 2015 2016 2017
Stan
dard
Life
div
iden
d pe
r sha
re (p
)
10.80 11.50 11.77 12.24 13.00 13.80 14.7015.80
17.0318.36
19.82
Final DividendInterim Dividend
4
+8.2%

23Bank of America Merrill Lynch 22nd Annual Financials CEO Conference | September 2017
Creating a diversified world-class investment company
Standard Life Aberdeen – Looking to the future with confidence
Delivering for clients, our people and shareholders
Highly complementary with improved choice and service to clients
Positioned to meet global demand for next generation investment solutions
Global distribution with enhanced proximity to clients
Scale to invest, attract talent and deliver value for clients
Truly diversified business and compelling financial benefits
Attractive returns and a sustainable progressive dividend for shareholders

Questions and answers