standard practice internal corrosion direct assessment ... sp0208-2008 (lp-icda).pdf · standard...
TRANSCRIPT

Standard Practice
Internal Corrosion Direct Assessment Methodology for Liquid Petroleum Pipelines
This NACE International standard represents a consensus of those individual members who have reviewed this document, its scope, and provisions. Its acceptance does not in any respect preclude anyone, whether he or she has adopted the standard or not, from manufacturing, marketing, purchasing, or using products, processes, or procedures not in conformance with this standard. Nothing contained in this NACE International standard is to be construed as granting any right, by implication or otherwise, to manufacture, sell, or use in connection with any method, apparatus, or product covered by Letters Patent, or as indemnifying or protecting anyone against liability for infringement of Letters Patent. This standard represents minimum requirements and should in no way be interpreted as a restriction on the use of better procedures or materials. Neither is this standard intended to apply in all cases relating to the subject. Unpredictable circumstances may negate the usefulness of this standard in specific instances. NACE International assumes no responsibility for the interpretation or use of this standard by other parties and accepts responsibility for only those official NACE International interpretations issued by NACE International in accordance with its governing procedures and policies which preclude the issuance of interpretations by individual volunteers. Users of this NACE International standard are responsible for reviewing appropriate health, safety, environmental, and regulatory documents and for determining their applicability in relation to this standard prior to its use. This NACE International standard may not necessarily address all potential health and safety problems or environmental hazards associated with the use of materials, equipment, and/or operations detailed or referred to within this standard. Users of this NACE International standard are also responsible for establishing appropriate health, safety, and environmental protection practices, in consultation with appropriate regulatory authorities if necessary, to achieve compliance with any existing applicable regulatory requirements prior to the use of this standard. CAUTIONARY NOTICE: NACE International standards are subject to periodic review, and may be revised or withdrawn at any time in accordance with NACE technical committee procedures. NACE International requires that action be taken to reaffirm, revise, or withdraw this standard no later than five years from the date of initial publication and subsequently from the date of each reaffirmation or revision. The user is cautioned to obtain the latest edition. Purchasers of NACE International standards may receive current information on all standards and other NACE International publications by contacting the NACE International First Service Department, 1440 South Creek Dr., Houston, Texas 77084-4906 (telephone +1 281-228-6200).
Approved 2008-11-07 NACE International
1440 South Creek Dr. Houston, Texas 77084-4906
+1 281-228-6200 ISBN 1-57590-221-4
© 2008, NACE International
NACE SP0208-2008 Item No. 21127

SP0208-2008
NACE
____________________________________________________________________
Foreword This standard practice formalizes a methodology termed liquid petroleum internal corrosion direct assessment (LP-ICDA) that can be used to help ensure pipeline integrity. The methodology is applicable to pipelines that are normally fully packed with petroleum compound(s) existing in an incompressible liquid state under normal pipeline operating conditions, with basic (or bottom) sediment and water (BS&W) contamination normally lower than 5% by volume. This standard is intended for use by pipeline operators and others who manage pipeline integrity. The basis of LP-ICDA is identification and detailed examination of locations along a pipeline in which water or solids can accumulate for extended periods, allowing informed conclusions to be made about the integrity of the nonexamined pipeline. If the locations determined to have the highest susceptibility for long-term internally corrosive conditions are examined and found to be free of significant corrosion, other less susceptible locations may be considered to be free of corrosion. This standard is not applicable to pipelines in which corrosion or leaks have occurred at unpredictable locations, and it may not present an economical alternative to in-line inspection for pipelines found to have moderate or higher rates of internal corrosion. LP-ICDA methodology for liquid petroleum systems is described in terms of a four-step process: (1) pre-assessment, (2) indirect inspection, (3) detailed examination, and (4) post assessment. The LP-ICDA method provides the greatest benefit for pipelines that cannot be in-line inspected; however, the method is not limited to unpiggable pipelines. This standard was prepared by Task Group (TG) 315 on Pipelines (Liquid Petroleum): Internal Corrosion—Direct Assessment. TG 315 is administered by Specific Technology Group (STG) 35 on Pipelines, Tanks, and Well Casings. This standard is issued by NACE International under the auspices of STG 35.
In NACE standards, the terms shall, must, should, and may are used in accordance with the definitions of these terms in the NACE Publications Style Manual. The terms shall and must are used to state a requirement, and are considered mandatory. The term should is used to state something good and is recommended, but is not considered mandatory. The term may is used to state something considered optional.
_____________________________________________________________________
International i

SP0208-2008
ii
______________________________________________________________________________
NACE International Standard Practice
Internal Corrosion Direct Assessment Methodology
for Liquid Petroleum Pipelines
Contents
1. General ........................................................................................................................... 1 2. Definitions ....................................................................................................................... 8 3. Pre-Assessment ............................................................................................................. 9 4. Indirect Inspection ......................................................................................................... 11 5. Detailed Examinations .................................................................................................. 16 6. Post Assessment .......................................................................................................... 18 7. LP-ICDA Records ......................................................................................................... 18 References ........................................................................................................................ 19 Appendix A: Determination of Water Accumulation (Nonmandatory) .............................. 22 Appendix B: Determination of Wettability (Nonmandatory) .............................................. 28 Appendix C: Determination of Solids Accumulation (Nonmandatory) .............................. 28 Appendix D: Corrosion Rate Models (Nonmandatory) ..................................................... 31 FIGURES Figure 1: Pre-Assessment Step .......................................................................................... 3 Figure 2: Indirect Inspection Step ....................................................................................... 4 Figure 3: Detailed Examination—Site Selection ................................................................. 5 Figure 4: Detailed Examination Step .................................................................................. 6 Figure 5: Post-Assessment Step ........................................................................................ 7 Figure A1: Schematic representation of the stratified oil-water flow ................................ 25 Figure C1: Schematic presentation of three-layer model and forces acting on a
representative particle at the interface between the two bed layers ........................... 29 TABLES Table 1: Typical Data for Use of LP-ICDA Methodology .................................................. 10
________________________________________________________________________
NACE International

SP0208-2008
NACE International
____________________________________________________________________________
Section 1: General
1.1 Introduction
1.1.1 This standard is intended to serve as a guide for applying the NACE LP-ICDA process to liquid petroleum pipeline systems. 1.1.2 The primary purposes of the LP-ICDA method are (1) to enhance the assessment of internal corrosion in liquid petroleum pipelines, and (2) to improve pipeline integrity. 1.1.3 The LP-ICDA methodology assesses the likelihood of internal corrosion and includes existing methods of examination available to a pipeline operator to determine whether internal corrosion is actually present or may occur. This methodology may be incorporated into corrosion integrity and risk management plans. 1.1.4 LP-ICDA uses flow modeling results and provides a framework to utilize those methods. 1.1.5 LP-ICDA was developed for pipelines that are normally fully packed with petroleum compound(s) that exists in an incompressible liquid state under normal pipeline operating conditions, with BS&W contaminations that are normally less than 5% by volume. 1.1.6 One benefit of the LP-ICDA approach is that an assessment can be performed on a pipe segment for which alternative methods (e.g., in-line inspection [ILI], hydrostatic testing, etc.) may not be practical. 1.1.7 LP-ICDA has limitations, and not all pipelines can be successfully assessed with LP-ICDA. These limitations are identified in the pre-assessment step. 1.1.8 The provisions of this standard shall be applied by or under the direction of competent persons who, by reason of knowledge of the physical sciences and the principles of engineering and mathematics, acquired by education or related practical experience, are qualified to engage in the practice of corrosion control and risk assessment on pipeline systems. Such persons may be (1) registered professional engineers, (2) re-cognized as corrosion specialists by organizations such
as NACE, or (3) professionals (i.e., engineers or technicians) with professional experience, including detection/mitigation of internal corrosion and evaluation of internal corrosion on pipelines. 1.1.9 For accurate and correct application of this standard, it shall be used in its entirety. Using or referring to only specific paragraphs or sections can lead to misinterpretation or misapplication of the recommendations and practices contained herein. 1.1.10 This standard does not designate practices for every specific situation because of the complexity of internal conditions that may be present in various pipeline systems. 1.1.11 In the process of applying LP-ICDA, other pipeline integrity threats, such as external corrosion, mechanical damage, stress corrosion cracking (SCC), etc., may be detected. When such threats are detected, additional assessments, inspections, or both must be performed. The pipeline operator should utilize appropriate methods to address risks other than internal corrosion, such as those described in NACE standards (e.g., SP0204),1 ANSI(1)/ASME(2) B31.4,2
ANSI/ASME B31.8,3 API(3) 1160,4 ANSI/API 579,5 and BSI(4) 7910,6 international standards (e.g., DnV(5) RP-F101),7 and other documents. 1.1.12 This standard does not address specific remedial actions that may be taken when corrosion is found; however, the reader is referred to ASME B31.42 and other relevant documents (e.g., API 2200)8 for guidance.
1.2 Four-Step Process
1.2.1 LP-ICDA requires the integration of data from multiple field examinations and pipe surface evaluations, including the pipeline’s physical characteristics and operating history. 1.2.2 LP-ICDA includes the following four steps, as shown in Figures 1 through 5.
__________________________________________
(1)American National Standards Institute (ANSI), 11 W. 42nd St., New York, NY 10036. (2)ASME International (ASME), Three Park Ave., New York, NY 10016-5990. (3)American Petroleum Institute (API), 1220 L St. NW, Washington, DC 2000-4070. (4) British Standards Institute (BSI), 389 Chiswick High Rd., London, United Kingdom W4 4AL. (5) Det Norske Veritas (DnV), Veritasveien 1, 1322, Høvik, Oslo, Norway.
1
SP
2
0208-2008
1.2.2.1 Pre-Assessment. The pre-assessment step collects essential historic and present operating data about the pipeline, determines whether LP-ICDA is feasible, and then defines LP-ICDA regions. The types of data to be collected are typically available in design and construction records, operating and maintenance histories, alignment sheets, corrosion survey records, liquid analysis reports, and inspection reports from prior integrity evaluations or maintenance actions.
1.2.2.2 Indirect Inspection. The indirect inspection step covers flow predictions, developing a pipeline elevation profile, and identifying sites along a pipeline segment most likely to have corrosion damage caused by water, solids accumulation, or
both, and other factors affecting corrosion distribution within a LP-ICDA region. 1.2.2.3 Detailed Examination. The detailed examination step includes performing excavations and conducting detailed examinations of the pipe to determine whether metal loss from internal corrosion has occurred. 1.2.2.4 Post Assessment. The post-assessment step is an analysis of the data collected from the three previous steps to assess the effectiveness of the LP-ICDA process, to develop conclusions about the integrity of nonexamined pipe, and to determine reassessment intervals.
NACE International
SP0208-2008
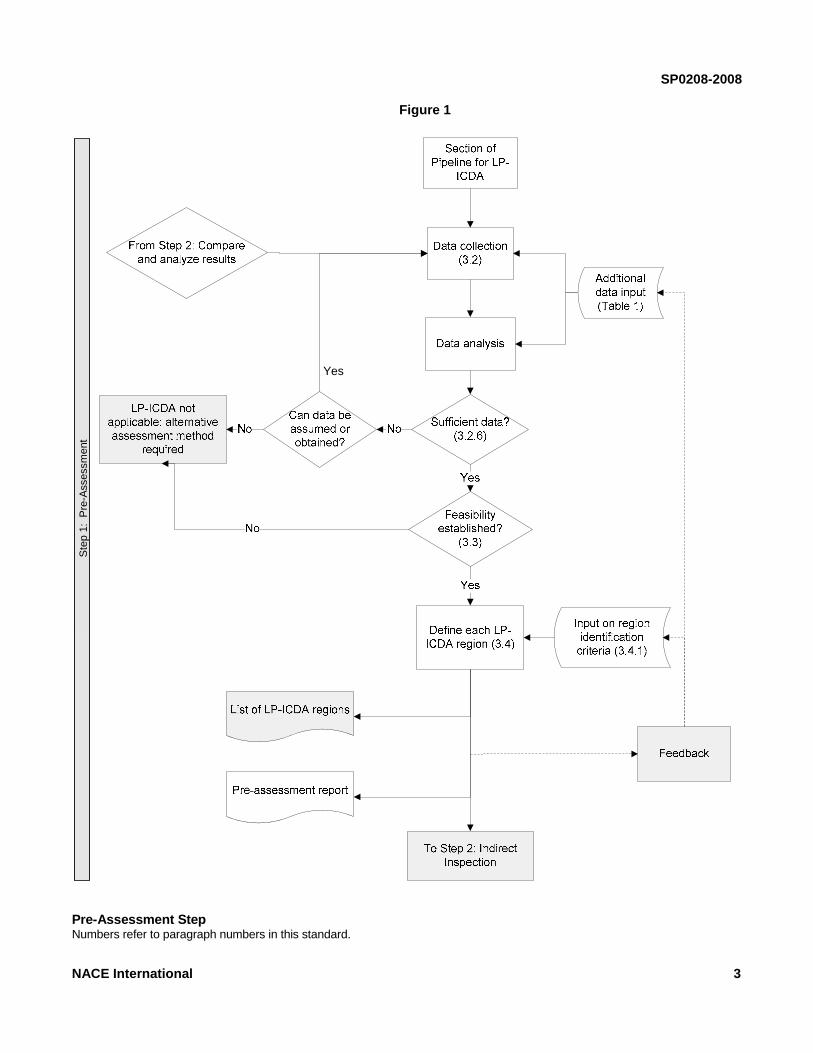
Figure 1
Pre-Assessment Step Numbers refer to paragraph numbers in this standard.
Ste
p 1:
Pre
-Ass
essm
ent
Yes
NACE International 3

SP0208-2008
Figure 2
Indirect Inspection Step Numbers refer to paragraph numbers in this standard.
From Step 1: Pre-Assessment
For each LP-ICDA region
4 NACE International

SP0208-2008
Figure 3
Detailed Examination—Site Selection Numbers refer to paragraph numbers in this standard.
—
NACE International 5

SP0208-2008
Figure 4
Detailed Examination Step Numbers refer for paragraph numbers in this standard.
Select dig sites (go to Step 3a: Figure 3)
6 NACE International

SP0208-2008
Figure 5
Post-Assessment Step Numbers refer to paragraph numbers in this standard.
-
NACE International 7

SP0208-2008
8
______________________________________________________________________
Section 2: Definitions
Anomalies: See Indication. Cleaning Pig: A device inserted in a pipeline for the purpose of dislodging and removing accumulated corrodents such as solids or water. Corrosion: The deterioration of a material, usually a metal, that results from a reaction with its environment. Creaming: The separation of the phases of an emulsion due to deformation of the dispersed droplets and migration to pipe walls in vertical and near-vertical flows. Critical Droplet Size (dcrit): The largest size of water droplet that can be maintained as a water-in-oil dispersion in horizontal or near-horizontal flow without settling due to gravitational forces causing stratified oil/water flow. Critical Inclination Angle: An angle determined by LP-ICDA flow modeling; the lowest angle at which water accumulation or solids accumulation is expected to occur. Critical Velocity (Vcrit): The velocity of a water-in-oil dispersion in which the maximum water droplet size (dmax) is smaller than the dcrit. Flow velocity greater than Vcrit significantly reduces the possibility of water accumulation by preventing the separation of oil and water into distinct phases. Dry Gas Internal Corrosion Direct Assessment (DG-ICDA): A four-step direct assessment (DA) process to evaluate the impact of corrosion occurring on the inside wall of a pipe normally carrying dry natural gas, but may suffer from infrequent upsets of water. Direct Assessment (DA): A structured process that combines pre-assessment, indirect inspections, direct examination, and post assessment to evaluate the impact of predictable pipeline integrity threats such as corrosion. Detailed Examination: The examination of the pipe wall at a specific location to determine whether metal loss from internal corrosion has occurred. This may be performed using any industry-accepted technology, such as visual, ultrasonic, radiographic means, etc. Electrolyte: A chemical substance containing ions that migrate in an electric field. External Corrosion Direct Assessment (ECDA): A four-step DA process to evaluate the impact of corrosion occurring on the outside wall of a pipe on the integrity of a pipeline. Hydrostatic Testing: The testing of sections of a pipeline performed by filling the pipeline with water and pressurizingit until the nominal hoop stresses in the pipeline reach a specified value. Inclination Angle: An angle resulting from a change in elevation between two points on a pipeline, in degrees. Indication: Any measured deviation from the norm. Indirect Inspection: The use of tools, methods, or procedures to evaluate a pipeline indirectly. For LP-ICDA, this consists of calculating and comparing flow modeling results and probability of corrosion distribution with an inclination profile. In-Line Inspection (ILI): The inspection of a pipeline from the interior of the pipe using an ILI tool. The tools used to conduct ILI are known as pigs, smart pigs, or intelligent pigs. In Situ Water Velocity: The average velocity of the bottom layer of water in stratified oil-water flow. Liquid: A substance that tends to maintain a fixed volume, but not a fixed shape. Liquid Petroleum: Petroleum compound(s) that exists as an incompressible fluid at every point in the pipeline system of interest. Liquid Petroleum Internal Corrosion Direct Assessment (LP-ICDA): The internal corrosion direct assessment process as defined in this standard applicable to liquid petroleum systems. Low Point: A location having higher elevations immediately adjacent upstream and downstream. LP-ICDA Region: A continuous length of pipe (including weld joints) exhibiting a uniform set of operating parameters including the following as a minimum: (1) fluid characteristics (e.g., liquid petroleum, including contaminants), (2) flow characteristics (e.g., diameter and flow rate), and (3) mitigative activities (e.g., pigging and chemical treatment). Maximum Droplet Size (dmax): The largest size of water droplet that can be sustained by a flow in a water-in-oil dispersion without further breakup due to turbulent forces. Microbiologically Influenced Corrosion (MIC): Corrosion processes that have been made more aggressive through environmental changes brought about by microbiological activity on or near the metal surface. Overbend: Any vertical change in pipe direction that results in a negative change in slope.
NACE International

Pigging: See In-Line Inspection or Cleaning Pig. Region: See LP-ICDA Region. Segment: A portion of a pipeline that is assessed using LP-ICDA. A segment may consist of one or more ICDA regions.
NACE International
_____________________________________
SP0208-2008
Stratified Flow: A multiphase flow regime in which fluids are separated into layers, with lighter fluids flowing above heavier (i.e., higher-density) fluids. Superficial Liquid Velocity: The volumetric flow rate of liquid (at system temperature and pressure) divided by the cross-sectional area of the pipe.
___________________________________
Section 3: Pre-Assessment
3.1 Introduction3.1.1 The objective of the pre-assessment step is to determine whether LP-ICDA is an appropriate integrity assessment method for the selected pipeline segment. It must be perfomed in a comprehensive and thorough manner. This step includes evaluating the potential internal corrosion mechanisms that may have been present in the pipeline during its history. 3.1.2 The pre-assessment step includes the following activities:
3.1.2.1 Data collection; 3.1.2.2 Assessment of LP-ICDA feasibility; and 3.1.2.3 Identification of LP-ICDA regions.
3.2 Data Collection
3.2.1 The pipeline operator shall collect both historical (i.e., throughout the life of the pipeline) and current data, along with physical information for each segment to be evaluated.
3.2.1.1 The pipeline operator shall define minimum data requirements based on the history and condition of the pipeline segment. In addition, the pipeline operator shall identify data elements that are critical to the success of the LP-ICDA process (see Table 1 for typical information to be considered). 3.2.1.2 All parameters that impact the LP-ICDA region definition (see Paragraph 3.4) shall be considered for initial LP-ICDA process applications on a pipeline segment. 3.2.1.3 Accurate and complete elevation profile and flow rate data are essential for predicting the locations of water and solids accumulation. Accurate information regarding pipeline operating
and maintenance activities related to internal corrosion is essential in determining the probability of significant internal corrosion damage.
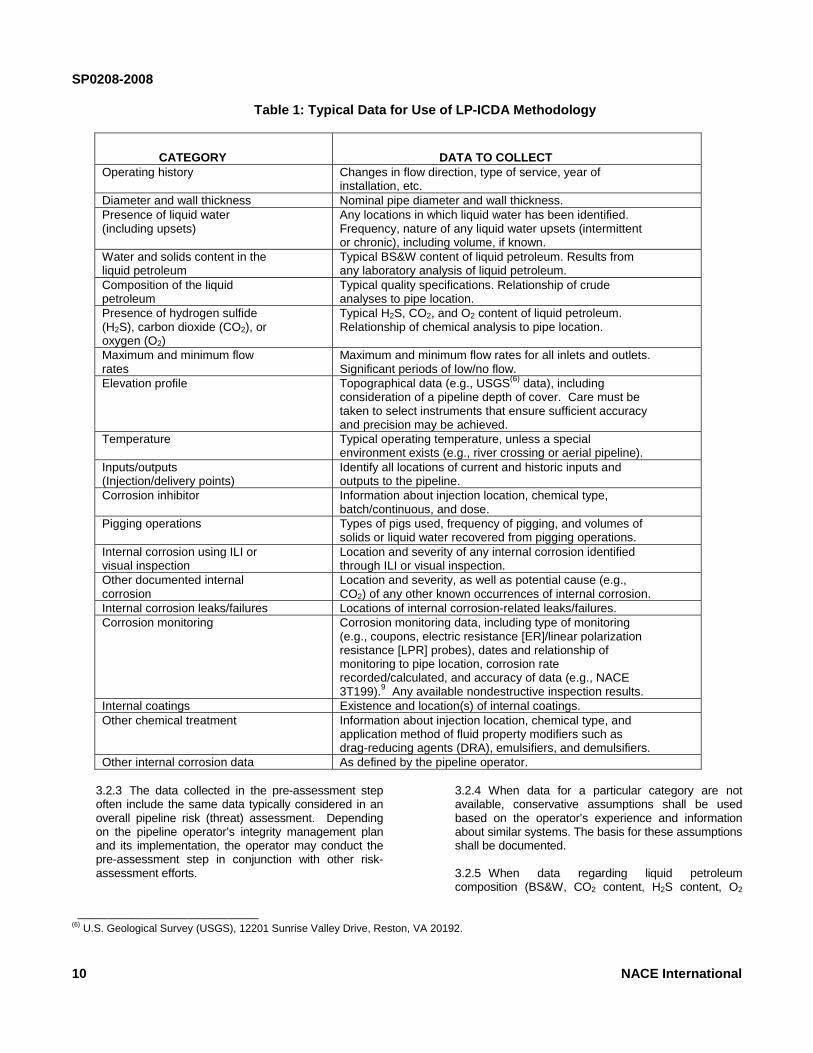
3.2.2 At a minimum, the pipeline operator shall collect essential data from the following categories, as shown in Table 1. In addition, a pipeline operator may determine that items not included in Table 1 are necessary.
3.2.2.1 Operating history; 3.2.2.2 System design information (grade, wall thickness of pipe, maximum operating pressure [MOP], etc.); 3.2.2.3 Presence of liquid water (including upsets); 3.2.2.4 Water and solids content in the liquid petroleum; 3.2.2.5 Composition of liquid petroleum; 3.2.2.6 Presence of hydrogen sulfide (H2S), carbon dioxide (CO2), and oxygen (O2); 3.2.2.7 Maximum and minimum flow rates; 3.2.2.8 Pipeline elevation profiles; 3.2.2.9 Internal corrosion leak or failure history; 3.2.2.10 Internal corrosion using in-line inspection (ILI) or visual inspection; 3.2.2.11 Mitigation currently being applied to control internal corrosion; and 3.2.2.12 Other known and documented causes of internal corrosion such as microbiologically influenced corrosion (MIC).
9
SP0208-2008
Table 1: Typical Data for Use of LP-ICDA Methodology
CATEGORY DATA TO COLLECT Operating history Changes in flow direction, type of service, year of
installation, etc. Diameter and wall thickness Nominal pipe diameter and wall thickness. Presence of liquid water (including upsets)
Any locations in which liquid water has been identified. Frequency, nature of any liquid water upsets (intermittent or chronic), including volume, if known.
Water and solids content in the liquid petroleum
Typical BS&W content of liquid petroleum. Results from any laboratory analysis of liquid petroleum.
Composition of the liquid petroleum
Typical quality specifications. Relationship of crude analyses to pipe location.
Presence of hydrogen sulfide (H2S), carbon dioxide (CO2), or oxygen (O2)
Typical H2S, CO2, and O2 content of liquid petroleum. Relationship of chemical analysis to pipe location.
Maximum and minimum flow rates
Maximum and minimum flow rates for all inlets and outlets. Significant periods of low/no flow.
Elevation profile Topographical data (e.g., USGS(6) data), including consideration of a pipeline depth of cover. Care must be taken to select instruments that ensure sufficient accuracy and precision may be achieved.
Temperature Typical operating temperature, unless a special environment exists (e.g., river crossing or aerial pipeline).
Inputs/outputs (Injection/delivery points)
Identify all locations of current and historic inputs and outputs to the pipeline.
Corrosion inhibitor Information about injection location, chemical type, batch/continuous, and dose.
Pigging operations Types of pigs used, frequency of pigging, and volumes of solids or liquid water recovered from pigging operations.
Internal corrosion using ILI or visual inspection
Location and severity of any internal corrosion identified through ILI or visual inspection.
Other documented internal corrosion
Location and severity, as well as potential cause (e.g., CO2) of any other known occurrences of internal corrosion.
Internal corrosion leaks/failures Locations of internal corrosion-related leaks/failures. Corrosion monitoring
Corrosion monitoring data, including type of monitoring (e.g., coupons, electric resistance [ER]/linear polarization resistance [LPR] probes), dates and relationship of monitoring to pipe location, corrosion rate recorded/calculated, and accuracy of data (e.g., NACE 3T199).9 Any available nondestructive inspection results.
Internal coatings Existence and location(s) of internal coatings. Other chemical treatment Information about injection location, chemical type, and
application method of fluid property modifiers such as drag-reducing agents (DRA), emulsifiers, and demulsifiers.
Other internal corrosion data As defined by the pipeline operator.
10
3.2.3 The data collected in the pre-assessment step often include the same data typically considered in an overall pipeline risk (threat) assessment. Depending on the pipeline operator’s integrity management plan and its implementation, the operator may conduct the pre-assessment step in conjunction with other risk-assessment efforts.
3.2.4 When data for a particular category are not available, conservative assumptions shall be used based on the operator’s experience and information about similar systems. The basis for these assumptions shall be documented. 3.2.5 When data regarding liquid petroleum composition (BS&W, CO2 content, H2S content, O2
___________________________ (6) U.S. Geological Survey (USGS), 12201 Sunrise Valley Drive, Reston, VA 20192.
NACE International

SP0208-2008
content, etc.) are unknown, a sample shall be collected and analyzed to gain an understanding of current operations. Note: Samples collected do not provide any information regarding historical operating conditions, but rather are a snapshot of the location and the time that the sample was collected. The operator’s experience and information about similar systems may predicate more conservative assumptions regarding historical liquid petroleum composition, as required (see Paragraph 3.2.4). 3.2.6 In the event the pipeline operator determines that sufficient data are not available or cannot be collected for some LP-ICDA regions comprising a segment to support the pre-assessment step, LP-ICDA shall not be used for those regions until the appropriate data can be obtained.
3.3 LP-ICDA Feasibility Assessment The pipeline operator shall examine the data collected in Paragraph 3.2 to determine whether conditions exist that would preclude this LP-ICDA application or for which indirect inspection tools, methods, or procedures cannot be used. The following conditions preclude the application of this LP-ICDA standard:
3.3.1 Indirect inspection cannot determine locations in which internal corrosion is most probable; 3.3.2 The pipeline is expected to have a continuous water phase during normal operation; 3.3.3 The pipeline has a continuous internal coating for the entire length of the line;
NACE International
______________________________________
3.3.4 The pipeline cannot be made accessible for detailed examinations; and 3.3.5 A reliable (or conservative) reassessment interval cannot be determined.
3.4 Identification of LP-ICDA Regions The pipeline operator shall define LP-ICDA regions from the data collected in the pre-assessment step.
3.4.1 A LP-ICDA region is a portion of pipeline that has at least one distinguishing characteristic to describe it. A distinguishing characteristic is any parameter relating to liquid petroleum constituents, flow patterns, operating conditions, or mitigative actions that may affect the location of corrosion initiation, corrosion mechanism, or anticipated corrosion rate. At a minimum, new LP-ICDA regions should be determined by:
3.4.1.1 Historical and present injection points; 3.4.1.2 Historical and present delivery points; 3.4.1.3 Historical and present chemical injection points; and 3.4.1.4 Historical and present pigging operations (send/receive points).
3.4.2 Region designations shall also consider changes in flow direction. In the case of bidirectional flow history, LP-ICDA regions shall be identified for each flow direction, and each flow direction shall be treated separately.
__________________________________
Section 4: Indirect Inspection
4.1 Introduction4.1.1 The objective of the LP-ICDA indirect inspection step is to evaluate the likelihood of internal corrosion as a function of distance within each LP-ICDA region using flow modeling analysis and detailed pipe elevation profiles. 4.1.2 The indirect inspection step requires the comparison of critical velocities and inclination angles for water and solids accumulation with pipeline inclination profiles. Locations that are predicted to have the highest susceptibility to corrodent accumulation for the longest duration of time are assessed the highest likelihood of experiencing significant internal corrosion. The indirect inspection step utilizes this analysis to select sites for detailed examination. Note: Inclination angle is not the only factor that causes water and solids
accumulation; therefore, accumulation may be identified as occurring in a horizontal pipe segment. 4.1.3 The LP-ICDA indirect inspection step shall include each of the following activities, for each LP-ICDA region:
4.1.3.1 Performing multiphase flow calculations using collected data to determine the critical velocities and inclination angles for water and solids accumulation; 4.1.3.2 Identifying other factors for the pipeline system that might influence internal corrosion or corrosion location—such as non-stready flow, temperature profile, or historical pigging operations;
11

SP0208-2008
4.1.3.3 Producing a pipeline inclination profile; 4.1.3.4 Identifying sites in which water accumulation, solids accumulation, or both may occur, integrating the flow calculation results with the pipeline inclination profile; and 4.1.3.5 Assessing the probability of internal corrosion at sites in which internal corrosion is most likely to have occurred using corrosion models or sound engineering judgment.
4.2 Water Accumulation
4.2.1 The internal corrosion threat in liquid petroleum systems is based on the assumption that corrosion only occurs when water drops out of the hydrocarbon phase and wets the steel surface of the pipe. Therefore, the operator shall predict critical parameters for water dropout and accumulation using flow modeling calculations for each identified LP-ICDA region. 4.2.2 One model for identifying the minimal velocity for water entrainment and the critical inclination angle for water accumulation is shown in Appendix A (Nonmandatory). For the purpose of providing an example, Paragraphs 4.2.3 and 4.2.5 through 4.2.8 describe the parameters and methodology used in this model. Several other valid models are also identified in Appendix A. Any valid multiphase flow-modeling approach that considers stratified flow, semistratified flow, and water-in-oil dispersion flow is acceptable. The operator shall consider the system operating conditions (i.e., liquid petroleum composition, pressure, temperature, flow rate, etc.) and select a model that is applicable to those conditions. The rationale for selecting the model shall be documented. 4.2.3 A parameter known as Vcrit is used to determine the oil-water flow pattern. If the input velocity is smaller than Vcrit, the flow pattern is stratified for a given flow condition. If the input velocity is equal to or greater than Vcrit, the flow pattern is water-in-oil dispersion for horizontal and downward inclined pipelines. 4.2.4 Accumulation of water does not necessarily lead to corrosion. Under this condition, wettability of the hydrocarbon on the steel determines corrosiveness. Based on the wettability, hydrocarbons can be classified into three categories:
4.2.4.1 Oil-wet surface: On an oil-wet surface, the oil has a strong affinity to be in contact with carbon steel. Oil-wet surfaces physically isolate the pipe from the corrosive environment and, under such conditions, corrosion does not occur. 4.2.4.2 Water-wet surface: On a water-wet surface, the oil does not have an affinity to be in contact with carbon steel; in fact, the oil may not be in contact with the carbon steel at all, even
12
when it is the only phase. A water-wet surface (in the presence of oil) is highly susceptible to corrosion. 4.2.4.3 Neutral-wet surface: On a neutral-wet surface, the oil does not have any preference to be in contact with carbon steel. The oil may be in contact with the carbon steel surface as long as there is no competing phase (e.g., water) present. 4.2.4.4 All locations should be assumed to have the same wettability (whether it is oil-wet or water-wet), unless evidence suggests otherwise. Appendix B (Nonmandatory) contains references for laboratory tests that can be performed to determine wettability.
4.2.5 In order for water-in-oil dispersion flow to occur, dmax must be less than dcrit for water entrainment.
4.2.5.1 The dcrit is the water droplet size above which the droplet separates from the oil-water dispersion either as a result of gravity forces, which are predominant in horizontal flow, or deformation and creaming, which is typical of vertical flow. 4.2.5.2 The dcrit is dependent on the pipeline inclination angle.
4.2.6 Determination of dmax for dilute dispersions and dense dispersions is discussed in Appendix A.
4.2.6.1 A dilute dispersion exists when water droplets entrained in the oil phase act independently, fully suspended in the continuous hydrocarbon phase. 4.2.6.2 A dense dispersion exists when droplets of water entrained in the hydrocarbon phase are not fully suspended and there is significant interaction between them.
4.2.7 If water is not entrained in the hydrocarbon phase (i.e., dmax > dcrit), the probability of water/oil phase separation and internal corrosion is increased. Further analysis is then needed to estimate whether water accumulation is expected to occur. 4.2.8 The critical inclination angle is not necessarily constant within an LP-ICDA region (e.g., changes in internal diameter) and is usually plotted against distance.
4.3 Solids Accumulation
4.3.1 Corrosion in locations in which water accumulates may be significantly affected by organic or inorganic solids that may coprecipitate from the liquid, grow on the pipeline surface, or both.
NACE International

N
4.3.2 Solid particles within liquid petroleum systems are subject to gravitational forces (which tend to deposit them) and turbulent forces (which tend to keep them in suspension). 4.3.3 Various flow patterns may be observed, depending on the mixture flow rate. If the flow rate is high enough, all the solid particles are suspended because of the high level of turbulence. When the flow rate is reduced, the solid particles with density higher than that of the carrier fluid tend to settle and agglomerate at the bottom of the pipe, forming a moving sediment bed. 4.3.4 The minimal settling bed velocity can be calculated to determine whether or not solids accumulate, and it is based on the balance of driving and opposing torques acting on solid particles. It is influenced by the pipeline inclination angle, as discussed in Appendix C (Nonmandatory). Several other valid models for determining solids accumulation are also identified in Appendix C. The operator shall consider the system operating conditions (i.e., liquid petroleum composition, pressure, temperature, flow rate, BS&W, etc.) and select a model that is applicable to those conditions. The rationale for selecting a model shall be documented. 4.3.5 The inclination angle at which the in situ water velocity is equal to the minimal particle settling velocity is defined as the solids critical inclination angle. 4.3.6 Local variations in turbulence caused by changing pipe direction, fittings, or pipeline diameter changes can cause deposition of sediment and resulting corrosive conditions at locations that are not predicted by the analysis presented in Appendix A. Additional direct examinations at the following locations known to cause local sedimentation may be required to compensate for uncertainties regarding the sedimentation process:
4.3.6.1 Overbends associated with changes in topographical profile and pipe direction (excavate and examine pipe immediately downstream from overbend); 4.3.6.2 Isolation valves (examine entire joint downstream from valve); 4.3.6.3 Pipeline diameter increases (spot check several joints downstream from diameter increases); and 4.3.6.4 Liquid petroleum injection points (spot check several joints downstream from new injection points).
4.3.7 Nonsedimenting pipeline operations may be demonstrated through the use of mechanical cleaning runs that do not produce accumulated sand or
ACE International
SP0208-2008
sediment. Operations cleared through this method do not require solids accumulation analysis using flow models.
4.4 Other Influencing Factors
4.4.1 In addition to the primary factors of water and solids accumulation that affect where internal corrosion may occur, the following additional factors should be considered in determining the probability of internal corrosion distribution within a LP-ICDA region: 4.4.2 Emulsion Breaking If sufficient mixing or shear stress is applied to two immiscible liquids such as oil and water, one liquid becomes dispersed in the form of droplets entrained in the other liquid. Once the agitation in the system ceases, the dispersion tends to separate into distinct phases over time. The stability of the dispersion is usually determined by the time required for separation. More stable emulsions require more time for separation.
4.4.2.1 For the same Vcrit, a more stable emulsion may require a longer incline to produce water separation.
4.4.3 Corrosion Inhibition The use of corrosion inhibitors may affect corrosion distribution along a pipeline segment because inhibition effectiveness is usually affected by distance from the injection point. The dependence is different for batch and continuously treated systems and is further influenced by the frequency of pigging.
4.4.3.1 For batch treatment, corrosion may be more likely upstream than downstream. This is especially true for systems whose batch frequency is determined by downstream monitoring (e.g., coupons). Downstream pipe can remain inhibited longer than upstream portions because of re-adsorption of inhibitor that desorbed from upstream locations. 4.4.3.2 For continuous inhibitors, corrosion may be more likely downstream than upstream. Downstream piping can receive less protection because the residual concentration of the inhibitor decreases with length as the inhibitor adsorbs in upstream locations. This is especially true for systems with long distances between injection point and with corrosion monitoring solely located in upstream portions of pipe.
13

SP0208-2008
4.4.4 Water Chemistry Water chemistry is expected to remain relatively constant throughout the length of pipeline. However, the following changes should be considered:
4.4.4.1 Increased dissolved iron with distance (e.g., from internal corrosion) may affect the pH of the water, and 4.4.4.2 If trace amounts of oxygen enter the system, the oxygen may be consumed at upstream locations, leaving downstream locations free from oxygen.
4.4.5 Bacteria and Biocides A pipeline known to suffer from MIC is expected to have a large uncertainty with respect to predicted corrosion severity over distance. Additional direct examinations may be required in systems in which MIC is expected to be the primary internal corrosion mechanism. It has been recognized that even though MIC can occur in unexpected places, it is more prevalent in the following locations:
4.4.5.1 At locations where water is allowed to accumulate; 4.4.5.2 At locations where solid materials are allowed to accumulate; 4.4.5.3. At low point in long-distance pipes; and 4.4.5.4 In stagnant areas or fittings that rarely or never experience flow (i.e., dead legs).
4.4.6 Solids Composition Internal corrosion caused by solids accumulation may be significantly affected by the presence of different organic and inorganic materials that may be present from corrosion products, scales, and carryover of solids into the pipeline segment.
4.4.6.1 The effectiveness of cleaning pigs over distance should be considered. 4.4.6.2 The composition of solids may provide information on potential internal corrosion mechanisms. 4.4.6.3 The presence of corrosion products or other adherent scale or organic deposits can reduce the internal corrosion rate. A system with a changing scaling tendency may have less internal corrosion where a protective scale has formed. 4.4.6.4 The deposition of wax or formation of a stable asphaltenic layer on the surface can effectively inhibit corrosion.
14
4.4.7 Hysteresis in Wettability The amount of time required for the pipeline surface properties to change from hydrophobic (oil-wet) to hydrophilic (water-wet) may be very long, depending on hydrocarbon properties, the presence of surfactants, and flow and operating conditions.
4.4.7.1 Locations predicted to be water-wet under normal operating conditions may have a higher likelihood of internal corrosion than those predicted to be water-wet only during upsets.
4.4.8 Hysteresis in Water and Solids Transport The velocity required to re-entrain settled water and solid materials is higher than the velocity required to maintain entrainment under steady state operation. The impact of short term shutdown or flow rate reductions must be considered as a risk factor. 4.4.9 Effect of Turbulence and Flow Disturbances The effect of turbulence and flow disturbances is dependent on flow rates, flow pattern, liquid petroleum properties, and BS&W content.
4.4.9.1 Additional turbulence at bends or welds may induce entrainment of the water phase, reducing the internal corrosion rate. 4.4.9.2 Turbulence may facilitate water droplets to break through the thin oil film, wetting the pipe surface and inducing localized corrosion. 4.4.9.3 Inertial forces in a bend may also induce additional water/oil separation.
4.5 Inclination Profile Calculation
4.5.1 The operator shall calculate the inclination profile or change in elevation over the defined length. The accuracy of the inclination profile is critical to the success of LP-ICDA, and the accuracy of methods to measure the profile must be documented (including consideration of pipeline depth-of-cover). 4.5.2 The inclination profile shall be composed of multiple sets of data points for each LP-ICDA region examined and is calculated by Equation (1):
⎟⎟⎠
⎞⎜⎜⎝
⎛)∆(distance
n)∆(elevatio arcsin=θ (1)
Where: θ is the inclination angle at that location. 4.5.3 Elevation measurements must be taken at intervals that capture all relevant changes in the inclination profile. The minimum interval depends on
NACE International
the specific pipeline being evaluated, the terrain, and other features. Uncertainty in the inclination profile must be estimated based on the accuracy of elevation data. 4.5.4 The operator shall document the procedure for collecting the elevation data, the elevation data obtained, the assumptions made in this process, the method of determining uncertainty of the inclination profile, and this uncertainty.
4.6 Probability of Corrosion Distribution
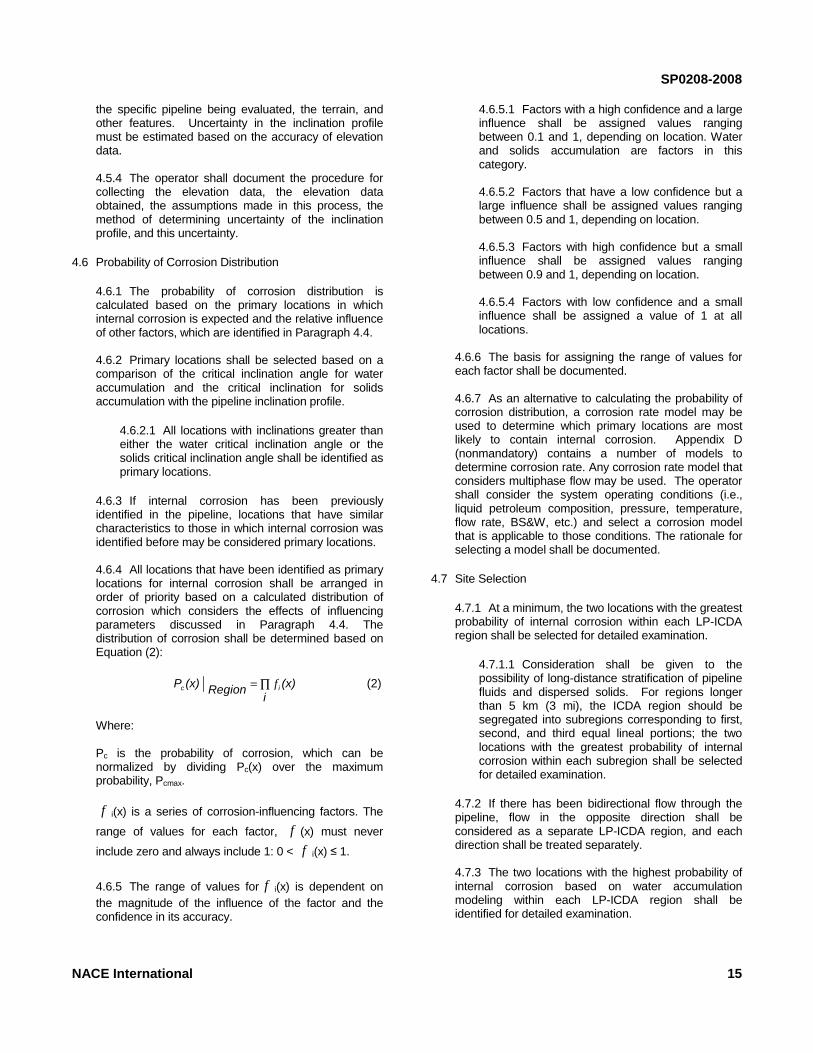
4.6.1 The probability of corrosion distribution is calculated based on the primary locations in which internal corrosion is expected and the relative influence of other factors, which are identified in Paragraph 4.4. 4.6.2 Primary locations shall be selected based on a comparison of the critical inclination angle for water accumulation and the critical inclination for solids accumulation with the pipeline inclination profile.
4.6.2.1 All locations with inclinations greater than either the water critical inclination angle or the solids critical inclination angle shall be identified as primary locations.
4.6.3 If internal corrosion has been previously identified in the pipeline, locations that have similar characteristics to those in which internal corrosion was identified before may be considered primary locations. 4.6.4 All locations that have been identified as primary locations for internal corrosion shall be arranged in order of priority based on a calculated distribution of corrosion which considers the effects of influencing parameters discussed in Paragraph 4.4. The distribution of corrosion shall be determined based on Equation (2):
∏=
i(x) Region (x)P ic f (2)
Where: Pc is the probability of corrosion, which can be normalized by dividing Pc(x) over the maximum probability, Pcmax. f i(x) is a series of corrosion-influencing factors. The
range of values for each factor, f (x) must never
include zero and always include 1: 0 < f i(x) ≤ 1.
4.6.5 The range of values for f i(x) is dependent on the magnitude of the influence of the factor and the confidence in its accuracy.
NACE International
SP0208-2008
4.6.5.1 Factors with a high confidence and a large influence shall be assigned values ranging between 0.1 and 1, depending on location. Water and solids accumulation are factors in this category. 4.6.5.2 Factors that have a low confidence but a large influence shall be assigned values ranging between 0.5 and 1, depending on location. 4.6.5.3 Factors with high confidence but a small influence shall be assigned values ranging between 0.9 and 1, depending on location. 4.6.5.4 Factors with low confidence and a small influence shall be assigned a value of 1 at all locations.
4.6.6 The basis for assigning the range of values for each factor shall be documented. 4.6.7 As an alternative to calculating the probability of corrosion distribution, a corrosion rate model may be used to determine which primary locations are most likely to contain internal corrosion. Appendix D (nonmandatory) contains a number of models to determine corrosion rate. Any corrosion rate model that considers multiphase flow may be used. The operator shall consider the system operating conditions (i.e., liquid petroleum composition, pressure, temperature, flow rate, BS&W, etc.) and select a corrosion model that is applicable to those conditions. The rationale for selecting a model shall be documented.
4.7 Site Selection
4.7.1 At a minimum, the two locations with the greatest probability of internal corrosion within each LP-ICDA region shall be selected for detailed examination.
4.7.1.1 Consideration shall be given to the possibility of long-distance stratification of pipeline fluids and dispersed solids. For regions longer than 5 km (3 mi), the ICDA region should be segregated into subregions corresponding to first, second, and third equal lineal portions; the two locations with the greatest probability of internal corrosion within each subregion shall be selected for detailed examination.
4.7.2 If there has been bidirectional flow through the pipeline, flow in the opposite direction shall be considered as a separate LP-ICDA region, and each direction shall be treated separately. 4.7.3 The two locations with the highest probability of internal corrosion based on water accumulation modeling within each LP-ICDA region shall be identified for detailed examination.
15

SP0208-2008
4.7.3.1 If a region or subregion contains more than two sites with a similar highest probability of internal corrosion, additional sites shall be selected.
4.7.4 For pipelines susceptible to solids accumulation due to flow disturbance effects, two locations with the highest probability of internal corrosion within each LP-ICDA region or subregion shall be identified for detailed examination.
4.7.4.1 Solids accumulation resulting from flow disturbance effects is exacerbated by increasing pipe diameter and increasing hydrocarbon density.
4.7.5 Site accessibility, repair history/records, and any internal leak/rupture history should be considered during site selection.
4.7.5.1 If multiple sites have the same probability for the same internal corrosion mechanism, it may be prudent to perform the first inspection at the site that is most easily accessible.
16
_____________________________________
4.7.5.2 Locations selected for detailed examination should be compared to repair records and history in order to identify any steel/composite repair sleeves that may exist that would make inspections difficult. Also, because internal corrosion is a time-dependent threat, if the location selected is in an area of replacement pipe, consideration should be given to selecting another site with a similar probability of internal corrosion.
4.8 Comparison and Analysis
4.8.1 To check for consistency, the results of the indirect inspection shall be compared to the data collected in the pre-assessment step as well as any locations in which internal corrosion is known to have occurred. The values assigned to each factor shall be reevaluated in selected sites that are not consistent with the known location of internal corrosion or pre-assessment data.
___________________________________
Section 5: Detailed Examinations
5.1 Introduction5.1.1 The objectives of the LP-ICDA detailed examination are (1) to determine whether internal corrosion exists at locations selected in the indirect assessment step, and (2) to use the findings to assess the overall condition of the LP-ICDA region. 5.1.2 The detailed examination step focuses examination efforts on identified sites and features most likely to experience internal corrosion. 5.1.3 Excavation and subsequent inspection sufficient to identify and characterize internal corrosion features in the pipe must be used. 5.1.4 Procedures for nondestructive inspection techniques (NDT) and action as a result of identifying defects during the inspection are not included in the scope of this standard. The operator must follow the appropriate guidelines located in related NACE and ASME standards for evaluating and responding to the presence and extent of corrosion at each site examined. 5.1.5 During the detailed examination step, defects other than internal corrosion, such as external corrosion, mechanical damage, and SCC, may be found. If this occurs, alternative methods must be considered for assessing the impact of such defect types.
5.1.6 Alternative methods are given in ASME B31.4,2 API 1160,4 ANSI/API 579,5 BS 7910,6 NACE standards, international standards, and other documents. 5.1.7 The priority in which excavations and detailed examinations are made shall be determined through comparison of flow modeling results with the pipe inclination profile.
5.2 Performing the Detailed Examination Process
5.2.1 Selection and examination of sites for detailed examination shall be based on the diagrams shown in Figures 3 and 4. Any deviation from this process must be technically justified by the operator, and the reasons must be documented. 5.2.2 An alternative to the deterministic detailed examination process as described in Figures 1 through 5 is to optimize the number of excavations required for LP-ICDA assessment by engineering analysis (including probabilistic methods). The use of an alternative approach shall be technically justified, and the methodology and assumptions documented. 5.2.3 In addition, detailed examination shall be conducted in one location not identified as susceptible for internal corrosion. 5.2.4 In summary, locations with the greatest probability of internal corrosion must be examined in
NACE International

SP0208-2008
_
each LP-ICDA region or subregion. The two locations with the highest priority shall be examined. Two consecutive locations must be found free of internal corrosion to complete the assessment. 5.2.5 One of the following criteria shall be used for measurements to determine the presence of internal corrosion. These criteria are the basis for determining the number of required detailed examinations as described in Paragraph 5.2.4.
5.2.5.1 Internal corrosion metal loss is considered present if the wall thickness is less than minimum specified nominal (compensation for metal loss from external corrosion can be made). 5.2.5.2 A pipeline-specific analysis may be performed to develop criteria for internal corrosion. The analysis might include consideration of previous metal loss and years of pipeline service. 5.2.5.3 Other technical criteria for internal corrosion may be used with documented technical justification.
5.2.6 Operators may perform additional validation examinations at their discretion on regions for which the detailed examination process has been completed. 5.2.7 When the detailed examination process identifies the existence of extensive severe internal corrosion, the operator shall return to pre-assessment because the applicability of LP-ICDA is in question (significant continuous water phase). 5.2.8 When performing the detailed examination step, the operator shall conduct detailed, accurate measurements of the wall thickness and determine the axial length of any wall loss indications present. The length of the pipeline affected by water accumulation may be large in some situations, and care should be taken in selecting the proper NDT technique. Remaining wall thickness values must be identified. 5.2.9 NDT methods used to determine the remaining wall of the pipe in corroded areas shall be performed in accordance with qualified written procedures and applicable industry standards by individuals qualified by training and experience. 5.2.10 The pipeline operator shall evaluate or calculate the remaining strength of locations in which corrosion is found. Example methods of calculating the remaining strength include RSTRENG,10 ASME B31G,11,12 and DnV RP-F101.7 5.2.11 The inspection procedures, detailed wall-thickness data, and strength calculations must be retained with the LP-ICDA records for the pipeline.
____________________________________
NACE International
5.3 Other Facility Components 5.3.1 Even in the absence of a critical incline, facility components that rarely or never experience flow (i.e., dead legs) may represent worst-case conditions for water and solids accumulation. Examples of such locations include tee fittings where the direction of pipe flow (under normal operating conditions) makes an abrupt turn, allowing water and solids to accumulate in the full bore pipe immediately past the tee. 5.3.2 The pipeline operator shall examine at least one fixture in which flow effects can be expected to preferentially deposit water or solids.
5.4 Excavation and Inspection
5.4.1 Corrosion detection and mitigation are not included in the scope of the LP-ICDA standard. However, improvements for real-time monitoring and future site accessibility for LP-ICDA, to be installed concurrently with excavations/inspections, are recommended. 5.4.2 Once a site has been exposed, the operator may install a corrosion monitoring device to assist in determining assessment intervals and benefit from monitoring in the locations most susceptible to corrosion.13 Various monitoring devices are discussed in NACE Publication 3T199.9
5.4.2.1 Coupons installed at arbitrary locations (e.g., end of pipeline) are not expected to represent a pipeline with corrosion that varies with location. 5.4.2.2 Monitoring equipment must be selected based on the appropriate corrosion threat mechanism.
5.4.3 ILI tools (or other assessment) results for a portion of pipe within a LP-ICDA region may provide information that can be used to help assess the condition of the pipeline in areas where a pig cannot be run.
5.4.3.1 ILI results showing extensive significant corrosion demonstrate that the LP-ICDA process is not feasible for that region. 5.4.3.2 ILI results showing sporadic locations of corrosion damage may be used to refine the susceptibility analysis used to select direct examination sites. 5.4.3.3 ILI results showing negligible corrosion damage allow a reduction in the number of direct examination sites required to demonstrate the integrity of that region.
___________________________________
17
SP0208-2008
18
________________________________________________________________________
_________________________
Section 6: Post Assessment
6.1 Introduction6.1.1 The objectives of the post-assessment step are to assess the effectiveness of LP-ICDA and to determine reassessment intervals. 6.1.2 If the operator utilizing LP-ICDA determines that the locations most susceptible to internal corrosion are free from metal loss, the integrity of a large portion of pipeline mileage has been assured relative to this corrosion threat, and resources can be focused on pipelines on which corrosion is determined to be more likely.
6.2 Assessment of LP-ICDA Effectiveness
6.2.1 Effectiveness of the LP-ICDA process is determined by the correlation between detected corrosion and the LP-ICDA predicted locations.
6.2.1.1 Operators must evaluate the effectiveness of LP-ICDA, and the process shall be documented.
6.2.2 The operator shall establish additional criteria for assessing the long-term effectiveness of the LP-ICDA process.
6.2.2.1 An operator may choose to establish criteria that track the reliability or repeatability with which the LP-ICDA process is applied.
6.2.3 If extensive corrosion is found throughout the pipeline, the assumption that water and solid corrodents are predictably being transported in the liquid petroleum shall be reevaluated.
6.3 Remaining Life Calculations
6.3.1 If no internal corrosion defects are found, no remaining life calculation is needed. The remaining life can be taken as the same for a new pipeline. 6.3.2 The maximum remaining flaw size at all detailed examination locations shall be used in the remaining life calculations.
_____________
6.3.2.1 The remaining life of the maximum remaining flaw shall be estimated using sound engineering analysis.
6.3.3 The corrosion growth rate shall be determined by one of the following methods:
6.3.3.1 Reexamine the site at a prescribed frequency to determine or assess growth rate (i.e., monitor site for corrosion growth on the actual pipe); 6.3.3.2 Install one or more corrosion monitoring devices at sites of predicted liquid accumulation and at other representative locations, based on flow modeling results; 6.3.3.3 Apply a corrosion rate model based on operating conditions, liquid composition, and other key factors; or 6.3.3.4 Perform laboratory testing on fluids (i.e., liquid water composition) to determine corrosiveness.
6.4 Determination of Reassessment Intervals
6.4.1 When internal corrosion is identified during detailed examinations, the maximum reassessment interval for each LP-ICDA region shall be taken as one-half of the calculated remaining life. The maximum reassessment interval may be further limited by documents such as ASME B31.42 and ASME B31.8.3 6.4.2 Different LP-ICDA regions may have different reassessment intervals based on variation in expected internal corrosion growth rates.
6.5 Feedback and Continuous Improvement 6.5.1 Improvements as a result of this assessment are to be incorporated into future LP-ICDA projects.
__________________________________
Section 7: LP-ICDA Records
7.1 Introduction7.1.1 This section describes LP-ICDA records that document data pertinent to pre-assessment, indirect inspection, detailed examination, and post assessment
in a clear, concise, and workable manner. All decisions and supporting assessments must be documented. The records required by the standard must be kept for the life of the pipeline.
NACE International

SP0208-2008
7.2 Pre-Assessment Documentation7.2.1 All pre-assessment step actions and decisions shall be recorded. These may include, but are not limited to, the following:
7.2.1.1 Data elements collected for the segment to be evaluated, in accordance with Table 1; 7.2.1.2 Methods and procedures used to integrate the data collected to determine when LP-ICDA is not feasible; and 7.2.1.3 Boundaries of LP-ICDA regions.
7.3 Indirect Inspection
7.3.1 All indirect inspection actions and decisions shall be recorded. These may include, but are not limited to, the following:
7.3.1.1 Flow models used to determine critical angles for solids and water accumulation, as well as the rationale for selecting each model; 7.3.1.2 Method for determining the accuracy of inclination profiles; and 7.3.1.3 Method used for determining the probability of corrosion distribution (or, alternatively, identifying the corrosion model used), as well as the rationale for selecting a given corrosion rate model, if used.
7.4 Detailed Examinations
7.4.1 All detailed examination actions and decisions shall be recorded. These may include, but are not limited to, the following:
7.4.1.1 Data collected before and after the excavation;
7.4.1.1.1 Measured metal loss corrosion geometries;
NACE International
____________________________________
7.4.1.1.2 Data used to identify other areas that may be susceptible to corrosion; and 7.4.1.1.3 Results of remaining strength calculations.
7.4.1.2 Planned mitigation activities; and 7.4.1.3 Descriptions of and reasons for any selections of additional sites.
7.5 Post Assessment
7.5.1 All post-assessment actions and decisions shall be recorded. These may include, but are not limited to, the following:
7.5.1.1 Remaining-life calculation results;
7.5.1.1.1 Maximum remaining flaw size determinations; 7.5.1.1.2 Corrosion growth rate deter-minations; and 7.5.1.1.3 Method of estimating remaining life.
7.5.1.2 Reassessment intervals, including technical justification and operator’s validation of selected method of reassessment; 7.5.1.3 Criteria used to assess LP-ICDA effectiveness and results from assessments;
7.5.1.3.1 Criteria and metrics; and 7.5.1.3.2 Data from periodic assessments.
7.5.1.4 Monitoring records; and 7.5.1.5 Feedback.
____________________________________
References
1. NACE SP0204 (latest revision), “Stress Corrosion Cracking (SCC) Direct Assessment Methodology” (Houston, TX: NACE). 2. ANSI/ASME B31.4 (latest revision), “Pipeline Transportation Systems for Liquid Hydrocarbons and Other Liquids” (New York, NY: ASME). 3. ANSI/ASME B31.8 (latest revision), “Gas Transmission and Distribution Piping Systems” (New York, NY: ASME).4. API 1160 (latest revision), “Managing System Integrity for Hazardous Liquid Pipelines” (Washington, DC: API). 5. ANSI/API 579 (latest revision), “Recommended Practice for Fitness-for-Service and Continued Operation of Equipment” (Washington, DC: API). 6. BS 7910 (latest revision), “Guide to methods for assessing the acceptability of flaws in metallic structures” (London, England: BSI).
19

SP0208-2008
7. DnV-RP-F101 (latest revision), “Corroded Pipelines” (Oslo, Norway: DnV). 8. API 2200 (latest revision), “Repairing Crude Oil, Liquified Petroleum Gas, and Product Pipelines” (Washington, DC: API). 9. NACE Publication 3T199 (latest revision), “Techniques for Monitoring Corrosion and Related Parameters in Field Applications” (Houston, TX: NACE). 10. P.H. Vieth, J.F. Kiefner, RSTRENG2 (DOS Version) User’s Manual and Software (Includes L51688B, Modified Criterion for Evaluating the Remaining Strength of Corroded Pipe) (Washington, DC: PRCI,(7) 1993). 11. ANSI/ASME B31G (latest revision), “Manual for Determining the Remaining Strength of Corroded Pipelines: A Supplement to B31, Code for Pressure Piping” (New York, NY: ASME). 12. P.H. Vieth, J.F. Kiefner, “A Modified Criterion for Evaluating the Remaining Strength of Corroded Pipelines: A Supplement to B31, Code for Pressure Pipe,” PRCI, PR-3-805, Final Report, December 22, 1989. 13. API Specification 5L (latest revision), “Specification for Line Pipe” (Washington, DC: API). 14. O. Moghissi, W. Sun, C. Mendez, J. Vera, S. Brossia, "Development of ICDA for Liquid Petroleum Pipelines," PHMSA Report DTRS56-05-T-0005, 2006. 15. N. Brauner, D. Maron, “Two-Phase Liquid-Liquid Stratified Flow,” Physico Chemical Hydrodynamics 11, 4 (1989): pp. 487-506. 16. R.S. Brodkey, The Phenomena of Fluid Motions (New York, NY: Dover Publications, 1995). 17. D. Barnea, “A Unified Model for Predicting Flow-Pattern Transitions for the Whole Range of Pipe Inclinations,” International Journal Multiphase Flow 13, 1 (1987): pp. 1-12. 18. Y. Taitel, A.E. Dukler, “A Model for Predicting Flow Regime Transitions in Horizontal and Near Horizontal Gas-Liquid Flow,” AIChE(8) Journal 22, 1 (1976): pp. 47-55.20
19. B.F.M. Pots, “Prediction of Corrosion Rates of the Main Corrosion Mechanisms in Upstream Applications,” CORROSION/2005, paper no. 550 (Houston, TX: NACE, 2005). 20. J.T. Davies, “Calculation of Critical Velocities to Maintain Solids in Suspension in Horizontal Pipes,” Chemical Engineering Science 42, 7 (1987). 21. J.F. Hollenberg, R.V.A. Olimens, “Prediction of Flow Conditions to Minimize Corrosion,” Shell Report, 1992. 22. A.J. Karabelas, “Vertical Distribution of Dilute Suspensions in Turbulent Pipe Flow,” AIChE Journal 23, 4 (1977): p. 426. 23. A. Segev, “Mechanistic Model for Estimating Water Dispersion in Crude Oil Flow,” 90th Annual AIChE meeting, held November 25-30, 1984 (New York, NY: AIChE, 1984). 24. B.F.M. Pots, J.F. Hollenberg, E.L.J.A. Hendriksen, “What Are the Real Influences of Flow on Corrosion?” CORROSION/2006, paper no. 591 (Houston, TX: NACE, 2006). 25. S. Papavinasam, A. Doiron, T. Panneerselvam, R.W. Revie, “Predicting Internal Pitting Corrosion of Oil and Gas Pipelines: Hydrocarbon-Wet to Water-Wet Transition,” CORROSION/2006, paper no. 641 (Houston, TX: NACE, 2006). 26. U. Lotz, “Velocity Effects in Flow-Induced Corrosion,” CORROSION/90, paper no. 27 (Houston, TX: NACE, 1990). 27. H. Snuverrink, O. Lansink, P.E.M. Duijvestijn, “Liquid/Liquid Oil/Water Flow in Pipes: Entrainment of Settled Water by Flowing Oil in Pipes,” Shell Report, 1987. 28. D.T. Tsahalis, “Conditions for the Entrainment of Settled Water in Crude Oil and Product Pipelines,” 83rd Annual AIChE Meeting, held March 21-24, 1977 (New York, NY: AIChE, 1977). 29. C. Deng, K. Sand, P. Teevens, “A Web Based Software for Prediction of the Internal Corrosion of Sweet and Sour Multiphase Pipelines,” CORROSION/2006, paper no. 565 (Houston, TX: NACE, 2006). 30. K. Sand, C. Deng, P. Teevens, D. Robertson, T. Smyth, “Corrosion Engineering Assessments via a Predictive Tool,” presented at the Tri-Service Corrosion Conference, held November 14-18, 2005 (sponsored by the
___________________________ (7) Pipeline Research Council International, Inc. (PRCI), 1401 Wilson Blvd., Suite 1101, Arlington, VA 22209. (8)American Institute of Chemical Engineers (AIChE), Three Park Avenue, New York, NY 10016-5991.
NACE International

SP0208-2008
United States Department of Defense(9) Corrosion Policy and Oversight Office, the Office Under Secretary of Defense for Acquisition, Technology, and Logistics, and NACE International, 2005). 31. P. Teevens, “Sour Pipeline Production Operations: 27 Years of Failure-Free Engineering Strategies for the Detection, Mitigation and Prevention of Internal Corrosion,” CORROSION/2005, paper no. 647 (Houston, TX: NACE, 2005).32. M. Wicks, J.P.Fraser, “Entrainment of Water by Flowing Oil,” Materials Performance 14, 5 (1975): p. 9. 33. J.O. Hinze, “Fundamentals of the Hydrodynamic Mechanism of Splitting in Dispersion Processes,” AIChE Journal 1, 3 (1955): p. 289. 34. ISO(10) 6614 (latest revision), “Petroleum Products—Determination of Water Separability of Petroleum Oils and Synthetic Fluids” (Geneva, Switzerland: ISO). 35. W.G. Anderson, “Wettability Literature Survey - Part 2: Wettability Measurement,” Journal of Petroleum Technology 38, 12 (1986): pp. 1246-1262. 36. S. Papavinasam, A. Doiron, R.W. Revie, “Determine Inhibitory and/or Corrosive Properties of Condensates,” PRCI, GRI-8705, 2005. 37. P. Doiron, D. Barnea, “Flow Pattern Maps for Solid-Liquid Flow in Pipes,” International Journal of Multiphase Flow 22, 2 (1996): pp. 273-283. 38. J.R. Shadley, S.A. Shirazi, E. Dayalan, E.F. Rybicki, “Velocity Guidelines for Preventing Pitting of Carbon Steel Piping when the Flowing Medium Contains CO2 and Sand,” CORROSION/96, paper no. 15 (Houston, TX: NACE, 1996). 39. C.D. Adams, J.D. Garber, R.K. Sing, V.R. Jangama, “Computer Modeling to Predict Corrosion Rates in Gas Condensate Wells Containing CO2,” CORROSION/96, paper no. 31 (Houston, TX: NACE, 1996). 40. A. Anderko, R.D. Young, “Simulation of CO2/H2S Corrosion Using Thermodynamic and Electrochemical Models,” CORROSION/99, paper no. 31 (Houston, TX: NACE, 1999).
41. A. Anderko, “Simulation of FeCO3/FeS Scale Formation Using Thermodynamic and Electrochemical Models,” CORROSION/2000, paper no. 102 (Houston, TX: NACE, 2000). 42. A. Anderko, P. McKenzie, R.D. Young, “Computation of Rates of General Corrosion Using Electrochemical and Thermodynamic Models,” Corrosion 57, 3 (2001): pp. 202-213. 43. M.R. Bonis, J.L. Crolet, “Basics of the Prediction of the Risks of CO2 Corrosion in Oil and Gas Wells,” CORROSION/89, paper no. 466 (Houston, TX: NACE, 1989). 44. J.L. Crolet, N. Thevenot, A. Dugstad, “Role of Free Acetic Acid on the CO2 Corrosion of Steels,” CORROSION/99, paper no. 24 (Houston, TX: NACE, 1999). 45. E. Dayalan, F.D. de Moraes, S.A. Shirazi, E.F. Rybicki, “CO2 Corrosion Prediction in Pipe Flow Under FeCO2 Scale-Forming Conditions,” CORROSION/98, paper no. 51 (Houston, TX: NACE, 1998). 46. C. de Waard, D.E. Milliams, “Carbonic Acid Corrosion of Steel,” Corrosion 31, 5 (1975): pp. 177-181. 47. C. de Waard, U. Lotz, “Prediction of CO2 Corrosion of Carbon Steel,” CORROSION/93, paper no. 69 (Houston, TX: NACE, 1993). 48. C. de Waard, U. Lotz, A. Dugstad, “Influence of Liquid Flow Velocity on CO2 Corrosion: A Semi-Empirical Model,” CORROSION/95, paper no. 128 (Houston, TX: NACE, 1995). 49. B. Mishra, S. Al-Hassan, D.L. Olson, M.M. Salama, “Development of a Predictive Model for Activation-Controlled Corrosion of Steel in Solutions Containing Carbon Dioxide,” Corrosion 53, 11 (1997): pp. 852-859. 50. S. Nesic, J. Postlethwaite, S. Olsen, “An Electro-chemical Model for Prediction of Corrosion in Mild Steel in Aqueous Carbon Dioxide Solutions,” Corrosion 52, 4 (1996): p. 280. 51. S. Nesic, J. Postlethwaite, S. Olsen, “An Electro-chemical Model for Prediction of CO2 Corrosion,” CORROSION/95, paper no. 131 (Houston, TX, 1995). 52. S. Nesic, M. Nordsveen, R. Nyborg, A. Stangeland, “A Mechanistic Model for CO2 Corrosion with Protective Iron Carbonate Films,” CORROSION/2001, paper no. 40 (Houston, TX: NACE, 2001).
21
NACE International
___________________________ (9) Department of Defense (DoD), 1400 Defense Pentagon, Washington, DC 20310-1400. (10) International Standards Organization (ISO), 1, ch. de la Voie-Creuse, Case postale 56,CH-1211 Geneva 20, Switzerland.
SP0208-2008
53. R. Nyborg, P. Andersson, M. Nordsveen, “Implementation of CO2 Corrosion Models in a Three-Phase Fluid Flow Model,” CORROSION/2000, paper no. 48 (Houston, TX: NACE, 2000). 54. NORSOK(11) Standard M-506 (latest revision), “CO2 Corrosion Rate Calculation Model” (Lysaker, Norway: NORSOK). 55. A.M.K. Halvorsen, T. Santvedt, “CO2 Corrosion Model for Carbon Steel Including a Wall Shear Stress Model for Multiphase Flow and Limits for Production Rate to Avoid Mesa Attack,” CORROSION/99, paper no. 42 (Houston, TX: NACE, 1999). 56. J.E. Oddo, M.B. Tomson, “The Prediction of Scale and CO2 Corrosion in Oil Field Systems,” CORROSION/99, paper no. 41 (Houston, TX: NACE, 1999). 57. S. Papavinasam, R.W. Revie, V. Sizov, “Predicting Internal Pitting Corrosion of Oil and Gas Pipelines: Model Preduction vs. Field Experience,” CORROSION 2007, paper no. 658 (Houston, TX: NACE, 2007). 58. S. Papavinasam, R.W. Revie, W.I. Friesen, A. Doiron, T. Panneerselvam, “Review of Models to Predict Internal22
_____________________________________
Pitting Corrosion of Oil and Gas Pipelines,” Corrosion Reviews 24, 3-4 (2006): pp. 173-230. 59. B.F.M. Pots, “Mechanistic Models for the Prediction of CO2 Corrosion Rates under Multi-Phase Flow Conditions,” CORROSION/95, paper no.137 (Houston, TX: NACE, 1995). 60. S. Srinivasan, R.D. Kane, “Prediction of Corrosivity of CO2/H2S Production Environments,” CORROSION/96, paper no. 11 (Houston, TX: NACE, 1996). 61. M.B. Kermani, L.M. Smith, eds., “CO2 Corrosion Control in Oil and Gas Production, Design Considerations,” European Federation of Corrosion(12) Publications, Number 23, Chapter 6 (London, England: Maney Publishing, 1997), pp. 18-23. 62. N. Petalas, K. Aziz, “A Mechanistic Model for Multiphase Flow in Pipes,” Journal of Canadian Petroleum Technology 39, 6 (2000): pp. 43-55. 63. E. Adsani, S.A. Shirazi, J.R. Shadley, E.F. Rybicki, “Mass Transfer and CO2 Corrosion in Multiphase Flow,” CORROSION/2002, paper no. 492 (Houston, TX: NACE, 2002).
___________________________________
Appendix A: Determination of Water Accumulation
(Nonmandatory)
This appendix is considered nonmandatory, although it may contain mandatory language. It is intended only to provide supplementary information or guidance. The user of this standard is not required to follow, but may choose to follow, any or all of the provisions herein.
Example of an Oil-Water Flow Model (excerpt from PHMSA DTRS56-050T-0005)14This model is not intended to bind the user of this direct assessment standard practice to a particular modeling approach, but rather to demonstrate the level of sophistication required to predict water accumulation in liquid-packed hydrocarbon pipelines with reasonable rigor. This model has been peer reviewed (through PHMSA) and is in reasonable agreement with other flow models and published flow loop data. The operator shall consider the system operating conditions (i.e., liquid petroleum composition, pressure, temperature, flow rate, BS&W, etc.) and select a model that is applicable to those conditions. Under a given set of flow conditions, there is a maximum size of water droplet that can exist without being broken down into smaller pieces by the forces of turbulence. Similarly, there is a maximum water droplet size that can be
sustained without settling under the forces of gravity. The point at which these two values are equal is known as the critical velocity for a water-in-oil dispersion, and comparison of the actual pipe flow to this critical velocity determines whether a stable water-in-oil dispersion will persist, or whether the flow will separate into stratified layers of oil on water (stratified flow). Factors governing formation of water droplets and their sizes are oil- and water-specific gravities, interfacial tension between the oil and water, oil viscosity, oil velocity, pipe diameter, and pipeline inclination. The critical velocity can be calculated at different pipeline inclinations for a certain test condition, and eventually the critical pipeline inclination for water entrainment can be deduced. The sets of equations proposed for these calculations are described in the paragraphs following.
_______________________________ (11) Norsk Sokkels Konkuranseposisjon (NORSOK), P.O. Box 242, NO-1326 Lysaker, Norway. (12) European Federation of Corrosion (EFC), 1 Carlton House Terrace, London SW 1Y 5DB, UK.
NACE International
SP0208-2008
Maximum Droplet Size Two sets of equations (see Equations [A.1] through [A.15]) are used to determine the maximum droplet size, depending on the characteristics of the water dispersion in the oil phase. The first set of equations described in this appendix apply to dilute dispersions. For dilute dispersions: Under dilute flow conditions, the water droplets entrained in the oil phase act independently, fully suspended in the continuous hydrocarbon phase, and fluid-droplet forces dominate.( ) 1≈ρρ
ε-1o
mw (A.1)
Where (units are dimensionless unless otherwise stated):
wε is the in situ water cut (i.e., fractional flow that is water—
the disperse phase, in this case)
mρ is the density of the oil-water mixture, kg/m3
oρ is the density of the continuous phase (in this case, oil),
kg/m3
maxd , the maximum droplet size, in m, for pipe flow, can be
expressed according to Brauner15 as:
( ) 0.080.6-
0.4-
oom
wo
dilute
max ReWeρε1ρ
1.88D
d - ⎥⎦
⎤⎢⎣
⎡⎟⎟⎠
⎞⎜⎜⎝
⎛ = (A.2)
If:
0.1<D
d<1.8Re
dilute
maxo
0.7
⎟⎟⎠
⎞⎜⎜⎝
⎛
Note that the subscript refers to dilute dispersion. Where (units are dimensionless unless otherwise stated): D is the pipe diameter, m
wε is the in situ water cut
oWe is Weber number of the oil phase
oRe is Reynolds number of the oil phase
sosw
sww UU
Uε+
= (A.4)
σDUρ
We2
ooo = (A.5)
o
ooo η
DUρRe = (A.6)
(A.3)
NACE International
soswo UUU += (A.7)
Where (units are dimensionless unless otherwise stated):
oU is the oil velocity (the continuous phase, in this case),
m/s
swU is the superficial water velocity, m/s, (A
QU wsw = ),
Where:
WQ is the volume flow of water, m3/s
and A is the cross-sectional area of pipe, m2
soU is the superficial oil velocity, m/s (A
QU oso = ),
oQ is the
volume flow of oil, m3/s
oη is the oil viscosity, Pa-s
σ is the surface tension of the water, N/m The Weber number represents the ratio between the external force that tends to deform the drop and the counteracting surface tension force (see Equation A.8). Although the turbulent field in pipe flow is not homogeneous and isotropic, Equation (A.2) has been proven to yield a good prediction of dmax in the flow of dilute dispersions for a variety of two-liquid systems, as long as dmax < 0.1 D. For liquid systems, where the density of the continuous and disperse phases is approximately the same, this approximation is valid for εw< 1.
/σdτWe maxcrit ⋅= (A.8)
Where: τ = shear stress, N/m2 The following input parameters are required for the calculation of dmax: Fluid parameters: Water phase:
wQ (m3/s)
Mixture oil-water: mρ (kg/m3)
Hydrocarbon or oil phase: oQ (m3/s), oη (Pa-s), σ (N/m),
oρ (kg/m3)
Geometric Parameters: Pipe diameter: D (m) Cross-sectional area: A (m2) For dense dispersions: When the dispersion cannot be considered dilute, which means droplets of water entrained in the hydrocarbon phase are not fully suspended and there is much interaction
23

SP0208-2008
between them, a dense dispersion approach should be considered. This approach may apply if there is an eventual increase in the water cut for any reason or if there is a large difference between the oil-water mixture density and the oil density. Under such conditions, the flow rate of oil phase, Qo, should carry sufficient turbulent energy to disrupt the tendency of the water droplets, flowing at a rate Qw, to coalesce. Brauner15 noted that the rate of surface energy production in the coalescing water phase is proportional to the rate of turbulent energy supply by the flowing oil phase (see Equations [A.9] to [A.12]):wmax
Ho
'2o Q
d4σ
CQ2
Uρ=⎟⎟
⎠
⎞⎜⎜⎝
⎛ (A.9)
so2
o UD4π
Q = (A.10)
sw2
w UD4π
Q = (A.11)
( )2/3
max'2 ed2U = (A.12)
Where:
HC is a constant of the order of 1, and 'U (m/s) denotes the
turbulent kinetic energy. In the isotropic and homogeneous turbulence, the turbulent kinetic energy can be related to the rate of turbulent energy dissipation, e, as shown in Equation (A.13) (turbulent energy dissipation rate is in units of m2/s3):
( ) ( )wo
m3o
wo ε1ρρ
D
2U
ε1DρU4
e−
=−
= oτ (A.13)
Substituting Equations (A.11) and (A.13) into (A.9) yields Equation (A.14):
( )
0.4-
wo
m
-0.6
w
w
0.6-2oo0.6
H
dense
max fε-1ρ
ρε-1
εσ
DUρ2.22C
D
d⎥⎦
⎤⎢⎣
⎡⎟⎟⎠
⎞⎜⎜⎝
⎛⎟⎟⎠
⎞⎜⎜⎝
⎛=⎟
⎠
⎞⎜⎝
⎛ (A.14)
The subscript dense denotes the dense oil-water dispersion and f is the Fanning friction factor, see Equation (A.19). For the dense dispersion analysis, the same parameters used for the dilute dispersion analysis are needed. Given a water-oil fluid system and operational conditions, the largest droplet size that can be sustained is the larger of the two values obtained via the dilute or the dense dispersion approach (Equations [A.2] and [A.14]), which can
24
be considered as the worst case for a given oil-water system (see Equation [A.15]):
⎭⎬⎫
⎩⎨⎧
⎟⎠
⎞⎜⎝
⎛⎟⎠
⎞⎜⎝
⎛=⎟⎠
⎞⎜⎝
⎛
dense
max
dilute
maxmax
Dd
,D
dMax
Dd
(A.15)
Gravity Effect The gravity effect is the critical droplet diameter above which separation of droplets due to gravity, dcd, takes place. This can be found by a balance of gravity and turbulent forces, as shown in Equation (A.16):
( ) oFr∆ρρ
f83
θcosDgfU
∆ρρ
83
Dd 0
2oocd =
⋅=⎟
⎠
⎞⎜⎝
⎛ (A.16)
Where Froude number (Fro) is defined in Equations (A.17), (A.18), and (A.19) as:
( )βcosDg
UFr
2o
o ⋅= (A.17)
wo ρ-ρ∆ρ = (A.18)
Where (units are dimensionless unless otherwise stated): β : inclination of the pipeline, degrees g : gravity constant, 9.81 m/s2 f : turbulent flow friction factor
0.2
o0.046/Re=f (A.19)
This effect is predominant at low pipe inclinations, i.e., in horizontal and near-horizontal flows. The critical droplet diameter, above which drops are deformed and creamed (dcσ), leads to the migration of the droplets toward the pipe walls in vertical and near-vertical flows, as calculated in Equations (A.20) through (A.22):16
( )
0.5
2wo
cσ
θcosgDρρ0.4σ
Dd
⎥⎥⎦
⎤
⎢⎢⎣
⎡
⋅−=⎟
⎠
⎞⎜⎝
⎛ (A.20)
βθ = if o45β < (A.21)
β90θ −= if o45β > (A.22)
Dcrit can then be conservatively estimated for any pipe inclination according to the suggestion made by Barnea (see Equation [A.23]):17
NACE International

⎭⎬⎫
⎩⎨⎧
⎟⎟⎠
⎞⎜⎜⎝
⎛⎟⎟⎠
⎞⎜⎜⎝
⎛=D
d,
D
dMin
D
d cσcdcrit (A.23)
In addition to the parameters needed to estimate dmax, the calculation of dcrit requires the inclination angle of pipeline. The final criterion for water entrainment into the hydrocarbon or oil phase is established by Brauner.15 The transition from stratified flow to stable water-in-oil dispersion occurs, when the oil phase turbulence is intense enough to maintain the water phase broken up into droplets not larger than dmax, which must be smaller than dcrit, causing droplet separation (dmax ≤ dcrit). In situ water velocity estimation The objective is to identify local examination points in which water that is not entrained in the hydrocarbon can locally accumulate (i.e., upstream from inclines). In these
NACE International
SP0208-2008
locations, the in situ water velocity approaches zero, accumulation occurs, and the likelihood of internal corrosion is increased. The two-phase segregated flow model is selected because liquid petroleum transmission pipelines are fully packed witha liquid phase (i.e., no significant gas phase), and the water content in crude oil is typically specified by BS&W of less than 1%. Two-phase stratified model In the two-phase segregated flow model, the phases are assumed to be totally separated, with one phase flowing at the top of the pipe and the other at the bottom of the pipe. Two sets of conservation equations, one for oil phase and the other for water phase, are used to describe the momentum balance, mass balance, and energy balance in the two-phase segregated flow model. The schematic of a two-phase stratified flow of oil and water in a circular pipe is shown in Figure A1.
Figure A1
Schematic representation of the stratified oil-water flow.
uo
uw
oτ
iτ
iτ
Ao si
−h
Aw iτ wτ
Based on the figure, both mass balance and momentum balance conservation equations are written for each phase. A mass balance includes Equations (A.24) to (A.26): AUAUQ soooo == (A.24)
AUAUQ swwww == (A.25)
)AU(UAUAUQQ swsowwoowo +=+=+ (A.26)
Where: A is the pipe cross-sectional area, m2 Qo is the volumetric flow rate of the oil phase, m3/s Qw is the volumetric flow rate of the water phase, m3/s Ao is the cross-sectional area occupied by the oil layer, m2 Aw is the cross-sectional area occupied by the water layer, m2 Uo is the in situ velocity of the oil layer, m/s
25
Uw is the in situ velocity of the water layer, m/s Uso is the superficial velocity of the oil layer, m/s Usw is the superficial velocity of the water layer, m/s If the height of the oil-water interface is h from the bottom of the pipe, then the cross-sectional area occupied by the water phase is given by Equation (A.27):
⎟⎟⎟
⎠
⎞
⎜⎜⎜
⎝
⎛⎟⎠⎞
⎜⎝⎛ −−
⎟⎟⎟
⎠
⎞
⎜⎜⎜
⎝
⎛−+
⎟⎟⎟
⎠
⎞
⎜⎜⎜
⎝
⎛−−=
−−− 22
w 1h211h21h2acosπ4
DA (A.27)
Where the dimensionless film height,−h , is calculated in
Equation (A.28):
Dh
h =−
(A.28)
and D is the diameter of the pipe, m

SP0208-2008
A momentum balance is carried out for the oil and water layers in Equations (A.29) and (A.30): For the water phase:0=−−−⎟⎠⎞
⎜⎝⎛ gsinβAρSS
dxdp
A wwi1i1www ττ (A.29)
For the oil phase:
0gsinβAρSSdxdp
A ooioo =−+−⎟⎠⎞
⎜⎝⎛
io ττ (A.30)
Where:
oτ is the shear stress at wall for oil, N/m2
wτ is the shear stress at wall for water, N/m2 iτ is the interfacial shear stress, N/m2
β is the pipe inclination, (β is positive for upward flow), degrees
oS is the portion of pipe circumference in contact with the
oil phase, m
wS is the portion of pipe circumference in contact with the
water phase, m
iS is the width of the interface, m
(dp/dx) is the pressure gradient, N/m3
oρ is the density of the oil phase, kg/m3
wρ is the density of the water phase, kg/m3
The pressure drop is the same in both the phases. The pressure drop term is eliminated in Equation (A.31):
( ) 0sinAS
AS
AS
AS
w
i
o
i
w
w
o
o =−+⎟⎟⎠
⎞⎜⎜⎝
⎛+−− βρρτττ gwoiwo (A.31)
Following Taitel and Dukler,18 the shear stresses are evaluated by using a Blasius-type equation, as shown in Equations (A.32) and (A.33):
2U 2
oooo f
ρτ = (A.32)
2U 2
wwww
ρτ f= (A.33)
Where: f is a Fanning friction factor that depends on the
Reynolds number. The friction factors are defined in Equations (A.34) and (A.35):
26
o
υf
n
o
oooo
UDC
−
⎟⎟⎠
⎞⎜⎜⎝
⎛= (A.34)
wn
w
wwww υ
UDC
−
⎟⎟⎠
⎞⎜⎜⎝
⎛=f (A.35)
Where:
wυ is the water viscosity in m2/s
oυ is the oil viscosity in m2/s
The constants C and n are given the following values: for laminar flow, C = 16 and n = 1 and for turbulent flow, C = 0.046 and n = 0.2. It should be noted that the Reynolds numbers for the two fluids are based on the equivalent hydraulic diameters. These are defined according to whether the upper layer is the faster one, or vice-versa.15 The interface is considered a free surface when the velocities of the phases on each side of the interface are of comparable levels. When the velocities are different, the interfacial surface must be added to the wetted perimeter of the faster phase. In contrast to gas-liquid flow, the velocities of the two phases in liquid-liquid systems may be similar, and alternatively, one phase velocity exceeds the other (see Equations [A.36] to [A.41]). For Uo > Uw:
io
oo SS
4AD
+= (A.36)
w
ww
A
SD
4= (A.37)
For Uo < Uw
o
o
S4A
D =o (A.38)
iw
ww SS
4AD
+= (A.39)
For Uo = Uw
o
oo S
4AD = (A.40)
w
ww S
4AD = (A.41)
The interfacial shear stress between the two layers, τi, is defined in Equation (A.42):
( )( )
2
UUUUρ owow −−= ii fτ (A.42)
NACE International

SP0208-2008
F > 0.67 ⇒No water accumulation at bottom of pipe F > 2 ⇒ Water entrainment into the oil phase
(A.43)
Where (units are dimensionless unless otherwise stated): ρ is the density of the faster layer, kg/m3
if is the friction factor of the faster layer
All parameters shown in the momentum balance (Equation [A.31]) can be expressed as a function of interface height. Hence, solving Equation (A.31) for a given oil and water flow rate, the height of the interface can be predicted. The holdup and pressure drop can then be evaluated. Other models can be used to calculate water accumulation. For example, a simple calculation for predicting water entrainment in oil under turbulent flow (Reynolds number of liquid phase > 2,100) has been proposed19 based on two critical Froude numbers, as indicated in Equation (A.43):
Lo V
∆ρgDρ
F =
Where (units are dimensionless unless otherwise stated): ρo is the oil density, kg/m3 ∆ρ the oil-water density difference, kg/m3 g is the acceleration due to gravity, 9.81 m/s2 D is the hydraulic diameter of the liquid phase (oil + water), m VL is the liquid phase velocity, m/s At a Froude number of 0.67, water is predicted to be swept from a low point over a hill by the oil flow. This rule is based on flow loop tests and considered conservative for inclinations less than 5 degrees. At a Froude number of about 2, water is predicted to be entrained into the oil phase. The critical value is obtained from modeling of the breakup of water droplets and found to be within 20% of field and laboratory cases studied. Alternative Flow Models A number of additional rules and models are available to describe the likelihood of water dropout of oil, leading to establishment of corrosion conditions. Every model has its limitations; therefore, when a particular model is used, its characteristics and limitations should be understood. Only some simple models are described in this appendix; more complex models are not necessarily better. Hollenberg and Oliemans Model20,21
Hollenberg and Oliemans describe a model that establishes the Vcrit, at which sufficient turbulence is created to break up large water droplets and to maintain them in dispersion against sedimentation. It is based on the following
NACE International
assumptions: homogeneous dispersion, single droplet size, drops act as solid particles, smooth pipe wall, and horizontal line. Karabelas/Segev (K/S) Model22,23,24
This model provides critical flow velocity for water settling. This velocity is assumed to be the flow velocity at which 60% of water accumulates at the bottom. Papavinasam Model24,25
There are two kinds of emulsions: oil-in-water and water-in-oil. An oil-in-water emulsion has high conductivity and is corrosive. In an operating pipeline, initially, the amount of water carried is lower and the amount of oil carried is higher, and the water content progressively increases. The percentage of water at which water-in-oil converts to oil-in-water is known as the emulsion inversion point (EIP). Laboratory and field probes are available to identify the type of emulsion under pipeline operating conditions. Pots Model24,26
In the past, a minimum mixture velocity of 1 m/s and a maximum water cut of 20% was used for a safe and corrosion-free operation. However, based on a combination of laboratory and field experiments, it was found that water dropout and water-film thickness depend on the nature of the oil, and that no single Vcrit can be used in all circumstances. Snuverink et al. Model24,27
Snuverink et al. correlated Vcrit for moving water over a hill with a Froude number. This rule is conservative for inclinations less than 5 degrees. It applies only when the flow is turbulent. This model was developed by determining the sweeping of water from the lowest point of an inclined pipe section in laboratory experiments using various pipe diameters, inclinations, and model fluids. Tsahalis Model28
The Tsahalis model was developed to predict the minimum flow velocity at which the water is entrained into the oil phase. This model gives typical critical flow velocities as low as 0.5 m/s. Teevens Model29,30,31
The Teevens model predicts both the liquid holdup and the internal corrosion rate in two- and three-phase oil and gas production pipelines. It is able predict both the location and liquid hold-up cross-sectional area as a function of distance and elevation change over discrete distances as dictated by global positioning system (GPS) interval data collected and inputted into the model.
27

SP0208-2008
Wicks and Fraser Model32,33The model developed by Wicks and Fraser refers to the pickup of water by flowing oil from low points. The model is based on a combination of two correlations: one for the minimum velocity for the net axial transport of sand particles
28
_____________________________________
____________________________________
and one for water dropout size. It is assumed that the correlation for the sand particles is equally applied to rigid dropouts of the same size. The droplet size is taken from a different study, which refers to dmax in a turbulent flow. The sand transport correlation is derived from experimental data for transport of sand in various liquids.
___________________________________
Appendix B: Determination of Wettability
(Nonmandatory)
This appendix is considered nonmandatory, although it may contain mandatory language. It is intended only to provide supplementary information or guidance. The user of this standard is not required to follow, but may choose to follow, any or all of the provisions herein.
Emulsion and wettability are two different properties. A hydrocarbon may hold a lot of water, but as soon as the inversion point occurs, the surface may become water-wet immediately. On the other hand, an inversion point may occur at a very low water cut, but the surface may not become water-wet until a very high water cut is reached. The difference in behavior is because the emulsion depends on liquid-liquid (oil-water) interaction, whereas wettability depends on the balance between two solid-liquid (steel-oil and steel-water) interactions. Contact Angle Method
The tendency of water to displace hydrocarbon from steel can be estimated by considering the relative surface energies of all the interfaces involved. A hydrocarbon-steel interface is replaced by a water-steel interface if the energy of the system decreases as a result of this action. Displacement of water by hydrocarbon should be expected when the contact angle (θ), measured through the water, is between 90° and 180°, and displacement of hydrocarbon by water should be expected when θ is between 0° and 90°.
On the other hand, displacement of water by hydrocarbon is expected when θ, measured through the oil, is between 0° and 90°.
Laboratory setup: Steel samples are polished (600 grit). The samples are then placed in a beaker containing distilled water, and the oil is injected through a syringe into the water so that it adheres to the sample surface. A photograph from which the contact angle is measured is taken. Spreading Method25,34,35,36
In this method, the conductivity of the emulsion is measured between two probes placed at various distances apart. In the presence of oil with no affinity toward steel (water-wet), good conductivity (typically between 1 and 2 kΩ) is measured between all probes. On the other hand, in the presence of oil with an affinity toward steel (oil-wet), no conductivity is measured between any of the probes. In the presence of oil with no particular affinity (mixed-wet), conductivity is measured between some probes.
__________________________________
Appendix C: Determination of Solids Accumulation
(Nonmandatory)
This appendix is considered nonmandatory, although it may contain mandatory language. It is intended only to provide supplementary information or guidance. The user of this standard is not required to follow, but may choose to follow, any or all of the provisions herein.
Example of Solids Accumulation Model (excerpt from PRCI PR-186-04305)14 This model is not intended to bind the user of this direct assessment standard practice to a particular modeling approach, but rather to demonstrate the level of sophistication required to predict solids accumulation in liquid-packed hydrocarbon pipelines with reasonable rigor. This model has been peer reviewed (through PRCI) and is
in reasonable agreement with other models. The operator shall consider the system operating conditions (i.e., liquid petroleum composition, pressure, temperature, flow rate, BS&W, etc.) and select a model that is applicable to those conditions. Settled-out solids often contain high concentrations of contaminants such as bacteria and organic chlorides that may benignly persist on the bottom of a pipeline until a
NACE International
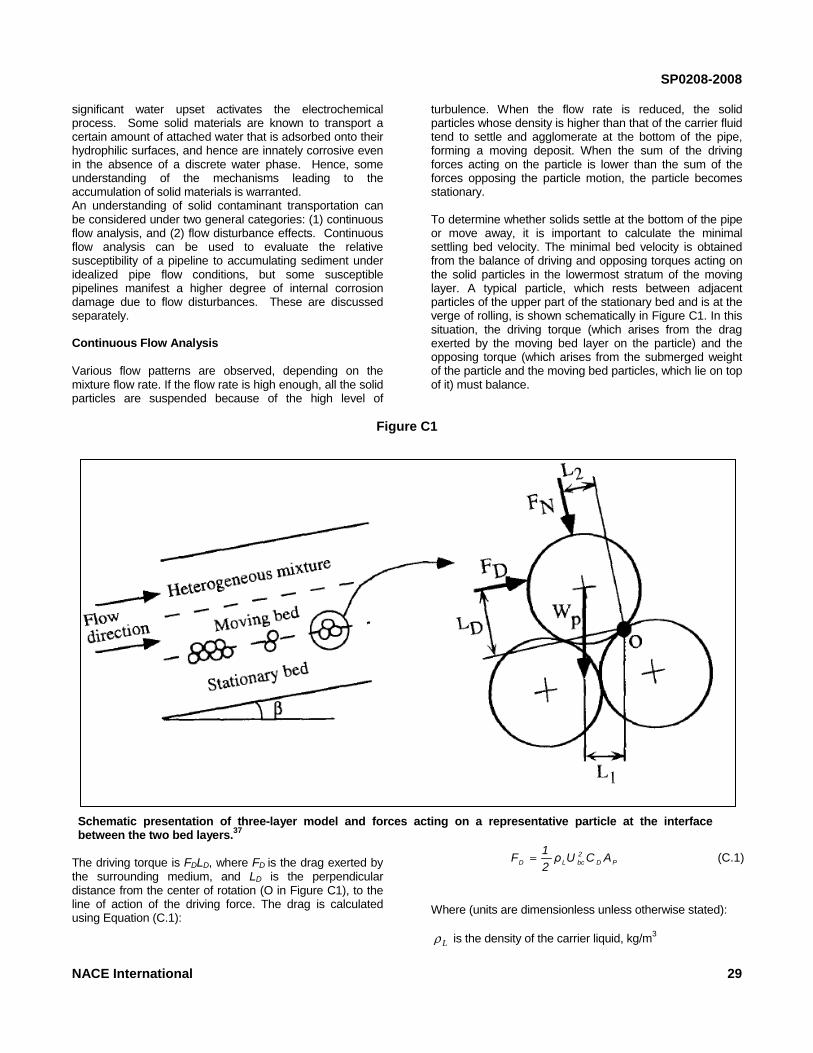
SP0208-2008
significant water upset activates the electrochemical process. Some solid materials are known to transport a certain amount of attached water that is adsorbed onto their hydrophilic surfaces, and hence are innately corrosive even in the absence of a discrete water phase. Hence, some understanding of the mechanisms leading to the accumulation of solid materials is warranted. An understanding of solid contaminant transportation can be considered under two general categories: (1) continuous flow analysis, and (2) flow disturbance effects. Continuous flow analysis can be used to evaluate the relative susceptibility of a pipeline to accumulating sediment under idealized pipe flow conditions, but some susceptible pipelines manifest a higher degree of internal corrosion damage due to flow disturbances. These are discussed separately. Continuous Flow Analysis Various flow patterns are observed, depending on the mixture flow rate. If the flow rate is high enough, all the solid particles are suspended because of the high level ofNACE International
turbulence. When the flow rate is reduced, the solid particles whose density is higher than that of the carrier fluid tend to settle and agglomerate at the bottom of the pipe, forming a moving deposit. When the sum of the driving forces acting on the particle is lower than the sum of the forces opposing the particle motion, the particle becomes stationary. To determine whether solids settle at the bottom of the pipe or move away, it is important to calculate the minimal settling bed velocity. The minimal bed velocity is obtained from the balance of driving and opposing torques acting on the solid particles in the lowermost stratum of the moving layer. A typical particle, which rests between adjacent particles of the upper part of the stationary bed and is at the verge of rolling, is shown schematically in Figure C1. In this situation, the driving torque (which arises from the drag exerted by the moving bed layer on the particle) and the opposing torque (which arises from the submerged weight of the particle and the moving bed particles, which lie on top of it) must balance.
Figure C1
Schematic presentation of three-layer model and forces acting on a representative particle at the interface between the two bed layers.37
The driving torque is FDLD, where FD is the drag exerted by the surrounding medium, and LD is the perpendicular distance from the center of rotation (O in Figure C1), to the line of action of the driving force. The drag is calculated using Equation (C.1):
29
PD2bcLD ACUρ
21
F = (C.1)
Where (units are dimensionless unless otherwise stated):
Lρ is the density of the carrier liquid, kg/m3

SP0208-2008
bcU is the minimal settling velocity, m/s
PA is the projection of the particle’s exposed area on a
plane normal to the flow direction, m2
DC is the drag coefficient for the particle. DC depends on
the particle Reynolds number, Rep (see Equations [C.2] to [C.4]). LPoLP /µdωρRe = (C.2)
6.0−= P18.5ReCD 500Re0.1 LP << (C.3)
0.44CD = 5
LP 102Re500 ×<< (C.4) LD passes through the centroid of Ap, as shown in Equation (C.5):
⎟⎠⎞
⎜⎝⎛ += 0.0137
3π
sin2
dL P
D (C.5)
Where: wo is the fluid velocity, m/s
Lµ is the viscosity of the liquid, Pa-s
dp is the particle’s diameter, m The opposing torque is composed of the effect of the submerged weight of the particle (WpL1) and the effect of the solid particles in the moving bed layer pressing on it (FNL2). The particle’s submerged weight, Wp, is found using Equation (C.6):
( ) 3PLSP gdρρπ
61
W −= (C.6)
Where: Wp is the particle’s submerged weight, N
Sρ is the density of the solids, kg/m3
g is the gravitational acceleration, 9.81 m/s2
The perpendicular distance (L1) from the line of action of this force to the center of rotation, “O,” is found using Equation (C.7):
⎟⎠⎞
⎜⎝⎛ += βπ
621 sind
L P (C.7)
Where: β is the pipe’s angle, radians The normal force exerted by the column of particles lying above the particle under consideration is found using Equation (C.8):
cosβd
dyCWNcosβWF
P
PmbmbPPN
−== (C.8)
30
Where (units are dimensionless unless otherwise stated): N is the average number of particles in the column
mby is the height of the moving bed layer, m
mbC is the moving bed concentration (assumed to be 0.52
for cubic packing) The distance (L2) between the line of action of this force to the centre of rotation, “O,” is found using Equation (C.9):
⎟⎠⎞
⎜⎝⎛=
6π
sin2
dL P
2 (C.9)
The minimal settling bed velocity is then extracted by equating the driving torque and the opposing torques (see Equation C.10):
( )
DL
LS
C
1dy
Ccos
singd1.559
UP
mbmbP
bc ρ
ββπρρ⎥⎥⎦
⎤
⎢⎢⎣
⎡⎟⎟⎠
⎞⎜⎜⎝
⎛−+⎟
⎠⎞
⎜⎝⎛ +−
=26 (C.10)
Flow Disturbance Effects Flow disturbances caused by pipeline fittings, valves, diameter changes, direction changes, and injection locations create unpredictable turbulence variations within an operating pipeline. Such disturbances in susceptible pipelines may precipitate sudden changes in the ability of the working fluid to maintain uniform transport of the moving sediment bed on the pipe floor, and severely accelerated settling of solid materials may result; thus, accelerated corrosion is possible. Common characteristics of most susceptible pipelines are identified below:
• Large diameter (> 0.4 m) • Higher-density petroleums (> 900 kg/m3) • Moderate-low flow rates (< 1.2 m/s) • Measurable base sediment load (even as low as ~ 0.05%)
Pipelines exhibiting these characteristics should have a selection of direct examination sites based on the following flow disturbance creating fittings:
• Valves (downstream joint or 5 m minimum) • Diameter increases (downstream joint or 5 m minimum) • Overbends (5 m downstream, beginning at overbend) • Injection points (5 m downstream, beginning at injection point)
NACE International

SP0208-2008
Alternative Models A number of additional rules or models to describe the likelihood of solids accumulation in oil-packed pipelines are available. Every model has its limitations; therefore, when a particular model is used, its characteristics and limitations should be understood. Only some simple models are described; more complex models are not necessarily better. Shadley Model38The Shadley model is based on the analysis of corrosion pattern to provide guidelines for flow rates below which solids are expected to accumulate.
NACE International
_____________________________________
Teevens Model29,30
This model predicts where solids deposition locations are most likely to occur by calculating the solids depositional velocity of the material being accumulated. It predicts solids accumulation as a function of distance and elevation change over discrete distances, as dictated by global positioning satellite (GPS) interval data collected and input into the model. The model does not predict the cumulative amount of the material, nor does it attempt to predict underdeposit corrosion rate behavior at this time.
___________________________________
Appendix D: Corrosion Rate Models
(Nonmandatory)
This appendix is considered nonmandatory, although it may contain mandatory language. It is intended only to provide supplementary information or guidance. The user of this standard is not required to follow, but may choose to follow, any or all of the provisions herein.
A corrosion rate model may be used to identify locations for detailed examination instead of determining the probability of corrosion distribution. Several models to predict internal corrosion of oil and gas pipelines are presented in this appendix. This list is not exhaustive. In addition, several commercial software packages that are largely based on these models are available. Adams Model39The Adams model, developed from the operating conditions of condensate wells, can be used to predict corrosion rates in gas condensate wells based on operating conditions, temperatures, and flow rates. Anderko Model40,41,42
This comprehensive model has been developed to calculate the corrosion rates of carbon steels in the presence of CO2, H2S, and brine. It combines a thermodynamic model (that provides realistic speciation of aqueous systems) with an electrochemical model (based on partial cathodic and anodic processes on the metal surface). The partial processes taken into account by this model include the oxidation of iron and reduction of hydrogen ions, water, carbonic acid, and hydrogen sulfide. Crolet Model43,44
The Crolet model predicts the probability of corrosion in oil wells. It is based on a detailed analysis of field data on CO2 corrosion from two oilfield operations. In the Crolet model, the parameters that influence potential corrosiveness are pH level, carbonic acid (H2CO3), CO2, acetic acid, temperature, and flow rate.
Dayalan Model45
This model consists of a computational procedure and a computer program to predict the corrosion rates of carbon steel pipeline caused by CO2-containing flowing fluids in oil and gas field conditions. The computational procedure is based on a mechanistic model for CO2 corrosion and is developed from basic principles. The model takes into account the CO2 corrosion mechanism and the kinetics of electrochemical reactions, chemical equilibrium reactions, and mass transfer. De Waard and Milliams Model46,47,48
The model developed by de Waard and Milliams is the most frequently cited model for evaluating internal corrosion. The first version of this model was published in 1975, and it has been revised three times since then. In the earlier versions of the model, there was no significant consideration of the effects of liquid flow velocity on the CO2 corrosion rate. The corrosion reaction was assumed to be activation controlled, although the observed corrosion rates were, in some cases, about twice the rate predicted. Therefore, a somewhat empirical equation was developed to describe and predict the effect of the flow rate. In 1995, the effect of carbides on the CO2 corrosion rate was addressed. Mishra Model49
Corrosion of steel in CO2 solutions is considered to be a chemical-reaction-controlled process. In the Mishra model, a corrosion rate equation was derived on the basis of fundamental reaction rate theory and was then compared with empirically determined relationships reported in the literature. The prediction of this model is similar to the
31

SP0208-2008
empirically developed models; the model, however, accounts for the effects of steel microstructure and the flow velocity of the solution on the corrosion rate. The application limit for this model occurs when the corrosion process begins to be diffusion controlled, usually after the formation of a stable corrosion-product scale on the steel surface. Nesic Model50,51,52Nesic uses a theoretical approach by modeling individual electrochemical reactions occurring in a water-CO2 system. The processes modeled in this system are the electrochemical reactions at the metal surface and the transport processes of all the species in the system, including H+, CO2, H2CO3, and Fe2+. The Nesic model requires the following inputs: temperature, pH, CO2 partial pressure, oxygen concentration, steel, and flow geometry. Version 2 of the Nesic model also predicts the equivalent of a scaling tendency (that is, the ratio between the precipitation rate and the corrosion rate). Nyborg Model53,54,55
Nyborg integrated the 1993 and 1995 versions of the de Waard and Milliams model with a commonly used three-phase fluid-flow model. The temperature, pressure, and liquid flow velocity profiles derived from this fluid-flow model are used to calculate CO2 partial pressure, pH, and corrosion rate profiles along the pipeline.
Oddo Model56
The Oddo model uses an iterative approach to predict the corrosion rate. The model accounts for protective films formed by the deposition of mineral scales. Initially, the program calculates the corrosion rate, assuming that there is no scale on the metal surface. Papavinasam, et al. Model57,58
The Papavinasam, et al. model predicts internal pitting corrosion of oil and gas pipelines. The model accounts for the statistical nature of the pitting corrosion, predicts the growth of internal pits based on the readily available operational parameters from the field, and includes the pit
32
growth rate driven by variables that are not included in the model. It also considers the variation of the pitting corrosion rate as a function of time and determines the error in the prediction. Pots Model59
This mechanistic model predicts the CO2 corrosion rate and the effects of fluid flow. The model, also referred to as the Limiting Corrosion Rate (LCR) model, provides a theoretical upper limit for the corrosion rate based on the assumption that the rate determining steps are the transport and production of protons and carbonic acid in the diffusion and reaction boundary layers. Srinivasan Model60
The basis of the Srinivasan model is the de Waard and Milliams relationship between CO2 and corrosion rate, but additional correction factors are introduced. The first step in this approach is a computation of the system pH. The dissolved CO2 (or H2S) that contributes to pH is determined as a function of acid gas partial pressures, bicarbonates, and temperature. In addition to pH reduction, the Srinivasan model takes into account the role of H2S as a general corrodent, as a protective film former, and as a pit initiator. SSH Model61
The SSH model is a worst-case scenario model, derived mainly from laboratory data below 100 °C and from a combination of laboratory and field data at temperatures above 100 °C. Teevens Model30,31,32,62,63
This mass-transfer model is capable of yielding a general corrosion rate for uninhibited corroding multiphase or two-phase pipeline systems, in which O2, CO2, and H2S contribute to corrosion of carbon steel pipes. The gas-liquid flow model was updated mainly from the work of Petalas and Aziz, Taitel and Dukler, and Barnea. The flow model predicts the flow pattern, liquid holdup, pressure drop, and friction losses, and it calculates gas and liquid velocities.
NACE International NACE International ISBN 1-57590-221-4