standardised impact metrics for the off-grid energy sector · pdf filestandardised impact...
TRANSCRIPT
Standardised impact metrics
for the off-grid energy sector
Version 2.0: January 2016
©So
larA
id/P
atri
ck B
entl
ey
aligned with

2

3
Contents
Contents .................................................................................................................................................. 3
1. Summary ......................................................................................................................................... 4
2. Introduction and background ......................................................................................................... 5
3. Alignment with IRIS ......................................................................................................................... 7
4. Status update .................................................................................................................................. 8
5. The Working Group ......................................................................................................................... 9
6. GOGLA impact metrics .................................................................................................................. 12
7. Coefficient calculations and default values................................................................................... 23
8. Metric table ................................................................................................................................... 41
9. Next steps ...................................................................................................................................... 42
10. Feedback and review process ....................................................................................................... 47
11. Resources ...................................................................................................................................... 48

4
1. Summary
In 2013, the Global Off-Grid Lighting Association (GOGLA) convened a Working Group on impact
metrics to produce a harmonised industry standard for reporting on social impact for consistent use
across the sector. At the time, there was no standard for calculating impact in the sector and as a
result different organisations use different approaches or were limited in their capacity to
report/communicate on this. The use of different approaches undermines credibility of results and
prevents industry-wide aggregation. Credible benchmarking is important for policy discussions,
advocacy efforts, and other initiatives where robust impact figures influence sector-related support
and decisions.
The vision of these metrics is to accurately describe impacts in a harmonised and comparable
manner. The mission is to attract investment, working capital, and regulatory support for the off-
grid lighting industry that will help the sector to scale.
GOGLA members reporting on impact where metrics are GOGLA harmonised metrics are available
should use this way of reporting.
1) Other organisations can utilise this set of core metrics for reporting and communications.
2) Broadcasting results: Organisations and coalitions that adopt the GOGLA framework can
speak with a unified language of positive change to investors, policymakers, and other market
supporters.
The table below summarises the harmonised framework metrics which are detailed in the rest of
this document.
Metrics
1ai. Improved energy access, historically
1aii. Improved energy access, currently
1b. Basic energy needs met
2. Livelihoods supported
3. Status quo lighting source no longer in use
4a. Household change in available hours of light
4b. Household change in available light output
5a. Savings on energy-related expenditure, per household
5b. Savings on energy-related expenditure, in aggregate
6. Greenhouse gas emissions offset (currently not in use)

5
2. Introduction and background
In 2013, the Global Off-Grid Lighting Association (GOGLA) convened a Working Group on impact
metrics to produce a harmonised industry standard for reporting on social impact for consistent use
across the sector.
At the time of creating the group, there was no standard for calculating metrics in the sector and as a
result different organisations use different approaches or were limited in their capacity to
report/communicate on this. The use of different approaches undermines credibility of results and
prevents industry-wide aggregation. Credible benchmarking is important for policy discussions,
advocacy efforts, and other initiatives where robust impact figures influence sector-related support
and decisions. At the same time credibility can only be achieved by applying harmonised approaches,
avoiding overly optimistic hypotheses, prevention of double counting.
This report shares GOGLA’s harmonised impact metrics for the off-grid energy sector and contains
detailed information on the objectives, the Working Group, the metrics and coefficients, and the next
steps.
The vision of these metrics is to accurately describe impacts in a harmonized and comparable
manner. The mission is to attract investment, working capital, and regulatory support for the off-
grid lighting industry that will help the sector to scale.
A key challenge to building standardised social impact metrics is that many of the benefits from off-
grid lighting are difficult to track directly: for example, improvements in educational, health, and
livelihood outcomes for the people who adopt improved lighting. This version 2.0 includes those
metrics that are 1) relatively easy to track, 2) linked through research and practical experience to the
critical development outcomes. Version 1.0 was shared and released at the GOGLA AGM in
Amsterdam in June 2015. Since then, the group have taken on board feedback and inputs from
members as well as test running the metrics with members who kindly volunteered, and as a result
some adjustments and updates have been made.
The way these metrics can be used by the industry and broader sector are:
3) Adopting the GOGLA framework: Organisations including manufacturers, distributors,
multilateral programs, and industry groups (like GOGLA) can adopt this set of core metrics as
a key piece of external reporting for programme outcomes. Any reporting of impact along the
dimensions included in the framework should be based on the harmonised approach to
ensure consistency of message.
4) Going beyond the GOGLA framework: There are a range of development outcomes that may
be specific to a particular region or product, or may be difficult to track in aggregate. It is
encouraged that users go beyond the framework and report these as well, to build the case
for off-grid power and increase the knowledge base. The GOGLA framework is meant as a
foundation, not a ceiling, on social impact reporting.
5) Broadcasting results: Organisations and coalitions that adopt the GOGLA framework can
speak with a unified language of positive change to investors, policymakers, and other market
supporters.

6
The stages for the metrics process are:
→ produce agreed-upon, third party reviewed methodologies for calculating a set of customer-
and business-oriented metrics (completed)
→ develop minimum standards for reporting on these metrics (completed)
→ align to existing global metrics to ensure use outside of the sector (completed)
→ establish a process for voluntary member reporting to GOGLA, for public dissemination
(completed in part)
The table below summarises the harmonised framework that is detailed in the rest of this document.
Black coefficients are to be inputted by members, orange coefficients have default values – outlined
in detail later in this document.
GOGLA social impact tracking metrics version 2.0
Metric Formula
1ai. Improved energy access, historically S * SL * Srep* HH
1aii. Improved energy access, currently (Sn,j) * SL * Srep* HH
1b. Basic energy needs met (Sn,j) * SL * Srep* Fse4all
2. Livelihoods supported (Sn,j * SL * B) + L
3. Status quo lighting source no longer in use Sn,j * SL * RR
4a. Household change in available hours of light (%) 100% * (([average]UR / SQ.UR) – 1))
4b. Household change in available light output (%) 100% * (([average]ULU / SQ.ULU) – 1))
5a. Savings on energy-related expenditure, per household (SQ.UC * RR * ULi) - UP
5b. Savings on energy-related expenditure, in aggregate S * SL * ((SQ.UC * RR * ULi) – UP))
6. Greenhouse gas emissions offset S * SL * RR * SQ.UGHG - (S * UP * UGHG / ULi)
where:
S = number of units sold
SL = discount for loss
Srep = discount for repeat sales
HH = average household size
Sn,j = number of units sold within lifespan of products (year n-j to n)1
Fse4all = Tier 1 access factor from SE4All framework
B = percentage of customers using solar products for business
L = number of supply chain livelihoods supported
RR = average replacement ratio of status quo lighting for solar
[average]UR = average run-time of solar product
SQ.UR = average usage per day of status quo product
[average]ULU = average lumens of solar product
SQ.ULU = average lumens of status quo product
SQ.UC = average annual operating cost of status quo source
ULi = average solar product lifetime
UP = average retail price of solar product
SQ.UGHG = average annual greenhouse gas emission volume of status quo source
UGHG = average embodied greenhouse gas of solar product
1 Lifespan of product is calculated as warranty period x 1.5

7
3. Alignment with IRIS
While the metrics have been reviewed by external experts, we recognised that aligning with globally
recognised standards may help to enhance credibility and respect for the reporting framework. As a
result we have partnered with the IRIS Initiative at the Global Impact Investing Network (GIIN).
The IRIS Initiative will promote and support these metrics. The coordination between IRIS and GOGLA
aims to further advance the use of standardised metrics that will strengthen efficiency, credibility, and
consistency in the reporting process. The Off-Grid Energy Metrics Set will be a resource for investors
and other stakeholders interested in using IRIS metrics to better understand the performance of their
off-grid lighting investments.
IRIS is an initiative of the Global Impact Investing Network (GIIN). The GIIN is a non-profit organization
dedicated to increasing the scale and effectiveness of impact investing. IRIS is the catalog of generally-
accepted performance metrics that leading impact investors use to measure social, environmental,
and financial performance, evaluate deals, and communicate performance. IRIS is used by leading
investors in the industry, including impact managers that represent more than $10 billion in impact
assets under management. IRIS is a free resource available atiris.thegiin.org. The IRIS website receives
approximately 5,800 unique visitors per month and is used in nearly 150 countries worldwide.

8
4. Status update
The first phase of the group’s work focused on creating conservatively constructed calculations for
modelling a set of priority metrics, which all GOGLA members and other companies will be encouraged
to report on. The underlying calculations are based on assumptions, analysis, and other inputs from
the Working Group’s members and other external experts in the field.
So far, the group has:
identified priority impact metrics relevant to GOGLA members for global reporting
determined metrics that could be developed now and others that will require more work to
provide credible calculations for
established appropriate formulae for calculating metric values
sourced available data to propose coefficient default values, with references, assumptions
and limitations outlined
circulated to external advisors for input/validation and adapted metrics and communications
based on this
finalised proposed methodologies for priority metrics
finalised an overview document which outlines all metrics, formulas, coefficients and sources,
as well as phase 2 work
shared the metrics (version 1.0) with GOGLA members for input and feedback
made adjustments to the metrics based on GOGLA member feedback
aligned with global standard metrics
created a process for reporting
This document was developed to share this progress to:
→ enable organisations to start using these standardised metrics for calculating impact
→ share with a wider audience the extent of the work conducted and further align with relevant
organisations, where possible
→ request GOGLA members to adopt this way of calculating and communicating impact for
metrics included
9
5. The Working Group
→ Chair: Kat Harrison, Acumen; (October 2013 – present)
Kat is Associate Director – Impact at Acumen (formerly Director of Research & Impact at SolarAid).
Kat leads the impact work on Acumen’s energy portfolio and developed and managed the award-
winning research and impact work at SolarAid – housing some of the most comprehensive data
on rural energy access on Africa. Kat is managing multiple large-scale research projects, including
the first randomised control trial into the impacts of solar lights on poverty alleviation with
research partners, and is building links with others to enhance learning and ultimately
effectiveness for the off-grid sector. Kat was recognised as a Young Leader in Renewable Energy
by Recharge, and was finalist for the Red magazine Women of the Year award for her work. Kat
previously set up the Monitoring and Evaluation system at Riders for Health and worked in M&E
and programme management for the United Nations World Food Programme in Malawi.
→ Co-chair: Peter Alstone, Lighting Global; (October 2013 – present: co-chair since March 2015)
Peter is a contributor to the Lighting Global project, a World Bank Group effort to catalyse
market-based approaches for off-grid lighting. Through Lighting Global he has helped coordinate
the global Quality Assurance framework, has lead and advised on market research efforts, and
has worked on policy development and outreach to build coalitions of support for off-grid
solar. Peter also manages and contributes to research projects focused on the relationship
between information technology and energy systems both on- and off-grid. His core research is
currently supported through an ITRI-Rosenfeld postdoctoral fellowship at Lawrence Berkeley
National Laboratory. He completed his Ph.D work in 2015 at the University of California, Berkeley,
in the Energy and Resources Group.
→ Coordination: Johanna Diecker GOGLA
Johanna Diecker is GOGLA’s project manager. Besides project management, she is also
responsible for the coordination of the social impact and policy and regulation Working Groups.
Before joining GOGLA in April 2013, Johanna had been working for the GIZ where she was actively
involved in the provision of advisory services to the German Federal Ministry for Economic
Development and Cooperation regarding ICT4D. Earlier on she was trusted with different project
management responsibilities working for a development consultancy. She holds bachelor
degrees in development studies and political science, as well as a master degree in political
sciences from the University of Vienna.
→ Member: Gerhard Mair, OSRAM; (October 2013 – present)
Gerhard works at lighting company OSRAM as a project manager for sustainability projects. He
has been active in the off-grid lighting area since 2008. Starting with a socio-economic impact
study, he moved to project implementation and product development.

10
→ Observer/advisor: Micah Melnyk, World Bank; (October 2014 – present)
Micah Melnyk works for the World Bank as a consultant on solar energy in Africa, including on
the Lighting Africa program. Among other elements, Micah’s work program includes work on
evaluating the impact of Lighting Africa activities. He formerly worked for Global Village Energy
Partnership (GVEP) International in Uganda, Kenya and Tanzania, where he led a research study
on the impact of access to enhanced mobile phone charging on mobile phone usage, and prior to
that he spent a number of years as a senior analyst on climate and energy issues for the
Government of Canada. Micah completed his MPhil at the University of Cambridge, UK, where
his dissertation examined the impact that different business models to deliver off-grid solar have
on sustainable development outcomes, and holds a BSc. Civil Engineering and BA. Economics
from Queen’s University, Canada.
→ Observer/advisor: Gunnar Wegner, GIZ; (September 2014 – present)
Gunnar works at Energising Development, a global initiative on energy access funded by various
donor organisations. Gunnar has working experience in a range of African and Latin American
countries. In EnDev, Gunnar is in charge of monitoring, solar technologies, and the Latin American
portfolio.
→ Member: Cas Van Kleef, WakaWaka; (May 2015 – present)
Cas works as Impact Manager at WakaWaka. He has been with WakaWaka for almost three years
and has fulfilled different roles in the company and WakaWaka Foundation. Currently he is
responsible for WakaWaka donation-campaigns, supporting our local NGO-projects and partners
and monitoring & communicating about our impact
Past contributors
→ Co-chair: Darin Kingston, d.light; (October 2013 - February 2015)
→ Member: Elizabeth Pion, TOTAL; (October 2013 – July 2015)
More information on GOGLA Working Groups
The GOGLA Working Groups provide a platform to discuss issues and develop activities aimed at
specific sector topics, building upon the experience and expertise of our members. Their objective is
to generate a common approach to the challenges faced by the industry in promoting efficient off-
grid lighting solutions. Working Groups are composed of GOGLA members, and may be strengthened
by international experts from other stakeholders including governments, civil society, academia,
research organizations, international agencies and the private sector.
Working Groups are set up and defined in their scope by the Board of Directors (BoD). They can be
either of permanent or ad hoc character. The WG chairs are nominated by the BoD from among
GOGLA members. As a rule, natural persons are appointed as chairs, not the company they are

11
working for. The chairs and co-chairs are developing annual work plans for their respective Working
Group in conjunction with group members. The work plan and progress made will be presented
regularly to the BoD and the Advisory Board.
Each Working Group is open to all GOGLA members. Members can sign up for each Working Group by
sending an email to the GOGLA office. External experts may be invited to join the Working Group at
the discretion of the chairs. If a formal decision is required, only GOGLA members are eligible to vote
(one vote per member organisation).
To operate on a legal basis (anti-trust laws) each Working Group needs a minimum of three members.
The same applies for member presence in meetings or telephone conferences. In addition a neutral
person of the GOGLA office needs to be present in each meeting. Each Working Group will be
coordinated by a GOGLA staff member.
Working Group meetings (in person or via telephone conference) take place as the chairs and the coordinator see fit but at least three times a year.
All GOGLA members have at all times the right to get access to Working Group documents.
Furthermore, an update on Working Group activities will be shared on a regular basis on the GOGLA
website as well as via emails to all GOGLA members.
Please note, the Working Group members are unpaid for this position, and on the whole, have full
time jobs outside of this role.
For full GOGLA Working Group guidelines (last adopted 21st July 2015), please contact the GOGLA
office.
The external reviewers
The Working Group wishes to thank the following people who provided helpful expert reviews and
comments.
→ Ellen Carey, GIIN
→ Kathryn Conway, UNEP / en.lighten
→ Dr. Evan Mills, Lawrence Berkeley National Laboratory
→ Jennifer Tracy, iiDevelopment
→ Olola Vieyra, UNEP/ en.lighten
→ Dr. Arne Jacobson, Lighting Global / Humboldt State University
→ Michael Scholand, UNEP/ en.lighten
→ Dr. Nicholas Lam, University of Illinois at Urbana-Champaign

12
6. GOGLA impact metrics
The metrics that were identified as priority, relevant, and measurable, at this stage were:
1. Lives impacted
a. Improved energy access
i. Improved energy access, historically
ii. Improved energy access, currently
b. Basic energy needs met
2. Livelihoods supported
3. Status quo lighting sources no longer in use
4. Change in available lighting service
a. Household change in available hours of light
b. Household change in available light output
5. Money saved
a. Savings on energy-related expenditure, per household
b. Savings on energy-related expenditure, in aggregate
6. 6. Greenhouse gas emissions offset
The following pages outline for each priority metric:
→ Definition
→ Assumptions
→ Usefulness of metrics/message to share
→ Calculation
→ Improvements planned for future work
The metrics are modelled off unit sales and other product information provided by GOGLA members,
which will be inserted into formulas to calculate. All metrics apply to impact in the developing world
only. Therefore only units sold in the developing world are included. The assumptions and calculations
for coefficients that make up the metric formulas are outlined in the next section.

13
Metric 1ai. Improved energy access, historically
Unit of measurement Number of people
Definition Cumulative number of people who have ever lived in a household with an
improved energy source (i.e. solar)
Usefulness of metric Enables us to show the scale of impact at the household level
Message to share The pico-solar industry has helped to improve energy access for x people
Calculation
S * SL * Srep* HH
Number of units sold (S) x discount for loss (SL) x discount for repeat sales
(Srep) x household size (HH)
Assumptions
- Solar products are used in the home
- Solar products are used by all members in the household
- Solar products are being used in households with a ‘worse’ source of
energy before
Other notes
In this context, ‘improved’ is used to reflect lighting and energy provided
by appropriate (less expensive, less dangerous, better quality light)
technologies such as solar, instead of status quo technologies such as
kerosene lanterns, battery lights, etc.
Future improvements Discounts for assumptions i.e. products used outside the home and intra-
household usage across all members.

14
Metric 1aii. Improved energy access, currently
Unit of measurement Number of people
Definition Cumulative number of people who currently live in a house with an
improved energy source (i.e. solar)
Usefulness of metric Enables us to show the scale of impact at the household level for those
currently using
Message to share The pico-solar industry is helping to improve energy access for x people
Calculation
(Sn,j) * SL * Srep* HH
Number of units sold in year n-j to n (Sn,j) x discount for loss (SL) x discount
for repeat sales (Srep) x household size (HH), where year n is current year
and each product model lasts an average of j years.
Assumptions
- Solar products are used in the home
- Solar products are used by all members in the household
- Solar products are being used in households with a ‘worse’ source of
energy before
Other notes
In this context, ‘improved’ is used to reflect lighting and energy provided
by appropriate (less expensive, less dangerous, better quality light)
technologies such as solar, instead of status quo technologies such as
kerosene lanterns, battery lights, etc.
Future improvements Discounts for assumptions i.e. products used outside the home and intra-
household usage across all members.

15
Metric 1b. Basic energy needs met
Unit of measurement Number of people
Definition Number of people with Tier 1 energy access currently, based on the SE4All
Global Tracking Framework
Usefulness of metric
Adds depth of impact to the scale at the customer level and allows for
global harmonisation across the range of energy access from pico-solar to
reliable grid access
Message to share The pico-solar industry is helping to meet the basic energy needs of x
people
Calculation
(Sn,j) * SL * Srep* (Fse4all)
(Result from Metric 1aii) number of units sold in year n-j to n (Sn,j) x
discount for loss (SL) x discount for repeat sales (Srep) x Tier 1 factor from
SE4All framework (Fse4all), where the reduction factor is based on number
of lumen-hours of lighting service and watt-hours of device recharging
available on a typical day.
Assumptions - See SE4All Global Tracking framework
Other notes
Future improvements Continued engagement in the maintenance and utilisation of the SE4All
Global Tracking Framework.
16
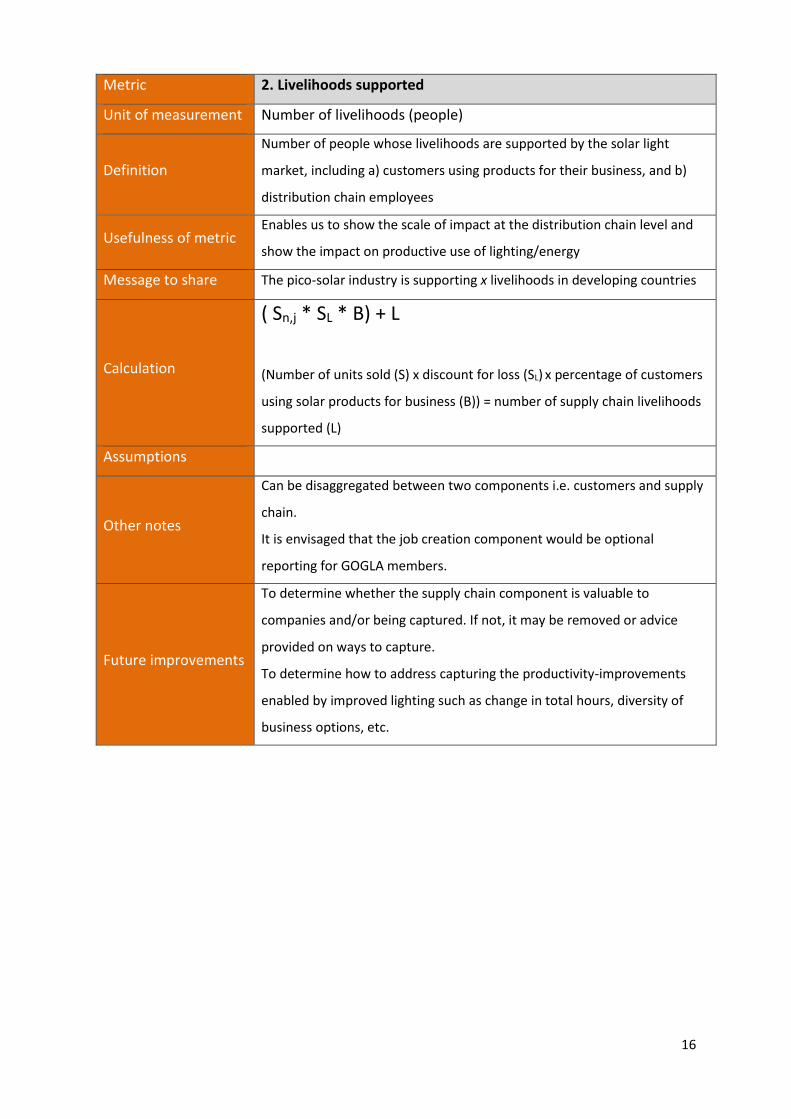
Metric 2. Livelihoods supported
Unit of measurement Number of livelihoods (people)
Definition
Number of people whose livelihoods are supported by the solar light
market, including a) customers using products for their business, and b)
distribution chain employees
Usefulness of metric Enables us to show the scale of impact at the distribution chain level and
show the impact on productive use of lighting/energy
Message to share The pico-solar industry is supporting x livelihoods in developing countries
Calculation
( Sn,j * SL * B) + L
(Number of units sold (S) x discount for loss (SL) x percentage of customers
using solar products for business (B)) = number of supply chain livelihoods
supported (L)
Assumptions
Other notes
Can be disaggregated between two components i.e. customers and supply
chain.
It is envisaged that the job creation component would be optional
reporting for GOGLA members.
Future improvements
To determine whether the supply chain component is valuable to
companies and/or being captured. If not, it may be removed or advice
provided on ways to capture.
To determine how to address capturing the productivity-improvements
enabled by improved lighting such as change in total hours, diversity of
business options, etc.

17
Metric 3. Status quo lighting sources no longer in use
Unit of measurement Number of status quo lighting sources
Definition
Number of status quo lighting sources, such as kerosene lanterns, candles,
battery torches, no longer in use because customers have replaced them
with solar lighting
Usefulness of metric Enables us to show the impact of diverting use of detrimental lighting
sources that have been replaced
Message to share
The pico-solar industry is contributing to the reduction of x expensive,
dangerous, polluting kerosene lanterns and other status quo lighting
sources
Calculation
Sn,j * SL * RR
Number of units sold (S) x discount for loss (SL) x replacement ratio of
status quo lighting for solar (RR)
Assumptions - Status quo lighting sources no longer used because of access to new solar
product
Other notes
Future improvements

18
Metric 4a. Household change in available hours of light
Unit of measurement % change in hours of available light per day per household
Definition Change in available hours of light per day from solar product, as compared
to typical usage time for status quo lighting, for average household
Usefulness of metric Enables us to show the potential quantity improvement (i.e. newly
available opportunity of light time) of solar over alternatives
Message to share
The pico-solar industry is enabling customers to experience up to x hours
or percentage more hours of light per day than kerosene lanterns or other
status quo lighting sources
Calculation
100% *[([average]UR / SQ.UR) – 1)]
Average run-time of solar product (UR) / average usage per day of status
quo product (SQ.UR), adjusted to be a change relative to status who,
reported as a percentage.
Assumptions - People use solar product for maximum time available.
Other notes
GOGLA will calculate geometric averages based on data provided so that
there is no distortion of averages and so that weighting occurs at both
organisational and aggregate levels. Run-time will be based on a full solar
charge.
This metric compares different things: usage of status quo lighting and
available hours (run-time) of solar product. The reason for this is that it is
recognizing the potential for enabling households to change the number of
hours light that is available to them.
When this metric is aggregated between products and over time, the mean
change for the portfolio should be based on a weighted average, with
weight by the number of persons with improved access (metric 1a).
Future improvements
To determine the best way to incorporate decreased run-time for products
which also charge mobile phones.
To determine how to capture customers’ actual usage in addition to this
metric, which speaks to potential usage.

19
Metric 4b. Household change in available light output
Unit of measurement % change in available lumens per household
Definition Change in available light output (lumens) from solar product, as compared
to typical output for status quo lighting, for average household
Usefulness of metric Enables us to show the potential quality improvement (i.e. newly available
opportunity of light brightness) of solar over alternatives
Message to share
The pico-solar industry is enabling customers to experience brighter
lighting; an average x lumens more than kerosene lanterns or other status
quo lighting sources
Calculation
100% *[([average]ULU / SQ.ULU) – 1)]
Average lumens of solar product (ULU) / average lumens of status quo
product (SQ.ULU), adjusted to be a change relative to status who, reported
as a percentage.
Assumptions - Additional light output is as a direct result of access to new product.
Other notes
GOGLA will calculate geometric averages based on data provided so that
there is no distortion of averages and so that weighting occurs at both
organisational and aggregate levels.
When this metric is aggregated between products and over time, the mean
change for the portfolio should be based on a weighted average, with
weight by the number of persons with improved access (metric 1a).
Future improvements
To determine the best way to incorporate decreased run-time for products
which also charge mobile phones.
To determine how to capture customers’ actual usage in addition to this
metric, which speaks to potential usage.

20
Metric 5a. Savings on energy-related expenditure per household
Unit of measurement US$ per household over lifetime of solar product
Definition The amount of money a household saves on lighting and phone charging
after purchase of a solar product
Usefulness of metric Enables us to demonstrate the financial benefit of solar at the household
level
Message to share
The pico-solar industry is enabling customers to save $x over the solar
product lifetime by replacing use of status quo alternatives for lighting and
phone charging
Calculation
(SQ.UC * RR * ULi) - UP
(Average annual operating cost of status quo source (SQ.UC) x replacement
ratio of status quo lighting for solar (RR) x average solar product lifetime
(ULi)) – average retail price of solar product (UP)
Assumptions - Uniform spending across product lifetime
Other notes
Takes into account product lifetime and cost.
Will be disaggregated between two components i.e. savings on lighting
cost and saving on mobile-phone charging cost.
Average solar product lifetime (ULi) and average retail price of solar
product (UR) will be based on an average of GOGLA member data.
When this metric is aggregated between products and over time, the mean
change for the portfolio should be based on a weighted average, with
weight by the number of persons with improved access (metric 1a).
Future improvements

21
Metric 5b. Savings on energy-related expenditure in aggregate
Unit of measurement US$ per households over lifetime of solar products
Definition The amount of money all households save on lighting and phone charging
after purchase of a solar product
Usefulness of metric Enables us to demonstrate the financial benefit of solar in aggregate
Message to share
The pico-solar industry is enabling customers to save $x over the solar
product lifetime by replacing use of status quo alternatives for lighting and
phone charging
Calculation
S * SL * ((SQ.UC * RR * ULi) – UP))
Number of units sold (S) x discount for loss (SL) x ((average annual operating
cost of status quo source (SQ.UC) x replacement ratio of status quo lighting
for solar (RR) x average solar product lifetime (ULi)) – average retail price of
solar product (UP))
Assumptions - Uniform spending across product lifetime
Other notes
Takes into account product lifetime and cost.
Includes historical savings of current and past customers (current = within
product lifetime; past = expected product lifetime expired) and includes
projected savings of current customers, through to expected lifetime of
solar product.
Will be disaggregated between two components i.e. savings on lighting
cost and saving on mobile-phone charging cost.
Average solar product lifetime (ULi) and average retail price of solar product
(UR) will be based on an average of GOGLA member data.
Future improvements
22
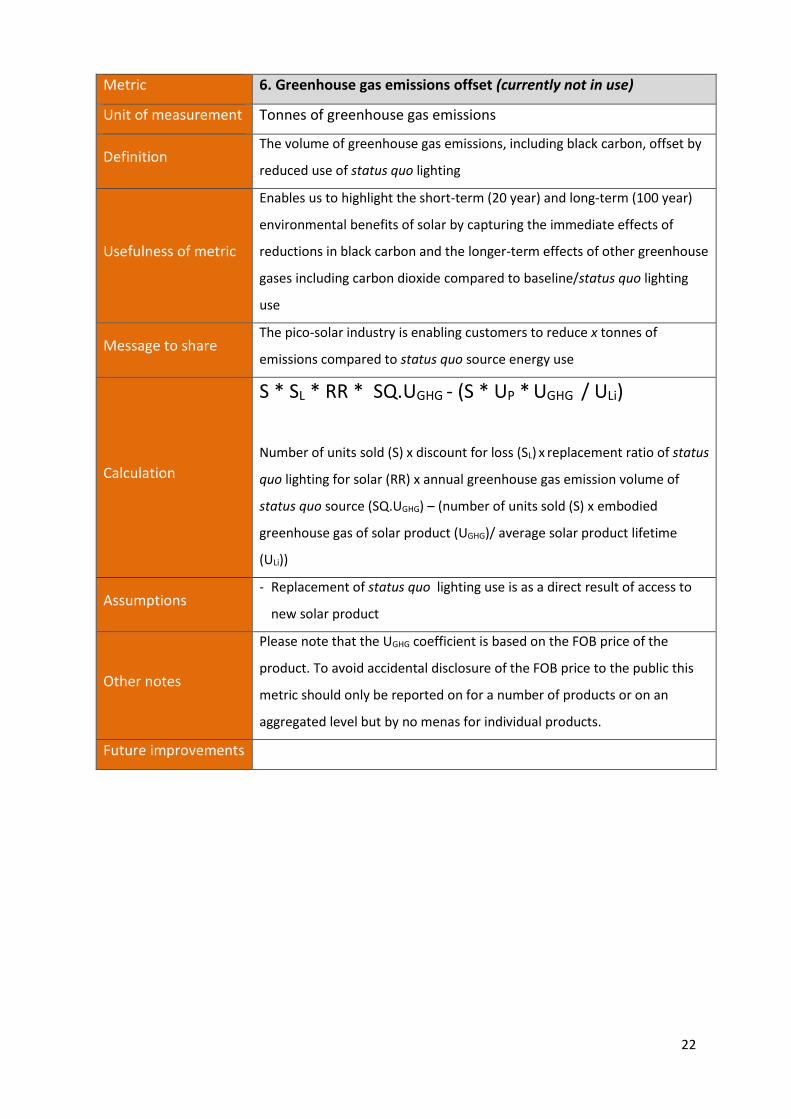
Metric 6. Greenhouse gas emissions offset (currently not in use)
Unit of measurement Tonnes of greenhouse gas emissions
Definition The volume of greenhouse gas emissions, including black carbon, offset by
reduced use of status quo lighting
Usefulness of metric
Enables us to highlight the short-term (20 year) and long-term (100 year)
environmental benefits of solar by capturing the immediate effects of
reductions in black carbon and the longer-term effects of other greenhouse
gases including carbon dioxide compared to baseline/status quo lighting
use
Message to share The pico-solar industry is enabling customers to reduce x tonnes of
emissions compared to status quo source energy use
Calculation
S * SL * RR * SQ.UGHG - (S * UP * UGHG / ULi)
Number of units sold (S) x discount for loss (SL) x replacement ratio of status
quo lighting for solar (RR) x annual greenhouse gas emission volume of
status quo source (SQ.UGHG) – (number of units sold (S) x embodied
greenhouse gas of solar product (UGHG)/ average solar product lifetime
(ULi))
Assumptions - Replacement of status quo lighting use is as a direct result of access to
new solar product
Other notes
Please note that the UGHG coefficient is based on the FOB price of the
product. To avoid accidental disclosure of the FOB price to the public this
metric should only be reported on for a number of products or on an
aggregated level but by no menas for individual products.
Future improvements

23
7. Coefficient calculations and default values
The below tables outline the definitions, assumptions and default value for coefficients that make up
the metric formulas.
Standard coefficients with default values
Coefficient SL : discount for loss
Definition The percentage of units sold that do not end up in customer homes, due to
pilferage, damage, loss, etc.
Default value 3%
Justification Conservative estimate by companies involved in the supply chain
Limitations - Not validated by any data
Sources GOGLA member companies
Relevant metrics
where coefficient is
used
1ai. Improved energy access, historically √
1aii. Improved energy access, currently √
1b. Basic energy needs met √
2. Livelihoods supported √
3. Status quo lighting source no longer in use √
4a. Household change in available hours of light √
4b. Household change in available light output √
5a. Savings on energy-related expenditure, per household
5b. Savings on energy-related expenditure, in aggregate
6. Greenhouse gas emissions offset √
Future improvements Collect better data from member companies or identify third party
research source.

24
Coefficient Srep : discount for repeat sales
Definition
The percentage of units sold that are repeated sales to a household with
solar already due to replacement (either fault product, or at the end of life)
or additional purchases while first product is still in use. Intention is to
avoid double-counting within number of people affected and to recognise
diminishing returns in impact of second product.
Default value 10%
Justification Conservative estimate by companies involved in the supply chain
Limitations - Not validated by any data
Sources GOGLA member companies
Relevant metrics
1ai. Improved energy access, historically √
1aii. Improved energy access, currently
1b. Basic energy needs met
2. Livelihoods supported
3. Status quo lighting source no longer in use
4a. Household change in available hours of light
4b. Household change in available light output
5a. Savings on energy-related expenditure, per household
5b. Savings on energy-related expenditure, in aggregate
6. Greenhouse gas emissions offset
Future improvements Collect better data from member companies or identify third party
research source.

25
Coefficient HH : household size
Definition The number of people living in a household
Default value
5
Companies wishing to report on country basis should use country data
from the world mapper database.
Justification High-quality external source for individual countries; the average for
developing countries in Asia as well as Africa is 5.
Limitations Data used are not updated since 2002
Sources - UNEP/GEF en.lighten initiative : Off-Grid Country Lighting Assessments
- www.worldmapper.org
Relevant metrics
1ai. Improved energy access, historically √
1aii. Improved energy access, currently √
1b. Basic energy needs met
2. Livelihoods supported
3. Status quo lighting source no longer in use
4a. Household change in available hours of light
4b. Household change in available light output
5a. Savings on energy-related expenditure, per household
5b. Savings on energy-related expenditure, in aggregate
6. Greenhouse gas emissions offset
Future improvements To be reviewed and updated periodically.

26
Coefficient B : percentage of customers using solar products for business
Definition
The percentage of customers using products for their businesses of
income-generating activities, for example, lighting a kiosk or offering
mobile phone charging.
Default value 10%
Justification Conservative average based on GOGLA member company and outside
research
Limitations
The definitions of productive use are contested (i.e., not full agreement
around what constitutes productivity), and the data to support estimates
of how products are used is relatively scarce.
Sources
- Brüderle, Anna. 2011. Solar Lamps Field Test in Uganda - Final Report.
- Adkins, Edwin, Sandy Eapen, Flora Kaluwile, Gautam Nair, and Vijay
Modi. 2010. Off-grid energy services for the poor: Introducing LED
lighting in the Millennium Villages Project in Malawi. Energy Policy,
38(2): 1087–97.
- Brüderle, Anna. 2012. Results from a PicoPV field test in the Amazon
and Chaco regions in Bolivia.
- d.light. Internal study with distribution partner, India. 2014.
- SolarAid internal data (2012-4) from follow-up interviews with solar
light customers in Kenya, Malawi, Tanzania and Zambia.
Relevant metrics
1ai. Improved energy access, historically
1aii. Improved energy access, currently
1b. Basic energy needs met
2. Livelihoods supported √
3. Status quo lighting source no longer in use
4a. Household change in available hours of light
4b. Household change in available light output
5a. Savings on energy-related expenditure, per household
5b. Savings on energy-related expenditure, in aggregate
6. Greenhouse gas emissions offset
Future improvements Collect better data from member companies or identify third party
research source.

27
Coefficient RR : replacement ratio of status quo lighting for solar
Definition The rate at which the purchase of an improved lighting source i.e. solar
product, reduces the use of status quo solutions such as kerosene lanterns
Default value 1:1
Justification Widely used in the sector, limited additional data available to date,
especially for candles and batteries.
Limitations
- Limited number of countries represented in data
- Some data sources assume all existing lighting sources are being
replaced, regardless of the new solar technology category e.g. task
lights versus home system
- No detailed study has identified how the performance of lighting
products is related to the replacement / offset effectiveness, and
different dynamics are expected when replacing fuels vs. dry cell
battery lighting.
Sources
- UNEP/GEF en.lighten initiative : Off-Grid Country Lighting Assessments
- Lighting Africa (2010), Solar Lighting for the Base of the Pyramid –
Overview of an Emerging Market.
- SolarAid (2012-4) internal data from interviews with solar light
customers in Kenya, Malawi, Tanzania and Zambia.
- UNFCCC (2012) Small-scale Methodology: Substituting fossil fuel based
lighting with LED/CFL lighting systems.
Relevant metrics
1ai. Improved energy access, historically
1aii. Improved energy access, currently
1b. Basic energy needs met
2. Livelihoods supported
3. Status quo lighting source no longer in use √
4a. Household change in available hours of light
4b. Household change in available light output
5a. Savings on energy-related expenditure, per household √
5b. Savings on energy-related expenditure, in aggregate √
6. Greenhouse gas emissions offset √
Future improvements Collect better data from member companies or identify third party
research source.

28
Coefficient SQ.UR : average usage per day of status quo product
Definition The number of hours of light per day provided by status quo lighting
products
Default value 4 hours
Justification High-quality external source
Limitations - Using kerosene lantern run-time as proxy for battery torches and
candles too
Sources
- UNEP/GEF en.lighten initiative : Off-Grid Country Lighting Assessments
- Lighting Africa (report and raw data)
- SolarAid (2012-4) research data from public surveys across Kenya,
Malawi, Senegal, Tanzania and Zambia.
Relevant metrics
1ai. Improved energy access, historically
1aii. Improved energy access, currently
1b. Basic energy needs met
2. Livelihoods supported
3. Status quo lighting source no longer in use
4a. Household change in available hours of light √
4b. Household change in available light output √
5a. Savings on energy-related expenditure, per household
5b. Savings on energy-related expenditure, in aggregate
6. Greenhouse gas emissions offset
Future improvements

29
Coefficient SQ.ULU : average lumen of status quo product
Definition The number of lumens generated by status quo lighting products
Default value 20
Justification Highest-quality external source data available
Limitations - Average lumen levels
- For battery torch, based on Kenya-specific data with small sample size
Sources
- 25 lumens (kerosene lantern)
- 12 lumens (candle)
- 25 lumens (battery torch)
- The global default value is 20 lumens, but more country-specific
defaults may be appropriate with different mixes of status quo lighting.
Kerosene lantern
- Evan Mills (2003). Technical and Economic Performance Analysis of
Kerosene Lamps and Alternative Approaches to Illumination in
Developing Countries. Lawrence Berkeley National Laboratory;
- Peter Alstone, Patricia Lai, Evan Mills, and Arne Jacobson. (2014) High
Life Cycle Efficacy Explains Fast Energy Payback for Improved Off-Grid
Lighting Systems. Journal of Industrial Ecology, March, n/a–n/a.
doi:10.1111/jiec.12117.
Candle
- Lighting Global. Light Emitting Diode (LED) Lighting Basics. Technical
Note Issue 0. January 2010.
Battery torch
- Mink, T., Alstone, Peter, Tracy, Jennifer & Jacobson, Arne. LED
Flashlights in the Kenyan Market: Quality Problems Confirmed by
Laboratory Testing. (Lighting Africa, 2010). at
http://lightingafrica.org/resources/technical-res.html
Relevant metrics
1ai. Improved energy access, historically
1aii. Improved energy access, currently
1b. Basic energy needs met
2. Livelihoods supported
3. Status quo lighting source no longer in use
4a. Household change in available hours of light √
4b. Household change in available light output √
5a. Savings on energy-related expenditure, per household
5b. Savings on energy-related expenditure, in aggregate
6. Greenhouse gas emissions offset
Future
improvements

30
Coefficient SQ.UC : average annual operating cost of status quo product
Definition The annual cost, in US$, of status quo lighting products, assuming daily use
at the run-time in SQ.UR
Default value
Average World: US$ 79.19 (weighted by population)
Average Africa: US$ 86.36
Average Asia and Middle East: US$ 70.86
Average Latin America & Caribbean: US$ 103.43
For reporting on country level, please refer to the UNEP/ en.lighten off-grid
lighting country assessments (monthly / annual consumption listed on page
two of each country assessment): http://map.enlighten-initiative.org/
Justification Highest-quality external source data available
Limitations
- UNEP: Data available is generalised to some extent due to a lack of
specific country-level data regarding critical inputs. Data is also biased
as UNEP does not differentiate between the frequency of use of
multiple types of lighting devices within the same household, nor the
number of hours that a device is used.
- Lighting Africa: Only data for five countries available. The survey data
does not distinguish between the frequency of use of multiple types of
lighting device within the same household, nor the number of hours
that a device is used so the values are not normalised to reflect
operating cost per hour of use; they only show average operating cost
for households or traders that use the device.
- SolarAid: Data is only Africa-focused (and in 6 countries).
Sources
- UNEP/GEF en.lighten initiative Off-Grid Country Lighting Assessments
- Lighting Africa (2011) The Off-Grid Lighting Market in Sub-Saharan
Africa: Market Research Synthesis Report.
- SolarAid (2012-4) research data from public surveys in Kenya, Malawi,
Senegal, Tanzania and Zambia.
Relevant metrics
1ai. Improved energy access, historically
1aii. Improved energy access, currently
1b. Basic energy needs met
2. Livelihoods supported
3. Status quo lighting source no longer in use
4a. Household change in available hours of light
4b. Household change in available light output
5a. Savings on energy-related expenditure, per household √
5b. Savings on energy-related expenditure, in aggregate √
6. Greenhouse gas emissions offset
Future improvements

31
Coefficient SQ.UGHG : average annual greenhouse gas emission volume of
status quo product, including black carbon
Definition
The amount of greenhouse gases, including black carbon, in tonnes of
carbon dioxide (or equivalent for black carbon), emitted annually by status
quo lighting products, assuming daily use at the run-time in SQ.UR
Default value 370 kg CO2e
Justification Highest-quality external source data available
Limitations - Data uses single-point estimate, doesn't help with diverse use rates,
etc.
Sources
- UNEP/GEF en.lighten initiative Off-Grid Country Lighting Assessments
2.6kg CO₂ per litre of kerosene (kerosene lantern)
3.81kg CO₂ per litre of wax (candle)
0.35kg CO₂ per battery (d-cell battery torch)
- Analysis incorporating findings on black carbon with support from the
author, Dr Nicholas Lam (original source below, details in the annex).
- Lam, N. L. et al. Household light makes global heat: high black carbon
emissions from kerosene wick lamps. Environmental science &
technology 46, 13531–13538 (2012).
Relevant metrics
1ai. Improved energy access, historically
1aii. Improved energy access, currently
1b. Basic energy needs met
2. Livelihoods supported
3. Status quo lighting source no longer in use
4a. Household change in available hours of light
4b. Household change in available light output
5a. Savings on energy-related expenditure, per household
5b. Savings on energy-related expenditure, in aggregate
6. Greenhouse gas emissions offset √
Future improvements Update figures when UNEP add black carbon to their analysis.
Execute analysis to recalculate for 20 year time horizon.

32
Coefficient UGHG : embodied greenhouse gas of solar product
Definition The amount of greenhouse gases, in tonnes, emitted in the marginal
production of off-grid lighting products
Default value 7.64 kg CO₂e per US$ FOB price
Justification
This is an assumption that applies a factor t the manufactured price,
applying an estimated sector-wide economic intensity. This is based on
work by Alstone et al on making detailed embodied energy estimates for
seven products.
Limitations
- Crude and does not distinguish between the varied actual emission
profiles for products.
- Intrinsically difficult to pin down a precise estimate for life-cycle
impacts because of the dynamic and connected nature of global
economies.
Sources
- Peter Alstone, Patricia Lai, Evan Mills, and Arne Jacobson. (2014) High
Life Cycle Efficacy Explains Fast Energy Payback for Improved Off-Grid
Lighting Systems. Journal of Industrial Ecology, March, n/a–n/a.
doi:10.1111/jiec.12117.
Relevant metrics
1ai. Improved energy access, historically
1aii. Improved energy access, currently
1b. Basic energy needs met
2. Livelihoods supported
3. Status quo lighting source no longer in use
4a. Household change in available hours of light
4b. Household change in available light output
5a. Savings on energy-related expenditure, per household
5b. Savings on energy-related expenditure, in aggregate
6. Greenhouse gas emissions offset √
Future improvements Add black carbon to analysis, if relevant.
Execute analysis to recalculate for 20 year time horizon.

33
Coefficient values to be inputted by members
Coefficient S : number of units sold
Definition The number of off-grid products sold in a given timeframe
Guidance
This coefficient aims to record the number of products sold since the
beginning of the GOGLA reporting member’s operations. Only products
sold in the developing world should be counted, and only those sold by the
GOGLA member reporting.
Relevant metrics
1ai. Improved energy access, historically √
1aii. Improved energy access, currently
1b. Basic energy needs met
2. Livelihoods supported √
3. Status quo lighting source no longer in use √
4a. Household change in available hours of light
4b. Household change in available light output
5a. Savings on energy-related expenditure, per household
5b. Savings on energy-related expenditure, in aggregate √
6. Greenhouse gas emissions offset √

34
Coefficient Sn,j: number of units sold within lifetime of product (year n-j to n)
Definition The number of off-grid products sold in lifetime of product (year n is
present, product model lifespan is j years)
Guidance
Lifetime of product is calculated as 1.5 x warranty period. This coefficient
aims to estimate the number of products still in working order, and
therefore, only products sold in the lifetime timeframe should be included.
Only products sold in the developing world should be counted, and only
those sold by the GOGLA member reporting.
Relevant metrics
1ai. Improved energy access, historically
1aii. Improved energy access, currently √
1b. Basic energy needs met √
2. Livelihoods supported
3. Status quo lighting source no longer in use
4a. Household change in available hours of light
4b. Household change in available light output
5a. Savings on energy-related expenditure, per household
5b. Savings on energy-related expenditure, in aggregate
6. Greenhouse gas emissions offset

35
Coefficient Fse4all : Tier 1 access factor from SE4All framework
Definition
Based on the SE4ALL Global Tracking Framework, an estimate of the
number of persons who achieve Tier 1 Access to electricity through stand-
alone pico-solar lighting systems. These are specific to each model of pico-
solar product that is offered in the market, with calculation based on
verified test results.
Guidance
This coefficient is the results of a global effort towards harmonization on
the definition for energy access classifications. These are based on specific
performance parameters for off-grid lighting products that will be reported
by companies and/or verified by third-party testing of particular products.
While a substantial improvement over binary (on/off grid) metrics this still
fails to capture all the nuance in energy access.
Relevant metrics
1ai. Improved energy access, historically
1aii. Improved energy access, currently
1b. Basic energy needs met √
2. Livelihoods supported
3. Status quo lighting source no longer in use
4a. Household change in available hours of light
4b. Household change in available light output
5a. Savings on energy-related expenditure, per household
5b. Savings on energy-related expenditure, in aggregate
6. Greenhouse gas emissions offset

36
Coefficient L : number of supply chain livelihoods supported
Definition The number of jobs created by GOGLA member through
supply/distribution chain
Guidance
The GOGLA member reporting should only include staff numbers i.e. direct
jobs created. Later iterations may try to capture jobs created in the sector,
as a result of GOGLA member activity, too.
Relevant metrics
1ai. Improved energy access, historically
1aii. Improved energy access, currently
1b. Basic energy needs met
2. Livelihoods supported √
3. Status quo lighting source no longer in use
4a. Household change in available hours of light
4b. Household change in available light output
5a. Savings on energy-related expenditure, per household
5b. Savings on energy-related expenditure, in aggregate
6. Greenhouse gas emissions offset

37
Coefficient [average]UR : average run-time of solar product
Definition This information can be provided by the company using Lighting Global
standards specification sheets, also made available for distributors.
Guidance
Preferred source is third-party verified performance by Lighting Global. If
this is not available, manufacturer-provided specification sheets can be
used. If there are multiple settings available, the geometric average of the
run times should be used as a representative run time (or, choose one of
the settings and use that one also for the average lumens metric, below).
Relevant metrics
1ai. Improved energy access, historically
1aii. Improved energy access, currently
1b. Basic energy needs met
2. Livelihoods supported
3. Status quo lighting source no longer in use
4a. Household change in available hours of light √
4b. Household change in available light output
5a. Savings on energy-related expenditure, per household
5b. Savings on energy-related expenditure, in aggregate
6. Greenhouse gas emissions offset

38
Coefficient [average]ULU : average lumens of solar product
Definition This information can be provided by the company using Lighting Global
standards specification sheets, also made available for distributors.
Guidance
Preferred source is third-party verified performance by Lighting Global. If
this is not available, manufacturer-provided specification sheets can be
used. If there are multiple settings available, the geometric average2 of the
run times should be used as a representative run time (or, choose one of
the settings and use that one also for the average run time metric, above).
Relevant metrics
1ai. Improved energy access, historically
1aii. Improved energy access, currently
1b. Basic energy needs met
2. Livelihoods supported
3. Status quo lighting source no longer in use
4a. Household change in available hours of light
4b. Household change in available light output √
5a. Savings on energy-related expenditure, per household
5b. Savings on energy-related expenditure, in aggregate
6. Greenhouse gas emissions offset
2 A geometric average allows for realistic typical sets of values to be developed in cases where there are multiplicative relationships between sets of possible values. In this case, the sets of possible brightness (lumens) and run time (hours) are bound by the available energy. Finding the normal (arithmetic) average brightness and run time independently leads (in many cases) to an impossible combination of brightness and run time. The
geometric average for two values (v1 and v2) is calculated by the following: 𝐴 = √(𝑣1 × 𝑣2) .

39
Coefficient ULi : average lifetime of solar product
Definition Expected lifetime of solar product based on 150% of warranty period.
Guidance The average useful lifetime of products will be assumed to be 1.5 times the
warranty period.3
Relevant metrics
1ai. Improved energy access, historically
1aii. Improved energy access, currently
1b. Basic energy needs met
2. Livelihoods supported
3. Status quo lighting source no longer in use
4a. Household change in available hours of light
4b. Household change in available light output
5a. Savings on energy-related expenditure, per household √
5b. Savings on energy-related expenditure, in aggregate √
6. Greenhouse gas emissions offset √
3 Among many difficult to estimate factors the ex-ante lifetime of off-grid lighting products is particularly challenging. The approach taken here is to use the warranty period as a proxy for lifetime, understanding that most products will fail after the warranty. As the market scales and data from the field are captured, better estimates of lifetime will be possible.

40
Coefficient UP : average retail price of solar product
Definition
GOGLA will calculate averages based on GOGLA member data provided so
that there is no distortion of averages and so that weighting occurs at both
organisation and aggregate levels.
Provided by reporting members. Members wish not to report on this
individually, however, it would be required through GOGLA reporting to
enable aggregation.
Guidance
Data protection is important to GOGLA. Therefore, an independent third
party will collect all data on behalf of GOGLA and only share aggregates.
The third party will treat company data with greatest care and not disclose
any sensitive data. GOGLA staff will not have access to individual company
data and will only report impact data on an aggregated level.
Relevant metrics
1ai. Improved energy access, historically
1aii. Improved energy access, currently
1b. Basic energy needs met
2. Livelihoods supported
3. Status quo lighting source no longer in use
4a. Household change in available hours of light
4b. Household change in available light output
5a. Savings on energy-related expenditure, per household √
5b. Savings on energy-related expenditure, in aggregate √
6. Greenhouse gas emissions offset

8. Metric table
Metric Formula Calculation 1ai. Improved energy access, historically S * SL * Srep* HH S * 3% * 10% * 5 1aii. Improved energy access, currently (Sn,j) * SL * Srep* HH (Sn,j) * 3% * 10% * 5 1b. Basic energy needs met (Sn,j) * SL * Srep* Fse4all (Sn,j) * 3% * 10% * Fse4all 2. Livelihoods supported (Sn,j * SL * B) + L (Sn,j * 3% *10%) + L 3. Status quo lighting source no longer in use Sn,j * SL * RR Sn,j * 3% * 1 4a. Household change in available hours of light 100% * (([average]UR / SQ.UR) – 1) 100% * (([average]UR / 4) – 1)
4b. Household change in available light output 100% * (([average]ULU / SQ.ULU) – 1) 100% * (( [average]ULU / 20) – 1)
5a. Savings on energy-related expenditure, per household (SQ.UC * RR * ULi) - UP (79.19 USD * 1 * ULi) - UP 5b. Savings on energy-related expenditure, in aggregate S * SL * ((SQ.UC * RR * ULi) – UP)) S * 3% * ((79.19 USD * 1 * ULi) – UP))
6. Greenhouse gas emissions offset (currently not in use) S * SL * RR * SQ.UGHG - (S * UP * UGHG / ULi)
S * 3% * 1 * 370 kg CO2e - (S * UP * 7.64 / ULi)
where:
S = number of units sold
SL = discount for loss
Srep = discount for repeat sales
HH = household size
Sn,j = number of units sold within lifespan of product (year n-j to n)
Fse4all = reduction factor from SE4All framework
B = percentage of customers using solar products for business
L = number of supply chain livelihoods supported
RR = replacement ratio of status quo lighting for solar
[average]UR = average run-time of solar product
SQ.UR = average usage per day of status quo product
[average]ULU = average lumens of solar product
SQ.ULU = average lumens of status quo product
SQ.UC = average annual operating cost of status quo source
ULi = average solar product lifetime
UP = average retail price of solar product
SQ.UGHG = annual greenhouse gas emission volume of status quo source
UGHG = embodied greenhouse gas of solar product
Black coefficients are to be inputted by members, orange coefficients have
default values.
9. Next steps
At this stage, the next steps for the Working Group at GOGLA are to collect the impact data from its
members and to share results with the wider public. This requires the development of a sound
reporting protocol and data collection structures. To ensure that collection and processing of sensitive
data such as sales figures abides to all anti-trust regulations, a third independent party must be
involved. In addition the underlying coefficients and assumptions should be further refined and
backed by additional research.
A reporting document has been created to enable members to calculate their own impact using this
framework, but as yet, this has not been incorporated into GOGLA member reporting. To have a copy
of this document, please do get in touch with GOGLA.
Specifically, the next steps are to:
1. develop a protocol for GOGLA member data reporting to allow for industry aggregates
2. develop tools for member reporting that are in-line with other reporting requirements
3. pilot the protocol and tools with GOGLA members and revise components where needed
4. finalise full package of protocol and tools
5. launch with all GOGLA members
6. design process for reviewing and updating (second phase)
A second phase may involve:
→ improvements in the calibre of inputs
→ strategies to ease GOGLA member reporting
→ development of additional metrics, especially ways to better measure and communicate the
impact of solar home systems
→ guidelines/support on measurement for GOGLA members interested in pursuing additional
specificity and accuracy through primary data collection
The guiding principle for both phases is to minimise the resource investment required to generate
credible impact reporting for individual members and the sector at large, and to ensure consistency
and rigour in the industry’s reporting.
In addition, the Working Group will help fill evidence gaps on impact data points that are critical for
the sector at large but cannot be addressed through individual GOGLA members or even the
membership as a whole due to logistical and resource constraints, for example, the impact of solar
lighting on household health, through coordinated efforts with partners and donors.

43
Reporting protocol
The reporting protocol will outline the format of reported data e.g. how to define a product run-time,
and tackle challenges such as double counting e.g. data collected from distributor and manufacturer.
At the same time the protocol must be designed in a way that it complies with all anti-trust regulations
and will define which stakeholder groups will get access to the data on which level.
To efficiently manage the collected data, the metrics developed by the Working Group will be
translated into a user-friendly web-based database that will allow analysis of the data on both an
aggregated and a disaggregated level. While only data on an aggregated level will be made available
to the wider public, the disaggregated level will enable participating companies to communicate their
individual impact. Individual impact can already be calculated through the document prepared by the
Working Group.
Communicating results
To ensure that results of the data collection reach the target audiences, such as policy makers and
investors, the outcomes will be communicated through various channels. A dedicated website will be
developed where data is visualised in a user-friendly way. The website will also allow browsing of data
and customising visualisation i.e. for a specific country or region or product type. This tool will multiply
the communication effort; users can customise the data needed to further disseminate it to other
target groups such as regional policy forums etc.
In addition to making the data publicly available, GOGLA will also present the data at international
events.
Refining data collection and expanding research
To keep the data up to date, and to improve its quality on an ongoing basis, further research is needed
in order to refine coefficients, close data gaps, and include further metrics of relevance in the data
collection.
The values of the coefficients have been identified by the Working Group after reviewing all available
data and going through an external expert review. However, reliable information to date is limited. To
verify the values for the coefficients, further research is necessary.

44
Funding restrictions
To carry out the above listed tasks, additional funding is needed. GOGLA would use the funding
especially to cover third party costs. This includes the development of a sound reporting protocol, the
analysis, processing, and aggregation of data, an interactive and web-based database, as well as the
design and production of communication materials.
In order to refine and expand data collection as well as close knowledge gaps, further field research is
necessary that also requires additional funding.

45
Priority metrics for development in phase 2 and research in pipeline
Through consultation, GOGLA members would like to see better data on the following impact areas. These data points are extremely difficult to collect through
individual organisations/companies due to the level of primary data collection and thus resources (financial and management) required. The Working Group will
therefore identify the best available references for each data point based on the available literature or, in cases where high quality evidence is lacking, advocate for
and possibly partner on new data collection initiatives through appropriate external institutions, such as development agencies.
Priority metrics to be developed Usefulness of metric Message to share Research in pipeline
Percentage of customers using
solar product for productive use
categories i.e. income
generation, study, etc.
To enable us to add depth of
impact on the customer level;
reflects a more developmental
approach that solar lights have the
potential to support.
The pico-solar industry can
support the productivity of X
people.
- SolarAid have incorporated questions around
this into their primary data collection activities
which span across Kenya, Malawi, Tanzania,
Uganda, and Zambia.
- d.light study in Uganda on home systems.
Results expected in 2015.
Change in value of spending on
lighting that remains in-country
(kerosene compared to off-grid
products)
To enable us to show national-level
impacts and support advocacy
efforts in reducing solar import
tariffs and potentially reducing
kerosene subsidies.
The pico-solar industry can
support national economic
development.
Change in education-related
impacts
To enable us to highlight the
educational benefits of solar.
The pico-solar industry has
secondary benefits for the
education sector.
- SolarAid are delivering a randomised control
trial study with Stanford University on this
impact area. Start date for pilot: September
2015.
Change in household income
levels
To enable us to show the longer-
term financial benefits of solar
The pico-solar industry can
support economic
development and poverty
reduction efforts.
- SolarAid have commissioned a randomised
control trial study to explore this topic,
specifically relating to solar lights impact on
poverty alleviation. The results will be available
in summer 2016 and the study is being carried
out in Kenya.

46
Change in health of household
members
To enable us to show the health
benefits of solar, in particular in
comparison to traditional lighting
i.e. kerosene.
The pico-solar industry has
secondary benefits for the
health sector.
- SolarAid have commissioned a pilot study,
alongside the study into poverty effects above,
to explore indoor air pollution from
traditional/status quo lighting and contribution
to health outcomes. Preliminary results will be
available in summer 2016.
- UNEP has published a report by Evan Mills on
health implications of traditional means of
lighting, see here.
- Reported health outcomes - d.light study in
Uganda on home systems. Results expected in
2015.
Change in quality of
life/empowerment
To enable us to share the more
qualitative benefits of solar.
The pico-solar industry can
support empowerment/
progress towards
development and/or enable
customers to enjoy a higher
quality of life.
- d.light study in Uganda on home systems.
Findings expected 2015.

47
10. Feedback and review process
Experts have been invited to review the above listed metrics. In addition, GOGLA encouraged and
welcomed feedback from its members and other stakeholders in the sector when version 1.0 was
released and shared in June 2015. Feedback on the methodology and the process can be provided via
email as well as during workshops organised by the group. Partners and members are welcome to ask
questions or make suggestions at any time, but to ensure metrics remain consistent and useful,
updates will be done on a periodic basis.
Feedback and questions can be sent to Chair of group Kat Harrison at [email protected] and/or
Johanna Diecker, GOGLA, at [email protected].

48
11. Resources
This section provides useful resources and links to both sources used to inform metrics, and other
reports and research that has been conducted.
Publications
→ Adkins, E., Eapen, S., Kaluwile, F., Nair, G., and Modi, V. (2010). Off-grid energy services for the poor: Introducing LED lighting in the Millennium Villages Project in Malawi. Energy Policy, 38(2): 1087–97.
→ Alstone, P., Lai, P., Mills, E., and Jacobson, A. (2014). High Life Cycle Efficacy Explains Fast Energy Payback for Improved Off-Grid Lighting System. Journal of Industrial Ecology, 18 (5): 722–733.
→ Brüderle, A. (2011). Solar Lamps Field Test in Uganda - Final Report. Deutsche Gesellschaft für Internationale Zusammenarbeit (GIZ) GmbH.
→ Comprehensive Initiative on Technology Evaluation (CITE) at MIT (2014). Experimentation in Product Evaluation: The Case of Solar Lanterns in Uganda.
→ Esper, H., London, T., Kanchwala, Y. (2013). Access to Clean Lighting and Its Impact on Children: An Exploration of SolarAid’s SunnyMoney. Child Impact Case Study 4, William Davidson Institute at the University of Michigan.
→ Furukawa, C. (2012). Do Solar Lamps Help Children Study? Contrary Evidence from a Pilot Study in Uganda. Brown University.
→ GIZ (2012). Results from a PicoPV field test in the Amazon and Chaco regions in Bolivia. → Grimm, M., Munyehirwe, A., Peters, J., Sievert, M. (2014). A First Step up the Energy Ladder?
Low Cost Solar Kits and Household’s Welfare in Rural Rwanda. IZA Discussion Paper Series. → Hassan, F., Lucchino, P. (2014). Powering Education. Enel Foundation: Working paper 17/2014. → Kudo, Y., Shonchoy, A., Takahashi, K. (2015). Impacts of Solar Lanterns in Geographically
Challenged Locations: Experimental Evidence from Bangladesh. IDE Discussion Paper No. 502. → Lam, Nicholas L., Yanju Chen, Cheryl Weyant, Chandra Venkataraman, Pankaj Sadavarte,
Michael A. Johnson, Kirk R. Smith, Benjamin T. Brem, Joseph Arineitwe, and Justin E. Ellis. “Household Light Makes Global Heat: High Black Carbon Emissions from Kerosene Wick Lamps.” Environmental Science & Technology 46 (2012): 13531–38.
→ Lighting Africa (2010). Solar Lighting for the Base of the Pyramid – Overview of an Emerging Market.
→ Lighting Africa (2011). The Off-Grid Lighting Market in Sub-Saharan Africa: Market Research Synthesis Report.
→ Lighting Global (2010). Light Emitting Diode (LED) Lighting Basics. Technical Note Issue 0. → Mills, E. (2003). Technical and Economic Performance Analysis of Kerosene Lamps and
Alternative Approaches to Illumination in Developing Countries. Lawrence Berkeley National Laboratory.
→ SE4All (2013): Global Tracking Framework. → UN Statistics (2011). Compendium of Housing Statistics. → UNEP/GEF en.lighten initiative (2013): Off-Grid Country Lighting Assessments. → UNFCCC (2012) Small-scale Methodology: Substituting fossil fuel based lighting with LED/CFL
lighting systems.
Internal GOGLA-member data sources

49
→ SolarAid (2012-5). Research data from public surveys and customer interviews in Kenya,
Malawi, Senegal, Tanzania, Uganda, and Zambia.
→ d.light (2014). Internal study with distribution partner in India
Organisations, initiatives and further reading
→ Global Off-Grid Lighting Association (GOGLA) → Lighting Global → LuminaNet → Sustainable Energy for All → UNEP/GEF en.lighten initiative → Energypedia → SolarAid

50