standardization under group incentives - boston … · standardization under group incentives! ......
TRANSCRIPT

Standardization under Group Incentives!
Jonathan KetchamArizona State University†
Pierre Thomas LegerHEC Montreal, CIRANO and CIRPEE‡
Claudio Lucarelli§
Cornell University and U. de los Andes
October 2009Preliminary and Incomplete
Abstract
Group-based incentives can reduce a firm’s costs more than individual incentives by providinga rationale for standardizing decisions across employees or agents. We theoretically demonstrateand empirically test this in the context of hospital services, where fragmentation between hos-pitals and physicians has promoted high growth in spending. Specifically, we analyze recentgainsharing programs in cardiology in which hospitals establish group incentives for their non-employee physicians to control spending on highly-priced drugs and devices. We find that gain-sharing lowered hospitals’ spending on devices, and this occurred from both greater negotiatingpower and standardizing purchasing on lower-priced items. The model describes the conditionsunder which each of these outcomes is achieved. We also find that the incentives had the greateste!ect on groups that were most costly and least standardized prior to gainsharing. However, wedo not find evidence of di!erences by group size, suggesting that the net e!ects of free ridingand peer pressure are not important.
1 Introduction
Firms have adopted a wide range of incentives to align their interests with those of their employeesand agents (Prendergrast (1999)). These include both individual- and group-based approaches.Existing work has indicated that group incentives are most preferred when firms have di"cultyobserving output of individuals but not overall, or when agents engage in team production and havegreater ability than firms to monitor each others’ productivity (Varian (1990)). Although free-riderproblems are well known (Holmstrom (1982)), group incentives and even firm-wide incentives such as
!This project was supported by grant number R01 HS018481 from the Agency for Healthcare Research and Quality.The content is solely the responsibility of the authors and does not necessarily represent the o!cial views of the Agencyfor Healthcare Research and Quality. Initial funding for this project was provided to Ketcham from the Health SectorSupply Chain Research Consortium at Arizona State University. Leger thanks HEC Montreal, FQRSC and SSHRCfor funding.
†Corresponding author: W.P. Carey School of Business, Arizona State University. 300 E. Lemon Street, TempeAZ 85287. Tel: 480.965.5507. E-mail: [email protected].
‡Institute of Applied Economics, HEC Montreal, 3000 Cote-Sainte-Catherine, Montreal, Quebec, CANADA H3T2A7. E-mail: [email protected]
§Department of Policy Analysis and Management, Cornell University, 105 MVR, Ithaca, NY 14853. E-mail:[email protected]
1

profit-sharing have been shown to influence employee behavior (Kandel and Lazear (1992); Hamiltonet al. (2003); Gaynor et al. (2004); Knez and Simester (2001)). A general shortcoming of the existingwork on group incentives is understanding the mechanisms by which group incentives overcomemoral hazard. In one notable exception, Che and Yoo (2001) rely on long-term relationships betweengroup members to provide a rationale for group incentives.
This paper proposes and tests an additional rationale for group incentives that applies evenin a static framework, namely, their ability to cause agents to internalize costs that increase froma lack of standardization across agents. Many principal-agent models focus on incentives to anincrease agent’s e!ort and subsequent output. In some contexts, however, agents determine thecosts borne by the principals. Financial incentives can be established so that agents internalizetheir principal’s costs. However, in contexts with multiple agents, these costs can also depend onthe extent of standardization among the agents and across tasks for a given agent. By providinga rationale for mutual monitoring, peer pressure, and information sharing, group incentives canpromote standardization where individual incentives cannot.
In this paper, we theoretically demonstrate that individual incentives for workers result in uti-lization of inputs that may diverge from the firm’s optimal utilization of inputs. We then show howthe introduction of a group incentive can cause their decisions to move toward the firm’s optimalutilization. We contrast this with various alternative individual incentive designs. Following that weadapt the model to incorporate the specific design of a group incentive that hospitals have recentlyused for non-employee physicians. That is, we examine the hospital and physician environment asa case study of this specific form of a principal-agent framework where inputs are determined bythe agent but paid for by the principal. This yields predictions about the mechanisms by whichgroup incentives reduce the hospitals’ costs and promote standardization among the physicians.We test the results from the model using data from specific gainsharing programs that have beenimplemented in cardiology, which we describe in more detail below. We also extend the model toconsider how group incentives’ e!ects vary with important group characteristics.1
We examine group incentives in the context of health care, where fragmentation among physi-cians and misaligned incentives between hospitals and physicians have contributed to high growthrates in costs with questionable value (Cebul et al. (2008)). Physicians are typically not hospitalemployees, yet physicians determine the use of other labor and non-labor inputs such as drugs andmedical supplies. These inputs are purchased by the hospital. Hospital-supplier bargaining de-termines prices, which depends on physicians’ willingnesses to switch suppliers and to standardizetheir decisions.
Historically, regulatory barriers have prohibited hospitals from o!ering direct financial incentivesto non-employee physicians. Hospitals have frequently adopted group incentives through initiativessuch as joint ventures, in which physicians profit-share, or through reinvestment programs, in whichhospitals plough back some of the cost reductions into capital for the service area. Recent decisionsby Health and Human Services O"ce of Inspector General, however, have allowed group incentiveprograms with direct financial payments known as ”gainsharing” to be implemented on a case-by-case basis.
Manufacturing firms initially developed gainsharing to elicit tacit knowledge gained by work-ers from their experiences and encourage workers to share knowledge with each other (Welbourneet al. (1995); Saver (2003)). Although gainsharing programs take a variety of forms, they shareseveral common characteristics. First, each individual receives the same payout, which is deter-
1Specifically, we follow Hamilton et al. (2003) and Gaynor et al. (2004) and analyze the role of group size andheterogeneity among its members in determining the e"ects of group incentives net of free riding, mutual monitoringand peer pressure, and learning through information-sharing.
2

mined by group-level performance rather than individual actions.2 Second, payouts are based onperformance relative to a historical baseline, rather than absolute targets or performance relativeto other firms or units within the firm, as in competitive tournaments. Previous work on gainshar-ing suggests it incorporates greater risk sharing, potentially aligning individuals’ incentives moreclosely to the firms’ interests (Gomez-Mejia et al. (2000)), but at the expense of greater shirkingrelative to competition-based incentives (Wageman (1995); Nalbantian and Schotter (1997)). Also,gainsharing’s endogenously-determined targets have been found to provide stronger incentives thantargets based on external sources (Nalbantian and Schotter (1997)).
Our empirical analysis has several strengths that facilitate our ability to build upon prior workon these issues. First, we have data from multiple firms rather than a single firm. These data includefirms that adopted group incentives as well as those that have not. For the adopting firms, the datainclude time periods prior to adoption. Likewise, the programs adopted across the firms were highlysimilar due to the regulatory approval process, as described below. The data are also very detailed,providing information on every individual input (drugs and medical devices and supplies) used byevery individual worker (physician) for every individual ”task” (patient). This includes the firm’s(hospital’s) acquisition costs for each product. They also include other detailed data such as patientclinical measures to eliminate a number of confounding factors.
With these data we find that gainsharing reduced the cost per patient in the two highest-priceddevice categories. The results support the hypotheses from the model and indicate that lower pricesresulted from standardization. This occurred by increasing hospitals’ ability to negotiate a lower,uniform price from di!erent manufacturers, as well as by prompting physicians to converge onlower-priced brands. Both result from the group incentives giving physicians a reason to coordinatetheir purchases collectively as well as to purchase cheaper items individually.
The remainder of the paper is organized as follows. In Section 2 we provide a theoretical rationalfor group-based incentives. In Section 3, we build a model to describe the actual hospital-physiciangroup-based incentives (i.e., gainsharing) in Cardiology in the US. The solution to the model andcomparative statics are derived in Section 4. In Section 5, we describe the data and the empiricalstrategy some results. Further results with respect to variations in gainsharing’s e!ects by groupcharacteristics are explored in Section 6. Conclusions are drawn in Section 7.
2 A Theoretical Rationale for Group-Based Incentives
We begin by presenting a simple model to reflect an environment that we wish to study, namely,group incentives for agents whose decisions a!ect the prices paid for inputs by the principal. Wefirst show that in the absence of a group-based incentives, agents will not internalize the e!ectsthat their decisions have on total costs. We next demonstrate when group-based incentives canlead agents to internalize (at least in part) the e!ect of their choices have on the prices paid bythe principal. Because lower prices can be achieved by standardization across agents or throughcredible threats to collectively switch purchases to a competitor, group incentives create benefits tomutual monitoring and peer pressure. This causes agents’ optimal choices of inputs to move towardthat of the principal’s in ways that various individual payment mechanisms cannot. Although wedemonstrate this in the context of hospitals and physicians specifically, this applies to any contextin which a principal’s costs depend on coordination among its multiple agents.
2Gainsharing is one of several compensation schemes known as ‘forcing contracts’, which aim to address potentialmoral hazard in groups in the context of a principle-agent relationship (Holmstrom (1982), Prendergrast (1999), andGibbons (2005)).
3

Denote hospital h’s objective function #h,t as:
#h,t =n!
i=1
DRGi,t "A!
a=1
(Ca!
c=1
pca,tqca,t) + !
n!
i=1
h("i,t, qca,t), (1)
where: (i) DRGi,t stands for ”diagnosis related group” and denotes the per-patient payment madeby the third-party (insurer) to the hospital for treating patient i in period t, (ii) pca,t is the price(paid by the hospital to the manufacturer) of device c in category a at time t, and qca,t denotes thevector of quantities of devices c in category a purchased at time t where
a = {1, ..., A},
c = {1, ..., Ca},
and (iii) ! denotes the weight the hospital puts on patient i’s post-treatment health h("i, qca) . Thisweight is greater than zero if either reputation or competition a!ects profitability, or if the hospitaldirectly values patient health outcomes per se (for example, in non-for-profit hospitals).
2.1 Price setting
Prices for each device c in each category a (i.e., the vector of prices{ p11, ..., pC11; p12, ..., pC22; ...; p1A, ..., pCAA}) are the result of a bargaining process between the
hospital h and the manufacturers. Hospitals can achieve two forms of discounts: (i) volume (basedon the quantity of items purchased at the hospital level), and (ii) market share (based on thehospital’s total purchases in a given category). Thus, we can write hospital h’s pricing function fordevice c in category a to be:
pca,t = ph
"
qTca,t,
qTca,t
qTa,t
#
, (2)
where qTca denotes the hospital’s total purchases of devices c in category a whereas qT
a denotes thehospital’s total purchases of devices purchased in a given category a. We allow for a hospital-specific pricing function because price levels and volume and market-share discounts depend on thebargaining power of the hospital.3
2.2 Patients
We define patients’ health as a decreasing function of their illness severity and increasing functionof the care they receive from their physicians. That is, patient i’s health production function isgiven by:
h("i,t, qca,t), (3)
where the patient’s illness severity "i is drawn from a known illness severity distribution F (") andqca,t denotes the vector of care received (i.e., qca = {q11, ..., qC11; q12, ..., qC22; ...; q1A, ..., qCAA}) attime t.
3Both of these types of discounts are non-linear, with distinct tiers or thresholds at which points the price of everydevice purchased (including those purchased previously) under the current contract are lowered.
4

2.3 The Hospital’s Problem
Suppose that the hospital could directly dictate the treatment vector for each of its patients (i.e.,make all purchasing and treatment decisions directly). Consequently, the hospital would maximize(1) by choice of vector qca,t for each patient i while considering the impact its choice would have onthe prices it would face in treating all of its other patients.
The marginal e!ect of an increase of a particular device c for a given patient i (and droppingthe t subscripts for compactness) is:
"pca + !#h
#qca"
$#pca
#qca
%qca "
$#pca
#qca
%qca, H "
n!
i=1
c!
c=1
$#p ca
#qca
%q ca (4)
where qca, H denotes the quantities c used on other patients at the same hospital, c denotes adevice in category a but not c, p c denotes the price of a device in category a but not c and finally
n denotes patients but not i. Thus,& n
i=1
& cc=1
'!p ca
!qca
(q ca > 0 denotes the e!ect of an increase
in c on the price of the other devices which occurs because the share that these devices hold withrespect to the total quantity in category a changes (assuming that physicians only use one type of
device per patient). Furthermore,'
!pca
!qca
(< 0 because of quantity and share discounts. Finally, we
assumed that !h!qca
> 0.As a result, the hospital should increase the quantity of device c if and only if the hospital’s
benefits from doing so, which occur through the health e!ect, is greater than the net costs e!ects(which occur through the price paid for c as well as the prices paid for all of the other devices) or:
!#h
#qca> pca +
$#pca
#qca
%qca +
$#pca
#qca
%qca, H +
n!
i=1
c!
c=1
$#p ca
#qca
%q ca (5)
Similarly the marginal e!ect of moving from a particular device c to an alternative device c!
within the same category a for a given patient yields:
pca " pc"a +
$#pca
#qca
%(qca + qca, H) "
$#pc"a
#qc"a
%(qc"a + qc"a, H) (6)
+
$#pc"a
#qca
%(qc"a + qc"a, H) "
$#pca
#qc"a
%(qca + qca, H)
"!h("i, qca) + !h("i, qc"a)
where'
!pca
!qca
(< 0,
'!pc"a!qc"a
(< 0 (which work through quantity and market share discounts) and
'!pca
!qc"a
(> 0 and
'!pc"a!qca
(> 0 (which works through the market share discounts). As a result,
the hospital should move from device c to an alternative device c! within the same category if theweighted net health benefit is greater than the additional costs, or:
!(h("i, qc"a) " h("i, qca))
> pc"a " pca "
$#pca
#qca
%(qca + qca, H) +
$#pc"a
#qc"a
%(qc"a + qc"a, H)
"
$#pc"a
#qca
%(qc"a + qc"a, H) +
$#pca
#qc"a
%(qca + qca, H) (7)
5

2.4 The Physician’s Problem
In the absence of gainsharing, physician k who treats I number of patients (which is a subset of n)is assumed to value his own income and paternalistically value his patients’ health4:
V jk,t =
I!
i=1
Revenuei,t + $
I!
i=1
h("i,t, qca,t). (8)
Given that the physician’s revenue is invariant to his choice of devices, the physician choosesthe vector of drugs and devices which maximizes the patient’s health:5
q"ca,t argmax h("i,t, qca,t). (9)
Analagous to the hospital’s decisions given by (6 and 7), the physician should: (i) increase thequantity of device c for a given patient i if:
#h
#qca,t> 0 (10)
or if the patient’s health improves; and (ii) should move from device c to an alternative device c!
within the same category if:h("i, qc"a,t) " h("i, qca,t) > 0 (11)
or again, if the patient’s health improves.
2.5 Comparing the Hospital’s Optimal Decisions with the Physician’s
This framework highlights the fact that the physician’s utility maximizing vector q"ca does notcoincide with the hospital’s profit maximizing quantities simply because the physician does notconsider the costs associated with his choices. Specifically, the physician does not consider howthe type and the quantity of devices used a!ect the (direct or indirect) costs faced by the hospitalbut, rather, only considers how these choices a!ect the patient’s health. The type of device thephysician uses is important for two reasons. First, certain devices are more expensive than others.As a result, the physician has no incentive to move to the lower-priced devices (for a given levelof health outcome). Second, the price of devices depends on the quantity and mix of devices usedby all physicians at the hospital (i.e., purchased by the hospital as a whole). As a result, thephysician’s decisions about the quantity and mix of devices a!ects the prices that the hospital paysfor all devices used by all physicians at the hospital level. Given that hospitals typically receiveprospective payments, higher device prices and quantities reduce their profits.
These misaligned incentives lead to two important results:(i) Physicians purchase too many devices (as shown by comparing 4 to 10).(ii) Physicians do not consider (internalize) the cost/benefit ratio when considering the choice
of treatment (as shown by comparing 7 to 11) and as such, will move to an alternative treatment(or to c! from c) under smaller changes in post-treatment health outcomes than the hospital would.
4A more general form of altruism, in which the physician considers both the patient’s health and consumption(i.e., his entire utility) is equivalent to the paternalistic form taken here if patients are fully insured.
5We make the simplifying assumption that physicians are not paid directly as a function of devices used. Morerealistically, physicians can receive an additional payment for each additional stent provided to a patient. Butphysician’s payments are invariant to the type of stent used (bare metal or drug-eluting) and to the quantity of othertypes of drugs and devices used.
6

The di!erence between the hospital’s optimal decision and that of the physician depends on theweight that the hospital puts on the patient’s health. Specifically, the more the hospital weighs thepatient’s health, the more similar will be the the preferred outcomes of the hospitals and physicians. .However, even if both ! = 1 and $ = 1, the physician will over-provide care relative to the hospital’sdesired level.
2.6 Comparing Group Incentives with Alternative Individual Incentives
One way that the hospital could encourage physicians to internalize some of the e!ect that his orher use of devices has on total costs (and thus hospital profits) is through a prospective paymentsystem (such as capitation) where physicians receive a fixed-payment for each patient they treatbut are responsible for all costs (including device costs) without any marginal reimbursement.
Paying a fixed amount to a physician for each patient he treats encourages physicians to (i)reduce the amount of devices he uses per patient and (ii) switch to lower cost devices. Thus, thephysician would essentially be maximizing an objective function similar to (1) but only over his setof patients (i.e., I # n).
The marginal e!ect of an increase of a particular device c for a given patient i is:
"pca,t + !#h
#qca,t"
$#pca
#qca,t
%qca,t "
$#pca
#qca,t
%qca,t I "
I!
i=1
c!
c=1
$#p c,t
#qc,t
%q ca,t (12)
where qca,t I denotes the quantities c used on other patients by the same physician, c denotes adevice in category a but not c, p c denotes the price of a device in category a but not c and finally I
denotes individuals but not i served by this physician. Yet under individual capitation, physicians donot consider how their actions a!ect the prices paid for devices by other physicians. As a result, thisimportant externality is not considered when making choices. By paying physicians prospectively,each might opt for inexpensive devices but not necessarily the same ones. Thus, physicians areunlikely to benefit from negotiated discounts or contract-compliance (volume) discounts.6 Thus,even in a prospective payment system in which physicians were responsible for drug and devicecosts currently paid by the hospital, physicians do not internalize the externalities of their choiceson the prices paid by other physicians.
To deal with this issue under a prospective payment, physicians must (a) coordinate on typesof devices and quantities, (b) agree on specific targets, and (c) find a way for physicians to ad-here to them (through mutual monitoring and credible threats of team sanctions) to overcome thedetrimental e!ects of free-riding. Yet individual incentives provide little rationale for such e!orts.
3 Hospital-Physician Gainsharing in Cardiology
In this section we present the existing model of gainsharing for hospitals’ cardiology service lines.Having each physician’s payout tied directly to the behavior of other well identified physicians asin the gainsharing program, encourages mutual monitoring and punishment and reduce free-riding.By doing so, it may lead physicians to behave in a manner more closely to (1).
Hospitals receive a fixed (prospective) payment for each patient and pay for all of the devicesand drugs used during treatment. But treatment decisions about the types and quantities of devicesand drugs used are made by non-employee cardiologists and internists. Due to negotiations between
6And in fact, if indivudual physicians became purchasers instead of hospitals, the negotiated prices would be higherthan they are currently.
7

hospitals and drug and device manufacturers, hospitals’ prices depend on both their ability tocredibly threaten to switch their physicians’ purchasing decisions as well as contract compliance, inthe form of volume or market-share discounts.
Gainsharing is one approach hospitals are using to overcome misaligned incentives with theirphysicians that arise from divergent reimbursement methods and regulatory barriers to integration.Many insurers, including Medicare, pay hospitals case rates that do not vary with the cost ofmedical devices and drugs used, while they pay physicians piece-rate for each service performed.Most hospitals do not employ the physicians who treat their patients, and regulations prohibithospitals from making direct payments to physicians. These include both the “Stark” self-referralregulations and the Civil Monetary Penalties (CMP) “anti-kickback” restrictions included in theMedicare and Medicaid statutes of the Social Security Act.
In recent years, the Department of Health and Human Services O"ce of Inspector General(OIG) has permitted a few hospitals to implement gainsharing with their non-employee cardiologists,cardiac surgeons and orthopedic surgeons. The current programs share many features in common asstipulated by the OIG. In each, hospitals pay physicians based on cost reductions in pre-determinedareas that are subject to physicians’ control. A separate historical baseline is determined for everyphysician practice (whether a medical group or solo practice) that participates. Any savings fromthese baselines are shared equally (50/50) by the hospital and the group, where the group is requiredto provide the same payouts to each individual member, and physicians are not at risk for costoverruns (the lower bound on payouts is $0). In the completed programs with cardiologists thatwe examine, the payouts have averaged $17,000 (approximately 5% of cardiologists’ average income(The American Medical Group Association (2007)) and ranged from $0-59,000 per physician. Eachprogram runs for one year, at which point savings are estimated and payouts are made. A hospitalcan run subsequent annual programs, in which case the baseline is recalibrated.7 (Additional legal,historical and institutional details are provided in Ketcham and Furukawa (2008) and Saver (2003).)
The gainsharing programs relied on physicians’ practice a"liations to define the groups. Physi-cians formed partnerships prior and unrelated to the implementation of gainsharing, and switchingpractice a"liations during gainsharing rarely occurred. Thus, we do not examine how gainsharing’sincentives alter the composition of the medical partnerships (Farrell and Scotchmer (1998); Levinand Tadelis (2005)) or the endogenous formation of teams (Hamilton et al. (2003).) Rather, wetake group membership as exogenously determined. Although there are few interdependencies inproduction among physicians within the groups, coordination among physicians both across andbetween groups is relevant in hospitals’ negotiations with their suppliers. First, it can providehospitals with the credible threat to shift their purchasing to other device manufacturers. Second,volume and market share discounts are built into the tiered contracts.8 To promote coordination,the gainsharing programs provided physicians with financial incentives and information, in theform of detailed benchmarking reports of each physician’s practice patterns (Hansen (1997)). Thisinformation lowers the cost of within-group monitoring among physicians and might act throughchannels of (internal) guilt and (external) shame (Kandel and Lazear (1992)).910 Additionally, be-
7Several of these programs were initiated prior to approval, in which case the program ran but physician payoutswere held until the program was approved. Recently the OIG has approved multi-year programs, but the data for ourstudy end before those began.
8This is similar to the group-based MD incentives studied by Gaynor et al. (2004). Related work on factorsinfluencing hospital bargaining power can be found in (Brooks et al. (1997); Cutler et al. (2000); Dor et al. (2004).
9For further discussion of papers on group incentives see Che and Yoo (2001), La"ont and N’Guessan (2001),Varian (1990), Ma (1988), McAfee and McMillan (1991), Jeon (1996), Macho-Stadler and Perez-Castrillo (1993) andfor papers on group incentives among physicians specifically see Gaynor et al. (2004), Gaynor and Gertler (1995).
10For further discussion of dual agency in the healthcare context, including models of physician behavior based
8

cause the incentives are based on the practice’s performance overall, gainsharing creates incentivesfor a physician to share knowledge, for example regarding the relative advantages or similarities ofvarious alternative devices, to the extent that such information sharing increases the gainsharingpayouts by altering his partners’ choices.
The gainsharing programs studied here apply to cardiologists and internists working in hospital-based coronary catheterization laboratories (”cath labs”), which treat patients with a range of heartconditions including acute myocardial infarction and congestive heart failure. Diagnostic physicianstypically inject patients with contrast to indicate the location and severity of blockages of thecoronary arteries. Cath lab patients can also receive treatment with medication, be treated withinthe lab by an interventional physician (often the same as the diagnostic physician) with proceduresincluding angioplasty, insertion of a coronary stent, or implanting of an electrophysiology devicesuch as a pacemaker or defibrillator, or be transferred out of the lab for cardiac surgery. Both totalcost and device costs per catheterization lab patient have risen sharply during the decade. In Figure1 we report the average total and device costs per patient from 2000 through 2007 (calculated froma data set described below). During this time, average total cost climbed by 65% ($978), with drugand device costs accounting for 89% ($868) of the increase and 83% of the total cost per patient atthe end of 2007.
3.1 Theoretical Model
We provide a simple multistage model in which the hospital introduces financial incentives at thephysician–practice level to align the physicians’ incentives with the hospital’s. Specifically, physi-cians face a mixed-payment system known as gainsharing whereby hospitals share cost reductionswith physicians.
3.1.1 Hospitals
Denote the hospital h’s net revenue # from n patients in year t as:
#h,t =n!
i=1
DRGi "A!
a=1
(Ca!
c=1
pca,tqca,t) "J!
j=1
A!
a=1
payoutja, (13)
where payoutsja denote the payouts made to physician group j (where j = {1, ..., J}) for category
a of medical devices as part of the gainsharing agreement. For simplicity, and without loss ofgenerality, we omit !
&ni=1 h("i,t, qca,t) term from the hospital’s objective function.
3.1.2 Payouts in Gainsharing
A framework of gainsharing and payouts to physicians:
The general idea of gainsharing is to share cost-savings made over a given period betweenphysician groups and the hospital. However, the gainsharing program implemented in these hospitalshad several specific details which were dictated by the OIC.
First, a separate historic baseline is calculated for each physician group for each category ofdevices a. In order to do so, a single baseline is calculated for each hospital h, and the baseline costs
on principal-agent relationships with patients, see for example Dranove and White (1987) and Blomqvist (1991).Gainsharing creates both dual agency relationships and multi-task agency in which physicians balance the objectivesof both quality and cost e!ciency Holmstrom and Milgrom (1990). In our setup, the dual agency comes from thephysician’s altruism (towards the patient) and the coordination issues (cost savings).
9

are allocated to each medical group based on the group’s share of the cardiac catheterization lab’stotal patient volume in the baseline year. In other words, physician group j’s share of the hospitalh’s total volume in t " 1 is sj
t#1,11 where
sjt#1 =
volumejt#1
Total volumet#1. (14)
Then, the baseline share of total expenditures in category a attributed to group j is given by:
)gja,t#1 =
volumejt#1
Total volumet#1! Total Expendituresa, t#1
=volumej
t#1
Total volumet#1!
J!
j=1
"Ca!
c=1
pca,t#1qjca,t#1
#
,
= sj,t#1 !J!
j=1
gja,t#1. (15)
Thus, a group j which is responsible for 30 per cent of the patient volume in hospital h in year t"1will be attributed a baseline equal to 30 percent of total expenditures in each category a for year t.
Consequently, the actual payout made to group j for category a is given by:
payoutja,t =1
2max
'0, )gj
a,t#1 " gja,t
(. (16)
where
gja,t =
A!
a=1
(Ca!
c=1
pca,tqjca,t) (17)
denotes group j’s expenditures in category a in period t.Notice that in the approved gainsharing programs, the savings (relative to the baseline) are
shared equally between the hospital and the physician group. Secondly, physician groups are notresponsible for cost overuns (i.e., if they spend more than their baseline, the are not responsable forthe di!erence). Finally, payouts (which are physician-group-category specific) are equally dividedamongst group members. Thus, the total payout made to physician k in group j (of size Dj) inperiod t is given by:
payoutjk,t =A!
a=1
*1
Dj
1
2max(0, )gj
a,t#1 " gja,t)
+. (18)
In this framework, savings can come from several sources: (i) moving to a lower price devicewithin the same category (substitution e!ect), (ii) reducing the quantity of devices used (quantitye!ect), and (iii) discounts in the hospital-level price of a device (discount e!ect) due to negotiationor due to volume or market-share discounts (equation (2)).
Further notice, that this payout rule can lead to the case where a physician group j receives alarge payout without changing its behavior. For example, a physician group that accounts for 30%percent of the cath lab volume in the baseline year will have its baseline set at 30% of the totalexpenditures for each category. If the group had below-average expenditures in the baseline year,it would receive a payout (i.e., )gj
a,t#1 > gja,t even if gj
a,t#1 = gja,t) simply by maintaining the same
level of use.11For example, physician group j treated 30% of all patients seen in the hospital’s cath lab.
10

Finally, the current version of gainsharing requires that payouts are made only for predetermined”targets”: prior to initiating the program, hospitals choose specific categories of drugs and devicesfor which payouts will be calculated, as well as whether the payouts will be generated due toreductions in quantities, average prices (whether through substitution or discounts), or both. 12
3.1.3 Physician Preferences
Similar to (8), physician k in group j is assumed to have preferences over his income (which nowinclude gainsharing bonuses), his patients’ health (a paternalistic form of altruism) and sanctions:13
V jk,t =
I!
i=1
Revenuei,t +A!
a=1
1
Djpayoutja,t + $
I!
i=1
h("i,t, qca,t) "I!
i=1
[$(qca,t("i), )qca,t("i),Dj)]. (19)
The vector of quantities provided by the physician is given by qca whereas the ‘appropriate oragreed upon’ vector of quantities is denoted by )qca(") (which we define in detail later). Finally, $(.)denotes the utility loss (from sanctions) associated with deviating from the agreed upon vector ofdrugs and devices (agreed upon at the hospital level). We assume that the utility loss is a functionof the actual care provided, the agreed upon care as well as the number of physicians in the group.One can think of the $(.) as a reduced-form punishment device for physicians that deviate fromthe group-norm.14
Although the above specification assumes that physicians are altruistic (i.e., the patient’s healthenters directly into the physician’s utility function) where $ denotes the level of altruism, themodel could be modified in a simple manner to reflect heterogeneity in physicians’ preferencesfor specific devices. Specifically, (19) could be modified by dropping the term related to altru-ism (i.e., $
&Ii=1 h("i, qca)) and introducing a physician-specific preference for particular devices
(&I
i=1 hk("i, qca)). As such, hk("i, qca) can be thought of as the utility that physician k receivesfrom treating a patient i with illness "i with the vector of particular devices qca. In such a setting,a physician who has strong preferences for particular devices will see his utility vary greatly fromone vector of devices to another for a particular "i. On the other hand, a physician with very weakpreferences for particular devices yield utility which is invariant to the vector of devices used (i.e.,hk("i, qca) will not vary from one vector of devices to another for a given "i). Although we do notuse this alternative representation in the derivations below, we discuss the results in both settings(i.e., for heterogeneity in physicians’ altruism and preferences for devices).
12If only prices are targeted for a category, physicians have incentive to increase quantities, both because of thevolume discounts and because the payouts are calculated by multiplying the reductions in price by the volume usedin the program year. However, payouts are subject to the constraint that total spending for the category decreasedfrom the prior year, limiting physicians’ ability to increase quantities and receive greater payments. This potentiallyperverse incentive is further o"set by the goverment requirement that payouts cannot be made for any volume offederally-insured patients beyond the volume in the baseline year, as well as by the requirement that physicians whoalter the average clinical characteristics of their patients be excluded from the payouts altogether.
13A more general form of altruism, in which the physician considers both the patient’s health and consumption(i.e., his entire utility) is equivalent to the paternalistic form taken here if patients are fully insured. This disutilityfrom deviating from appropriate treatment is similar to prior models of physician behavior, e.g. Gaynor, Rebitzerand Taylor (2004).
14This disutility from deviating from appropriate treatment is similar to prior models of physician behavior, e.g.Gaynor et al. (2004).
11

3.1.4 The Multi-Stage Game
Stage 1 Hospitals negotiate with manufacturers on the prices (contingent contracts with the manufac-turers based on the quantity and share of the devices to be purchased).
Stage 2 Hospitals decide on the “appropriate” illness-specific treatment vectors )qca(") (treatmentguideline for each illness severity ").
Stage 3 Physicians treat their patients maximizing their utility (i.e., decide on qca(") to maximize(19)).
Stage 4 The physician group monitors the members’ behavior.
Stage 5 Payouts are distributed and penalties attributed.
4 Solving the Model
We solve the model by backward induction. Because we have assumed Stages 5 and 4 to bedeterministic, we solve Stages 3 through 1.
4.1 Stage 3: Physicians’ maximization problem
Each physician k in group j chooses the vector of quantities qca(") at time t that solves:
maxqca(")
V jk,t =
I!
i=1
Revenuei,t+A!
a=1
1
Djpayoutja,t+
I!
i=1
$h("i,t, qca,t)"I!
i=1
[$(qca,t("i), )qca,t("i),Dj)], (20)
or
maxqca(")
V jk,t =
I!
i=1
Revenuei,t +A!
a=1
,
- 1
Dj
1
2max
.
/0, )gja,t#1 "
Ca!
c=1
Dj!
D $=k
pca,tqDca,t "
Ca!
c=1
pca,tqkca,t
0
1
2
3 +
I!
i=1
$h("i,t, qca,t) "I!
i=1
[$(qca,t("i), )qca,t("i),Dj)], (21)
The benefits of deviating from )qca by increasing the quantity or substituting to higher-quality/higher-priced (or preferred) devices is its e!ect on the patient’s health (or the physician’s utility). It mayalso decrease the price paid for the device which would apply to all devices used (on all patients)due to the nonlinearities in the contract with device manufacturers. The costs, on the other hand,are threefold: (i) it can a!ect the payout, (ii) it can lead to punishments due to monitoring by othermembers of the group, and (iii) a lack of coordination results in smaller market-share or volumeprice discounts. 15 Because the payouts are shared equally between the group and the hospital, andthe group’s share is split equally among its members, free-riding incentives remain because eachphysician only bears a 1
Dj
12 share of his increases in medical expenditures. Furthermore, because
the discount e!ect is shared equally among all physicians in the hospital, the free-riding e!ect asso-ciated with price reductions due to increased contract compliance (i.e., quantity and market-sharediscounts) are likely to be substantial. As a result, this mechanism alone is theoretically insu"cient
15It could also a"ect the prices paid on other devices by a"ecting their within-category share.
12

at controlling costs–hence the need for a group incentive to promote coordination and monitor-ing within the group. By having one physician’s action a!ect the other’s payo!, physicians havea financial interest in monitoring their group members’ actions. By facilitating such monitoring(for example, by providing information on fellow group-members’ actions), group incentives can“encourage” monitoring and punishment and, as a result, help internalize such externalities.16
By solving (21), we denote the physician’s utility maximizing vector of care or reaction functionto be q"ca,i("i,$, )qca,i,Dj).
4.1.1 Some highlights from stages 3-5:
The Marginal E!ect of Increasing Quantities or Switching Devices:For a physician, the marginal e!ect of increasing one unit of a given device qca, holding fixed
the type of device and the number of patients, is (assuming an interior solution):
"1
Dj
1
2pca + $
#h
#qca"
#$
#qca"
1
Dj
1
2
#pca
#qcaqca J "
1
Dj
1
2
#p ca
#qcaq ca J (22)
where " 1Dj
12
!pca
!qcaqca J denotes the increase in the payout that comes from potentially decreasing the
prices paid on all the same types of devices c (within the category) used by all group members (i.e.,including the physician himself) through quantity and market-share discounts and " 1
Dj
12
!p ca
!qcaq ca J
denotes the decrease in payouts that come from potentially increasing the price of other typesof devices c used by all group members (including the physician himself) which occurs throughmarket-share discounts only.
Notice that relative to a traditional fee-for-service system, the gainsharing system internalizessome of the externality with respect to choices and quantites by tying the physician’s decisions to apayout but does not do so completely as there are potentially important free-riding problems. Thisfree-riding problem may be mitigated (at least in part) by the presence of peer monitoring.
Further notice that relative to a fully prospective system, the gainsharing system (with monitor-ing and potential punishments) helps to internalize not only the e!ect that quantity has on profitsbut also some of the e!ect that their choices have on the prices paid by the hospital for all types ofdevices (within the same category) chosen by other physicians (through the last two terms in 22).
Thus, relative to fee-for-service or a fully prospective system, a gainsharing program (coupledwith monitoring with punishment) forces physicians to in part internalize how their choices of devices(both types and quantites) a!ect the hospital’s profits both through the direct costs associated withtheir quantity choices but also through the prices paid for all devices. The marginal e!ect of movingaway from the agreed upon device c to the physician’s utility-maximizing (or preferred) device c!
holding fixed the quantity of devices and the number of patients is:
1
Dj
1
2(pc"a " pca) + $(h("i, qc"a) " h("i, qca)) " $(qc"a, )qca,i("i),Dj) (23)
+1
Dj
1
2
$#pca
#qcaqca J +
#pc"a
#qcaqc"a J +
#pca
#qc"aqca J +
#pc"a
#qc"aqc"a J
%
where 1Dj
12
'!pca
!qcaqca J + !pc"a
!qcaqc"a J + !pca
!qc"aqca J + !pc"a
!qc"aqc"a J
(is the total e!ect that such changes
have on the payout due to changes in prices on devices c and c! through quantity and market sharee!ects on all group members.
16The programs implemented to date additionally incorporate incentives for coordination between groups by re-quiring positive net savings across all the groups at the hospital for any group to receive a payout.
13

Again, the results relative to the fee-for-service and the prospective payment system are clear.That is, in the gainsharing system, physicians’ choices a!ect not only the costs but also the pricespaid for devices by all group members. As such, physicians have an incentive to monitor theirgroup-members as their payouts depend on others within the group internalizing the e!ect thattheir choices have on costs (which include the e!ect that their choices have on prices).
Physician’s Willingness to Standardize: The willingness of physicians to coordinate on particulardevices is a direct function of each physician’s willingness to align their use of particular devicesto the hospital-level treatment guidelines. To highlight this e!ect, we examine di!erent potentiallevels of the preference parameter $ and examine its likely e!ect on coordination of devices holdingthe level of monitoring/punishment fixed. Alternatively, this can be conceptualized as how muchthe hk function varies from one device to another, that is, the degree of substitutability betweenalternative products within the category (again, holding the level of monitoring/punishment fixed).
1. Suppose that physicians have no preferences for one device over another in the category (i.e.,$ = 0). This could result if devices are identical, if they do not face costs due to switching(for example due to learning by doing), or if they gain no utility from their patients’ health.In this case, physicians do not receive any benefit from deviating and will exclusively use theagreed-upon device, because this standardization decreases the prices paid by the hospital,increasing the gainsharing payout. Thus coordination on devices at the physician, group andhospital levels should be strong.
2. Suppose that physicians had extremely strong preferences for particular devices, for exampledue to large clinical di!erences between them combined with strong altruistic preferencesfor patient health, or due to steep learning curves. In this case, the model predicts thatgainsharing will have little or no e!ect on the physicians’ choices of devices (depending on thelevel of monitoring/sanctions). Thus, gainsharing is unlikely promote coordination on devicesat the physician, group or hospital level.
3. Finally, suppose that physicians have preferences over some devices under certain situationsbut not for others (or similarly, have some preferences over some devices but not others). Forexample, suppose that for some of a physician’s patients, two alternative devices in a categoryyield identical outcomes, but for his other patients one device is clinically superior than theother. This could yield divergence in device use at the physician level, because physiciansmight be willing to move away from their preferred device to the agreed upon device for somecases/patients but not for others. Thus if a physicians preferences vary across his patients,gainsharing could generate divergence at the physician level. What happens at the groupand hospital level is ambiguous as it depends on the patterns of convergence at the physicianlevel. Nonetheless, we should see convergence for a given level of illness severity " (at all threelevels).17
Given (1)-(3), the model indicates that gainsharing might, under some conditions, not promotefull standardization in physicians’ choices of devices and drugs, and in fact it might (under particularsituations) decrease coordination. The result ultimately depends on how strong the physicianspreferences for particular devices are weighed relative to the monetary benefits of coordination andthe monitoring/sanction e!ects of the groups. Because this in part depends on the outcome ofhospital-manufacturer negotiation, we return to this following the solution to stage 1.
17This depends in part on the degree of heterogeneity across physicians, which we examine in greater detail below.
14

4.2 Stage 2: Choosing the optimal vector )qca(!i)
In this stage, the hospital must decide on treatment guidelines. These guidelines seek to minimizehealth-care expenditures for a given level of quality, which is determined by the hospital’s preferencesfor quality and the OIG’s restrictions on reductions in device quantities. Gainsharing incorporatestwo mechanisms that align the hospital’s and physicians’ incentives: the financial incentive of thepayouts themselves, and the benchmarking information that facilitates physicians’ ability to monitoreach other and punish those who deviate from the treatment guidelines. Each vector )qca("i) chosenby the hospital elicits a reaction from each of its physicians (i.e., qk"
ca("i, )qca,$,Dj)) and an expectedincome where the expectation comes from uncertainty about the distribution of patients’ illnessseverities under gainsharing relative to the baseline year. In addition to aligning physician-hospitalincentives, because the payouts are dependent on the choices of the entire group, and to a lesserextent on the choices of all of the physicians at the hospital, gainsharing also creates incentivefor physicians to share information about the similarities and relative advantages of alternativedevices. This information-sharing enters into the physician reaction function and thereby influencesthe hospitals’ choice of optimal vector of )qca("i).
We denote the hospital’s income maximizing optimal vector of )qca("i) as )q"ca("i). That is, )q"ca("i)is the vector which maximizes the income of the hospital conditional on the reaction function ofeach of its physicians (i.e., conditional on qk"
ca("i, )qca,$,Dj) for all k, i).
4.3 Stage 1: Hospital-manufacturer negotiation
In this first stage, the hospital must negotiate with each manufacturer to determine a price function
(i.e., pca = ph
'qTca,
qTca
qTa
().
From the previous stages, )q"ca("i) denotes the hospital’s profit maximizing vector given thephysicians’ reactions functions where prices were taken as exogenous. Specifically, )q"ca("i) dependsnot only on how physicians will react but also the prices associated with each of the devices in eachof the category. To make this explicit, we re-write )q"ca("i) as )q"ca("i|pca).
In the absence of manufacturer competition, the manufacturer would choose a price functionp"ca that would maximize its profit given the hospital’s optimal response vector )q"ca("i|pca) and itsassociated physicians’ reaction functions qk"
ca("i,$, )qca,i,Dj |pca). Thus, p"ca
p"ca = arg max #manufacturer
|bq!ca("i|pca)&qk!ca ("i,#,bqca,i,Dj |pca)
. (24)
In the presence of manufacturer competition, the manufacturer must not only consider howthe hospital and its physicians will respond to each price it sets, but also how its competitors willreact. The level of competition depends on the number of manufacturers, and more importantly,the physicians’ willingness to move away from their preferred devices to the agreed-upon devices.If physicians are very reluctant to deviate from their preferred devices (i.e., devices are very weaksubstitutes for each other) and convergence is expected to be very weak, then manufacturers ofthose devices can exert market power and set prices accordingly. Thus, prices of the hospital arenot expected to converge across manufacturers in the category.
If, however, physicians have very weak preferences for particular devices, then devices are strongsubstitutes for each other. Consequently, the hospital’s credible threat to switch purchasing deci-sions to lower-priced alternatives will create strong incentives for manufacturers to reduce theirprices and converge to a single price. If the remaining di!erences between firms’ prices are small,physicians have little incentive to actually concentrate their purchases among fewer manufactur-ers. Even apart from eliminating savings due to substitution per se, some incentive to coordinate
15

remains due to the existence of volume discounts; but, theory indicates that competition will ame-liorate those discounts as well. Thus, if gainsharing promotes greater price competition, a potentialoutcome is the convergence on prices without a strong convergence on devices when preferences areweak.
4.4 Summary of the Comparative Statics
4.4.1 Physicians have strong preferences for particular quantities or devices:
In this case, physicians are reluctant to switch devices or reduce quantities and little standardizationwill occur. Given these strong preferences, manufacturers will exert market power and maintaintheir previous levels of price dispersion. Thus, we expect to see little within-category standardizationon either devices or prices. When physicians have strong preferences, we expect gainsharing willgenerate few savings from any of the quantity, substitution, or discount e!ects.
4.4.2 Physicians have weak preferences for particular quantities or devices:
In this case, physicians have strong incentive to switch to the agreed upon devices and the willing-ness to converge is strong. Given this strong willingness to convergence, manufacturers will facestrong competition and convergence on prices should be strong. Thus, case we expect to see strongconvergence on prices but ambiguous convergence on devices. When physicians have weak prefer-ences, we expect to see gainsharing reduce costs due to quantity and bargaining discount e!ects,and potentially but not necessarily due to substitution e!ects.
4.4.3 Physicians’ preferences for particular quantities or devices vary across their
patients:
In this case, the results are ambiguous. A given physician might either increase or decrease hisdegree of device standardization across his patients. Given this ambiguity at the physician level,the implications for standardization at the group or hospital level are also ambiguous. In this case,we expect to see that gainsharing lowers costs via both quantity and substitution e!ects for sometypes of patients but not for others. The degree of savings due to discount e!ects is positivelyrelated to the proportion of patients for whom physicians have weak preferences about devices.
5 Empirical Analysis of Gainsharing in Cardiology
5.1 Data
All of the approved programs in cardiology were submitted by clients of Goodroe Healthcare So-lutions (”the consulting firm”), a health care consulting firm owned by VHA. The consulting firmprovided us with detailed data covering the fourth quarter of 2001 through the second quarter of2007.18 A total of 13 annual programs at 6 hospitals completed or initiated before the third quarterof of 2007. Table 1 reports the timing of each program and the number of groups and physicians ineach.
18Data from 2000 and earlier in 2001 were provided but were missing some important features we use in the analysis.Beginning in the 3rd quarter of 2007, some hospitals, including some gainsharing hospitals, began a software conversionand those data have not (yet) been provided for analysis.
16

The data are an unbalanced panel, where inclusion is determined by employment of the con-sulting firm’s services and installation of their software to capture the data. These data cover timeperiods before and during gainsharing. We eliminated data from patients treated at gainsharinghospitals by physicians who never participated in gainsharing.19 In total, 168 physicians from 34groups treated 73,672 patients under these programs. Practice sizes ranged from 1 to 17 physicians,and the average patient under gainsharing was treated by a physician in a group of 11. The datainclude an additional 138 hospitals that did not participate in gainsharing.
These data incorporate both real-time information gathered in the cath lab and other datacollected by the hospital. The data provide patient characteristics that are more detailed than in-surance claims data and include age and sex, as well as risk factors that allow for the risk adjustmentmethodology defined by the American College of Cardiology’s National Cardiovascular Data Reg-istry (NCDR.) These include pre-existing conditions, comorbidities, clinical presentation and othermeasures of illness types and severity. These data also report which procedures were performed;various characteristics of the drugs and devices provided to each patient, including the manufac-turer, product number and model number, the size or strength (where relevant), and prices paidfor them by the hospital, net of rebates; identifiers for the diagnostic and interventional physician;and, for gainsharing physicians, their practice a"liations.
The specific drugs or devices included in each programs varied both between a hospital andwithin a hospital over time. Patients treated in cath labs receive drugs and devices from up to 20distinct categories. We focus on the two most expensive that were targeted frequently: drug-elutingstents (DES) and bare metal stents (BMS).20 These categories varied in their number of competingsuppliers and the degree of substitutability among them. For example, drug-eluting stents were notavailable in the US at the beginning of the study period, but two manufacturers, Cordis (part ofJohnson & Johnson) and Boston Scientific, introduced their product to the US during the studyperiod. Alternatively, hospitals in our study sample purchased bare metal stents from eight di!erentmanufacturers.21
5.2 Methods
With these data, we focus on two primary outcomes because of their direct relationship to the modeldeveloped above. Specifically, we analyze gainsharing’s e!ects on cost per patient separately foreach device category,22 We also analyze standardization in terms of the brand of device used andthe price per device. We consider this at the levels of the physician, the group, and the hospital.We note that this approach allows us to estimate the hypotheses generated by the model, but itdoes not permit us to estimate the model itself.
When our two categories of interest were included in the gainsharing program, it always incor-porated financial incentives to lower prices. In some programs, additional incentives were provided
19These non-participating physicians treated only 0.35% of the patients treated at gainsharing hospitals.20We exclude the highest-cost category, electrophysiology (e.g. pacemakers and defibrillators), because they were
not always included in gainsharing programs, because they are used typically by only one or two physicians in eachhospital, and because unlike the other categories they were not consistently captured by the consultant’s softwareduring all of the study periods. Lower-cost categories included peripheral stents, guides, other catheters, sheaths andcontrast.
21When the patient was treated by di"erent diagnostic and interventional physicians, we ascribe the relevant drugsand devices to each physician based on which type of physician uses which type of item. If a patient was treated bytwo or more of the same type of physician, the devices and drugs were assigned to all physicians. We included theseobservations in the reported analysis, but excluding them did not meaningfully alter the results.
22We employ this category-specific approach because not all categories were targeted in any given program, so totaldrug and device costs includes both decisions incentivized by gainsharing and those not addressed by the program.
17

to lower quantities. In our approach, we consider the incremental e!ect of both of these types ofincentives.
Given the availability of data from the nongainsharing hospitals, we rely on a di!erence-in-di!erence approach. These data incorporate selection on unobserved characteristics along multipledimensions: physicians sort into practices, practices decide whether to enter and exit gainsharing,physicians decide whether to treat their patients at the gainsharing hospital or elsewhere, hospitalsdecide whether to enter and exit gainsharing, and hospitals decide to employ the consulting firm.23
Despite the richness of the data, they o!er few approaches to identify these selection models andaddress any bias that results. Thus we do not generalize our results to physicians, hospitals andclinical service lines that have not yet adopted gainsharing.
5.3 E!ects on drug and device costs per patient
The model indicates that gainsharing can reduce costs through three pathways–reductions in quanti-ties, reductions in prices through discounts, and reductions due to substitution of lower-priced items.Each of these is tied to standardization, which under some but not all conditions is promoted bygainsharing’s group-based financial incentives. These incentives cause physicians to internalize theexternalities of their choices on the prices of devices chosen by other physicians. This e!ect is in ad-dition to the standard rationale for group incentives, namely that it compels physicians to monitoreach other and share information.
We analyze the cost per patient for each device category. We estimate the patient-level model:
Yight = $0 + $1Gg + $2Ag + $3GQg + $4AQg + $5Tt + $6Hh + $7"i + %ight (25)
where Y is the patient’s costs for a given device category, G indicates whether the category wasincluded in the gainsharing program, A indicates that the category is either after or between gain-sharing (to distinguish it from both the pre- and during-gainsharing time periods), GQ indicateswhether the category also included a quantity target, AQ indicates time between or after a quantitytarget, T is a vector of quarter-by-year fixed e!ects, H is a vector of hospital fixed e!ects, " is avector of patient clinical variables including illness severity, age, sex, and complications, as detailedin Appendix 1, and %ight is an i.i.d error term. While " adjusts for the severity of illness, substantialheterogeneity in the type of illness still exists given the range of patient types treated in cath labs.Our device categories of interest are not clinically relevant for many patients diagnosed in cath labs;because these would all have $0 cost regardless of gainsharing, we restrict this analysis to those whoreceived percutaneous coronary interventions.24 To eliminate a few implausible values for prices,we assigned as missing any values for prices below the 0.1 or above 99.9th percentiles. Similarly,we eliminated quantities exceeding the 99.9th percentile.
The incremental e!ects from Tobit models are reported in Table 2. It shows large reductionsin spending during gainsharing for both DES and BMS. For both categories, price targets led toreductions in costs, amounting to 14% for DES and 8.3% for BMS. Quantity targets resulted inlarge additional reductions for DES. For BMS, the e!ect is positive and highly significant; thisresults from the fact that BMS are substitutes for DES and BMS quantity targets were alwaysimplemented in conjunction with DES quantity targets. Given that prices of DES were much larger
23In previous work we found no evidence that gainsharing altered physican’s treatment volumes, caused steeringof healthier patients into gainsharing, or increased the prevalence of in-lab complications (Ketcham and Furukawa(2008)).
24These are stent placement, percutaneous transluminal angioplasty (PTCA), atherectomy, coronary thrombectomy,and intracoronary irradiation.
18

than those for BMS, physicians incentives were stronger to reduce DES more. However, the increasein BMS indicates that under gainsharing, for some patients they were willing to substitute BMS forDES but not willing to provide no stent; this is evident by the fact that BMS spending increasedwhen quantity targets were in place for both types of stents.25 For DES, costs remained low afterthe gainsharing incentives were removed, suggesting that the information shared during gainsharingaltered practice patterns in ways that persisted.
5.4 E!ects on Standardization
As the model indicates, gainsharing’s incentives can diminish the amount of within-physician stan-dardization when a physicians’ preferred drugs and devices vary across his patients. When pref-erences are weak or alternative products are close substitutes, however, gainsharing can promotestandardization on prices by enhancing hospitals’ negotiating power with manufacturers, and theresulting similarity of prices can attenuate physicians’ need to actually standardize on manufac-turer. We also investigate the degree of standardization at the practice level, because the groupincentives of gainsharing might promote coordination through information sharing and monitoring;and the hospital level, which influences the prices paid by the hospital for the drugs and devicesand will reflect coordination and information sharing between practices as well as within the lowertwo levels. Although these group and hospital-level measures reflect the aggregation of the physi-cians’ decisions for each patient, standardization at the three levels are not necessarily positivelycorrelated. This is because physicians or groups can standardize to di!erent treatment vectors, orbecause physicians might specialize in the types of patients ("i) that they treat. We test the lattercase by examining whether standardization is greater for patients with certain clinical risk factors.
We generate several measures of standardization. For standardization on manufacturer, we cre-
ate a Herfindahl-Hirschman Index (HHIaght =Ca&
c=1
$qTcgh
qTagh
%2
for category a with Ca manufacturers)
and the top manufacturer’s share of the total volume in the category (CR1).26 Standardization onprice is measured as the standard deviation of prices in the category (with the outliers trimmed asabove). This measure incorporates the e!ects of both physicians’ choices of devices (the substitutione!ect) and the outcomes of hospital-manufacturer bargaining.
We implement the regression:
Yght = $0 + $1Gg + $2Ag + $3GQg + $4AQg + $5Tt + $6Hh + %ght (26)
where Yght is the HHI or standard deviation of prices, T is a vector of year-by-quarter fixed e!ects,H is a vector of provider fixed e!ects that depend on the level of analysis (physician, practice, orhospital), G is an indicator for gainsharing, A is an indicates after or between gainsharing, GQ
indicates whether the category also included a quantity target, AQ indicates time between or aftera quantity target, and %ght is an i.i.d error term. Data from the non-gainsharing hospitals areincluded to define the secular time trend in the physician and hospital-level analyses. However,because the data for these hospitals lack the physician practice a"liations, they are excluded fromall practice-level analysis, and the time trend is identified by the gainsharing-participating hospitalsonly.
Because the HHI ranges from 0 to 1, we estimate them with fractional logit models (Papkeand Wooldridge (1996)).27 The estimates for drug-eluting stents begin in the first quarter of 2004
25In unreported models that do not distinguish the price target e"ects from the quantity target e"ects, we findreductions in DES costs of $343, or 15.6% and reductions of BMS costs of $51.1, or just under 7%.
26Because the CR1 results were virtually identical to those for HHI, we do not report them separately.27The preliminary results presented here are from linear models.
19

after the second manufacturer, Boston Scientific, entered the market, giving physicians a choiceof manufacturer. To reduce the influence of noise in our dependent variables, we weight eachobservation (defined based on the provider, year-by-quarter, and gainsharing status) by total numberof devices used for the category.
Table 3 presents the incremental e!ects of gainsharing on standardization as measured by HHIand the standard deviation of product prices. The results provide consistent evidence that addingquantity targets to price targets promoted standardization for both DES and BMS. At all threelevels, quantity targets lowered the standard deviation of prices paid for DES. The lack of stan-dardization on manufacturer suggests that this resulted from quantity targets promoting hospitals’ability to negotiate similar prices from all of the DES manufacturers. Quantity targets for BMS, incontrast, both increased the HHI and lowered the variation in prices at all three levels (though thewithin-hospital e!ect on price variation is not significant at p < 0.05.) This indicates that physi-cians concentrated their purchases among fewer BMS manufacturers, relative to non-gainsharingphysicians, and this convergence occurred within physicians, groups, and hospitals. Thus relativeto the financial incentives created by gainsharing with quantity targets, physician preferences forspecific manufacturers of DES and BMS appear to be weak. This led to standardization of pur-chases, although the route to standardization di!ers between DES and BMS. Furthermore, theresults indicate that in both categories the standardization persisted after the financial incentivesfor quantity reductions were eliminated.
5.5 Validating the di!erence-in-di!erence assumption
To test the underlying assumption that the pre-gainsharing time trends in standardization wereparallel among the two groups, we ran regressions excluding the data from the gainsharing providersduring or after gainsharing:
Yaght = $0 + $1t + $2t2 + $3tF + $4t
2F + $5Hh + %aght (27)
where Y is the dependent variable of interest, t is the number of quarters since the third quarterof 2001, F is a dummy variable indicating pre-gainsharing data from a provider who later adoptedgainsharing, and H is a provider (physician or hospital) fixed e!ect.
The results in Table 4 provide evidence that the pre-gainsharing trends in standardization atthe hospital level were identical between gainsharing and non-gainsharing hospitals; the interactionsbetween the dummy indicating gainsharing in the future and time and its quadratic are not jointlysignificant at p < 0.10 for any of the four models. The evidence at the physician level is mixed,however, with joint significance at p < 0.01 for two of the four models. Specifically, the trends forvariation in DES prices and for the HHI of BMS are consistent with the results we found, suggestingthat part of the e!ect observed in Table 3 may be due to these underlying di!erences.
6 Variation in Gainsharing’s E!ects by Group Characteristics
Extending the model further allows us to consider how the e!ects of gainsharing can vary based ongroup charactersitics. Specifically, group incentives can promote information sharing among groupmembers, and this may be particularly influential when group members are more heterogeneousprior to gainsharing.
20

6.1 Heterogeneity in physician types within practices
We extend the model to consider how the e!ects of gainsharing di!er with the degree of heterogeneityamong a group’s members. We demonstrate that the predictions are ambiguous, depending onwhether the heterogeneity reflects di!erences in true underlying preferences or simply di!erences ininformation regarding the substitutability of alternative devices.
To generate predictions about how gainsharing’s e!ects vary with true heterogeneity in pref-erences, suppose that physicians vary with respect to their level of altruism (i.e., they vary in $).Next, suppose that the preferred device for a physician is ck and that the agreed upon/preferredtype of device is c (i.e., the one that follows the treatment guideline given by )qca(")). Physician k
would be willing to move to the preferred device if:
1
Dj
1
2(pca " pcka) + $(h("i, qca) " h("i, qcka)) " $(c, ck,Dj) (28)
+1
Dj
1
2
$#pcka
#qcka
qcka J +#pca
#qcka
qca J +#pcka
#qcaqcka J +
#pca
#qcaqca J
%> 0
or
+$(h("i, qca) " h("i, qcka))
> $(c, ck,Dj) "1
Dj
1
2(pca " pcka)
"1
Dj
1
2
$#pcka
#qcka
qcka J +#pca
#qcka
qca J +#pcka
#qcaqcka J +
#pca
#qcaqca J
%(29)
where we represent the punishment function as $(c, ck ,Dj) to highlight the di!erent between thephysician’s preferred device ck and the hospital’s preferred device c. Thus, as the level of altruismincreases, physicians are less likely to deviate to the preferred devices (i.e., they are willing to acceptlarger punishments to keep their preferred devices).
If, instead we reconsider the model so that physicians have particular preferences over devices(and not over their patients’ health), then physician k would be willing to move to the preferreddevice if:
hk("i, qca) " hk("i, qcka)
> $(c, ck,Dj) "1
Dj
1
2(pca " pcka)
"1
Dj
1
2
$#pcka
#qcka
qcka J +#pca
#qcka
qca J +#pcka
#qcaqcka J +
#pca
#qcaqca J
%. (30)
Both (29) and (30) show that the farther the physician’s preferred devices are from the agreed-upon treatment guideline, the more the physician is willing to accept a given level of punishmentbefore switching. That is, the farther the physician’s preferences are from the preferred device, themore the physician group will have to punish him in order to get him to comply. This suggeststhat more heterogenous groups are less likely to converge on a given device (for given levels ofmonitoring and punishments). This result may not hold, however, if preferences for particulardevices are the result of lack of information. For example, suppose that physicians have preferencesfor di!erence devices because they have little information about alternative devices (such as theirclinical value). In the absence of gainsharing, the incentive to learn about alternative devices may
21

be small. However, in the presence of gainsharing, physicians may be able to learn from each otherthrough both the provision of cheap information (through the quarterly benchmarking reports)and the greater incentive to share information (because of the group-based design.) Thus, in aheterogenous group where some physicians’ preferences align with the ‘preferred’ devices, they maybe able to transfer their knowledge about such devices to their group members, particularly thosewhose pre-gainsharing practice patterns are most di!erent from the guidelines. Thus, heterogenousgroups may actually foster more standardization then homogenous ones in cases where physicians’preferences in homogenous groups are di!erent from those of the hospital’s.
The most relevant predecessor is the model of Hamilton et al. (2003). In both, group incentivescreate a rationale for the transfer of knowledge from one type of worker to another. However, intheir model, teams were formed endogenously in response to the incentive program itself. As such,exit from the team is low cost, giving rise to within-team bargaining over the group norms due tothe threat of exiting the group. In our context, these are represented by the agreed-upon treatmentguidelines. However, we note that the bargaining aspect does not apply because groups formedprior and unrelated to gainsharing. Thus, exiting the group is costly and in fact rarely observed inour context. Additionally, our model assumes that the guidelines are established at the level of thehospital rather than the individual group.
6.2 Di!erences by group size
For physicians in solo practices, (19) reduces to:
V jk,t =
I!
i=1
Revenuei,t +A!
a=1
payoutja,t + $
I!
i=1
h("i,t, qca,t). (31)
A solo physician does not face the free-riding problem–he simply decides how much he is willing totrade o! his monetary payouts for his preferences for specific items, including the items’ e!ects onhis patients’ health.
In contrast to (22) above for group physicians, for a solo physician, the marginal e!ect ofincreasing one unit of a given device qca holding fixed the type of device and the number of patientsis (assuming an interior solution):
"1
2pca + $
#h
#qca"
1
2
#pca
#qcaqca J "
1
2
#p ca
#qcaq ca J . (32)
This solution di!ers from that of (22) in that: (i) savings are split evenly between the hospital andthe solo-physician, (ii) there are no punishments attributed by other physicians, and (iii) there areno price e!ects on other team members (i.e., the J subscript denotes the e!ect on other devicesused by the solo physician not other devices used by other group members).
If we assume that the price discount e!ect is negligible, then (32) becomes:
"1
2pca,t + $h!. (33)
In contrast to (23) for a group-practice physician, for a solo physician the marginal e!ect ofmoving away from a given device c to the physician’s utility-maximizing (or preferred) device c!
holding fixed the quantity of devices and the number of patients and ignoring the discount e!ect is:
1
2(pc"a " pca) + $(h("i, qc"a) " h("i, qca))
+1
2
$#pca
#qcaqca J +
#pc"a
#qcaqc"a J +
#pca
#qc"aqca J +
#pc"a
#qc"aqc"a J
%.
22

Thus, as the number of physicians in the practice increases, a physician has: (i) on the one handa greater incentive to move to his preferred device c! or increase the quantity of a given deviceqca because the costs of doing so are shared by both the hospital and his other group members,and (ii) on the other hand smaller as there is monitoring within the group. If the free-riding e!ectdominates (is dominated by) the monitoring e!ect, a physician in a larger group will have a greater(smaller) incentive to use his preferred device or increase his quantity of devices rather than theagreed upon device or quantity.28
6.3 Empirical results by group characteristics
We empirically examined how gainsharing’s e!ects on costs and standardization varied with groupsize and measures of productivity and its variation in the time preceding gainsharing. This followsthe analysis of Hamilton et al. (2003), who found that more heterogeneous teams of garment workerswere more productive, conditional on average productivity of the team. They also found that ahigher productivity of the most productive group member had a larger e!ect than an equally-sizedincrease in the productivity of the least productive group member. They interpret this as consistentwith both the bargaining and learning explanations within their model; because our context lacksthe bargaining aspect, our results can isolate the e!ects of information-sharing within groups. Theyalso found no evidence of free-riding: team productivity did not decline with team size.
We also build o! of the work of Gaynor et al. (2004) who analyzed the e!ects of HMO’s use ofgroup incentives. They found that the e!ects of financial incentives to lower costs diminish as groupsize increases due to free riding’s e!ects exceeding any benefits from greater mutual monitoring.In contrast, they do not find support for the idea that free riding caused physicians with smallershares of patients (and thus a smaller impact on the costs of the group as a whole) to have highercosts.
To generate productivity measures similar to Hamilton et al. (2003), we calculated each physi-cian’s average cost per category for each patient treated in the time prior to the physician’s initialgainsharing program for the category.29 We limited the analysis to physicians who treated at least 10PCI patients prior to gainsharing (during the time captured by the data.) For each group we thencalculated the average and standard deviation of these physician-level average risk-adjusted costmeasures. We also calculated the average costs of each group’s highest cost and lowest cost physi-cians and took the di!erence of those as an alternative measure of heterogeneity in pre-gainsharingproductivity. To test the e!ects of group size, we assigned groups into 4 categories based on theirnumber of physicians: solo, 2-5, 6-10 and 11 or more.
With these measures of physician and practice characteristics, we re-estimated (25) but allowedthe gainsharing e!ect to vary with these characteristics. For simplicity, we excluded the data fromtime periods where the category was between or after gainsharing; we also consider variation inthe overall gainsharing e!ect and do not estimate models that distinguish between the price andquantity targets. These models include group fixed e!ects in addition to the quarter-by-year fixede!ects and the patient risk adjustment variables. Because we lack group a"liations for the non-gainsharing hospitals, these analyses are limited to the hospitals that implemented gainsharing.
Table 5 reports the incremental e!ects from Tobit models for DES and BMS costs per patient.The first column suggests that large free-rider e!ects dominate any greater peer pressure in largergroups, so that solo physicians experienced the greatest decrease in costs of DES per patient. The
28Although the free-riding e"ect is larger for larger groups, larger groups may have more incentive to coordinate inthe first place as they are likely to be able to benefit from tier-discounts that smaller groups cannot.
29In future analysis we will generate risk-adjusted measures.
23

second column, though, suggests that these group size e!ects are driven by underlying di!erences inpre-gainsharing productivity. Specifically, groups with higher costs prior to gainsharing experiencedsubstantially larger reductions in costs during the program. That is, we find that the savings isdue to changes in behavior among higher-cost groups despite the theoretical possibility that theprogram design could pay physicians whose decisions remain unchanged. The final result in thissecond column indicates that these reductions are not due to information-sharing among teammembers. Instead, as the most costly (least productive) member of the group becomes more costly,conditional on average cost of the group, savings were smaller under gainsharing. The case of BMSappears somewhat di!erent, with some evidence (in Model 2) that groups with least expensivemembers with lower costs had greater decreases during gainsharing, suggesting some learning mayoccur.
We also consider how group characteristics a!ect standardization within the group. Table 6reports the incremental e!ects from models for the HHI and price variation, in which we allow thegainsharing e!ects to vary by group size and by the degree of pre-gainsharing standardization. The4th column indicates some free-riding e!ect, with divergence on prices increasing with group size.These results are conditional on the group’s pre-gainsharing standard deviation of DES prices, whichitself is negative. Similar to the results for DES costs in Table 5, groups with greater variation inpre-gainsharing prices experienced substantially greater convergence in prices during gainsharing.In general, however, the results in Table 6 provide little evidence that gainsharing’s e!ects onstandardization varied with group characteristics. As the model indicated, this is likely due to thefact that a majority of the programs targeted only stent prices, and the price externalities occurboth within but also between groups. In other words, participating physicians across all groups maycoordinate their purchasing because that is what is required to achieve discounts (whether due tonegotiating or contract compliance.) Such coordination is facilitated by the quarterly provision ofbenchmarking data on each participating physician in the cath lab to each participating physician,regardless of group a"lation.30
7 Discussion
When a firm’s costs depend on coordination across workers or agents, group incentives can lowercosts by promoting standardization. By causing individuals to internalize the e!ects of their owndecisions on the costs created by others, group incentives have a rationale even in contexts withoutteam production or long term relationships among group members. Because of this externality,group incentives can reduce costs even more than individual incentives that cause a worker toconsider the e!ects of his choices on only his own costs.
Our empirical analysis provided support for the model. It also provided an empirical test ofpreviously-developed rationales for group incentives, namely, the role of mutual monitoring andpeer pressure in countervailing the e!ects of moral hazard in teams. Specifically, we found thatimplementing group incentives for physicians systematically lowered the costs incurred by hospitalsfor high-priced devices. As the model highlights, standardization played a role in reducing costs. Forone type of technology, the credible threat of standardizing purchasing reduced the price di!erencesbetween manufacturers. Subsequently, we saw only a little actual standardization, as anticipatedby the model. Alternatively, for the other type of technology, the group incentive caused physiciansto converge on the brand of device being used.
We found little evidence in di!erences by group size. This may indicate that as group size in-
30Programs varied in precisely how often and what level of benchmarking data were provided.
24

creases, the greater incentive to free ride is o!set by greater peer pressure and monitoring. Althoughwe have not formally modeled groups’ decisions about the level of monitoring and punishments, ourresults suggest that the optimal level may be such that it just o!sets free-riding, so that increasesin monitoring and free-riding counteract each other as group size increases. Alternatively, it maybe that the relevant group is at the firm (hospital) level because the price externality depends onthe purchasing decisions of the firm as a whole. Other di!erences by pre-gainsharing characteristicsindicate that the incentives most altered the behavior of groups who were more costly and lessstandardized. However, we found limited evidence that such benefits accrue due to learning fromless-costly group members.
In sum, we find strong evidence that group incentives increased productivity via standardiza-tion by providing agents with a rationale to coordinate. In contrast, we find little evidence tosupport the earlier hypothesis that the heightened peer pressure of group incentives can increaseproductivity despite the greater potential for free riding. For firms in health care and other sectors,group incentives can provide an important tool to promote productivity even apart from long termrelationships among group members or the potential for peer pressure and peer monitoring.
References
Blomqvist, A. (1991). The doctor as double agent: Information asymmetry, health insurance, andmedical care. Journal of Health Economics, 10:411–422.
Brooks, J., Dor, A., and Wong, H. (1997). Hospital-insurer bargaining: An empirical investigationof appendectomy pricing. Journal of Health Economics, 16:417–434.
Cebul, R., Rebitzer, J., Taylor, L., and Voturba, M. (2008). Organizational fragmentation and carequality in the u.s. healthcare system. Journal of Economic Perspectives, 22:93–113.
Che, Y. and Yoo, S. (2001). Optimal incentives for teams. American Economic Review, 91:525–541.
Cutler, D., McClellan, M., and Newhouse, J. (2000). How does managed care do it? RAND Journal
of Economics, 31:526–548.
Dor, A., Grossman, M., and Koroukian, S. (2004). Hospital transaction prices and managed-carediscounting for selected medical technologies. American Economic Review, 94:352–356.
Dranove, D. and White, W. D. (1987). Agency and the organization of health care delivery. Inquiry,24:405–415.
Farrell, J. and Scotchmer, S. (1998). Partnerships. Quarterly Journal of Economics, 103:279–297.
Gaynor, M. and Gertler, P. (1995). Moral hazard and risk spreading in medical partnerships. RAND
Journal of Economics, 26:591–613.
Gaynor, M., Rebitzer, J., and Taylor, L. (2004). Physician incetives in health maintenance organi-zations. Journal of Political Economy, 112:914–931.
Gibbons, R. (2005). Incentives between firms (and within). Management Science, 51:2–17.
Gomez-Mejia, L., Welbourne, T., and Wiseman, R. (2000). The role of risk sharing and risk takingunder gainsharing. Academy of Management Review, 25:492–507.
25
Hamilton, B., Nickerson, J., and Owan, H. (2003). Team incentives and worker heterogeneity: Anempirical analysis of the impact of teams on productivity and participation. Journal of Political
Economy, 111:465–497.
Hansen, D. (1997). Worker performance and group incentives: A case study.
Holmstrom, B. (1982). Moral hazard in teams.
Holmstrom, B. and Milgrom, P. (1990). Regulating trade among agents. Journal of Institutional
and Theoretical Economics, 146:85–105.
Jeon, S. (1996). Moral hazard and reputational concerns in teams: Implications for organizationalchoice. ijio, 14:297–315.
Kandel, E. and Lazear, E. (1992). Peer pressure and partnerships. Journal of Political Economy,100:801–817.
Ketcham, J. and Furukawa, M. (2008). Hospital-physician gainsharing in cardiology. Health A!airs,1:803–812.
Knez, M. and Simester, D. (2001). Firm-wide incentives and mutual monitoring at continentalairlines. Journal of Labor Economics, 19:743–772.
La!ont, J. J. and N’Guessan, T. (2001). Group contracting and enforcement. Journal of Institutional
and Theoretical Economics, 157:487–49.
Levin, J. and Tadelis, S. (2005). Profit sharing and the role of professional partnerships. Quarterly
Journal of Economics, 120:131–171.
Ma, A. (1988). Unique implementation of incentive contracts with many agents. Review of Economic
Studies, 55:555–571.
Macho-Stadler, I. and Perez-Castrillo, J. D. (1993). Moral hazard with several agents. 11:73–100.
McAfee, R. P. and McMillan, J. (1991). Optimal contracts for teams. International Economic
Review, 32:561–577.
Nalbantian, H. and Schotter, A. (1997). Productivity under group incentives: An experimentalstudy. American Economic Review, 87:314–341.
Papke, L. and Wooldridge, J. (1996). Econometric methods for fractional response variables withan application to 401(k) plan participation rates. Journal of Applied Econometrics, 11:619–632.
Prendergrast, C. (1999). The provision of incentives in firms.
Saver, R. (2003). Squandering the gain: Gainsharing and the continuing dilemma of physicianfinancial incentives.
The American Medical Group Association (2007). Physician compensation survey.
Varian, H. (1990). Monitoring agents with other agents. Journal of Institutional and Theoretical
Economics, 146:153–174.
26

Wageman, R. (1995). Interdependence and group e!ectiveness. Administrative Science Quarterly,40:145–180.
Welbourne, T., Balkin, D., and Gomez-Mejia, L. (1995). Gainsharing and mutual monitoring: Acombined agency-organizational justice interpretation. Academy of Management Journal, 38:881–899.
27

FIGURE 1. Total and Device Cost per Patient, 2000-2007
0
500
1000
1500
2000
2500
3000
1 2 3 4 1 2 3 4 1 2 3 4 1 2 3 4 1 2 3 4 1 2 3 4 1 2 3 4 1 2 3 4
2000 2001 2002 2003 2004 2005 2006 2007
Total Cost Device Cost
$2742
$1505
$2484

TABLE 1. Start Dates and Participation in Gainsharing Programs in Cardiology in the Study Sample
Annual Program 1 Annual Program 2 Annual Program 3 Annual Program 4
Hospital 1 January 1, 2003 January 1, 2004 January 1, 2005
N (MDs/practices) 17/1 15/1 16/1
Hospital 2 April 1, 2003 April 1, 2004 April 1, 2005 September 1, 2006
N (MDs/practices) 29/6 29/7 26/6 28/5
Hospital 3 April 1, 2005 January 1, 2007
N (MDs/practices) 43/9 39/8
Hospital 4 November 1, 2005 January 1, 2007
N (MDs/practices) 17/7 13/5
Hospital 5 November 1, 2005
N (MDs/practices) 17/5
Hospital 6 July 1, 2006
N (MDs/practices) 31/4
NOTES: Data used in this study end June 30, 2007.

Drug-eluting
stents
Bare metal
stents
Price target -315.09 -41.83
[26.02]*** [9.88]***
Between or After Price Target -308.35 19.73
[33.16]*** [14.56]
Quantity Target -129.14 128.20
[74.0]** [14.46]***
Between or After Quantity Target -231.64 93.66
[74.10]** [30.07]**
N 209,734 210,504
Mean of dependent variable 2200.0 505.6
Standard errors in brackets.
* p<0.05 ** p<0.01 ***p<0.001
Cost per patient for
Marginal effects from Tobit models that include hospital and year-by-
quarter fixed effects and patient risk adjustment variables.
Analysis is limited to patients who received a percutaneous coronary
intervention.
TABLE 2. Incremental effects of gainsharing on risk-adjusted costs per
patient

TABLE 3. Incremental effects of gainsharing on within-provider standardization
Manufacturer
HHI
Price Std
Dev
Manufacturer
HHI
Price Std
Dev
Within-physician
Price target 0.030 -4.67 0.016 16.997
[0.013]* [4.908] [0.017] [8.567]*
Between or After Price Target 0.013 -18.51 0.01 20.998
[0.018] [6.334]** [0.030] [17.244]
Quantity Target 0.047 -179.76 0.151 -67.59
[0.053] [12.100]*** [0.022]*** [18.184]***
Between or After Quantity Target 0.12 -179.22 0.168 -79.93
[0.059]* [11.940]*** [0.048]*** [30.845]**
N 8375 8375 13646 13646
Mean of dependent variable 0.843 59.42 0.780 94.55
Within-hospital
Price target 0.040 -7.05 0.001 33.00
[0.023] [15.133] [0.024] [13.906]*
Between or After Price Target 0.016 -28.37 0.018 36.63
[0.038] [17.581] [0.037] [20.547]
Quantity Target -0.003 -184.40 0.236 -42.062
[0.040] [25.715]*** [0.037]*** [35.530]
Between or After Quantity Target 0.104 -181.99 0.213 -67.58
[0.043]* [24.552]*** [0.051]*** [51.031]
N 915 915 1903 1903
Mean of dependent variable 0.753 89.35 0.621 144.16
Within-group
Price target 0.023 2.82 0.036 21.46
[0.023] [9.103] [0.025] [18.861]
Between or After Price Target -0.034 -22.84 0.11 10.94
[0.048] [14.643] [0.041]** [32.253]
Quantity Target -0.062 -106.86 0.291 -75.80
[0.058] [10.899]*** [0.032]*** [32.119]*
Between or After Quantity Target 0.023 -112.00 0.287 -92.45
[0.063] [10.567]*** [0.061]*** [49.293]
N 313 313 396 396
Mean of dependent variable 0.758 45.20 0.715 92.74
HHI is Herfindahl-Hirschman Index.
Robust standard errors in brackets.
* p<0.05 ** p<0.01 ***p<0.001
All models include provider and year-by-quarter fixed effects. Group-level estimates do not
include the non-gainsharing hospitals. Estimates are weighted by total volume.
Drug-eluting stents Bare metal stents
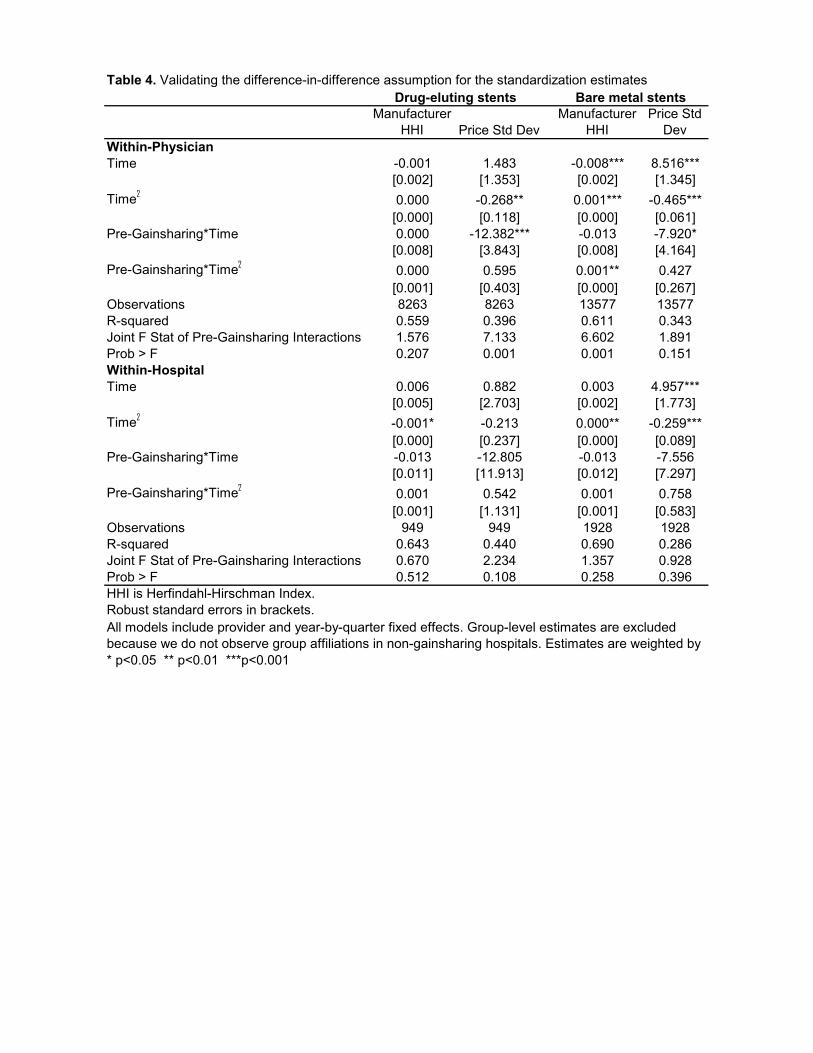
Table 4. Validating the difference-in-difference assumption for the standardization estimates
Manufacturer
HHI Price Std Dev
Manufacturer
HHI
Price Std
Dev
Within-Physician
Time -0.001 1.483 -0.008*** 8.516***
[0.002] [1.353] [0.002] [1.345]
Time!
0.000 -0.268** 0.001*** -0.465***
[0.000] [0.118] [0.000] [0.061]
Pre-Gainsharing*Time 0.000 -12.382*** -0.013 -7.920*
[0.008] [3.843] [0.008] [4.164]
Pre-Gainsharing*Time!
0.000 0.595 0.001** 0.427
[0.001] [0.403] [0.000] [0.267]
Observations 8263 8263 13577 13577
R-squared 0.559 0.396 0.611 0.343
Joint F Stat of Pre-Gainsharing Interactions 1.576 7.133 6.602 1.891
Prob > F 0.207 0.001 0.001 0.151
Within-Hospital
Time 0.006 0.882 0.003 4.957***
[0.005] [2.703] [0.002] [1.773]
Time!
-0.001* -0.213 0.000** -0.259***
[0.000] [0.237] [0.000] [0.089]
Pre-Gainsharing*Time -0.013 -12.805 -0.013 -7.556
[0.011] [11.913] [0.012] [7.297]
Pre-Gainsharing*Time!
0.001 0.542 0.001 0.758
[0.001] [1.131] [0.001] [0.583]
Observations 949 949 1928 1928
R-squared 0.643 0.440 0.690 0.286
Joint F Stat of Pre-Gainsharing Interactions 0.670 2.234 1.357 0.928
Prob > F 0.512 0.108 0.258 0.396
HHI is Herfindahl-Hirschman Index.
Robust standard errors in brackets.
* p<0.05 ** p<0.01 ***p<0.001
Drug-eluting stents Bare metal stents
All models include provider and year-by-quarter fixed effects. Group-level estimates are excluded
because we do not observe group affiliations in non-gainsharing hospitals. Estimates are weighted by

TABLE 5. Variation in gainsharing's effects on risk-adjusted category cost per patient, by group characteristics
Model 1 Model 2 Model 3 Model 1 Model 2 Model 3
Group size
Gainsharing*Solo -269.347 216.624 336.694 -49.876 -36.060 -71.040
[106.45]* [155.11] [132.19]* [47.22] [50.22] [51.50]
Gainsharing*Size 2-5 -90.759 228.688 358.417 53.106 23.310 50.133
[82.08] [132.05] [118.52]** [28.07] [34.84] [39.56]
Gainsharing*Size 6-10 -204.778 8.965 235.647 53.690 -44.710 36.344
[40.46]*** [119.91] [95.297]* [13.68]*** [32.14] [32.32]
Gainsharing*Size 11+ -67.846 131.547 401.270 13.310 -96.258 -1.996
[33.85]* [128.11] [97.016]*** [11.03] [32.44]** [34.10]
Cost per patient prior to gainsharing
Gainsharing*Average across MDs in Group -0.436 -0.261 -0.037 0.045
[0.055]*** [0.035]*** [0.13] [0.030]
Gainsharing*Minimum MD's average -0.034 -0.132
[0.040] [.037]**
Gainsharing*Maximum MD's average 0.255 0.147
[0.063]*** [0.11]
Gainsharing*Standard Deviation between MDs 0.327 -0.124
[0.12]** [0.21]
Observations 29991 28626 28618 34835 33394 33092
Results are the incremental effects from Tobit models.
All models include provider and year-by-quarter fixed effects and patient risk adjustment variables.
* p<0.05 ** p<0.01 ***p<0.001
Drug-eluting stents Bare metal stents
Analysis is limited to patients who received a percutaneous coronary intervention and treated by MDs who treated more than
10 PCI patients in the data prior to gainsharing.

Title 6. Incremental effects of gainsharing on within-group standardization, by group characteristics
Model 1 Model 2 Model 1 Model 2 Model 1 Model 2 Model 1 Model 2
Group size
Gainsharing*Solo 0.051 -0.175 -0.589 27.238 0.007 0.013 -25.875 -19.647
[0.043] [0.196] [12.034] [12.500]* [0.092] [0.143] [34.517] [43.907]
Gainsharing*Size 2-5 0.02 -0.195 -9.521 26.403 -0.227 -0.222 23.478 29.96
[0.046] [0.185] [16.608] [16.814] [0.057]*** [0.120] [33.096] [45.744]
Gainsharing*Size 6-10 0.075 -0.133 -9.553 38.898 0.041 0.046 19.1 27.031
[0.030]* [0.171] [14.413] [16.289]* [0.040] [0.096] [26.969] [41.384]
Gainsharing*Size 11+ -0.004 -0.198 -0.482 40.136 -0.001 0.003 36.84 45.563
[0.022] [0.156] [11.402] [12.469]** [0.036] [0.097] [22.720] [45.670]
Standardization prior to gainsharing
Gainsharing*Prior HHI 0.306 -0.009
[0.251] [0.144]
Gainsharing*Prior Std Dev of Prices -0.544 -0.076
[0.065]*** [0.328]
N 256 256 256 256 355 355 355 355
Dependent Variable Mean 0.75 0.75 50.67 50.67 0.72 0.72 94.61 94.61
Standard errors in brackets
All models include group and year-by-quarter fixed effects. Fractional logit models are used for HHI and CR1.
* p<0.05 ** p<0.01 ***p<0.001
Drug-eluting stents
Manufacturer HHI Price Std Dev
Bare metal stents
Manufacturer HHI Price Std Dev

N = 1,025,784
Variable Mean Std Dev
age 63.581 13.274
age_missing 0.004 0.064
Caucasian 0.717 0.451
African american 0.069 0.254
Hispanic 0.069 0.254
Other race (asian, native american, other) 0.022 0.147
Race missing 0.123 0.328
Male 0.529 0.499
Sex missing 0.090 0.285
RF_SMOKER risk factor 0.184 0.387
RF_SMOKERFMR risk factor 0.260 0.439
RF_SMOKER missing 1.000 0.000
RF_SMOKERFMR missing 1.000 0.000
RF_ACUTE risk factor 0.053 0.224
RF_ACUTE missing 0.001 0.023
RF_SHOCK risk factor 0.001 0.036
RF_SHOCK missing 0.001 0.023
RF_STROKE risk factor 0.070 0.255
RF_STROKE missing 0.000 0.022
RF_LUNG risk factor 0.108 0.310
RF_LUNG missing 0.000 0.022
RF_CONGENITAL risk factor 0.006 0.074
RF_CONGENITAL missing 0.000 0.022
RF_CHF risk factor 0.080 0.271
RF_CHF missing 0.036 0.187
RF_DIABETES risk factor 0.278 0.448
RF_DIABETES missing 0.000 0.017
RF_EF30 risk factor 0.019 0.137
RF_EF30 missing 0.001 0.023
RF_EF30_50 risk factor 0.019 0.135
RF_EF30_50 missing 0.001 0.023
RF_FAMILY risk factor 0.442 0.497
RF_FAMILY missing 0.000 0.021
RF_CHOLEST risk factor 0.424 0.494
RF_CHOLEST missing 0.000 0.021
RF_HYPER risk factor 0.653 0.476
RF_HYPER missing 0.000 0.021
RF_PERIPH risk factor 0.095 0.293
RF_PERIPH missing 0.000 0.022
RF_REMOTE risk factor 0.113 0.317
RF_REMOTE missing 0.000 0.022
RF_RENAL risk factor 0.026 0.158
RF_RENAL missing 0.000 0.022
RF_TRANSPLANT risk factor 0.003 0.059
RF_TRANSPLANT missing 0.000 0.022
RF_VALVULAR risk factor 0.012 0.108
RF_VALVULAR missing 0.001 0.028
Appendix 1. Descriptive statistics of risk adjustment, demographic and
procedure variables in study sample

N = 1,025,784
Variable Mean Std Dev
Appendix 1. Descriptive statistics of risk adjustment, demographic and
procedure variables in study sample
RF_PREV_CARDSURG risk factor 0.157 0.364
RF_PREV_CARDSURG missing 0.001 0.028
RF_PREV_ABLATIONS risk factor 0.004 0.064
RF_PREV_ABLATIONS missing 0.001 0.023
RF_PREV_CONGSURG risk factor 0.002 0.041
RF_PREV_CONGSURG missing 0.001 0.023
RF_PREV_INVASIVE risk factor 0.235 0.424
RF_PREV_INVASIVE missing 0.001 0.028
RF_PREV_PERIPH risk factor 0.019 0.137
RF_PREV_PERIPH missing 0.001 0.023