standards for pet image acquisition and quantitative data...
TRANSCRIPT

Standards for PET Image Acquisition andQuantitative Data Analysis
Ronald Boellaard
Department of Nuclear Medicine and PET Research, VU University Medical Center, Amsterdam, The Netherlands
Quantitative 18F-FDG PET is increasingly being recognized as animportant tool for diagnosis, determination of prognosis, and re-sponse monitoring in oncology. However, PET quantificationwith, for example, standardized uptake values (SUVs) is affectedby many technical and physiologic factors. As a result, some ofthe variations in the literature on SUV-based patient outcomesare explained by differences in 18F-FDG PET study methods.Various technical and clinical studies have been performed tounderstand the factors affecting PET quantification. On the basisof the results of those studies, several recommendations andguidelines have been proposed with the aims of improving theimage quality and the quantitative accuracy of 18F-FDG PETstudies. In this contribution, an overview of recommendationsand guidelines for quantitative 18F-FDG PET studies in oncologyis provided. Special attention is given to the rationale underlyingcertain recommendations and to some of the differences in var-ious guidelines.
Key Words: guidelines; standards; PET; standardized uptakevalue
J Nucl Med 2009;50:11S–20SDOI: 10.2967/jnumed.108.057182
PET is increasingly being used for diagnosis, staging, andtherapy response evaluation (1–10). Interest in PET espe-cially increased after the introduction of PET/CT scanners,which allowed for the collection of both anatomic informa-tion and metabolic or functional information in vivo in onescanning session. To date, the success of PET in the oncologydomain still relies on the use of 18F-FDG (5,11,12).
In clinical practice, visual inspection of PET or PET/CTimages is the main tool for image interpretation, and forstaging or restaging, this method is usually adequate (7,13).Although visual inspection may suffice in, for example,many cases of evaluation of the response of gastrointestinalstromal tumors to imatinib and lymphoma restaging, evalu-ation of the response of solid tumors to therapy is morechallenging and requires some form of quantification. Ulti-mately, PET was developed as a quantitative tool, and itsquantitative characteristics are increasingly being recog-
nized as providing an objective, more accurate, and lessobserver-dependent measure for prognosis and responsemonitoring purposes than visual inspection alone. Quantifi-cation of 18F-FDG uptake therefore has the potential to allowan early, accurate assessment of responses to stratifyresponding and nonresponding patients (9,14). Moreover,recognition of the potential of quantitative 18F-FDG PET forearly response assessment has increased its role in anticancerdrug development (15).
Various quantitative measures can be derived from 18F-FDG PET studies (16). The rate of metabolism of glucose,obtained by applying a pharmacokinetic model to dataderived from dynamic PET studies, may be considered thegold standard; however, its requirement for dynamic scan-ning, which is not feasible for whole-body scans, prohibits itsroutine use in many clinical settings (17). Moreover, dynamicscanning generally requires scan durations of 60–90 min,which reduce patient throughput; in addition, with currentPET/CT scanners, dynamic studies cover a field of view ofonly up to 20 cm. However, this kind of quantification canprovide valuable information regarding the validity of the useof simplified quantitative methods (18). The difficultiesassociated with quantitative data on the rate of metabolismof glucose have led to the development of simplified quan-titative measures that can be combined with static whole-body 18F-FDG PET studies.
The standardized uptake value (SUV) is an example ofsuch a simplified measure, and it is now probably the mostwidely used method for the quantification of 18F-FDG PETstudies, although other measures have been developed aswell (19–21). The SUV represents the 18F-FDG uptakewithin a tumor, measured over a certain interval after 18F-FDG administration and normalized to the dose of 18F-FDGinjected and to a factor (such as body weight) that takes intoaccount distribution throughout the body (22,23). The SUVnormalized to body weight is given by the following equation(SUV equation):
SUV 5ACvoi ðkBq=mlÞ
FDGdose ðMBqÞ=BW ðkgÞ: Eq. 1
In Equation 1, ACvoi represents the average activity con-centration, in kBq/mL, in the specified volume of interest(or the maximum value); FDGdose is the dose of 18F-FDG
Received Nov. 3, 2008; revision accepted Jan. 29, 2009.For correspondence or reprints contact: Ronald Boellaard, Department
of Nuclear Medicine and PET Research, VU University Medical Center,De Boelelaan 1117, 1081 HV Amsterdam, The Netherlands.
E-mail: [email protected] ª 2009 by the Society of Nuclear Medicine, Inc.
STANDARDS FOR QUANTITATIVE PET • Boellaard 11S
by on April 26, 2018. For personal use only. jnm.snmjournals.org Downloaded from

administered, in megabecquerels (corrected for physicaldecay); and BW is the body weight, in kilograms.
Many factors affect the outcome of the SUV. These fac-tors can be both physiologic (9,22,24,25) and technical(26–29) and have been discussed extensively elsewhere(4,7,9,13,17,30–35). An overview of these factors is pro-vided in Table 1. Approximate ranges and maximum effectsare provided to give inexperienced readers an impression ofthe magnitude of potential errors. However, because thevalues listed were derived from published studies and un-published data, deviations might be both larger and smaller inspecific cases. Moreover, many factors have, on average, arelatively small effect (,15%) on the SUVoutcome, yet theaccumulation of many small errors can lead to substantialdifferences in SUVoutcomes among sites (26,43–45). There-fore, strict standardization is of utmost importance.
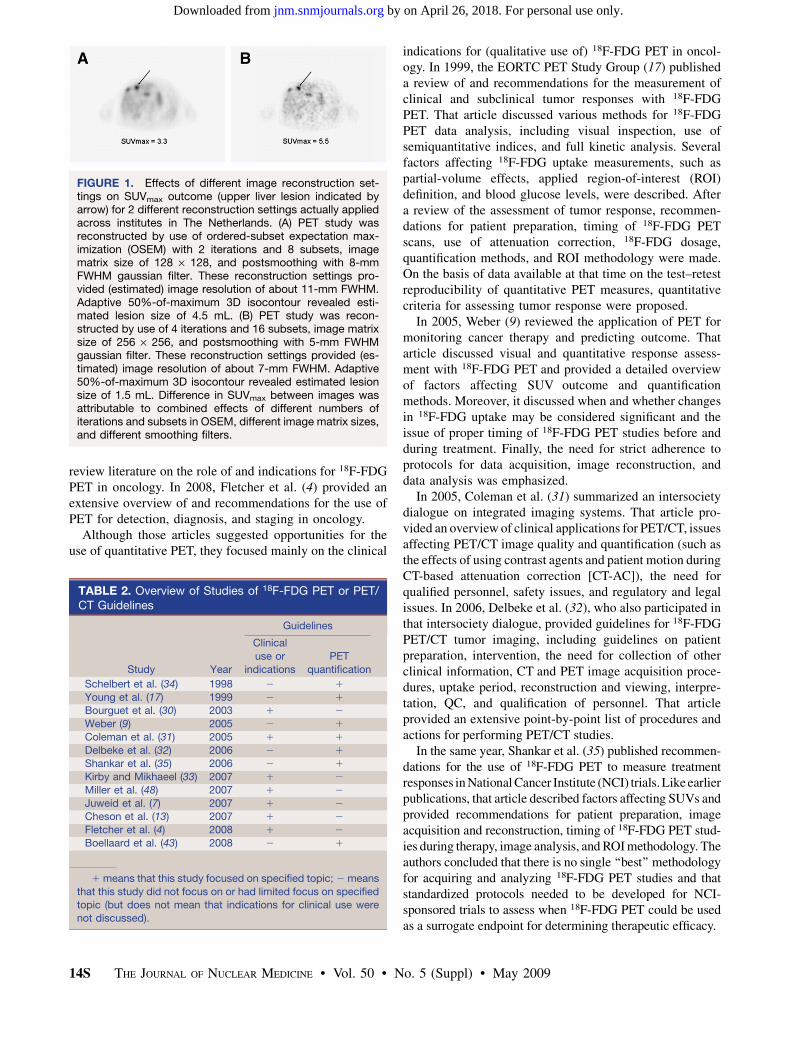
Figure 1 shows an example of the effects of image re-construction settings on the maximum SUV (SUVmax) in alesion. As a consequence of such effects, the SUV has beenreferred to as ‘‘silly useless value’’ (46), a description that ispartly justified because of the lack of standardization ofprocedures; such standardization is needed to minimize thevariability of SUVs across institutes and studies. The maindisadvantage of nonstandardized SUVs is that, although aproof of concept for various clinical applications has beendemonstrated in several single-center studies, the resultscannot be directly applied at other sites or in multicenterstudies (45). Such heterogeneity partly explains why even thelatest response evaluation criteria in solid tumors (47) still donot incorporate quantitative PET, although the oncologiccommunity does recognize its potential.
The need for standardization of quantitative PET wasrecognized as early as 1998 by Schelbert et al. (34) and in1999 by a European Organization for Research and Treat-ment of Cancer (EORTC) task force (17). Subsequently,several other studies reported the impact of various factors onPET quantification and provided recommendations for per-forming 18F-FDG PET studies. Some of these studies focusedmainly on the clinical use of or indications for 18F-FDG PET,on improving PET study quality, and on providing guidelinesfor PET study interpretation or measurement of the responseto therapy (4,7,13,30,31,33,48). Coleman et al. (31) dis-cussed various aspects and technical issues regarding the useof integrated imaging systems, that is, PET/CT. In the presentreview, the focus is on recommendations and standards givenspecifically for quantitative 18F-FDG PET oncology studies.The various factors affecting PET quantification and recom-mendations given in various reports are discussed.
STANDARDS AND RECOMMENDATIONS FOR18F-FDG PET
There are wide variations in PET and PET/CT scanners,each having its own characteristics, PET acquisition pos-sibilities (e.g., acquisitions in 2-dimensional [2D] and3-dimensional [3D] modes), image reconstruction methods,and software for visualization and data analysis. The
performance of a PET or PET/CT scanner is generallycharacterized with National Electrical Manufacturers As-sociation (NEMA) NU 2 standards. The NEMA NU 2protocol provides a standardized way of assessing the basicperformance characteristics of a scanner, such as sensitiv-ity, spatial resolution, noise equivalent count rate curves,scatter fraction, counting rate linearity, and image quality.Although scanner performance can be well characterizedwith NEMA NU 2 standards, there are still considerabledifferences in SUV outcomes among centers because ofdifferences in patient preparation methods, PET acquisitionsettings, image reconstruction algorithms and settings, anddata analysis software (26,45).
Differences in scanner performance, (implementation of)image reconstruction algorithms, and data analysis toolscannot be eliminated easily, as they generally are built intothe PET or PET/CT scanner itself; that is, scanners fromdifferent vendors usually have different acquisition proto-cols, image reconstruction algorithms, and data analysissoftware. Moreover, default settings used within these algo-rithms or software may differ as well. Consequently, it mayseem impossible to design guidelines that can ensure theappropriate exchange of SUV results in a multicenter setting.However, it has been shown that SUV results are determinedprimarily by several factors, parameters, or settings that canand should be standardized (45). Table 1 provides an over-view of factors affecting SUVs and their impact on SUVs,which have been extensively discussed in numerous articles(9,14,17,22,25–28,34,45,49,50). Following is a short reviewof some published recommendations for quantitative PET.
OVERVIEW OF PUBLISHED 18F-FDG PETRECOMMENDATIONS AND GUIDELINES
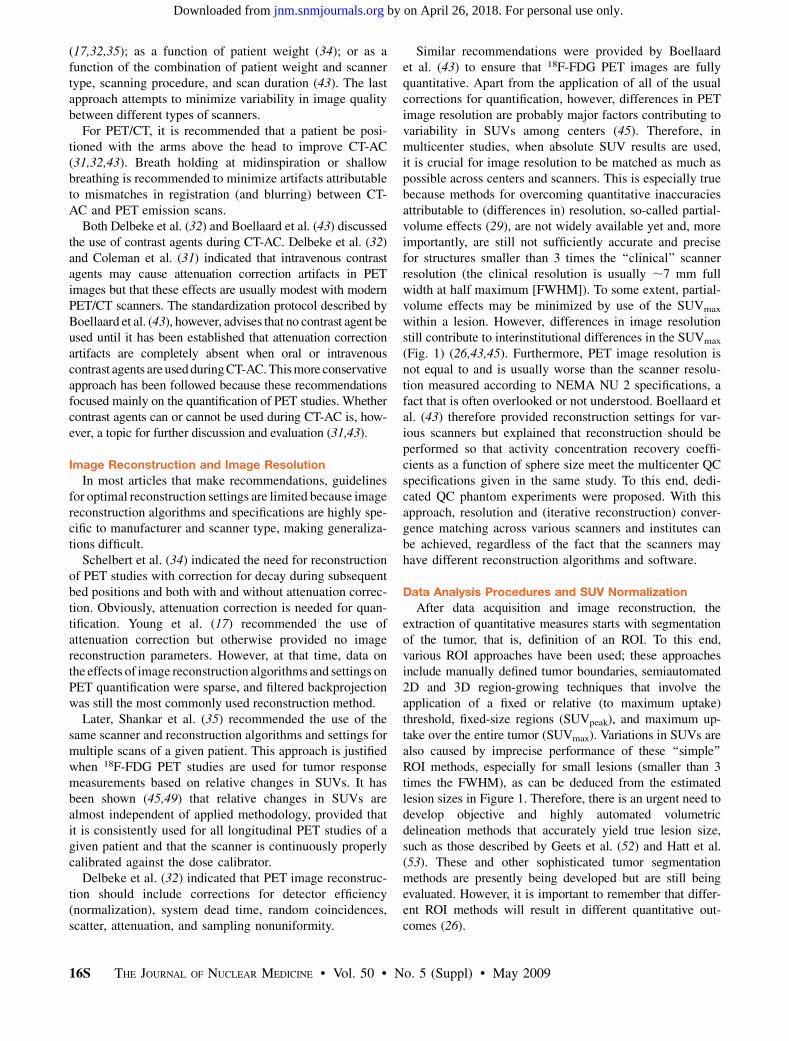
Table 2 provides an overview of published recommen-dations or guidelines for 18F-FDG PET or PET/CT. To myknowledge, Table 2 lists articles with detailed and com-prehensive recommendations or guidelines for performingand analyzing 18F-FDG PET studies. These articles wereobtained from a PubMed search with (a combination of) thefollowing search terms: 18F-FDG, PET, recommendation,standard, guideline, harmonization, quantification, and pro-tocol. Some of the articles dealing specifically with quan-titative PET are discussed here; however, various otherstudies reported on the effects of various factors on SUVs.
A decade ago, Schelbert et al. (34) proposed a procedureguideline for tumor imaging with 18F-FDG. That articlesummarized indications for 18F-FDG PET and providedrecommendations for patient preparation, image acquisitionand intervention procedures, and processing (reconstruc-tion) and interpretation or reporting. It was stated thatquantification might be helpful in identifying malignanttumors. Moreover, the need for quality control (QC) ofradiopharmaceuticals and instrumentation was indicated.Finally, sources of error affecting PET interpretation werelisted. In 2002, Bourguet et al. (30) provided guidelines onthe clinical use of PET. The objective of that article was to
12S THE JOURNAL OF NUCLEAR MEDICINE • Vol. 50 • No. 5 (Suppl) • May 2009
by on April 26, 2018. For personal use only. jnm.snmjournals.org Downloaded from

TABLE 1. Overview of Factors Affecting 18F-FDG PET Quantification
Category Factor Explanation
Typical range (maximum
effect)* Reference or source
Technical
errors
Relative calibration between PET
scanner and dose calibrator
Systematic error in SUV is equal to
error in relative calibration between
PET scanner and dose calibrator
210%210% (650%) 44,45
Residual activity in syringe
or administration system
Lower net administered dose results in
incorrect lower uptake level and SUV
0%25% (typically ,15%,
but can be much greater
in worst-case situations)
Unpublished data
Incorrect synchronization of
clocks of PET/CT camera
and dose calibrator
Incorrect decay correction results in
incorrect SUV
0%210% (21%, as seen in
ongoing multicenter
study)
Unpublished data
Injection vs. calibration time Incorrect time interval is used for decay
correction of administered dose
0%210% (NaN) Unpublished data
Paravenous administration of18F-FDG
Rate and quantity of delivery of 18F-
FDG to tumor are reduced, resulting
in incorrect SUV
0%250% or more, strongly
depending on quality of
administration
Estimated values
based on unpublished
data
Biologic
factors
Blood glucose level Lower uptake levels or SUVs occur with
increasing blood glucose levels
215%2115% (675%)y 14,16,54
Uptake period Higher SUVs occur at increasing time
intervals between injection and start
of PET study
10%2115% at 60–90 min
(630%)
25
Patient motion or breathing Image artifacts result from mismatches
in positions between CT-AC and
PET emission scans, and lower SUV
may result from respiratory motion
(resolution loss)
0%230% (660%) 36,37
Patient comfort Patient stress and poor waiting conditions
result in uptake of 18F-FDG in muscle or
brown fat and affect SUV quantification
NaN, mainly giving rise to
false-positive results
(SUVBW 5 2–12) and
possibly incorrect SUV in
case of spillover
38
Inflammation Inflammatory processes near or at tumor
result in false-positive increase in SUV
NaN, mainly giving rise to
false-positive results and
possibly incorrect SUV in
case of spillover
39
Physical
factors
Scan acquisition parameters SNR of PET scan is affected, e.g., lower
SNR results in upward bias of SUV
0%215% (615%) 26,45
Image reconstruction parameters Insufficient convergence and lower
resolution result in lower SUV and
increase in partial-volume effects;
insufficient convergence makes SUV
more dependent on surrounding
activity distributions
230%20% (230%) 26,27,43,45,49,50
ROI SUV outcome is strongly dependent on
size and type of ROI used
0%255% (655%) 26,45
Normalization factor for SUV SUV outcomes are numerically different
when body weight, body surface
area, and lean body mass are used as
normalization factors in SUV equation
Trivialz 14,22
Blood glucose level correction Higher serum glucose level results in
underestimation of SUV; use of
serum glucose level correction in
SUV equation therefore results in
different SUV outcomes
215%215% (675%)y 14,16,54
Use of contrast agents during
CT-AC
Overestimation of attenuation and
therefore higher SUV (upward bias)
may occur
0%215% (650%)§ 40–42
*Values represent estimated or approximate ranges and maximum deviations derived from published studies or unpublished data. Therefore,
quoted values partly reflect personal opinions of authors. However, listed references or other reviews provide more details. For unpublished
data, values were estimated or derived from my own data. NaN 5 not a number available; SUVBW 5 SUV normalized to body weight.yVery large errors may occur when blood glucose levels are very high (.11 mmol/L). Blood glucose levels should be checked before PET
study; if blood glucose levels are high, PET study should be rescheduled (43).zUse of different normalization factors (e.g., body weight [kg] and body surface area [m2]) in SUV equation yields different SUVs.§In general, use of contrast agents produces artifacts of up to about 20%. However, very large errors may occur when high-density oral
contrast agents (e.g., barium) are used.
STANDARDS FOR QUANTITATIVE PET • Boellaard 13S
by on April 26, 2018. For personal use only. jnm.snmjournals.org Downloaded from
review literature on the role of and indications for 18F-FDGPET in oncology. In 2008, Fletcher et al. (4) provided anextensive overview of and recommendations for the use ofPET for detection, diagnosis, and staging in oncology.
Although those articles suggested opportunities for theuse of quantitative PET, they focused mainly on the clinical
indications for (qualitative use of) 18F-FDG PET in oncol-ogy. In 1999, the EORTC PET Study Group (17) publisheda review of and recommendations for the measurement ofclinical and subclinical tumor responses with 18F-FDGPET. That article discussed various methods for 18F-FDGPET data analysis, including visual inspection, use ofsemiquantitative indices, and full kinetic analysis. Severalfactors affecting 18F-FDG uptake measurements, such aspartial-volume effects, applied region-of-interest (ROI)definition, and blood glucose levels, were described. Aftera review of the assessment of tumor response, recommen-dations for patient preparation, timing of 18F-FDG PETscans, use of attenuation correction, 18F-FDG dosage,quantification methods, and ROI methodology were made.On the basis of data available at that time on the test–retestreproducibility of quantitative PET measures, quantitativecriteria for assessing tumor response were proposed.
In 2005, Weber (9) reviewed the application of PET formonitoring cancer therapy and predicting outcome. Thatarticle discussed visual and quantitative response assess-ment with 18F-FDG PET and provided a detailed overviewof factors affecting SUV outcome and quantificationmethods. Moreover, it discussed when and whether changesin 18F-FDG uptake may be considered significant and theissue of proper timing of 18F-FDG PET studies before andduring treatment. Finally, the need for strict adherence toprotocols for data acquisition, image reconstruction, anddata analysis was emphasized.
In 2005, Coleman et al. (31) summarized an intersocietydialogue on integrated imaging systems. That article pro-vided an overview of clinical applications for PET/CT, issuesaffecting PET/CT image quality and quantification (such asthe effects of using contrast agents and patient motion duringCT-based attenuation correction [CT-AC]), the need forqualified personnel, safety issues, and regulatory and legalissues. In 2006, Delbeke et al. (32), who also participated inthat intersociety dialogue, provided guidelines for 18F-FDGPET/CT tumor imaging, including guidelines on patientpreparation, intervention, the need for collection of otherclinical information, CT and PET image acquisition proce-dures, uptake period, reconstruction and viewing, interpre-tation, QC, and qualification of personnel. That articleprovided an extensive point-by-point list of procedures andactions for performing PET/CT studies.
In the same year, Shankar et al. (35) published recommen-dations for the use of 18F-FDG PET to measure treatmentresponses in National Cancer Institute (NCI) trials. Like earlierpublications, that article described factors affecting SUVs andprovided recommendations for patient preparation, imageacquisition and reconstruction, timing of 18F-FDG PET stud-ies during therapy, image analysis, and ROI methodology. Theauthors concluded that there is no single ‘‘best’’ methodologyfor acquiring and analyzing 18F-FDG PET studies and thatstandardized protocols needed to be developed for NCI-sponsored trials to assess when 18F-FDG PET could be usedas a surrogate endpoint for determining therapeutic efficacy.
FIGURE 1. Effects of different image reconstruction set-tings on SUVmax outcome (upper liver lesion indicated byarrow) for 2 different reconstruction settings actually appliedacross institutes in The Netherlands. (A) PET study wasreconstructed by use of ordered-subset expectation max-imization (OSEM) with 2 iterations and 8 subsets, imagematrix size of 128 · 128, and postsmoothing with 8-mmFWHM gaussian filter. These reconstruction settings pro-vided (estimated) image resolution of about 11-mm FWHM.Adaptive 50%-of-maximum 3D isocontour revealed esti-mated lesion size of 4.5 mL. (B) PET study was recon-structed by use of 4 iterations and 16 subsets, image matrixsize of 256 · 256, and postsmoothing with 5-mm FWHMgaussian filter. These reconstruction settings provided (es-timated) image resolution of about 7-mm FWHM. Adaptive50%-of-maximum 3D isocontour revealed estimated lesionsize of 1.5 mL. Difference in SUVmax between images wasattributable to combined effects of different numbers ofiterations and subsets in OSEM, different image matrix sizes,and different smoothing filters.
TABLE 2. Overview of Studies of 18F-FDG PET or PET/CT Guidelines
Guidelines
Study Year
Clinical
use or
indications
PET
quantification
Schelbert et al. (34) 1998 2 1
Young et al. (17) 1999 2 1
Bourguet et al. (30) 2003 1 2
Weber (9) 2005 2 1
Coleman et al. (31) 2005 1 1
Delbeke et al. (32) 2006 2 1
Shankar et al. (35) 2006 2 1
Kirby and Mikhaeel (33) 2007 1 2
Miller et al. (48) 2007 1 2
Juweid et al. (7) 2007 1 2
Cheson et al. (13) 2007 1 2
Fletcher et al. (4) 2008 1 2
Boellaard et al. (43) 2008 2 1
1 means that this study focused on specified topic; 2 means
that this study did not focus on or had limited focus on specifiedtopic (but does not mean that indications for clinical use were
not discussed).
14S THE JOURNAL OF NUCLEAR MEDICINE • Vol. 50 • No. 5 (Suppl) • May 2009
by on April 26, 2018. For personal use only. jnm.snmjournals.org Downloaded from

Lammertsma et al. (18) discussed various methods foranalyzing 18F-FDG PET studies performed to monitor tumorresponse. They emphasized the need for standardization.Moreover, they indicated that the relationship between SUVsand data obtained from a full kinetic analysis may be alteredduring (i.e., because of) treatment. In other words, theobserved relative change in the SUV may under- or overes-timate the response measured by a full quantitative outcomemeasure derived from a kinetic analysis. Consequently, theneed to validate the use of simplified measures, such as theSUV, against a full kinetic analysis for response monitoringtrials was stressed, as was also done by the EORTC PETStudy Group (17).
In 2008, a Dutch cooperative group (43) published aprotocol for the standardization and quantification of 18F-FDG PET studies in multicenter trials. After a descriptionof factors that affect SUVs, recommendations for patientpreparation, PETacquisition, 18F-FDG dosage, image recon-struction, data analysis, ROI procedures, SUV normaliza-tion, and QC measures were made. That article specificallyfocused on the interchangeability of both absolute andrelative SUV results in multicenter trials.
OVERVIEW OF SPECIFIC RECOMMENDATIONS FORQUANTITATIVE 18F-FDG PET STUDIES
As may be deduced from Table 1 and the precedingliterature summary, the standardization of quantitative 18F-FDG PET studies is urgently needed and may be achievedby the standardization of several principles. These princi-ples or items reflect, to some extent, the chronological orderof performing PET studies and may be identified as patientpreparation procedures and interventions, 18F-FDG admin-istration procedures, PET study acquisition, image qualityand signal-to-noise ratio (SNR), image reconstruction,clinical image resolution, data analysis procedures andSUV normalization, and QC of instrumentation and qual-ification of personnel (43).
Patient Preparation Procedures
The procedures used for patient preparation affect 18F-FDG uptake in both tumors and surrounding healthytissues. Patient preparation procedures therefore should beaimed at maximizing uptake in tumors and minimizinguptake in healthy tissues, thereby optimizing image qualityand reducing SUV variability among subjects. The variousstudies described earlier all provided guidelines for patientpreparation, and there seemed to be a general consensus onthe optimal preparation procedure. In general, guidelineswere given for a fasting period to achieve euglycemicconditions, hydration, use of sedatives and waiting condi-tions, bladder voiding or use of diuretics, and limits forblood glucose levels. In most cases, additional guidelineswere provided for diabetes mellitus patients. A completedelineation of patient preparation guidelines can be foundin the articles listed in Table 2.
Until recently, there was still some debate on the optimaltime interval between 18F-FDG administration and the startof a PET study. Lowe et al. (25) and Shankar et al. (35)reported that 18F-FDG uptake was still rising up to 120 minafter injection, although uptake curves seemed to becomeflatter at 60–90 min after injection. At present, an intervalof 60 min with a tolerance of 5–10 min seems to be con-sidered acceptable in most guidelines. In other publica-tions (17,32,34), a minimum uptake period of 30–40 minwas recommended. The shift toward a longer uptake periodmay reflect the trend toward using PET in a quantitativerather than a qualitative manner.
Additional recommendations are still needed for the timeinterval between (the end of) therapy cycles and the executionof a PET study. For chemotherapy, a minimum interval of 14 dis usually applied, but more detailed recommendations aregiven by Juweid et al. (7). For radiotherapy, intervals betweenthe end of treatment and the start of a PET study of even 3 momay be required. The optimal interval may therefore be studyspecific, and further investigations are required (11). Theappropriate timing of PET studies is one of the topicsaddressed further in other contributions in this supplementissue of The Journal of Nuclear Medicine.
It is also necessary to measure weight and, depending onthe SUV normalization procedure, the height of the patient atthe time of each PET study. Moreover, the net administereddose specified at the dose calibration time or injection time,which can vary, must be known with certainty. Because all ofthese values are entered into the SUV equation, they shouldbe reported on a scan report form or entered into the PETsystem during acquisition, so that the data are stored withinthe DICOM (Digital Imaging and Communications in Med-icine) file headers of the PET scan (43).
18F-FDG Administration Procedures
The net amount of the administered dose is directly used inthe SUV calculation. Consequently, the exact 18F-FDG dosegiven to a patient must be known; that is, the dose must becorrected for residual activity in the syringe or administrationsystem. Moreover, decay corrections must be applied tocompensate for the radioactive decay of 18F between the dosecalibration time or injection time and the beginning of acqui-sition. Therefore, clocks in the PETor PET/CT system must besynchronized with those in the dose calibrators used tomeasure or determine the dose of 18F-FDG injected. A detaileddiscussion of these issues can be found elsewhere (9,43).
PET Study Acquisition, Image Quality, and SNR
PET acquisition parameters, such as acquisition mode,scan duration per bed position, and amount of bed overlap insubsequent bed positions, in combination with patient weightand 18F-FDG dose, affect PET image quality. It has beenshown that poorer image quality (increased noise levels) mayresult in an upward bias of SUV measurements (26,51). Tooptimize image quality, recommendations are generallygiven for uptake period, scan duration, and 18F-FDG dose.The dose can be selected from a range of generally used doses
STANDARDS FOR QUANTITATIVE PET • Boellaard 15S
by on April 26, 2018. For personal use only. jnm.snmjournals.org Downloaded from
(17,32,35); as a function of patient weight (34); or as afunction of the combination of patient weight and scannertype, scanning procedure, and scan duration (43). The lastapproach attempts to minimize variability in image qualitybetween different types of scanners.
For PET/CT, it is recommended that a patient be posi-tioned with the arms above the head to improve CT-AC(31,32,43). Breath holding at midinspiration or shallowbreathing is recommended to minimize artifacts attributableto mismatches in registration (and blurring) between CT-AC and PET emission scans.
Both Delbeke et al. (32) and Boellaard et al. (43) discussedthe use of contrast agents during CT-AC. Delbeke et al. (32)and Coleman et al. (31) indicated that intravenous contrastagents may cause attenuation correction artifacts in PETimages but that these effects are usually modest with modernPET/CT scanners. The standardization protocol described byBoellaard et al. (43), however, advises that no contrast agent beused until it has been established that attenuation correctionartifacts are completely absent when oral or intravenouscontrast agents are used during CT-AC. This more conservativeapproach has been followed because these recommendationsfocused mainly on the quantification of PET studies. Whethercontrast agents can or cannot be used during CT-AC is, how-ever, a topic for further discussion and evaluation (31,43).
Image Reconstruction and Image Resolution
In most articles that make recommendations, guidelinesfor optimal reconstruction settings are limited because imagereconstruction algorithms and specifications are highly spe-cific to manufacturer and scanner type, making generaliza-tions difficult.
Schelbert et al. (34) indicated the need for reconstructionof PET studies with correction for decay during subsequentbed positions and both with and without attenuation correc-tion. Obviously, attenuation correction is needed for quan-tification. Young et al. (17) recommended the use ofattenuation correction but otherwise provided no imagereconstruction parameters. However, at that time, data onthe effects of image reconstruction algorithms and settings onPET quantification were sparse, and filtered backprojectionwas still the most commonly used reconstruction method.
Later, Shankar et al. (35) recommended the use of thesame scanner and reconstruction algorithms and settings formultiple scans of a given patient. This approach is justifiedwhen 18F-FDG PET studies are used for tumor responsemeasurements based on relative changes in SUVs. It hasbeen shown (45,49) that relative changes in SUVs arealmost independent of applied methodology, provided thatit is consistently used for all longitudinal PET studies of agiven patient and that the scanner is continuously properlycalibrated against the dose calibrator.
Delbeke et al. (32) indicated that PET image reconstruc-tion should include corrections for detector efficiency(normalization), system dead time, random coincidences,scatter, attenuation, and sampling nonuniformity.
Similar recommendations were provided by Boellaardet al. (43) to ensure that 18F-FDG PET images are fullyquantitative. Apart from the application of all of the usualcorrections for quantification, however, differences in PETimage resolution are probably major factors contributing tovariability in SUVs among centers (45). Therefore, inmulticenter studies, when absolute SUV results are used,it is crucial for image resolution to be matched as much aspossible across centers and scanners. This is especially truebecause methods for overcoming quantitative inaccuraciesattributable to (differences in) resolution, so-called partial-volume effects (29), are not widely available yet and, moreimportantly, are still not sufficiently accurate and precisefor structures smaller than 3 times the ‘‘clinical’’ scannerresolution (the clinical resolution is usually ;7 mm fullwidth at half maximum [FWHM]). To some extent, partial-volume effects may be minimized by use of the SUVmax
within a lesion. However, differences in image resolutionstill contribute to interinstitutional differences in the SUVmax
(Fig. 1) (26,43,45). Furthermore, PET image resolution isnot equal to and is usually worse than the scanner resolu-tion measured according to NEMA NU 2 specifications, afact that is often overlooked or not understood. Boellaard etal. (43) therefore provided reconstruction settings for var-ious scanners but explained that reconstruction should beperformed so that activity concentration recovery coeffi-cients as a function of sphere size meet the multicenter QCspecifications given in the same study. To this end, dedi-cated QC phantom experiments were proposed. With thisapproach, resolution and (iterative reconstruction) conver-gence matching across various scanners and institutes canbe achieved, regardless of the fact that the scanners mayhave different reconstruction algorithms and software.
Data Analysis Procedures and SUV Normalization
After data acquisition and image reconstruction, theextraction of quantitative measures starts with segmentationof the tumor, that is, definition of an ROI. To this end,various ROI approaches have been used; these approachesinclude manually defined tumor boundaries, semiautomated2D and 3D region-growing techniques that involve theapplication of a fixed or relative (to maximum uptake)threshold, fixed-size regions (SUVpeak), and maximum up-take over the entire tumor (SUVmax). Variations in SUVs arealso caused by imprecise performance of these ‘‘simple’’ROI methods, especially for small lesions (smaller than 3times the FWHM), as can be deduced from the estimatedlesion sizes in Figure 1. Therefore, there is an urgent need todevelop objective and highly automated volumetricdelineation methods that accurately yield true lesion size,such as those described by Geets et al. (52) and Hatt et al.(53). These and other sophisticated tumor segmentationmethods are presently being developed but are still beingevaluated. However, it is important to remember that differ-ent ROI methods will result in different quantitative out-comes (26).
16S THE JOURNAL OF NUCLEAR MEDICINE • Vol. 50 • No. 5 (Suppl) • May 2009
by on April 26, 2018. For personal use only. jnm.snmjournals.org Downloaded from

Young et al. (17) suggested that the whole tumor uptakebe reported and that the same ROI volumes be used onsubsequent scans. Mean uptake and maximum uptake,expressed in MBq/L, should be recorded. Shankar et al.(35) did not recommend a specific ROI methodology butindicated that consistent ROI methodology should be usedfor a given patient during a longitudinal study. Both articlesspecifically addressed the use of 18F-FDG PET for assess-ing the tumor response to therapy, for which consistencyhas been shown to be of utmost importance. Boellaard et al.(43) recommended the use of various 3D ROIs (i.e., volumeof interest [VOI]) based on relative (to maximum uptake)thresholds, either with or without background corrections(adaptive thresholds). Because a larger VOI may be moreprecise, it was suggested that the largest VOI be used toprovide stable and accurate VOIs corresponding to thetumor location and extent on all subsequent scans. How-ever, this strategy is only applicable to the assessment of aresponse to therapy. Nevertheless, it was specified that in allcases, the maximum uptake should be reported and thesame VOI method should be used for a given patient andacross institutes participating in a multicenter trial.
Finally, SUV normalization variables and the serumglucose level affect SUVs. The SUV is usually normalizedto body weight, but lean body mass and body surface areaare being used as well. Young et al. (17), Weber (9),Shankar et al. (35), Lammertsma et al. (18), and Boellaardet al. (43) all indicated that SUV normalized to bodysurface area might be more appropriate during longitudinalstudies in case of weight loss during therapy, as has beendemonstrated in other studies (22,23). The most appropriatemethod for SUV normalization is still a matter of debate,but the method should be standardized for multicenter trials.
A higher blood glucose level results in a lower SUV. Thepossible effects of blood glucose levels were investigated byEary and Mankoff (54) and discussed by Young et al. (17),Weber (9), Delbeke et al. (32), Shankar et al. (35),Lammertsma et al. (18), and Boellaard et al. (43). Theystated that the blood glucose level should be checked beforethe administration of 18F-FDG. In general, 2 strategies forminimizing the effects of blood glucose levels were recom-mended. First, with a strict patient preparation protocol(including, e.g., at least 4 h of fasting), a blood glucoselevel within the reference range (70–130 mg/dL, correspond-ing to approximately 4–7 mmol/L) usually can be achieved.When needed, the blood glucose level may be reduced by theadministration of insulin (17,32), but rescheduling is gener-ally recommended for patients in hyperglycemic states(32,35,43). The blood glucose level threshold for reschedul-ing ranges from 130 to 200 mg/dL, corresponding to 7.2–11.1 mmol/L. Delbeke et al. (32) and Shankar et al. (35) didnot specify an exact threshold but indicated that, in general, athreshold of 150–200 mg/dL (8.3–11.1 mmol/L) is appliedby most institutes.
The second strategy for overcoming variability in SUVsbecause of variations in blood glucose levels involves
incorporation of the blood glucose level as a correctionfactor in the SUV calculation, as suggested by, for example,Lammertsma et al. (18) and Boellaard et al. (43). However,the use of blood glucose level correction is still a matter ofdebate, and a possible improvement in SUV accuracy shouldnot be counterbalanced by a disproportionate increase inSUV variability. At the very least, a standardized andvalidated method for measuring the blood glucose level isneeded (i.e., bedside devices should not be used (43)), andthe method should be calibrated among centers.
QC Measures and Qualification of Personnel
Technical prerequisites for performing quantitative PETstudies are that a scanner is operating according to spec-ifications and that it is calibrated correctly with a phantomthat has known activity concentrations, as described else-where (9,32,35,43). In addition to QC measures, Delbeke etal. (32) provided additional guidelines for minimum PETscanner performance based on NEMA NU 2 specificationsand provided guidelines for the qualification of personnel.
Correct functioning of a PET or PET/CT scanner isusually verified on a daily basis with a set of manufacturer-supplied daily QC routines. In addition, a PET scannershould be cross calibrated against a dose calibrator; that is,the activity measured by the PET camera should be directlycompared with the injected activity measured by the dosecalibrator being used clinically (12,43,51). Boellaard et al.(43) indicated that this relative calibration should be accu-rate to within 65% on the basis of multicenter calibrationexperiences (43–45).
These QC measures for PET are usually sufficient whenquantitative 18F-FDG PET studies are performed to assessthe response to therapy on the basis of relative changes inSUVs. However, absolute SUV results can be used fordifferentiating between benign and malignant lesions, deter-mination of prognosis, and response monitoring by evalua-tion of residual uptake after therapy or a combination ofrelative changes and residual uptake during or after therapy;therefore, absolute SUV results are being used more fre-quently. In all of these cases, especially multicenter studies,additional QC measures are required. Takahashi et al. (55)showed that a variation in the SUV of up to 47% wasobserved when 5 different scanners were compared and thatthis variation was reduced to within 22.6% when standard-ized protocols were used. Boellaard et al. (43) observed thatby (very) strict standardization of PET acquisition, imagereconstruction, and data analysis procedures, variability inthe SUV as a function of sphere size could be reduced toapproximately 610%. Therefore, it was suggested that anassessment of activity concentration (or SUV) recoverycoefficients as a function of sphere size be included inmulticenter QC procedures. Specification of activity concen-tration or SUV recovery coefficients for each sphere (withinthe NEMA NU 2 2001 image quality phantom) is an attemptto achieve resolution and reconstruction convergence match-ing across scanners and institutes.
STANDARDS FOR QUANTITATIVE PET • Boellaard 17S
by on April 26, 2018. For personal use only. jnm.snmjournals.org Downloaded from
DISCUSSION
Is There a Need for Different Levels ofStandardization?
The required level of standardization may depend on theintended use of 18F-FDG PET. When oncologic 18F-FDGPET studies are interpreted visually for staging and diag-nostic purposes, the PET procedure should focus on opti-mizing image quality for tumor detection. In such a studyor clinical practice, specifications for patient preparation,18F-FDG dosage, and scan duration are required, but it islikely that standardization of reconstruction settings acrossvarious institutes will be less stringent.
More strict guidelines in a multicenter setting are neededfor quantitative PET studies. A distinction can be madebetween the use of relative changes in quantitative outcomesfor measuring the response to therapy and the use of absolutequantitative measures for diagnosis, determination of prog-nosis, or prediction of responses (e.g., residual 18F-FDGuptake during or after therapy). With relative changes inSUVs, that is, the ratio of the SUV in response studies to theSUV obtained during a baseline study, the impact of mostfactors affecting individual SUVs in response studies is min-imized (i.e., canceled out). Indeed, it has been shown that theconsistent application of a certain methodology, in additionto all other actions undertaken to optimize image quality, islikely to be sufficient (45,49). However, constant scannerperformance and calibration over time must be verified(32,35,44). Moreover, if changes in metabolic volume occur,differences in ROI methodologies and image resolution willstill affect the observed responses (45), so that standardiza-tion of 18F-FDG PET protocols is still mandatory.
When absolute quantitative measures are used in a mul-ticenter trial, all participating centers must follow strictguidelines for patient preparation, PET acquisition, 18F-FDGdosage, image reconstruction (i.e., matching of resolutionand iterative reconstruction convergence), data analysis pro-cedures, and QC measures (43).
Finally, Mankoff et al. (56) and Lammertsma et al. (18)emphasized the need for the verification of responses basedon SUVs against responses obtained from a full kineticanalysis. For this purpose, dynamic quantitative 18F-FDGPET studies of a small series of patients should be done forcomparison with established associations of SUV andkinetic analyses. Several centers, including my own, havelarge datasets for such comparisons, increasing statisticalpower. The execution and data analysis of these studies aremuch more complicated than those needed for SUV quan-tification. Therefore, these studies are likely to be per-formed at a limited number of sites. However, at least onesingle-center validation study should be included duringphase I or II studies to correctly interpret SUV responses inlarger clinical trials (17). To date, there are no guidelinesfor performing such quantitative dynamic 18F-FDG PETstudies, although some considerations have been described(17,18). It is obvious that such guidelines should incorpo-
rate the same recommendations for patient preparation, 18F-FDG dosage, administration procedures, and image recon-struction settings as those used for studies based on SUVsalone (Table 2). Guidelines for data analysis have not yetbeen officially provided, although Young et al. (17) sug-gested Patlak analysis as the preferred kinetic method foranalyzing dynamic 18F-FDG PET studies.
In summary, different levels of standardization could bebased on the intended use of 18F-FDG PET, ranging fromvisual inspection to full kinetic analysis. Depending on thecapabilities of a certain site, different levels of accreditationcould be assigned, thereby allowing or not allowing a site toparticipate in certain clinical multicenter trials. However,PET centers should be encouraged to meet the highest fea-sible quality standards. It is important to remember thatmany small factors affect SUV results and that it is thereforeof utmost importance to standardize all of these factors; thatis, many small factors can add up to considerable variationsin SUVs—up to 50% or more (9,26,45,49,55)—and guide-lines therefore should be followed strictly.
Issues in Maintaining and Updating Future Standards
Once a standardized protocol has been established andimplemented, regular verification of correct implementa-tion of 18F-FDG PET guidelines is needed. To this end,multicenter QC measurements should be obtained regularlyand centrally reviewed and archived.
Because different software platforms or programs pro-vide different SUV outcomes, even when identical datasetsare used (57), standardization of ROI methodology and dataanalysis software is urgently needed. At present, someinitiatives, such as that of the Quantitative Imaging Bio-markers Alliance (QIBA), are being undertaken to addressthese issues. Alternatively, in the absence of standardizedROI software and implementation, quantification of 18F-FDG PET studies in a multicenter setting may need to bereviewed and analyzed centrally.
A potential threat for maintaining standard proceduresacross various institutes and PET/CT scanners over time isthe limited flexibility in defining acquisition and recon-struction settings for most modern PET/CT scanners. Thislimited flexibility is some form of standardization and may,at present, be considered beneficial. Nevertheless, theimpact of future software and hardware upgrades on SUVquantification needs to be monitored carefully. Any changein acquisition and reconstruction settings will have a directeffect on derived SUVs. Any software or hardware upgradetherefore should be clearly specified by the manufacturer,including a description of the effects of the upgrade onimage quality, that is, on resolution recovery and SNR (55).Moreover, manufacturers should allow for the continuoususe of previously implemented acquisition and reconstruc-tion methods and settings to ensure the consistent use ofmethodology. This matter is of utmost importance whenclinical decisions are being made on the basis of observedchanges in SUVs. In other words, an artificial change in an
18S THE JOURNAL OF NUCLEAR MEDICINE • Vol. 50 • No. 5 (Suppl) • May 2009
by on April 26, 2018. For personal use only. jnm.snmjournals.org Downloaded from

SUV because of a change in methodology could incorrectlybe interpreted as tumor response or progression; obviously,such a situation should be avoided. An alternative strategyis for each manufacturer to assist in the implementation andmaintenance of acquisition and image reconstruction pro-tocols to meet the specifications of a multicenter standard-ized protocol.
Furthermore, future PET/CT scanners are likely to havehigher sensitivity, improved image quality, and higherspatial resolution. Higher sensitivity and improved imagequality resulting from more advanced image reconstructionmethods may be used to reduce the 18F-FDG dose, shortenthe scan duration, or both. Changes in spatial resolution,however, have a greater impact on SUV quantification(26,27,45,49). Therefore, as mentioned earlier, it is of ut-most importance that any PET study can be reconstructedin such a way that it meets the SUV recovery coefficientrequirements of current 18F-FDG PET standardized proto-cols. A simple solution could be the generation of a second(standardized) PET image by another reconstruction of thePET study with earlier software versions or settings or thesimple downsmoothing of the higher (spatial)-resolutionPET image with an appropriate filter to meet the (lower)resolution requirements of ongoing multicenter studies. Anadditional benefit of this strategy would be the collection ofpaired (high- and low-resolution) quantitative PET datasets.The use of such paired datasets would allow a proper eval-uation of the clinical benefits of new technology and mightfacilitate the design of new 18F-FDG PET standards, that is,the ‘‘translation’’ of existing protocols, SUV thresholds, orresponse criteria to newer ones.
Finally, apart from improvements in PET and PET/CTtechnology, other multimodality imaging devices, such asPET/MRI scanners, will be introduced (31,58–62). Boththeir clinical use and optimal data acquisition procedureswill need to be assessed. Future recommendations willtherefore need to focus on PET combined with CT or MRI.Other new developments may be the increasing use oftracers other than 18F-FDG or of multitracer studies (63–65) to further enhance clinical accuracy or in other appli-cations, such as radiation oncology (66,67). These issuesare beyond the scope of the present review, but multitracerand multimodality studies are likely to play an increasinglyimportant role in oncology in the future (62,65).
CONCLUSION
The present article reviewed a number of published stan-dards and recommendations for quantitative 18F-FDG PETandPET/CT studies. In most publications, various factors affectingSUVs or quantitative outcomes were identified; subsequently,recommendations to take these factors into account wereproposed. Consequently, most recommendations made in thesepublications seem to be in agreement. The extent and detail ofthese guidelines seem to reflect mainly the level of standard-ization required for the intended clinical or multicenter use of
quantitative PET. The main challenges in the near future will beto implement and maintain standards in larger (international)multicenter trials and to incorporate procedures for dealingwith new multimodality and multitracer studies.
ACKNOWLEDGMENTS
I would like to thank Otto S. Hoekstra and Adriaan A.Lammertsma for many fruitful discussions, review of thisarticle, and support. I would also like to thank all membersof the HOVON imaging working group for their contribu-tions in setting up The Netherlands standardization protocolfor multicenter quantitative whole-body 18F-FDG PETstudies. Finally, I would like to express much appreciationfor many fruitful discussions with colleagues from varioussocieties and working groups, including the EORTC,the American College of Radiology Imaging Network(ACRIN), the American Association of Physicists in Med-icine (AAPM) Task Group 145, the QIBA, the EuropeanAssociation of Nuclear Medicine (EANM), the NCI, theAmerican Society of Clinical Oncology (ASCO), EORTC–NCI–ASCO (ENASCO), the Dutch Society of ClinicalPhysics (NVKF), and the Dutch Society of NuclearMedicine (NVNG).
REFERENCES
1. Avril NE, Weber WA. Monitoring response to treatment in patients utilizing
PET. Radiol Clin North Am. 2005;43:189–204.
2. Bastiaannet E, Groen H, Jager PL, et al. The value of FDG-PET in the detection,
grading and response to therapy of soft tissue and bone sarcomas: a systematic
review and meta-analysis. Cancer Treat Res. 2004;30:83–101.
3. Erdi YE. The use of PET for radiotherapy. Curr Med Res. 2007;3:3–16.
4. Fletcher JW, Djulbegovic B, Soares HP, et al. Recommendations on the use of18F-FDG PET in oncology. J Nucl Med. 2008;49:480–508.
5. Geus-Oei LF, van der Heijden HF, Corstens FH, Oyen WJ. Predictive and
prognostic value of FDG-PET in nonsmall-cell lung cancer: a systematic review.
Cancer. 2007;110:1654–1664.
6. Hoekstra CJ, Stroobants SG, Smit EF, et al. Prognostic relevance of response
evaluation using [F-18]-2-fluoro-2-deoxy-D-glucose positron emission tomogra-
phy in patients with locally advanced non-small-cell lung cancer. J Clin Oncol.
2005;23:8362–8370.
7. Juweid ME, Stroobants S, Hoekstra OS, et al. Use of positron emission
tomography for response assessment of lymphoma: consensus of the Imaging
Subcommittee of International Harmonization Project in Lymphoma. J Clin
Oncol. 2007;25:571–578.
8. Vansteenkiste JF, Stroobants SG. The role of positron emission tomography with18F-fluoro-2-deoxy-D-glucose in respiratory oncology. Eur Respir J. 2001;
17:802–820.
9. Weber WA. Use of PET for monitoring cancer therapy and for predicting
outcome. J Nucl Med. 2005;46:983–995.
10. Borst GR, Belderbos JS, Boellaard R, et al. Standardised FDG uptake: a
prognostic factor for inoperable non-small cell lung cancer. Eur J Cancer. 2005;
41:1533–1541.
11. Weber WA. PET for response assessment in oncology: radiotherapy and
chemotherapy. Br J Radiol. 2005;78:42–49.
12. Larson SM, Schwartz LH. 18F-FDG PET as a candidate for ‘‘qualified
biomarker’’: functional assessment of treatment response in oncology. J Nucl
Med. 2006;47:901–903.
13. Cheson BD, Pfistner B, Juweid ME, et al. Revised response criteria for malignant
lymphoma. J Clin Oncol. 2007;25:579–586.
14. Hoekstra CJ, Hoekstra OS, Stroobants SG, et al. Methods to monitor response to
chemotherapy in non–small cell lung cancer with 18F-FDG PET. J Nucl Med.
2002;43:1304–1309.
15. Weber WA. Chaperoning drug development with PET. J Nucl Med. 2006;47:
735–737.
STANDARDS FOR QUANTITATIVE PET • Boellaard 19S
by on April 26, 2018. For personal use only. jnm.snmjournals.org Downloaded from
16. Hoekstra CJ, Paglianiti I, Hoekstra OS, et al. Monitoring response to therapy in
cancer using [F-18]-2-fluoro-2-deoxy-D-glucose and positron emission tomog-
raphy: an overview of different analytical methods. Eur J Nucl Med. 2000;
27:731–743.
17. Young H, Baum R, Cremerius U, et al. Measurement of clinical and subclinical
tumour response using [18F]-fluorodeoxyglucose and positron emission tomog-
raphy: review and 1999 EORTC recommendations. European Organization for
Research and Treatment of Cancer (EORTC) PET Study Group. Eur J Cancer.
1999;35:1773–1782.
18. Lammertsma AA, Hoekstra CJ, Giaccone G, Hoekstra OS. How should we
analyse FDG PET studies for monitoring tumour response? Eur J Nucl Med Mol
Imaging. 2006;33(suppl 1):16–21.
19. Hunter GJ, Hamberg LM, Alpert NM, Choi NC, Fischman AJ. Simplified
measurement of deoxyglucose utilization rate. J Nucl Med. 1996;37:950–955.
20. Sadato N, Tsuchida T, Nakamura S, et al. Non-invasive estimation of the net
influx constant using the standardized uptake value for quantification of FDG
uptake of tumours. Eur J Nucl Med. 1998;25:559–564.
21. Graham MM, Peterson LM, Hayward RM. Comparison of simplified quantitative
analyses of FDG uptake. Nucl Med Biol. 2000;27:647–655.
22. Stahl A, Ott K, Schwaiger M, Weber WA. Comparison of different SUV-based
methods for monitoring cytotoxic therapy with FDG PET. Eur J Nucl Med Mol
Imaging. 2004;31:1471–1479.
23. Kim CK, Gupta NC. Dependency of standardized uptake values of fluorine-18
fluorodeoxyglucose on body size: comparison of body surface area correction
and lean body mass correction. Nucl Med Commun. 1996;17:890–894.
24. Lindholm P, Minn H, Leskinen-Kallio S, Bergman J, Ruotsalainen U, Joensuu H.
Influence of the blood glucose concentration on FDG uptake in cancer: a PET
study. J Nucl Med. 1993;34:1–6.
25. Lowe VJ, DeLong DM, Hoffman JM, Coleman RE. Optimum scanning protocol
for FDG-PET evaluation of pulmonary malignancy. J Nucl Med. 1995;36:883–887.
26. Boellaard R, Krak NC, Hoekstra OS, Lammertsma AA. Effects of noise, image
resolution, and ROI definition on the accuracy of standard uptake values: a
simulation study. J Nucl Med. 2004;45:1519–1527.
27. Jaskowiak CJ, Bianco JA, Perlman SB, Fine JP. Influence of reconstruction
iterations on 18F-FDG PET/CT standardized uptake values. J Nucl Med.
2005;46:424–428.
28. Lartizien C, Kinahan PE, Swensson R, et al. Evaluating image reconstruction
methods for tumor detection in 3-dimensional whole-body PET oncology
imaging. J Nucl Med. 2003;44:276–290.
29. Soret M, Bacharach SL, Buvat I. Partial-volume effect in PET tumor imaging.
J Nucl Med. 2007;48:932–945.
30. Bourguet P, Blanc-Vincent MP, Boneu A, et al. Summary of the standards,
options and recommendations for the use of positron emission tomography with
2-[18F]fluoro-2-deoxy-D-glucose (FDG-PET scanning) in oncology (2002). Br J
Cancer. 2003;89(suppl 1):S84–S91.
31. Coleman RE, Delbeke D, Guiberteau MJ, et al. Concurrent PET/CT with an
integrated imaging system: intersociety dialogue from the joint working group of
the American College of Radiology, the Society of Nuclear Medicine, and the
Society of Computed Body Tomography and Magnetic Resonance. J Nucl Med.
2005;46:1225–1239.
32. Delbeke D, Coleman RE, Guiberteau MJ, et al. Procedure guideline for tumor
imaging with 18F-FDG PET/CT 1.0. J Nucl Med. 2006;47:885–895.
33. Kirby AM, Mikhaeel NG. The role of FDG PET in the management of
lymphoma: practical guidelines. Nucl Med Commun. 2007;28:355–357.
34. Schelbert HR, Hoh CK, Royal HD, et al. Procedure guideline for tumor imaging
using fluorine-18-FDG.Society of Nuclear Medicine.J Nucl Med. 1998;39:1302–1305.
35. Shankar LK, Hoffman JM, Bacharach S, et al. Consensus recommendations for
the use of 18F-FDG PET as an indicator of therapeutic response in patients in
National Cancer Institute trials. J Nucl Med. 2006;47:1059–1066.
36. Erdi YE, Nehmeh SA, Pan T, et al. The CT motion quantitation of lung lesions
and its impact on PET-measured SUVs. J Nucl Med. 2004;45:1287–1292.
37. Hamill JJ, Bosmans G, Dekker A. Respiratory-gated CT as a tool for the simu-
lation of breathing artifacts in PET and PET/CT. Med Phys. 2008;35:576–585.
38. Alkhawaldeh K, Alavi A. Quantitative assessment of FDG uptake in brown fat
using standardized uptake value and dual-time-point scanning. Clin Nucl Med.
2008;33:663–667.
39. Gorospe L, Raman S, Echeveste J, Avril N, Herrero Y, Herna NS. Whole-body
PET/CT: spectrum of physiological variants, artifacts and interpretative pitfalls
in cancer patients. Nucl Med Commun. 2005;26:671–687.
40. Cohade C, Osman M, Nakamoto Y, et al. Initial experience with oral contrast in
PET/CT: phantom and clinical studies. J Nucl Med. 2003;44:412–416.
41. Dizendorf E, Hany TF, Buck A, von Schulthess GK, Burger C. Cause and
magnitude of the error induced by oral CT contrast agent in CT-based attenuation
correction of PET emission studies. J Nucl Med. 2003;44:732–738.
42. Mawlawi O, Erasmus JJ, Munden RF, et al. Quantifying the effect of IV contrast
media on integrated PET/CT: clinical evaluation. AJR. 2006;186:308–319.
43. Boellaard R, Oyen WJ, Hoekstra CJ, et al. The Netherlands protocol for
standardisation and quantification of FDG whole body PET studies in multi-
centre trials. Eur J Nucl Med Mol Imaging. 2008;35:2320–2333.
44. Geworski L, Knoop BO, de Wit M, Ivancevic V, Bares R, Munz DL. Multicenter
comparison of calibration and cross calibration of PET scanners. J Nucl Med.
2002;43:635–639.
45. Westerterp M, Pruim J, Oyen W, et al. Quantification of FDG PET studies using
standardised uptake values in multi-centre trials: effects of image reconstruction,
resolution and ROI definition parameters. Eur J Nucl Med Mol Imaging.
2007;34:392–404.
46. Keyes JW Jr. SUV: standard uptake or silly useless value? J Nucl Med.
1995;36:1836–1839.
47. Eisenhauer EA, Therasse P, Bogaerts J, et al. New response evalution criteria in
solid tumours: revised RECIST guideline (version 1.1). Eur J Cancer. 2009;
45:228–247.
48. Miller JC, Fischman AJ, Aquino SL, Blake MA, Thrall JH, Lee SI. FDG-PET
CT for tumor imaging. J Am Coll Radiol. 2007;4:256–259.
49. Krak NC, Boellaard R, Hoekstra OS, Twisk JWR, Hoekstra CJ, Lammertsma
AA. Effects of ROI definition and reconstruction method on quantitative
outcome and applicability in a response monitoring trial. Eur J Nucl Med Mol
Imaging. 2005;32:294–301.
50. Visvikis D, Cheze-LeRest C, Costa DC, Bomanji J, Gacinovic S, Ell PJ.
Influence of OSEM and segmented attenuation correction in the calculation of
standardised uptake values for [18F]FDG PET. Eur J Nucl Med. 2001;28:1326–
1335.
51. Thie JA. Understanding the standardized uptake value, its methods, and
implications for usage. J Nucl Med. 2004;45:1431–1434.
52. Geets X, Lee JA, Bol A, Lonneux M, Gregoire V. A gradient-based method for
segmenting FDG-PET images: methodology and validation. Eur J Nucl Med Mol
Imaging. 2007;34:1427–1438.
53. Hatt M, Lamare F, Boussion N, et al. Fuzzy hidden Markov chains segmentation
for volume determination and quantitation in PET. Phys Med Biol.
2007;52:3467–3491.
54. Eary JF, Mankoff DA. Tumor metabolic rates in sarcoma using FDG PET. J Nucl
Med. 1998;39:250–254.
55. Takahashi Y, Oriuchi N, Otake H, Endo K, Murase K. Variability of lesion
detectability and standardized uptake value according to the acquisition procedure
and reconstruction among five PET scanners. Ann Nucl Med. 2008;22:543–548.
56. Mankoff DA, Muzi M, Krohn KA. Quantitative positron emission tomography
imaging to measure tumor response to therapy: what is the best method? Mol
Imaging Biol. 2003;5:281–285.
57. Leal J, Lodge M, Wahl R. Reproducibility of SUVmax for oncologic PET:
significant differences in quantification of the same study between PET-only and
PET/CT analysis modes [abstract]. J Nucl Med. 2008;49(suppl):107P.
58. Beyer T, Antoch G, Muller S, et al. Acquisition protocol considerations for
combined PET/CT imaging. J Nucl Med. 2004;45(suppl 1):25S–35S.
59. Beyer T, Antoch G, Bockisch A, Stattaus J. Optimized intravenous contrast
administration for diagnostic whole-body 18F-FDG PET/CT. J Nucl Med.
2005;46:429–435.
60. Czernin J, Schelbert HR. PET/CT in cancer patient management: introduction. J
Nucl Med. 2007;48(suppl):2S–3S.
61. De Wever W, Stroobants S, Verschakelen JA. Integrated PET/CT in lung cancer
imaging: history and technical aspects. JBR-BTR. 2007;90:112–119.
62. Smit EF, Hoekstra OS. New imaging techniques (PET, PET/CT, MRI, E(B)US)
for lung cancer staging and response assessment. J Thorac Oncol. 2007;2:S144–S145.
63. Dunnwald LK, Gralow JR, Ellis GK, et al. Tumor metabolism and blood flow
changes by positron emission tomography: relation to survival in patients treated
with neoadjuvant chemotherapy for locally advanced breast cancer. J Clin Oncol.
2008;26:4449–4457.
64. Linden HM, Stekhova SA, Link JM, et al. Quantitative fluoroestradiol positron
emission tomography imaging predicts response to endocrine treatment in breast
cancer. J Clin Oncol. 2006;24:2793–2799.
65. Mankoff DA, Eary JF, Link JM, et al. Tumor-specific positron emission
tomography imaging in patients: [18F]fluorodeoxyglucose and beyond. Clin
Cancer Res. 2007;13:3460–3469.
66. Nestle U, Kremp S, Grosu AL. Practical integration of [18F]-FDG-PET and PET-
CT in the planning of radiotherapy for non-small cell lung cancer (NSCLC): the
technical basis, ICRU-target volumes, problems, perspectives. Radiother Oncol.
2006;81:209–225.
67. Ollers M, Bosmans G, van Baardwijk A, et al. The integration of PET-CT scans
from different hospitals into radiotherapy treatment planning. Radiother Oncol.
2008;87:142–146.
20S THE JOURNAL OF NUCLEAR MEDICINE • Vol. 50 • No. 5 (Suppl) • May 2009
by on April 26, 2018. For personal use only. jnm.snmjournals.org Downloaded from

Doi: 10.2967/jnumed.108.057182Published online: April 20, 2009.
2009;50:11S-20S.J Nucl Med. Ronald Boellaard Standards for PET Image Acquisition and Quantitative Data Analysis
http://jnm.snmjournals.org/content/50/Suppl_1/11SThis article and updated information are available at:
http://jnm.snmjournals.org/site/subscriptions/online.xhtml
Information about subscriptions to JNM can be found at:
http://jnm.snmjournals.org/site/misc/permission.xhtmlInformation about reproducing figures, tables, or other portions of this article can be found online at:
(Print ISSN: 0161-5505, Online ISSN: 2159-662X)1850 Samuel Morse Drive, Reston, VA 20190.SNMMI | Society of Nuclear Medicine and Molecular Imaging
is published monthly.The Journal of Nuclear Medicine
© Copyright 2009 SNMMI; all rights reserved.
by on April 26, 2018. For personal use only. jnm.snmjournals.org Downloaded from