standards mastery determined by benchmark and … mastery determined by benchmark and statewide test...
TRANSCRIPT
Assessment Technology, Incorporated6700 E. Speedway Boulevard
Tucson, Arizona 85710Phone: 520.323.9033 • Fax: 520.323.9139
© 2005 Assessment Technology, Incorporated
byJohn Richard Bergan, Ph.D.John Robert Bergan, Ph.D.
and Christine Guerrera Burnham, Ph.D.
Research Paper
Standards Mastery Determinedby Benchmark and Statewide
Test Performance

Copyright © 2005 by Assessment Technology, Incorporated All rights reserved. No part of this document may be reproduced or transmitted in any form or by any means, electronic or mechanical, including
photocopy, recording, or any information storage and retrieval system, without permission from the publisher.
Assessment Technology, Inc., Publishers Tucson, Arizona, U.S.A.
Printed in the United States of America.
V5-062411
Standards Mastery Determined by 1.800.367.4762 Benchmark and Statewide Test Performance ati-online.com Assessment Technology, Incorporated © Assessment Technology, Incorporated 2005
i
Standards Mastery Determined by Benchmark and
Statewide Test Performance
By John Richard Bergan, Ph.D., John Robert Bergan, Ph.D., and Christine Guerrera, Ph.D. Assessment Technology, Incorporated
Table of Contents Table of Contents ........................................................................................................................ i Acknowledgements ..................................................................................................................... ii I. Introduction ........................................................................................................................ 1
A. Guiding Instruction Through Benchmark Forecast ........................................................... 1 B. Limitations of the Forecasting Approach .......................................................................... 1
II. A Latent-Class Approach to Standards Mastery Based on Multiple Assessments......................................................................................................... 2
A. The General Unrestricted Latent-Class Model ................................................................. 2 B. Setting Cut Points for Standards Mastery ........................................................................ 4 C. Data Used in the Study .................................................................................................... 4
III. Results ................................................................................................................................. 5
IV. Implications of Determining Standards Mastery Based on Benchmark and Statewide Test Classifications .............................................................. 13
A. Reducing the Impact of a Single Test on High-Stakes Decisions ................................... 14 B. Increasing Curricular Validity ......................................................................................... 14 C. Increasing Timely Access to Assessment Information that Counts ................................ 15 D. Mastery and Non-Mastery Class Assignment with Information on
Classification Errors ....................................................................................................... 15
V. Benchmark Assessment Credibility................................................................................. 16 A. Reliability ....................................................................................................................... 16 B. Validity........................................................................................................................... 17 C. Mastery Level Cut Points ............................................................................................... 18
VI. Conclusions....................................................................................................................... 19 VII. References ......................................................................................................................... 20
Standards Mastery Determined by 1.800.367.4762 Benchmark and Statewide Test Performance ati-online.com Assessment Technology, Incorporated © Assessment Technology, Incorporated 2005
ii
Acknowledgements The authors wish to thank Dave Thissen for his careful review and helpful comments regarding this paper. We also wish to thank Jason Feld for his helpful thoughts and Kathy Bergan and Jody Jepson for their thorough review of the manuscript. Finally, we wish to extend our appreciation to the students, teachers, and administrators in the Marana Unified School District for their efforts, which resulted in the assessment data used in this article.
Standards Mastery Determined by 1.800.367.4762 Benchmark and Statewide Test Performance ati-online.com Assessment Technology, Incorporated © Assessment Technology, Incorporated 2005
1
I. Introduction School reform and related state accountability initiatives have played an important role in promoting a new standards-based approach to education. Standards-based education provides a basis for guiding instruction toward the achievement of valued and measurable educational goals. Goals typically reflect standards and performance objectives established at the state level. In addition, they may include local objectives. The pursuit of shared goals articulated in state standards and performance objectives focuses the initiatives in local districts toward a common purpose. The use of reliable and valid statewide assessment instruments to measure student achievement provides an objective approach to the measurement of goal attainment. Under the No Child Left Behind Act of 2001, 2002, statewide tests play a critical role in evaluating schools and students. In the typical case, statewide tests are administered in the spring of the school year. Cutoff points reflecting designated levels of mastery of state standards are established at selected points on the statewide test scales. The cutoff points are used to determine the attainment of annual measurable objectives used in establishing Adequate Yearly Progress (AYP). For example, students who score at or above a given cut point on a statewide math test may be designated as having met the state standard for math. In order to determine adequate yearly progress for a given year, the state may require that a certain percentage of students meet the state math standard for that year. Schools meeting or exceeding the designated percentage level are classified as having met the annual measurable objective requirement for the year. Over time, the AYP percentage requirement is increased so that in the end “no child is left behind”. A. Guiding Instruction through Benchmark Test Forecasts In order to guide instruction in ways that promote the achievement of AYP requirements, many schools have installed educational management systems including benchmark tests aligned with state standards and administered at multiple points during the school year. Periodic benchmark testing provides information well in advance of statewide testing making it possible to target instruction in ways that meet student learning needs and promote the attainment of AYP standards. The effectiveness of benchmark testing as a tool for informing instruction is a function of the extent to which benchmark tests are able to accurately forecast performance on statewide tests. To the extent that local benchmark assessments are measuring the same capabilities as those assessed on statewide tests, schools can use benchmark assessments to guide instruction in ways that are likely to enhance student progress as measured by performance on statewide tests. Accordingly, research on forecasting statewide test performance from benchmark test performance has become an important concern in the management of learning (Bergan & Bergan, 2004). B. Limitations of the Forecasting Approach Although forecasting can be a useful tool, there are limitations associated with the approach of determining the attainment of annual measurable objectives related to AYP from statewide test performance and using local benchmark assessments to forecast statewide test performance. One is that information on student learning obtained from benchmark testing at the local level is not used in determining AYP. Local benchmark assessments administered at multiple points during the school year provide the opportunity to assess a greater range of
Standards Mastery Determined by 1.800.367.4762 Benchmark and Statewide Test Performance ati-online.com Assessment Technology, Incorporated © Assessment Technology, Incorporated 2005
2
capabilities than it may be practical to assess on a statewide test administered at the end of the year. Moreover, benchmark tests can be linked directly to standards and performance objectives reflecting the school’s instructional goals. If local assessments played a role in determining AYP, school districts would have more information for determining AYP at more points in time than is the case under the current approach to accountability. A second limitation is that measurement error associated with statewide tests is not adequately taken into account under the current approach to establishing AYP (Bergan & Bergan, 2004). For example, suppose that benchmark assessments were able to forecast accurately that standards were met based on statewide test performance 90 percent of the time. For 10 percent of the cases, the forecast would be inaccurate. This error is always assigned to the benchmark tests, never to the statewide test. The implicit assumption is that classifications based on statewide test performance have no measurement error. Statewide test classifications serve as a gold standard against which classifications based on benchmark test performance are evaluated. There are significant consequences associated with the decision to treat classifications based on statewide test performance as error free. Accordingly, this assumption requires close examination.
II. A Latent-Class Approach to Standards Mastery Based on Multiple Assessments
Given the limitations described in the preceding paragraphs, it seems reasonable to examine alternative ways to determine standards mastery from assessment information. This paper examines a latent-class approach for determining standards mastery from multiple assessments of student capabilities. In this approach, a latent-class model is used to assign students to a mastery class based on their performance on multiple assessments. The model includes two classes: The first is comprised of individuals who have met the state standard. The second is composed of individuals who have not met the standard. The latent-class approach makes it possible to estimate measurement error for each of the assessments used in determining standards mastery. The approach has the additional advantage of providing an estimate of the probability that a student has been accurately classified based on his or her assessment performance. In the discussion that follows, latent-class models are used to test the assumption that classifications based on statewide test performance are error free. In the testing process, models that include the assumption of error-free statewide-test classifications are compared statistically to models that do not include that assumption. Implications of various models for determining standards mastery and guiding instruction are explored. A. The General Unrestricted Latent-Class Model The latent-class models examined here are special cases of a general unrestricted latent-class model developed by Lazarsfeld (Lazarsfeld & Henry, 1968) and elaborated by Goodman (1974a, 1974b). The general model was developed to address problems involving categorical data. Lazarsfeld developed a companion model to address problems involving continuous data. The model for continuous data is almost identical to the latent-class model and currently is in widespread use under the name of Item Response Theory (e.g., Thissen & Wainer, 2001).
Standards Mastery Determined by 1.800.367.4762 Benchmark and Statewide Test Performance ati-online.com Assessment Technology, Incorporated © Assessment Technology, Incorporated 2005
3
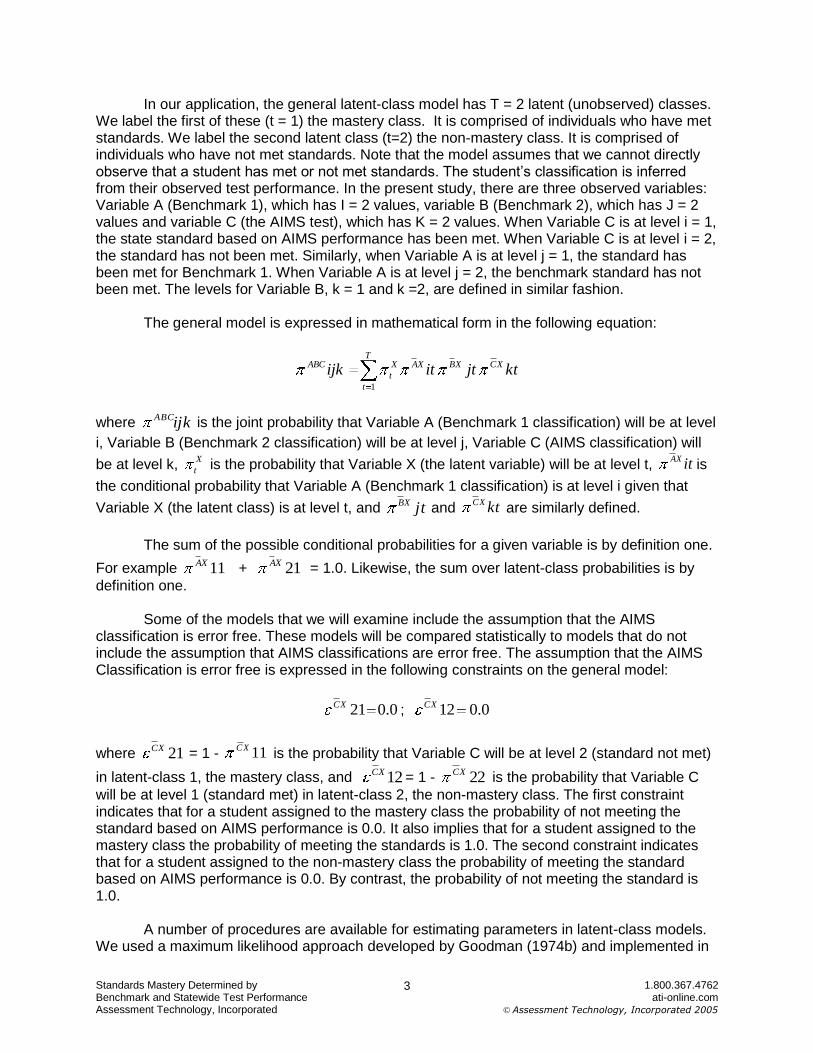
In our application, the general latent-class model has T = 2 latent (unobserved) classes. We label the first of these (t = 1) the mastery class. It is comprised of individuals who have met standards. We label the second latent class (t=2) the non-mastery class. It is comprised of individuals who have not met standards. Note that the model assumes that we cannot directly observe that a student has met or not met standards. The student’s classification is inferred from their observed test performance. In the present study, there are three observed variables: Variable A (Benchmark 1), which has I = 2 values, variable B (Benchmark 2), which has J = 2 values and variable C (the AIMS test), which has K = 2 values. When Variable C is at level i = 1, the state standard based on AIMS performance has been met. When Variable C is at level i = 2, the standard has not been met. Similarly, when Variable A is at level j = 1, the standard has been met for Benchmark 1. When Variable A is at level j = 2, the benchmark standard has not been met. The levels for Variable B, k = 1 and k =2, are defined in similar fashion. The general model is expressed in mathematical form in the following equation:
T
t
XCXBXAX
t
ABC ktjtitijk1
where ijkABC is the joint probability that Variable A (Benchmark 1 classification) will be at level
i, Variable B (Benchmark 2 classification) will be at level j, Variable C (AIMS classification) will
be at level k, X
t is the probability that Variable X (the latent variable) will be at level t, itXAis
the conditional probability that Variable A (Benchmark 1 classification) is at level i given that
Variable X (the latent class) is at level t, and jtXBand ktXC
are similarly defined.
The sum of the possible conditional probabilities for a given variable is by definition one.
For example 11XA + 21XA
= 1.0. Likewise, the sum over latent-class probabilities is by
definition one. Some of the models that we will examine include the assumption that the AIMS classification is error free. These models will be compared statistically to models that do not include the assumption that AIMS classifications are error free. The assumption that the AIMS Classification is error free is expressed in the following constraints on the general model:
0.021XC; 0.012XC
where 21XC = 1 - 11XC
is the probability that Variable C will be at level 2 (standard not met)
in latent-class 1, the mastery class, and 12XC= 1 - 22XC
is the probability that Variable C
will be at level 1 (standard met) in latent-class 2, the non-mastery class. The first constraint indicates that for a student assigned to the mastery class the probability of not meeting the standard based on AIMS performance is 0.0. It also implies that for a student assigned to the mastery class the probability of meeting the standards is 1.0. The second constraint indicates that for a student assigned to the non-mastery class the probability of meeting the standard based on AIMS performance is 0.0. By contrast, the probability of not meeting the standard is 1.0. A number of procedures are available for estimating parameters in latent-class models. We used a maximum likelihood approach developed by Goodman (1974b) and implemented in
Standards Mastery Determined by 1.800.367.4762 Benchmark and Statewide Test Performance ati-online.com Assessment Technology, Incorporated © Assessment Technology, Incorporated 2005
4
a computer program developed by Clogg and Eliason (1987). The fit of a latent-class model to a given data set can be tested by assessing the correspondence between observed data patterns and patterns expected under the model using the likelihood-ratio chi-squared statistic. The expected patterns are computed by multiplying the joint probability on the left side of the equation for the general model by N, the sample size. As already indicated, in this study we compare the fit of two types of models to the data. One type assumes an error-free criterion. That assumption is expressed in the two restrictions specified above. The second type of model does not assume an error-free criterion. It imposes no restrictions on the general model. The model without restrictions is “just identified”. It has no degrees of freedom and fits the data perfectly. The model with restrictions has two degrees of freedom, one associated with each of the two restrictions specified above. This model may or may not provide an acceptable fit for the data. In those instances in which it does not fit the data, it is rejected and the unrestricted model becomes the preferred model for representing the data. B. Setting Cut Points for Standards Mastery Determining standards mastery from statewide and benchmark test scores requires that interval scale data obtained for the statewide test and each benchmark test be converted into categorical data. This was accomplished by setting a cut point for the statewide test and for each of the benchmark tests. Those students performing at or above the cut point on a particular test were scored as having met the standard. Those students scoring below the cut point were scored as not having met the standard. The cut point for the statewide test was established by the state. The cut points for the benchmark tests were established using regression equations. In each equation statewide test performance was regressed on performance on a benchmark test. The cut-point score on the statewide test and the regression coefficients and intercepts on the benchmark tests were used to solve for the score on each benchmark test that predicted performance at the cut point on the statewide test. These predictor scores were chosen as the cut points for each of the benchmark tests. Other methods could be used to set the benchmark cut points. The regression approach was chosen for the present study because it provides one way to relate the benchmark cut points to the cut point set by the state for the AIMS test. C. Data used in the Study The latent-class models examined in the study were tested with samples of third, fifth, eighth, and 10th grade students from schools in Arizona using the Galileo Educational Management System. These grade levels were selected because at the time of the study the statewide Arizona’s Instrument to Measure Standards (AIMS) test was administered only at those grade levels. The data for the study included the math and reading and literature AIMS tests administered in the spring of 2004 and math and reading and literature benchmark tests administered in late fall of 2003 and the spring of 2004. In the 10th grade sample only reading tests were considered because at this grade level the participating schools did not include a math benchmark test aligned with Arizona standards reflected in the AIMS test.
Standards Mastery Determined by 1.800.367.4762 Benchmark and Statewide Test Performance ati-online.com Assessment Technology, Incorporated © Assessment Technology, Incorporated 2005
5
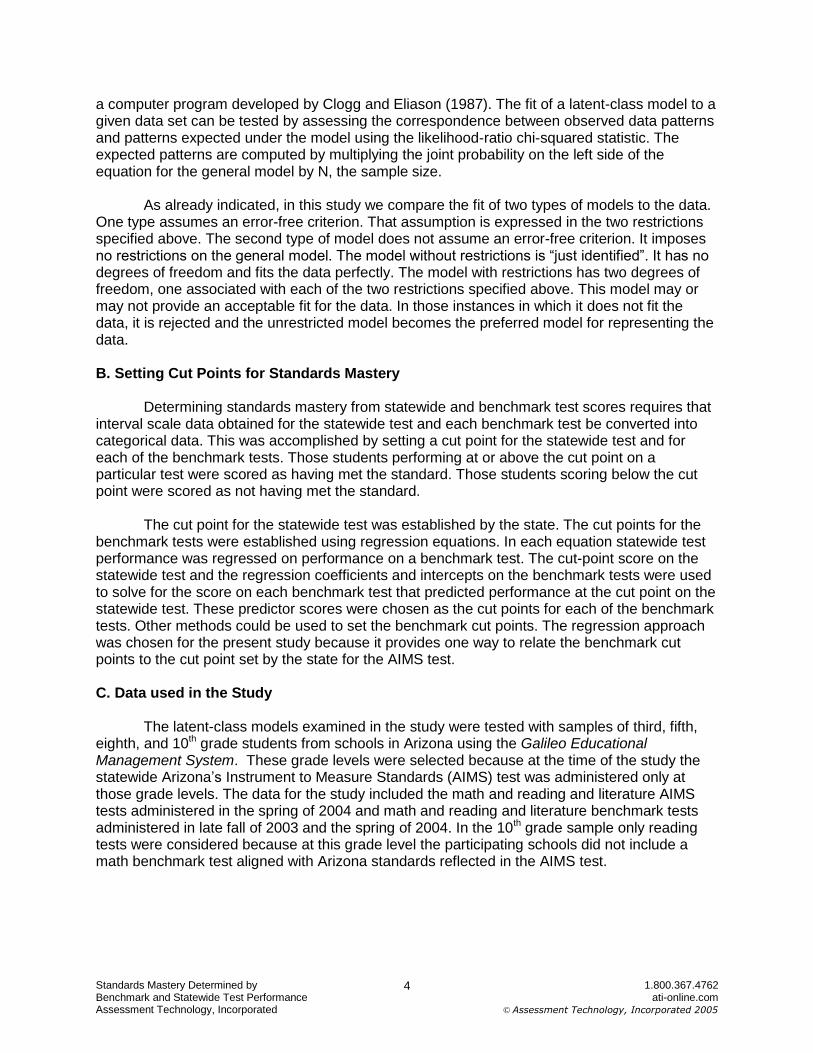
Table 1 shows the means and standard deviations for the participating students on the AIMS scales and the benchmark tests. TABLE 1 Means and Standard Deviations for AIMS and Benchmark Tests
Subject AIMS Benchmark 1 Benchmark 2
Mean SD Mean SD Mean SD
Third-Grade Math 536.26 62.90 754.77 72.74 951.05 101.01
Third-Grade Reading 522.26 39.70 768.90 91.44 836.40 100.41
Fifth-Grade Math 515.70 53.90 1003.10 91.40 1147.90 122.60
Fifth-Grade Reading 511.10 38.20 967.80 81.80 961.20 85.70
Eighth-Grade Math 468.00 44.20 1311.30 93.90 1417.00 96.50
Eighth-Grade Reading 500.50 43.70 1313.70 85.80 1312.40 96.40
Tenth-Grade Reading 528.90 47.20 1556.00 90.00 1540.60 119.40
Note that scores on the benchmark tests tend to rise from one assessment to the next.
The benchmark tests within each grade were placed on a common scale using vertical equating techniques based on Item Response Theory (IRT) (Thissen & Wainer, 2001). As a result, they can be used to measure progress.
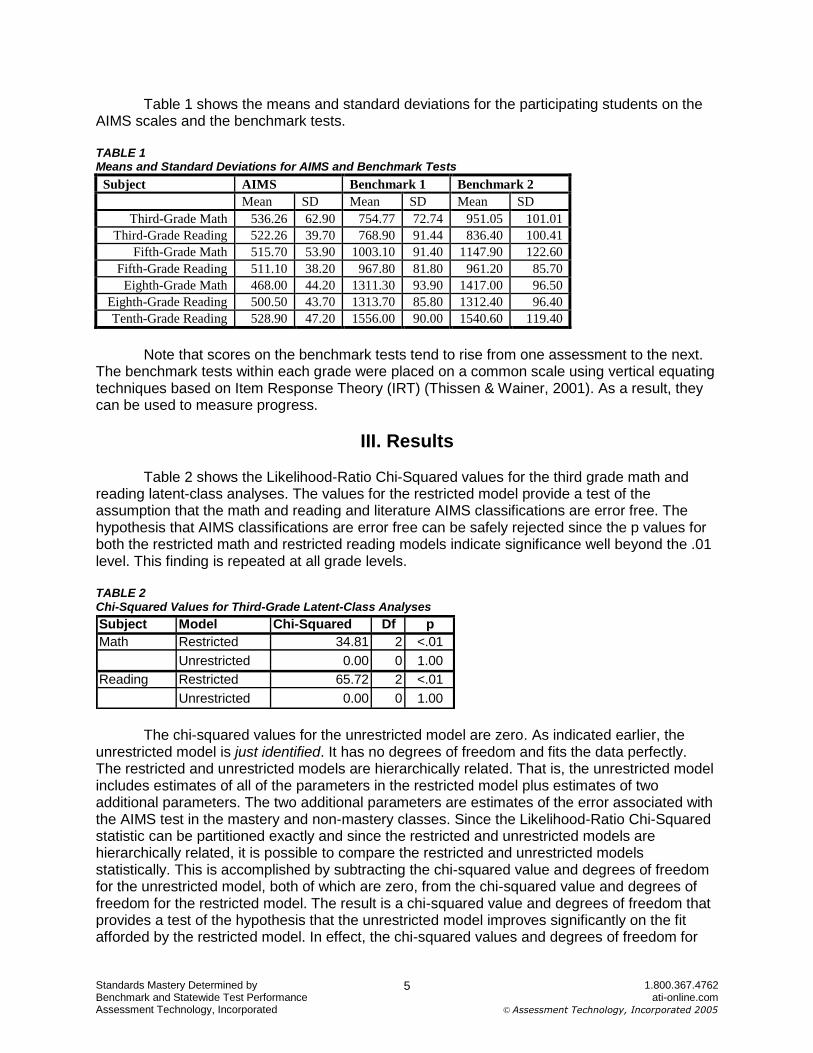
III. Results Table 2 shows the Likelihood-Ratio Chi-Squared values for the third grade math and reading latent-class analyses. The values for the restricted model provide a test of the assumption that the math and reading and literature AIMS classifications are error free. The hypothesis that AIMS classifications are error free can be safely rejected since the p values for both the restricted math and restricted reading models indicate significance well beyond the .01 level. This finding is repeated at all grade levels. TABLE 2 Chi-Squared Values for Third-Grade Latent-Class Analyses
The chi-squared values for the unrestricted model are zero. As indicated earlier, the unrestricted model is just identified. It has no degrees of freedom and fits the data perfectly. The restricted and unrestricted models are hierarchically related. That is, the unrestricted model includes estimates of all of the parameters in the restricted model plus estimates of two additional parameters. The two additional parameters are estimates of the error associated with the AIMS test in the mastery and non-mastery classes. Since the Likelihood-Ratio Chi-Squared statistic can be partitioned exactly and since the restricted and unrestricted models are hierarchically related, it is possible to compare the restricted and unrestricted models statistically. This is accomplished by subtracting the chi-squared value and degrees of freedom for the unrestricted model, both of which are zero, from the chi-squared value and degrees of freedom for the restricted model. The result is a chi-squared value and degrees of freedom that provides a test of the hypothesis that the unrestricted model improves significantly on the fit afforded by the restricted model. In effect, the chi-squared values and degrees of freedom for
Subject Model Chi-Squared Df p
Math Restricted 34.81 2 <.01
Unrestricted 0.00 0 1.00
Reading Restricted 65.72 2 <.01
Unrestricted 0.00 0 1.00
Standards Mastery Determined by 1.800.367.4762 Benchmark and Statewide Test Performance ati-online.com Assessment Technology, Incorporated © Assessment Technology, Incorporated 2005
6
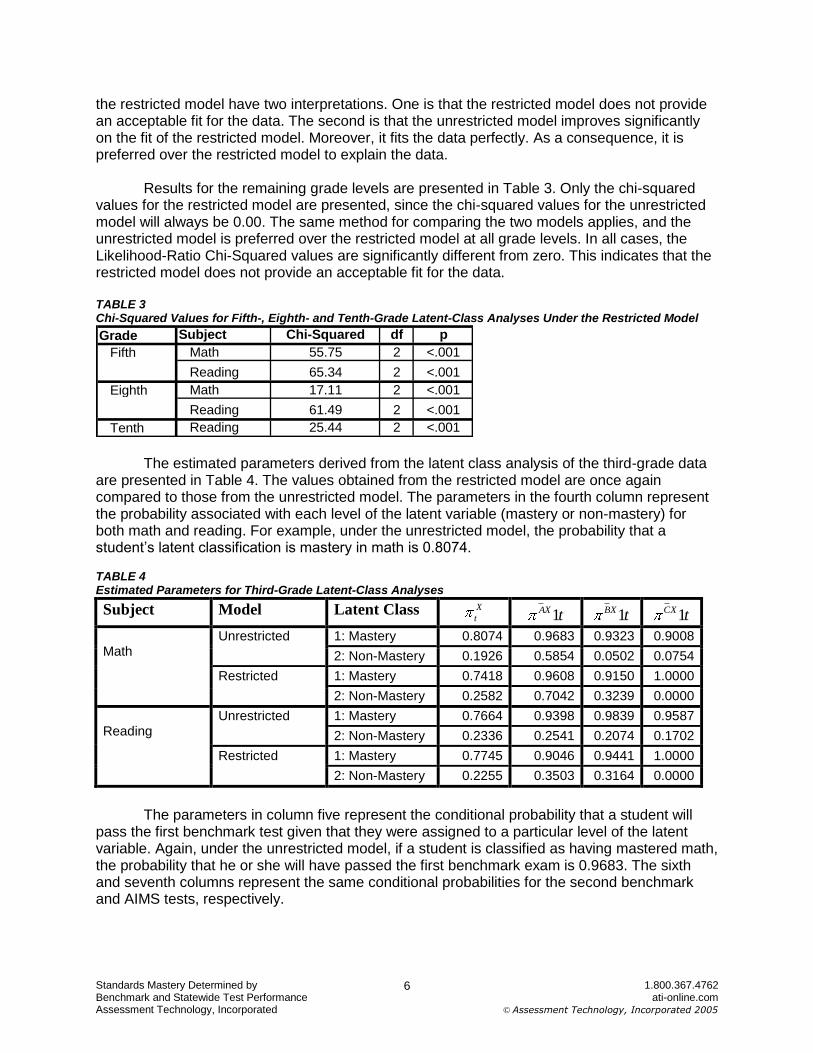
the restricted model have two interpretations. One is that the restricted model does not provide an acceptable fit for the data. The second is that the unrestricted model improves significantly on the fit of the restricted model. Moreover, it fits the data perfectly. As a consequence, it is preferred over the restricted model to explain the data. Results for the remaining grade levels are presented in Table 3. Only the chi-squared values for the restricted model are presented, since the chi-squared values for the unrestricted model will always be 0.00. The same method for comparing the two models applies, and the unrestricted model is preferred over the restricted model at all grade levels. In all cases, the Likelihood-Ratio Chi-Squared values are significantly different from zero. This indicates that the restricted model does not provide an acceptable fit for the data. TABLE 3 Chi-Squared Values for Fifth-, Eighth- and Tenth-Grade Latent-Class Analyses Under the Restricted Model
The estimated parameters derived from the latent class analysis of the third-grade data are presented in Table 4. The values obtained from the restricted model are once again compared to those from the unrestricted model. The parameters in the fourth column represent the probability associated with each level of the latent variable (mastery or non-mastery) for both math and reading. For example, under the unrestricted model, the probability that a student’s latent classification is mastery in math is 0.8074. TABLE 4 Estimated Parameters for Third-Grade Latent-Class Analyses
Subject Model Latent Class X
t tXA 1 tXB 1 tXC 1
Math
Unrestricted 1: Mastery 0.8074 0.9683 0.9323 0.9008
2: Non-Mastery 0.1926 0.5854 0.0502 0.0754
Restricted 1: Mastery 0.7418 0.9608 0.9150 1.0000
2: Non-Mastery 0.2582 0.7042 0.3239 0.0000
Reading
Unrestricted 1: Mastery 0.7664 0.9398 0.9839 0.9587
2: Non-Mastery 0.2336 0.2541 0.2074 0.1702
Restricted 1: Mastery 0.7745 0.9046 0.9441 1.0000
2: Non-Mastery 0.2255 0.3503 0.3164 0.0000
The parameters in column five represent the conditional probability that a student will
pass the first benchmark test given that they were assigned to a particular level of the latent variable. Again, under the unrestricted model, if a student is classified as having mastered math, the probability that he or she will have passed the first benchmark exam is 0.9683. The sixth and seventh columns represent the same conditional probabilities for the second benchmark and AIMS tests, respectively.
Grade Subject Chi-Squared df p
Fifth Math 55.75 2 <.001
Reading 65.34 2 <.001
Eighth Math 17.11 2 <.001
Reading 61.49 2 <.001
Tenth Reading 25.44 2 <.001
Standards Mastery Determined by 1.800.367.4762 Benchmark and Statewide Test Performance ati-online.com Assessment Technology, Incorporated © Assessment Technology, Incorporated 2005
7
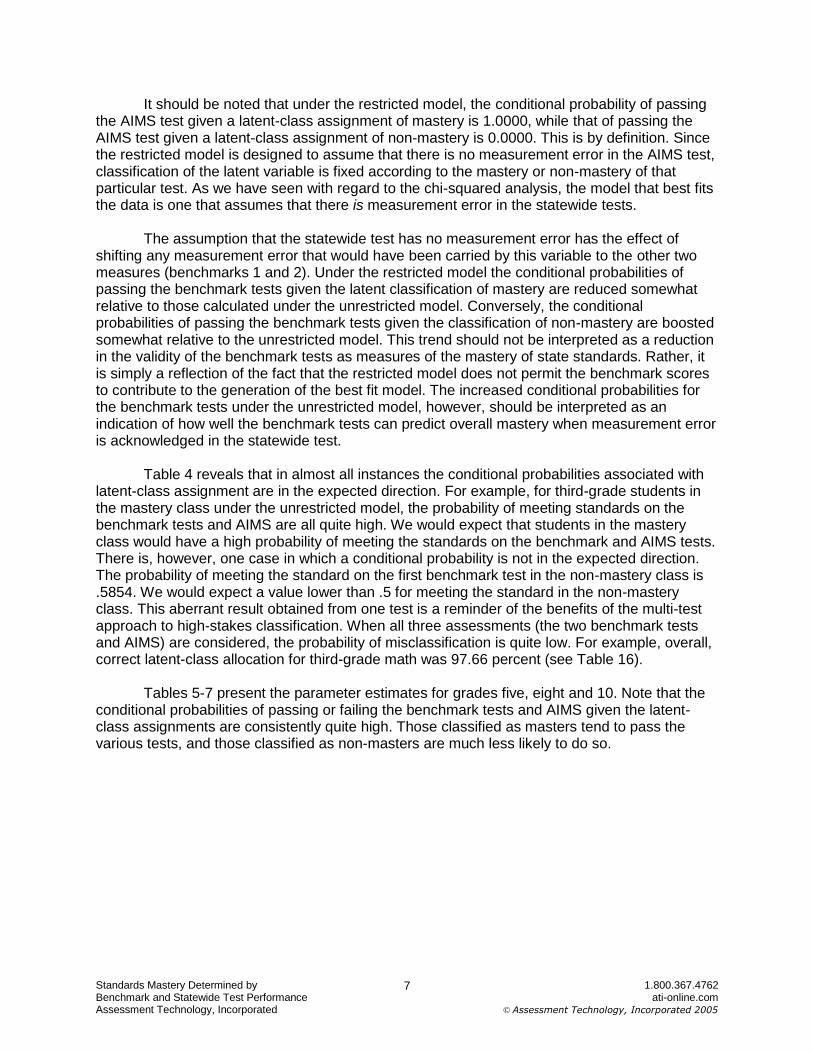
It should be noted that under the restricted model, the conditional probability of passing the AIMS test given a latent-class assignment of mastery is 1.0000, while that of passing the AIMS test given a latent-class assignment of non-mastery is 0.0000. This is by definition. Since the restricted model is designed to assume that there is no measurement error in the AIMS test, classification of the latent variable is fixed according to the mastery or non-mastery of that particular test. As we have seen with regard to the chi-squared analysis, the model that best fits the data is one that assumes that there is measurement error in the statewide tests.
The assumption that the statewide test has no measurement error has the effect of
shifting any measurement error that would have been carried by this variable to the other two measures (benchmarks 1 and 2). Under the restricted model the conditional probabilities of passing the benchmark tests given the latent classification of mastery are reduced somewhat relative to those calculated under the unrestricted model. Conversely, the conditional probabilities of passing the benchmark tests given the classification of non-mastery are boosted somewhat relative to the unrestricted model. This trend should not be interpreted as a reduction in the validity of the benchmark tests as measures of the mastery of state standards. Rather, it is simply a reflection of the fact that the restricted model does not permit the benchmark scores to contribute to the generation of the best fit model. The increased conditional probabilities for the benchmark tests under the unrestricted model, however, should be interpreted as an indication of how well the benchmark tests can predict overall mastery when measurement error is acknowledged in the statewide test.
Table 4 reveals that in almost all instances the conditional probabilities associated with latent-class assignment are in the expected direction. For example, for third-grade students in the mastery class under the unrestricted model, the probability of meeting standards on the benchmark tests and AIMS are all quite high. We would expect that students in the mastery class would have a high probability of meeting the standards on the benchmark and AIMS tests. There is, however, one case in which a conditional probability is not in the expected direction. The probability of meeting the standard on the first benchmark test in the non-mastery class is .5854. We would expect a value lower than .5 for meeting the standard in the non-mastery class. This aberrant result obtained from one test is a reminder of the benefits of the multi-test approach to high-stakes classification. When all three assessments (the two benchmark tests and AIMS) are considered, the probability of misclassification is quite low. For example, overall, correct latent-class allocation for third-grade math was 97.66 percent (see Table 16).
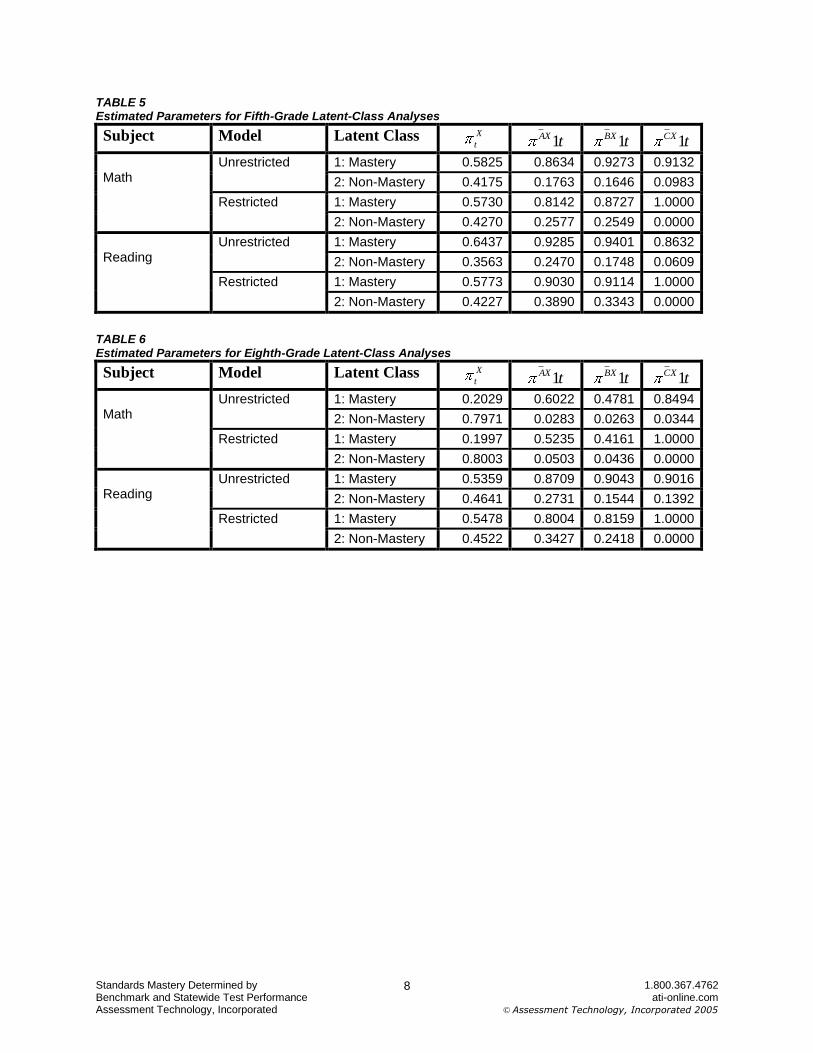
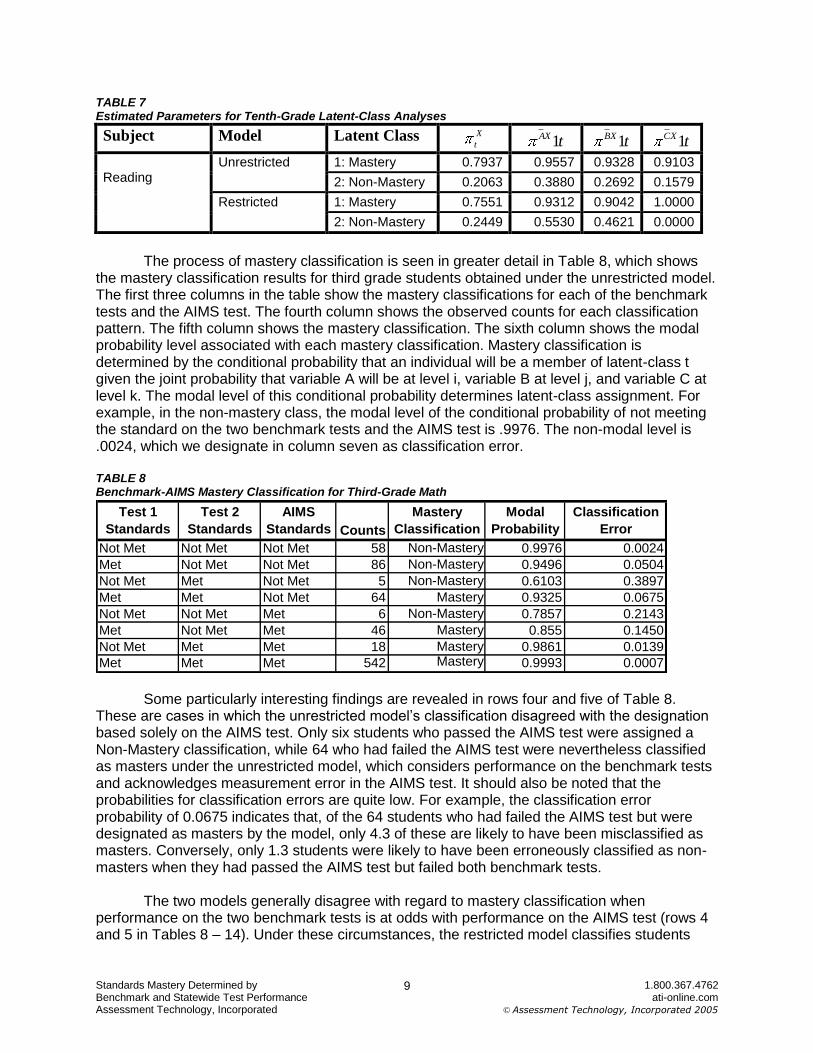
Tables 5-7 present the parameter estimates for grades five, eight and 10. Note that the conditional probabilities of passing or failing the benchmark tests and AIMS given the latent-class assignments are consistently quite high. Those classified as masters tend to pass the various tests, and those classified as non-masters are much less likely to do so.
Standards Mastery Determined by 1.800.367.4762 Benchmark and Statewide Test Performance ati-online.com Assessment Technology, Incorporated © Assessment Technology, Incorporated 2005
8
TABLE 5 Estimated Parameters for Fifth-Grade Latent-Class Analyses
Subject Model Latent Class X
t tXA 1 tXB 1 tXC 1
Math
Unrestricted 1: Mastery 0.5825 0.8634 0.9273 0.9132
2: Non-Mastery 0.4175 0.1763 0.1646 0.0983
Restricted 1: Mastery 0.5730 0.8142 0.8727 1.0000
2: Non-Mastery 0.4270 0.2577 0.2549 0.0000
Reading
Unrestricted 1: Mastery 0.6437 0.9285 0.9401 0.8632
2: Non-Mastery 0.3563 0.2470 0.1748 0.0609
Restricted 1: Mastery 0.5773 0.9030 0.9114 1.0000
2: Non-Mastery 0.4227 0.3890 0.3343 0.0000
TABLE 6 Estimated Parameters for Eighth-Grade Latent-Class Analyses
Subject Model Latent Class X
t tXA 1 tXB 1 tXC 1
Math
Unrestricted 1: Mastery 0.2029 0.6022 0.4781 0.8494
2: Non-Mastery 0.7971 0.0283 0.0263 0.0344
Restricted 1: Mastery 0.1997 0.5235 0.4161 1.0000
2: Non-Mastery 0.8003 0.0503 0.0436 0.0000
Reading
Unrestricted 1: Mastery 0.5359 0.8709 0.9043 0.9016
2: Non-Mastery 0.4641 0.2731 0.1544 0.1392
Restricted 1: Mastery 0.5478 0.8004 0.8159 1.0000
2: Non-Mastery 0.4522 0.3427 0.2418 0.0000
Standards Mastery Determined by 1.800.367.4762 Benchmark and Statewide Test Performance ati-online.com Assessment Technology, Incorporated © Assessment Technology, Incorporated 2005
9
TABLE 7 Estimated Parameters for Tenth-Grade Latent-Class Analyses
Subject Model Latent Class X
t tXA 1 tXB 1 tXC 1
Reading
Unrestricted 1: Mastery 0.7937 0.9557 0.9328 0.9103
2: Non-Mastery 0.2063 0.3880 0.2692 0.1579
Restricted 1: Mastery 0.7551 0.9312 0.9042 1.0000
2: Non-Mastery 0.2449 0.5530 0.4621 0.0000
The process of mastery classification is seen in greater detail in Table 8, which shows the mastery classification results for third grade students obtained under the unrestricted model. The first three columns in the table show the mastery classifications for each of the benchmark tests and the AIMS test. The fourth column shows the observed counts for each classification pattern. The fifth column shows the mastery classification. The sixth column shows the modal probability level associated with each mastery classification. Mastery classification is determined by the conditional probability that an individual will be a member of latent-class t given the joint probability that variable A will be at level i, variable B at level j, and variable C at level k. The modal level of this conditional probability determines latent-class assignment. For example, in the non-mastery class, the modal level of the conditional probability of not meeting the standard on the two benchmark tests and the AIMS test is .9976. The non-modal level is .0024, which we designate in column seven as classification error. TABLE 8 Benchmark-AIMS Mastery Classification for Third-Grade Math
Some particularly interesting findings are revealed in rows four and five of Table 8. These are cases in which the unrestricted model’s classification disagreed with the designation based solely on the AIMS test. Only six students who passed the AIMS test were assigned a Non-Mastery classification, while 64 who had failed the AIMS test were nevertheless classified as masters under the unrestricted model, which considers performance on the benchmark tests and acknowledges measurement error in the AIMS test. It should also be noted that the probabilities for classification errors are quite low. For example, the classification error probability of 0.0675 indicates that, of the 64 students who had failed the AIMS test but were designated as masters by the model, only 4.3 of these are likely to have been misclassified as masters. Conversely, only 1.3 students were likely to have been erroneously classified as non-masters when they had passed the AIMS test but failed both benchmark tests. The two models generally disagree with regard to mastery classification when performance on the two benchmark tests is at odds with performance on the AIMS test (rows 4 and 5 in Tables 8 – 14). Under these circumstances, the restricted model classifies students
Test 1
Standards
Test 2
Standards
AIMS
Standards Counts
Mastery
Classification
Modal
Probability
Classification
Error
Not Met Not Met Not Met 58 Non-Mastery 0.9976 0.0024
Met Not Met Not Met 86 Non-Mastery 0.9496 0.0504
Not Met Met Not Met 5 Non-Mastery 0.6103 0.3897
Met Met Not Met 64 Mastery 0.9325 0.0675
Not Met Not Met Met 6 Non-Mastery 0.7857 0.2143
Met Not Met Met 46 Mastery 0.855 0.1450
Not Met Met Met 18 Mastery 0.9861 0.0139
Met Met Met 542 Mastery 0.9993 0.0007
Standards Mastery Determined by 1.800.367.4762 Benchmark and Statewide Test Performance ati-online.com Assessment Technology, Incorporated © Assessment Technology, Incorporated 2005
10
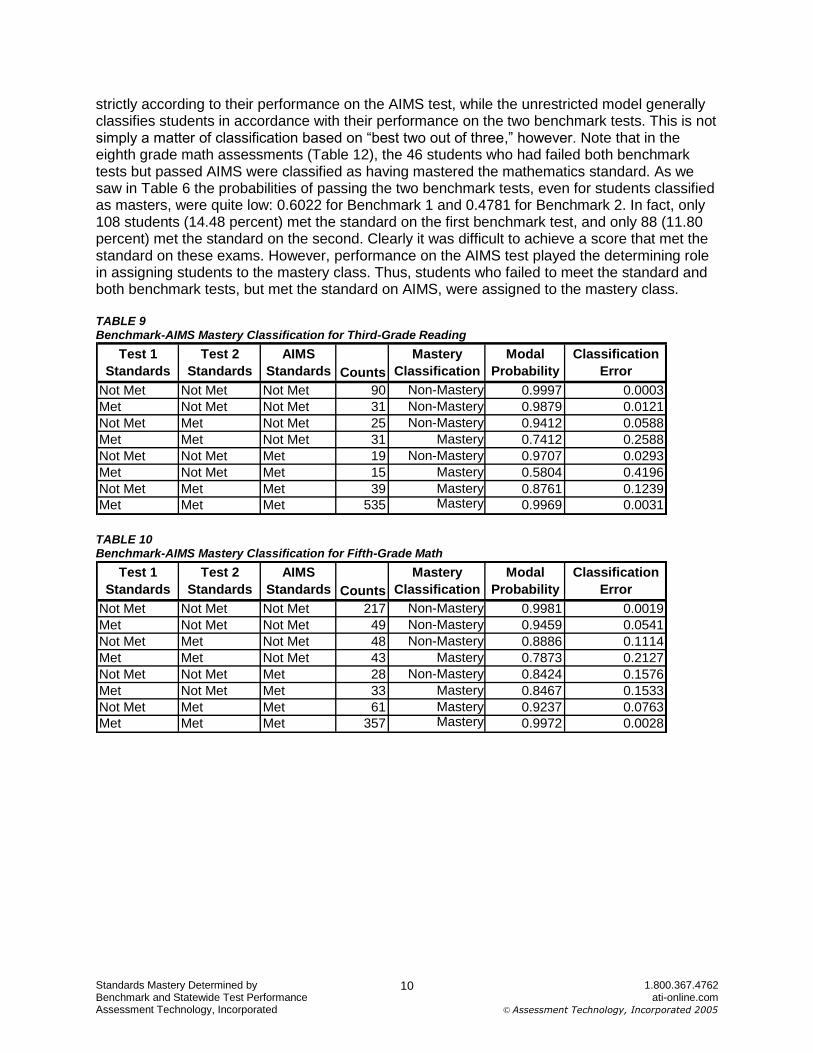
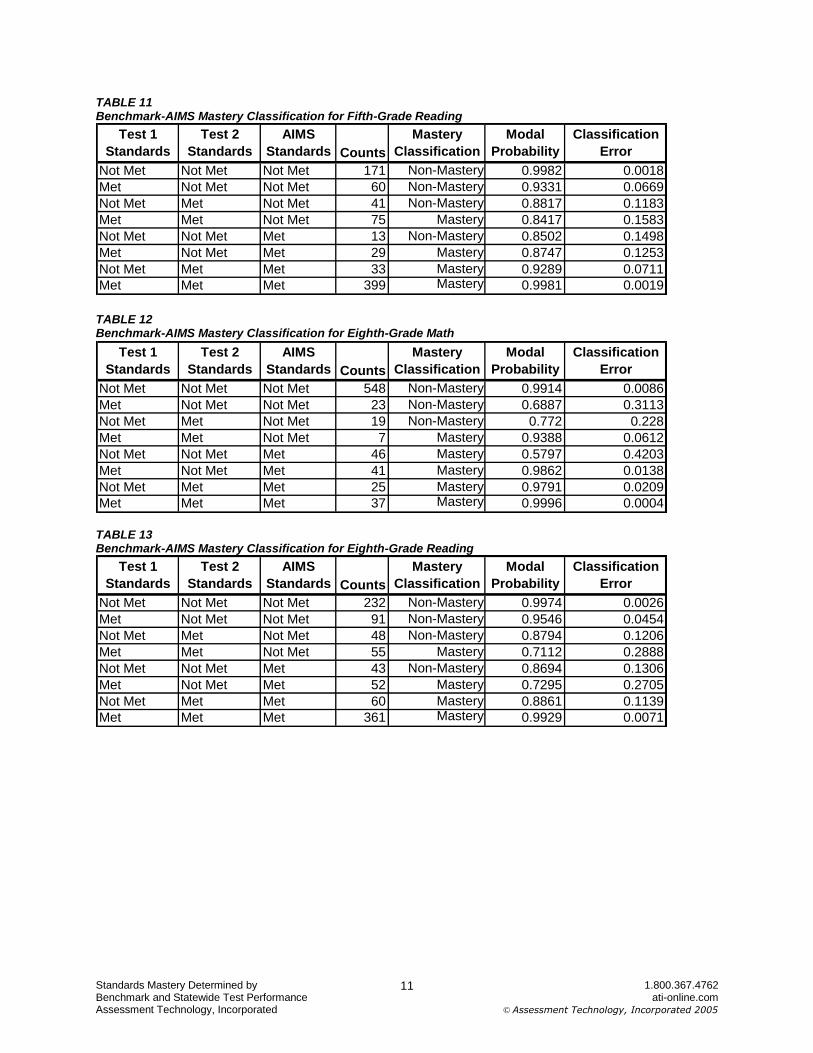
strictly according to their performance on the AIMS test, while the unrestricted model generally classifies students in accordance with their performance on the two benchmark tests. This is not simply a matter of classification based on “best two out of three,” however. Note that in the eighth grade math assessments (Table 12), the 46 students who had failed both benchmark tests but passed AIMS were classified as having mastered the mathematics standard. As we saw in Table 6 the probabilities of passing the two benchmark tests, even for students classified as masters, were quite low: 0.6022 for Benchmark 1 and 0.4781 for Benchmark 2. In fact, only 108 students (14.48 percent) met the standard on the first benchmark test, and only 88 (11.80 percent) met the standard on the second. Clearly it was difficult to achieve a score that met the standard on these exams. However, performance on the AIMS test played the determining role in assigning students to the mastery class. Thus, students who failed to meet the standard and both benchmark tests, but met the standard on AIMS, were assigned to the mastery class. TABLE 9 Benchmark-AIMS Mastery Classification for Third-Grade Reading
TABLE 10 Benchmark-AIMS Mastery Classification for Fifth-Grade Math
Test 1
Standards
Test 2
Standards
AIMS
Standards Counts
Mastery
Classification
Modal
Probability
Classification
Error
Not Met Not Met Not Met 90 Non-Mastery 0.9997 0.0003
Met Not Met Not Met 31 Non-Mastery 0.9879 0.0121
Not Met Met Not Met 25 Non-Mastery 0.9412 0.0588
Met Met Not Met 31 Mastery 0.7412 0.2588
Not Met Not Met Met 19 Non-Mastery 0.9707 0.0293
Met Not Met Met 15 Mastery 0.5804 0.4196
Not Met Met Met 39 Mastery 0.8761 0.1239
Met Met Met 535 Mastery 0.9969 0.0031
Test 1
Standards
Test 2
Standards
AIMS
Standards Counts
Mastery
Classification
Modal
Probability
Classification
Error
Not Met Not Met Not Met 217 Non-Mastery 0.9981 0.0019
Met Not Met Not Met 49 Non-Mastery 0.9459 0.0541
Not Met Met Not Met 48 Non-Mastery 0.8886 0.1114
Met Met Not Met 43 Mastery 0.7873 0.2127
Not Met Not Met Met 28 Non-Mastery 0.8424 0.1576
Met Not Met Met 33 Mastery 0.8467 0.1533
Not Met Met Met 61 Mastery 0.9237 0.0763
Met Met Met 357 Mastery 0.9972 0.0028
Standards Mastery Determined by 1.800.367.4762 Benchmark and Statewide Test Performance ati-online.com Assessment Technology, Incorporated © Assessment Technology, Incorporated 2005
11
TABLE 11 Benchmark-AIMS Mastery Classification for Fifth-Grade Reading
TABLE 12 Benchmark-AIMS Mastery Classification for Eighth-Grade Math
TABLE 13 Benchmark-AIMS Mastery Classification for Eighth-Grade Reading
Test 1
Standards
Test 2
Standards
AIMS
Standards Counts
Mastery
Classification
Modal
Probability
Classification
Error
Not Met Not Met Not Met 171 Non-Mastery 0.9982 0.0018
Met Not Met Not Met 60 Non-Mastery 0.9331 0.0669
Not Met Met Not Met 41 Non-Mastery 0.8817 0.1183
Met Met Not Met 75 Mastery 0.8417 0.1583
Not Met Not Met Met 13 Non-Mastery 0.8502 0.1498
Met Not Met Met 29 Mastery 0.8747 0.1253
Not Met Met Met 33 Mastery 0.9289 0.0711
Met Met Met 399 Mastery 0.9981 0.0019
Test 1
Standards
Test 2
Standards
AIMS
Standards Counts
Mastery
Classification
Modal
Probability
Classification
Error
Not Met Not Met Not Met 548 Non-Mastery 0.9914 0.0086
Met Not Met Not Met 23 Non-Mastery 0.6887 0.3113
Not Met Met Not Met 19 Non-Mastery 0.772 0.228
Met Met Not Met 7 Mastery 0.9388 0.0612
Not Met Not Met Met 46 Mastery 0.5797 0.4203
Met Not Met Met 41 Mastery 0.9862 0.0138
Not Met Met Met 25 Mastery 0.9791 0.0209
Met Met Met 37 Mastery 0.9996 0.0004
Test 1
Standards
Test 2
Standards
AIMS
Standards Counts
Mastery
Classification
Modal
Probability
Classification
Error
Not Met Not Met Not Met 232 Non-Mastery 0.9974 0.0026
Met Not Met Not Met 91 Non-Mastery 0.9546 0.0454
Not Met Met Not Met 48 Non-Mastery 0.8794 0.1206
Met Met Not Met 55 Mastery 0.7112 0.2888
Not Met Not Met Met 43 Non-Mastery 0.8694 0.1306
Met Not Met Met 52 Mastery 0.7295 0.2705
Not Met Met Met 60 Mastery 0.8861 0.1139
Met Met Met 361 Mastery 0.9929 0.0071
Standards Mastery Determined by 1.800.367.4762 Benchmark and Statewide Test Performance ati-online.com Assessment Technology, Incorporated © Assessment Technology, Incorporated 2005
12
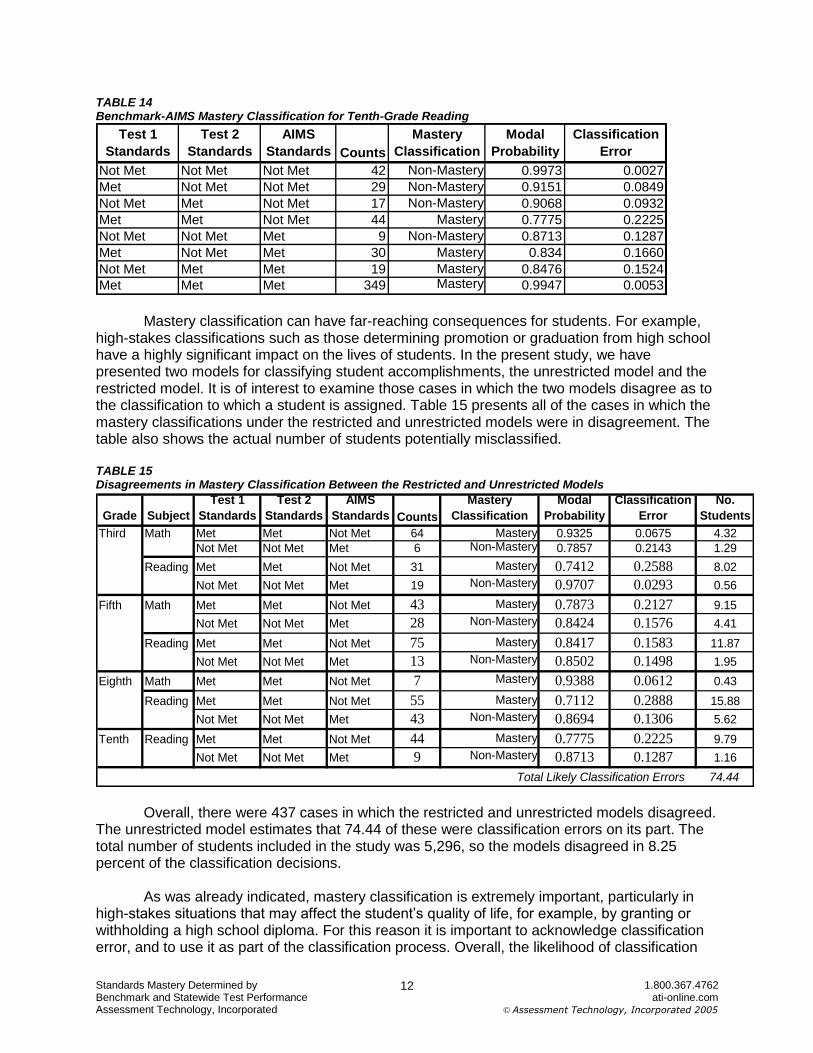
TABLE 14 Benchmark-AIMS Mastery Classification for Tenth-Grade Reading
Mastery classification can have far-reaching consequences for students. For example, high-stakes classifications such as those determining promotion or graduation from high school have a highly significant impact on the lives of students. In the present study, we have presented two models for classifying student accomplishments, the unrestricted model and the restricted model. It is of interest to examine those cases in which the two models disagree as to the classification to which a student is assigned. Table 15 presents all of the cases in which the mastery classifications under the restricted and unrestricted models were in disagreement. The table also shows the actual number of students potentially misclassified. TABLE 15 Disagreements in Mastery Classification Between the Restricted and Unrestricted Models
Overall, there were 437 cases in which the restricted and unrestricted models disagreed.
The unrestricted model estimates that 74.44 of these were classification errors on its part. The total number of students included in the study was 5,296, so the models disagreed in 8.25 percent of the classification decisions.
As was already indicated, mastery classification is extremely important, particularly in
high-stakes situations that may affect the student’s quality of life, for example, by granting or withholding a high school diploma. For this reason it is important to acknowledge classification error, and to use it as part of the classification process. Overall, the likelihood of classification
Test 1
Standards
Test 2
Standards
AIMS
Standards Counts
Mastery
Classification
Modal
Probability
Classification
Error
Not Met Not Met Not Met 42 Non-Mastery 0.9973 0.0027
Met Not Met Not Met 29 Non-Mastery 0.9151 0.0849
Not Met Met Not Met 17 Non-Mastery 0.9068 0.0932
Met Met Not Met 44 Mastery 0.7775 0.2225
Not Met Not Met Met 9 Non-Mastery 0.8713 0.1287
Met Not Met Met 30 Mastery 0.834 0.1660
Not Met Met Met 19 Mastery 0.8476 0.1524
Met Met Met 349 Mastery 0.9947 0.0053
Grade Subject
Test 1
Standards
Test 2
Standards
AIMS
Standards Counts
Mastery
Classification
Modal
Probability
Classification
Error
No.
Students
Third Math Met Met Not Met 64 Mastery 0.9325 0.0675 4.32
Not Met Not Met Met 6 Non-Mastery 0.7857 0.2143 1.29
Reading Met Met Not Met 31 Mastery 0.7412 0.2588 8.02
Not Met Not Met Met 19 Non-Mastery 0.9707 0.0293 0.56
Fifth Math Met Met Not Met 43 Mastery 0.7873 0.2127 9.15
Not Met Not Met Met 28 Non-Mastery 0.8424 0.1576 4.41
Reading Met Met Not Met 75 Mastery 0.8417 0.1583 11.87
Not Met Not Met Met 13 Non-Mastery 0.8502 0.1498 1.95
Eighth Math Met Met Not Met 7 Mastery 0.9388 0.0612 0.43
Reading Met Met Not Met 55 Mastery 0.7112 0.2888 15.88
Not Met Not Met Met 43 Non-Mastery 0.8694 0.1306 5.62
Tenth Reading Met Met Not Met 44 Mastery 0.7775 0.2225 9.79
Not Met Not Met Met 9 Non-Mastery 0.8713 0.1287 1.16
74.44Total Likely Classification Errors
Standards Mastery Determined by 1.800.367.4762 Benchmark and Statewide Test Performance ati-online.com Assessment Technology, Incorporated © Assessment Technology, Incorporated 2005
13
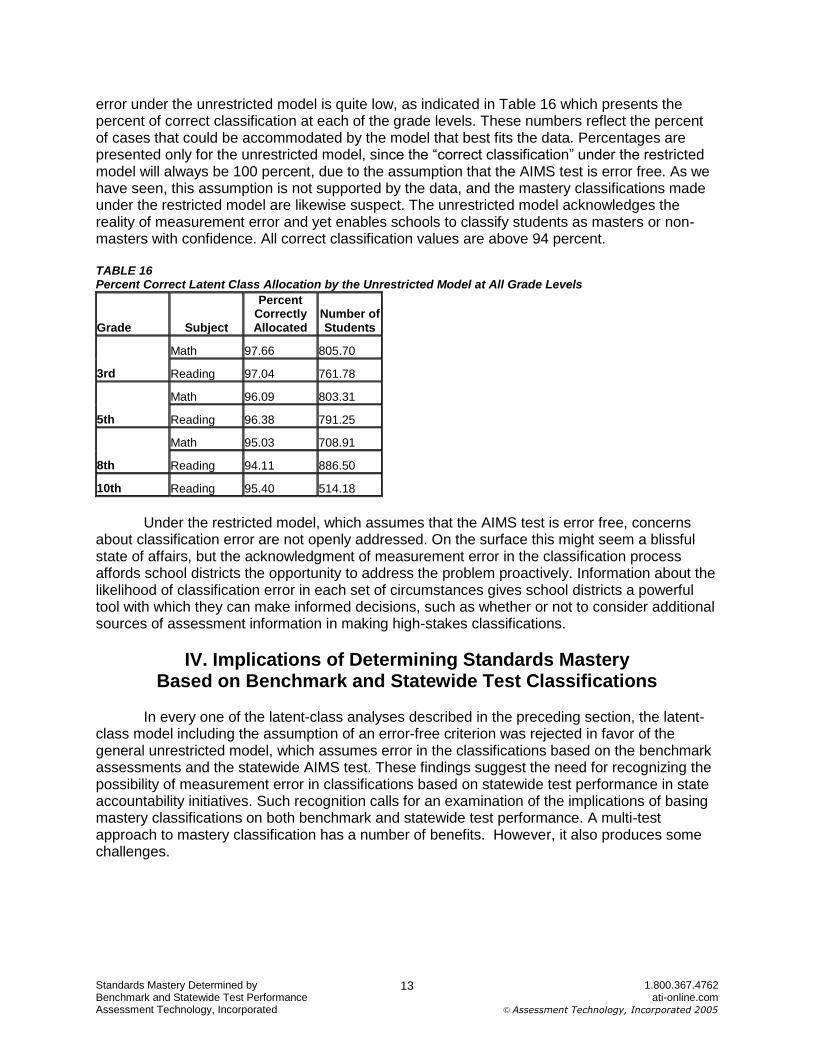
error under the unrestricted model is quite low, as indicated in Table 16 which presents the percent of correct classification at each of the grade levels. These numbers reflect the percent of cases that could be accommodated by the model that best fits the data. Percentages are presented only for the unrestricted model, since the “correct classification” under the restricted model will always be 100 percent, due to the assumption that the AIMS test is error free. As we have seen, this assumption is not supported by the data, and the mastery classifications made under the restricted model are likewise suspect. The unrestricted model acknowledges the reality of measurement error and yet enables schools to classify students as masters or non-masters with confidence. All correct classification values are above 94 percent. TABLE 16 Percent Correct Latent Class Allocation by the Unrestricted Model at All Grade Levels
Grade Subject
Percent Correctly Allocated
Number of Students
3rd
Math 97.66 805.70
Reading 97.04 761.78
5th
Math 96.09 803.31
Reading 96.38 791.25
8th
Math 95.03 708.91
Reading 94.11 886.50
10th Reading 95.40 514.18
Under the restricted model, which assumes that the AIMS test is error free, concerns about classification error are not openly addressed. On the surface this might seem a blissful state of affairs, but the acknowledgment of measurement error in the classification process affords school districts the opportunity to address the problem proactively. Information about the likelihood of classification error in each set of circumstances gives school districts a powerful tool with which they can make informed decisions, such as whether or not to consider additional sources of assessment information in making high-stakes classifications.
IV. Implications of Determining Standards Mastery Based on Benchmark and Statewide Test Classifications
In every one of the latent-class analyses described in the preceding section, the latent-class model including the assumption of an error-free criterion was rejected in favor of the general unrestricted model, which assumes error in the classifications based on the benchmark assessments and the statewide AIMS test. These findings suggest the need for recognizing the possibility of measurement error in classifications based on statewide test performance in state accountability initiatives. Such recognition calls for an examination of the implications of basing mastery classifications on both benchmark and statewide test performance. A multi-test approach to mastery classification has a number of benefits. However, it also produces some challenges.
Standards Mastery Determined by 1.800.367.4762 Benchmark and Statewide Test Performance ati-online.com Assessment Technology, Incorporated © Assessment Technology, Incorporated 2005
14
A. Reducing the Impact of a Single Test on High-Stakes Decisions One potential benefit of the approach utilizing both benchmark and statewide assessments is that it would reduce the impact of a single test on high-stakes decisions about schools and students. At the same time it would insure that mastery classification had a credible empirical basis. Accountability testing has significant consequences for schools and students. The wisdom of extensive reliance on a single test has been widely questioned when high-stakes decisions are involved (National Research Council, 1999). When mastery classification is based on performance on multiple tests, the stakes associated with performance on any one test are reduced. This reduction in no way compromises the fact that classifications are based on credible empirical evidence. The present study illustrated mastery classification based on three tests. Other options are also possible. For example, many districts administer four or five benchmark tests during the school year. Under these circumstances, mastery classification could be based on performance on subsets of tests. For instance, classifications could be based on any subset of three tests that included the statewide test. An option of this sort would further reduce the stakes associated with performance on a single test. B. Increasing Curricular Validity A second benefit of the multi-test approach is that it can increase curricular validity. Concerns related to fairness in accountability initiatives require that tests used for accountability purposes cover content that has been taught. The phrase Curricular Validity has been used to express this concern (National Research Council, 1999). The multi-test approach can affect curricular validity in three ways: First, it can increase content coverage. Second, it promotes curricular diversity. Third, it can link assessment to local instructional goals close to the time when they are targeted for instruction.
i. Increasing Content Coverage.
When standards mastery is linked to performance on a single test administered at one point in time at the end of the school year, content coverage is necessarily limited. Although the material covered on the test may be designed to reflect what has been taught, the extent to which instructional content is adequately covered on a single statewide assessment will necessarily be limited to some extent. In the not too distant past, this type of limitation in high-stakes tests frequently led to the charge that the test narrows the curriculum. Multiple testing can increase content coverage. For example, a much broader range of content can be covered in three tests than in one test. It is not unreasonable to expect that the lion’s share of curricular standards and performance objectives could be covered under a multi-test approach to accountability.
ii. Increasing curricular diversity.
In the multi-test approach, the scope and sequence of standards and performance objectives covered on benchmark assessments is controlled at the local district level. School systems vary greatly in their approach to curriculum. The multi-test approach promotes curricular diversity by making it possible for districts to establish their own benchmark tests articulated to their unique approaches to curriculum. Curricular diversity enhances curricular validity by linking what is tested to what is taught at the local level. Curricular diversity also
Standards Mastery Determined by 1.800.367.4762 Benchmark and Statewide Test Performance ati-online.com Assessment Technology, Incorporated © Assessment Technology, Incorporated 2005
15
enriches curriculum by reflecting the broad spectrum of approaches to curriculum designed to meet the needs of local communities.
iii. Linking assessment to instruction.
Linking assessment to instruction lies at the heart of curricular validity. To the extent that students do not have the opportunity to learn what is tested in an accountability initiative, the assessment instruments used in the initiative are invalid. The claim to curricular validity rests on the evidence that what is measured is what students have had the opportunity to learn in their instructional programs. The importance of this alignment of curriculum and instruction to high-stakes assessments was highlighted in the landmark circuit court decision in Debra P. v. Turlington (1981), in which it was ruled that students’ Fourteenth Amendment right to due process was violated in that they had not been taught the material assessed on the state-wide graduation test. The State of Florida Board of Education was enjoined from using the test as a graduation requirement for four years, during which time it was ordered to align curriculum and instruction with the test. Needless to say, this decision has had a great impact on policymakers. Benchmark tests assessing standards and performance objectives targeted for instruction at the local level reduce the danger of violating due process and provide clear evidence of curricular validity. C. Increasing Timely Access to Assessment Information that Counts A major benefit of the multi-test approach is that it increases timely access to assessment information that counts. Addressing concerns about test fairness, The National Research Council (1999) recommended that in addition to being given fair notice of the skills that will be tested, students should have access to appropriate test preparation. In addition, students in danger of failing the standardize test should be advised of their status well ahead of time and should be given appropriate remedial instruction to give them a better chance at passing. In the multi-test approach, performance on each benchmark test and the statewide test determine mastery classification. Each benchmark test provides immediate evidence that can be counted in determining standards mastery. The early availability of information that counts increases the capability of the school to adjust instruction as needed to promote standards mastery. The multi-test approach stands in sharp contrast to the single-test approach. In the single-test approach, benchmark assessments used to guide instruction play no role in determining the mastery of standards. The information provided by the benchmark test is useful to the extent that the benchmark test is effective in predicting how students will perform on the statewide test. Under these conditions, the value of the information available through benchmark testing is invariably compromised to some degree by the fact that all measurement error is assigned to the benchmark test while the statewide test is erroneously assumed to be error free. D. Increasing the Accuracy of Classification Decisions The multi-test approach to mastery classification presented in this study provides objective information on classification errors that can be taken into account when determining whether or not individual students have met standards. Information on classification errors can be used to increase the accuracy of classification decisions. Information on errors is particularly helpful in cases where students are on the borderline of demonstrating mastery in the context of a high-stakes classification, as in the case of graduation requirements. The availability of
Standards Mastery Determined by 1.800.367.4762 Benchmark and Statewide Test Performance ati-online.com Assessment Technology, Incorporated © Assessment Technology, Incorporated 2005
16
information regarding the degree of likely classification error affords school districts the opportunity to consider additional assessments if the classification error is high.
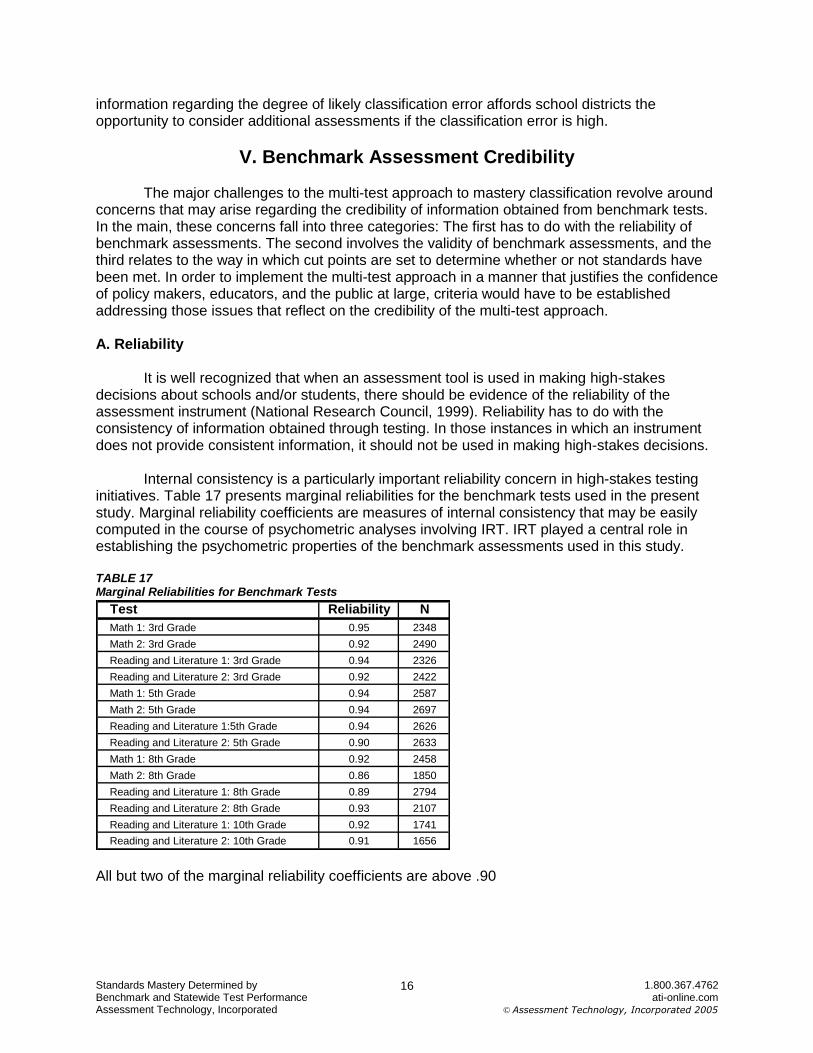
V. Benchmark Assessment Credibility The major challenges to the multi-test approach to mastery classification revolve around concerns that may arise regarding the credibility of information obtained from benchmark tests. In the main, these concerns fall into three categories: The first has to do with the reliability of benchmark assessments. The second involves the validity of benchmark assessments, and the third relates to the way in which cut points are set to determine whether or not standards have been met. In order to implement the multi-test approach in a manner that justifies the confidence of policy makers, educators, and the public at large, criteria would have to be established addressing those issues that reflect on the credibility of the multi-test approach. A. Reliability It is well recognized that when an assessment tool is used in making high-stakes decisions about schools and/or students, there should be evidence of the reliability of the assessment instrument (National Research Council, 1999). Reliability has to do with the consistency of information obtained through testing. In those instances in which an instrument does not provide consistent information, it should not be used in making high-stakes decisions. Internal consistency is a particularly important reliability concern in high-stakes testing initiatives. Table 17 presents marginal reliabilities for the benchmark tests used in the present study. Marginal reliability coefficients are measures of internal consistency that may be easily computed in the course of psychometric analyses involving IRT. IRT played a central role in establishing the psychometric properties of the benchmark assessments used in this study. TABLE 17 Marginal Reliabilities for Benchmark Tests
All but two of the marginal reliability coefficients are above .90
Test Reliability N
Math 1: 3rd Grade 0.95 2348
Math 2: 3rd Grade 0.92 2490
Reading and Literature 1: 3rd Grade 0.94 2326
Reading and Literature 2: 3rd Grade 0.92 2422
Math 1: 5th Grade 0.94 2587
Math 2: 5th Grade 0.94 2697
Reading and Literature 1:5th Grade 0.94 2626
Reading and Literature 2: 5th Grade 0.90 2633
Math 1: 8th Grade 0.92 2458
Math 2: 8th Grade 0.86 1850
Reading and Literature 1: 8th Grade 0.89 2794
Reading and Literature 2: 8th Grade 0.93 2107
Reading and Literature 1: 10th Grade 0.92 1741
Reading and Literature 2: 10th Grade 0.91 1656
Standards Mastery Determined by 1.800.367.4762 Benchmark and Statewide Test Performance ati-online.com Assessment Technology, Incorporated © Assessment Technology, Incorporated 2005
17
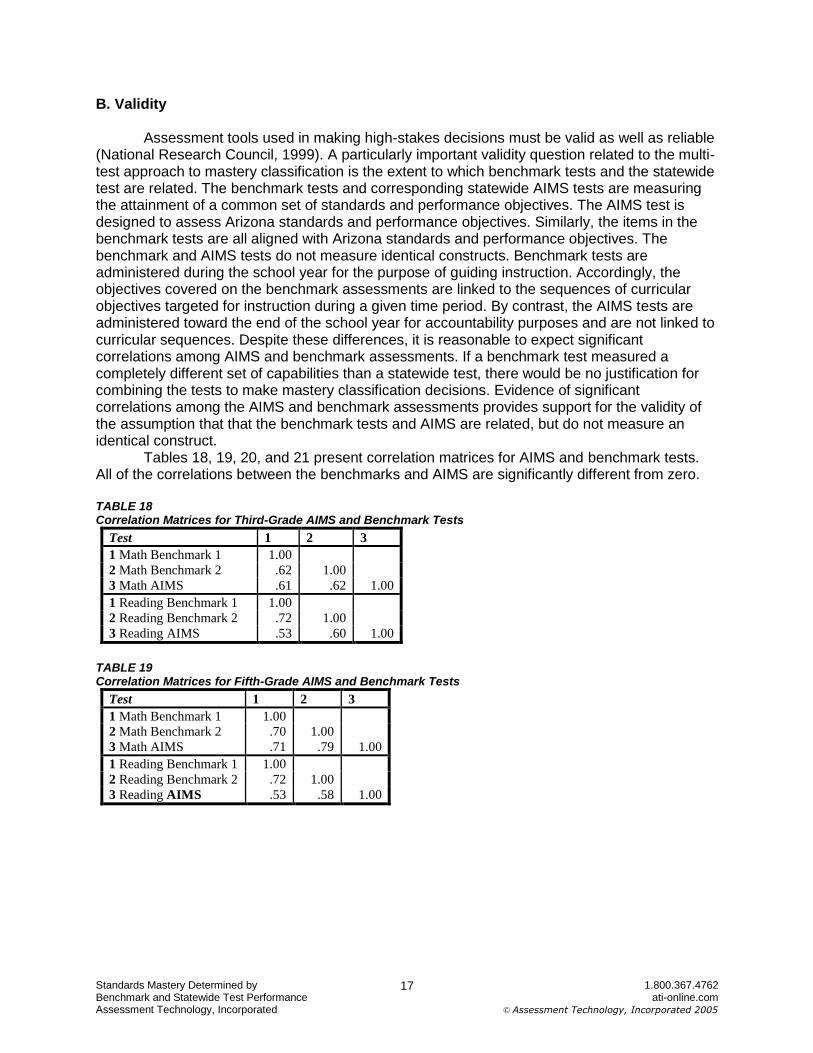
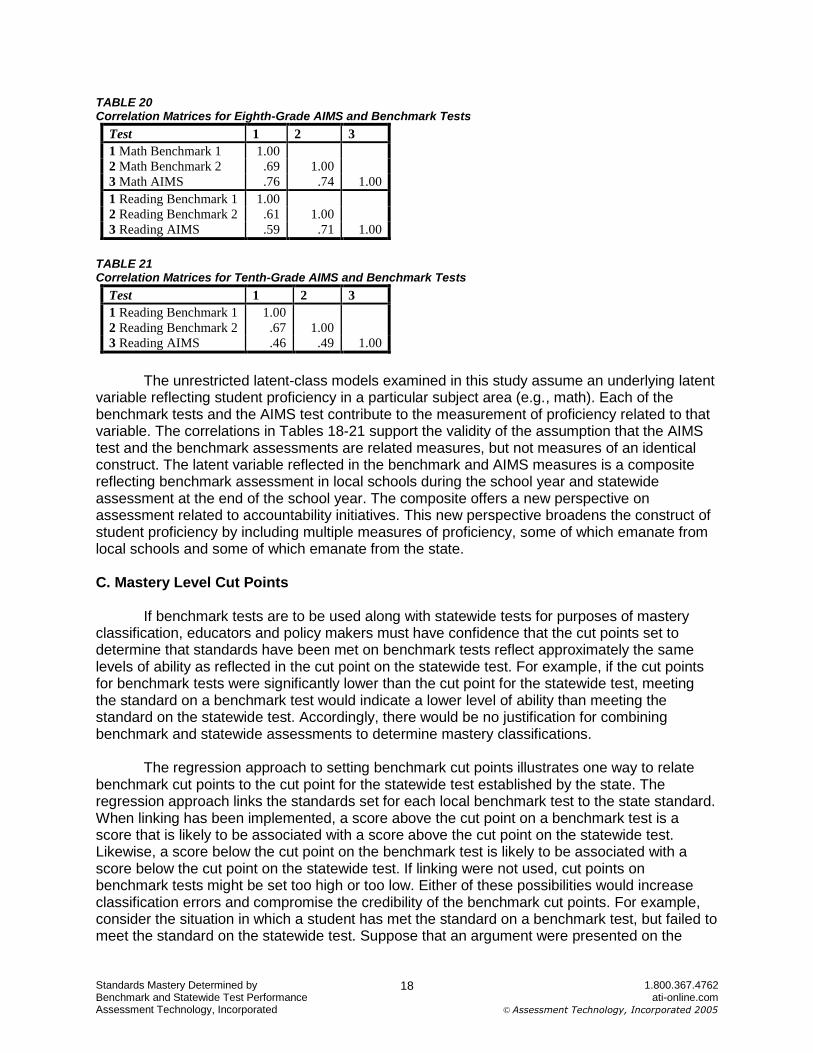
B. Validity Assessment tools used in making high-stakes decisions must be valid as well as reliable (National Research Council, 1999). A particularly important validity question related to the multi-test approach to mastery classification is the extent to which benchmark tests and the statewide test are related. The benchmark tests and corresponding statewide AIMS tests are measuring the attainment of a common set of standards and performance objectives. The AIMS test is designed to assess Arizona standards and performance objectives. Similarly, the items in the benchmark tests are all aligned with Arizona standards and performance objectives. The benchmark and AIMS tests do not measure identical constructs. Benchmark tests are administered during the school year for the purpose of guiding instruction. Accordingly, the objectives covered on the benchmark assessments are linked to the sequences of curricular objectives targeted for instruction during a given time period. By contrast, the AIMS tests are administered toward the end of the school year for accountability purposes and are not linked to curricular sequences. Despite these differences, it is reasonable to expect significant correlations among AIMS and benchmark assessments. If a benchmark test measured a completely different set of capabilities than a statewide test, there would be no justification for combining the tests to make mastery classification decisions. Evidence of significant correlations among the AIMS and benchmark assessments provides support for the validity of the assumption that that the benchmark tests and AIMS are related, but do not measure an identical construct. Tables 18, 19, 20, and 21 present correlation matrices for AIMS and benchmark tests. All of the correlations between the benchmarks and AIMS are significantly different from zero. TABLE 18 Correlation Matrices for Third-Grade AIMS and Benchmark Tests
Test 1 2 3
1 Math Benchmark 1 1.00
2 Math Benchmark 2 .62 1.00
3 Math AIMS .61 .62 1.00
1 Reading Benchmark 1 1.00
2 Reading Benchmark 2 .72 1.00
3 Reading AIMS .53 .60 1.00
TABLE 19 Correlation Matrices for Fifth-Grade AIMS and Benchmark Tests
Test 1 2 3
1 Math Benchmark 1 1.00
2 Math Benchmark 2 .70 1.00
3 Math AIMS .71 .79 1.00
1 Reading Benchmark 1 1.00
2 Reading Benchmark 2 .72 1.00
3 Reading AIMS .53 .58 1.00
Standards Mastery Determined by 1.800.367.4762 Benchmark and Statewide Test Performance ati-online.com Assessment Technology, Incorporated © Assessment Technology, Incorporated 2005
18
TABLE 20 Correlation Matrices for Eighth-Grade AIMS and Benchmark Tests
Test 1 2 3
1 Math Benchmark 1 1.00
2 Math Benchmark 2 .69 1.00
3 Math AIMS .76 .74 1.00
1 Reading Benchmark 1 1.00
2 Reading Benchmark 2 .61 1.00
3 Reading AIMS .59 .71 1.00
TABLE 21 Correlation Matrices for Tenth-Grade AIMS and Benchmark Tests
Test 1 2 3
1 Reading Benchmark 1 1.00
2 Reading Benchmark 2 .67 1.00
3 Reading AIMS .46 .49 1.00
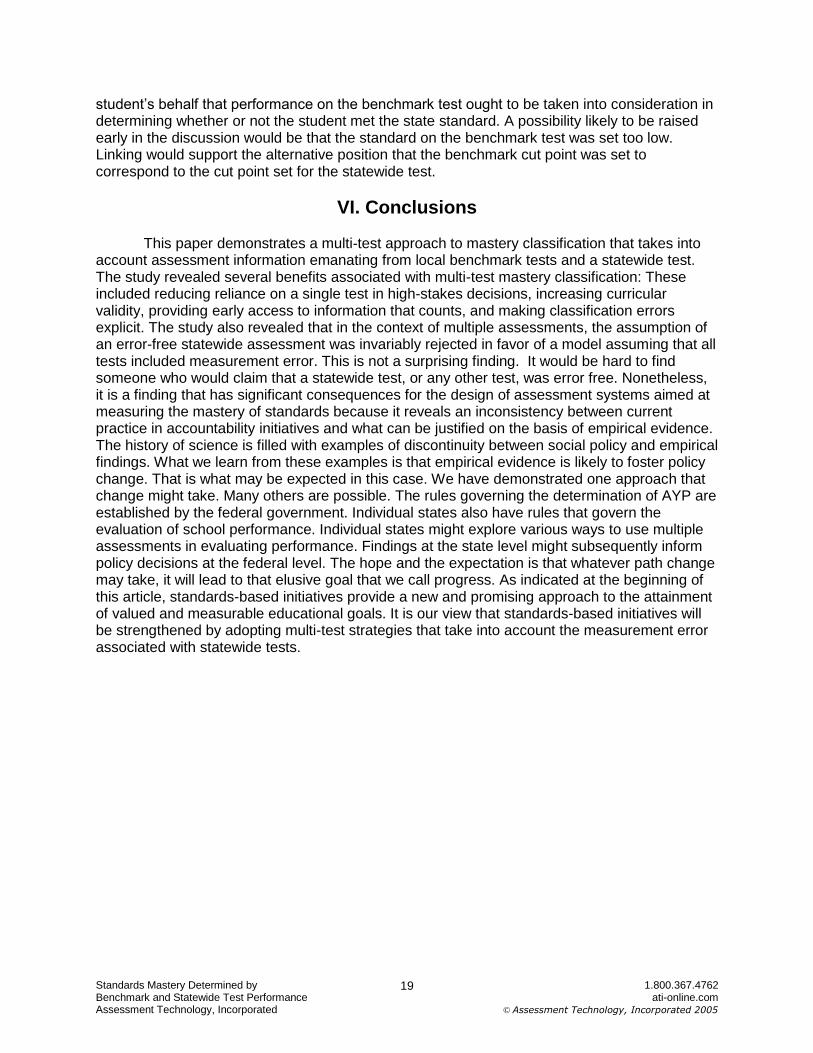
The unrestricted latent-class models examined in this study assume an underlying latent variable reflecting student proficiency in a particular subject area (e.g., math). Each of the benchmark tests and the AIMS test contribute to the measurement of proficiency related to that variable. The correlations in Tables 18-21 support the validity of the assumption that the AIMS test and the benchmark assessments are related measures, but not measures of an identical construct. The latent variable reflected in the benchmark and AIMS measures is a composite reflecting benchmark assessment in local schools during the school year and statewide assessment at the end of the school year. The composite offers a new perspective on assessment related to accountability initiatives. This new perspective broadens the construct of student proficiency by including multiple measures of proficiency, some of which emanate from local schools and some of which emanate from the state. C. Mastery Level Cut Points If benchmark tests are to be used along with statewide tests for purposes of mastery classification, educators and policy makers must have confidence that the cut points set to determine that standards have been met on benchmark tests reflect approximately the same levels of ability as reflected in the cut point on the statewide test. For example, if the cut points for benchmark tests were significantly lower than the cut point for the statewide test, meeting the standard on a benchmark test would indicate a lower level of ability than meeting the standard on the statewide test. Accordingly, there would be no justification for combining benchmark and statewide assessments to determine mastery classifications. The regression approach to setting benchmark cut points illustrates one way to relate benchmark cut points to the cut point for the statewide test established by the state. The regression approach links the standards set for each local benchmark test to the state standard. When linking has been implemented, a score above the cut point on a benchmark test is a score that is likely to be associated with a score above the cut point on the statewide test. Likewise, a score below the cut point on the benchmark test is likely to be associated with a score below the cut point on the statewide test. If linking were not used, cut points on benchmark tests might be set too high or too low. Either of these possibilities would increase classification errors and compromise the credibility of the benchmark cut points. For example, consider the situation in which a student has met the standard on a benchmark test, but failed to meet the standard on the statewide test. Suppose that an argument were presented on the
Standards Mastery Determined by 1.800.367.4762 Benchmark and Statewide Test Performance ati-online.com Assessment Technology, Incorporated © Assessment Technology, Incorporated 2005
19
student’s behalf that performance on the benchmark test ought to be taken into consideration in determining whether or not the student met the state standard. A possibility likely to be raised early in the discussion would be that the standard on the benchmark test was set too low. Linking would support the alternative position that the benchmark cut point was set to correspond to the cut point set for the statewide test.
VI. Conclusions This paper demonstrates a multi-test approach to mastery classification that takes into account assessment information emanating from local benchmark tests and a statewide test. The study revealed several benefits associated with multi-test mastery classification: These included reducing reliance on a single test in high-stakes decisions, increasing curricular validity, providing early access to information that counts, and making classification errors explicit. The study also revealed that in the context of multiple assessments, the assumption of an error-free statewide assessment was invariably rejected in favor of a model assuming that all tests included measurement error. This is not a surprising finding. It would be hard to find someone who would claim that a statewide test, or any other test, was error free. Nonetheless, it is a finding that has significant consequences for the design of assessment systems aimed at measuring the mastery of standards because it reveals an inconsistency between current practice in accountability initiatives and what can be justified on the basis of empirical evidence. The history of science is filled with examples of discontinuity between social policy and empirical findings. What we learn from these examples is that empirical evidence is likely to foster policy change. That is what may be expected in this case. We have demonstrated one approach that change might take. Many others are possible. The rules governing the determination of AYP are established by the federal government. Individual states also have rules that govern the evaluation of school performance. Individual states might explore various ways to use multiple assessments in evaluating performance. Findings at the state level might subsequently inform policy decisions at the federal level. The hope and the expectation is that whatever path change may take, it will lead to that elusive goal that we call progress. As indicated at the beginning of this article, standards-based initiatives provide a new and promising approach to the attainment of valued and measurable educational goals. It is our view that standards-based initiatives will be strengthened by adopting multi-test strategies that take into account the measurement error associated with statewide tests.
Standards Mastery Determined by 1.800.367.4762 Benchmark and Statewide Test Performance ati-online.com Assessment Technology, Incorporated © Assessment Technology, Incorporated 2005
20
VII. References Bergan, J.R., & Bergan, J.R. (2004). Forecasting statewide test performance and adequate
yearly progress from district assessments. Tucson, AZ: Assessment Technology Inc. Clogg, C.C., & Eliason, S.R. (1987). Unrestricted and restricted maximum likelihood latent
structure analysis: A manual for users (Working Paper 1977-09). University Park, PA: Population Issues Research Office.
Debra P. v. Turlington, 474 F. Supp. 244 (M.D. Fla. 1979); aff’d in part and rev’d in part, 644
F.2d 397 (5th Cir. 1981); rem’d, 564 F. Supp. 177 (M.D. Fla. 1983); aff’d, 730 F.2d 1405 (11th Cir. 1984).
Goodman, L.A. (1974a). The analysis of systems of quantitative variables when some of the
variables are unobservable: Part I, A modified latent structure approach. American Journal of Sociology, 79, 179-259.
Goodman, L.A. (1974b). Exploratory latent structure analysis using both identifiable and
unidentifiable models. Biometrika, 61, 215-231. Lazarsfeld, P.F., & Henry, N.W. (1968). Latent structure analysis. Boston: Houghton-Mifflin. National Research Council (1999). High Stakes: Testing for Tracking, Promotion and
Graduation. Washington, D.C.: National Academy Press. Thissen, D. & Wainer, H. (Eds.). (2001). Test scoring. Mahwah, N.J.: Lawrence Erlbaum
Associates.