stargazing: the effect of superstar ceos on competitors
TRANSCRIPT

1
Stargazing: The Effect of Superstar CEOs on Competitors’ Behavior
Anna Bergman Brown
School of Business
University of Connecticut
Viktoriya Zotova
R.H. Smith School of Business
University of Maryland
Emanuel Zur
R.H. Smith School of Business
University of Maryland
February 2018

2
Stargazing: The Effect of Superstar CEOs on Competitors’ Behavior
Abstract
U.S. corporate CEOs are rewarded by the media through a superstar system, whereby few CEOs
reap the majority of media awards and attention. Prior literature documents that the corporate
superstar system has a negative impact on the shareholders of superstar CEO firms, as superstar
CEOs tend to shift their focus toward lucrative personal interests after winning awards. This
study examines the effects of the corporate superstar system on competitors of superstar CEOs.
Consistent with social psychology’s upward social comparison theory, we document that
competing CEOs exhibit a more optimistic tone in conference calls and are more likely to
overinvest after superstar CEOs win awards. In addition, after superstar CEOs win awards,
competing CEOs engage in behaviors likely to attract media attention and/or temporarily boost
stock prices, to the detriment of long-term shareholder value. The results are strongest for CEOs
who share the most connections with superstar CEOs, and are weakest for firms with strong
corporate governance. Our findings provide new evidence of the costs to shareholders of a
competitive media-driven system of rewarding CEOs.

1
1. Introduction
Social comparison theory proposes that people tend to compare themselves to peers who
slightly outperform them. When comparing themselves to higher-performing peers (“upward
comparison”), people often group themselves in the same category as the higher-performing peer;
therefore considering themselves to be “almost as good” as the higher performer (Wheeler 1966).
In this way, upward comparison frequently results in improved self-evaluations, as people believe
themselves to be close to reaching the same level of achievement as the higher-performing peer
(Collins 1996). Further, upward comparison often induces competitive behavior, where people
strive to reach the same level of achievements as the higher-performing peer. Looking at how
CEOs react to competing CEOs receiving prestigious media-driven awards, we test these two
components of social comparison theory. Our empirical evidence suggests that CEOs react to
competing CEOs achieving superstar status by becoming more overconfident about their
performance as well as their firm’s performance and taking actions that likely harm shareholder
value.
First, we test whether CEOs react to competing CEOs achieving superstar status by
becoming more overconfident about their firm’s performance, consistent with upward comparison
leading to improved self-evaluation.1 We measure overconfidence using a proxy for managerial
optimism captured by the language tone in disclosures: a growing stream of literature finds that
managers’ optimistic language in firm disclosures is used to subtly convey value-relevant
information about future firm performance (Demers and Vega 2011; Davis et al. 2012; Price et al.
1 We use the term overconfidence to refer to a cognitive bias that leads to unrealistic positive beliefs about the
distribution of an uncertain outcome. We use the term optimism to refer to the degree of positive versus negative
language used in firm disclosures. Finance and accounting literature frequently uses the term overconfidence
interchangeably with optimism or optimistic bias (Ben-David et al. 2007; Schrand and Zechman 2012; Ahmed and
Duellman 2013; Davis et al. 2015).

2
2012; Demers and Vega 2014; Davis et al. 2015; Baginski et al. 2016). If CEOs react to competitor
CEOs achieving superstar status by becoming more overconfident about their firm’s performance
(because they are more optimistic about their own chances of winning an award), their disclosures
will be more optimistic after competitor CEOs win prestigious awards that elevate them to
superstar status. Further, we test for changes in CEO overconfidence using changes in the level of
industry-adjusted excess investment: overconfident CEOs tend to overinvest on average, because
they overestimate the cash flows and underestimate the risks associated with projects (Ben-David
et al. 2007; Schrand and Zechman 2012). If CEOs are more confident about their chances of
winning an award after competitor CEOs win awards, they will likely be overly confident about
the potential positive payoffs associated with investments.
We follow prior literature to construct a sample of shocks to CEOs’ status through a major
media award in order to proxy for the date that superstar CEOs “achieve” superstar status
(Malmendier and Tate 2009; Ammann et al. 2016). We examine changes in CEO tone in
conference calls for competitor vs. control firms (Bushee et al. 2011; Price et al. 2012; Brochet et
al. 2016; Levy et al. 2017) in a difference-in-differences analysis (hereafter, DID) using a sample
of the competitors of the superstar CEO firms and propensity score matched non-competitor
control firms, for the periods before and after superstar CEOs achieve superstar status (hereafter,
the “pre-award” and “post-award” periods).2 In a sample of conference call data for the four
quarters pre-award and post-award, we document that competitor CEOs employ a more optimistic
tone in conferences calls (measured using the number of optimistic vs. pessimistic words, as well
as the total number of words) compared to the changes for control firms over the same period. We
2 We propensity score match competitor CEO firms to non-competitor control firms based on the likelihood of
winning an award, which should control for the possibility that results are driven based on the likelihood of winning
an award, and not being a competitor of a superstar CEO (Ammann et al. 2016).

3
further show that competitor CEOs have a higher level of overinvestment post-award (measured
using industry-adjusted excess investments one year pre-award and post-award) compared to the
changes for control firms over the same period. The results are consistent with competitor CEOs
reacting to superstar CEOs winning awards with an improved self-evaluation and greater
confidence about their own chances of winning an award.
Next, we examine whether CEOs react competitively to peer CEOs achieving superstar
status by striving to win an award for themselves, and whether this competitive behavior is
beneficial or harmful to shareholder value. When CEOs achieve superstar status through
prestigious media awards, competitor CEOs may view themselves as being “almost as good” as
the superstar CEO and, therefore, close to winning an award. The competitor CEOs may therefore
try to achieve the same level of accomplishments and recognition as the superstar CEO through
competitive behaviors that are likely to improve their chances of winning an award.
Using a DID approach comparing competitor to control firms, pre- versus post-award, we
examine several mechanisms through which CEOs may increase their chances of winning an
award. Malmendier and Tate (2009) document that the stock returns in the 36 months leading up
to the award date are one of the primary predictors of winning an award; therefore, competitor
CEOs may engage in activities that are likely to increase firm stock returns, thus improving their
chances of winning an award. First, we examine changes in accounting choices, including changes
in accounting conservatism – measured using the firm-year conservatism measure from Khan and
Watts (2009) – and positive and negative disclosures – measured using the issuance of positive or
negative earnings guidance (i.e., earnings guidance or warning), following Levy et al. (2017).
Decreasing accounting conservatism and negative disclosures, and increasing positive disclosures
all likely provide a temporary boost in a firm’s stock price; however, manipulating the timing of

4
accounting recognition and disclosures to boost stock price is likely harmful to shareholder value
(Jin and Myers 2006; Chen et al. 2009).
Next, we examine changes in M&A activity and test whether CEOs engage in more
frequent and/or larger M&A transactions: successful M&A are likely to attract media attention,
enhance CEO social recognition, and increase long-term stock returns, and would therefore likely
increase a CEO’s chance of winning a media award. For this reason, overconfident CEOs may
engage in more/larger M&A because they are overconfident about the likelihood that investments
in M&A will yield positive payoffs and attract media attention. We further examine the quality of
M&A deals post-award versus pre-award to test whether CEOs are engaging in M&A that build
value for shareholders or are value-destroying: analyzing the change in the quality of M&A deals
post-award versus pre-award allows us to directly test the effect of competitor CEO activities on
shareholder value.
We document that both accounting conservatism and negative disclosures decrease at
competitor firms post-award, while positive disclosures increase, compared to the change for
control firms over the same period. Collectively, these results are consistent with competitor CEO
firms engaging in manipulation of accounting recognition and disclosures that may temporarily
boost stock price, but will likely harm long-term shareholder value. Next, we document that
competitor CEO firms increase both the number and size of M&A deals post-award and pay a
higher premium for targets: this behavior is consistent with competitor CEOs being overconfident
about the likelihood that an M&A deal will be successful, and therefore lead to positive returns,
improved social recognition, and media attention. However, we find that M&A deals for
competitor firms have lower abnormal returns around the M&A announcement date in the post-
award period, compared to control firms. This suggests that while competitor CEOs are trying to

5
improve their chances of winning an award by engaging in more frequent and visible M&A, the
M&A are relatively more value-destroying for shareholders.
The next set of tests examine whether our results on CEO behaviors are mitigated by strong
corporate governance. We expect that firms with strong corporate governance may reign in CEOs’
value-destroying activities in the interest of shareholder value. Consistent with this prediction, we
find that in the post-award period, competitor CEO firms with weak (strong) corporate governance:
decrease accounting conservatism more (less), are less (more) likely to disclose bad news and more
(less) likely to disclose good news, complete more (fewer) M&A deals and of a larger (smaller)
amount, pay higher (lower) deal premiums, and have lower (higher) M&A announcement returns.3
In robustness tests, we examine the effects of upward comparison on competitor CEO
behavior using several additional cross-sectional analyses. First, we test whether our results are
strongest for CEOs who perceive themselves to be similar to the superstar CEO. Collins (1996)
argues that a person’s perceived similarity with a higher-achieving peer makes them more likely
to believe that they are in the “same group” as the higher achiever because they minimize the
significance of the differences in achievement between themselves and the higher achiever.4
Therefore, competitor CEOs who perceive themselves to be more similar to the superstar CEO
may be especially overconfident and competitive about their chances of winning an award. We
document that our results are strongest for firms where the CEOs have more connections with the
superstar CEO (measured using shared board seats), as well as firms that are closer competitors to
the superstar CEO firms (defined using the Hoberg and Phillips (2010, 2016) measure), consistent
3 We find no significant differences in CEO tone or overinvestments across firms with weak versus strong corporate
governance. This suggests that, on average, competitor CEOs are more overconfident about their chances of winning
an award after superstar CEOs win awards; however, our results show that competitor CEOs from firms with weak
corporate governance are more likely to engage in value-destroying activities to boost firm stock price. 4 In experiments, psychologists manipulate the condition of perceived similarity in a variety of ways, for example,
by telling subjects that they share a common birthday (Brown, Novick, Lord, and Richards 1992) or a common
group membership (Brewer and Weber 1994) with the higher achiever.

6
with these CEOs perceiving themselves to be more similar to the superstar, and, therefore, closer
to winning an award. We further document that our results are strongest for competitor CEOs who
are more likely to win an award, using the propensity score from a logit model predicting award
winners (Malmendier and Tate 2009). Overall these results provide additional evidence that our
findings are likely to be driven by changes in CEO behavior attributable to upward comparison.
Finally, we perform a falsification test examining changes in CFO tone and total words
used in conference calls at competitor versus control firms. This test allows us to isolate optimism
related to actual firm fundamentals – which should affect both CEO and CFO tone – from optimism
attributable to superstar awards – which should only affect CEO tone (Li et al. 2014). We find that
our results on tone and total words do not hold using changes in CFO tone, consistent with our
results being driven by changes in CEO optimism due to superstar awards, and not changes in firm
fundamentals.
Our results make several important contributions to the literature. First, we contribute to
the recent literature on superstar CEOs and their competitors. While the CEO is meant to serve
shareholders’ best interests, the superstar system is largely media-driven, and therefore
independent of shareholders. It is therefore important to note that this media-driven system could
negatively impact not only shareholders of firms for the few CEOs winning prestigious awards
(Malmendier and Tate 2009), but also, more broadly, the shareholders of their competitors. Next,
our results complement prior studies on the effects of the superstar system on competitor CEOs
(Ammann et al. 2016; Shi et al. 2017). Ammann et al. (2016) document positive long-term
abnormal stock returns (over one to three years) at competitor CEO firms when superstars win
awards, driven by competitor firms with strong corporate governance. The authors conclude that
the superstar system is in fact beneficial to shareholders, because it induces competitive behavior

7
at peer firms. Our empirical findings as a whole do not contradict the findings in Ammann et al.
(2016): our results for competitor CEO activities are strongest for firms with weak corporate
governance, a setting where Ammann et al. (2016) do not find results. However, our study suggests
that the corporate superstar system can have a negative effect on shareholders of competitor CEO
firms, as competitor CEO firms, on average, engage in value-destroying activities in the post-
award period.
Further, our results provide empirical support for upward social comparison theory in the
setting of superstar CEOs and their competitors; we provide evidence consistent with CEOs
comparing themselves to higher-achieving peers and behaving competitively in order to try to
reach the same level of achievements. Finally, our results contribute to the literature on peer
networks: our results suggest that peer CEOs with more connections compete more with one
another.
The remainder of the paper is organized as follows. Section 2 discusses prior literature and
motivates our hypotheses. Section 3 describes our measures of overconfidence and stock price-
boosting activities and section 4 presents our sample selection and research design. Section 5
discusses descriptive statistics and empirical results, section 6 presents additional and robustness
analyses, and section 7 concludes.
2. Prior Literature and Hypothesis Development
2.1 Superstar CEOs
The superstar CEO system refers to a media-driven practice of rewarding few CEOs with
prestigious awards and attention, and turning these few CEOs into “superstars” or celebrities of

8
the media world (Malmendier and Tate 2009).5 For example, in 2003, Amazon’s Jeff Bezos was
named the “Best Performing CEO of the Year” by Forbes magazine. This was the first of multiple
media awards for Bezos, and therefore, 2003 arguably marks the year that Bezos was catapulted
to media celebrity status. Similarly, Apple’s Tim Cook won his first major media award in 2011 –
the year he took over the position of CEO from Steve Jobs – being named on Fortune’s list of
“Businessperson of the Year.” The first time a CEO receives a major media award is a significant
media event for this CEO, and often marks the beginning of an elevated level of media-driven
attention, interviews, and further awards.
Malmendier and Tate (2009) examine the media-driven superstar CEO phenomenon, and
document that the most significant determinants of “becoming a superstar,” that is, winning the
first major media award, are firm size and stock returns in the 36 months leading up to the award
date. Next, Malmendier and Tate (2009) find evidence that superstar CEO firms underperform
after the award date: stock returns and ROA are lower in the three years following the award,
compared to a matched sample of predicted award winners. Despite this underperformance, there
is an increase in both cash- and equity-based compensation for superstar CEOs after the award
date, compared to a matched sample. In addition, after winning prominent awards, superstar CEOs
write more books, join more external boards, and improve their golf handicaps, consistent with
more time spent on lucrative and leisure activities. Therefore, although the media tends to reward
CEOs for their strong performance prior to the award, the corporate superstar system is associated
with negative effects for shareholders of superstar firms.
A number of related studies examine further consequences of the corporate superstar
system. Carlin et al. (2010, 2010a) propose a model in which greater competition for attention and
5 The superstar system in general was first defined by Rosen (1981) as a system in which few players reap the
majority of income, market share, and/or public attention.
9
prizes makes discretionary disclosures less likely. One implication of this model is that a superstar
system, in which competition is high and few CEOs win awards, should have the effect of reducing
voluntary disclosures among award competitors. Kubick and Lockhart (2017) document that
superstar CEOs exhibit greater tax aggressiveness after winning prominent awards. Next, in
contrast to Malmendier and Tate (2009), two studies provide evidence that superstar CEO firms in
fact improve their performance after winning an award: Koh (2011) finds that superstar CEOs
become more conservative and are less likely to manage earnings after winning an award, while
Shemesh (2017) finds that superstar CEO firms reduce idiosyncratic volatility, reduce R&D
spending, and increase investments in fixes assets after the award.
In a related study examining the effect of superstar CEOs’ award winning on competing
CEOs, Ammann et al. (2016) document positive long-term abnormal stock returns for competing
firms (over one to three years) when superstars win awards; the results are driven by firms with
strong corporate governance. The authors conclude that competing CEOs have incentives to
perform better when superstars win prominent awards, which has a positive effect on shareholders
of competing firms. In a final set of analyses, the authors also find that in the three years following
the awards, competing firms have a higher standard deviation of returns, higher ROA and markup
on sales, and issue more patents.
Finally, Shi et al. (2017) also examine competitors of superstar CEOs, and find that
competitors increase the number and size of M&A transactions after the superstar wins an award.
In addition, the authors find that post-award acquisitions by competitors are associated with poorer
announcement returns and lower ROA after the acquisitions are completed. The authors conclude
that competing CEOs seek to achieve social recognition and status and/or visibility, similar to the
superstar CEOs.

10
2.2 Social Comparison Theory and Competitor CEOs
Social comparison theory originates from social psychology research on how people
compare their own performance with that of their peers. Upward comparison theory argues that
people tend to compare their own performance with that of a peer who slightly outperforms them,
and that such a comparison motivates people to perform better in order to assimilate to the higher-
performing peer (Wheeler 1966). Further, upward comparison often leads to an enhanced self-
image, as people tend to minimize the significance of the differences in achievement between
themselves and the higher-performing peer. An example using academics is illustrated by Collins
(1996), who asks the reader to imagine a researcher with a vita with 10 publications comparing
herself to a peer with a vita with 12 publications (holding constant the quality of the publications).
The researcher with 10 publications likely minimizes the significance of these two additional
publications and places herself in the same category as the higher-achieving peer. The researcher’s
self-assessment is therefore enhanced because through this comparison she has changed her self-
evaluation from someone with a vita with 10 publications, to someone in a group of people with
vitas with “10 or 12” publications.
Applied to the setting of superstar CEOs, upward social comparison theory predicts that
CEOs likely benchmark themselves against higher-performing peer CEOs. When superstar CEOs
win prestigious media awards, it is therefore likely that CEOs of competing firms may perceive
themselves to be “almost as good” as the superstar CEOs, and therefore, closer to winning an
award for themselves. In this way, competing CEOs will likely be overconfident about their own
firm’s performance, due to their improved self-evaluation. We therefore state our first hypothesis
as follows:

11
H1: Competitor CEOs experience an increase in overconfidence when superstar CEOs
receive prestigious media awards.
In addition, social comparison theory predicts that people react to upward comparison
through competitive behavior: because they perceive the accomplishments of the higher-achieving
peer as more accessible, or easier to achieve, people strive to reach the same level of
accomplishments by behaving competitively and/or assimilating to the higher-achieving peer’s
behavior (Wheeler 1966; Collins 1996).6 Following this theory, competitor CEOs likely react to
superstar CEOs achieving prestigious awards by trying to win an award for themselves through
competitive or assimilation behavior. Malmendier and Tate (2009) document that one of the
strongest predictors of winning an award are the stock returns in the 36 months leading up to the
award date. In addition, chances of winning an award should be higher when CEOs are engaging
in activities that enhance their social recognition, increase their firm’s visibility and attract media
attention. We therefore predict that competitor CEOs react to superstar CEOs achieving prestigious
awards by engaging in activities that are likely to boost stock prices and/or attract media attention.
We state our second hypothesis as follows:
H2: Competitor CEOs engage in activities that are likely to boost stock prices or attract
media attention when superstar CEOs receive prestigious media awards.
3. Measures of Overconfidence and Competitive Activities
3.1 Measures of Overconfidence
6 We use the term competitive behavior to refer to a person striving to reach the same level of accomplishments as a
higher-achieving peer. The term assimilation refers to directly emulating the higher achieving peer’s behavior, or, in
other words, doing what the higher achiever did to reach their level of accomplishments.

12
In order to measure CEO overconfidence, we use a measure of managerial optimism
captured by the language tone of disclosures, as well as a measure of industry-adjusted excess
investment. First, we measure managerial optimism as captured by the relative optimism of
language tone in quarterly earnings conference calls. Specifically, we use textual analysis to
calculate CEO_PosTone as the sum of optimistic words less the sum of pessimistic words spoken
by the CEO in the presentation section of each conference call, scaled by the total words spoken
by the CEO, following Loughran and McDonald (2011). Higher levels of CEO_PostTone therefore
reflect CEOs using relatively more optimistic versus pessimistic words during conference calls.
We also measure CEO_Words as the total number of words spoken by the CEO during the
presentation section of the conferences call, where using more words in total reflects a more
optimistic bias (DePaulo et al. 2003; Larcker and Zakolyukina 2012). Prior literature finds that
CEO optimism as measured by language tone reflects higher current and future performance, and
that the market reacts positively to optimistic tone (Davis et al. 2012; Price et al 2012; Demers and
Vega 2014). However, Davis et al. (2015) also find that optimistic tone is driven by a manager-
specific tendency to be optimistic versus pessimistic, consistent with tone optimism capturing a
managerial cognitive bias that reflects unrealistic positive beliefs about the distribution of an
uncertain outcome. If competitor CEOs are more overconfident about their firms’ performance
after superstars win awards, their overconfidence may be reflected in a more optimistic tone in
conference calls.
Next, we measure CEO overconfidence in investments using industry-adjusted excess
investments. Specifically, Over_Invest is an indicator variable equal to 1 if the residual of the
industry-year regression of total asset growth on sales growth is greater than zero, and 0 otherwise,
following Ahmed and Dullman (2013). Overconfident CEOs tend to overinvest, on average,

13
because they overestimate the positive cash flows and underestimate the risks associated with
investment projects (Ben-David et al. 2007; Schrand and Zechman 2012). If CEOs are more
overconfident about their firm’s performance after superstars win awards, we therefore predict that
they will be overly confident about the potential positive payoffs associated with investments.
3.2 Measures of Competitive Activities and the Effects on Shareholder Value
Our second hypothesis predicts that competitor CEOs will engage in competitive behavior
in order in increase their chances of winning an award after superstar CEOs win prominent awards.
These competitive activities may be activities likely to boost stock prices, enhance their social
recognition, increase their firm’s visibility and attract media attention. We first choose several
mechanisms through which CEOs may boost stock prices. First, we examine accounting
conservatism: C_Score is the firm-year measure of financial reporting conservatism estimated
following the model from Khan and Watts (2009). A higher value of C_Score reflects more
conservative financial reporting, defined as more timely recognition of losses versus gains.
Overconfident CEOs tend to report less conservatively, on average, because they are overconfident
about future returns, and therefore justify delaying loss recognition (or recognizing gains sooner)
on the basis that future returns will likely be higher (Ahmed and Duellman 2013). In addition,
decreasing accounting conservatism provides a temporary boost to stock prices, but likely harms
long-term shareholder value (Jin and Myers 2006; Chen et al. 2009). We therefore predict that if
competitor CEOs are more overconfident about their firm’s performance, they may report losses
on a less timely basis, therefore reporting less conservatively, on average, which should have a
negative effect on shareholder value.
Following this same argument, we use analysts’ forecasts and firms’ interim guidance to
measure positive and negative disclosures and predict that competitor CEOs will increase positive

14
disclosures and decrease negative disclosures if they are more overconfident after superstars win
prominent awards. We calculate Pos_Disclos (Neg_Disclos) for a subset of firms for which actual
earnings per share for period t exceeds (falls short of) analysts’ forecasts for period t that was
issued immediately after earnings announcement of period t-1. Next, we create an indicator
variable Pos_Disclos (Neg_Disclos) equal to 1 if the firm issues earnings guidance (warning) for
period t in the middle of period t, but before the earnings announcement of period t (and 0
otherwise). Pos_Disclos (Neg_Disclos) therefore captures cases where managers guide earnings
up (down) given a potential positive (negative) earnings surprise. Increasing positive disclosures
and decreasing negative disclosures likely provides a temporary boost to stock prices, but may
harm long-term shareholder value.
Finally, we measure M&A activity as a potential mechanism through which competitor
CEOs may seek to increase their chances of winning an award by attracting media attention and
enhancing CEO social recognition. First, contingent on H1, competitor CEOs are more likely to
be overly confident about the potential positive payoffs (and underestimate the potential risks)
associated with M&A investments. That is, if competitor CEOs are more overconfident post-
award, they will likely be overly confident about the potential success of M&A deals, and therefore
more likely to engage in M&A as an investment that will make their firm larger, and may boost
stock price. In addition, M&A deals likely lead to media attention and recognition; it is therefore
plausible that competitor CEOs engage in more and larger M&A deals as a means to attract media
attention and increase their chances of winning an award (Shi et al. 2017). We employ three
measures of the frequency and size of M&A deals: (1) Deal_Number measures the total number
of acquisitions of at least 50% of the target’s shares that were announced and completed; (2)
Deal_Value captures the total value (in $ Millions) of all acquisitions of at least 50% of the target’s

15
shares that were announced and completed; and (3) Deal_Prem measures the total value of all
premiums paid for acquisitions of at least 50% of the target’s shares that were announced and
completed, where the premium is calculated as the deal value, less the product of the target firm’s
equity value 42 days before the announcement and the % of the stock bought in the deal.
Last, we measure market-adjusted announcement returns in order to assess the effect of
M&A activity on shareholder value. If competitor CEOs are overconfident about the likely success
of M&A deals, and increase M&A activity in the post-award period, it may be that these deals are
relatively more value-destroying for shareholders, which would typically be reflected by lower
deal announcement returns. Ann_Returns measures the acquirer’s cumulative market adjusted
return over the three-day period (-1, +1), where day 0 is the merger announcement date.
4. Sample Selection and Research Design
4.1 Sample Selection
The sample originates from a list of 539 CEOs who won national media awards published
between 1996 to 2014.7 Business Week and Financial World are the two main publications that
granted awards to CEOs during the sample period. Other publications include Forbes, Chief
Executive, Harvard Business Review, Morningstar, Fortune, and Industry Week. Since some CEOs
receive multiple awards over multiple years, we only consider a superstar CEO’s first award – the
first award date therefore proxies for the date that the superstar is first elevated to celebrity status.
We also restrict our analysis to CEOs in the BoardEx universe. A total of 363 superstar CEOs are
included in our final sample of superstar CEOs.
7 We limit our sample to 1996-2013 because the Hoberg and Gordon (2016) database only covers the period
between 1996 and 2013.

16
Next, to identify the competitor CEOs for each superstar CEO, we use the Hoberg-Phillips
Text-based Network Industry Classification (TNIC-3), which builds on firms’ business and
product descriptions in 10-K annual filings, instead of the three-digit SIC grouping, to provide a
firm-by-firm similarity measure. The level of competitiveness between two firms is measured by
the relative number of words in common in the product description sections in the 10-k. A detailed
explanation of the TNIC-3 data can be found in Hoberg and Phillips (2010, 2016). We follow
Hoberg and Phillips (2016) and use a 21.32% threshold to define competitors. This procedure
yields a sample of the 1,857 competitors of the superstar CEO firms, or approximately five
competitors per superstar CEO (ranging from one to nine competitors). Finally, we construct a
sample of matched control firms using the propensity score from a logit model predicting award
winners (Malmendier and Tate 2009). For each of the 1,857 competitors of the superstar CEO
firms we choose, without replacement, another CEO who is not a direct competitor to the superstar
CEO, and has the propensity score closest to the score of the competitor CEO.
4.2 Research Design
Our empirical analyses are designed to test whether competitor CEOs react to superstar
CEOs winning awards with an improved self-evaluation and greater confidence about their own
chances of winning an award. To that end, we employ a DID approach comparing competitor CEO
firms to control firms, before and after the superstar CEO wins an award. We define the treatment
group as the sample of competitor CEO firms and the control group as the sample of matched
control firms. We expect CEOs in our treatment group to be influenced by the superstar CEO’s
win of a prestigious media award, and therefore experience an increase in overconfidence about
their firms’ performance in the year following the award. However, we do not expect the media
award to affect the CEOs and firms in the control group, as these CEOs are not direct competitors

17
of the superstar firms, and therefore are less likely to benchmark themselves against the superstar
CEOs. The basic regression we use in the analyses is as follows:
DEP_VARi,t = β0 + β1Posti,t + β2Competitori,t + β3Posti,t × Competitori,t
+ βControlsi,t + γt+λi+εi,t, (1)
where DEP_VAR is the dependent variable in each analysis. The dependent variables, which we
describe in detail in section 3, pertain to the measures of overconfidence and competitor firm
activities that we focus on in this study: the speech tone of the CEO (CEOPos_Tone and
CEO_Words), excess investments decision (Over_Invest), firms’ financial reporting conservatism
(C_Score), the provision of early disclosure of negative and positive news (Pos_Disclos and
Neg_Disclos), and merger and acquisition transactions (Deal_Number, Deal_Value, Deal_Prem,
and Ann_Returns).
Post is an indicator variable equal to one for the fiscal year(s) after the superstar CEO wins
a media award and zero otherwise. Competitor is an indicator variable equal to one for treatment
firms and zero for control firms. Post × Competitor is the variable of interest, an interaction
between the above-described variables. The interaction term Post x Competitor allows us to test
the difference in the change in the dependent variable across treatment and control samples. We
use the interaction of these variables throughout our analyses as the main explanatory variable.
We include the following variables to control for other firm characteristics that could
potentially affect CEO behavior and accounting and financial decisions: Log_MV, MTB, ROA,
Earnings_Growth, and Sales_Growth. In our tests using an M&A setting, we also control for the
following deal characteristics: RelativeSize, TargetPublic, TenderOffer, StockPercentage, and
Toehold (see Appendix A for variable definition).

18
Our analyses also include year and firm fixed effects. We chose to include firm fixed effects
to better gauge within-firm changes. Including firm and year fixed effects, however, renders
interpretation of the main effect in the analyses (Post and Competitor) meaningless. Therefore, we
ignore the main effects when reporting results. Finally, we calculate standard errors clustered by
firm and superstar CEO award.
5. Descriptive Statistics and Empirical Results
5.1 Descriptive Statistics
Table 1, Panel A, presents the descriptive statistics (mean, median and standard deviation)
for the dependent and independent variables for the full sample. The final sample consists of 1,857
competitors of the superstar CEO firms and a matched control sample of 1,857 non-competitor
control firms. To minimize the impact of outliers, we winsorize all variables at the 1st and 99th
percentile values.
We first examine the CEO overconfidence characteristics. As displayed in Panel A, a CEO
speaks an average of 1,497 words during conference calls (CEO_Words), and the CEO’s tone
during the conference call (CEO_PosTone) is slightly more positive than negative with
approximately 1.5 percent more positive words used by the CEO during the conference call than
negative ones. We also find that approximately 41 percent of the firms in our sample overinvest,
comparable to Schrand and Zechman (2012) and Ahmed and Dullman (2013). Next, we present
the disclosure characteristics of our sample. C_Score, Pos_Disclos and Neg_Disclos – measures
of conservatism and early disclosure of good and bad news – have mean values of 0.121, 0.158,
and 0.207, respectively; the values are comparable to Levy et al. (2017). We also describe the
acquisition activity in the one year before and after the competitor CEOs win prestigious awards

19
that elevate them to superstar status. Deal_Number is the total number of majority-ownership
acquisitions in a year announced in our sample and which will subsequently be completed, and
range from zero for firms that did not engage in any acquisition in the year to three deals at the
maximum. The firms in our sample announced an average of 0.415 majority-ownership
acquisitions in a year (and total of 3,083 deals during the period sample). The average total value
of these acquisition in a year is approximately 20 million dollars. The average total premium paid
by the firms in our sample each year for the acquisitions (Deal_Prem) is 13.5 percent. The acquirer
cumulative market-adjusted return over the three days spanning the deal announcement
(Ann_Returns) for the sample of 3,083 acquisitions is -2.24 percent, on average. Finally, Panel A
also provides the descriptive statistics for all the different control variables for our sample.
Table 1, Panel B, reports correlation coefficients between our variable pairs. The
correlation analyses demonstrate that most of the correlations are less than 0.5, which is
considerably less than the 0.8 threshold that would suggest multicollinearity (Gujarati 2003).
5.2 Empirical Results
Table 2 presents our tests of H1, the effect of superstars winning prestigious awards on the
overconfidence/optimism of competitor CEOs. Columns (1), (2), and (3) present regressions where
the dependent variables are CEO_PosTone, CEO_Words, and Over_Invest, respectively. The
independent variable of interest is the interaction term Competitor x Post, which indicates the
effect of the change in the dependent variable for competitors from the pre- to post-award periods,
compared to the change for control firms over the same period.8 In each of columns (1) through
(3), the coefficient on Competitor x Post is positive and significant: competitor CEOs employ a
more positive tone, use more words, and are more likely to overinvest in the post-award period,
8 Because our regressions include year and firm fixed effects, the coefficients on the standalone terms Post and
Competitor simply absorb the omitted year/firm term, and therefore cannot be interpreted meaningfully.

20
compared to the change for control firms over the same period. We also estimate the economic
significance of the interaction term Competitor x Post coefficients. We find that competitor CEOs
increase the positive tone in the post period by 0.3 percent, which is approximately one-third of
one standard deviation, and increase by an average of six percent of the number of words spoken
in the post period. Moreover, we show that competitor CEOs in the post period, on average, are
associated with a 5.5 percentage increase in over investment, representing a 13.3 percent increase
in the respective unconditional mean of Over_Invest. We therefore provide evidence supporting
H1, that competitor CEOs are more overconfident about their firms’ performance after superstars
win prominent awards.
Tables 3 and 4 presents our tests of H2, the effect of superstars winning prestigious awards
on competitor CEO behavior. Columns (1), (2), and (3) of Table 3 present regressions where the
dependent variables are C_Score, Pos_Disclos, and Neg_Disclos, respectively. The independent
variable of interest in each regression is the interaction term Competitor x Post. In column (1), the
coefficient on Competitor x Post is negative (-0.058) and significant (t-stat of -3.81): competitor
CEO firms therefore report less conservatively in the post-award period, compared to the change
for control firms. In column (2) (column (3)), the coefficient on Competitor x Post is positive
(negative) and significant, consistent with competitor CEOs providing more positive and less
negative disclosures in the post-award period, compared to the change for control firms. We find
the competitor CEOs in the post period are associated with a 4.7 (7.3) percentage increase
(decrease) in positive (negative) disclosure, representing a 29 (35) percent increase (decrease) on
the respective unconditional mean Pos_Disclos (Neg_Disclos). Overall, the results in Table 3 are
consistent with competitor CEOs manipulating the timing of accounting recognition and

21
disclosures in a way that may boost the firm’s stock price in the post-award period, an activity
which is likely harmful to shareholder value (Jin and Myers 2006; Chen et al. 2009).
Table 4 presents our tests of mergers and acquisitions activity, where the dependent
variables in columns (1), (2), (3), and (4), are Deal_Number, Deal_Value, Deal_Premium, and
Ann_Returns, respectively. The first three columns test whether competitor CEOs engage in more
and larger M&A deals in the post-award period. The coefficients on Competitor x Post in columns
(1) through (3) are positive and significant: competitor CEOs engage in more M&A deals, larger
deals, and pay a larger premium in the post-award period. These results are consistent with
competitor CEOs being overconfident about the probability that the M&A deals will be successful
and attract positive media attention. However, in column (4), the coefficient on Competitor x Post
is negative and significant: competitor CEO firms’ M&A deals have lower abnormal
announcement returns in the post-award period, consistent with these deals being relatively more
value-destroying for shareholders. Overall, the results in Table 4 are consistent with competitor
CEOs engaging in more M&A activity in the post-award period; however, shareholders perceive
these deals to be relatively more value-destroying.
In Table 5, we test whether our results for H2 are mitigated by firms with strong corporate
governance. Tables 3 and 4 provide evidence consistent with competitor CEOs engaging in
activities in the post-award period that overconfident CEOs believe are likely to increase the
chances of winning an award; however, these activities come at the expense of long-term
shareholder value. We therefore predict that competitor CEO firms with weak corporate
governance will be relatively more likely to engage in such activities, while competitor CEO firms
with strong corporate governance will be more likely to reign in the CEOs’ value-destroying
activities. For these and all subsequent tests, we omit control firms, and instead examine cross-

22
sectional results for competitor firms only. First, in Panel A of Table 5, we compare accounting
choices for competitor firms with weaker corporate governance (HighG-Index=1) compared to
competitor firms with stronger corporate governance (HighG-Index=0). The coefficient on
HighG-Index x Post is negative in column (1): competitor CEO firms with weaker corporate
governance therefore decrease accounting conservatism more than firms with stronger corporate
governance, although the results are only marginally significant. The coefficient on the interaction
term is insignificant in column (2), but in column (3) it is negative and significant, consistent with
competitor CEO firms with weaker corporate governance decreasing negative disclosures more
than those with stronger corporate governance in the post-award period.
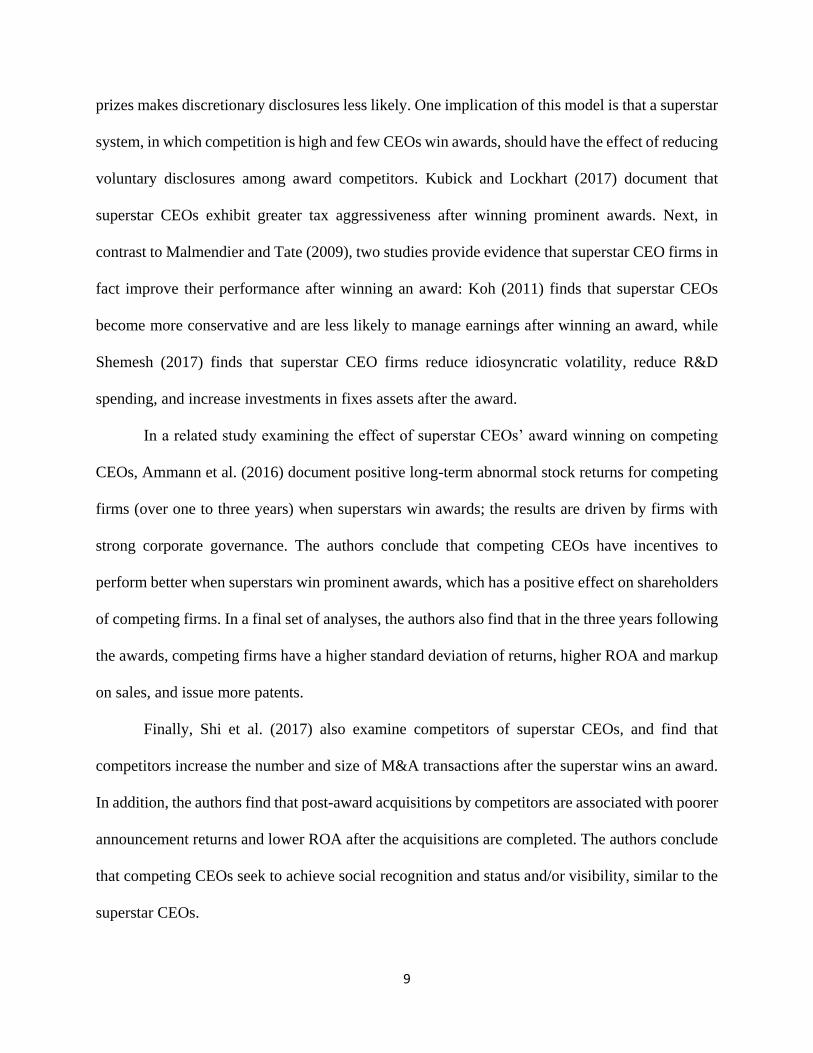
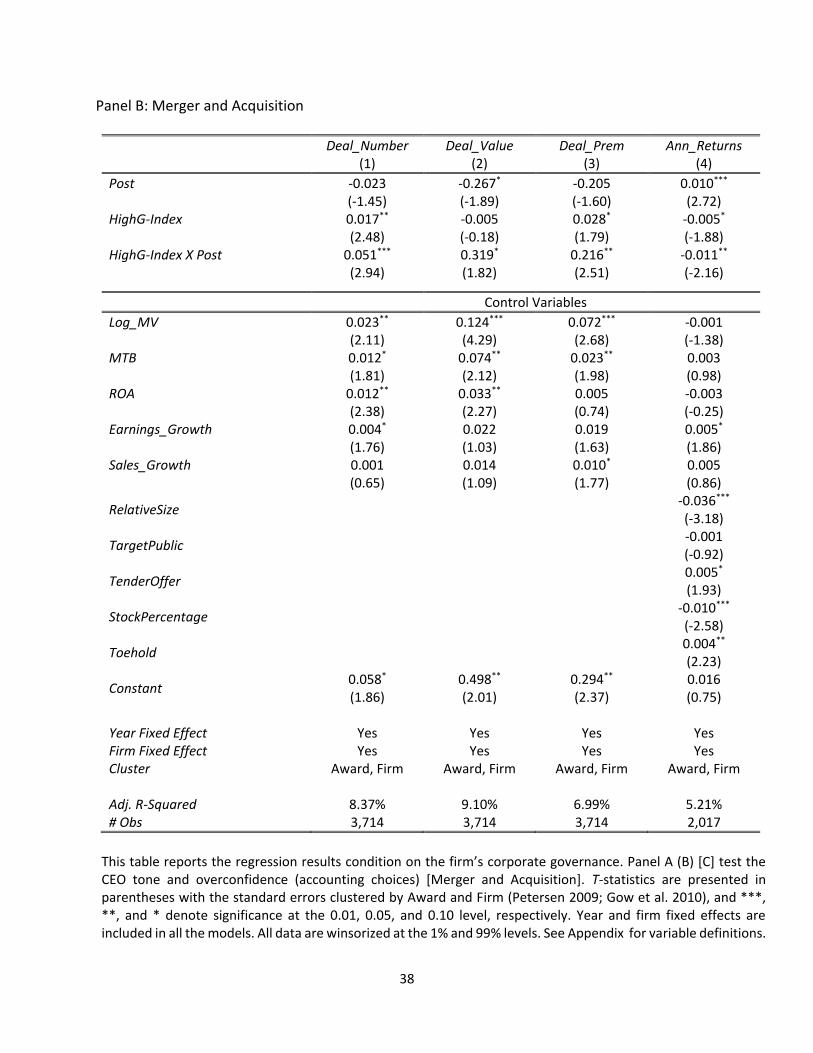
Next, in Panel B of Table 5, we test for the effects of competitor firms with weaker/stronger
corporate governance on M&A activity. We document that competitor CEO firms with weaker
corporate governance complete more M&A deals of a larger value and pay a higher premium, but
have lower announcement returns in the post-award period, compared to firms with stronger
corporate governance. Overall, the results in Table 5 support the prediction that competitor CEO
firms with weaker corporate governance engage in activities that are detrimental to shareholder
value; competitor CEO firms with stronger corporate governance are more likely to reign in CEOs’
value-destroying activities.
6. Additional Analyses and Falsification Test
6.1 Additional Analyses
In additional analyses, we test whether our results vary cross-sectionally across CEOs who
share more connections with the superstar or are more likely to win an award. Specifically, we
divide our sample of competitor CEOs at the median across three dimensions: (1) the level of
connections with the superstar CEO, defined using shared board seats between the competitor and

23
superstar firms (Cai and Sevilir 2012; Larcker, So, and Wang 2013); (2) whether the competitor
firm is the closest competitor with the superstar, defined using the Hoberg and Phillips (2010,
2016) text-based competitor classification; and (3) whether the competitor has a relatively higher
chance of winning an award, using the logit model predicting award winners from Malmendier
and Tate (2009).
In Table 6, we test our cross-sectional predictions for H1. We document that competitor
CEOs exhibit a more optimistic tone in conferences calls and are more likely to overinvest when
they share more connections with the superstar CEOs, are the closest competitors to superstar
CEOs (marginally significant), and are more likely to win awards. These findings provide
additional evidence that our primary results are driven by competitor CEOs engaging in upward
comparison with higher-achieving peers, and being driven by a desire to win an award.
Next, in Tables 7 and 8, we test our cross-sectional predictions for H2. In Table 7, we
document that competitor CEOs decrease accounting conservatism more when they are more
connected with the superstar CEO, or the closest competitor to the superstar CEO. In addition,
competitor CEOs increase (decrease) positive (negative) disclosures when they share more
connections with the superstar, are the closest competitor to the superstar, and have a higher chance
of winning an award. In Table 8, we similarly document that competitor CEOs increase the
number, size, and premium of M&A deals, but experience lower announcement returns, when they
share more connections with the superstar CEO, are the closest competitor to the superstar CEO,
and have a higher chance of winning an award. Overall, the results in Tables 7 and 8 provide
evidence that competitor CEOs are most likely to engage in activities they believe will boost stock
prices and/or attract media attention when they are a closer peer to the superstar, and when their
ex ante chances of winning an award are higher.

24
6.2 Falsification Test
Our results for CEO overconfidence/optimism document that CEOs employ a more
optimistic tone in earnings conference calls when their competitors win prestigious awards. We
propose that these results suggest an increase in CEO overconfidence, consistent with upward
social comparison leading to improved self-evaluation. However, one concern arising from these
analyses is that our results could be driven by shared characteristics of the competing firms, and
not a CEO’s personal overconfidence.
To address this concern, in Table 9, we test whether competitor firm CFOs also exhibit a
more optimistic tone in conference calls in the post-award period (Li et al. 2014). Competitor
CEOs and CFOs would likely share in any optimistic bias/overconfidence driven by firm
fundamentals; however, competitor CFOs should not share in the optimism/overconfidence driven
by CEOs’ personal biases and comparison to their peers. In Table 9, we document that competitor
CFOs do not exhibit a more optimistic tone/number of words in conference calls in the post-award
period, consistent with the primary results for H1 being driven by competitor CEOs’ improved
self-evaluation after upward comparison with superstars.
7. Conclusion
This study examines how CEOs react to competing CEOs winning prestigious media
awards. Social comparison theory proposes that people tend to compare themselves to higher-
performing peers (upward comparison); upward comparison often leads to improved self-
evaluation, because people think they are closer to reaching the same level of achievements as the
higher-performing peer. In addition, upward comparison often results in competitive/assimilation
behavior, where people strive to reach the same level of achievements as the higher-performing
peer. Applying social comparison theory to CEO behavior, we therefore predict that CEOs will

25
react to peer CEOs winning prestigious awards by becoming more overconfident and engaging in
activities likely to boost their chances of winning an award.
We conduct difference-in-differences analyses comparing a sample of firms with CEOs
who are competitors of superstar CEOs (“competitor CEOs”) to matched control firms, before and
after superstar CEOs first win prestigious media awards. We first document that competitor CEOs
employ a more optimistic tone in earnings conference calls after superstars win awards, compared
to the change for control firms. In addition, competitor CEOs are more likely to overinvest in the
post-award period, consistent with an increase in CEO overconfidence after peer CEOs win
awards. Next, in our test of competitive behaviors, we document that after superstar CEOs win
awards, competitor CEOs: (1) report less conservatively, (2) increase positive disclosures, (3)
decrease negative disclosures, (4) engage in more M&A, of a larger amount, and pay a higher
premium, and (5) experience lower M&A announcement returns. These activities all suggest that
overconfident competitor CEOs are engaging in activities likely to boost stock price and/or attract
media attention, and therefore increase their chances of winning an award. However, these
activities are value-destroying for shareholders. We find that our results are strongest (weakest)
for firms with weak (strong) corporate governance, consistent with firms with strong corporate
governance reigning in CEOs’ value-destroying activities. In additional analyses, we document
that our results are strongest when competitor CEOs share more board connections with the
superstar CEO, are closer competitors to the superstar CEO, and have a higher chance of winning
an award. In a falsification test, we document that competitor CFOs do not exhibit a more positive
tone in conference calls after superstars win awards, consistent with the primary results being
driven by CEO upward comparison, and not competitor firm characteristics.

26
This study makes several contributions to the literature. First, we complement Malmendier
and Tate’s (2009) findings that the media-driven corporate superstar system has a negative impact
on shareholders of superstar firms; we provide evidence that the superstar system also negatively
impacts the shareholders of competing firms. Next, our results provide empirical support for
upward social comparison theory among CEO: our findings suggest that CEOs compare
themselves to higher-performing peers, and strive to reach the same level of achievements as these
peers by engaging in activities that are likely detrimental to shareholders. Further, we contribute
to the literature on peer networks by documenting that CEOs react more to one another’s behavior
when they share more boardroom connections. Finally, we contribute to a limited literature on
competitors of superstar CEOs; in contrast to the findings of Amman et al. (2016), our results
suggest that shareholders of competitor firms are negatively impacted by the corporate superstar
system.

27
Appendix - Variable Definitions
Dependent Variables
CEO_PosTone The difference between the positive words and the negative words spoken by the CEO during the presentation section of the conference call, scaled by the total words spoken by the CEO during the presentation section. The positive and negative words are based on the list from Loughran and McDonald (2011).
CEO_Words Total number of words spoken by the CEO during the presentation section Over_Invest An indicator variable equals to 1 if the residual of regression of total asset
growth on sales growth run by industry-year is greater than zero, and 0 otherwise.
C_Score The firm-year conservatism measure estimated from the model by Khan and Watts (2009).
Pos_Disclos Potentially positive surprise—For the subset of firms for which actual earnings per share for period t exceeds analysts’ forecasts for period t that was issued immediately after earnings announcement of period t-1: Indicator variable equals to 1 if the firm issued earning guidance for period t in the middle of period t but before the earnings announcement of period t, and 0 otherwise.
Neg_Disclos Potentially negative surprise—For the subset of firms for which actual earnings per share for period t falls short of analysts’ forecasts for period t that was issued immediately after earnings announcement of period t-1, we create an indicator variable coded 1 if the firm issued earning guidance (warning) for period t in the middle of period t but before the earnings announcement of period t, and 0 otherwise.
Deal_Number The total number of acquisitions of at least 50% of the target’s shares which were announced in a year by each acquirer firm. If a firm did not engage in any acquisition during the year the total number of acquisitions is zero.
Deal_Value The total value of all the acquisition of at least 50% of the target’s shares which were announced in a year by each acquirer firm. If a firm did not engage in any acquisition during the year the total value of acquisitions is zero.
Deal_Prem The total value of all the premium paid for acquisitions which were announced in a year by each acquirer firm. If a firm did not engage in any acquisition during the year the total deal premium is zero. Premium is calculated as (Deal Value-(Target Equity Value 42 days before announcement* % of stock bought in the deal)).
Ann_Returns The acquirer cumulative market adjusted return over the three days spanning day -1 to day +1, where day 0 is the merger announcement date.
Variables of Interests
Post An indicator variable equals to 1 for the period post superstar award and 0 otherwise.
Competitor An indicator variable equals to 1 when the observation is superstar CEO competitor firm and 0 otherwise.
Connectedness The degree of connection between competitor’s board of directors and CEO superstar’s board of director from Cai and Sevilir (2012) and Larker, So, and

28
Wang (2013), which is measured as how easily or quickly a board can reach an outside board through interlocking directorates. For example if both firms share a common director the connectedness is equal 1, and if one director from the competitor and one director from the superstar CEO have been serving on the board of a third firm the connectedness is equal 2.
HighConnectedness An indicator variable equals to 1 when Connectedness is below the median value and 0 otherwise.
CloseCompetitor An indicator variable equals to 1 for the closest competitor for each superstar CEO (base on the text-bases competitor classification developed by Hoberg and Phillips (2010, 2016)) and 0 otherwise.
HigherChanceWin An indicator variable equals to 1 when competitor propensity score for probability of winning an award is above median and 0 otherwise.
G-Index The governance index developed by Gompers et al. (2003). HighG-Index An indicator variable equals to 1 when G-Index is above nine and 0 otherwise.
Control Variables
Log_MV Log market value of equity (COMPUSTAT CSHO×PRCC_F). MTB Market value of equity / book value of equity (COMPUSTAT
(CSHO×PRCC_F)/CEQ). ROA Return on assets (COMPUSTAT EBIT/AT). Earnings_Growth Change in earnings in quarter q relative to quarter q-4 scaled by total assets
(COMPUSTAT (IBQq-IBQq-4)/ATQ). Sales_Growth Growth in sales in quarter q relative to quarter q-4 (COMPUSTAT
SALESQq/SALESQq-4-1) RelativeSize The ratio of deal value over acquirers’ market value.
TargetPublic An indicator variable equals to 1 when the target is a public traded company and 0 otherwise.
TenderOffer An indicator variable that equals to 1 when the acquisition involves a tender offer and 0 otherwise.
StockPercentage The percentage of the transactions financed with common stock.
Toehold The percentage of target firm’s outstanding shares held by the bidder prior to the current deal.
Other Variables
CFO_PosTone The difference between the positive words and the negative words spoken by the CFO during the presentation section of the conference call, scaled by the total words spoken by the CFO during the presentation section. The positive and negative words are based on the list from Loughran and McDonald (2011).
CFO_Words Total number of words spoken by the CFO during the presentation section Rel_Words Relative words of CEO to CFO calculated as CEO_Words- CFO_Words. Rel_Tone Relative positive tone of CEO to CFO calculated as CEO_PosTone -
CFO_PosTone.

29
References
Ammann, M., Horsch, P., & Oesch, D. (2016). Competing with Superstars. Management Science,
62(10), 2842-2858.
Ahmed, A., & Duellman, S. (2013). Managerial overconfidence and accounting
conservatism. Journal of Accounting Research, 51(1), 1-30.
Baginski, S., Demers, E., Wang, C., & Yu, J. (2016). Contemporaneous verification of language:
Evidence from management earnings forecasts. Review of Accounting Studies, 21(1), 165-197.
Ben-David, I., Graham, J., & Harvey, C. (2007). Managerial overconfidence and corporate
policies (NBER working paper series, no. 13711). Cambridge, Mass.: National Bureau of
Economic Research.
Brewer, M. B., & Weber, J. G. (1994). Self-evaluation effects of interpersonal versus intergroup
social comparison. Journal of Personality and Social Psychology, 66(2), 268-75.
Brochet, F., Naranjo, P., & Yu, G. (2016). The capital market consequences of language barriers
in the conference calls of non-U.S. firms. The Accounting Review, 91(4), 1023-1049.
Brown, J., Novick, N., Lord, K., & Richards, J. (1992). When Gulliver travels: Social context,
psychological closeness, and self-appraisals. Journal of Personality and Social Psychology, 62(5),
717-727.
Bushee, B., Jung, M., & Miller, G. (2011). Conference presentations and the disclosure
milieu. Journal of Accounting Research, 49(5), 1163-1192.
Cai, Y., & Sevilir, M. (2012). Board connections and M&A transactions. Journal of Financial
Economics, 103(2), 327-349.
Carlin, B., Davies, S., & Iannaccone, A. (2010). Competing for attention in financial
markets (NBER working paper series, no. 16085). Cambridge, Mass.: National Bureau of
Economic Research.
Carlin, B. I., Davies, S., & Iannaccone, A. (2010). Competition and transparency in financial
markets. AFA 2012 Chicago Meetings Paper. Available at
SSRN: https://ssrn.com/abstract=1778262.
Chen, S., Chen, X., Cheng, Q., Hutton, A. (2009). Accounting conservatism and large
shareholders. Working Paper. University of Texas, Austin.
Collins, R. L. (1996). For better or worse: The impact of upward social comparison on self-
evaluations. Psychological Bulletin, 119(1), 51-69.

30
Davis, A. K., Piger, J. M., & Sedor, L. M. (2012). Beyond the Numbers: Measuring the Information
Content of Earnings Press Release Language. Contemporary Accounting Research, 29: 845–868.
Davis, A., Ge, W., Matsumoto, D., & Zhang, J. (2015). The effect of manager-specific optimism
on the tone of earnings conference calls. Review of Accounting Studies, 20(2), 639-673.
Demers, E., & Vega, C. (2011). Linguistic Tone in Earnings Announcements: News Or Noise?.
(INSEAD working paper series). Fontainebleau, France: INSEAD.
Demers, E., & Vega, C. (2014). Understanding the role of managerial optimism and uncertainty
in the price formation process: evidence from the textual content of earnings announcements.
Working paper, Univeristy of Virginia.
DePaulo, B., & Malone, B. (2003). Cues to deception. Psychological Bulletin, Vol. 129 No. 1 (ene.
2003), P74-118.
Gujarati, D.N. (2003). Basic Econometrics. New York: McGraw Hill Book Co.
Hoberg G., & Phillips, G. (2010) Product market synergies and competition in mergers and
acquisitions: A text-based analysis. Review of Financial Studies, 23(10):3773–3811.
Hoberg G., & Phillips, G. (2016). Text-based network industries and endogenous product
differentiation. Journal of Political Economy, 124(5), 1423-1465.
Jin, L. & Myers, S. (2004). R-squared around the world: New theory and new tests (NBER
working paper series, no. 10453). Cambridge, Mass.: National Bureau of Economic Research.
Khan, M., & Watts, R. L. (2009). Estimation and empirical properties of a firm-year measure of
accounting conservatism. Journal of accounting and Economics, 48(2-3), 132-150.
Koh, K. (2011). Value or glamour? An empirical investigation of the effect of celebrity CEOs on
financial reporting practices and firm performance. Accounting & Finance, 51(2), 517-547.
Kubick, T. R., & Lockhart, G. B. (2017). Overconfidence, CEO Awards, and Corporate Tax
Aggressiveness. Journal of Business Finance & Accounting, 44(5-6), 728-754.
Larcker, D. F., So, E. C., & Wang, C. C. (2013). Boardroom centrality and firm
performance. Journal of Accounting and Economics, 55(2-3), 225-250.
Larcker, D. F., & Zakolyukina, A. A. (2012). Detecting deceptive discussions in conference
calls. Journal of Accounting Research, 50(2), 495-540.
Levy, H., Shalev, R., & Zur, E. (2018). The effect of CFO personal litigation risk on firms’
disclosure and accounting choices. Contemporary Accounting Research, forthcoming.

31
Li, F., Minnis, M., Nagar, V., & Rajan, M. (2014). Knowledge, compensation, and firm value: An
empirical analysis of firm communication. Journal of Accounting and Economics, 58(1), 96-116.
Loughran, T., & McDonald, B. (2011). When is a liability not a liability? Textual analysis,
dictionaries, and 10‐Ks. The Journal of Finance, 66(1), 35-65.
Malmendier, U., & Tate, G. (2005). CEO overconfidence and corporate performance. Journal of
Finance 60(6): 2661–2700.
Price, S. M., Doran, J. S., Peterson, D. R., & Bliss, B. A. (2012). Earnings conference calls and
stock returns: The incremental informativeness of textual tone. Journal of Banking &
Finance, 36(4), 992-1011.
Rosen, S. (1981). The economics of superstars. The American Economic Review, 71(5), 845-858.
Schrand, C. M., & Zechman, S. L. (2012). Executive overconfidence and the slippery slope to
financial misreporting. Journal of Accounting and Economics, 53(1-2), 311-329.
Shemesh, J. (2017). CEO social status and risk-taking. Quarterly Journal of Finance, 7(02).
Shi, W., Zhang, Y., & Hoskisson, R. E. (2017). Ripple effects of CEO awards: Investigating the
acquisition activities of superstar CEOs' competitors. Strategic Management Journal, 38(10),
2080-2102.
Wheeler, L. (1966). Motivation as a determinant of upward comparison. Journal of Experimental
Social Psychology, 1, 27-31.

32
Table 1: Sample Panel A: Descriptive Statistics
#Obs Mean Median Std Dev (1) (2) (3) (4)
Dependent Variables
CEO_PosTone 29,712 0.015 0.014 0.010 CEO_Words 29,712 1496.900 1315.000 946.805 Over_Invest (0/1) 29,712 0.412 0.000 C_Score 7,428 0.121 0.112 0.137 Pos_Disclos (0/1) 18,372 0.158 0.000 Neg_Disclos (0/1) 9,126 0.207 0.000 Deal_Number 7,428 0.415 0.000 0.905 Deal_Value 7,428 20.053 0.000 133.352 Deal_Prem 7,428 13.501% 0.000 17.195% Ann_Returns 3,083 -2.248% -1.103% 6.385%
Control Variables
Log_MV 7,428 7.851 7.442 1.583 MTB 7,428 2.811 2.142 2.095 ROA 7,428 0.095 0.083 0.074 Earnings_Growth 7,428 0.001 0.001 0.008 Sales_Growth 7,428 0.096 0.070 0.083 RelativeSize 2,692 0.095 0.067 0.174 TargetPublic (0/1) 2,692 0.410 0.000 TenderOffer (0/1) 2,692 0.045 0.019 StockPercentage 2,692 0.228 0.158 0.369 Toehold 2,692 0.020 0.000 0.016
Other Variables
CFO_PosTone 29,712 0.003 0.003 0.009 CFO_Words 29,712 1301.677 1140.000 820.210 Rel_Words 29,712 195.223 112.000 948.322 Rel_Tone 29,712 0.011 0.010 0.012

33
Panel B: Correlation Table
(1) (2) (3) (4) (5) (6) (7) (8) (9) (10) (11) (12) (13) (14) (15) (16) (17) (18) (19)
1.CEO_PosTone 1.00
2.CEO_Words 0.13 1.00
3.Over_Invest 0.19 0.11 1.00
4.C_Score -0.02 -0.04 -0.12 1.00
5.Pos_Disclos 0.03 0.01 0.01 -0.09 1.00
6.Neg_Disclos -0.01 0.00 -0.04 0.26 -0.31 1.00
7.Deal_Number -0.00 -0.01 -0.02 0.01 -0.05 0.03 1.00
8.Deal_Value 0.03 0.04 0.06 -0.03 0.01 -0.02 0.69 1.00
9.Deal_Prem 0.07 0.10 0.03 -0.14 0.06 -0.16 0.45 0.08 1.00
10.Ann_Returns -0.06 -0.03 -0.01 0.02 0.01 0.05 -0.26 -0.10 -0.23 1.00
11.Log_MV 0.20 0.17 0.12 -0.03 0.06 -0.01 0.04 0.05 0.03 -0.06 1.00
12.MTB 0.09 0.02 0.05 -0.09 0.14 -0.12 0.02 0.03 0.01 -0.02 0.14 1.00
13.ROA 0.16 0.23 0.17 -0.02 0.05 -0.01 0.01 0.01 0.06 -0.09 0.23 0.17 1.00
14.Earnings_Growth 0.13 0.10 0.12 -0.08 0.02 -0.05 -0.00 -0.02 -0.01 0.03 0.10 0.13 0.15 1.00
15.Sales_Growth 0.19 0.16 0.09 -0.05 0.07 -0.12 0.03 0.01 0.03 0.00 0.07 0.08 0.11 0.18 1.00
16.RelativeSize -0.02 0.00 -0.01 0.02 -0.04 0.01 -0.03 -0.05 -0.03 -0.01 -0.04 -0.01 0.02 0.01 0.02 1.00
17.TargetPublic -0.00 -0.01 0.03 0.01 -0.00 0.01 -0.01 -0.01 -0.00 0.01 -0.02 -0.01 -0.01 -0.03 -0.00 0.09 1.00
18.TenderOffer 0.03 0.04 0.13 -0.16 0.10 -0.21 -0.01 0.01 0.02 -0.04 0.03 0.03 0.01 0.05 0.02 0.11 0.05 1.00
19.StockPercentage 0.05 0.08 -0.01 -0.09 0.04 -0.16 0.08 0.05 0.01 -0.06 0.01 0.01 0.00 -0.01 -0.03 0.08 0.10 0.18 1.00
20.Toehold 0.00 -0.01 0.03 0.14 -0.15 0.05 -0.02 -0.03 -0.00 0.01 0.03 0.05 0.02 0.01 0.00 0.01 0.07 0.03 0.03
This table describe the sample. Panel A provides the descriptive statistics (mean, median, and standard deviation) for all of our variables. Panel B presents sample Spearman’s correlations. Correlations that are significantly different from zero at the p<0.05 level are in bold. All data are winsorized at the 1% and 99% levels. See Appendix for variable definitions.

34
Table 2: Change in CEO’s Tone and Overconfidence
CEO_PosTone CEO_Words Over_Invest (1) (2) (3)
Post -0.003 (-1.60)
186.022*** (3.09)
0.025 (1.21)
Competitor -0.001* (-1.76)
-22.989 (-0.95)
0.013 (0.75)
Competitor X Post 0.003*** (3.21)
95.186* (1.94)
0.055** (2.01)
Control Variables
Log_MV -0.001*** (-4.37)
103.577** (2.01)
0.069** (2.34)
MTB -0.001** (-2.16)
-17.998 (-1.51)
-0.011* (-1.88)
ROA 0.003 (0.95)
1054.117** (2.11)
0.011 (0.31)
Earnings_Growth -0.009*** (-3.83)
-937.194 (-1.05)
0.100** (2.51)
Sales_Growth -0.002*** (-3.68)
-46.925 (-1.28)
0.021*** (3.01)
Constant -0.016*** (-6.54)
1437.476*** (5.90)
Year Fixed Effect Yes Yes Yes Firm Fixed Effect Yes Yes Yes Cluster Award, Firm Award, Firm Award, Firm Adj. R-Squared 34.35% 2.05% 13.12% # Obs 29,712 29,712 29,712
This table reports the regression results where the dependent variables are CEO_PosTone, CEO_Words, and Over_Invest in columns 1, 2 and 3, respectively. T-statistics are presented in parentheses with the standard errors clustered by Award and Firm (Petersen 2009; Gow et al. 2010), and ***, **, and * denote significance at the 0.01, 0.05, and 0.10 level, respectively. Year and firm fixed effects are included in all the models. All data are winsorized at the 1% and 99% levels. See Appendix for variable definitions.

35
Table 3: Accounting Choices
C_Score Pos_Disclos Neg_Disclos (1) (2) (3)
Post -0.016 (-0.45)
-0.124** (-2.41)
-0.264 *** (-3.81)
Competitor 0.021* (1.71)
0.031 (1.10)
-0.025 (-0.85)
Competitor X Post -0.058*** (-3.81)
0.047* (1.90)
-0.073** (-2.25)
Control Variables
Log_MV -0.036*** (-8.46)
0.105* (1.88)
0.121*** (2.82)
MTB -0.025*** (-5.28)
-0.005 (-0.35)
-0.014 (-1.15)
ROA -0.368*** (-7.32)
-0.041* (-1.88)
-0.046 (-1.04)
Earnings_Growth -0.047 (-1.39)
0.011* (1.81)
-0.017 (-0.93)
Sales_Growth -0.026* (-1.80)
0.003 (-0.26)
0.001 (0.52)
Constant 1.132*** (3.89)
Year Fixed Effect Yes Yes Yes Firm Fixed Effect Yes Yes Yes Cluster Award, Firm Award, Firm Award, Firm Adj. R-Squared 11.52% 3.85% 4.27% # Obs 7,428 18,372 9,126
This table reports the regression results where the dependent variables are C_Score, Pos_Disclos, and Neg_Disclos in columns 1, 2 and 3, respectively. T-statistics are presented in parentheses with the standard errors clustered by Award and Firm (Petersen 2009; Gow et al. 2010), and ***, **, and * denote significance at the 0.01, 0.05, and 0.10 level, respectively. Year and firm fixed effects are included in all the models. All data are winsorized at the 1% and 99% levels. See Appendix for variable definitions.

36
Table 4: Merger and Acquisition
Deal_Number Deal_Value Deal_Prem Ann_Returns (1) (2) (3) (4)
Post -0.041** (-1.97)
-0.319** (-2.10)
-0.195 (-1.48)
0.011** (2.12)
Competitor 0.006 (1.09)
-0.058 (-1.02)
-0.016 (-0.17)
0.001 (0.49)
Competitor X Post 0.066** (2.33)
0.438*** (3.11)
0.285*** (5.03)
-0.019*** (-3.76)
Control Variables
Log_MV 0.032*** (3.18)
0.136*** (5.39)
0.065* (1.92)
-0.002* (-1.73)
MTB 0.010* (1.68)
0.085*** (2.72)
0.019** (2.13)
0.005 (1.38)
ROA 0.018* (1.84)
0.035** (2.11)
0.010 (1.34)
-0.005 (-0.68)
Earnings_Growth 0.006* (1.73)
0.025 (1.06)
0.018** (2.31)
0.005* (1.72)
Sales_Growth 0.003 (1.18)
0.013 (0.62)
0.013* (1.70)
0.003 (0.37)
RelativeSize -0.039***
(-3.10)
TargetPublic -0.001
(-0.49)
TenderOffer 0.003*
(1.68)
StockPercentage -0.011***
(-2.83)
Toehold 0.005*
(1.93)
Constant 0.053*** (2.28)
0.538* (1.92)
0.329** (2.41)
0.019 (1.12)
Year Fixed Effect Yes Yes Yes Yes Firm Fixed Effect Yes Yes Yes Yes Cluster Award, Firm Award, Firm Award, Firm Award, Firm Adj. R-Squared 9.83% 10.15% 7.52% 5.81% # Obs 7,428 7,428 7,428 3,083
This table reports the regression results where the dependent variables are Deal_Number, Deal_Value, Deal_Prem, and Ann_Returns in columns 1, 2, 3 and 4, respectively. T-statistics are presented in parentheses with the standard errors clustered by Award and Firm (Petersen 2009; Gow et al. 2010), and ***, **, and * denote significance at the 0.01, 0.05, and 0.10 level, respectively. Year and firm fixed effects are included in all the models. All data are winsorized at the 1% and 99% levels. See Appendix for variable definitions.

37
Table 5: Corporate Governance Panel A: Accounting Choices
C_Score Pos_Disclos Neg_Disclos (1) (2) (3)
Post 0.008 (1.39)
0.157 (1.51)
-0.238** (-2.45)
HighG-Index -0.022** (-2.25)
0.057 (1.29)
-0.091* (-1.85)
HighG-Index X Post -0.018* (-1.84)
0.089 (1.01)
-0.129*** (3.16)
Control Variables
Log_MV -0.040*** (-4.59)
0.155* (1.79)
0.330*** (3.27)
MTB -0.020*** (-3.10)
-0.011 (-0.58)
-0.011 (-0.73)
ROA -0.334*** (-5.17)
-0.041** (-2.01)
-0.055 (-1.28)
Earnings_Growth -0.056 (-0.88)
0.003 (0.78)
-0.022 (-1.48)
Sales_Growth -0.020** (-2.03)
0.001 (-0.32)
0.001 (0.55)
Constant 1.173*** (2.79)
Year Fixed Effect Yes Yes Yes Firm Fixed Effect Yes Yes Yes Cluster Award, Firm Award, Firm Award, Firm Adj. R-Squared 10.23% 3.52% 4.42% # Obs 14,856 10,104 3,461
38
Panel B: Merger and Acquisition
Deal_Number Deal_Value Deal_Prem Ann_Returns (1) (2) (3) (4)
Post -0.023 (-1.45)
-0.267* (-1.89)
-0.205 (-1.60)
0.010*** (2.72)
HighG-Index 0.017** (2.48)
-0.005 (-0.18)
0.028* (1.79)
-0.005* (-1.88)
HighG-Index X Post 0.051*** (2.94)
0.319* (1.82)
0.216** (2.51)
-0.011** (-2.16)
Control Variables
Log_MV 0.023** (2.11)
0.124*** (4.29)
0.072*** (2.68)
-0.001 (-1.38)
MTB 0.012* (1.81)
0.074** (2.12)
0.023** (1.98)
0.003 (0.98)
ROA 0.012** (2.38)
0.033** (2.27)
0.005 (0.74)
-0.003 (-0.25)
Earnings_Growth 0.004* (1.76)
0.022 (1.03)
0.019 (1.63)
0.005* (1.86)
Sales_Growth 0.001 (0.65)
0.014 (1.09)
0.010* (1.77)
0.005 (0.86)
RelativeSize -0.036***
(-3.18)
TargetPublic -0.001
(-0.92)
TenderOffer 0.005*
(1.93)
StockPercentage -0.010***
(-2.58)
Toehold 0.004**
(2.23)
Constant 0.058* (1.86)
0.498** (2.01)
0.294** (2.37)
0.016 (0.75)
Year Fixed Effect Yes Yes Yes Yes Firm Fixed Effect Yes Yes Yes Yes Cluster Award, Firm Award, Firm Award, Firm Award, Firm Adj. R-Squared 8.37% 9.10% 6.99% 5.21% # Obs 3,714 3,714 3,714 2,017
This table reports the regression results condition on the firm’s corporate governance. Panel A (B) [C] test the CEO tone and overconfidence (accounting choices) [Merger and Acquisition]. T-statistics are presented in parentheses with the standard errors clustered by Award and Firm (Petersen 2009; Gow et al. 2010), and ***, **, and * denote significance at the 0.01, 0.05, and 0.10 level, respectively. Year and firm fixed effects are included in all the models. All data are winsorized at the 1% and 99% levels. See Appendix for variable definitions.

39
Table 6: Change in CEO’s Tone and Overconfidence Conditional on Competitor Characteristics
CEO_Tone CEO_Words Over_Invest CEO_Tone CEO_Words Over_Invest CEO_Tone CEO_Words Over_Invest (1) (2) (3) (4) (5) (6) (7) (8) (9)
Post 0.001* (1.84)
154.623*** (8.34)
0.042*** (2.99)
0.002* (1.91)
129.445*** (4.91)
0.046*** (3.51)
0.001* (1.86)
95.427*** (2.82)
0.031*** (2.69)
HighConnectedness 0.000 (0.45)
-5.559 (-0.41)
0.001 (0.59)
CloseCompetitor -0.001 (-0.38)
18.691 (0.99)
0.006 (1.04)
HigherChanceWin 0.003*** (3.09)
24.962* (1.83)
0.011* (1.76)
HighConnectedness X Post
0.002** (2.49)
39.249* (1.91)
0.027** (1.99)
CloseCompetitor X Post
0.001* (1.75)
21.342 (1.50)
0.020* (1.89)
HigherChanceWin X Post
0.001** (2.40)
13.494** (2.07)
0.015** (2.09)
Control Variables
Log_MV -0.001*** (-3.20)
95.920*** (2.81)
0.045** (2.01)
-0.001*** (-2.92)
94.635*** (2.60)
0.047** (2.12)
-0.001*** (-3.15)
95.811*** (2.75)
0.047** (2.20)
MTB -0.003* (-1.71)
-20.834 (0.94)
-0.011 (-1.38)
-0.002* (-1.88)
-20.529 (1.05)
-0.010 (-1.51)
-0.002* (-1.95)
-20.153 (1.26)
-0.011 (-1.29)
ROA 0.002 (0.58)
983.671* (1.85)
0.017 (0.88)
0.001 (0.38)
985.038* (1.69)
0.017 (0.95)
0.002 (0.46)
984.672* (1.73)
0.016 (0.66)
Earnings_Growth -0.012*** (-5.11)
-857.387* (-1.69)
0.112*** (3.19)
-0.012*** (-4.82)
-860.934 (-1.56)
0.110*** (2.99)
-0.011*** (-5.94)
-861.398 (-1.48)
0.112*** (3.10)
Sales_Growth -0.001** (-2.30)
-52.104 (-0.68)
0.017*** (3.49)
-0.001** (-2.49)
-52.781 (-0.84)
0.018*** (3.85)
-0.001** (-2.11)
-52.563 (-0.75)
0.018*** (3.91)
Constant -0.013*** (-5.10)
1257.387*** (7.38)
-0.012*** (-4.82)
1255.190*** (7.05)
-0.013*** (-5.29)
1254.471 (7.38)
Year Fixed Effect Yes Yes Yes Yes Yes Yes Yes Yes Yes Firm Fixed Effect Yes Yes Yes Yes Yes Yes Yes Yes Yes Cluster Award, Firm Award, Firm Award, Firm Award, Firm Award, Firm Award, Firm Award, Firm Award, Firm Award, Firm

40
Adj. R-Squared 28.18% 1.93% 12.44% 27.99% 1.88% 12.31% 28.51% 2.00% 12.39% # Obs 14,856 14,856 14,856 14,856 14,856 14,856 14,856 14,856 14,856
This table reports the regression results where the dependent variables are CEO_PosTone, CEO_Words, and Over_Invest. T-statistics are presented in parentheses with the standard errors clustered by Award and Firm (Petersen 2009; Gow et al. 2010), and ***, **, and * denote significance at the 0.01, 0.05, and 0.10 level, respectively. Year and firm fixed effects are included in all the models. All data are winsorized at the 1% and 99% levels. See Appendix for variable definitions.

41
Table 7: Accounting Choices Conditional on Competitor Characteristics
C_Score Pos_Disclos Neg_Disclos C_Score Pos_Disclos Neg_Disclos C_Score Pos_Disclos Neg_Disclos (1) (2) (3) (4) (5) (6) (7) (8) (9)
Post 0.005 (0.83)
0.152 (1.01)
-0.198** (-2.29)
-0.003 (-0.26)
0.129 (0.86)
-0.165** (-2.28)
-0.001 (-0.41)
0.113 (0.64)
-0.163** (-2.05)
HighConnectedness -0.013* (-1.72)
0.062 (1.08)
-0.059 (-0.99)
CloseCompetitor -0.010* (-1.89)
0.084* (1.79)
-0.097 (-1.05)
HigherChanceWin -0.005 (-1.27)
0.077** (1.98)
-0.103* (-1.92)
HighConnectedness X Post
-0.035** (-2.18)
0.077** (2.01)
-0.091** (-2.41)
CloseCompetitor X Post
-0.030*** (-2.91)
0.083** (2.32)
-0.107*** (-3.09)
HigherChanceWin X Post
-0.041 (-3.17)
0.058** (2.07)
-0.091** (-2.49)
Log_MV -0.043*** (-5.28)
0.188* (1.75)
0.351*** (3.09)
-0.041*** (-3.85)
0.185* (1.89)
0.350*** (2.94)
-0.041*** (-4.09)
0.186* (1.81)
0.350*** (2.99)
MTB -0.017*** (-2.89)
-0.013 (-0.91)
-0.014 (-0.16)
-0.015** (-2.50)
-0.012 (-0.84)
-0.015 (-0.24)
-0.017*** (-3.00)
-0.013 (-1.01)
-0.015 (-0.21)
ROA -0.338*** (-5.93)
-0.043** (-2.10)
-0.059 (-0.85)
-0.341*** (-5.31)
-0.045* (-2.21)
-0.060 (-0.79)
-0.340*** (-5.57)
-0.043** (-2.02)
-0.060 (-0.82)
Earnings_Growth -0.052 (-0.69)
0.005 (1.26)
-0.029 (-1.57)
-0.052 (-0.75)
0.005 (1.21)
-0.030* (-1.65)
-0.051 (-0.58)
0.004 (1.09)
-0.030 (-1.62)
Sales_Growth -0.021** (-2.11)
0.001 (-0.06)
0.001 (0.55)
-0.020** (-2.02)
0.001 (-0.08)
0.001 (0.61)
-0.020* (-1.95)
0.002 (-0.13)
0.001 (0.58)
Constant 1.184*** (3.15)
1.179*** (3.46)
1.186*** (3.02)
Year Fixed Effect Yes Yes Yes Yes Yes Yes Yes Yes Yes Firm Fixed Effect Yes Yes Yes Yes Yes Yes Yes Yes Yes Cluster Award, Firm Award, Firm Award, Firm Award, Firm Award, Firm Award, Firm Award, Firm Award, Firm Award, Firm

42
Adj R-Squared 10.89% 3.27% 5.05% 10.96% 3.19% 5.00% 10.67% 3.12% 4.96% # Obs 14,856 10,104 3,461 14,856 10,104 3,461 14,856 10,104 3,461
This table reports the regression results where the dependent variables are C_Score, Pos_Disclos, and Neg_Disclos. T-statistics are presented in parentheses with the standard errors clustered by Award and Firm (Petersen 2009; Gow et al. 2010), and ***, **, and * denote significance at the 0.01, 0.05, and 0.10 level, respectively. Year and firm fixed effects are included in all the models. All data are winsorized at the 1% and 99% levels. See Appendix for variable definitions.

43
Table 8: Merger and Acquisition Conditional on Competitor Characteristics Panel A: M&As and Connectedness
Deal_Number Deal_Value Deal_Prem Ann_Returns (1) (2) (3) (4)
Post -0.028 (-1.31)
0.053 (0.26)
0.022 (0.49)
-0.005* (-1.71)
HighConnectedness 0.003 (0.61)
-0.009 (-0.17)
-0.008 (-0.54)
-0.001 (-0.39)
HighConnectedness X Post 0.053*** (4.59)
0.361* (1.82)
0.225*** (2.71)
-0.014*** (-2.94)
Control Variables
Log_MV 0.025** (2.39)
0.121*** (4.75)
0.069** (2.43)
-0.001 (-1.52)
MTB 0.013* (1.90)
0.077** (2.36)
0.021* (1.84)
0.003 (1.10)
ROA 0.013** (2.52)
0.031** (2.01)
0.006 (0.89)
-0.003 (-0.31)
Earnings_Growth 0.005* (1.89)
0.020 (0.85)
0.021* (1.72)
0.007** (1.98)
Sales_Growth 0.001 (0.59)
0.016 (1.24)
0.011* (1.84)
0.005 (0.79)
RelativeSize -0.033***
(-2.75)
TargetPublic -0.001
(-0.82)
TenderOffer 0.006**
(2.08)
StockPercentage -0.009**
(-2.41)
Toehold 0.003**
(2.12)
Constant 0.061* (1.79)
0.502** (2.10)
0.299** (2.19)
0.015 (0.59)
Year Fixed Effect Yes Yes Yes Yes Firm Fixed Effect Yes Yes Yes Yes Cluster Award, Firm Award, Firm Award, Firm Award, Firm Adj. R-Squared 8.56% 9.25% 7.13% 5.25% # Obs 3,714 3,714 3,714 2,017

44
Panel B: M&As and Competitor
Deal_Number Deal_Value Deal_Prem Ann_Returns (1) (2) (3) (4)
Post -0.032 (-1.48)
0.061 (0.49)
0.030 (1.19)
-0.007* (-1.66)
CloseCompetitor 0.005 (0.71)
-0.008 (-0.25)
-0.005 (-0.27)
-0.001 (-0.52)
CloseCompetitor X Post 0.045*** (3.04)
0.340 (1.59)
0.196** (2.30)
-0.011*** (-2.68)
Control Variables
Log_MV 0.023** (2.12)
0.126*** (4.52)
0.070** (2.29)
-0.001* (-1.65)
MTB 0.012* (1.78)
0.081*** (2.67)
0.020* (1.69)
0.004 (0.91)
ROA 0.010*** (2.79)
0.028** (2.38)
0.005 (0.68)
-0.003 (-0.20)
Earnings_Growth 0.003* (1.69)
0.022 (1.02)
0.020* (1.80)
0.005* (1.88)
Sales_Growth 0.001 (0.41)
0.018 (1.37)
0.012** (2.06)
0.006 (1.00)
RelativeSize -0.030**
(-2.41)
TargetPublic -0.001
(-0.95)
TenderOffer 0.005**
(1.99)
StockPercentage -0.011***
(-2.98)
Toehold 0.002*
(1.75)
Constant 0.066** (1.98)
0.515** (2.39)
0.306** (2.31)
0.012 (0.43)
Year Fixed Effect Yes Yes Yes Yes Firm Fixed Effect Yes Yes Yes Yes Cluster Award, Firm Award, Firm Award, Firm Award, Firm Adj. R-Squared 8.39% 9.10% 6.98% 5.14% # Obs 3,714 3,714 3,714 2,017

45
Panel C: M&As and Probability of Winning an Award
Deal_Number Deal_Value Deal_Prem Ann_Returns (1) (2) (3) (4)
Post 0.021* (1.85)
0.108** (2.09)
0.038 (1.29)
-0.005* (-1.82)
HigherChanceWin 0.010* (1.71)
0.052* (1.69)
0.078* (1.92)
-0.005 (-1.52)
HigherChanceWin X Post 0.015 (1.52)
0.094** (2.41)
0.124** (2.39)
-0.009** (-1.97)
Control Variables
Log_MV 0.023** (2.01)
0.125*** (4.17)
0.070** (2.25)
-0.001 (-1.62)
MTB 0.015** (2.00)
0.076** (2.44)
0.018* (1.70)
0.004 (1.18)
ROA 0.013** (2.42)
0.027* (1.82)
0.005 (1.04)
-0.002 (-0.22)
Earnings_Growth 0.006** (1.98)
0.020 (0.69)
0.020* (1.84)
0.006* (1.86)
Sales_Growth 0.001 (0.50)
0.014 (1.09)
0.013* (1.90)
0.007 (1.05)
RelativeSize -0.036***
(-3.20)
TargetPublic -0.001
(-0.69)
TenderOffer 0.005**
(1.99)
StockPercentage -0.010***
(-2.61)
Toehold 0.003**
(2.12)
Constant 0.063* (1.74)
0.497** (1.97)
0.294** (2.07)
0.017 (0.35)
Year Fixed Effect Yes Yes Yes Yes Firm Fixed Effect Yes Yes Yes Yes Cluster Award, Firm Award, Firm Award, Firm Award, Firm Adj. R-Squared 8.22% 8.98% 7.03% 5.05% # Obs 3,714 3,714 3,714 2,017
This table reports the regression results where the dependent variables are Deal_Number, Deal_Value, Deal_Prem, and Ann_Returns. Panel A (B) [C] test the deals characteristics conditional on HighConnectedness (CloeCompetitor) [HigherChanceWin]. T-statistics are presented in parentheses with the standard errors clustered by Award and Firm (Petersen 2009; Gow et al. 2010), and ***, **, and * denote significance at the 0.01, 0.05, and 0.10 level, respectively. Year and firm fixed effects are included in all the models. All data are winsorized at the 1% and 99% levels. See Appendix for variable definitions.

46
Table 9: Chief Financial Officer
CFO_Words CFO_PosTone Rel_Words Rel_PosTone (1) (2) (3) (4)
Post 62.610*** (2.93)
-0.000 (-0.54)
123.411*** (3.68)
-0.002* (-1.86)
Competitor 14.452 (0.64)
0.001 (1.07)
-40.266 (-1.27)
-0.001 (-0.89)
Competitor X Post -4.086 (-0.55)
-0.001 (-0.20)
97.097* (1.71)
0.004*** (3.56)
Log_MV -10.06 (-0.17)
-0.001** (-2.46)
111.834** (2.14)
-0.000*** (-3.15)
MTB 5.101 (0.73)
-0.000* (-1.85)
-21.835 (-1.64)
-0.000* (-1.80)
ROA -685.438 (-1.28)
0.000 (0.36)
1705.283** (2.51)
0.002 (0.57)
Earnings_Growth -152.398 (-0.37)
-0.010*** (-3.21)
-782.834 (-0.85)
0.000 (0.11)
Sales_Growth 19.102 (0.74)
-0.001*** (-2.56)
-75.224* (-1.73)
-0.001* (-1.81)
Constant 1215.920*** (4.83)
-0.004*** (-4.49)
221.556*** (3.04)
-0.012*** (-7.64)
Year Fixed Effect Yes Yes Yes Yes Firm Fixed Effect Yes Yes Yes Yes Cluster Award Award Award Award
Adj. R-Squared 1.89% 30.88% 2.01% 32.81% # Obs 29,712 29,712 14,856 14,856
This table reports the falsification test for the CEO tone, using the CFO language and CFO language relative to the CEO during the conference call. The dependent variables are CFO_PosTone, CFO_Words, Rel_PosTone, and Rel_Words. T-statistics are presented in parentheses with the standard errors clustered by Award and Firm (Petersen 2009; Gow et al. 2010), and ***, **, and * denote significance at the 0.01, 0.05, and 0.10 level, respectively. Year and firm fixed effects are included in all the models. All data are winsorized at the 1% and 99% levels. See Appendix for variable definitions.