stark state college help desk services assessment biennial
TRANSCRIPT
1
Stark State College
Help Desk Services Assessment Biennial Report
Program/Department Name: Help Desk Services
Individual Completing Report: Robin Snedden
Date: 5/7/12
Program/ Departmental Self-Assessment Procedure and Action Plan
Purpose:
To self-identify the status of Program/Department in the outcomes assessment process as well as the action-
steps and timetable for the development of assessment processes.
Procedure:
All programs and departments must complete the self-assessment process. Programs which do not demonstrate
how the program/department meets each of the self-assessment criteria must submit an assessment plan
documenting the proposed action steps and timelines along with the self-assessment form. A follow-up self-
assessment report on the implementation of the assessment plan will be due the following academic year.
Programs meeting effective assessment standards will be required to submit an assessment report on a biennial
basis.
Directions:
Mark the appropriate response to the Yes/No items with an X. Provide a brief summary of action steps
to meet the Criteria (for example, the department will meet twice a month over the next term to develop goals).
Please note that it is critical that due diligence is given to the development of goals and associated outcome
measures. Do not attempt to create goals, identify measures, and implement the assessment plan in the same
term!
Assessment Criteria
1. Goals
Does the Department have specific student learning or academic/ student service goals which reflect the
discipline or service area professional standards?
Yes __X___ No _____
2. Outcome Measures
Are direct and indirect outcome measures identified for each goal?
Yes __X___ No _____
3. Research
Is research systematically conducted to evaluate success or failure in achieving outcomes?
Yes __X___ No _____
2
4. Findings
Are research results analyzed and interpreted and findings determined?
Yes __X___ No _____
5. Review Process
Are findings discussed and reviewed by appropriate groups and individuals and recommendations made for
action?
Yes __X___ No _____
6. Proposed Actions
Are recommendations acted upon?
Yes __X___ No _____
7. Improvements
Have actions result in documented improvements in student learning or academic/ student services?
Yes __X___ No _____
If no, what are the proposed action steps to meet the Criteria?
What is the proposed timetable for the action steps?
Assessment Measures Inventory
Purpose:
To identify benchmarked outcome measures and the benchmarking level (internal, state, national, etc.).
Instructions:
Enter the appropriate response for each question. Place an X in the box that corresponds to the level/type of
benchmarking data that is available for each measure. The table can be appended as needed by adding or
deleting rows.
Type of performance benchmark
(check all that apply)
Assessment Measures for Goals
(Outcome measures from assessment
report)
Is trend
data
available for
the
measure?
(Yes or No)
Has a
performance
benchmark(s)
been identified
for the
measure?
(Yes or No)
SSC
(Internal)
State-level
(OACC, OBR,
etc)
National
(Professional
Org.,
accrediting
group, etc.)
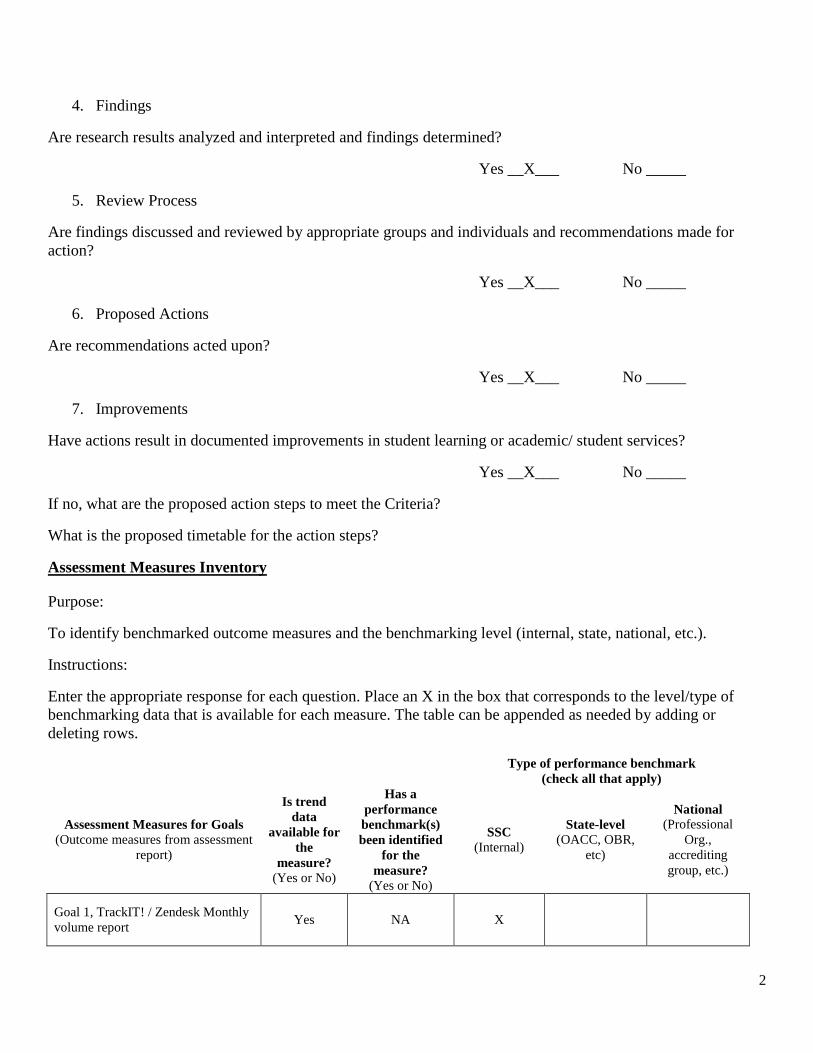
Goal 1, TrackIT! / Zendesk Monthly
volume report Yes NA X

3
Goal 1, TrackIT! / Zendesk Monthly
Response time Yes Yes X
Goal 1, Support Services
Effectiveness Survey No No X
Goal 1, Point-of-service survey No No X
Goal 1, Help Desk Tab content
reviews No NA
Goal 1, ACT Student Opinion
Survey No Yes X
X
Service Goals
Goal 1. To provide high-quality technical and information support services to students, faculty, and staff.
Summary Narrative
Help Desk Services offers a wide range of computing, technical, and informational services to the Stark State
College campus community. We are the first line of technical support for all computing problems and questions
across the College. Help is available at our staffed Help Desk counter, by phone, email, and in the mystarkstate
portal. By utilizing the portal, we are able to develop and support new technical initiatives throughout the
College. We work with Financial Aid, Registration, Admissions, Disability Support Services, and the Human
Resources offices to develop videos and help aids explaining how students and employees may accomplish
tasks online using the portal. We also provide support for online functionality, problems and questions for the
above mentioned areas. We provide videos and in-depth help aids supporting topics on student, faculty, and
staff network accounts, ANGEL troubleshooting, and other general computing tasks and IT information. In
addition, we develop equipment instructions for all equipment in classrooms and equipment available for
checkout to employees at the Help Desk Services counter.
The goal of Help Desk Services to provide high-quality technical and information support services to students,
faculty, and staff is done by several different methods to accommodate individual learning styles. Because the
Help Desk provides help and information in different formats, the criteria to measure if we are meeting our goal
took on several different methodologies. We developed qualitative and quantitative standards to assess whether
we are meeting our goal. One challenge encountered during the process was determining and measuring level
one support calls and tickets, separate from level two support calls and tickets. Since the Help Desk is the
contact point for both level one and level two support calls, it is not apparent to the constituents whether we are
providing their support or it has been provided by a level two support area. In developing the priority levels and
times to complete a ticket, level two support occurrences were considered, however, we do not have a voice in
how quickly a level two ticket is resolved. This is a limitation we will continue to encounter based on the nature
of Help Desk Services as the point of contact for all IT related problems.
The following measures are used to gauge if we are achieving our goal. We measure total calls and ticket
volume and report the totals on a monthly basis. We measure average response times for each ticket and report
the totals on a monthly basis. The Point-of-Service survey is offered to each person by email when a ticket is
solved to determine satisfaction. The Support Services Survey is offered once a year to students who are ready

4
to graduate and compares us to the College’s expectation for support services. The ACT Student Opinion
Survey is given every three years and compares us against national norms for colleges and universities. The
online content is evaluated yearly by conducting focus groups.
Evaluating the outcomes of our measures has shown that Help Desk Services operates as an effective support
area. Students, faculty and staff value and use our services on a consistent basis. The work orders completed
each month, along with the total monthly calls, show that the usage pattern is cyclical. We need to collect more
data to determine if we are busier at these times because we are getting the overflow calls from other support
offices and phone queues, or if we are busy do to the nature of startup each semester. We think that if we can
determine that cyclical usage is due to the nature of startup, then we can better market the use of our online self-
help available in the portal to curtail the use of additional personnel during these cycles.
During the reporting periods, there were changes to different software platforms to track calls and tickets
coming into Help Desk Services. In the changeover to a new platform for tracking tickets, one of the reporting
statistics changed to a different format and the old statistic was no longer available. It was noted on the monthly
report in the portal and below in the findings. Due to the new format available, one of our achievements has
been that the level one response times have been completed well within our set priority levels and we maintain
an extremely high satisfaction rate. In changing to a new phone platform, additional statistics are available to
monitor our calls.
The Support Services Effectiveness Survey results for Help Desk Services measured all above the College’s
benchmark for all support service areas. The individual questions pertaining to Help Desk Services online help
in the portal indicated the portal was utilized often. One of the challenges for Help Desk Services was indicated
in the remarks, and it is that there is a general lack of awareness about what we do at Help Desk Services. In
reviewing the findings with the director of Institutional Research and Planning, it was discussed that this same
finding was noted for other support offices at the College and an overall solution to the problem is being
considered.
The Point-of-Service survey revealed that the respondents were very satisfied with the service that we provided
them. Calling the Help Desk remains the favorite way to resolve issues, even after trying to raise online
awareness by advertising our online self-help in brochures and on the College monitors on campus. We
designed the Room At a Glance program to drive users to our tab in the portal for other reasons besides help.
Users find it very useful, but still prefer to call when help is needed. Most all comments were very positive
regarding the help they received. The few comments that were negative brought to light a challenge we face at
Help Desk Services, but have no control over; that is being the face of IT, but only resolving level one calls or
tickets. Even though we only control the help at the level one support level, the students and employees think
we provide the help for all areas. This one challenge was encountered again while reviewing the comments
students made in the ACT Student Opinion Survey.
The ACT Student Opinion Survey disclosed that students utilized our services heavily and that all IT services
are thought of as one entity. Since most processes are automated to accommodate the student better, we are
perceived as being the owner of all of these areas if a computer process is involved. This is a challenge that is
hard to overcome, but as additional procedures are put in place in other areas, a positive opinion should be
reflected in future outcomes. As we continue to work with heavily utilized area, such as Financial Aid and
Registration, to provide help for the automated processes, our perceptions of doing a better job should also be
reflected in higher scores on the survey.
The online content for Help Desk Services in the mystarkstate portal is evaluated by conducting yearly focus
groups. The results from the last two years contradicted each other. It was determined that the way users used
the online help, determined how they preferred the information presented to them. Those who used the online
content often were familiar with where specific help was located, and those who did not use it often, found it
5
difficult to navigate. We made changes based on the first year results, and the second year’s findings indicated
that the users did not like the changes. This was a challenge that we struggled to overcome, but did so by
solving it with a programing solution. The programming overcame the viewing limitations of the portal
software and gave users the choice to view data in the manner they choose. The changes have been received
well, and we have had positive feedback on the redesign of the Help Desk tab.
Our goal of providing high-quality technical and information support services to students, faculty, and staff will
continue to evolve as the College embarks in new directions and new initiatives are initiated to accomplish
those goals. Help Desk Services continues to work with other areas in the College to provide help to accomplish
tasks online and provide help for new technologies on campus and in the classroom.
Assessment Results Report
Purpose:
The report is a summary compilation of key assessment methods, findings, review processes, actions,
and improvements related to the academic/ student service or learning goals of the department/ unit on an
annual basis. As a historical record of assessment activities, the report provides for and supports the systematic
assessment of academic support outcomes.
Instructions:
Enter the outcome measure in the space provided. Please note that for each goal it is expected that a mix
of quantitative and qualitative as well as direct and indirect measures are employed. Mark the term of
assessment with an X (for example, if a survey is conducted in the fall term, mark fall for that measure).
Provide a brief summary of key findings, either as bulleted points or in short paragraph form. Provide a brief
summary on the review committee/ process (for example, Findings are reviewed by the Director and staff on a
per term basis and recommendations are forward to the VP for further review). Provide a brief summary of any
proposed actions for the next term/ academic year. Please note that not all findings result in actions. Provide a
brief summary of any improvements from the previous year (this does not apply to new measures the first year).
Finally, Goals and/ or Outcome Measures can be added (or deleted) as needed by copying and pasting.
Goal 1:
To provide high-quality technical and information support services to students, faculty, and staff.
Outcome Measure 1: TrackIT!/Zendesk Monthly volume report
Terms of Assessment: Summer __X___ Fall __X___ Spring __X___ Annual _____
Findings:
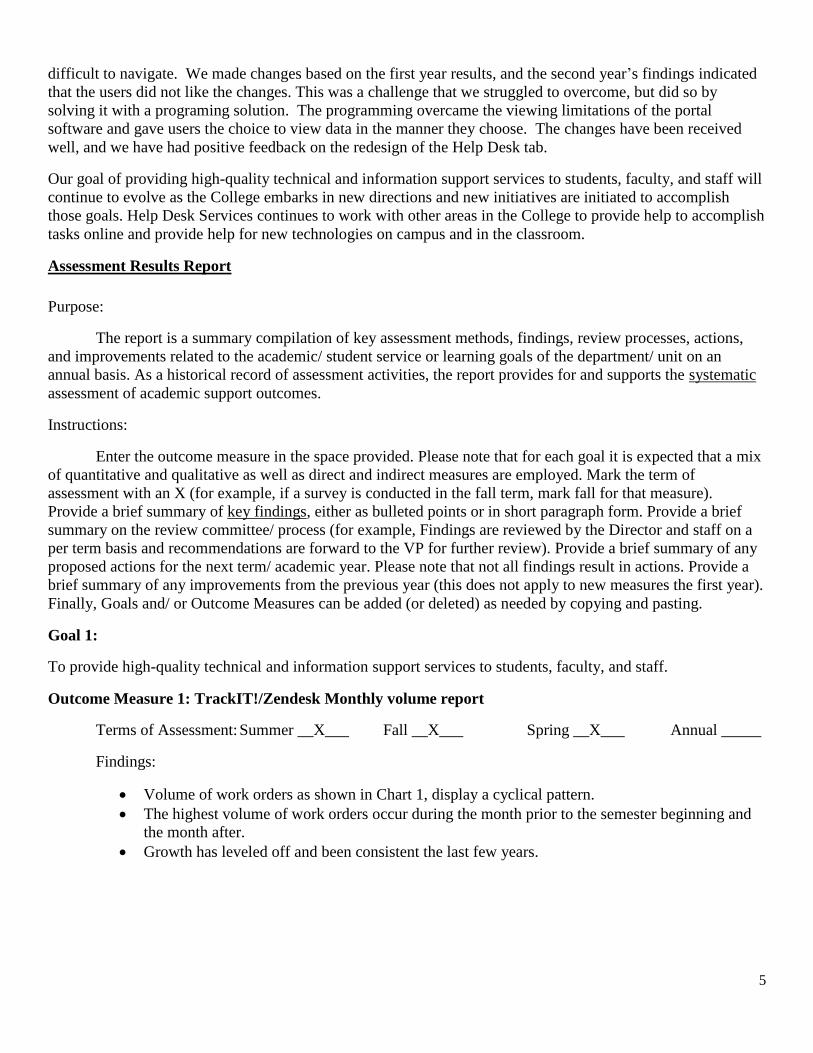
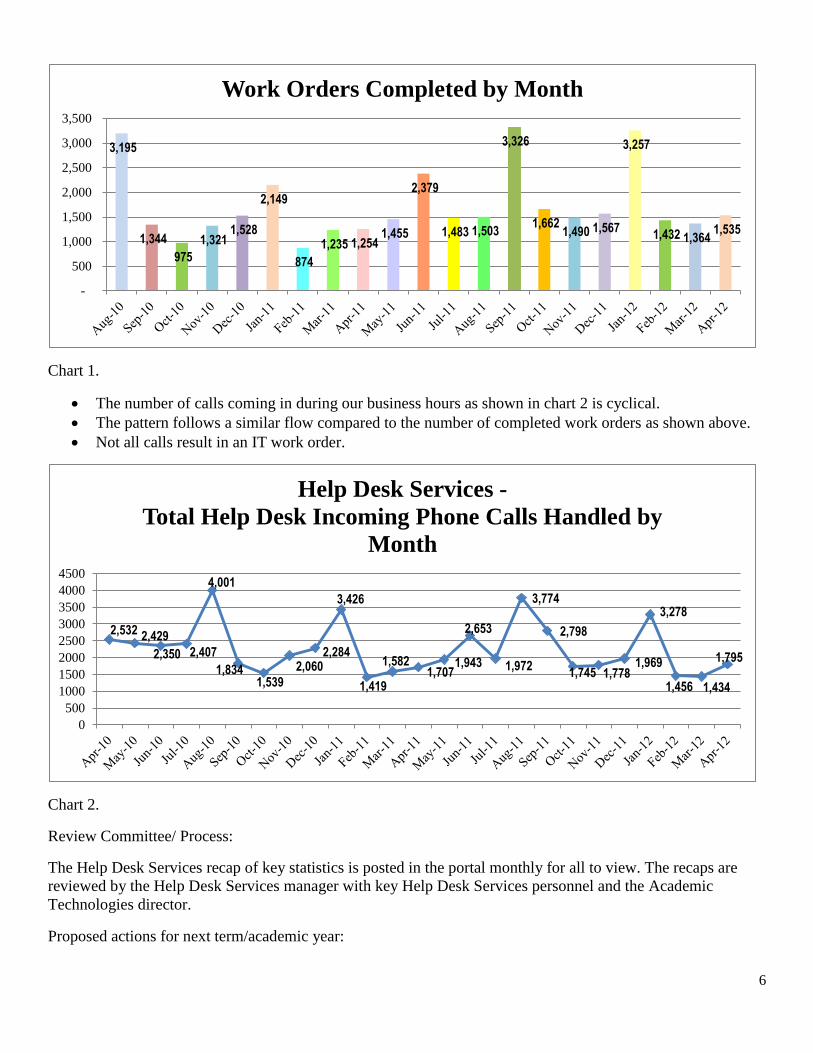
Volume of work orders as shown in Chart 1, display a cyclical pattern.
The highest volume of work orders occur during the month prior to the semester beginning and
the month after.
Growth has leveled off and been consistent the last few years.
6
Chart 1.
The number of calls coming in during our business hours as shown in chart 2 is cyclical.
The pattern follows a similar flow compared to the number of completed work orders as shown above.
Not all calls result in an IT work order.
Chart 2.
Review Committee/ Process:
The Help Desk Services recap of key statistics is posted in the portal monthly for all to view. The recaps are
reviewed by the Help Desk Services manager with key Help Desk Services personnel and the Academic
Technologies director.
Proposed actions for next term/academic year:
3,195
1,344
975
1,321 1,528
2,149
874
1,235 1,254 1,455
2,379
1,483 1,503
3,326
1,662 1,490 1,567
3,257
1,432 1,364 1,535
-
500
1,000
1,500
2,000
2,500
3,000
3,500
Work Orders Completed by Month
2,532 2,429
2,350 2,407
4,001
1,834 1,539
2,060 2,284
3,426
1,419
1,582 1,707
1,943
2,653
1,972
3,774
2,798
1,745 1,778 1,969
3,278
1,456 1,434
1,795
0
500
1000
1500
2000
2500
3000
3500
4000
4500
Help Desk Services -
Total Help Desk Incoming Phone Calls Handled by
Month

7
Currently our call volume and work tickets follow a cyclical pattern that shows an increased spike prior and
during the start of each semester. We need to collect more data to determine if we have a large percentage of
calls that drop out of the queues or determine if our volume goes up as other queues (Information Desk,
Financial Aid, Registration, and Admissions) back up.
Market the use of our online 24/7 Self-help to curb the use of additional personnel during peak times.
Improvements:
This is to be determined at a later date after the collection of additional data.
Outcome Measure 2: TrackIT!/Zendesk Monthly Response time
Terms of Assessment: Summer __X___ Fall __X___ Spring __X__ Annual _____
Findings:
The Help Desk (level 1) resolves work tickets/orders within the specified priority time levels assigned to
the order/ticket.
All level 1 and level 2 work orders/tickets are resolved within the priority time lines assigned to the
tickets as shown below in chart 3.
Work orders/tickets are monitored on a daily basis and reports are run monthly to evaluate the overall
time to resolve all work orders/tickets.
Note: Help Desk changed the software used to submit work orders/tickets from TrackIT! to ZenDesk
and the reporting of the Average Time to Complete Work Orders by Month measure changed due to
limitations of the reporting feature in the ZenDesk software.
Chart 3.
ZenDesk provides a 30 day snapshot daily that may be viewed as shown in figure 1 below.
ZenDesk provides a direct link to a satisfaction survey with every work ticket and the results may be
viewed overall as shown below in figure 1.

8
Figure 1.
ZenDesk provides a report for the current “Last 30 days” that displays all work tickets completed within
the assigned priority levels as shown in Chart 4.
Chart 4.
Review Committee/ Process:
The Help Desk Services recap of key statistics is posted in the portal monthly for all to view. The recaps are
reviewed by the Help Desk Services manager with key Help Desk Services personnel and the Academic
Technologies director.
Proposed actions for next term/academic year:
The VP has made a proposal to create an IT scorecard in which all IT departments would contribute key data to
track and report performance.
We need to gather additional information to determine level 1 response times and the different level 2
departmental response times in order to determine if priority levels times are being met by different areas.
Improvements:

9
This is to be determined at a later date after the collection of additional data.
Outcome Measure 3: Support Services Effectiveness Survey
Terms of Assessment: Summer _____ Fall _____ Spring _X___ Annual _____
Findings:
All areas exceeded the College benchmark grade (3.00) as shown in Table 1 below.
5 out of 9 criteria assessed received a grade of A- with the remaining receiving grades of B+.
Help Desk Score Grade
Meets personally with you 3.47 B+
Speaks by phone with you 3.60 A-
Provides help when needed 3.61 A-
Exhibits solid understanding of issues 3.38 B+
provides accurate, helpful information 3.48 B+
Shows courtesy and respect 3.62 A-
Demonstrates appropriate level of confidentiality 3.63 A-
Responds in timely manner 3.58 A-
Table 1.
Very high utilization of the Help Desk online self-help as shown in Table 2.
o Note 75% of Faculty & Staff use the online self-help in the portal sometimes or often
o 47% of Faculty & Staff use the Room At A Glance program on the Help Desk tab sometimes or
often
Note the underlined key words
Use online self-help on the Help Desk tab on the portal Sometimes/Often 346 75%
Use Room at a Glance on the Help Desk tab Sometimes/Often 344 47%
Table2.
Most individual comments were positive as summarized in Table 3 below.
Second most common comment related to lack of awareness which is consistent with the findings of other
departments.
Comments: Most Frequent Summarized Additional Comments
Help Desk Helpful/Excellent
(n =16) Don't deal with/ unsure of function
(n= 7)
Table 3.

10
Review Committee/ Process:
Reviewed the findings with Academic Technologies director and the Institutional Research and Planning
Director.
Proposed actions for next term/academic year: None.
Improvements: Not applicable.
Outcome Measure 4: Point-of-service survey
Terms of Assessment: Summer _____ Fall __X___ Spring ____X_ Annual _____
Findings:
The point-of-service survey instrument was revised and implemented in the spring of 2011 by embedding a link
to the survey in all Help Desk Services resolutions (that are emailed to the requestor). In the summer of 2011,
Help Desk Services changed the ticket order tracking software. The change provided an additional embedded
survey link in the resolution which allowed an immediate response to each individual work ticket. The overall
point of service survey results are listed below.
Preferred method of contact is over the phone, followed by coming in to the Help Desk counter as
shown in chart 5 and 6 below.
Chart 5.
Chart 6.

11
55% used or were aware of the online self-help in the portal in the spring 2011 semester as shown in
Chart 7 below.
Chart 7.
Online self-help awareness increased by 4.9% the following academic year when compared with Spring
2011 as shown in Charts 8 below.
Chart 8.
98% found the support person who helped them to be knowledgeable or very knowledgeable during
spring 2011 semester (reference Chart 9).
.

12
Chart 9.
The following academic year, this measure increased to 98.8% as shown in Chart 10.
Chart 10.
The respondents to the survey were overwhelmingly satisfied with the service received from Help Desk
Services for the 2010/11 and 2011/12 academic years.
During 2010/11 year, 83% responded they were very satisfied and 12.8% said they were satisfied, for a total of
95.8% of respondents having a positive experience with our service and 2.1% remained neutral, while another
2.1% were dissatisfied.

13
The following year, 2011/12, the respondents indicated 96.5% had a positive experience, with 84.2% very
satisfied with their service and 12.3% satisfied. We had another 2% remain neutral when responding to the
question and 1.2% who were dissatisfied. One person or .4% answered that they were very dissatisfied with our
service.
Review Committee/ Process:
Reviewed the findings with Academic Technologies director and the Institutional Research and Planning
Director.
Proposed actions for next term/academic year:
Market the Online 24/7 Self-help available on the Help Desk tab in mystarkstate.
Improvements:
4.9% increase in awareness of our Online 24/7 Self-help.
Outcome Measure 5: Help Desk Tab content reviews (online self-help)
Terms of Assessment: Summer _____ Fall _____ Spring __X___ Annual ____
Findings:
2010-11
Focus Group I & II Recap
May 26, 2011
Robin Snedden
Overview
On May 3, 2011, two focus groups were conducted to evaluate the content on the Help Desk tab in the Stark
State portal, mystarkstate. The groups were composed of a cross-section of different user groups from across
the College. Represented in the focus group were the following members: one full time faculty member, one
part-time faculty member, four full time staff members, and two students. A preliminary survey was sent to the
participants to familiarize them with the Help Desk tab. After viewing the Help Desk tab and specific channels
on the tab, the participants answered questions regarding their experience and brought the results with them to
the focus groups.
Results
The two groups found the Help Desk tab to very useful. Those who were familiar with the Help Desk tab, found
the help information to be quite helpful and robust. They used the self-help often. Those who were not familiar
with using the self-help or those who did not use it often, found the amount of information and scope of the help
to be daunting. For the most part, students and faculty used the portal more frequently than staff. Staff does not
use the portal as often to perform job functions as the faculty and students do.
Room at a Glance and Microsoft Office Help were mentioned as the most useful tools by faculty and staff. In
addition to this help, the Financial Aid help aids were also as helpful to students.
14
Those who used the portal before could find the information relatively quickly, and those students who used it
only to register for classes and check their grades, did not find information on help in the portal quickly.
One focus group found the section name headings in each channel to be self explanatory and the other focus
group did not.
When asked what other help is needed on the Help Desk tab, the majority of comments focused on formatting
issues such as font size and color and the size of the buttons for links. Students suggested adding a map to the
location of the Help Desk and include a photo of what it looks like. All participating in the focus group felt a
search option in the portal (or for the Help Desk tab) would be a helpful feature to have.
In response to the overall impression of the Help Desk tab, most participants felt there was a lot of good help
information. Some thought perhaps it needed to be on two tabs instead of one tab. One staff member thought
that there needed to be more separation of faculty and staff help.
At the conclusion of the focus groups, the facilitator asked for comments and suggestions. The following items
were brought up:
Advertize what is available on the Help Desk tab to faculty, staff and students.
Advertize more about the self-help on the monitors.
Put in info about the Help Desk in student orientation.
Put in info about the Help Desk tab in the new hire packets.
Offer more training on using mystarkstate.
Provide information through the student email about the Help Desk tab.
Have faculty support student awareness by announcing to the students at the beginning of the semester
and by including info about the Help Desk on the syllabus.
Follow-up
The Room at a Glance feature was created to drive users to a useful tool located on the Help Desk tab to
introduce users to all of the information available. It has served its purpose well, as it was repeatedly mentioned
as one of the most useful features used by the faculty and staff. While at the tab using this feature many become
acquainted with our self-help available 24/7 through the portal.
Training for mystarkstate customization will be integrated into the mystarkstate training that is offered to
faculty and staff at the beginning of each semester. Employees are not utilizing this feature and it allows them to
setup additional tabs with information that is relevant to them.
Brochures were developed to advertise the Help Desk and its different services for students spring 2011 and
were revised based on focus group feedback. They are dispersed at orientation and to new students through the
registration office.
The formatting suggestions have been implemented within the guidelines of the portal restrictions. Section
names have been revised, buttons made smaller, and we are developing video specifically for faculty and staff.

15
2011-2012
Focus Group I & II Recap
April 25 & April 26, 2012
Robin Snedden
Overview
On April 25 and April 26, 2012, two focus groups were conducted to evaluate the presentation of the online
help content on the Help Desk tab in the portal, mystarkstate. The groups were composed of a cross-section of
different user groups from across the College. Represented in the focus groups were members representing the
following areas:
Faculty member – Science Division,
Faculty member – Health Sciences Division,
Faculty member – Business & Entrepreneurial Studies Division,
Faculty member – Liberal Arts Division,
Faculty member – Engineering, Industrial & Emerging Technologies Division,
Staff member – Registration (did not attend),
Staff member – Admissions Councilor (did not attend),
Staff member – Teaching & Learning Division,
Staff member – Administrative Assistant to Dean,
Staff member – Orientation & Student Engagement,
Staff member – eStarkState E-Learning Division,
Staff member – Dean in Student Services (did not attend),
Staff member – Dean of Academic Division,
Student - (did not attend),
Student - (did not attend).
A preliminary survey was sent to the participants to familiarize them with the Help Desk tab. After viewing the
Help Desk tab and specific channels on the tab, the participants answered questions regarding their experience
and brought the results with them to the focus group for discussion.
Results
The two focus groups found the Help Desk tab very easily and our contact information and hours of operation
were easy to locate and read. The two groups found the following items to be the most helpful or useful features
of the tab:
Detailed Room At a Glance program,
Public Labs and Lounge areas information,
Directions are presented in two formats (readable print and videos),
Ability to find the information without calling the Help Desk,
The financial aid help information for students,
The general amount of information,

16
The location of the Submit a Help Ticket button.
The general consensus from both groups was the help presented is well done and easy to follow.
The items discussed by the focus groups that need improved or changed are that several channel names are very
similar and therefore, easy to confuse and need clarified better, the amount of information needs organized to
find the help easier, less clicks to help items, the size and color of the fonts used in the portal need changed, the
format of the Help Desk tab could be easier to navigate, and that the tab needs a search function or its own
directory.
When asked about the changes that were made last year, the groups liked the new design of the general Help
Desk Services channel. They like the buttons instead of links and felt they were easier to use. The format was
liked and they could easily read the information in the channel. They felt the section names added to the other
channels were self explanatory, but that the channels still needed to be organized or rearranged better. The
redesign of the Help Desk Services for Faculty & Staff channel was not clarified enough and they felt it needed
more work.
At the conclusion of the focus groups and at the end of the preliminary survey, the facilitator asked for
comments and suggestions. The following items were brought up:
Create an alphabet index similar to the .edu web page
Details to how to use the edit/find feature to search for key word
Need a search engine – maybe take info out of the portal and put it on our web site
Font is too small
Color content/contrast needs changed
Default is to use the phone and call the Help Desk
Wonderful, but too much to process visually
Make help on finding forms in the portal
Additional comments were made on the preliminary surveys that are not within the scope of Help Desk
Services. They covered topics such as providing help for financial planning, summer financial aid help for
students, making the whole portal searchable, and changing the colors and font of information presented in the
portal.
Follow-up
One of the changes made last year after the Focus Group reviews, was to update our general Help Desk Services
channel. We added buttons down one side instead of links and provided additional white space around the
information about our hours of operation and contact number. The users liked the new format using buttons
instead of descriptive links. They found it is easier to read and find information quicker. As a result of this
year’s findings, I am proposing we continue the new format through the other faculty, staff, and student
channels.

17
Based on the above findings, I am proposing the following changes for the Help Desk tab:
Reorganize the information provided in the channels under buttons
Make less categories
Change the channel names to eliminate confusion over similar names
Add videos and printable icons directly to the link
Eliminate the HITS channel
Bypass the portal style sheets to control the color, font size, and headings on the Help Desk tab
Based on the feedback and suggestions during the Focus Groups from the past two years, the following help
will be developed and added to the Help Desk tab:
Make a video and help aid on how mystarkstate is organized for new employees
Make a video and help aid on how the Help Desk tab is organized
Make a help guide to edit your own tabs in mystarkstate and eliminate the channel
The above help may be viewed by employees who are new and those who are not familiar with using the portal.
While adding a session on Help Desk Services and the Help Desk tab to new employee orientation, not all are
able to attend, and the above mentioned help will provide an overview and introduction to using the portal.
Review Committee/ Process:
Reviewed the findings with Academic Technologies director and the Institutional Research and Planning
Director.
Proposed actions for next term/academic year:
Improvements to the online self-help information were made based on the results of the 2010/2011 surveys and
Focus Group results. Additional improvements will be made during June and July of 2012 to the online help
based on the 2011/2012 surveys and Focus Group results.
Improvements:
This is to be determined at a later date after the collection of additional data.
Outcome Measure 6: ACT Student Opinion Survey
Terms of Assessment: Summer _____ Fall __X___ Spring ____ Annual _____
Findings:
The ACT Student Opinion Survey is conducted every three years. In the list of questions, Computer Services is
used as the departmental name, instead of Help Desk Services; however, Help Desk Services is the first line of
IT technical support that students encounter at SSC. In this respect, it is the role we serve at the College with
students regarding all Computer Services. For the most part we deliver the majority of level one IT support
though the Help Desk. The level two support responses may come from Academic Computing or Angel

18
Support, but it is delivered through the Help Desk interface and students perceive all IT computer services as
coming from the Help Desk Services area.
The survey asked students if they utilized Computer Services and 67% of the students responded yes. This is a
very high utilization rate. Only Financial Aid and Parking were utilized at a higher rate. 81% of students using
Computer Services were very satisfied or satisfied with their experience.
The SSC mean score for Computer Services was 4.15, which is high, but not compared to the 4.25 mean for
National public colleges. This is a statistically significant difference which means our score although good, was
significantly below the survey norm. Our mean score declined from the 2008 ACT survey results as well. While
it is difficult to determine why students were not as satisfied due to the nature of the survey questions, our
overwhelming continued growth during this time did impact some of our procedures and systems and may have
contributed to the decline in student satisfaction with Computer Services. Several student comments at the end
of the report mentioned an unpleasant experience with the E-Learning platform (Angel). One other comment by
a student suggested that the paper in the public lab areas needed to be addressed because of it running out so
often.
Students were satisfied with our hours of operation and our methods for them to contact Help Desk Services.
We provide a link in the portal that enables the student to submit their own ticket, and it gives them information
on the other methods such as email, phone, or they may walk in to the Help Desk Services counter on main
campus.
Review Committee/ Process:
Reviewed the findings with Academic Technologies director and the Institutional Research and Planning
Director.
Proposed actions for next term/academic year:
All proposals were implemented and the results are listed under improvements below.
Improvements:
Angle server hosting and IT support was outsourced to the vendor that provided the E-learning platform. This
has eliminated Angel down time.
More public computer lab areas and student lounge areas were made available. As new Academic buildings are
proposed, these common areas for students are designed into the plans.
All public lab printers were replaced with high paper capacity printers and locks were attached to paper trays to
prevent thief of paper. All public lab printers were branded with the Help Desk logo and phone number for
students to contact us in case of printer problems. The printers are replenished with paper on a regular basis and
students rarely experience a paper outage.
The Student Laptop Checkout program was initiated so that students could work in the public lounge areas or
any area on campus.

19
Assessment Report Review Rubric
Purpose: A rubric is a guide that differentiates between levels of development in outcomes assessment. The
rubric is designed to clearly show departments/ units how the assessment report will be evaluated and where
further action may be needed.
Directions: Mark the response to each item. If any item is not completed in its entirety the appropriate response
is No. An Assessment Report review committee will use the same rubric to evaluate your assessment report.
Are the goals for the department/ service area measureable?
Yes ___X__ No _____
Comments:
Is a mix of quantitative and qualitative measures used to assess outcomes for each goal?
Yes __X___ No _____
Comments:
Was research conducted and findings determined for each goal?
Yes __X___ No _____
Comments:
Is there a review process in place for the department/ service area?
Yes __X___ No _____
Comments:
Are action steps outlined where applicable?
Yes ___X__ No _____
Comments:
Was the self-assessment and action plan completed?
Yes __X___ No _____
Comments:
Was the assessment measures inventory completed?
Yes __X___ No _____
Comments:
20
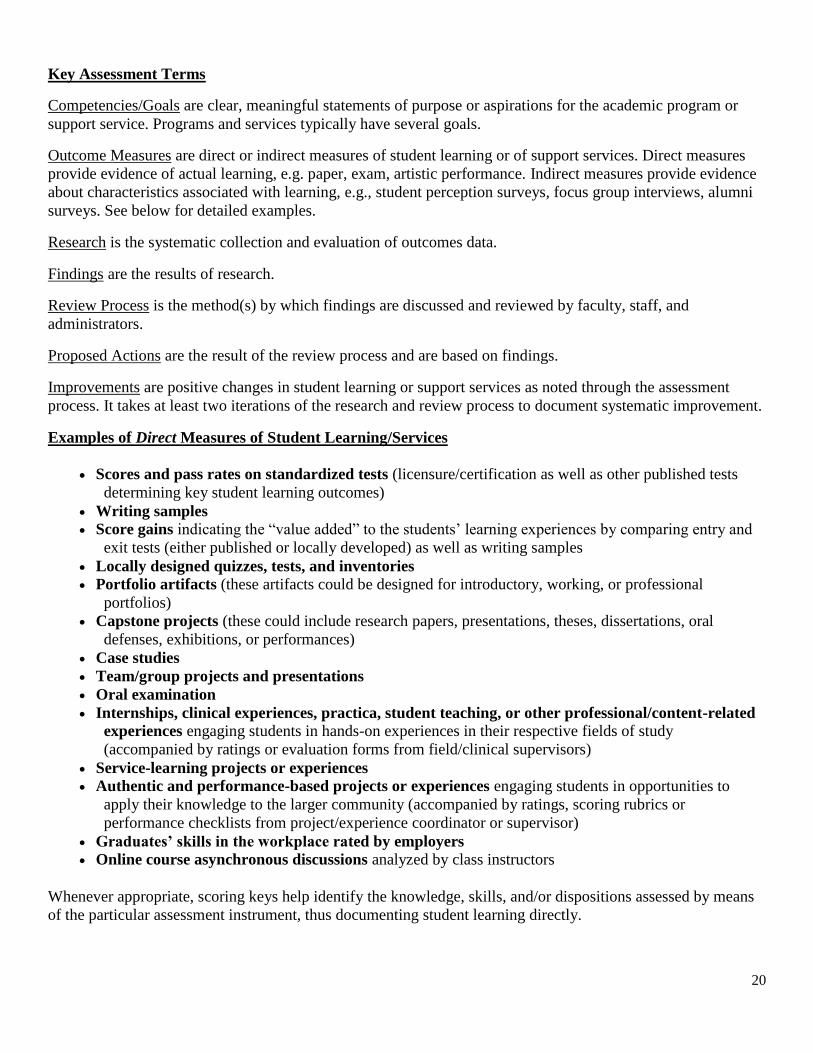
Key Assessment Terms
Competencies/Goals are clear, meaningful statements of purpose or aspirations for the academic program or
support service. Programs and services typically have several goals.
Outcome Measures are direct or indirect measures of student learning or of support services. Direct measures
provide evidence of actual learning, e.g. paper, exam, artistic performance. Indirect measures provide evidence
about characteristics associated with learning, e.g., student perception surveys, focus group interviews, alumni
surveys. See below for detailed examples.
Research is the systematic collection and evaluation of outcomes data.
Findings are the results of research.
Review Process is the method(s) by which findings are discussed and reviewed by faculty, staff, and
administrators.
Proposed Actions are the result of the review process and are based on findings.
Improvements are positive changes in student learning or support services as noted through the assessment
process. It takes at least two iterations of the research and review process to document systematic improvement.
Examples of Direct Measures of Student Learning/Services
Scores and pass rates on standardized tests (licensure/certification as well as other published tests
determining key student learning outcomes)
Writing samples Score gains indicating the “value added” to the students’ learning experiences by comparing entry and
exit tests (either published or locally developed) as well as writing samples
Locally designed quizzes, tests, and inventories Portfolio artifacts (these artifacts could be designed for introductory, working, or professional
portfolios)
Capstone projects (these could include research papers, presentations, theses, dissertations, oral
defenses, exhibitions, or performances)
Case studies
Team/group projects and presentations
Oral examination
Internships, clinical experiences, practica, student teaching, or other professional/content-related
experiences engaging students in hands-on experiences in their respective fields of study
(accompanied by ratings or evaluation forms from field/clinical supervisors)
Service-learning projects or experiences Authentic and performance-based projects or experiences engaging students in opportunities to
apply their knowledge to the larger community (accompanied by ratings, scoring rubrics or
performance checklists from project/experience coordinator or supervisor)
Graduates’ skills in the workplace rated by employers Online course asynchronous discussions analyzed by class instructors
Whenever appropriate, scoring keys help identify the knowledge, skills, and/or dispositions assessed by means
of the particular assessment instrument, thus documenting student learning directly.

21
Examples of Indirect Measures of Student Learning/Services
Course grades provide information about student learning indirectly because of a series of reasons,
such as: a) due to the focus on student performance or achievement at the level of an individual class,
such grades do not represent an indication of learning over a longer course of time than the duration of
that particular class or across different courses within a program; b) grading systems vary from class to
class; and c) grading systems in one class may be used inconsistently from student to student
Grades assigned to student work in one particular course also provide information about student
learning indirectly because of the reasons mentioned above. Moreover, graded student work in
isolation, without an accompanying scoring rubric, does not lead to relevant meaning related to overall
student performance or achievement in one class or a program
Comparison between admission and graduation rates
Number or rate of graduating students pursuing their education at the next level
Reputation of graduate or post-graduate programs accepting graduating students
Employment or placement rates of graduating students into appropriate career positions Course evaluation items related to the overall course or curriculum quality, rather than instructor
effectiveness
Number or rate of students involved in faculty research, collaborative publications and/or
presentations, service learning, or extension of learning in the larger community Surveys, questionnaires, open-ended self-reports, focus-group or individual interviews dealing with
current students’ perception of their own learning
Surveys, questionnaires, focus-group or individual interviews dealing with alumni’s perception of
their own learning or of their current career satisfaction (which relies on their effectiveness in the
workplace, influenced by the knowledge, skills, and/or dispositions developed in school)
Surveys, questionnaires, focus-group or individual interviews dealing with the faculty and staff
members’ perception of student learning as supported by the programs and services provided to
students
Quantitative data, such as enrollment numbers
Honors, awards, scholarships, and other forms of public recognition earned by students and
alumni
[Adapted from Maki, P.L. (2004). Assessing for learning: building a sustainable commitment across the
institution. Sterling, VA: AAHE; and Suskie, L. (2004). Assessing student learning: A common sense guide.
San Francisco, CA: Anker Publishing Company, Inc.]