starpresentation090605 (2)
DESCRIPTION
HiTRANSCRIPT
STAR PAPER STAR
PAPER A part of the Duncan Goenka Group of companies
Raising the bar
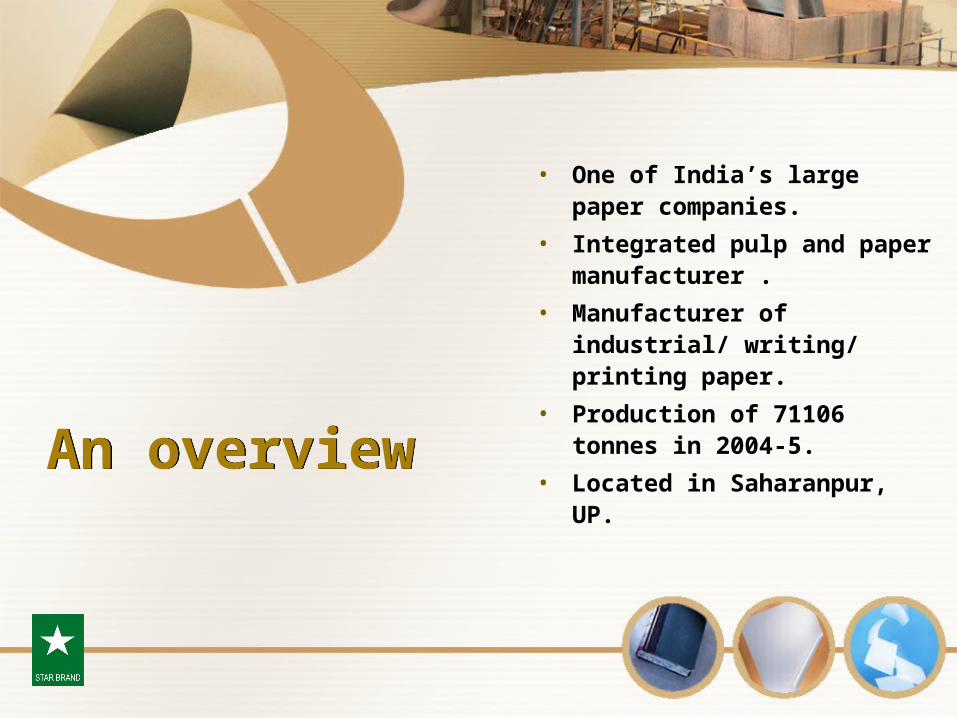
An overview An overview
• One of India’s large paper companies.
• Integrated pulp and paper manufacturer .
• Manufacturer of industrial/ writing/ printing paper.
• Production of 71106 tonnes in 2004-5.
• Located in Saharanpur, UP.

What we achieved in 2004-5
What we achieved in 2004-5

What we achieved over the years
What we achieved over the years
How Star’s performance
compares with its industry
peers
How Star’s performance
compares with its industry
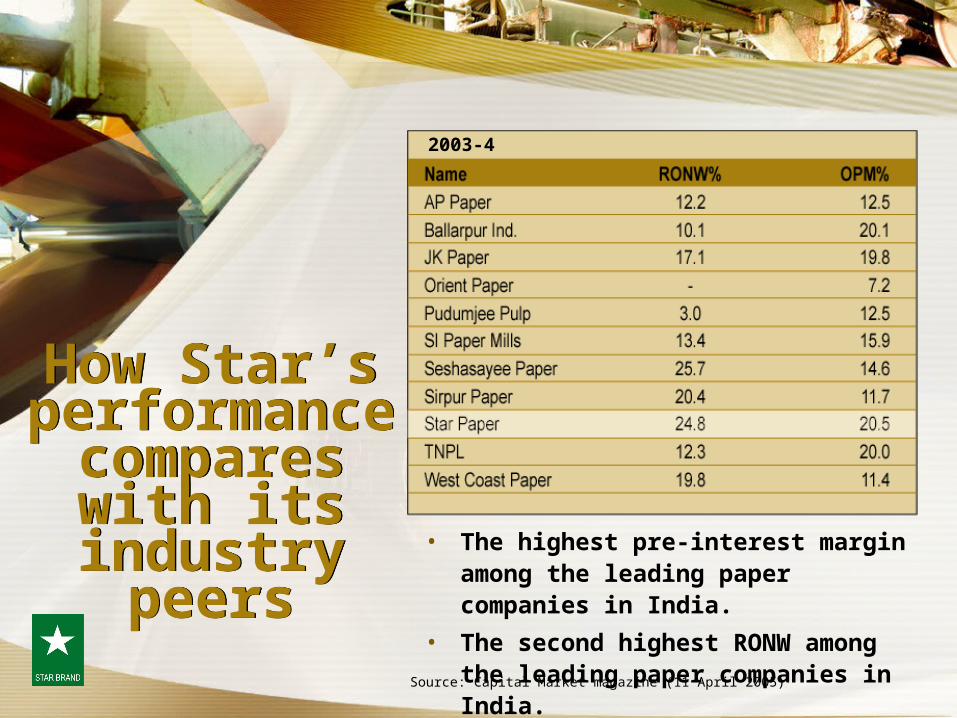
peers• The highest pre-interest margin among
the leading paper companies in India.
• The second highest RONW among the leading paper companies in India.
Source: Capital Market magazine (11 April 2005)
2003-4

Intra-industry comparison, 2003-4
Intra-industry comparison, 2003-4
Intra-industry comparison, 2004-5
Intra-industry comparison, 2004-5
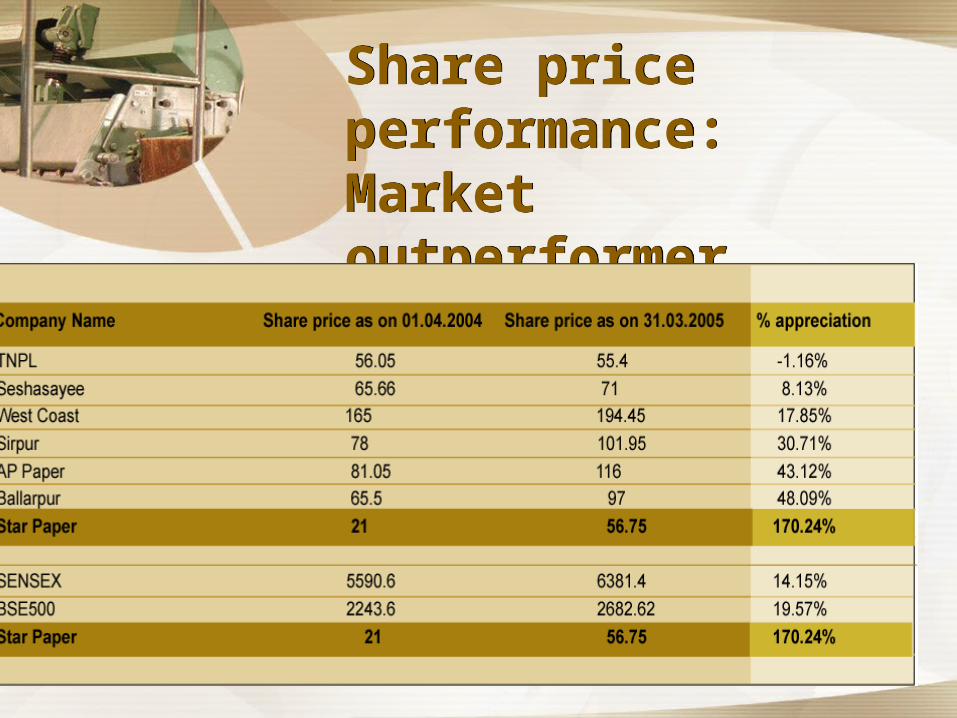
Share price performance: Market outperformer
Share price performance: Market outperformer

Improving results
but poor discounti
ng
Improving results
but poor discounti
ng
• Cash flow of Rs 28.52 cr, 2004-5.
• Market capitalisation of Rs 107 cr (closing price Rs.71, Mumbai Stock Exchange, 4 June 2005).
• Cash flow discounted around a mere 4 times.
contd.
Improving results
but poor discounti
ng
Improving results
but poor discounti
ng
• Net earnings discounted a little over 5 times for 2004-5 results.
• Lower than peer discounting on retrospective results.
• Almost half the industry P/E of 11 (source: Capital Market, 11 April 2005).

Star: Indian paper
industry’s attractive
growth proxy
Star: Indian paper
industry’s attractive
growth proxy
148.53160.2
172.1185.95
0
20
40
60
80
100
120
140
160
180
200
2001-2 2002-3 2003-4 2004-5
6.49 7.02
11.56
20.17
0
5
10
15
20
25
2001-2 2002-3 2003-4 2004-5
8.6412.75
27.69 28.52
0
5
10
15
20
25
30
2001-2 2002-3 2003-4 2004-5
Total income (Rs cr)
Profit after tax (Rs cr)
Cash flow (Rs cr)

Enhancing shareholde
r value
Enhancing shareholde
r value
• Positive EVA for two years leading to 2004-5.
• Increasing ROCE for each of three years leading to 2004-5.
• 44 per cent of cash flow ploughed back into assets, 11 per cent paid out as dividend.
• Payout ratio of 17.5 per cent in 2004-5, a balance between reinvestment and payout.
contd.

Enhancing shareholder value
Enhancing shareholder value
14.19
18.22
23.34
28.06
0
5
10
15
20
25
30
2001-2 2002-3 2003-4 2004-5
Return on averagecapital employed (%)
8.93 9.41
13.86
20.06
0
5
10
15
20
25
2001-2 2002-3 2003-4 2004-5
0.5
1
1.51.75
0
0.2
0.4
0.6
0.8
1
1.2
1.4
1.6
1.8
2001-2 2002-3 2003-4 2004-5
Return on net worth (%)
Dividend (Rs per share)
46.6 47.853.5
64.48
0
10
20
30
40
50
60
70
2001-2 2002-3 2003-4 2004-5
Book value* (Rs)*Net of revaluation reserve
Backed by a strong market
presence
Backed by a strong market
presence
• 60 per cent of industrial paper output sold within a radius of 250 kms.
• Flexibility in production capability between industrial and writing-printing paper varieties in response to demand situation.
• Dominant presence all over India for virgin kraft and industrial posters.
• Large number of stocking points even in B and C grade cities in North India, enabling the company to serve even small customers.
• One of the few Indian paper companies to have established a web-enabled indenting and web-enabled order processing system.
contd.

Distribution and reach
Distribution and reach
• Retail customers serviced through 50 nationwide distributors, Star’s primary customers; 8% increase in dealer throughput in 2004-5.
• Presence in 13 Indian states through the dealer network.
• 85 per cent of the company’s distributors have been the company’s channel partners for at least 10 years.
• Some distributors represent the fourth generation working with the company.
Eclectic customer
mix
Eclectic customer
mix
.
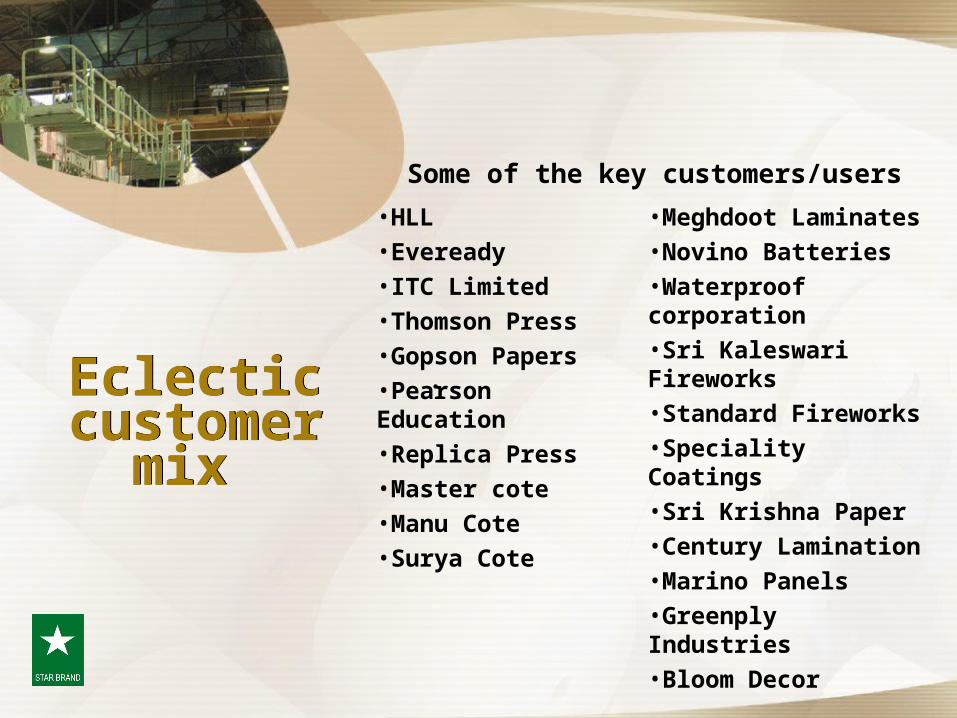
Some of the key customers/users
•HLL
•Eveready
•ITC Limited
•Thomson Press
•Gopson Papers
•Pearson Education
•Replica Press
•Master cote
•Manu Cote
•Surya Cote
•Meghdoot Laminates
•Novino Batteries
•Waterproof corporation
•Sri Kaleswari Fireworks
•Standard Fireworks
•Speciality Coatings
•Sri Krishna Paper
•Century Lamination
•Marino Panels
•Greenply Industries
•Bloom Decor
Operational excellence
Operational excellence
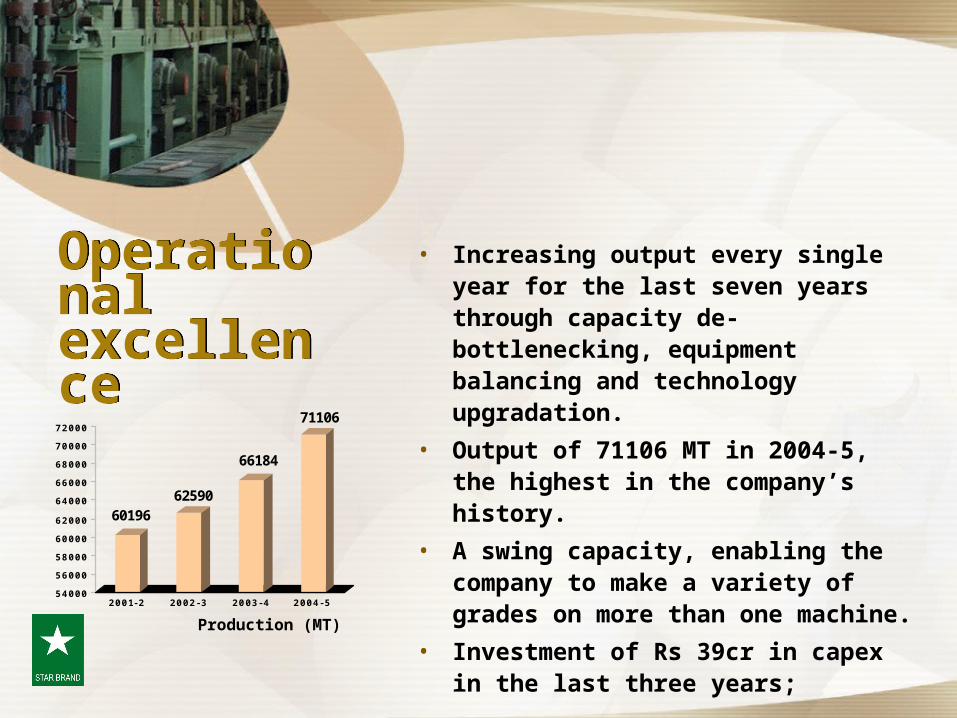
• Increasing output every single year for the last seven years through capacity de-bottlenecking, equipment balancing and technology upgradation.
• Output of 71106 MT in 2004-5, the highest in the company’s history.
• A swing capacity, enabling the company to make a variety of grades on more than one machine.
• Investment of Rs 39cr in capex in the last three years;
6019662590
66184
71106
54000
56000
58000
60000
62000
64000
66000
68000
70000
72000
2001-2 2002-3 2003-4 2004-5
Production (MT)
Prudent raw
material managem
ent
Prudent raw
material managem
ent
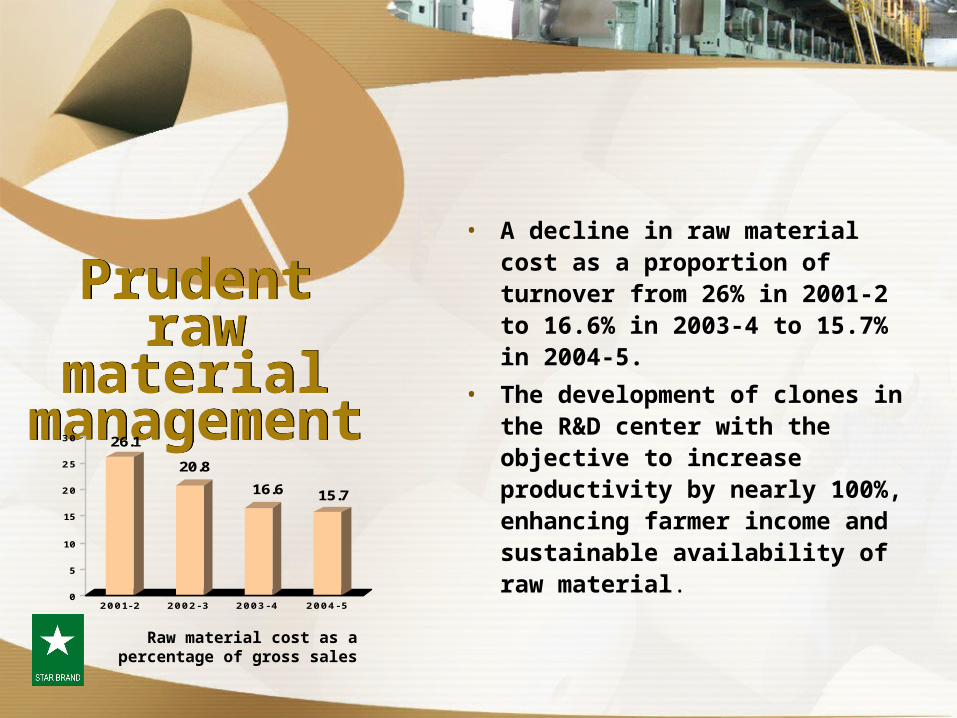
• A decline in raw material cost as a proportion of turnover from 26% in 2001-2 to 16.6% in 2003-4 to 15.7% in 2004-5.
• The development of clones in the R&D center with the objective to increase productivity by nearly 100%, enhancing farmer income and sustainable availability of raw material.
26.1
20.8
16.6 15.7
0
5
10
15
20
25
30
2001-2 2002-3 2003-4 2004-5
Raw material cost as apercentage of gross sales

Estimated generation of wood vs Star’s
own requirem
ent
Estimated generation of wood vs Star’s
own requirem
ent
1584
0021
0336
2178
00
2115
73
2340
0021
8724 2700
00
2257
03
4104
00
2506
60
5220
0026
5000
0
100000
200000
300000
400000
500000
600000
2000-01 2001-02 2002-03 2003-04 2004-05 2005-06
Wood Generation (MT)
Wood Consumption (MT)

Raw material scenario:Increasing use of
social forestry resources in Star
Raw material scenario:Increasing use of
social forestry resources in Star
Government wood
Social forestry wood
2377
2278
1189
991
496
0
10
20
30
40
50
60
70
80
90
100
2000-01 2001-02 2002-03 2003-04 2004-05
Prudent energy
management
Prudent energy
management
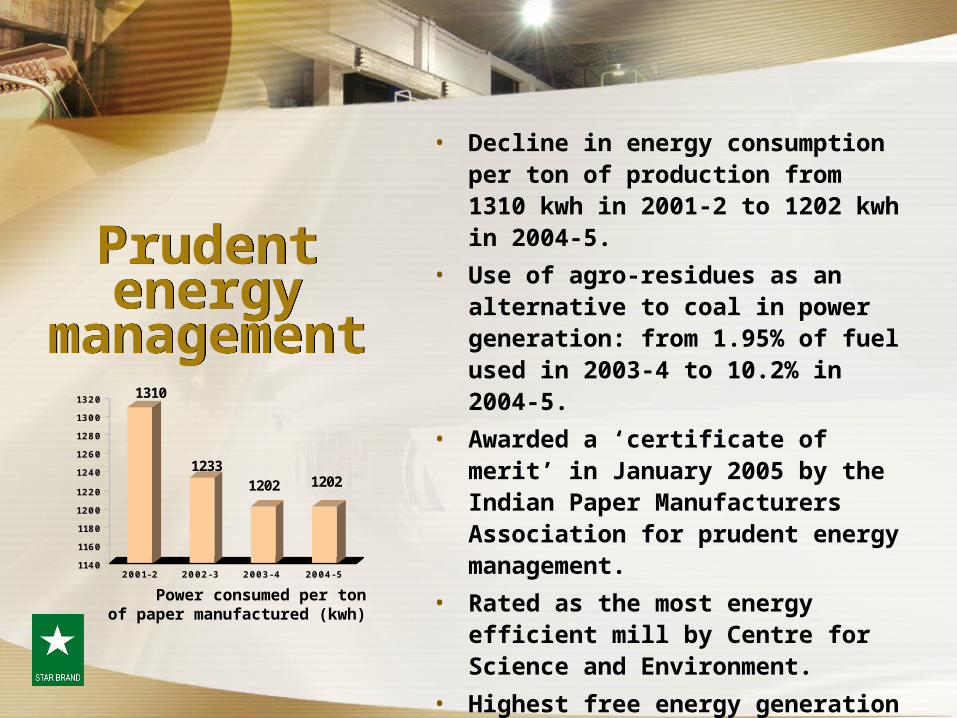
• Decline in energy consumption per ton of production from 1310 kwh in 2001-2 to 1202 kwh in 2004-5.
• Use of agro-residues as an alternative to coal in power generation: from 1.95% of fuel used in 2003-4 to 10.2% in 2004-5.
• Awarded a ‘certificate of merit’ in January 2005 by the Indian Paper Manufacturers Association for prudent energy management.
• Rated as the most energy efficient mill by Centre for Science and Environment.
• Highest free energy generation from by products in the industry.
1310
12331202 1202
1140
1160
1180
1200
1220
1240
1260
1280
1300
1320
2001-2 2002-3 2003-4 2004-5
Power consumed per tonof paper manufactured (kwh)

Better working capital
management
Better working capital
management
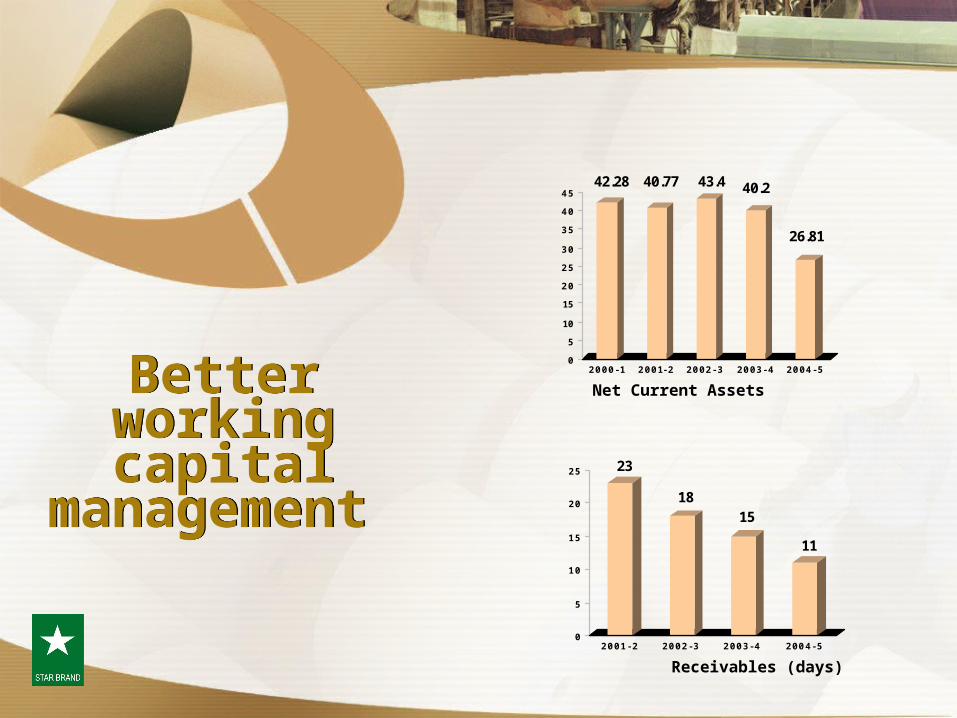
• Replacement of bank borrowings for working capital with internal accruals from Rs 12.6 cr in 2002-3 to Rs 3.6 cr in 2004-5.
• Reduction in fixed deposits and other unsecured loans from Rs 12 cr in 1999-2000 to Rs 0.70 cr in 2005.
• Reduction in net current assets from Rs 39 cr in 1999-2000 to Rs 27 cr in 2004-5 in the face of a rising turnover.
Better working capital
management
Better working capital
management
42.28 40.77 43.4 40.2
26.81
0
5
10
15
20
25
30
35
40
45
2000-1 2001-2 2002-3 2003-4 2004-5
Net Current Assets
23
1815
11
0
5
10
15
20
25
2001-2 2002-3 2003-4 2004-5
Receivables (days)
Enhanced people
productivity
Enhanced people
productivity
• Productivity increased by 24% in 2004-5 in comparison to 2002-03.
• Team working approach comprising 17 quality circles of seven members each across departments, aggregating all points of view in speedy problem-solving.
• The workmen are involved in several quality circles and the team has won awards in regional presentations.
Better fiscal managemen
t
Better fiscal managemen
t
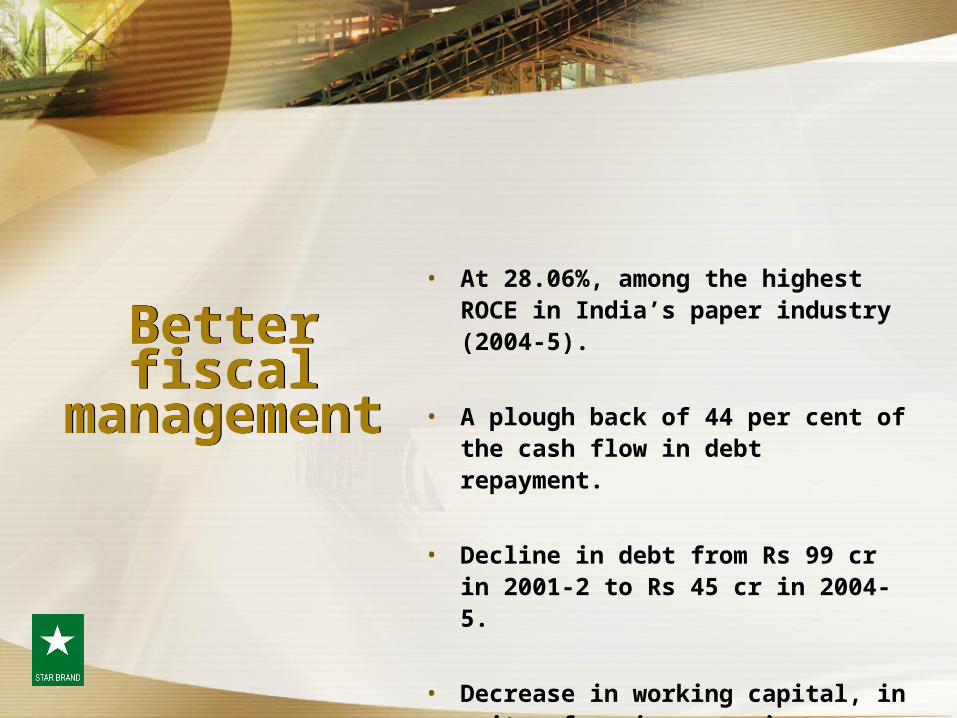
• At 28.06%, among the highest ROCE in India’s paper industry (2004-5).
• A plough back of 44 per cent of the cash flow in debt repayment.
• Decline in debt from Rs 99 cr in 2001-2 to Rs 45 cr in 2004-5.
• Decrease in working capital, in spite of an increase in raw material inventory.
Better fiscal managemen
t
Better fiscal managemen
t
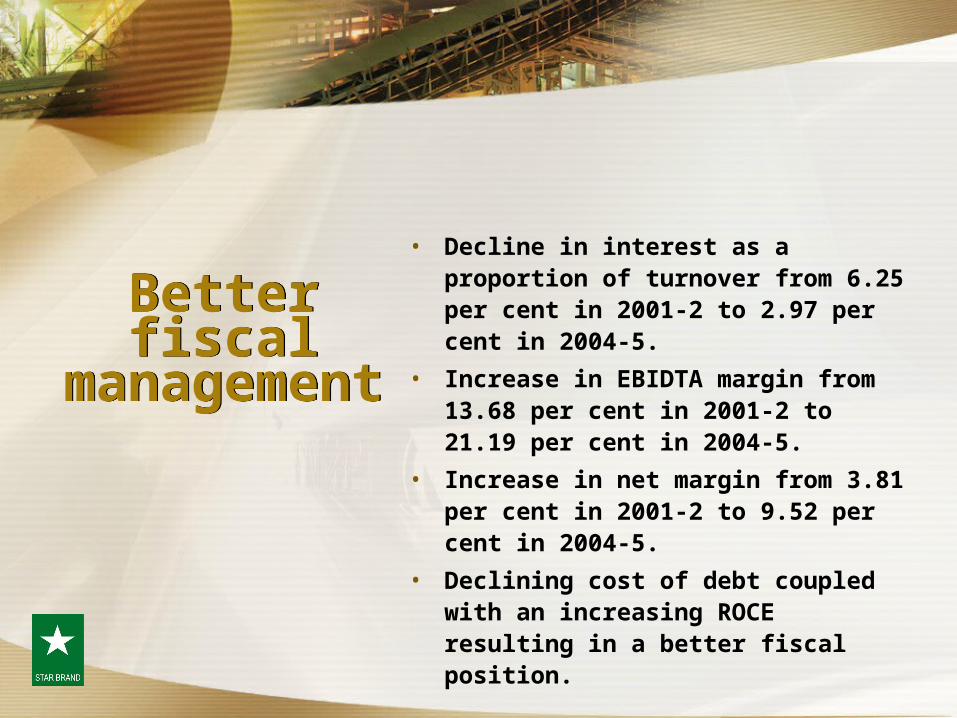
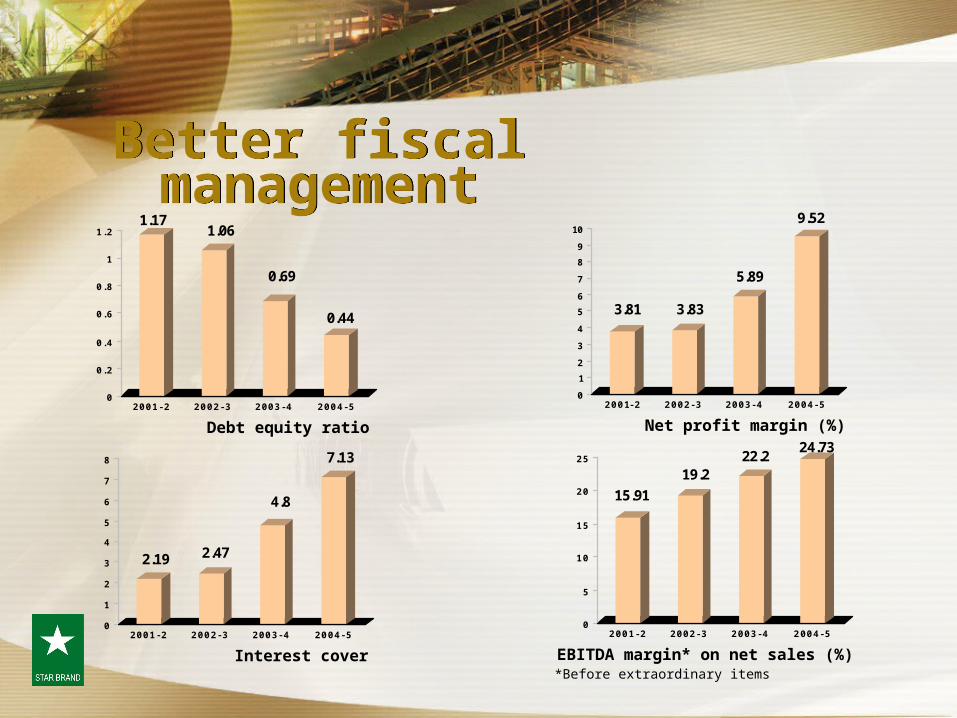
• Decline in interest as a proportion of turnover from 6.25 per cent in 2001-2 to 2.97 per cent in 2004-5.
• Increase in EBIDTA margin from 13.68 per cent in 2001-2 to 21.19 per cent in 2004-5.
• Increase in net margin from 3.81 per cent in 2001-2 to 9.52 per cent in 2004-5.
• Declining cost of debt coupled with an increasing ROCE resulting in a better fiscal position.
Better fiscal managementBetter fiscal management
2.19 2.47
4.8
7.13
0
1
2
3
4
5
6
7
8
2001-2 2002-3 2003-4 2004-5
Interest cover
3.81 3.83
5.89
9.52
0
1
2
3
4
5
6
7
8
9
10
2001-2 2002-3 2003-4 2004-5
Net profit margin (%)
15.91
19.222.2
24.73
0
5
10
15
20
25
2001-2 2002-3 2003-4 2004-5
EBITDA margin* on net sales (%)
1.171.06
0.69
0.44
0
0.2
0.4
0.6
0.8
1
1.2
2001-2 2002-3 2003-4 2004-5
Debt equity ratio
*Before extraordinary items
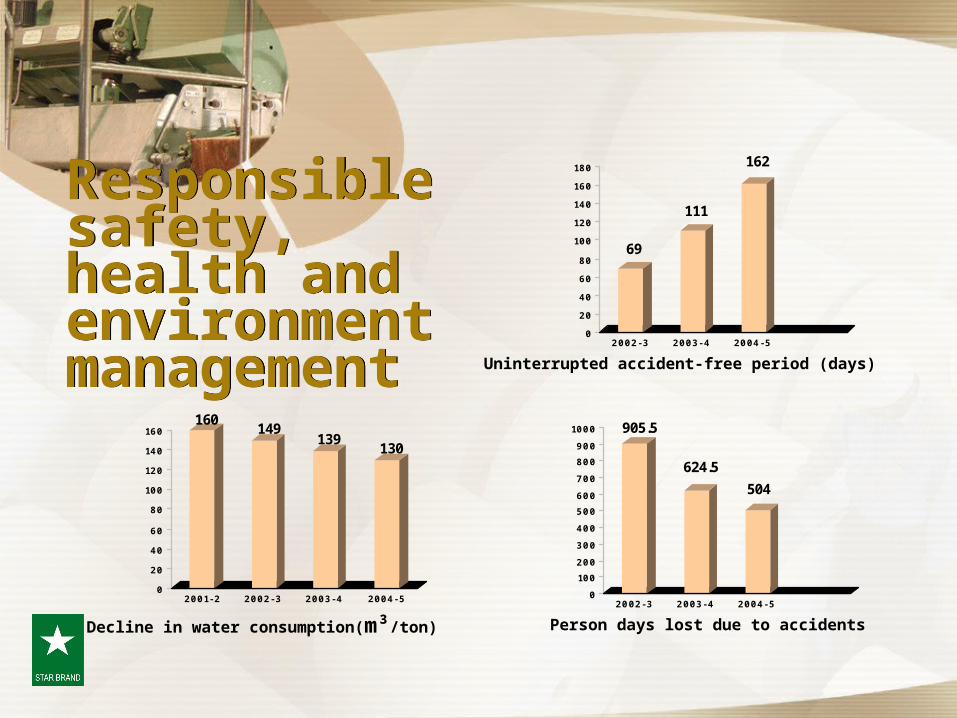
Responsible safety, health and environment management
Responsible safety, health and environment management
69
111
162
0
20
40
60
80
100
120
140
160
180
2002-3 2003-4 2004-5
Uninterrupted accident-free period (days)
905.5
624.5
504
0
100
200
300
400
500
600
700
800
900
1000
2002-3 2003-4 2004-5
Person days lost due to accidents
160149
139130
0
20
40
60
80
100
120
140
160
2001-2 2002-3 2003-4 2004-5
Decline in water consumption(m³/ton)
Looking ahead: Rs
85 cr modernizati
on cum expansion
Looking ahead: Rs
85 cr modernizati
on cum expansion
• Investment of Rs 85-cr in asset modernization, de-bottlenecking and co-generation.
• Investment in an increase in installed capacity from 71,350 TPA to 75,000 TPA.
• Investment in a 5 MW multi-fuel boiler to increase flexibility to switch to cheapest fuel.
Looking ahead: Rs
85 cr modernizati
on cum expansion
Looking ahead: Rs
85 cr modernizati
on cum expansion
• Investments dovetailed with a complete cash payback within about four years(approx).
• Phase One of these projects will be fully commissioned by July 2005, and the rest in phases by the end of 2006.
• Brief interruptions to integrate the projects staggered performance in the last quarter of 2004-5 and first quarter of 2005-6.
• CREP impact likely to result in capacity decline due to a number of small players unable to meet the new environment regulations.
• Increase in brownfield capacity to be offset by the projected decline in capacity as a result of the CREP impact.

• Low capacity investments and the emergence of a demand gap to lead to increased realisations.
• One of the few truly demand recession-neutral industries.
• Consistent year-on-year demand growth.• Influenced by price variations, but no
significant demand variations.• Speedy demand growth even in the face of
emergence of substitutes from time to time.
• Increase in literacy level in India from 52.21 % in 1991 to 65.38 % in 2001(taken from Census) – now expected to accelerate as a result of the levy of 2 % as education cess.
• Low capacity additions.
The Indian paper
industry: basis for optimism
The Indian paper
industry: basis for optimism

Star: points of optimismStar: points of optimism
• Effective backward linkages with farmers to secure increasing raw material availability.
• Prudent positioning in the industrial grades due to relatively low regional competition – only major paper mill in India in these grades.
• Industrial grades a strong proxy of the growing consumer and industry boom in India.
• Largely compliant with CREP requirements (2008), so no large capex foreseen on this account.

Star: points of optimismStar: points of optimism
• Demonstrated a resistance to industry cyclicality through a profit increase in every single year across the last four years.
• Modernisation cum expansion programme to reduce costs in a significant way and enhance production to 75,000 TPA from the second quarter of 2005-6.
• Erstwhile cash flow allocation towards debt reduction to be increasingly allocated towards capacity building and cost reduction.
Star: points of optimismStar: points of optimism
• Prospect of attractive growth in 2004-5 on account of three reasons: higher production, increased realisations. (increase announced in April and June 2005) and decline in production costs as a result of the modernisation.
• Prospect of sustained profit growth over the foreseeable future.
For any clarification, you may contact
Mr. Pankaj Virmani (Company Secretary)
Tel : 0132-2727731-35, 2731731-35