stars: space-time analysis of regional systemsstars-py.sourceforge.net/starsga.pdf · space-time...
TRANSCRIPT

STARS:
Space-Time Analysis of Regional Systems
Sergio J. Rey∗ Mark V. Janikas†
April 27, 2004
Abstract
Space-Time Analysis of Regional Systems (STARS) is an open sourcepackage designed for dynamic exploratory analysis of data measured forareal units at multiple points in time. STARS consists of four core analyt-ical modules: [1] ESDA: exploratory spatial data analysis; [2] Inequalitymeasures; [3] Mobility metrics; [4] Spatial Markov. Developed using thePython object oriented scripting language, STARS lends itself to threemain modes of use. Within the context of a command line interface (CLI),STARS can be treated as a package which can be called from within cus-tomized scripts for batch oriented analyses and simulation. Alternatively,a graphical user interface (GUI) integrates most of the analytical moduleswith a series of dynamic graphical views containing brushing and linkingfunctionality to support interactive exploration of the spatial, temporaland distributional dimensions of socioeconomic and physical processes. Fi-nally, the GUI and CLI modes can be combined for use from the Pythonshell to facilitate interactive programming and access to the many librariescontained within Python. This paper provides an overview of the designof STARS, its implementation, functionality and future plans. A selectionof its analytical capabilities are also illustrated that highlight the powerand flexibility of the package.Key Words: Space-time; geovisualization; geocomputation; distributionaldynamics; inequality.
1 Introduction
One of the active areas in the field of Geographic Information Sciences (GIS)is the development of new methods of exploratory spatial data analysis. Anumber of impressive efforts have recently appeared to provide researchers withpowerful tools for both geospatial statistical analysis, data mining, as well asgeovisualization. Well known efforts include the GeoDa environment (Anselin,
∗Department of Geography, San Diego State University, and Regional Economics Applica-tion Laboratory, University of Illinois
†Department of Geography, San Diego State University
1

2003), the GeoVista Studio (Takatsuka and Gahegan, 2002), Cartographic DataVisualizer (Dykes, 1995), SAGE (Haining et al., 2001) and the ArcView-XGobiproject (Symanzik et al., 1998).
A new addition to this field is the package STARS: Space-Time Analysisof Regional Systems. STARS is an open source environment written in Pythonthat supports exploratory dynamic spatial data analysis. Dynamic takes on twomeanings in STARS. The first reflects a strong emphasis on the incorporationof time into the exploratory analysis of space-time data. To do so, STARScombines two sets of modules, visualization and computation. The visualizationmodule consists of a family of geographical, temporal and statistical views thatare interactive and interdependent. That is, they allow the user to explorepatterns through various interfaces and the views are dynamically integratedwith one another, giving rise to the second meaning of dynamic spatial dataanalysis. On the computational front, STARS contains a set of exploratoryspatial data analysis modules, together with several newly developed measuresfor space-time analysis.
This paper provides the first detailed introduction to STARS and is or-ganized as follows. The motivation giving rise to the creation of STARS isdiscussed in the following section. A detailed overview of the analytical com-ponents of the package are presented in section 3. The capabilities of thesecomponents are then illustrated in a series of examples drawing from the studyof regional income dynamics in section 4. The paper closes with an outline offuture plans for the continued development of STARS.
2 Motivation
As is common with many open source packages, STARS was born out of aneed to scratch an itch. In this instance the itch was the lack of an integratedstatistical toolkit that supported the analysis of both the spatial and temporaldimensions of regional income growth and convergence. Regional convergenceor divergence has both temporal and spatial dimensions, and in studying theseprocesses researchers have relied on either spatial analysis (Rey and Montouri,1999) or time series methods (Carlino and Mills, 1993).1
To consider both dimensions jointly requires the use of two different sets oftools, yet with the existing software this meant having to switch between soft-ware packages. This turns out to be a rather awkward way to do exploratorydata analysis. It is clear that new tools are needed for an EDA toolkit thattruly integrates space and time. While the question of time in GIS has at-tracted much conceptual attention (Peuquet, 2002; Egenhofer and Golledge,1997), operational systems implementing both geocomputational and geovisu-alization components that also incorporate time are few in number.2 STARS isan attempt to fill this niche. Although the initial motivation for STARS was the
1For a recent overview of the empirical literature on spatial convergence see Rey and Janikas(2003).
2For an example of such a system focusing on geophysical data see Christakos et al. (2001).
2

study of regional income dynamics, the methods and tools it contains can beapplied to a wide set of socioeconomic or physical processes with data measuredfor areal units over multiple time periods.
3 Components and Design
It was decided in the genesis of the STARS project that the exploratory geo-computational methods and the visualization techniques used to express thembe developed separately. This facilitated the development of the STARS pack-age in a modular fashion which enables users to interact with the program in anumber of ways. First, the geocomputational and visualization modules can belinked to together in a user friendly interactive graphical interface. Second, theindividual modules can be used as a library and combined with scripts writtenin Python (or other scripting languages). The modularity also permits easyextension of STARS through the development of specialized modules. We re-turn to this issue later on. Next we discuss the two core modules of STARS,geocomputation and visualization.
3.1 Geocomputation
The methods used to explore the dynamics of space-time data have been brokeninto distinct categories, which are outlined in table 1. While STARS has many ofthe standard summary statistic capabilities that one would find in any numberof data analysis packages, it is its inherent ability to identify and analyze thespace-time characteristics of the data that makes it a unique environment.
STARS has focused on incorporating recent advances in the analysis of spa-tial dependence. Global measures of spatial autocorrelation are included forthe analysis of dependence over a region. The program also contains Local In-dicators of Spatial Autocorrelation (LISA’s) which give a more disaggregatedview at the nature of dependence (Anselin, 1995). These have been extendedto a dynamic context in a number of new empirical measures such as SpatialMarkov matrices, LISA Markov matrices, and indicators of spatial cohesion andflux introduced by Rey (2001).
A series of alternative computational categories that deal with inter/intradistributional dynamics are also contained in STARS. Measures such as Theil’sT (Theil, 1996) can be used to evaluate and decompose inequality over time andspace (See Rey, 2004a, for an illustration). STARS also incorporates enhancedmethods that identify various aspects of mobility within a distribution. Theseinclude spatially explicit rank correlation measures and regime based mobilitydecompositions introduced by Rey (2004b), as well as spatialized Gini coeffi-cients. All these new measures provide insights as to the role of spatial contextin the evolution of variable distributions over time and space.
STARS also provides a host of data and matrix utility functions. These canbe used to create new or transform existing variables as well as to constructalternative forms of spatial weights matrices, network representations of spa-
3

Table 1: Geocomputational Methods Contained in STARS
Category Description
Descriptive Statistics This category contains distribution and summarymeasures for variables by cross-section, time-period, or pooled.
Exploratory Spatial DataAnalysis
Includes various methods specifically designed toanalyze spatial dependence. Global and local ver-sions of Moran’s I, Geary’s c and the G statisticare provided.
Inequality Techniques that quantify and decompose inequal-ity over time and space. Includes classic and spa-tial Gini Coefficients as well as Theil decomposi-tion.
Mobility Recent advances in internal mobility dynamicsare presented through the τ and θ statistics.
Markov Analysis Transitional dynamics of distributional attributesare examined through the use of classic Markovand spatial Markov techniques.
tial structure and temporal covariance matrices. The latter allow for detailedinvestigation and comparison of the implied relationships between spatial obser-vations as reflected in various spatial weights matrices and those revealed fromthe temporal co-movement of variables for different cross-sectional units.
3.2 Visualization
A list of the visualization capabilities of the STARS module is presented inTable 2. STARS contains some views that are standard to an exploratory datapackage, however, the dynamic linking mechanisms enhance the users ability toanalyze data over various dimensions (see Section 4 for examples).
Some of the views are multidimensional by nature. The Conditional ScatterPlot can provide an additional facet to its traditional counterpart through acolor weighting scheme based on a requisite variable. This supports the use ofcategorical variables for regime based analysis and a simple time variable whichcan identify hidden evolutions.
The Time-Path Plot illustrates the pair-wise movement of two variablesand/or observations over time. This view is helpful in identifying levels of sta-bility across a given structural process. Individual aspects of the co-movementprogression can be dissected by interval gaps and distinct directional movements.
STARS also contains a series of maps which can be created and alteredthrough the use of various commands. Perhaps the most interesting extensionto basic mapping in the program involves the visualization of covariance matri-ces over space. The covariance structure of a variable is portrayed as a seriesof links between the centroids of each polygon. Positive correlations are colored
4
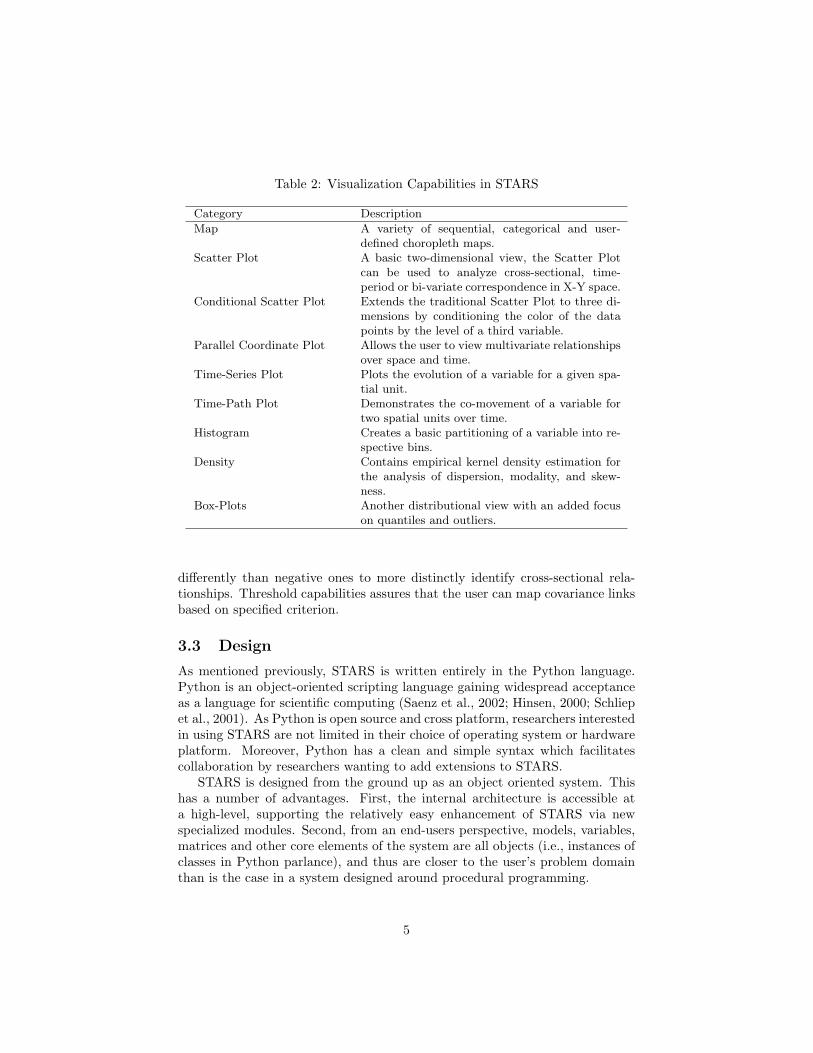
Table 2: Visualization Capabilities in STARS
Category Description
Map A variety of sequential, categorical and user-defined choropleth maps.
Scatter Plot A basic two-dimensional view, the Scatter Plotcan be used to analyze cross-sectional, time-period or bi-variate correspondence in X-Y space.
Conditional Scatter Plot Extends the traditional Scatter Plot to three di-mensions by conditioning the color of the datapoints by the level of a third variable.
Parallel Coordinate Plot Allows the user to view multivariate relationshipsover space and time.
Time-Series Plot Plots the evolution of a variable for a given spa-tial unit.
Time-Path Plot Demonstrates the co-movement of a variable fortwo spatial units over time.
Histogram Creates a basic partitioning of a variable into re-spective bins.
Density Contains empirical kernel density estimation forthe analysis of dispersion, modality, and skew-ness.
Box-Plots Another distributional view with an added focuson quantiles and outliers.
differently than negative ones to more distinctly identify cross-sectional rela-tionships. Threshold capabilities assures that the user can map covariance linksbased on specified criterion.
3.3 Design
As mentioned previously, STARS is written entirely in the Python language.Python is an object-oriented scripting language gaining widespread acceptanceas a language for scientific computing (Saenz et al., 2002; Hinsen, 2000; Schliepet al., 2001). As Python is open source and cross platform, researchers interestedin using STARS are not limited in their choice of operating system or hardwareplatform. Moreover, Python has a clean and simple syntax which facilitatescollaboration by researchers wanting to add extensions to STARS.
STARS is designed from the ground up as an object oriented system. Thishas a number of advantages. First, the internal architecture is accessible ata high-level, supporting the relatively easy enhancement of STARS via newspecialized modules. Second, from an end-users perspective, models, variables,matrices and other core elements of the system are all objects (i.e., instances ofclasses in Python parlance), and thus are closer to the user’s problem domainthan is the case in a system designed around procedural programming.
5

In addition to being object oriented in design, STARS is also highly modu-larized. The geocomputational and visualization modules are orthogonal, thatis, they can be used independently of one another, or they can be combineddepending on the demands of a particular project. This modularity permits theuse of STARS in three different modes. The first is the GUI mode, where thetwo sets of modules are tightly integrated. Here the user accesses the analyticalcapabilities from a series of menu items as displayed in Figure 1. This mode iswell suited to researchers wanted to apply exploratory space-time data analysisto a substantive problem.
Figure 1: STARS in GUI Mode
The second mode uses a command line interface (CLI) in which the compu-tational module can be called directly from the Python interpreter. An exampleof such use is seen in Figure 2. This supports very efficient interactive compu-tation, similar to that found in other data analysis environments such as R(R Development Core Team, 2004). This mode also supports the wrapping ofSTARS modules inside larger Python programs to implement simulation pro-grams through batch processing.3
STARS can also be used in a combined CLI+GUI mode as shown in Figure3. In this mode the user has access to the Python interpreter via the terminalwindow (upper left) and can create views either from that interpreter, or fromthe GUI (upper right). Results of interactive commands entered in the shell arereported in the text area of the GUI.
3An example of such an application is reported in Rey (2004a).
6

Figure 2: STARS in Command Line Interface Mode
7

Figure 3: STARS in CLI+GUI Mode
4 Illustrations
In this section a subset of the graphical and analytical capabilities of STARSare highlighted drawing on examples from regional income convergence studies.STARS stresses the need to study multiple dimensions underling the data usedin exploratory analysis. An illustration of this is provided in Figure 4 whichcontains four different views of data on US regional incomes for the lower 48states. The upper left view is a quintile map for incomes in 1929. Next tothis is the Moran scatterplot (Anselin, 1995), indicating strong positive spatialautocorrelation. Below the scatterplot, a histogram provides an a-spatial viewof the income distribution, while the view to the left of the histogram portraysthe time series for the global Moran statistic for the years 1929-2000. The latterfigure reveals that the level of spatial clustering fluctuates substantially overtime.
4.1 Linking and Brushing Views
In addition to providing views of the different dimensions (time, space, distri-bution), the views in STARS are also interactive. Interactivity can take onmultiple forms. The first is linking in which the selection of observations in anorigin view leads to the highlighting of associated observations in other desti-nation views. An example of this can be seen in 5, where the selection occurson the origin view (map) using a rectangle created and sized with the mouse.
8

Figure 4: Multiple Views of US Per Capita Income Data
When the user releases the mouse button, the polygons underneath the selectionrectangle are selected and observations associated with these selected polygonsare then highlighted in the three destination views.4
The second form of interaction is brushing which is illustrated in Figure 6.Here observations are selected in the same fashion as with linking, however theimpact of the selected set is different, and results in a re-fitting of the globalautocorrelation trend in the scatterplot to omit the states selected on the map.This provides insights as to the leverage of the selected states on the level ofspatial clustering for that time period.
4.2 Space-Time Traveling and Roaming
Linking and brushing can also be combined with a third form of interaction re-ferred to as roaming. Here the selection rectangle remains on the screen and theuser can move it around the origin view, as is reflected in Figure 7. Movementof the selection rectangle create a new selection set of observations on the originview and trigger the corresponding interaction signal (brushing or linking) onthe destination views.
Similar to roaming, linking and brushing can also be combined with trav-eling. Traveling on an origin view selects observations in a sorted order andtriggers linking or brushing on the destination views. The traveling is doneautomatically over the entire set of observations on the origin view, giving the
4The selection rectangle is not seen in 5 as it is erased upon completion of the selection.
9

Figure 5: Linking Multiple Views
Figure 6: Brushing Multiple Views
10

Figure 7: Roaming a Map with Brushing
user a full depiction of the particular type of interaction (linking or brushing).An example of this is shown in Figure 8 which combines cumulative brushingon the scatterplot and boxplot resulting from spatial traveling on the map.
Traveling can also be done on a time series view to trigger temporal updatingof destination views. The traveling proceeds from earliest period to the latestperiod given the user views of all destination views for each time period inthe sample. Alternatively, the user can control the the temporal updating byswitching to roaming on a time series view. This is illustrated in Figure 9where the vertical selector has been moved over the year 1990. Again the threedestination views (scatterplot, map and boxplot) are updated to this year, whichreveals an outlier in the boxplot. The user then selects that outlier observationon the boxplot to trigger linking on the destination views (map, time series,scatterplot) to reveal that the outlier observation is Connecticut.
The combination of linking and brushing with either space-time roamingor traveling provides a powerful approach to exploratory visualization that canreveal patterns that otherwise would be very difficult to detect. An example ofthis can be seen in Figure 10 where a conditional scatterplot in the lower rightcorner is used to combine the Moran scatterplots from each year in a singleview. The observations on each state’s income and that of its spatial lag arethen conditioned on a third variable, in this case Time, and the conditioninguses color depth to indicate early (light color) versus more recent (dark color)observations. The conditioning reveals that the dispersion in state incomes hasdeclined substantially over time. The figure also reflects the result of the user
11

Figure 8: Spatial Traveling with Brushing
Figure 9: Time Roaming
12

selecting Illinois on the map to trigger linking in the destination views. The own-lag pairs for all time periods for Illinois are then highlighted in the conditionalscatterplot to reveal that the spatial dynamics between Illinois and its neighborshave been qualitatively and quantitatively different from the overall space-timedynamics in the US space economy.
Figure 10: Space-Time Instabilities
4.3 View-Generated-Views
The view interactivity can be exploited to more fully explore these space-timeinstabilities depicted in the conditional scatterplot. While the latter shows thatIllinois and its geographical neighbors have income dynamics moving in differentdirections, additional insights on these dynamics can be obtained by the usercombining a key press (control) with a mouse-click on the Illinois specific obser-vation in the Moran scatterplot which generates a new view called a TimePathas shown in Figure 11. The TimePath shows the co-movement of Illinois percapita income and its spatial lag of per capita income for all time periods withsubsequent time periods linked together.
The ability to generate new views through user actions on existing viewsoffers a powerful exploratory device. View-generated-views can also be obtainedfrom a map origin view as seen in Figure 12, where the user has issued thesame selection event on Illinois in the map to generate the time series view ofrelative income for Illinois. This isolates the dynamics of Illinois income fromthe co-movement dynamics in the TimePath, in a similar manner to the way the
13

Figure 11: Scatterplot Generated TimePath
co-movement dynamics for Illinois were isolated in the TimePath from the fullset of state-lag co-movement dynamics depicted in the conditional scatterplot.
4.4 Distributional Dynamics
In addition to exploring spatial and temporal dimensions via view interactivity,the distributional dynamics can also be examined. One approach is displayedin Figure 13 in which two densities for state relative per capita incomes aredisplayed, one for the beginning of the period (1929) one for the last year ofthe sample (2000). To explore the movement of individual economies within theincome distribution the user can trigger spatial traveling on the map serving asthe origin view. This then highlights each state (from lowest income to highestincome) on the map and identifies the positions of that state in the initial andterminal income densities. As the traveling is done automatically for the entireset of spatial units, the user sees the full extent of distributional dynamics.Following the automated traveling, the user can then select individual states onthe map to isolate on their mobility characteristics. This is shown for Virginiawhich initially was a relatively poor economy but has shown substantial upwardmovement in the income distribution.
4.5 Spatial and Temporal Dependencies
In addition to providing dimension specific views, such as a TimePath, or box-plot or quintile map, STARS enables the depiction of multiple dimensions on
14

Figure 12: Map Generated Time Series
Figure 13: Distributional Mixing
15
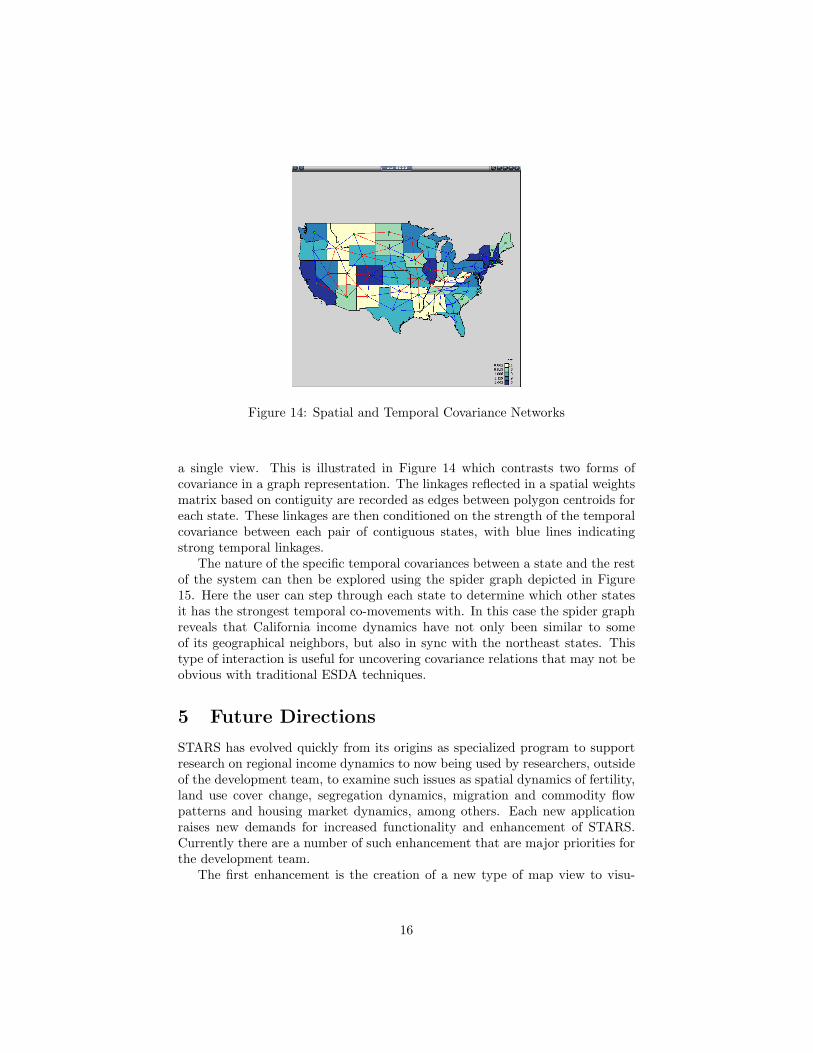
Figure 14: Spatial and Temporal Covariance Networks
a single view. This is illustrated in Figure 14 which contrasts two forms ofcovariance in a graph representation. The linkages reflected in a spatial weightsmatrix based on contiguity are recorded as edges between polygon centroids foreach state. These linkages are then conditioned on the strength of the temporalcovariance between each pair of contiguous states, with blue lines indicatingstrong temporal linkages.
The nature of the specific temporal covariances between a state and the restof the system can then be explored using the spider graph depicted in Figure15. Here the user can step through each state to determine which other statesit has the strongest temporal co-movements with. In this case the spider graphreveals that California income dynamics have not only been similar to someof its geographical neighbors, but also in sync with the northeast states. Thistype of interaction is useful for uncovering covariance relations that may not beobvious with traditional ESDA techniques.
5 Future Directions
STARS has evolved quickly from its origins as specialized program to supportresearch on regional income dynamics to now being used by researchers, outsideof the development team, to examine such issues as spatial dynamics of fertility,land use cover change, segregation dynamics, migration and commodity flowpatterns and housing market dynamics, among others. Each new applicationraises new demands for increased functionality and enhancement of STARS.Currently there are a number of such enhancement that are major priorities forthe development team.
The first enhancement is the creation of a new type of map view to visu-
16

Figure 15: Spider Graph of Temporal Covariance Networks
alize substantive flows between cross-sectional observations.5 There has beena growing interest in the extension of flow maps to include temporal-spatialdynamics which we believe STARS is quite posed to introduce. In short, thegoal of this extension is to demonstrate how flows between cross-sectional unitsevolve over time. Although often used to study migration, the notion of flowsis by no means confined to the movement of people. Flows of commodities, forexample, could be considered a driver for many socioeconomic processes, andthe inclusion of which could present some interesting research avenues; such asthe covariation between these flows and economic growth, and the constructionof hybrid weight matrices based on spatial constructs coupled with a-spatialflow linkages.
Another analytical front for the STARS module is cluster analysis. Althoughsome basic forms of spatial clustering are identifiable by a number of graphs andmaps produced in the current version of STARS, more analytical features ona-spatial cluster analysis seem a fruitful avenue for future work. The researchteam has an extensive body of code implementing agglomerative, partitive andmedoid clustering methods written in variety of languages (R, Octave, Python)in support of on-going research on industrial cluster analysis (Rey and Mattheis,2000; Rey, 2000a,b,c,d,e, 2002). The integration of these methods in STARS iscurrently underway.
We are also exploring new approaches towards recasting conventional mea-sures of distributional dynamics, such as the so called σ-convergence measure,to incorporate spatially explicit dimensions (Rey and Dev, 2004). Coupled withthis is work on developing inferential methods for new space-time empirics basedon both analytical distributions as well as computationally based approaches.
5See Tobler’s Flow Mapper at http://csiss.ncgia.ucsb.edu/clearinghouse/FlowMapper/ fora program designed for the sole purpose of studying flows.
17

STARS is a powerful environment for exploring data that has both temporaland spatial dimensions. The interactivity of the various views helps to identifydependencies across various dimensions that may otherwise go unnoticed. Theseviews are also tied to a suite of recently developed advanced methods for ESDAand ESTDA. Moreover, STARS has been designed for users with a wide range ofdemands and skill-sets. Researchers looking for a user-friendly GUI environmentfor exploratory space-time analysis should feel at home with STARS. Others whoare developing new methods for exploratory analysis can easily integrate theseinto the modular framework underlying STARS. In between these two groupsare researchers comfortable with writing simple macro type scripts (in Python)to use STARS for simulation experiments as well as for linkages with othermodel systems and statistical packages. We hope this design together with thecommitment to the open source development model will attract researchers tocollaborate on the enhancement and future development path of STARS.
References
Anselin, L. (1995). Local indicators of spatial association-LISA. GeographicalAnalysis, 27:93–115.
Anselin, L. (2003). An introduction to EDA with GeoDa. Technical report,Spatial Analysis Laboratory, University of Illinois.
Carlino, G. A. and Mills, L. O. (1993). Are U.S. regional incomes converging?A time series analysis. Journal of Monetary Economics, 32:335–346.
Christakos, G., Bogaert, P., and Serre, M. (2001). Temporal GIS. Springer,New York.
Dykes, J. (1995). Pushing maps past their established limits: a unified approachto cartographic visualization. In Innovations in GIS, pages 177–187. Taylorand Francis, London.
Egenhofer, M. J. and Golledge, R. G. (1997). Spatial and Temporal Reasoningin Geographic Information Systems. Oxford University Press, New York.
Haining, R., Wise, S., and Ma, J. (2001). Providing spatial statistical dataanalysis functionality for the GIS user: the SAGE project. InternationalJournal of Geographical Informtion Science, 15:230–54.
Hinsen, K. (2000). The molecular modeling toolkit: A new approach to molec-ular simulations. Journal of Computational Chemistry, 21:79–85.
Peuquet, D. J. (2002). Representations of Space and Time. Guilford, New York.
R Development Core Team (2004). R: A language and environment for statis-tical computing. R Foundation for Statistical Computing, Vienna, Austria.ISBN 3-900051-00-3.
18

Rey, S. J. (2000a). Identifying regional industrial clusters in California: VolumeII methods handbook. Technical Report. California Employment Develop-ment Department. Sacramento.
Rey, S. J. (2000b). Identifying regional industrial clusters in California: VolumeIII technical documentation of the state’s candidate industry clusters. Tech-nical Report. California Employment Development Department. Sacramento.
Rey, S. J. (2000c). Identifying regional industrial clusters in California: VolumeIV The role of industrial clusters in California’s economic recent economicexpansion. Technical Report. California Employment Development Depart-ment. Sacramento.
Rey, S. J. (2000d). A structural economic analysis of the biotechnology clusterin the San Diego Economy. Working paper, San Diego State Univeristy.
Rey, S. J. (2000e). A structural economic analysis of the visitors industry clusterin the San Diego Economy. Working paper, San Diego State Univeristy.
Rey, S. J. (2001). Spatial empirics for regional economic growth and conver-gence. Geographical Analysis, 33(3):195–214.
Rey, S. J. (2002). Identifying regional industrial clusters in Imperial CountyCalifornia. Technical Report. California Center for Border and RegionalEconomic Studies.
Rey, S. J. (2004a). Spatial analysis of regional income inequality. In Goodchild,M. and Janelle, D., editors, Spatially Integrated Social Science: Examples inBest Practice, pages 280–299. Oxford University Press, Oxford.
Rey, S. J. (2004b). Spatial dependence in the evolution of regional income distri-butions. In Getis, A., Mur, J., and Zoeller, H., editors, Spatial Econometricsand Spatial Statistics. Palgrave, Hampshire. Forthcoming.
Rey, S. J. and Dev, B. (2004). σ-convergence in the presence of spatial effects.Paper presented at the Western Regional Science Association Meetings. Maui,HA.
Rey, S. J. and Janikas, M. V. (2003). Convergence and space. Paper presented atthe 50th Annual Meetings of the Regional Science Association International.
Rey, S. J. and Mattheis, D. J. (2000). Identifying regional industrial clustersin California: Volume I conceptual design. Technical Report. California Em-ployment Development Department. Sacramento.
Rey, S. J. and Montouri, B. D. (1999). U.S. regional income convergence: Aspatial econometric perspective. Regional Studies, 33:143–156.
Saenz, J., Zubillaga, J., and Fernandez, J. (2002). Geophysical data anaylsisusing Python. Computers and Geoscience, 28:475–465.
19
Schliep, A., Hochstattler, W., and Pattberg, T. (2001). Rule-based animation ofalgorithms using animated data structures in gato. Technical report, Zentrumfur Angewandte Informatik Koln, Arbeitsgruppe Faigle/Schrader.
Symanzik, J., Kotter, T., Schmelzer, S., Klinke, S., Cook, D., and Swayne, D. F.(1998). Spatial data analysis in the dynamicall linked ArcView/XGobi/Xploreenvironment. Computing Science and Statistics, 29:561–569.
Takatsuka, M. and Gahegan, M. (2002). GeoVista Studio: A codeless visualprogramming environment for geoscientific data analysis and visualization.Journal of Computers & Geosciences, 28:1131–1144.
Theil, H. (1996). Studies in Global Econometrics. Kluwer Academic Publishers,Dordrecht.
20