statcom estimation using back-propagation, pso, shuffled
TRANSCRIPT

Research ArticleSTATCOM Estimation Using Back-Propagation PSOShuffled Frog Leap Algorithm and Genetic Algorithm BasedNeural Networks
Hamed Atyia Soodi and Ahmet Mete Vural
Electrical and Electronics Engineering Department University of Gaziantep Sahinbey 27310 Gaziantep Turkey
Correspondence should be addressed to Hamed Atyia Soodi hamedelec77gmailcom
Received 18 October 2017 Revised 28 February 2018 Accepted 21 March 2018 Published 26 April 2018
Academic Editor Carlos A V Sakuyama
Copyright copy 2018 Hamed Atyia Soodi and Ahmet Mete Vural This is an open access article distributed under the CreativeCommons Attribution License which permits unrestricted use distribution and reproduction in any medium provided theoriginal work is properly cited
Different optimization techniques are used for the training and fine-tuning of feed forward neural networks for the estimation ofSTATCOM voltages and reactive powers In the first part the paper presents the voltage regulation in IEEE buses using the StaticCompensator (STATIC) and discusses efficient ways to solve the power systems featuring STATCOM by load flow equations Theload flow equations are solved using iterative algorithms such as Newton-Raphsonmethod In the second part the paper focuses onthe use of estimation techniques based on Artificial Neural Networks as an alternative to the iterative methods Different trainingalgorithms have been used for training the weights of Artificial Neural Networks thesemethods include Back-Propagation ParticleSwarm Optimization Shuffled Frog Leap Algorithm and Genetic Algorithm A performance analysis of each of these methods isdone on the IEEE bus data to examine the efficiency of each algorithm The results show that SFLA outperforms other techniquesin training of ANN seconded by PSO
1 Introduction
The power systems are the backbone of any countryrsquos eco-nomic and social sectors without which a country cannotexcel in the industrial and social development But thepower systems face the ever-growing load demand as moreindustrial and housing units are established which makesthe job of power system managing challenging Recentlythe increase of nonlinear loads has badly affected the powerquality due to inherent voltage fluctuations in these types ofloads and has also raised question on the long-term stabilityof the power systems and their associated instruments [12] Hence more research studies have been dedicated toimproving the power quality and efficiency through variety ofdifferent techniques The total power in the system containsboth real and reactive power which implies that if the reactivepower of the system is improved the overall system canbenefit from this improvement
A family of different devices which can control thereactive power at designated buses is given the name FlexibleAC Transmission Systems (FACTS) These devices have thecapability to dynamically adjust different system parametersto enhance the performance and quality [2] The FACTS areactually controllers which can improve the system stabilityin terms of voltages reactive power and phase angles in thesteady-state operation One of the important FACTS deviceswhich we have focused on in this research is called the StaticSynchronous Compensator (STATCOM) A STATCOM isused to control the bus voltage or reactive power injec-tionabsorption at the bus and is connected in shunt with thedesignated bus
The STATCOM when used as a voltage regulator drawscontrollable reactive currents from the buses Since it is anexpensive device the selection of the optimal bus for theinstallation is of prime importanceWhen installed at an ideal
HindawiComputational Intelligence and NeuroscienceVolume 2018 Article ID 6381610 17 pageshttpsdoiorg10115520186381610
2 Computational Intelligence and Neuroscience
location the STATCOM can improve the efficiency of thepower systems significantly [3ndash6] However the STATCOMmust be installed on a load bus only since the generatorbuses do not need voltage regulation [7ndash9] Several authorshave reported the use of STATCOM for the voltage andreactive power regulation with different configurations Forexample in larger power systems involving hundreds ofbusesmultipulse inverters based controllers are used becausethey provide lower harmonic distortion [5 10 11]
The planning implementation control andmaintenanceof power systems initiate with the power flow calculationswhich constitute the crux of any power system Over the pastfew decades many different solutions have been proposedfor the load flow problems The most important of thesetechniques have been reviewed in [12] At any instant thepower systems experience varying operating conditions andthe power flow calculations ensure that the operation of thesystem is within the bounds of the stability criterion Thepower flow equations are complex nonlinear algebraic equa-tions which are usually written in computer programs whichare run over the course of the operation for dynamic analysisUsually these equations are solved in multiple iterations andhence require substantial processing and memory require-ments [13 14] One of the primary methods used for thesolutions of nonlinear equations is Newton-Raphsonmethod[15] which is widely known for its quadratic convergencefeatures However the conventional load flow studies donot account for the presence of STATCOM device(s) in thesystem and hence the method must be redesigned for theSTATCOM buses In this paper we have briefly explainedthe method to modify the existing load flow equationsto incorporate the STATCOM parameters such as reactivepowers and voltage sources using Newton-Raphson methodas done in [16] Many research studies have been dedicated tothe development of modifiedmodels for the STATCOM suchas [16ndash19]
Despite all the benefits of Newton-Raphson methodthis method is a complex one and requires large memoryand processing capabilities In real time power systemspower systems analysis including economic load dispatchmust be done as frequently as every 5 to 15 minutes [20]which becomes very difficult with classical mathematicalapproaches The situation is further aggravated as the hugepower systems undergo parameters shifting very rapidly Inorder to tune the control parameters of STATCOM the NRmethod needs to be run countless times in a system asthe system passes through different operational states Thismakes the whole calculations hectic and time-consumingWe propose an alternative approach to this method whichis based on machine learning algorithms More specificallywe propose the use of Artificial Neural Network (ANN) forestimating the STATCOMparameters such as voltages phaseangles and reactive powers ANN is a very powerful toolwhich can be used for the data fitting operations as wellas classification problems ANN has been successfully usedin different fields [21] which involve use of datasets suchas medical and biomedical applications [22ndash24] businessfinance stock markets and foreign exchange [25ndash28] andpower applications [29 30] The ANN can be trained to
capture the nuances in the input data and to produceestimated outputs accordingly which in this case would bethe estimated voltages and reactive powers The ANN can beused efficiently in real time power systems to do the load flowanalysis much faster than the NRmethod thus saving cost ofcomputation power andmaking shrewd decisions at the rightmoment
Three separate ANNs have been developedwhich take thereal and reactive powers of the STATCOM bus and predictthree different outputs First ANN is used to estimate thevoltage magnitude and the second uses ANN to find phaseangle of the STATCOM bus while the third and last ANN isused to estimate the reactive power of the STATCOM bus Inorder to generate a data set of real and reactive powers of theSTATCOM bus the real and reactive powers of all the loadbuses in the system were perturbed by gradually increasingtheir values and the corresponding voltages angles andreactive powers at the output were recordedThis data is thenfed to both of the ANNs for their respective tasks
Usually the Back-Propagation (BP) method is the pri-mary method for training the neural networks howeverthis method is prone to get stuck in the local minima andalso experiences slower convergence rate towards the optimalsolution [33] Alternative approach to the training of neuralnetwork for the optimal weight setting is to usemetaheuristictechniques to avoid local minima and slow convergenceproblems We have used multiple metaheuristic techniquesin this study to tune the weights of the ANN with promisingresults A survey of different randomized techniques for thetraining of neural networks is presented in [34] First one isthe Particle Swarm Optimization technique which is basedon stochastic optimization This technique is based on themimicking of social behavior of swarm of birds flying overan area in search for food The birds represent the solutionsand the total area over which the birds are flying is the searchspace while the food represents the optimal solution in thewhole search space [35] PSO performs better than Back-Propagation for training the neural network in terms of rate ofconvergence [36ndash38] PSO can be applied to improve variousaspects of the neural network such as weights assigned todifferent layers and the number of layers Several works inliterature have used PSO for the purpose of training neuralnetworks including [38] which has used neural network fornonlinear channel equalization In [39] PSO trained neuralnetwork is used to predict structure failure in multistoriedRC buildings Similarly [40] presents a review of differentPSO trainedANNswhich are used inwind energy systems In[26] PSO based neural networks are used for the forecastingof foreign exchange rates Another effort is the use of PSOtrained neural network in ground water management whichis used to minimize the operational cost of pumps andpipelines connected to the wells [41] In geology PSO basedANN is used to estimate the compressive strength of rocksamples [42]
Furthermore we have also applied Shuffled FrogLeap Algorithm (SFLA) [43] for parameter tuning of theANN SFLA is another memetic algorithm inspired bythe cooperative search metaphor of frogs The population(solutions) called frogs is divided into different memeplexes
Computational Intelligence and Neuroscience 3
each carrying its own meme The frogs search for localoptima in each memeplex using an evolution method whichis comparable to the PSO In the next stage the frogs arereshuffled to likely a different memeplex based on theirglobal ranking which is comparable to the shuffled complexevolution algorithm This ensures that global optima isachieved by the frogs The SFLA has been proved to be aneffective tool in the optimization problems There are severalexamples of using SFLA for the training of different typesof neural networks such as [44] which uses SFLA to trainneural networks which are used in channel equalization andestimation problem Similarly [45] has used SFLA to proposethree novel techniques for scheduling problem The authorssolve multiprocessor problem in grid environment by usingSFLA directly followed by training the ANN and RadialBasis Function Neural Network (RBFNN) using SFLA SFLAis also used in acoustics such as [46] which has trainedwavelet neural network to locate the source of acousticemission in rotating machinery to diagnose the friction faultsource In [47] the authors have proposed a combination ofImproved SFLA (ISFLA) and Back-Propagation to train theneural network to diagnose early faults in rolling bearings
At last but not the least Genetic Algorithm [48] isalso applied for the parameter tuning of the ANN GeneticAlgorithm is another efficient method of optimization whichhas been vastly used for different problems pertaining to theoptimization of different parameters Genetic Algorithm isbased on the Darwinian concept of survival and involvesnatural selection and natural geneticsThe algorithm consistsof binary strings which are evolved during the run on thebasis of their probabilities and minimal cost The algorithmconsists of certain operations such as mutation crossoverand reproduction Genetic Algorithm is used in literatureto provide training to the neural network parameters Thisincludes [49] which has usedGAbasedANN tomodel slumpof Ready Mix Concrete (RMC) based on its five ingredientsA combination of GA and ANN is used in [50] to solve theinverse kinematics problem of a six-joint Stanford roboticmanipulator The authors have used three different networkstraining networks using different training sets Time seriesforecasting is an efficient way to analyze the impact of futuredecisions both in organizational and individual capacitiesThe time series has been forecasted using GA based ANN in[51] where automatic design of Artificial Neural Networks(ADANN) is used In [52] GA and ANN have been usedto model and optimize the removal of methylene blue usingactivated carbon
In terms of similar work that is the use of Newton-Raphson and ANN for estimation of different parameters ofpower systems there are several instances For example [53]has used PSO tunedANN to estimate operating conditions ofthe STATCOM Specifically the authors have developed twoseparate neural networks to estimate the STATCOM voltageand reactive power Both the neural networks are trainedusing PSOThe authors perturbed the real and reactive pow-ers to produce larger dataset used Newton-Raphson methodto calculate the voltages and reactive powers and used ANNto estimate voltages and reactive powers Quite similarly theauthors of [54] have presented an optimal power flow study
using twomethods Newton-Raphson based iterativemethodand Back-Propagation ANN The outputs to be estimatedinclude voltages amplitudes phases and other parameters
Further works include [55] which has used ANN forthe calculation of causation of anomalies in input data onthe outputs in power systems Specifically ANN is used tocalculate the state of power system based on the input datawhich is taken as the real and reactive powers while theoutputs are upper and lower limits of voltage magnitudesand phase angles In [56] the proper size of STATCOMis calculated in both normal and contingency cases usingNewton-Raphson method
2 Modeling of Power Systems
Each power system consists of several buses interconnectedwith each other through transmission lines The buses caneither be load or generator buses The interconnection ofdifferent buses can be represented by the admittance matrixor the119884-matrixThe119884-matrix is a better representation of thetransmission lines because most of the entries in this matrixare zero as compared to the reactance matrix However the119884-matrix does not incorporate the admittances associatedwith the load connected to the buses and STATCOM con-troller This representation is shown in Figure 1 The steady-statemodel of the system is represented by the static load flowequations for the real and reactive powers of the buses alongwith the equality constraints of the transmission networkThe static load flow equations of a specific bus are written interms of voltage magnitudes and phase angles of all the busesconnected to this busThat is the load flow equations for real(119875119894) and reactive power (119876119894) of bus ldquo119894rdquo are written as
119875119894 = 119873sum119895=1
10038161003816100381610038161198811198941003816100381610038161003816 1003816100381610038161003816100381611988111989510038161003816100381610038161003816 1003816100381610038161003816100381611988411989411989510038161003816100381610038161003816 cos (120575119894 minus 120575119895 minus 120579119894119895)
119876119894 = 119873sum119895=1
10038161003816100381610038161198811198941003816100381610038161003816 1003816100381610038161003816100381611988111989510038161003816100381610038161003816 1003816100381610038161003816100381611988411989411989510038161003816100381610038161003816 sin (120575119894 minus 120575119895 minus 120579119894119895) (1)
In these equations |119881119894| is the magnitude of the voltage at busldquo119894rdquo and |119881119895| is the voltage magnitude of ldquo119895thrdquo bus connectedto the bus ldquo119894rdquo while ldquo120575rdquo represents the corresponding phaseangle of the voltage and 119873 is the total number of buses inthe system |119884119894119895| and 120579119894119895 are magnitude and phase angle of theadmittance between buses ldquo119894rdquo and ldquo119895rdquo 119884119894119895 can be calculatedfrom the admittance matrix 119884Bus of the bus system which isgiven as
119884Bus =[[[[[[[[[[
11988411 11988412 11988413 sdot sdot sdot 119884111987311988421 11988422 11988423 sdot sdot sdot 119884211987311988431 11988432 11988433 sdot sdot sdot 1198843119873 d
1198841198731 1198841198732 1198841198733 sdot sdot sdot 119884119873119873
]]]]]]]]]]
(2)
4 Computational Intelligence and Neuroscience
Power Systemwith STATCOM
Generator
Generator
Generator
LOA
D
LOA
D
LOA
D
STAT
COM
Figure 1 A power system representation with STATCOM
Here 119884119883119884 = minus119910119883119884 is the negative of line admittance frombus 119909 to bus 119910 containing the real and imaginary part 119910119883119884 iscalculated as
119910119883119884 = 1119877 + 119895 1119883 = 119866 + 119895119861 (3)
where ldquo119866rdquo is the conductance of the line and ldquo119861rdquo is thesusceptance (119877 and 119883 being the resistance and reactance)The self-admittance terms 119884119883119883 can be calculated as
119884119883119883 = 1199101198830 + 1199101198831 + 1199101198832 + sdot sdot sdot + 119910119883119883minus1 + 119910119883119883+1 + sdot sdot sdot+ 119910119883119873 (4)
For each of the load busses there are two equations forthe corresponding real and reactive powers while there arefour unknown variables of voltages and phase angles Hencethese equations need to be solved using nonlinear iterativemethodsThemost commonmethod is theNewton-Raphsonmethod which requires the Jacobian of the equations TheJacobian of the above equations can be represented as
[1198691 11986921198693 1198694][Δ120575Δ |119881|] = [
Δ119875Δ119876] (5)
In the above equation sub-Jacobian entries are defined as1198691 = 120597119875120597120575 1198692 = 120597119875120597|119881| 1198693 = 120597119876120597120575 and 1198694 = 120597119876120597|119881|With the addition of STATCOM the equations of the busconnected to the STATCOM are slightly modified which arepresented and justified in the next section
3 Power Systems with STATCOM
As mentioned in the introduction the purpose of the STAT-COM is to regulate the voltage and reactive powers of thepower systems Hence the STATCOM has two modes
(i) Voltage regulation in this mode the STATCOMis used to regulate the reactive power by injecting
Vk =Vk
k
IpPp + jQp
Zp = Rp + jXp Yp = 1Zp
Yp =Yp
p = Gp + jBp
minus
+
Ep =Ep
p
Pk + jQk
Figure 2 Equivalent diagram of STATCOM [31]
or absorbing the reactive power to and from thebus respectively by incorporating voltage sourceconverter circuit and hence it stabilized the voltagesto a predefined value The STATCOM will absorbthe reactive power from the bus when the voltage ishigher than the limit and will inject reactive power tothe bus when the voltage is below the defined limit
(ii) VAR control in this mode STATCOM keeps thereactive power of the bus at a constant value Theequivalent diagram of the STATCOM in steady-stateoperation is shown in Figure 2
The figure shows the model of STATCOM which is con-nected to the bus ldquo119896rdquo In this setting the STATCOM isrepresented by a controllable voltage source with electricpotential 119864119901 and phase angle 120575119901 which is connected in serieswith an impedance119885119901 119884119901 is the admittance of the link Since
Computational Intelligence and Neuroscience 5
the admittance is complex the real part of the impedancemodels the real power losses (119875119901) of the devices installed onthe system such as converters The leakage inductances ofthe coupling transformer makes up for the imaginary partof the reactance power loss (119876119901) This STATCOM modelis connected in parallel to the bus ldquo119896rdquo whose net real andreactive powers are represented as 119875119896 and 119876119896 respectivelyIf the STATCOM is being operated in the Voltage ControlMode it will absorb or inject the reactive power to keep thevoltage magnitude of the bus ldquo119896rdquo (|119881119896|) constant (usually at10 pu) With the introduction of STATCOM the power flowequations are changed only for the bus ldquo119896rdquo to which theSTATCOM is connected These equations are represented as
119875119896 = 119875119901 + 119873sum119895=1
10038161003816100381610038161198811198961003816100381610038161003816 1003816100381610038161003816100381611988111989510038161003816100381610038161003816 1003816100381610038161003816100381611988411989611989510038161003816100381610038161003816 cos (120575119896 minus 120575119894 minus 120579119896119895)
119876119896 = 119876119901 + 119873sum119895=1
10038161003816100381610038161198811198961003816100381610038161003816 1003816100381610038161003816100381611988111989510038161003816100381610038161003816 1003816100381610038161003816100381611988411989611989510038161003816100381610038161003816 sin (120575119896 minus 120575119894 minus 120579119896119895) (6)
Thus for the bus ldquo119896rdquo the original equation is modified by theaddition of the real and reactive powers (119875119901 and 119876119901) of theSTATCOM device These powers can further be representedas
119875119901 = 119866119901 100381610038161003816100381611988111989610038161003816100381610038162 minus 10038161003816100381610038161198811198961003816100381610038161003816 1003816100381610038161003816100381611986411990110038161003816100381610038161003816 1003816100381610038161003816100381611988411990110038161003816100381610038161003816 cos (120575119896 minus 120575119901 minus 120579119901)119876119901 = minus119861119901 100381610038161003816100381611988111989610038161003816100381610038162 minus 10038161003816100381610038161198811198961003816100381610038161003816 1003816100381610038161003816100381611986411990110038161003816100381610038161003816 1003816100381610038161003816100381611988411990110038161003816100381610038161003816 sin (120575119896 minus 120575119901 minus 120579119901)
(7)
It is evident from the above equations that STATCOM atbus ldquo119896rdquo has introduced two new variables electric potential119864119901 and phase angle 120575119901 in the equation set However |119881119896|is now a known variable with a predefined value Thus thesolution requires one more equation to solve the problemusing Newton-Raphson method By principle the real powerconsumed by the STATCOMmust be zero in the steady-stateoperationThe equation for the voltage source power must beequal to zero then this equation is given as
119875119864119901 = Real [119864119901119868119901lowast]119875119864119901 = minus119866119901 10038161003816100381610038161003816119864119901100381610038161003816100381610038162 minus 10038161003816100381610038161198811198961003816100381610038161003816 1003816100381610038161003816100381611986411990110038161003816100381610038161003816 1003816100381610038161003816100381611988411990110038161003816100381610038161003816 cos (120575119901minus120575119896 minus 120579119901)
(8)
With this modification in the equation of the bus ldquo119896rdquo theJacobian matrix for the updated system is given as
[[[[
1198691 1198692 11986931198694 1198695 11986961198697 1198698 1198699
]]]][[[[
Δ120575Δ |119881|Δ120575119901
]]]]= [[[Δ119875Δ119876Δ119875119901
]]] (9)
4 Overview of Artificial Neural Networks
ANN is an excellent machine learning algorithm for theregression and classification problems which can estimatethe data by emulating the functionality of human brainmdashitworks in different layers each with certain number of neuronsand weights The ANN can be used to estimate nonlinear
INPU
T
OU
TPU
T
InputLayer
OutputLayer
Hidden Layer
Figure 3 Artificial Neural Network [32]
systems even when the input data is sophisticated andcontains redundant and corrupt information Due to itsnonalgorithmic nature ANN does not try to approximate thesolution like the conventional techniques which are used forsolving the load flow equations
A neural network is composed of nodes called neu-rons at each of which the inputs from previous layersare accumulated after being multiplied with some weightsThe neurons are the fundamental processing units whichare interconnected with each other in a certain patternThe human brain comprises trillions of interconnectionsbetween the neurons It is estimated that there are 10 billionneurons present which are interconnected through 1014 links[32] An isolated worthless neuron becomes powerful wheninterconnected with other neurons in the network In asimilar fashion Artificial Neural Networks are comprised ofinterlinked neurons whose arrangement depends on the typeof application Each neural network has the following basiclayers
Input Layer This layer comprises passive nodes whose solejob is to transmit the input to the next layer and thereforethe number of nodes in this layer is equal to the numberof inputs to the network Each node carries specific weightfactor which is multiplied with each input valueThe numberof neurons in the input layer is represented as matrix withnumber of rows determined arbitrarily according to thedataset and number of columns being equal to the numberof input features
Hidden LayerThis is themost important layer of the networkwhich consists of arbitrary number of sublayers each con-taining different number of neurons This layer processes thedata from the input layer by multiplying it with the weightfactors
Output Layer This layer interfaces the internal layers withthe outputs and therefore the number of nodes in this layeris equal to the number of outputs Nodes in this layer areactive since they process the data received from the internallayers before transmitting it to the output A schematic of theconnections in ANN is shown in Figure 3
This interconnection improves the performance of thesystem over the traditional numerical analysis schemesObviously the inputs are received in the hidden layer after
6 Computational Intelligence and Neuroscience
INPUTS
SUM SQUASH
OUTPUT
WEIGHTS
X1
X2
X3
Xn
W1
W2
W3
Wn
sum
Figure 4 A single neuron structure [32]
beingmultipliedwithweights in the input layerThe structureof an artificial neuron is shown in Figure 4 The weightedinputs are summed and passed through the transfer functionto produce the output A transfer functionrsquos job is to restrictthe widely ranging inputs and map them to a finite outputand thatrsquos why it is also called ldquosquashrdquo At each node ldquo119895rdquo theweighted-input sum is represented by the equation
119878119895 = 119899sum119894=1
119883119894119882119894 (10)
The output of the neuron ldquo119895rdquo is written as ldquo119874119895rdquo119874119895 = 119879119895 (119878119895) (11)
One important issue in the design of ANN is the number ofhidden layers and neurons in each layerWhile the input layerand output layer topology depend largely on the input andoutput respectively hidden layerrsquos topology can be adjustedLower number of hidden neurons can result in poor esti-mation of the function while higher than required numberof neurons might result in overfitting of the network on thetraining dataset and might also incorporate the effects ofnoise apart from increasing the computation timeThereforethe optimal number of neurons must be decided on anempirical basis Another way to decide optimum hiddenneurons is to introduce self-adaptation in the network whilethe number of hidden layers is usually found appropriate andrestricted to one in most of the literature [24 55]
A neural network must be trained for the specific datasetbefore starting to make its own decisions The training of theneural network implies fine-tuning of the weights in eachlayer such that it is able to produce the expected outputwith minimum error Therefore ANN works in two parts (i)training and (ii) testing In training phase part of the datasetis fed to the ANN along with the determined output Theoutput obtained from the neural network is compared withthe original output (also called target) and the error is fedback to the network to adjust the weights accordingly Whenthe weights produce optimum result with minimum errorthe ANN is ready to be tested
The neural networks are usually trained using Back-Propagation method which is a variant of the Least MeanSquares Method due to its activation function which isanalytic continuous functionThe Back-Propagation methodis based on steepest-descent algorithm which seeks to find
the minimum error by adjusting weights in the directionof lowest error The error is taken and back-calculated toconverge to the optimum solutionThus in essence the errorpropagates in the backward direction and that is why it iscalled Back-Propagation methodThe error at the neuron ldquo119895rdquois calculated as
119864119895 = 12 (119877119895 minus 119874119895)2 (12)
The total error ldquo119864rdquo in all neurons becomes
119864 = sum119895
119864119895 = 12sum119895
(119877119895 minus 119874119895)2 (13)
In order to minimize the total error the weights are adjustedby adding a weight change (ΔW) to the original weightsafter each iteration In this respect a parameter ldquo120572rdquo whichis the learning rate is used along with the gradient descentalgorithm to define the weight changes as
Δ119882119896119895 = minus120572 120597119864120597119882119896119895 0 lt 120572 le 1 (14)
Thismeans that if the gradient is positive theweight change isnegative and vice versa to ensure that the solution convergestowards the least error The solution in the next iterationbecomes
1198821015840119896119895 = Δ119882119896119895 +119882119896119895 (15)
However Back-Propagation sometimes gets stuck in the localminimum One solution is to use this technique with othermethods such as the one proposed in [57] Another solutionis to use metaheuristic methods to fine-tune the neuralnetworks
Another important question is the validity of the use ofANN over Newton-Raphson method The major advantageof ANN over NR is that NR is an iterative method whichtakes valuable amount of time to solve the unknown variablesin the system The necessary element of NR method isJacobian matrix whose dimensions grow as the systemvariables increase As mentioned previously the huge powersystems are dynamic in nature and therefore load flowanalysis is critical after every few minutes to few secondsThe use of NR might be burdensome since it consumestime and computation power In contrast the ANN has theadvantage that it is nonparametric and useful in modelingnonlinearitiesMoreover they can be efficiently implementedon multiprocessor architectures due to their nature and thusthey can drastically reduce the processing time [58] Havingsaid this it should be mentioned that processing time andpower in ANN is required only during the training phaseof the network Once the ANN is trained it can estimatethe required output without much effort and this is thefundamental advantage of using ANN in place of NR in loadflow analysis
Computational Intelligence and Neuroscience 7
5 Overview of Optimization Techniques
In this section different optimization techniques areexplained As described earlier these optimization tech-niques are used to train the weights of the neural networksuch that the estimation error is reduced considerably
51 Particle Swarm Optimization (PSO) Particle SwarmOptimization is an excellent optimization technique whichcan be used to tune the weights of the ANN PSO finds thebest solution by allowing different particles to converge totheir own best solution (called 119875best) and the best solutionof the entire population (called 119866best) Each particle ldquo119894rdquo canbe can be represented in D-dimensional space as 119883119894 =(1199091198941 1199091198942 119909119894119863) As mentioned previously the PSO adjuststhe direction of each particle in the search space by regulatingthe velocity of each particle which is calculated on the basisof its own best experience (known as cognitive learning)as well as the experience of the best particle in the entirepopulation (called social learning) If the velocity at iterationldquo119896rdquo is represented by ldquoV(119896)rdquo and particlersquos current position byldquo119909(119896)rdquo then the velocity in the next iteration is calculatedusing the equation
V119894 (119896 + 1) = 119908119894V119894 (119896) + 1198881 sdot rand sdot (119875best minus 119909119894 (119896)) + 1198882sdot rand sdot (119866best minus 119909119894 (119896)) (16)
where 119875best = (1199011198941 1199011198942 119901119894119863) represents the local bestsolution of particle ldquo119894rdquo 119866best = (1198921 1198922 119892119863) is global bestsolution of entire swarm ldquo119908rdquo is the inertia constant ldquo1198881rdquo isthe cognitive constant and 1198882 is the social constant and rand()function generates a random number between 0 and 1 All ofthese constants have specific roles in determining the rate ofconvergence In one study [58] the optimum values of theseparameters are calculated as 1198881 = 1198882 = 1494 and 119908 = 0729
After the calculation of velocity for each particle in thenext iteration the position of the particle ldquo119894rdquo is updatedaccording to the equation
119883119894 (119896 + 1) = V119894 (119896 + 1) + 119883119894 (119896) (17)
One important aspect in PSO is the population or swarmsize The original authors of PSO have proposed in [59]that a swarm size of 20ndash100 particles usually producessimilar results however the size of swarm should also beadjusted based on the dataset dimensions constraints andcost function [60]
Shuffled Frog Leap Algorithm (SFLA) Shuffled frog leapalgorithm (SFLA) [43] is another population based meta-heuristic which works in a way which closely resemblesthe PSO This method converges to the optimal solution byevolution of memes which are carried by the particles (calledfrogs in this regime) which exchange information with eachother Each frog has an associated cost and during eachiteration the frogs try to improve their costThe frogs are thecarrier ofmemeswhich consist ofmemotypesThis algorithmcombines both deterministic and random approaches Indeterministic part the algorithm uses response surface infor-mation to search for the optimal solution On the other hand
the randompart allows the algorithm to instill robustness andflexibility Initially the algorithm generates random solutions(frogs) just like PSOThe cost of all the frogs is calculated andfrogs are ranked according to ascending order of their costThen starting from the top position the frogs are partitionedinto communities called memeplexes Within each of thesememeplexes the frogs share their memes or ideas with otherfrogs and therefore each memeplex evolves on its own interms of the cost In each memeplex the frogs with the bestand worst costs (119875119861 and 119875119908) are noted The next step is toimprove the position of the worst frog (119875119908)The new positionof the worst frog is updated as
119880 = 119875119908 + 119878 (18)
ldquo119878rdquo defines the step size (similar to the velocity in PSO) andit is calculated as
119878 = min (rand lowast (119875119861 minus 119875119882) 119878max) for positive step
119878 = max (rand lowast (119875119861 minus 119875119882) minus 119878max)for negative step
(19)
119878max is the maximum step size allowed and rand generatesa random number between 0 and 1 At each iteration theworst frog is moved close to the best frog and the cost ofthe new position U is calculated If the cost is better than theprevious cost the new position is assigned to the worst frogelse another step size is calculated as
119878 = min (rand lowast (119875119883 minus 119875119882) 119878max)for positive step
119878 = max (rand lowast (119875119883 minus 119875119882) minus 119878max)for negative step
(20)
Here 119875119883 is the position of the global best frog in allmemeplexes Once again the new positionrsquos cost is comparedwith the worst frogrsquos cost If it is better the new positionreplaces the old worst frog else this frog is terminated andanother random frog is generated After predefined numberof iterations the frogs in the memeplexes are reshuffled Inthis way memeplexes become richer with new ideas andquality of the meme gets improved
The important parameters in SLFA are the total numberof memeplexes and number of frogs in each memeplexAs the size of each memeplex increases the probability ofconverging to the global optima also increases however thisalso increases the computational demand As proposed in[43] the number of memeplexes can be set in the range of10ndash100 while the number of frogs in each memeplex canvary from 5 to 300 However it is imperative that optimumvalues for these parameters can be obtained through testingthe algorithm with different combinations
52 Genetic Algorithm (GA) Genetic Algorithm proposedby Goldberg and Holland [48] is another very efficient opti-mization algorithm This algorithm is based on the natural
8 Computational Intelligence and Neuroscience
selection and genetics which are derived from the Darwinianconcept of survival The solutions consist of binary stringswith exchange information with each other through differentoperations Usually the solutions are represented in terms ofbinary strings The initial solutions are randomly generatedand their cost is calculated The Genetic Algorithm performsthree basic operations on these solutions
Reproduction is the process of copying the strings accord-ing to their fitness which implies that higher fitness incursmore chances of survival
Crossover is the process of probabilistically choosing twoparents of a new solution (called child) based on their fitnessvalue Furthermore the crossover site is also chosen at whichthe two parents are split
Mutation randomly changes the bit values of the newlyborn child because there are chances that a bit might remainunchanged by previous operations This function can alsobe used to modify the newly born children which are notfeasible
The above processes are repeated in each iteration allow-ing the solutions to evolve and mature At each iteration theprevious solutions are replaced by the new solution Whenthe termination condition is met the solution with the bestcost is taken as the final solution
Regarding the initial population of Genetic Algorithmsolutions different theories have been suggested includingdependency on difficulty or building blocks in the problem[61 62] and self-adaptation [63] However the simplestapproach to the initialization of population is the empiricalmethod that is testing the GA with different number ofinitial solutions and using only correct number of solutionsafter testing This approach is corroborated by many studiessuch as [64 65] because most of the times the problem isdifficult to characterize in terms of difficulty [66]
53 Cost Function Since this work is dedicated to the studyof different estimation techniques the difference between theactual and estimated output is the actual error or cost of thesystemThe cost function can be represented inmathematicalform as
119891 (119909119894 (119896)) = 119864119894 (119896) (21)
The cost function ldquo119891(119909119894(119896))rdquo is the cost of the ldquo119894thrdquo particle inthe ldquo119896thrdquo iteration of the optimization algorithm The errorterm 119864119894(119896) is taken as the mean-squared error between theoriginal and estimated output which is the second momentabout the origin and is given as follows [67]
119864119894 (119896) = 1119873119873sum119899=1
(119910119889 (119899) minus 119910 (119899)2) (22)
where119873 is the total samples of datasets which are applied tothe network 119910119889 is the desired output and 119910 is the estimatedoutput of the system using the neural network
54 Dataset The dataset for the purpose of training andtesting neural networks is extracted from IEEE-30 bus testcase which represents American Electric Power SystemThis
IEEE-30 bus system contains 24 load buses 5 PV buses and 1slack bus and carries details information about the buses suchas generated and load powers voltages line admittances andsystem constraints
The inputs are real and reactive powers of the buseswhich are perturbed to generate training samples while theoutputs are voltage magnitudes phase angles and reactivepowers of the STATCOM device the unknowns of all ofthem are calculated using Newton-Raphson method Therelationship between the input and output variables is highlynonlinear and therefore it requires efficient estimation tech-niques
6 Methodology
In this study we have estimated the output voltages phaseangles and reactive power of the STATCOM bus using ANNwith different algorithms for the training The datasets weretaken from the standard IEEE bus systems The first stepis to solve (1)ndash(9) using any standard numerical analysistechnique such as Newton-Raphson The Newton-Raphsonis an iterative method that solves the equations iterativelyusing assumptions in the start The STATCOM is connectedto an appropriate load bus ldquo119896rdquo and the voltagemagnitude |119881119896|phase angle 120575119896 and reactive power 119876119896 of the modified busare also calculated using the above-mentioned equations Inorder to generate large data for the STATCOM bus the realand reactive powers of all the load buses were perturbed byincreasing their values in proportions of their original valuesThe voltages phase angles and reactive powers of all thebuses are calculated after each perturbation In this way alarge dataset is obtained in which the inputs are the real andreactive powers of the buses after each perturbation concate-nated in a single column and the outputs are correspondingvalues of STATCOM bus voltage magnitude |119881119896| phase angle120575119896 and reactive power 119876119896
Thewhole dataset is randomly divided into two parts suchthat 70 of the data is used for the training of the ANNand the remaining 30 is used for testing Three separateArtificial Neural Networks were used the first one is usedto estimate the voltage magnitude and the second one toestimate the phase angle of the STATCOM bus while thethird one is used to estimate the reactive power In thestandard operation the ANN has been trained using theBack-Propagationmethod which is explained in the previoussection Furthermore the ANN is also trained using ParticleSwarm Optimization Shuffled Frog Leap Algorithm andGenetic Algorithm
The steps for the design of neural network for each of thethree cases usingmetaheuristic optimization techniques canbe summarized as follows
(1) For each case arrange the dataset into two portionstraining and testing The total number of input fea-tures present in the dataset plays important role indetermining total number of neuron in hidden layer
(2) Initialize the total number of hidden layers andhidden neurons ldquonrdquo The total number of weighted
Computational Intelligence and Neuroscience 9
neurons in the input layer is the product of num-ber of hidden neurons ldquonrdquo and the features of theinput dataset ldquomrdquo Similarly the number of total biasparameters in the hidden layer is equal to total hiddenneurons while the number of bias parameters inoutput layers equals the number of outputs
(3) Calculate the total number of parameters to be opti-mized in the neural network For a network withldquonrdquo hidden neurons and an input with ldquomrdquo featuresthe total number of parameters in the input layer isldquo119899 lowast 119898rdquo In the hidden layer there are ldquonrdquo weights ofthe neurons and ldquonrdquo bias values In the output layerthere are total ldquoordquo output bias values correspondingto each output Hence the total number of parametersldquo119863rdquo to be optimized is given as
119863 = 119898 lowast 119899 + 119899 + 119899 + 119900 (23)
(4) Initialize the PSO SFLA and GA populations ran-domly Each solution has the dimension given by(23) and represents different combination of theweights and biases which are explained previouslyFurthermore all the relevant constants iterationsand constraints are initialized Constraints must bedefined according to the given conditions and canplay vital role in convergence of the algorithms Fur-thermore the number of memeplexes is also definedin SFLA
(5) The cost function is defined by (22) which is used byall the algorithms to calculate the difference betweenthe actual output (calculated using Newton-Raphsonmethod) and estimated output using the neural net-works
(6) For PSO the global best 119866best and 119875best are calculatedthe velocities and positions of particles are updatedaccording to (16) and (17) in each iteration For SFLAthe frogs (solutions) are ranked according to their costand assigned to memeplexes At each iteration (18)to (20) are used to update the solutions For GA thesteps for this optimization are as follows
(i) The parents are chosen probabilistically amongthe set of all solutions based on their cost with aprobability
(ii) A crossover is applied between the two selectedparents in each iteration to create a child solu-tionThis involves selection of parents as well asthe selection of split (crossover) site
(iii) Mutation operation takes the child and ran-domly changes random number of entries Thischild is now placed in the population set In thenext iteration this child would be candidate forthe parent
7 Results and Discussion
In order to study the efficacy of the designed STATCOM andthe ANN based estimation techniques we have tested the
Table 1 Summary of simulation parameters
Network Feed-forwardNumber of networks 3Optimization techniques Back-Propagation PSO SFLA GANeurons 1 5 10 15 20 25 30 40 50 60Hidden layers 1Input size 60Output size 1Inputs Real and reactive powers of load buses
Outputs STATCOM voltage phase and reactivepower
system on IEEE-30 bus system The duty of STATCOM isto maintain the bus voltage at 10 pu while the estimationschemes have been used to estimate the STATCOM voltagephase angle and the reactive power at STATCOMThe STAT-COM has been connected at the load bus 12 ANN has beentrained by a variety of different optimization techniques suchas Back-Propagation PSO SFLA and GA As mentionedearlier the real and reactive powers of the IEEE-30 bussystems were perturbed by increasing the powers at the loadbuses by introducing a 5 change in each iteration Thecorresponding voltages phase angles and reactive powersof the STATCOM are estimated using the Newton-Raphsonmethod This combination of real and reactive powers andcorresponding voltages phase angles and reactive powersbecomes the dataset for the three cases of ANN For thepurpose of summarizing the results total 30 samples of inputand output results are generated for each of the three cases ofANNs Out of the total dataset a random 70 of the data isused for training which makes a total of 21 samples and theremaining is used for the testing purposes which amountsto 9 samples In all cases the ANNs have been designedwith one input layer one hidden layer containing varyingnumber of neurons and one output layer containing oneoutput The varying number of nodes is used to consider theeffect of hidden neurons in estimation The neural networkconfiguration is ldquofeed forwardnetworkrdquowith no back links Inthe case of Back-Propagation training Levenberg-MarquardtBack-Propagation algorithm is used which is the most widelyused Back-Propagation method The input contains real andreactive powers of all the buses hence the size of input is60 Both the real and reactive powers are concatenated in acolumn vectorTheweights to be trained include hidden layerweights and biases plus the output layer weights and biases Inall cases of PSO 30 initial solutions were assumed Similarlyin the case of SFLA a total of 50 initial solutions (frogs) havebeen assumed with 10 memeplexes and 3 shuffles In caseof GA 30 initial solutions were produced in the populationThe total iterations for PSO SFLA and GA are fixed at 500A summary of all the simulation parameters is depicted inTable 1
71 Voltage Magnitude Estimation As the first case thevoltage estimation using BP PSO SFLA and GA is shownin Figures 5 6 7 and 8 respectively as the number of
10 Computational Intelligence and Neuroscience
Back-propagation with increasing no of neurons
Actual VoltageNo of Neurons
0981
102104106108
11112114
Volta
ge
83 6 92 51 4 7Samples
n = 1
n = 5
n = 10
n = 15
n = 20
n = 25
n = 30
n = 40
n = 50
n = 60
Figure 5 Voltage estimation using Back-Propagation with increas-ing number of neurons
PSO with increasing no of neurons
096098
1102104106108
11112114
Volta
ge
83 6 92 51 4 7Samples
Actual VoltageNo of Neurons
n = 1
n = 5
n = 10
n = 15
n = 20
n = 25
n = 30
n = 40
n = 50
n = 60
Figure 6 Voltage estimation using PSO with increasing number ofneurons
neurons is increased from 1 to 60 It is obvious from thefigures that the performance of SFLA is better than the restin most of the cases After SFLA strong competition canbe observed between PSO and BP algorithms SpecificallyPSO performs better than BP for intermediate number ofhidden neurons in the range of 119899 = 5 to 119899 = 30 neuronswhile BP outperforms PSO for lower and higher neuronsThereason for this behavior can be explained in terms of the factthat PSO is metaheuristic and could not find global optimawhen the numbers of supporting neurons was either lower orhigher while BPmanages to produce slightly better results insuch cases because of mathematical approach Neverthelessthe SFLA has been able to produce lower error and betterestimation owing to its exchange of information betweendifferent memeplexes which would allow it to escape localoptima more efficiently
SFLA with increasing no of neurons
0981
102104106108
11112114
Volta
ge
83 6 92 51 4 7Samples
Actual VoltageNo of Neurons
n = 1
n = 5
n = 10
n = 15
n = 20
n = 25
n = 30
n = 40
n = 50
n = 60
Figure 7 Voltage estimation using SFLAwith increasing number ofneurons
GA with increasing no of neurons
09095
1105
11115
12Vo
ltage
83 6 92 51 4 7Samples
Actual VoltageNo of Neurons
n = 1
n = 5
n = 10
n = 15
n = 20
n = 25
n = 30
n = 40
n = 50
n = 60
Figure 8 Voltage estimation using GA with increasing number ofneurons
Furthermore the voltage estimation of all the algorithmsis also displayed for (a) 10 (b) 20 (c) 30 and (d) 40 neuronsin Figure 9 while themean-squared errors for each algorithmand case are presented in Table 2
Obviously the SFLA has achieved mean-squared erroras low as 499119890 minus 6 for 25 hidden neurons which impliesthat with the network designed using SFLA weights 119899 =25 would be the optimal choice for the hidden neuronsThe GA performs slightly better than PSO only for lowernumber of neurons in the range 5ndash15 but produces relativelylarger error for higher values of neurons One reason for notincluding the results beyond 119899 = 60 is the obvious stagnationor degradation in the error performance improvement asmore neurons are added to the network Therefore it canbe concluded that best choice of hidden neurons for thegiven dataset is between 1 and 60 neurons The voltage
Computational Intelligence and Neuroscience 11
Neurons 10
ActualBack-PropagationPSO
SFLAGA
098
1
102
104
106
108
11
112
114Vo
ltage
83 6 92 51 4 7Samples
(a)
Neurons 20
ActualBack-PropagationPSO
SFLAGA
098
102
104
106
108
11
112
114
Volta
ge
83 6 92 51
1
4 7Samples
(b)
Neurons 30
ActualBack-PropagationPSO
SFLAGA
096
098
1
102
104
106
108
11
112
114
Volta
ge
83 6 92 51 4 7Samples
(c)
Neurons 40
ActualBack-PropagationPSO
SFLAGA
095
1
105
11
115
12Vo
ltage
83 6 92 51 4 7Samples
(d)
Figure 9 Estimation of voltages with different optimization techniques
estimation can directly be compared with the PSO-ANN1voltage estimation in [53] which has used PSO to trainthe ANN The estimation has rendered 2468 error whichamounts to root mean-squared error (rmse) of 00719This ishigher than the maximum error in SFLA voltage estimationwhose rmse amounts to 00063561 For our designednetworkthe best estimation using SFLA is obtained with 30 neuronsas compared to 37 neurons in the PSO-ANN1 Therefore wecan conclude that SFLA based ANN with one hidden layerand 30 neurons can be used to estimate the voltagemagnitudeof the STATCOM bus
72 Phase Estimation For the estimation of STATCOMphase the results are shown in Figures 10 11 12 and 13 for
BP PSO SFLA andGA respectivelyThe results show similartrend for all the optimization techniques as in the case ofvoltage estimation Usually the error is minimum in range of10 to 40 neurons for all the optimization techniques For BPand PSO the best estimation is observed at 119899 = 10 althoughmore consistent results can be observed in the range of 20 to30 neurons For SFLA similar trend is observed with optimalresults at 119899 = 10 which is also the overall minimum MSE Itis also evident that beyond hidden neurons greater than 40the error can be seen to rise and produce poor estimationWehave included results up to 60 neurons due to limited space
Furthermore the phase estimation of all the algorithms isalso displayed for (a) 10 (b) 20 (c) 30 and (d) 40 neurons inFigure 14 while the mean-squared errors for each algorithm
12 Computational Intelligence and Neuroscience
Back-propagation with increasing no of neurons
minus40
minus35
minus30
minus25
minus20
minus15
Phas
e
83 6 92 51 4 7Samples
Actual PhaseNo of Neurons
n = 1
n = 5
n = 10
n = 15
n = 20
n = 25
n = 30
n = 40
n = 50
n = 60
Figure 10 Phase estimation using BP with increasing number ofneurons
PSO with increasing no of neurons
minus40minus35minus30minus25minus20minus15
Phas
e
83 6 92 51 4 7Samples
Actual PhaseNo of Neurons
n = 1
n = 5
n = 10
n = 15n = 20
n = 25
n = 30
n = 40
n = 50n = 60
Figure 11 Phase estimation using PSO with increasing number ofneurons
SFLA with increasing no of neurons
minus40
minus35
minus30
minus25
minus20
minus15
Phas
e
83 6 92 51 4 7Samples
Actual PhaseNo of Neurons
n = 1
n = 5
n = 10
n = 15
n = 20
n = 25
n = 30
n = 40
n = 50
n = 60
Figure 12 Phase estimation using SFLA with increasing number ofneurons
GA with increasing no of neurons
Actual PhaseNo of Neurons
n = 1
n = 5
n = 10
n = 15
n = 20
n = 25
n = 30
n = 40
n = 50
n = 60
minus40
minus35
minus30
minus25
minus20
minus15
Phas
e
83 6 92 51 4 7Samples
Figure 13 Phase estimation using GA with increasing number ofneurons
Table 2 MSE in voltage estimation
119899 Back-Propagation PSO SFLA GA1 979E minus 05 000018 125E minus 05 00004035 804E minus 05 466E minus 05 175E minus 05 236E minus 0510 6E minus 05 386E minus 05 231E minus 05 37E minus 0515 745E minus 05 151E minus 05 338E minus 05 284E minus 0520 499E minus 05 384E minus 05 561E minus 06 511E minus 0525 162E minus 05 847E minus 05 499E minus 06 000022630 466E minus 05 188E minus 05 301E minus 06 356E minus 0540 0000155 0000928 144E minus 05 000455850 271E minus 05 0000294 134E minus 05 000125560 403E minus 05 0000322 404E minus 05 0001214
Table 3 MSE in phase estimation
119899 Back-Propagation PSO SFLA GA1 0038329 0026473 0016814 03890825 0081626 0056788 0036451 023986510 0008381 0005758 0003634 08313615 0104433 0072338 0046123 028455320 0019951 0013768 0008738 042407325 0013029 0009192 0006031 010445130 0019706 0014014 0009299 212863840 0100567 0069504 0009352 095829350 4929065 1213655 0044166 342246160 0019833 0014103 2189899 2099536
and case are presented in Table 3TheMSE are comparativelyhigher than the previous case of voltage estimation Thismight partly be due to the regression which involves widerrange of floating number as compared to the previous casewhile the nonlinearity of the estimation might also haveplayed its role Nevertheless the SFLA still outperforms otheralgorithms in terms of MSE The distribution of frogs intomemeplexes and each frog constructively improving the ideas
Computational Intelligence and Neuroscience 13
Neurons 10
ActualBack-PropagationPSO
SFLAGA
minus38minus36minus34minus32minus30minus28minus26minus24minus22minus20minus18
Phas
e
63 8 942 51 7Samples
(a)
1 2 3 4 5 6 7 8 9
Samples
minus40
minus35
minus30
minus25
minus20
minus15
Phas
e
Neurons 20
ActualBack-PropagationPSO
SFLAGA
(b)
1 2 3 4 5 6 7 8 9Samples
minus38minus36minus34minus32minus30minus28minus26minus24minus22minus20minus18
Phas
e
Neurons 30
ActualBack-PropagationPSO
SFLAGA
(c)
1 2 3 4 5 6 7 8 9Samples
minus38minus36minus34minus32minus30minus28minus26minus24minus22minus20minus18
Phas
e
Neurons 40
ActualBack-PropagationPSO
SFLAGA
(d)
Figure 14 Estimation of phases with different optimization techniques
of its memeplex independent of other memeplexes can leadto better results when compared with other algorithms Onthe contrary the GA is not proved efficient in the estimationof phase for which several reasons can be presented such asoverfitting on the training data unguided mutation and itsappropriateness for binary based problems
73 Reactive Power Estimation For reactive power estima-tion the results are shown in Figures 15 16 17 and 18 for BPPSO SFLA and GA respectively As opposed to the previousestimations the lower number of neurons has resulted inhigher than usual error while the minimum error shift isnot homogenous although it can be noted that the erroris minimum in the mediocre range of neurons For BP thebest estimation is achieved at 119899 = 40 and then error risesagain For PSO the minimum error seems to oscillate withthe increase in neurons but lowest error is attained at 119899 = 20
followed by 15 and 40 For SFLA the minimum error periodis more consistent in the range of 15 to 30 in whichminimumerror is observed for the estimation of reactive power In factthe SFLA still produces the best estimation of the reactivepower while comparison also depicts the better performanceof PSO when compared to the BP which is again attributedto the superiority of metaheuristic approaches in finding theglobal optima As opposed to the previous case it can alsobe seen that GA seems to perform on par with the BP inestimation when the number of neurons is between 5 and 20But for higher number of neurons GA fails to perform best
As in the previous cases the reactive power estimation ofall the algorithms is also displayed for (a) 10 (b) 20 (c) 30 and(d) 40 neurons in Figure 19 while the mean-squared errorsfor each algorithm and case are presented in Table 4Withoutany effort it can be concluded that SFLArsquos estimation is best inreactive power estimation closely followed by the PSO Theconstant failing of GA sheds light on the fact that it does not
14 Computational Intelligence and Neuroscience
Table 4 MSE in reactive power estimation
119899 Back-Propagation PSO SFLA GA1 0009706 0007413 0004553 00404815 0005537 0003064 0002702 000466910 000643 0005783 0004836 001506615 0006869 0001567 0000667 000462120 000576 0001045 0000894 000194425 000562 0007867 0001253 004862130 0006889 0002816 0000889 001455840 0002592 0002344 000182 001582750 000579 0003539 0002045 002995660 0004101 0010924 0000926 0071632
1 2 3 4 5 6 7 8 9Samples
minus14minus12
minus1minus08minus06minus04minus02
00204
Reac
tive P
ower
(Q)
Back-propagation with increasing no of neurons
Actual Reactive QNo of Neurons
n = 1
n = 5
n = 10
n = 15
n = 20
n = 25
n = 30
n = 40
n = 50
n = 60
Figure 15 Reactive power (119876) estimation using Back-Propagationwith increasing number of neurons
perform well in regression problems and it is more suitablefor scheduled optimization
This estimation can be applied to larger power systemssuch as IEEE-300 bus system to understand the dynamics oflarger amount of data and its effect on different optimizationtechniques
8 Conclusion
This paper is focused on fine-tuning the weights of Arti-ficial Neural Network (ANN) using different optimizationtechniques Then the developed ANN is used to estimatevoltages phases and reactive powers of STATCOMWe havediscussed the role of STATCOM in power buses for thevoltage regulation of the busesWe have presented an efficientiterative method to solve the power systems which involveSTATCOM The STATCOM introduces some new variablesin the system which must be accounted for In the nextstage we have provided an alternative method to calculatethe unknown variables in STATCOM using Artificial NeuralNetwork curve fitting which is faster and requires lessmemory and processing power We have trained ArtificialNeural Networks with different optimization techniques such
PSO with increasing no of neurons
minus14minus12
minus1minus08minus06minus04minus02
002
Reac
tive P
ower
(Q)
63 8 942 51 7
Samples
Actual QNo of Neurons
n = 1
n = 5
n = 10
n = 15
n = 20
n = 25
n = 30
n = 40
n = 50
n = 60
Figure 16 Reactive power (119876) estimation using PSOwith increasingnumber of neurons
SFLA with increasing no of neurons
minus14minus12
minus1minus08minus06minus04minus02
002
Reac
tive P
ower
(Q)
83 6 92 51 4 7Samples
Actual QNo of Neurons
n = 1
n = 5
n = 10
n = 15
n = 20
n = 25
n = 30
n = 40
n = 50
n = 60
Figure 17 Reactive power (119876) estimation using SFLA with increas-ing number of neurons
as Back-Propagation Particle Swarm Optimization ShuffledFrog Leap Algorithm and Genetic Algorithm The resultsshow that Shuffled Frog Leap Algorithm can perform betterthan the Back-Propagation and other methods when theparameters are fine-tuned according to the given datasetwhile PSO and BP performance are also acceptable
Conflicts of Interest
The authors declare that there are no conflicts of interestregarding the publication of this paper
Supplementary Materials
Supplementary materials contain a short video-clip aboutthe code which was adopted to simulate the performanceof Neural Networks with different optimization techniques(Supplementary Materials)
Computational Intelligence and Neuroscience 15
GA with increasing no of neurons
minus14minus12
minus1minus08minus06minus04minus02
00204
Reac
tive P
ower
(Q)
83 6 92 51 4 7Samples
Actual QNo of Neurons
n = 1
n = 5
n = 10
n = 15
n = 20
n = 25
n = 30
n = 40
n = 50
n = 60
Figure 18 Reactive power (119876) estimation using GA with increasing number of neurons
Neurons 10
minus14minus12
minus1minus08minus06minus04minus02
002
Reac
tive P
ower
(Q)
83 6 92 51 4 7Samples
ActualBack-PropagationPSO
SFLAGA
(a)
Neurons 20
minus14minus12
minus1minus08minus06minus04minus02
002
Reac
tive P
ower
(Q)
83 6 92 51 4 7Samples
ActualBack-PropagationPSO
SFLAGA
(b)
Neurons 30
minus14minus12
minus1minus08minus06minus04minus02
002
Reac
tive P
ower
(Q)
63 8 942 51 7Samples
ActualBack-PropagationPSO
SFLAGA
(c)
Neurons 40
minus14minus12
minus1minus08minus06minus04minus02
002
Reac
tive P
ower
(Q)
83 6 92 51 4 7Samples
ActualBack-PropagationPSO
SFLAGA
(d)
Figure 19 Estimation of reactive power (119876) with different optimization techniques
16 Computational Intelligence and Neuroscience
References
[1] G Singh and L Srivastava ldquoGenetic Algorithm-Based ArtificialNeural Network for Voltage Stability Assessmentrdquo Advances inArtificial Neural Systems vol 2011 pp 1ndash9 2011
[2] C Liu S McArthur and S Lee Smart Grid Handbook JohnWiley amp Sons Ltd Chichester UK 2016
[3] S Varshney L Srivastava and M Pandit ldquoComparison ofPSO models for optimal placement and sizing of statcomrdquoin Proceedings of the International Conference on SustainableEnergy and Intelligent Systems SEISCON 2011 pp 346ndash351India July 2011
[4] M Moazzami G B Gharehpetian H Shahinzadeh and SH Hosseinian ldquoOptimal locating and sizing of DG and D-STATCOM using Modified Shuffled Frog Leaping Algorithmrdquoin Proceedings of the 2nd Conference on Swarm Intelligence andEvolutionary Computation CSIEC 2017 pp 54ndash59 Iran March2017
[5] S Dixit L Srivastava and G Agnihotri ldquoOptimal placement ofSVC for minimizing power loss and improving voltage profileusing GArdquo in Proceedings of the 2014 International Conferenceon Issues and Challenges in Intelligent Computing TechniquesICICT 2014 pp 123ndash129 India February 2014
[6] R Kalaivani and V Kamaraj ldquoEnhancement of voltage stabilityby optimal location of static var compensator using geneticalgorithm and particle swarm optimizationrdquo American Journalof Engineering and Applied Sciences vol 5 no 1 2012
[7] A Karimi andR Raisinejad ldquoOptimal placement facts device toincrease voltage stability margin using direct search algorithmrdquoJournal of Fundamental and Applied Sciences vol 8 no 3S pp2984ndash2995 2016
[8] A R Jordehi ldquoBrainstorm optimisation algorithm (BSOA) anefficient algorithm for finding optimal location and setting ofFACTS devices in electric power systemsrdquo International Journalof Electrical Power amp Energy Systems vol 69 pp 48ndash57 2015
[9] A R Jordehi ldquoOptimal allocation of FACTS devices for staticsecurity enhancement in power systems via imperialistic com-petitive algorithm (ICA)rdquo Applied Soft Computing vol 48 pp317ndash328 2016
[10] M Eremia C-C Liu and A-A Edris ldquoAdvanced Solutions inPower Systems HVDC FACTS and AI Techniquesrdquo AdvancedSolutions in Power Systems HVDC FACTS and AI Techniquespp 1ndash1042 2016
[11] J Munoz P Melın and J Espinoza ldquoControl of multilevelSTATCOMsrdquo Power Systems vol 90 pp 265ndash311 2015
[12] B Stott ldquoReview of load-flow calculationmethodsrdquo Proceedingsof the IEEE vol 62 no 7 pp 916ndash929 1974
[13] J ZhuOptimization of power systemoperation JohnWiley Sons2015
[14] P Schavemaker and L V D Sluis Electrical power systemessentials John Wiley Sons 2017
[15] F Cajori ldquoHistorical Note on the NEWton-RaphsonMethod ofApproximationrdquo The American Mathematical Monthly vol 18no 2 pp 29ndash32 1911
[16] S Kamel F Jurado and D Vera ldquoA simple implementationof power mismatch STATCOM model into current injectionNewton-Raphson power-flow methodrdquo Electrical Engineeringvol 96 no 2 pp 135ndash144 2014
[17] E Acha and B Kazemtabrizi ldquoA new STATCOM model forpower flows using the newton-raphson methodrdquo IEEE Trans-actions on Power Systems vol 28 no 3 pp 2455ndash2465 2013
[18] B Kazemtabrizi and E Acha ldquoAn advanced STATCOM modelfor optimal power flows using Newtonrsquos methodrdquo IEEE Trans-actions on Power Systems vol 29 no 2 pp 514ndash525 2014
[19] S Kamel and F Jurado ldquoModeling of STATCOM in load flowformulationrdquo Power Systems vol 90 pp 405ndash435 2015
[20] FERC Staff Economic Dispatch Concepts Practices and IssuesCalifornia Palm Springs 2005
[21] K G Kim Deep Learning The MIT Press 2016[22] F Amato A Lopez E M Pena-Mendez P Vanhara A Hampl
and J Havel ldquoArtificial neural networks in medical diagnosisrdquoJournal of Applied Biomedicine vol 11 no 2 pp 47ndash58 2013
[23] O Ronneberger P Fischer and T Brox ldquoU-net convolutionalnetworks for biomedical image segmentationrdquo in Proceedings ofthe International Conference on Medical Image Computing andComputer-Assisted Intervention and Medical Image Computingand Computer-Assisted Intervention (MICCAI rsquo15) vol 9351 ofLectureNotes in Computer Science pp 234ndash241 November 2015
[24] J Dheeba N Albert Singh and S Tamil Selvi ldquoComputer-aideddetection of breast cancer on mammograms a swarm intelli-gence optimized wavelet neural network approachrdquo Journal ofBiomedical Informatics vol 49 pp 45ndash52 2014
[25] A Bahrammirzaee ldquoA comparative survey of artificial intelli-gence applications in finance artificial neural networks expertsystem and hybrid intelligent systemsrdquo Neural Computing andApplications vol 19 no 8 pp 1165ndash1195 2010
[26] G Sermpinis KTheofilatos A Karathanasopoulos E F Geor-gopoulos and C Dunis ldquoForecasting foreign exchange rateswith adaptive neural networks using radial-basis functions andparticle swarm optimizationrdquo European Journal of OperationalResearch vol 225 no 3 pp 528ndash540 2013
[27] M Tkac and R Verner ldquoArtificial neural networks in businessTwo decades of researchrdquo Applied Soft Computing vol 38 pp788ndash804 2016
[28] C S Vui G K Soon C K On R Alfred and P AnthonyldquoA review of stock market prediction with Artificial neuralnetwork (ANN)rdquo in Proceedings of the 2013 IEEE InternationalConference on Control System Computing and EngineeringICCSCE 2013 pp 477ndash482 Malaysia December 2013
[29] A S Ahmad M Y Hassan M P Abdullah et al ldquoA review onapplications of ANN and SVM for building electrical energyconsumption forecastingrdquo Renewable amp Sustainable EnergyReviews vol 33 pp 102ndash109 2014
[30] J A Laghari H Mokhlis A H A Bakar and H MohamadldquoApplication of computational intelligence techniques for loadshedding in power systems A reviewrdquo Energy Conversion andManagement vol 75 pp 130ndash140 2013
[31] A Ukil Intelligent Systems and Signal Processing in PowerEngineering Springer Berlin Heidelberg Berlin Heidelberg2007
[32] D J Rezende S Mohamed and D Wierstra ldquoStochasticbackpropagation and approximate inference in deep generativemodelsrdquo in Proceedings of the 31st International Conference onMachine Learning ICML 2014 pp 3057ndash3070 chn June 2014
[33] H B DemuthM H Beale O De Jess andM T Hagan Neuralnetwork design
[34] L Zhang and P N Suganthan ldquoA survey of randomizedalgorithms for training neural networksrdquo Information Sciencesvol 364ndash365 pp 146ndash155 2016
[35] Y S X Hu and R Eberhart ldquoRecent Advances in ParticleSwarmrdquo in in Proceedings of the Congress on EvolutionaryComputation Portland 2004
Computational Intelligence and Neuroscience 17
[36] A Suresh K V Harish and N Radhika ldquoParticle swarmoptimization over back propagation neural network for lengthof stay predictionrdquo Procedia Computer Science vol 46 pp 268ndash275 2015
[37] W Sun and Y Xu ldquoUsing a back propagation neural networkbased on improved particle swarm optimization to studythe influential factors of carbon dioxide emissions in HebeiProvince Chinardquo Journal of Cleaner Production vol 112 pp1282ndash1291 2016
[38] G Das P K Pattnaik and S K Padhy ldquoArtificial NeuralNetwork trained by Particle SwarmOptimization for non-linearchannel equalizationrdquo Expert Systems with Applications vol 41no 7 pp 3491ndash3496 2014
[39] S Chatterjee S Sarkar S Hore N Dey A S Ashour and VE Balas ldquoParticle swarm optimization trained neural networkfor structural failure prediction of multistoried RC buildingsrdquoNeural Computing and Applications vol 28 no 8 pp 2005ndash2016 2017
[40] R Ata ldquoArtificial neural networks applications in wind energysystems a reviewrdquoRenewableamp Sustainable Energy Reviews vol49 pp 534ndash562 2015
[41] S Gaur S Ch D Graillot B R Chahar and D N KumarldquoApplication of Artificial Neural Networks and Particle SwarmOptimization for the Management of Groundwater ResourcesrdquoWater Resources Management vol 27 no 3 pp 927ndash941 2013
[42] E Momeni D Jahed Armaghani M Hajihassani and M FMohd Amin ldquoPrediction of uniaxial compressive strength ofrock samples using hybrid particle swarm optimization-basedartificial neural networksrdquo Measurement vol 60 pp 50ndash632015
[43] M Eusuff K Lansey and F Pasha ldquoShuffled frog-leapingalgorithm a memetic meta-heuristic for discrete optimizationrdquoEngineering Optimization vol 38 no 2 pp 129ndash154 2006
[44] S Panda A Sarangi and S P Panigrahi ldquoA new training strat-egy for neural network using shuffled frog-leaping algorithmand application to channel equalizationrdquo AEU - InternationalJournal of Electronics and Communications vol 68 no 11 pp1031ndash1036 2014
[45] B Tripathy S Dash and S K Padhy ldquoMultiprocessor schedul-ing and neural network training methods using shuffled frog-leaping algorithmrdquoComputers amp Industrial Engineering vol 80no 1 pp 154ndash158 2015
[46] X Cheng X Zhang L Zhao et al ldquoThe application of ShuffledFrog Leaping Algorithm to Wavelet Neural Networks foracoustic emission source locationrdquo Comptes Rendus (Doklady)de lrsquoAcademie des Sciences de lrsquoURSS vol 342 no 4 pp 229ndash2332014
[47] Z Zhao Q Xu and M Jia ldquoImproved shuffled frog leapingalgorithm-based BP neural network and its application in bear-ing early fault diagnosisrdquo Neural Computing and Applicationsvol 27 no 2 pp 375ndash385 2016
[48] D E Goldberg and J H Holland ldquoGenetic algorithms andmachine learningrdquoMachine Learning vol 3 no 2-3 pp 95ndash991998
[49] V Chandwani V Agrawal and R Nagar ldquoModeling slump ofreadymix concrete using genetic algorithms assisted training ofArtificial Neural Networksrdquo Expert Systems with Applicationsvol 42 no 2 pp 885ndash893 2015
[50] R s RasitKoker ldquoA genetic algorithm approach to a neural-network-based inverse kinematics solution of robotic manip-ulators based on error minimizationrdquo Information Sciences vol222 pp 528ndash543 2013
[51] J Peralta X Li G Gutierrez and A Sanchis ldquoTime seriesforecasting by evolving artificial neural networks using geneticalgorithms and differential evolutionrdquo in Proceedings of theInternational Joint Conference on Neural Networks (IJCNN rsquo10)pp 1ndash8 IEEE 2010
[52] H Karimi and M Ghaedi ldquoApplication of artificial neuralnetwork and genetic algorithm to modeling and optimizationof removal of methylene blue using activated carbonrdquo Journalof Industrial and Engineering Chemistry vol 20 no 4 pp 2471ndash2476 2014
[53] S Varshney L Srivastava and M Pandit ldquoParameter tuningof statcom using particle swarm optimization based neuralnetworkrdquo Advances in Intelligent and Soft Computing vol 130no 1 pp 813ndash824 2012
[54] L Imen L Djamel S Hassiba D Abdellah and F SelwaldquoOptimal power flow study using conventional and neuralnetworks methodsrdquo in Proceedings of the 4th InternationalConference on Renewable Energy Research and ApplicationsICRERA 2015 pp 1422ndash1427 Italy November 2015
[55] A Jain S Tripathy R Balasubramanian and Y KawazoeldquoStochastic load flow analysis using artificial neural networksrdquoin Proceedings of the 2006 IEEE Power Engineering SocietyGeneral Meeting p 6 pp Montreal Que Canada June 2006
[56] H A Hassan and A E-A Lasheen ldquoSizing of STATCOM toEnhance Voltage Stabilityrdquo Smart Grid and Renewable Energyvol 5 pp 8ndash18 2014
[57] D J Sargent ldquoComparison of artificial neural networks withother statistical approaches Results from medical data setsrdquoCancer vol 91 no 8 pp 1636ndash1642 2001
[58] M Clerc Particle swarm optimization ISTE London 2006[59] D Bratton and J Kennedy ldquoDefining a standard for particle
swarm optimizationrdquo in Proceedings of the IEEE Swarm Intelli-gence Symposium (SIS rsquo07) pp 120ndash127 IEEEHonoluluHawaiiUSA April 2007
[60] A B Rohler and S Chen ldquoAn analysis of sub-swarms in multi-swarm systemsrdquo in AI 2011 advances in artificial intelligencevol 7106 of Lecture Notes in Comput Sci pp 271ndash280 SpringerHeidelberg 2011
[61] D E Goldberg K Deb and J H Clark ldquoGenetic algorithmsnoise and the sizing of populationsrdquo Complex Systems vol 6pp 333ndash362 1992
[62] M Pelikan D E Goldberg and E Cantu-Paz Bayesian opti-mization algorithm population sizing and time to convergenceIllinois Genetic Algorithms Laboratory University of Illinois2000
[63] G R Harik F G Lobo and D E Goldberg ldquoThe compactgenetic algorithmrdquo IEEE Transactions on Evolutionary Compu-tation vol 3 no 4 pp 287ndash297 1999
[64] A E Eiben R Hinterding and Z Michalewicz ldquoParametercontrol in evolutionary algorithmsrdquo IEEE Transactions onEvolutionary Computation vol 3 no 2 pp 124ndash141 1999
[65] F G Lobo and D E Goldberg ldquoThe parameter-less geneticalgorithm in practicerdquo Information Sciences vol 167 no 1-4 pp217ndash232 2004
[66] ldquoInitial Population for Genetic Algorithms A Metric Ap-proachrdquo GEM pp 43ndash49 2007
[67] C J Willmott ldquoSome comments on the evaluation of modelperformancerdquo Bulletin of the American Meteorological Societyvol 63 no 11 pp 1309ndash1313 1982
Computer Games Technology
International Journal of
Hindawiwwwhindawicom Volume 2018
Hindawiwwwhindawicom
Journal ofEngineeringVolume 2018
Advances in
FuzzySystems
Hindawiwwwhindawicom
Volume 2018
International Journal of
ReconfigurableComputing
Hindawiwwwhindawicom Volume 2018
Hindawiwwwhindawicom Volume 2018
Applied Computational Intelligence and Soft Computing
thinspAdvancesthinspinthinsp
thinspArtificial Intelligence
Hindawiwwwhindawicom Volumethinsp2018
Hindawiwwwhindawicom Volume 2018
Civil EngineeringAdvances in
Hindawiwwwhindawicom Volume 2018
Electrical and Computer Engineering
Journal of
Journal of
Computer Networks and Communications
Hindawiwwwhindawicom Volume 2018
Hindawi
wwwhindawicom Volume 2018
Advances in
Multimedia
International Journal of
Biomedical Imaging
Hindawiwwwhindawicom Volume 2018
Hindawiwwwhindawicom Volume 2018
Engineering Mathematics
International Journal of
RoboticsJournal of
Hindawiwwwhindawicom Volume 2018
Hindawiwwwhindawicom Volume 2018
Computational Intelligence and Neuroscience
Hindawiwwwhindawicom Volume 2018
Mathematical Problems in Engineering
Modelling ampSimulationin EngineeringHindawiwwwhindawicom Volume 2018
Hindawi Publishing Corporation httpwwwhindawicom Volume 2013Hindawiwwwhindawicom
The Scientific World Journal
Volume 2018
Hindawiwwwhindawicom Volume 2018
Human-ComputerInteraction
Advances in
Hindawiwwwhindawicom Volume 2018
Scientic Programming
Submit your manuscripts atwwwhindawicom
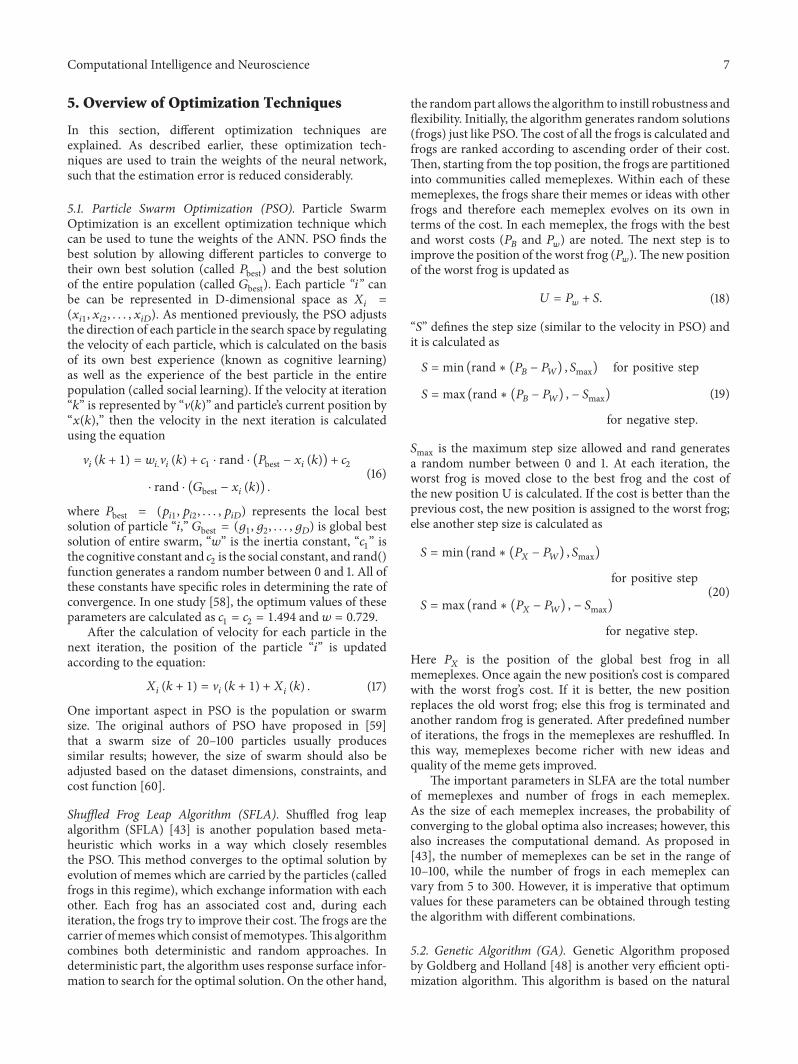
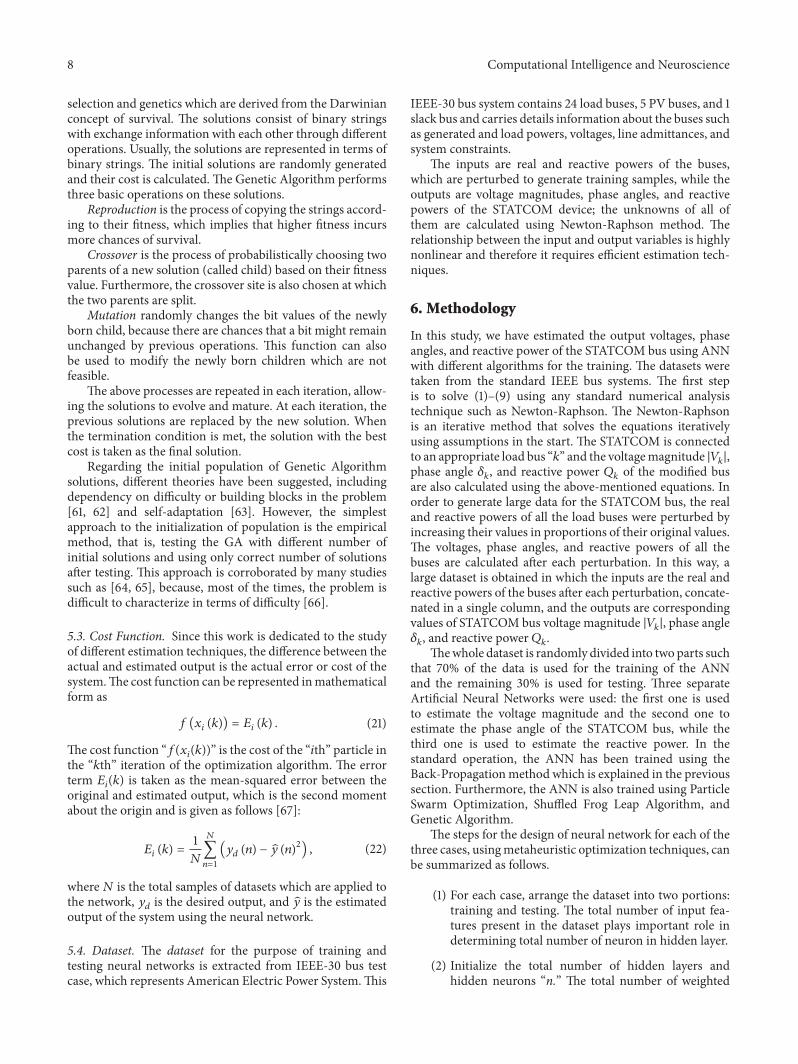