state assessment observations tressa madden, mph, res cso/standards implementation staff fda...
TRANSCRIPT

State Assessment ObservationsTressa Madden, MPH, RES
CSO/Standards Implementation StaffFDA
Tuesday, March 11, 20149:00 am – 10:00 am

MFPRS Performance Element Worksheets
• “Performance Indicator” worksheet was designed for use in 2012
• Promote standardized interpretation of MFRPS program elements
• Facilitate MFRPS meetings and dialogue• Provide states with a quality checklist to
facilitate implementation
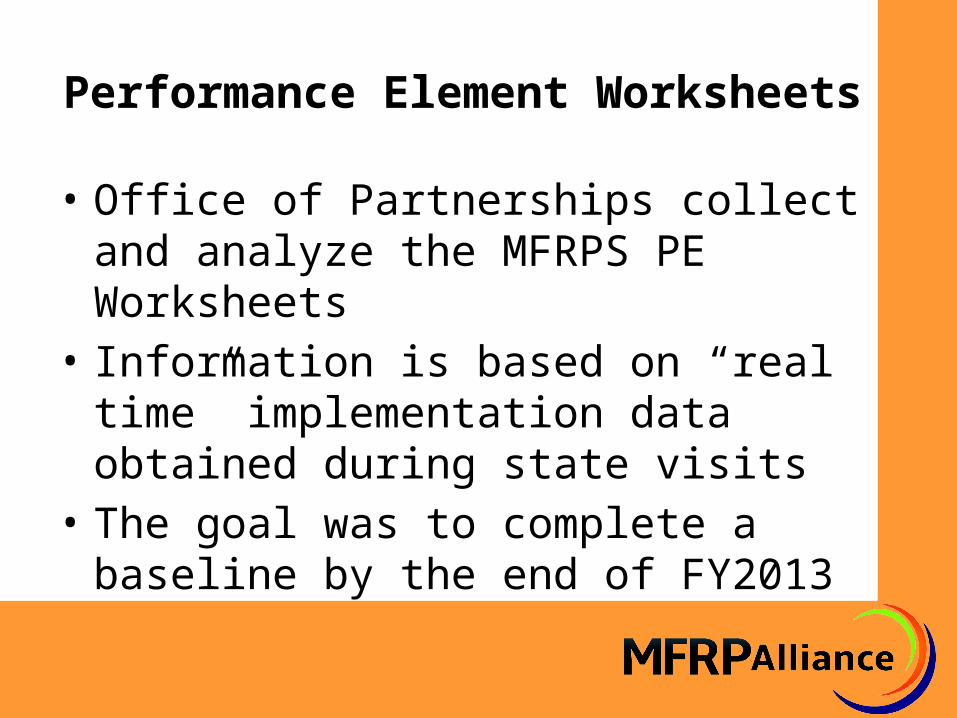
Performance Element Worksheets
• Office of Partnerships collect and analyze the MFRPS PE Worksheets
• Information is based on “real time” implementation data obtained during state visits
• The goal was to complete a baseline by the end of FY2013

PE Data Collection• The OP/Standards Implementation Staff mark
a “Yes” when it is determined that they are implementing a program element
• A “No” or “NA” is marked when determined they are not fully implementing an element or does not apply – addressed in comment area
• A “No” should be addressed on your state programs strategic plan
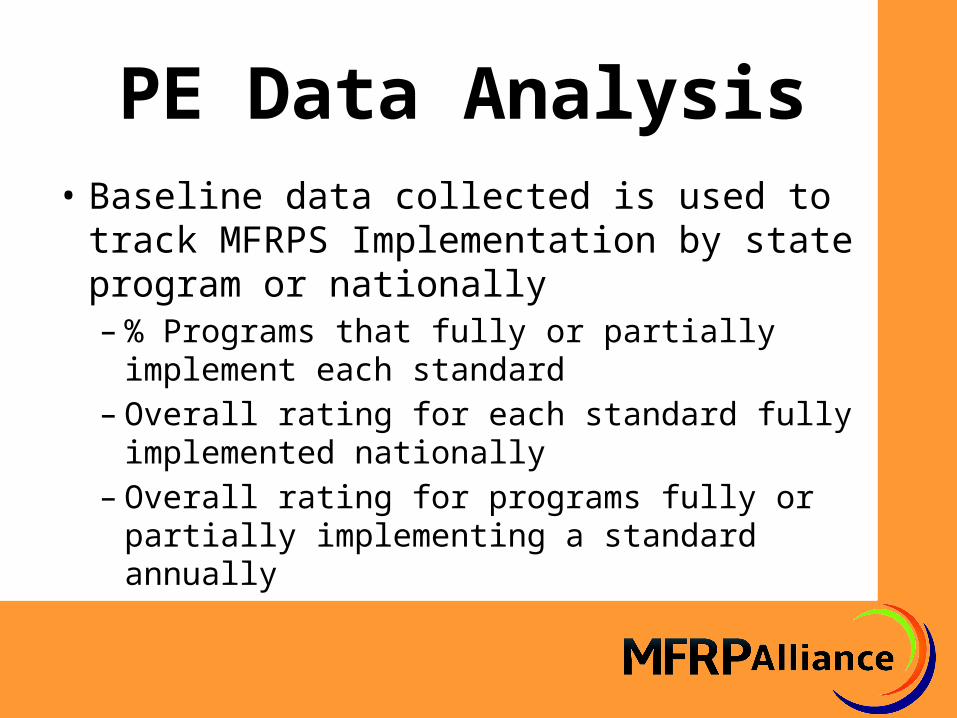
PE Data Analysis• Baseline data collected is used to track
MFRPS Implementation by state program or nationally– % Programs that fully or partially implement
each standard– Overall rating for each standard fully
implemented nationally – Overall rating for programs fully or partially
implementing a standard annually

PE Data Limitations• PE Data is an indicator of progress• Must be used in conjunction with other
information from the program– Resources– Strategic Plans– Timeframes for completion– Variables beyond the programs control (i.e.
Emergency Response Event)
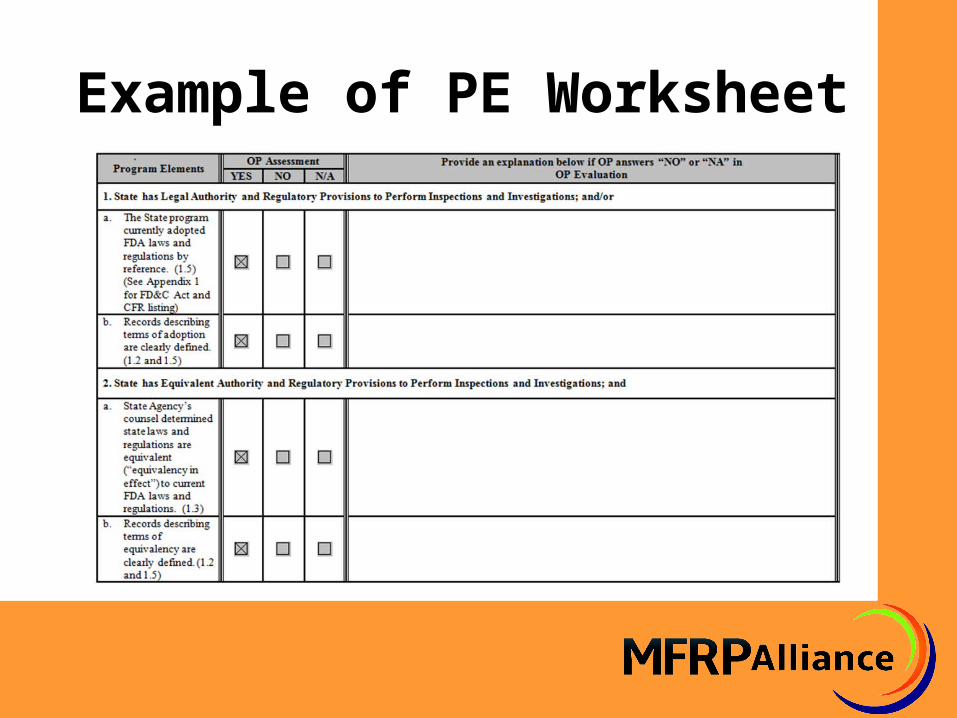
Example of PE Worksheet
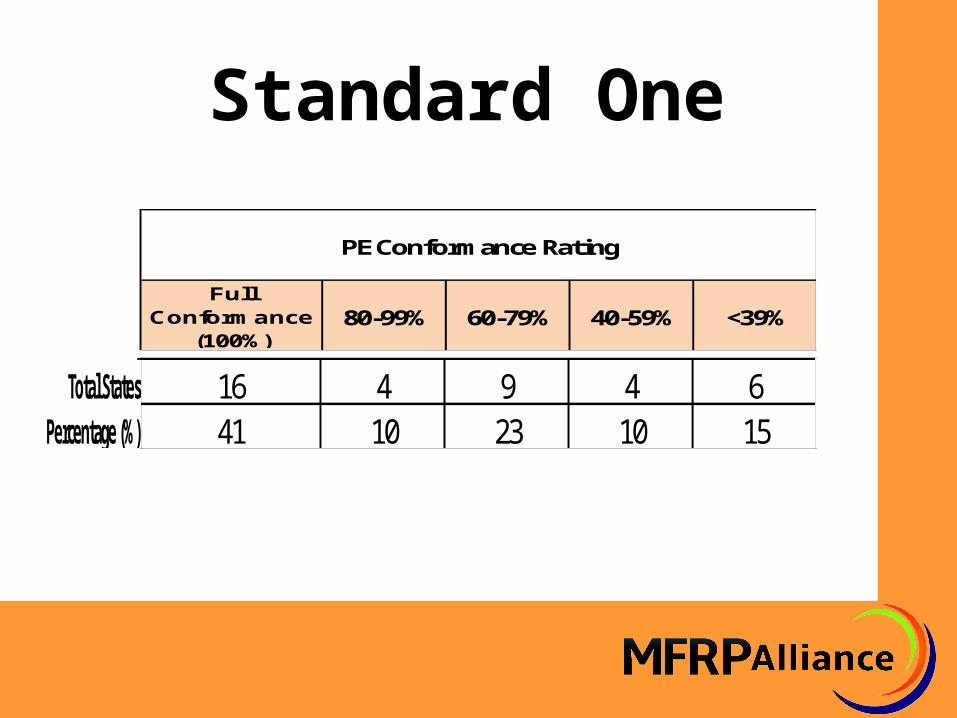
Standard One
Full Conformance
(100%)
80-99% 60-79% 40-59% <39%
PE Conformance Rating
16 4 9 4 641 10 23 10 15
Total StatesPercentage (%)

Standard One
No. of YES 22 30 16 21 36No. of NO 15 6 16 10 4No. of NA 3 4 8 9 0
Documentation
1.a 1.b 2.a 2.b 3
Equivalent Authority & Regulations
Legal Authority & Regulations
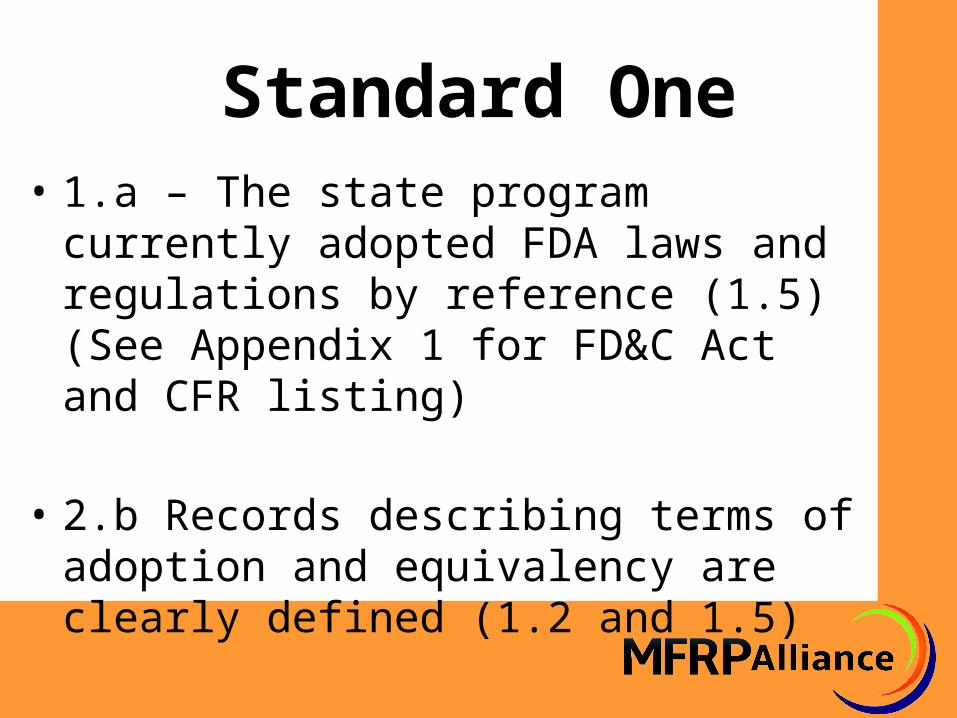
Standard One• 1.a – The state program currently adopted
FDA laws and regulations by reference (1.5) (See Appendix 1 for FD&C Act and CFR listing)
• 2.b Records describing terms of adoption and equivalency are clearly defined (1.2 and 1.5)
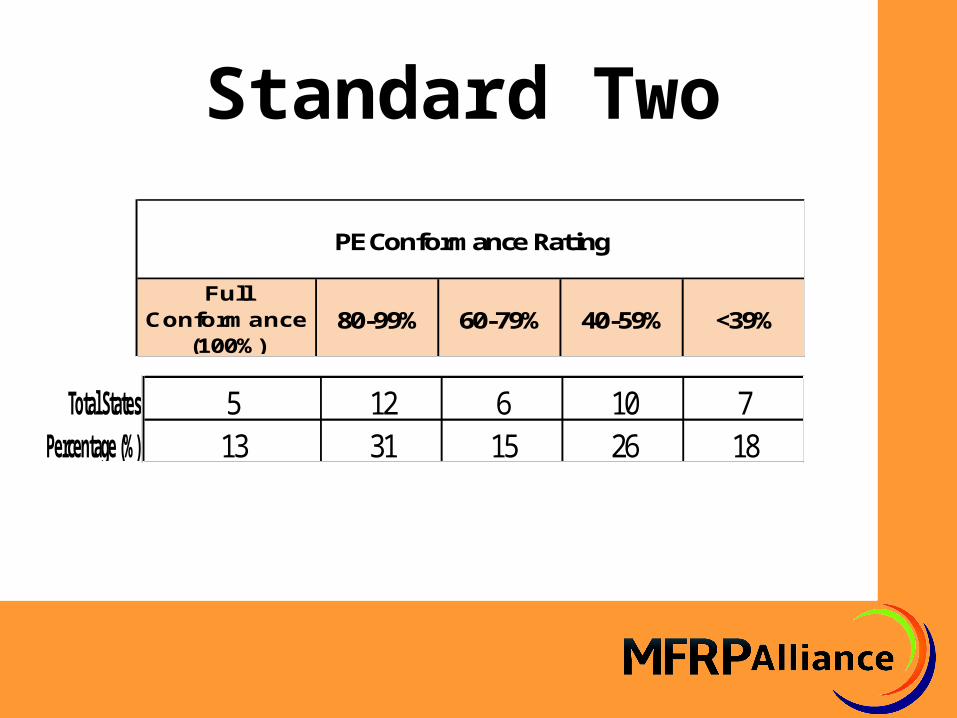
Standard Two
Full Conformance
(100%)
80-99% 60-79% 40-59% <39%
PE Conformance Rating
5 12 6 10 713 31 15 26 18
Total StatesPercentage (%)

Standard Two
No. of YES 19 25 25 22 25 25 15 25 29 29 27 31No. of NO 21 14 12 17 12 13 18 14 11 11 13 9No. of NA 0 1 3 1 3 2 7 1 0 0 0 0
1.a 1.b 2.a 2.b 2.c 3.a 3.b 4.a 4.b 5.a 5.b 5.c
Continuing Education
Training Records and Documentation
State Training Plan Basic Food Insp. TrainingAdvanced Food Insp. Training

Breakout Session Focus
• Elements 2.1.a State programs have training plan that ensures all inspectors received training adequate to perform their work assignment
• Elements 2.2.b & 2.3.b Field Training– Focus on conducting joint inspections and
inspection audits– Frequency and time requirements

Standard Three
Full Conformance
(100%)
80-99% 60-79% 40-59% <39%
PE Conformance Rating
1 11 14 5 83 28 36 13 21
Total StatesPercentage (%)

Standard Three
1.a 1.b 1.c 1.d 1.e 2.a 2.b 3.a 3.b 3.c 3.d 3.e 4.a 4.b 4.c 5.a 5.b 5.c 6.a 6.b
Risk Based Inspection System Inspection Protocol Recall System Consumer Complaint SystemFood Industry Complaint
Resolution SystemSelf Assessment
No. of YES 35 26 38 23 23 14 13 25 18 20 19 15 35 29 26 24 19 18 37 31No. of NO 4 11 1 16 16 25 26 14 21 19 20 24 4 10 13 15 20 21 2 8No. of NA 0 2 0 0 0 0 0 0 0 0 0 0 0 0 0 0 0 0 0 0
Breakout Session Focus
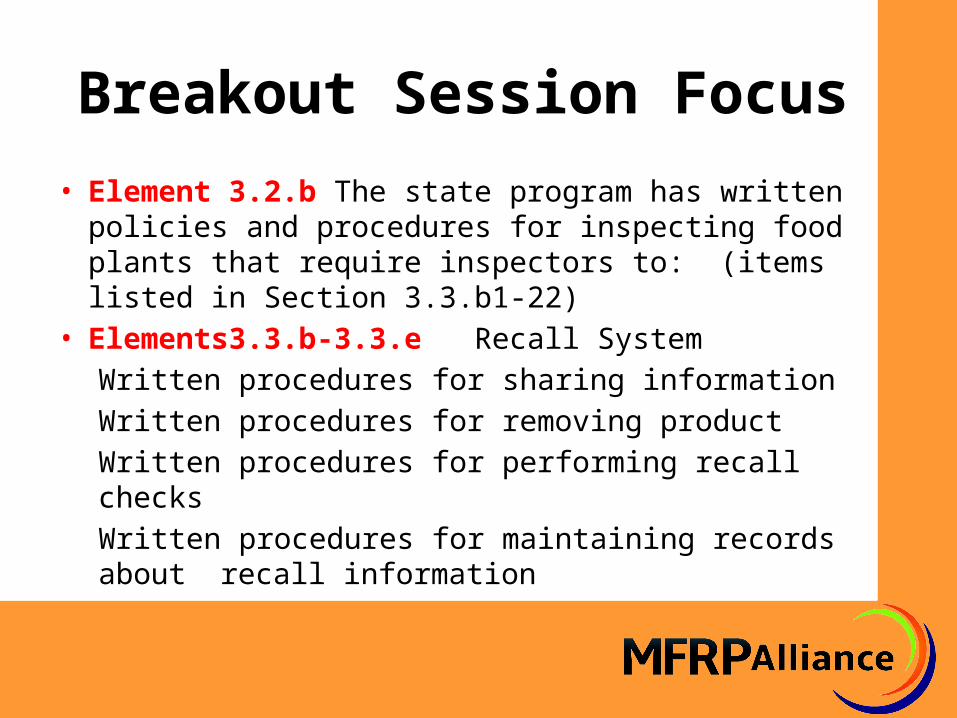
• Element 3.2.b The state program has written policies and procedures for inspecting food plants that require inspectors to: (items listed in Section 3.3.b1-22)
• Elements3.3.b-3.3.e Recall SystemWritten procedures for sharing informationWritten procedures for removing productWritten procedures for performing recall checksWritten procedures for maintaining records
about recall information

Standard Four
Full Conformance
(100%)
80-99% 60-79% 40-59% <39%
PE Conformance Rating
4 4 2 2 2710 10 5 5 69
Total StatesPercentage (%)

Standard Four
1.a 1.b 2.a 2.b 2.c 3.a 3.b 3.c 4.a 4.b 4.c 5.a 5.b 6.a 6.b
Field Inspection Audits Inspection Report Audits Sample Report AuditQuality Assurance
ProgramCorrective Action
PlanDocumentation
No. of YES 8 10 11 18 16 8 12 12 8 9 8 11 8 15 12No. of NO 30 28 28 21 23 31 27 27 30 27 27 28 31 24 27No. of NA 0 0 0 0 0 0 0 0 1 3 3 0 0 0 0

Breakout Session Focus
• Elements 4.2b &c, 4.3b & c, and 4.4b & c Implementation of the 3 Types of Audits– Field Inspection– Inspection Report– Sampling

Standard Five
Full Conformance
(100%)
80-99% 60-79% 40-59% <39%
PE Conformance Rating
6 16 7 5 515 41 18 13 13
Total StatesPercentage (%)

Standard FiveSelf
Assessment
1.a 1.b 2.a 2.b 2.c 2.d 2.e 2.f 2.g 2.h 2.i 2.j 2.k 2.l 3 4.a 4.b 4.c 4.d 4.e
DocumentationFood-related Illness InvestigationState Program Contracts for
Support
28 22 23 34 33 20 32 32 19 27 19 28 29 29 39 28 24 25 17 3410 15 8 4 6 19 5 6 11 12 15 11 10 10 0 9 15 14 22 51 2 8 1 0 0 2 1 9 0 5 0 0 0 0 2 0 0 0 0

Breakout Session Focus
• Element 5.2d System for traceback and trace-forward of food implicated in an illness, injury or outbreak
• Element 5.2g System for distribution of final report of illness, injury and outbreak
• Element 5.2i Establish criteria for releasing information to the public

Standard Six
Full Conformance
(100%)
80-99% 60-79% 40-59% <39%
PE Conformance Rating
3 2 8 7 198 5 21 18 49
Total StatesPercentage (%)

Standard Six
1.a 1.a.1 1.a.2 1.a.3 1.a.4 1.a.5 2.a 2.a.1 2.a.2 2.a.3
Compliance and Enforcement ProgramPerformance Review and Enforcement
Action
No. of YES 31 23 14 23 18 20 5 8 6 6No. of NO 8 16 25 16 21 19 34 31 33 33No. of NA 0 0 0 0 0 0 0 0 0 0

Breakout Session Focus
• Elements 6.2a.1, 2a.2 and 2a.3• Conduct performance review of
enforcement strategies every 12 mo.• Calculate overall rating to interpret
compliance and enforcement• Performance below 80%, needs
improvement

Standard Seven
Full Conformance
(100%)
80-99% 60-79% 40-59% <39%
PE Conformance Rating
25 9 3 2 064 23 8 5 0
Total StatesPercentage (%)

Standard Seven
1.a 1.b 1.c 1.d 1.e 2.a 2.b
Communication and Information Exchange Documentation
No. of YES 39 38 38 37 34 31 33No. of NO 0 1 1 2 5 8 6No. of NA 0 0 0 0 0 0 0

Breakout Session Focus
• Element 7.2.a• Documentation of outreach activities

Standard Eight
Full Conformance
(100%)
80-99% 60-79% 40-59% <39%
PE Conformance Rating
8 11 12 4 321 28 31 10 8
Total StatesPercentage (%)

Standard EightAdmin
Program Support
Program Resource Assessm
ent
Staffing Level
1 2 3 4.a 4.b
Equipment
No. of YES 30 32 24 34 14No. of NO 9 7 15 5 25No. of NA 0 0 0 0 0

Standard Nine
Full Conformance
(100%)
80-99% 60-79% 40-59% <39%
PE Conformance Rating
23 5 8 0 459 13 21 0 10
Total StatesPercentage (%)

Standard Nine
1.a 1.a.1 1.a.2 1.b 2.a 2.b
System for Continuous
Improvements
System to conduct Program Self-Assessment
No. of YES 37 38 36 33 29 28No. of NO 3 2 4 7 11 12No. of NA 0 0 0 0 0 0
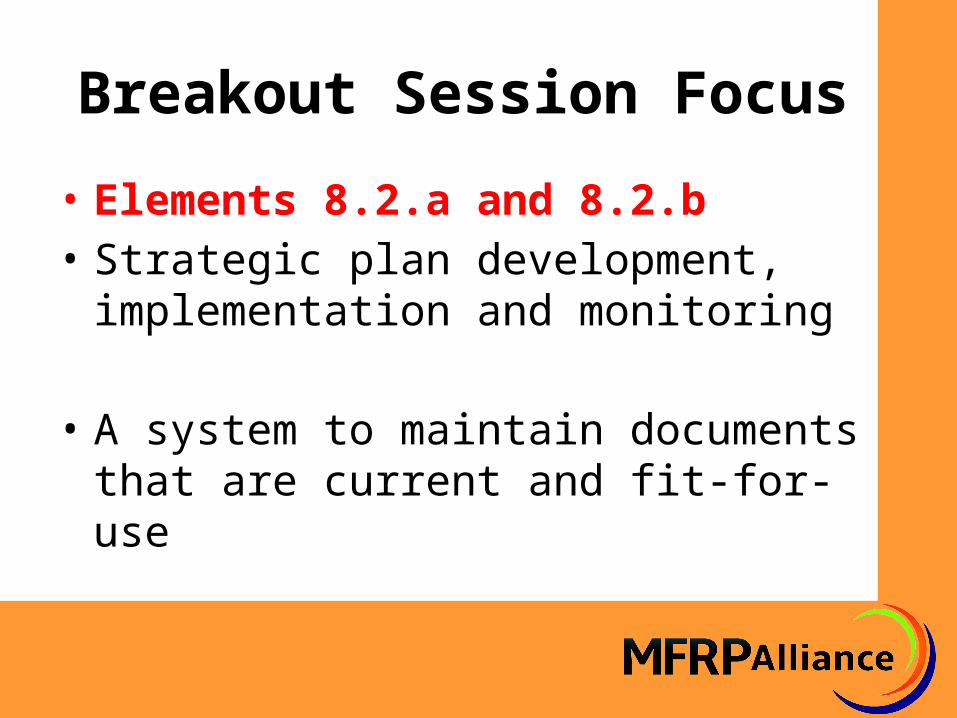
Breakout Session Focus
• Elements 8.2.a and 8.2.b• Strategic plan development, implementation
and monitoring
• A system to maintain documents that are current and fit-for-use
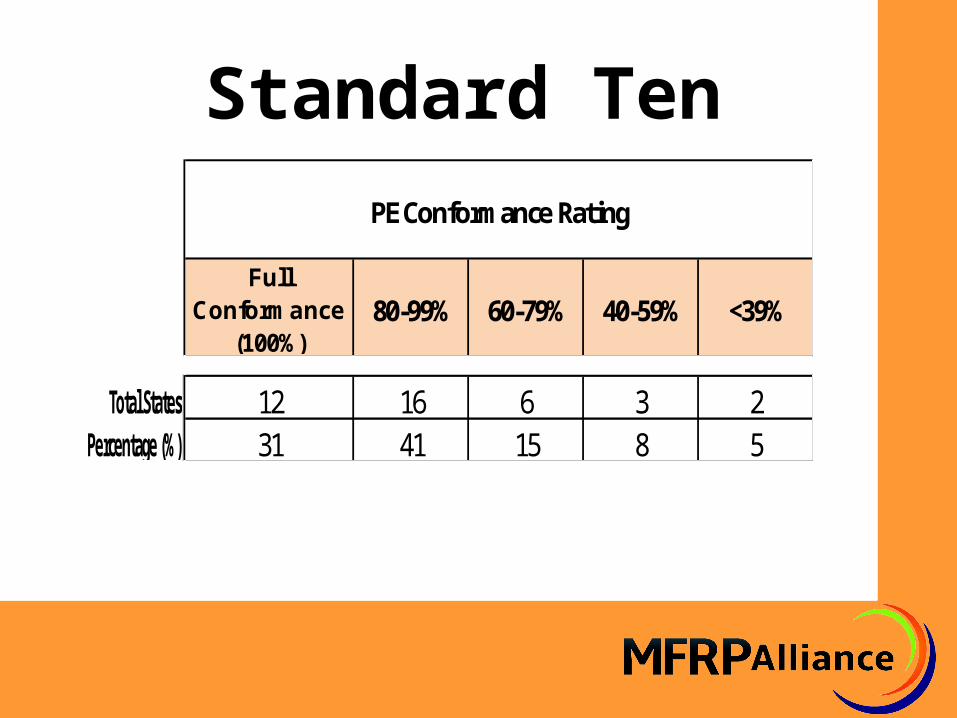
Standard Ten
Full Conformance
(100%)
80-99% 60-79% 40-59% <39%
PE Conformance Rating
12 16 6 3 231 41 15 8 5
Total StatesPercentage (%)

Standard TenSelf
Assessment
1.a 1.b 1.c 1.d 1.e 2
Laboratory Services
No. of YES 35 37 30 16 14 34No. of NO 4 2 7 6 23 5No. of NA 0 0 2 17 2 0

Breakout Sessions Objectives
• Identify resources that currently exist• Identify best practices in SOP development
and implementation that has been used by state programs
• Identify what internal verification procedures are being utilized by state programs

Best Practices• Will be identified and shared during the
MFRP Alliance meeting
• AFDO Portal for MFRPS will post information for state programs to utilize when building and improving their programs

Instructions• You were given a number when you arrived• You will attend breakout sessions specific to
Standards 2 ,3, 4, 5, 6, 7 and 9• No. 1 = Standards 2 today and 4 &7
tomorrow• No. 2 = Standards 3 today and 6 tomorrow• No. 3 = Standards 5 today and 9 tomorrow

Questions?
