state climate leadership - 4cleanair.org · state climate leadership: how (and why) ... overlap...
TRANSCRIPT
State Climate Leadership:How (and Why) States
Are Acting on Climate Change
COP9 – Milan, Italy06 December 2003
Ken Colburn, Executive DirectorNESCAUM

Why Are States Acting?
• Defensively:– Sense of urgency; exposure to climate risks– Protecting existing economies
• Offensively:– Learning curve; early adopters secure
competitive advantage• Aggressively to protect:
– Public Health– Quality of Life
• Significant relative impact• Prior success leading by example

TemperatureChange in the
Northeast1895-1999
(Source: NERA, 2001)
Impacts to skiing, snowmaking,
snowmobiling, ice fishing, etc.?

Changes in Dominant Forest Types Under Two Climate Scenarios
Source: U.S. Global Change Research Program
Impacts to forest products industry, paper making, foliage season,
maple sugaring, hunting habitat, etc.?

Overlap with Criteria Pollutants (Particulate Matter, Ozone, etc.)
Burlington VT PM2.5 7/7/02
FRM : 61.4 ug/m3
Duplicate FRM: 62.6 ug/m3
CAMM 24-hr mean: 61.9 ug/m3
And this is not an Exceedance Day!
Clear Skies?
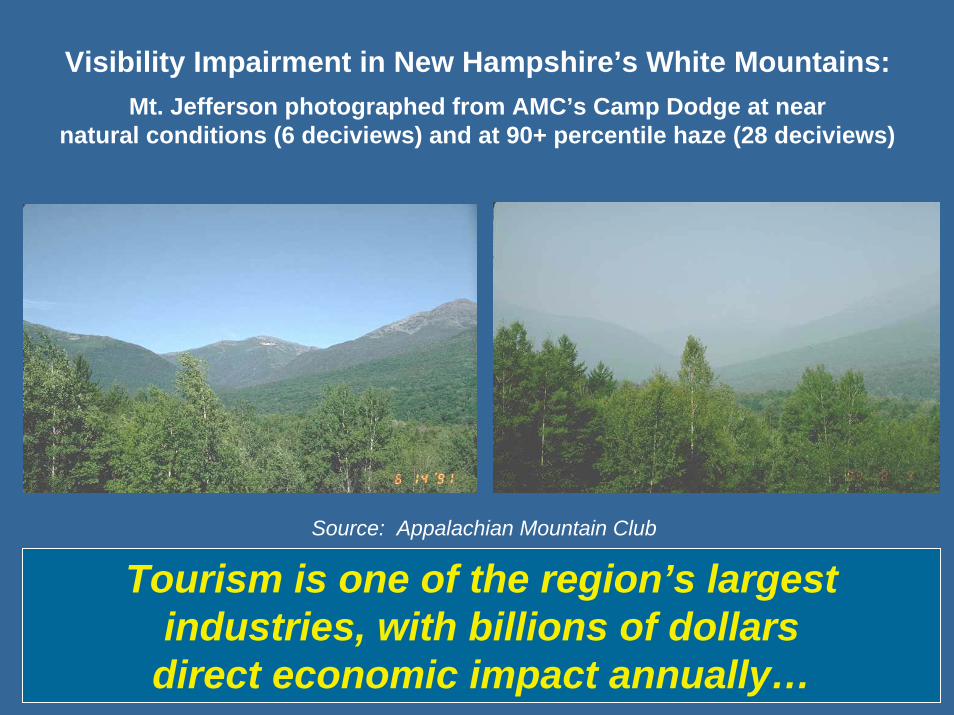
Visibility Impairment in New Hampshire’s White Mountains:Mt. Jefferson photographed from AMC’s Camp Dodge at near
natural conditions (6 deciviews) and at 90+ percentile haze (28 deciviews)
Source: Appalachian Mountain Club
Tourism is one of the region’s largest industries, with billions of dollars
direct economic impact annually…

Green & Gold 2000 - Rankings of StatesData Source: Institute for Southern Studies, 2000
0
5
10
15
20
25
30
35
40
45
50
0 5 10 15 20 25 30 35 40 45 50
Gold - Economic Ranking
Gre
en -
Envi
ronm
enta
l Ran
king
LowestRankedStates
HighestRankedStates

Per Capita Personal Income versus Utility Average Electricity Price for the 50 States and Washington, DC
(Data Sources: US Department of Commerce, Bureau of Economic AnalysisUS Energy Information Administration)
$15,000
$20,000
$25,000
$30,000
$35,000
$40,000
3 4 5 6 7 8 9 10 11 12 13
Utility Average Electricity Price (cents/kWh, 1998)
Per
Cap
ita P
erso
nal I
ncom
e (1
998)

An Economic Sea Change is Underway
Energy
Environment
EconomyEconomy
Old Paradigm:
Environment
Energy
EconomyEconomy
New Paradigm:

Evidence of an Economic Sea Change
• ACEEE: Energy/GDP fell 42% from 1970-1999• States with higher electric rates often have:
– Low poverty rates; low unemployment; high PCI– High growth in jobs, businesses, & Per Capita Income
• Global Business Competitiveness:– Power Quality & Reliability increasingly mportant
• Bank of Omaha (chose fuel cells); semiconductor manufacturers– Companies need to reduce vulnerability to price shocks,
supply disruptions, etc. (CA, Northeast, EU, etc.)– Basis of financial performance and international
competitiveness is changing (“Triple Bottom Line”)– Economic opportunity: “Who will own the patents?”– Dollar cost savings that energy efficiency provides
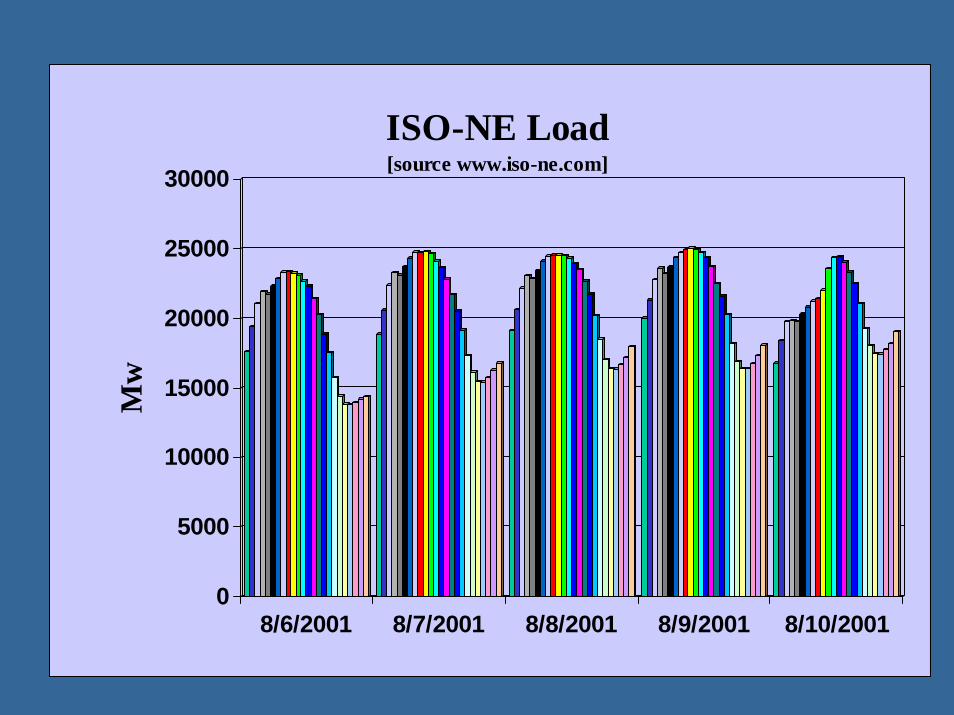
0
5000
10000
15000
20000
25000
30000
Mw
8/6/2001 8/7/2001 8/8/2001 8/9/2001 8/10/2001
ISO-NE Load [source www.iso-ne.com]

0100200300400500600700800900
1000
$/M
wh
8/6/2001 8/7/2001 8/8/2001 8/9/2001 8/10/2001
Hourly Bids ISO-NE[source www.iso-ne.com]

Employment & Energy Supply:Renewables Favor Environment AND Jobs
Source: Working for the Environment, Worldwatch Institute, Working Paper 152, September 2000.
GenerationSource
GenerationMarket Share
JobsSupported
Jobs per 1%Market Share
Wind 1.2% 15,000 12,500 Nuclear 33% 38,000 1,152 Coal 26% 80,000 3,077
Germany, Electricity Market Share, 1998

Are We Wedding Ourselves to Energy Technologies of the Past...
Source: Working for the Environment, Worldwatch Institute, Working Paper 152, September 2000.

…Or to the Energy Technologies
of the Future?
Source: Working for the Environment, Worldwatch Institute, Working Paper 152, September 2000.

Economics 101: Factors of Production
Time-to-Market – +
Factor BAU EE/RE
Material (Raw Material) + –Method (Technology) – +
Machine (Capital) + –Man (Labor) – +
Security & Certainty – +“6 Sigma” Quality – +
“Ecosystem Services” – +

“Place” Matters More in the New Economy
In an economy where physical assets are not as important as they used to be, where intellectual assets dominate, where business can be conducted from anywhere to anywhere, it would seem that place should not matter; in fact, it matters more. … Places – through the quality of life they offer – matter because entrepreneurs and highly skilled and sought-after workers want to live in areas with educational, cultural, natural and civic amenities.1 [emphasis added]
1 NetworkNH (a consortium of high tech companies), NH in the 21st Century, Competing in the New Economy, December 1, 2000, p. 16. See http://www.network.com

States Grasp the New Economics of Environment & Energy
And are acting on it...- New England (NEG/ECP)- NH (4-P Legislation; Registry)- MA (4-P regulation)- CA (Pavley, Renewable
Energy Mandate, Climate Action Registry)
- WI, ME (Registry, Mandatory Reporting)
- NJ (Voluntary Climate Effort; PSEG Settlement)
- NY (State Action Plan; Reduction Commitments?)
On a national basis, these states represent:
17% of CO2 emissions29% of population31% of Business Tax Base38% of GDP

Old or New Energy Path?
ECONOMICEFFICIENCY
Lower
Higher
TIME
Energy Efficiency & Renewables Path(MORE jobs, reliable, secure, clean, andexportable)
Energy Intensity Path(LESS jobs, reliable,
secure, clean, andexportable)
Competitive AdvantageLost to Delay
Now Later
Sustainability

What Difference Does it Make? States Have Significant Relative Impact…
• 1997 GHG Emissions:– NESCAUM States > Canada, Korea, Italy, Mexico,
Australia, Brazil, France, or Spain– New York > Taiwan or Venezuela– New England > Netherlands or Argentina– New Jersey > Egypt, Belgium, or Algeria– Massachusetts > Greece, Austria, Denmark, Kuwait,
Norway, Sweden, Israel, or Portugal– Connecticut > Switzerland, Ireland, New Zealand, or Peru– Maine > Croatia, Estonia, or Tunisia– New Hampshire > Lithuania, Jordan, or Ivory Coast– Rhode Island > Bolivia, Jamaica, Panama, or Kenya– Vermont > Paraguay, Tanzania, Iceland, or Cyprus

... Which Adds Up Rapidly
Top Emitters of CO2 (1998 Mtons C):1 UNITED STATES OF AMERICA 14862 CHINA (MAINLAND) 8503 RUSSIAN FEDERATION 3904 JAPAN 3105 INDIA 2906 NORTHEAST STATES + CALIFORNIA 2307 GERMANY 2258 UNITED KINGDOM 1509 NORTHEAST STATES 13010 CANADA 125Source: G. Marland et al., Oakridge National Lab, 1998; EIA, 1999

Prior “Lead by Example” Success• State Acid Rain laws: 1985
– Federal Acid Rain provisions: 1990• State laws for Toxic Air Contaminants: 1987
– Federal Toxics Program: 1990• State “4-P” laws for power plants: 2001-2
– Federal “4-P” law: (Introduced)• Statewide GHG reduction law: 2003
– Federal GHG law: (Introduced)• State/Regional GHG registries: 1999-2000
– Rigorous Federal Registry: (Coming?)• State GHG reductions from vehicles: 2002
– Federal vehicle GHG law: ?

State Climate Actions Proliferating (1)
• Oregon – 1997 first law requiring new power plants
to offset CO2 emissions• Massachusetts
– 2001 first “4-P” regulations; include 10% CO2 cut below 1997-99 baseline
• New Hampshire– 1999 first GHG registry law– 2002 first “4-P” law; cuts CO2 to 1990
levels by 2010

State Climate Actions Proliferating (2)
• California– 2001 first functioning GHG registry– 2002 law requiring “maximum feasible and
cost effective” CO2 reductions from passenger cars and trucks
• Maine– 2003 first law requiring economy-wide
reduction in GHG emissions to 1990 level by 2010
– 2003 GHG emission reporting requirement
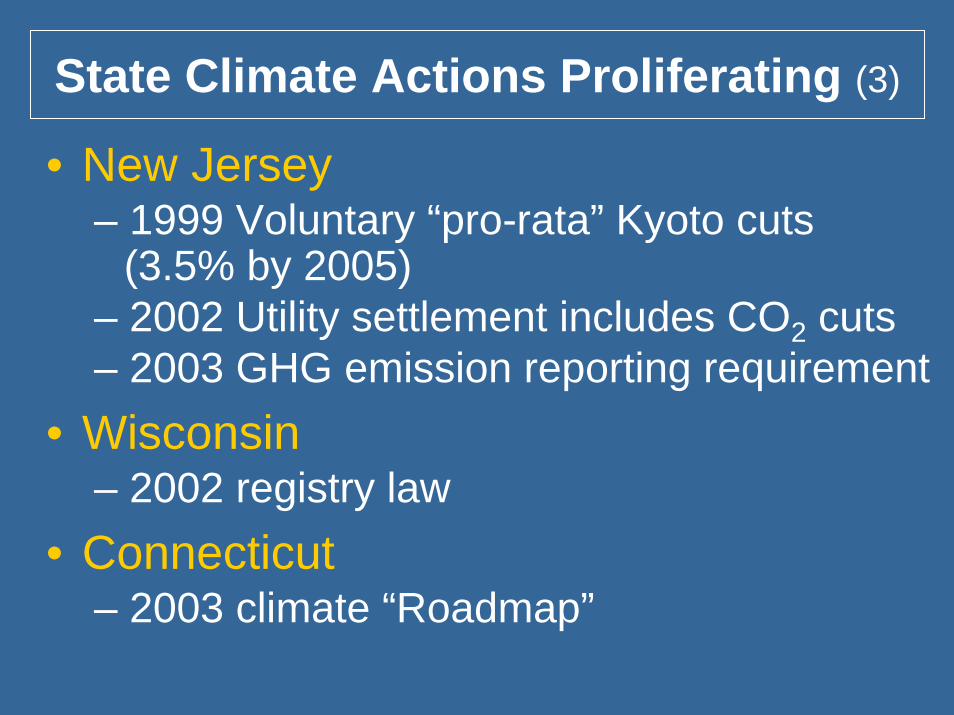
State Climate Actions Proliferating (3)
• New Jersey– 1999 Voluntary “pro-rata” Kyoto cuts
(3.5% by 2005)– 2002 Utility settlement includes CO2 cuts– 2003 GHG emission reporting requirement
• Wisconsin– 2002 registry law
• Connecticut– 2003 climate “Roadmap”

State Climate Actions Proliferating (4)
• Renewable Power Mandates (not all)– Maine: 30% by 2000– California: 20% by 2017– Nevada: 15% by 2013– Connecticut: 13% by 2009– New Mexico: 10% by 2011– New Jersey: 6.5% by 2012– Minnesota: 4.8% by 2012– Massachusetts: 4% by 2009– Texas: 2.2% by 2009– Wisconsin: 2.2% by 2011

States Are Also Acting Regionally…

New England Governors andEastern Canadian Premiers
Regional Climate Commitment, 2001• Short-Term:
– Reduce GHG economy-wide to 1990 levels by 2010• Mid-Term:
– Reduce by at least 10% below 1990 levels by 2020– Establish an iterative “five-year process, starting in
2005, to adjust the goals if necessary, and set future emissions reduction goals”
• Long-Term:– Reduce “sufficiently to eliminate any dangerous threat
to the climate “– Expected to be “75-85% below current levels”

NEG-ECP: Action Steps (1)
• Action Item 1: Establish Standardized Regional GHG Emissions Inventory
• Action Item 2: Establish a Plan for Reducing GHG Emissions and Conserving Energy
• Action Item 3: Promote Public Awareness
• Action Item 4: Governments Lead by Example– Reduce Public Sector GHG by 25% by 2012
• Action Item 5: Reduce Electricity Sector GHG– Lower CO2/MWH by 20% by 2025

NEG-ECP: Action Steps (2)
• Action Item 6: Reduce Total Energy Demandthrough Conservation
– By 2025, increase energy saved by 20%
• Action Item 7: Reduce and/or Adapt to Negative Social, Economic, and Environmental Impacts of Climate Change
• Action Item 8: Reduce Growth in TransportationSector GHG Emissions
• Action Item 9: Create Regional GHG Emissions Registry and Explore Regional Trading

West Coast Governors’ Initiative
• Announced: September 2003• Includes: CA, OR, & WA• Purpose: Joint strategy to reduce global
warming• Initial Components:
– Combined purchasing for fuel efficient fleets– Uniform appliance efficiency standards– Measuring & reporting GHG emissions– Reducing diesel generator use on ships

Regional Greenhouse Gas Initiative (RGGI) (1)
• Initiated – April 2003 invitation by New York Governor Pataki to 10 Northeast and Mid-Atlantic states
• Purpose – Discuss adopting a power sector GHG “Cap-and-Trade” system
• Status – 9 states “in”; 2 observing for now; 1 province observing
• Workplan – Developed, approved by state environment ministers

Regional Greenhouse Gas Initiative (RGGI) (2)
• Start simple: CO2 & power sector, then expand to other gases, sectors, offsets
• Will include: Data gathering, expert briefings, technical analyses, cost & benefits assessment, stakeholder participation
• Other states: May join• Phase 1 Target: Model rule April 2005

Northeast Regional Greenhouse Gas Registry
• Funded; development effort commencing• Goal: Support states’ current & future efforts• Will seek consistency with:
– Other state/regional registries– Recognized GHG Protocols
• States, NESCAUM, WRI, California Registry– Stakeholder process to follow
• Focus on power sector (RGGI), then others• Target start: Mid-to-Late 2005
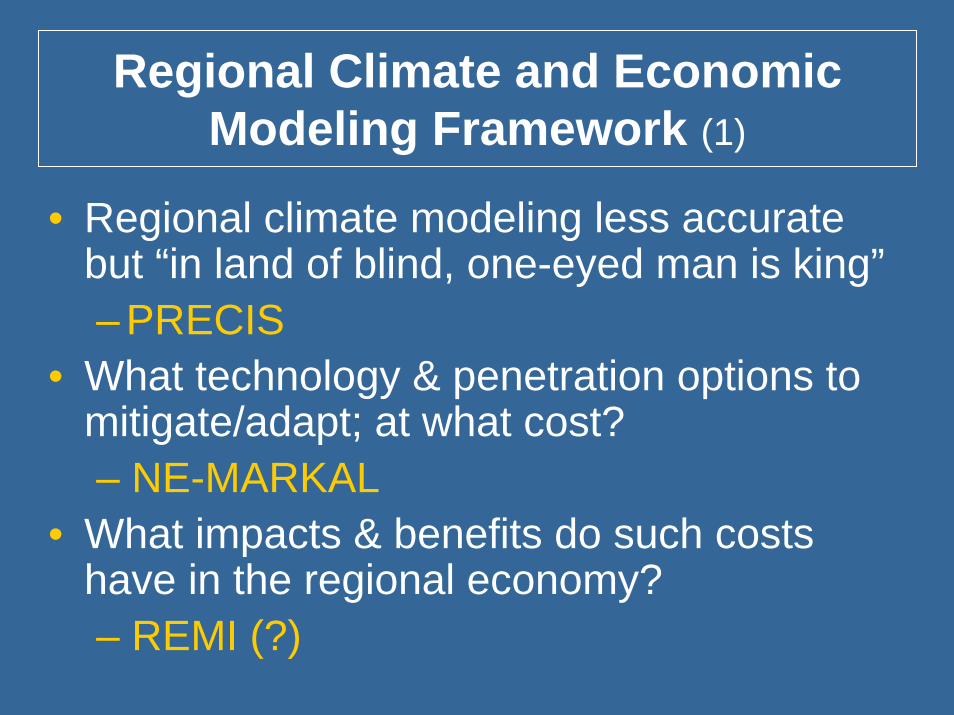
Regional Climate and Economic Modeling Framework (1)
• Regional climate modeling less accurate but “in land of blind, one-eyed man is king”– PRECIS
• What technology & penetration options to mitigate/adapt; at what cost? – NE-MARKAL
• What impacts & benefits do such costs have in the regional economy?– REMI (?)

Regional Climate and Economic Modeling Framework (2)
• Will allow political leadership to make more educated policy decisions
• Framework is not yet funded; seeking support

Litigation
• 1999 – NGOs petitioned EPA to regulate GHG from mobile sources
• August 2003 – EPA denied having authority to regulate GHG emissions
• October 2003 – 12 states, plus cities & NGOs, appealed EPA’s denial
• States include: CA, CT, IL, ME, MA, NJ, NM, NY, OR, RI, VT, and WA

And “State Activities” Exclude…
• Municipalities – 140+ ICLEI cities; 155 Mayors’ letter to Congress
• Scientists – 1000 wrote to Senate• Businesses – Many acting without mandate• Investors – CERES; pension funds• Public – Polling favors action 3-4:1• Movement in Congress
– S.139 vote (McCain-Lieberman)– S.843 (Carper-Chafee-Gregg-Alexander “4-P”)
• Not just U.S. States – Australia? Others?

Thank you for your time and attention!