state data tool science & engineering indicators robin pentola december 4, 2012 presented at:...
TRANSCRIPT
State Data ToolScience & Engineering Indicators
Robin PentolaDecember 4, 2012
Presented at:
2012 FCSM Statistical Policy Seminar Collaborating to Achieve Innovation and Efficiencies:
Advances and Opportunities
National Science FoundationNational Center for Science and Engineering Statistics
www.nsf.gov/statistics/
Science and Engineering Indicators
Congressionally mandated, biennial publication containing data on the U.S. and international science and engineering enterprise.
700+ printed pages
8 chapters
appendix tables available online
Grew out of Chapter 8 of Science and Engineering Indicators
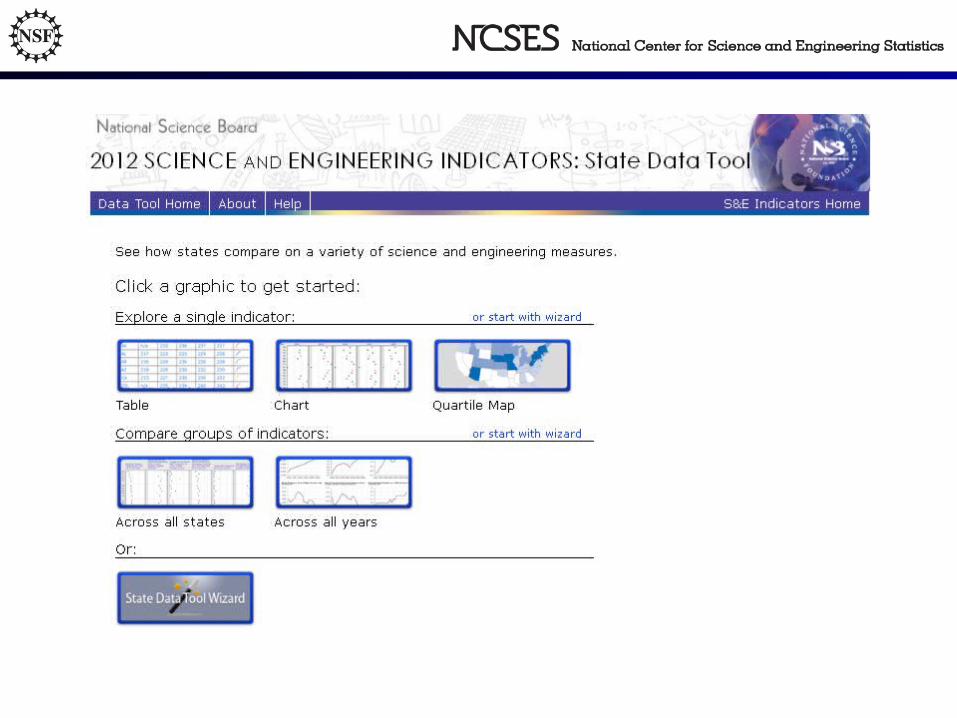
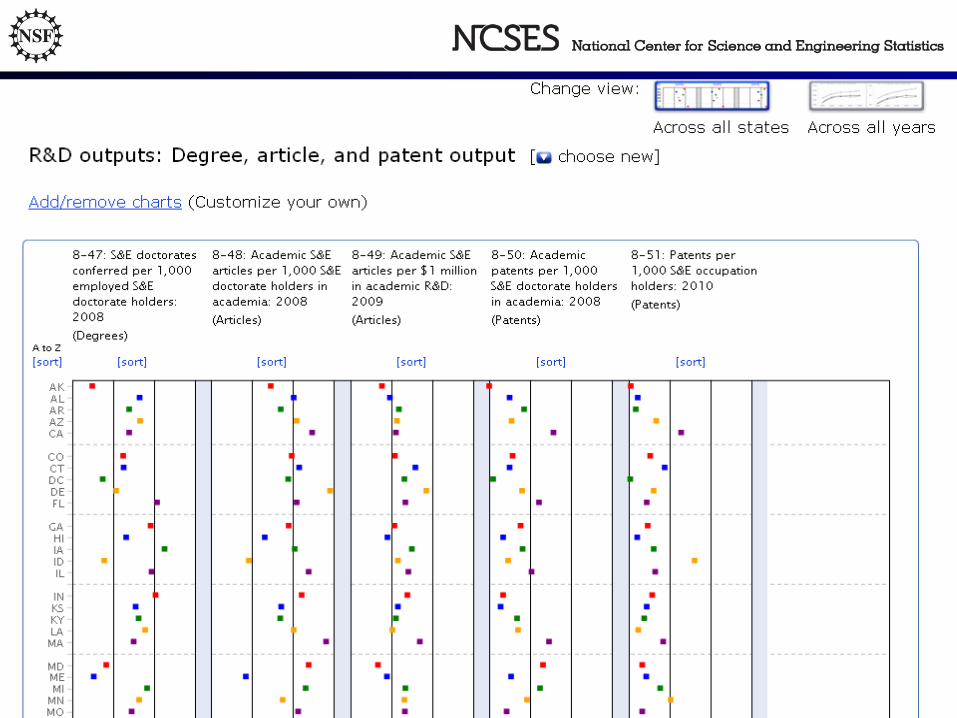
Designed to present information about various aspects of state S&T infrastructure S&T education Employed workforce Financial R&D inputs R&D outputs S&T in the economy
• Large amount of data gathered at state level• 2012: 58 indicators
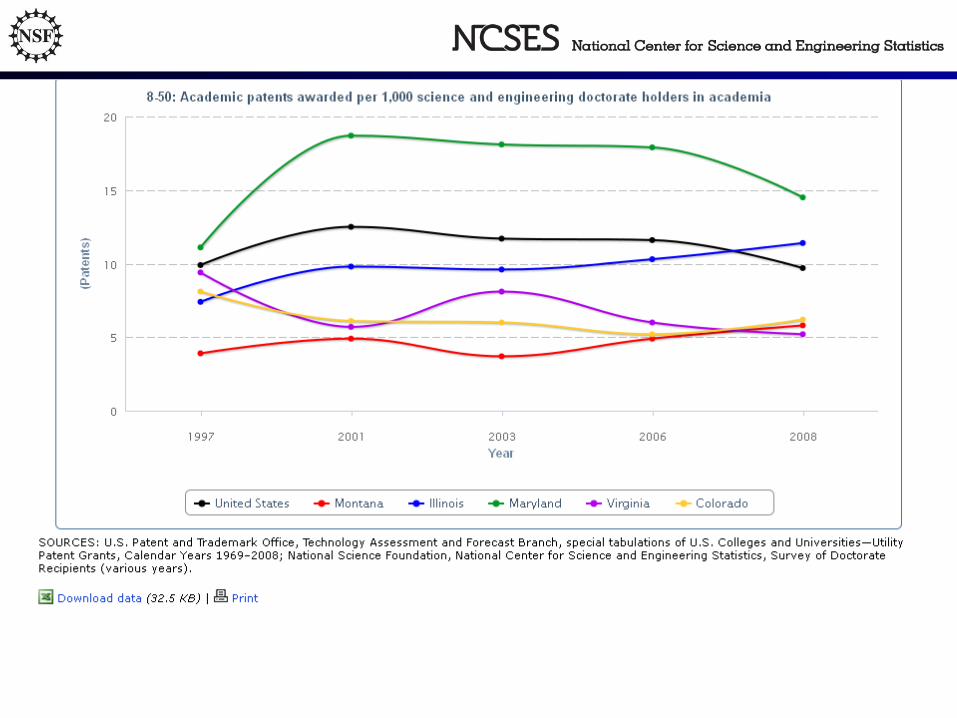
• Print format restricted amount of data available to users• By expanding the online presentation, able to include trend data for 20
years.
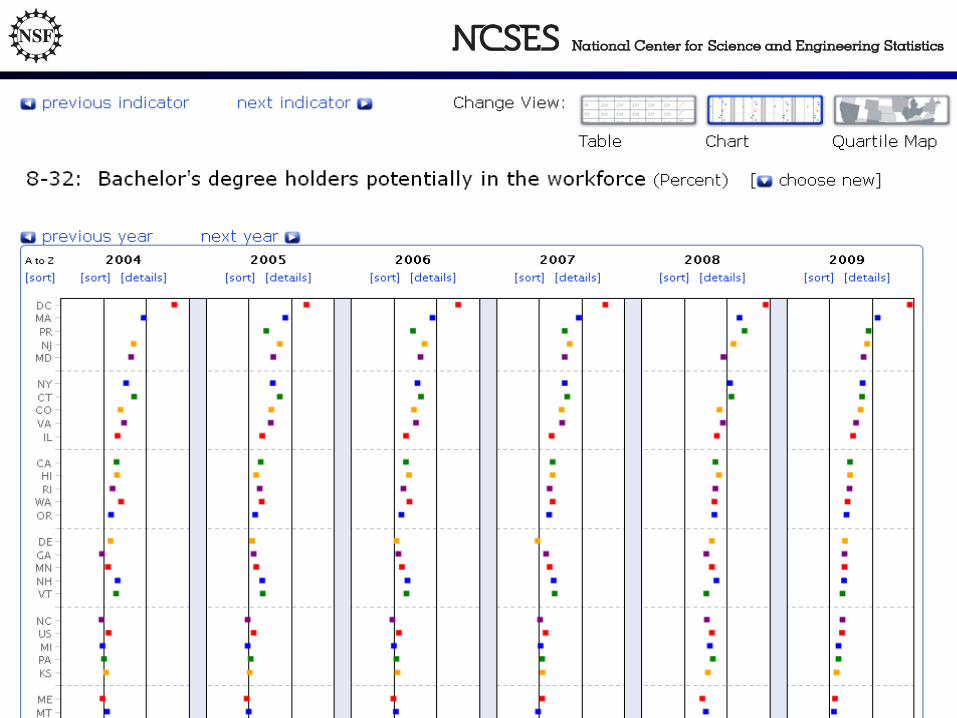
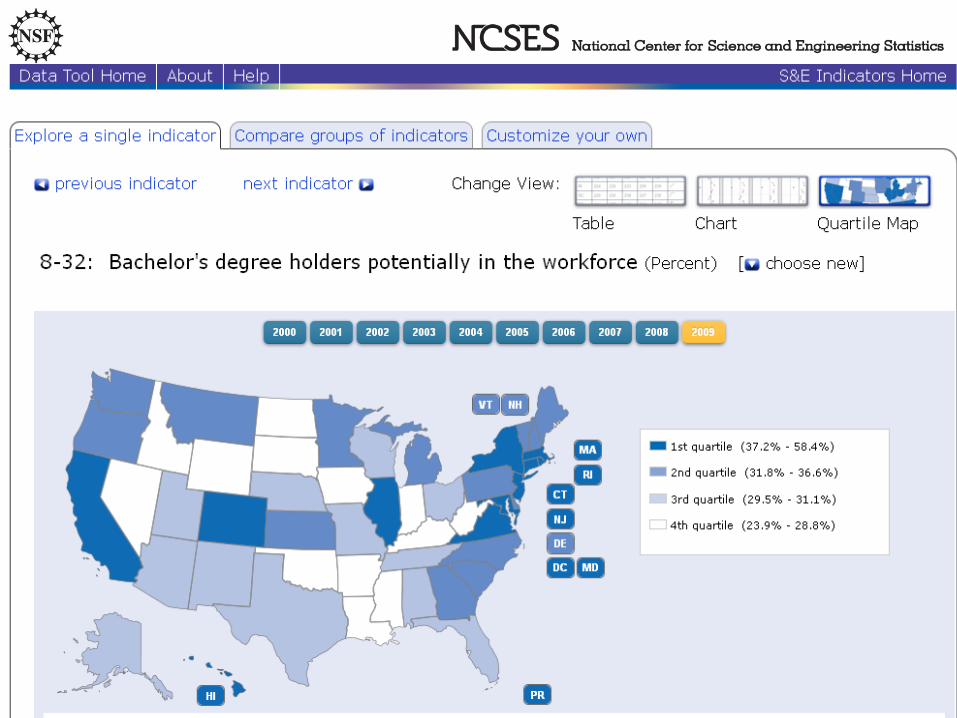
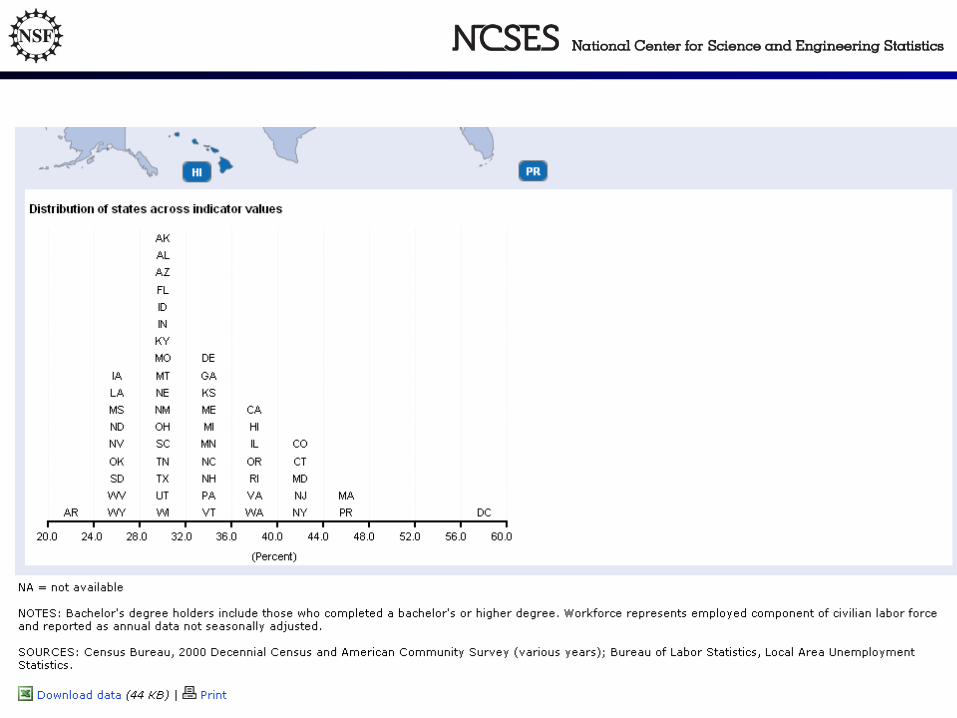
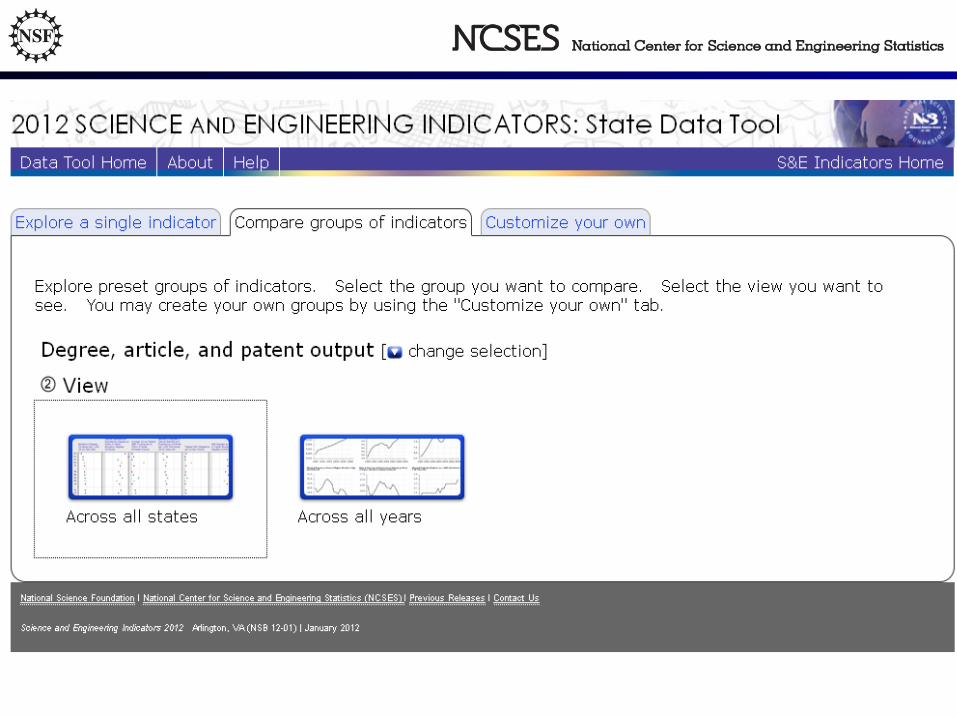
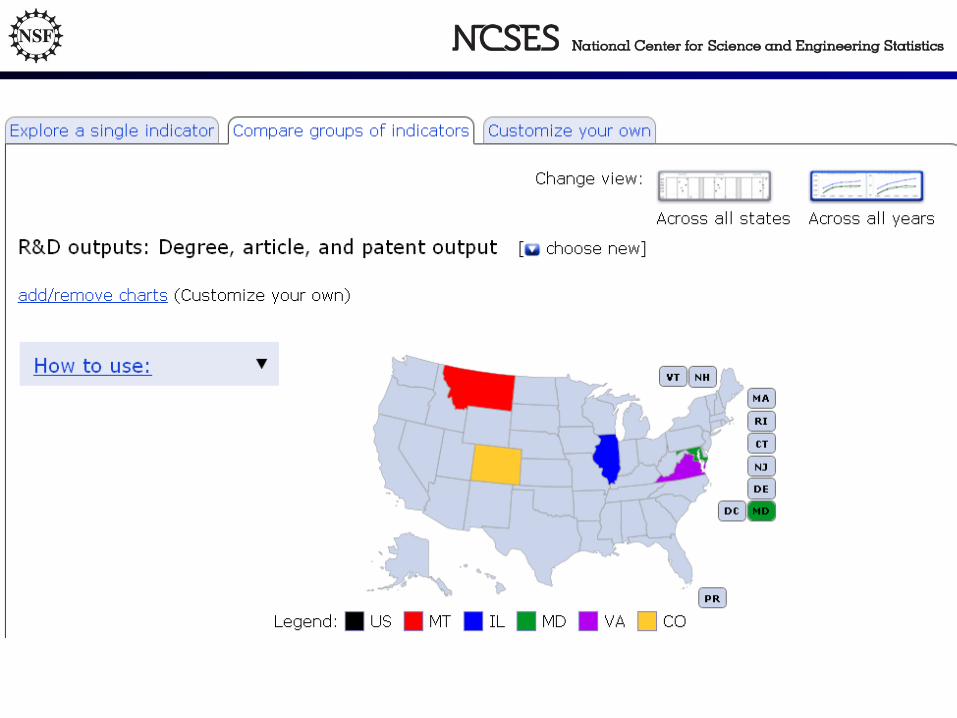
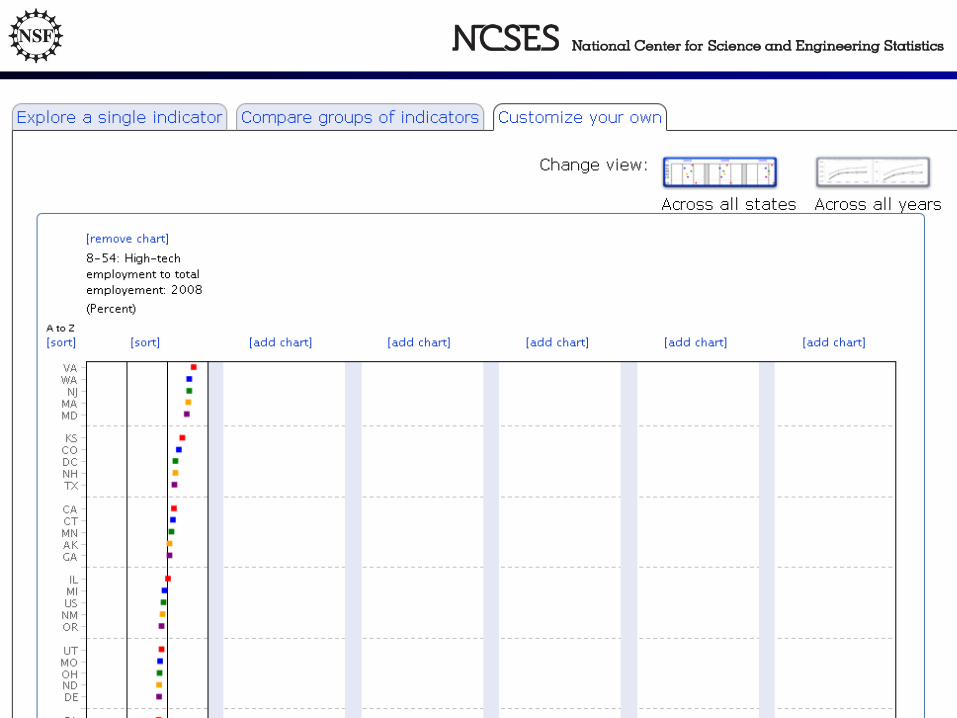
State Data Tool
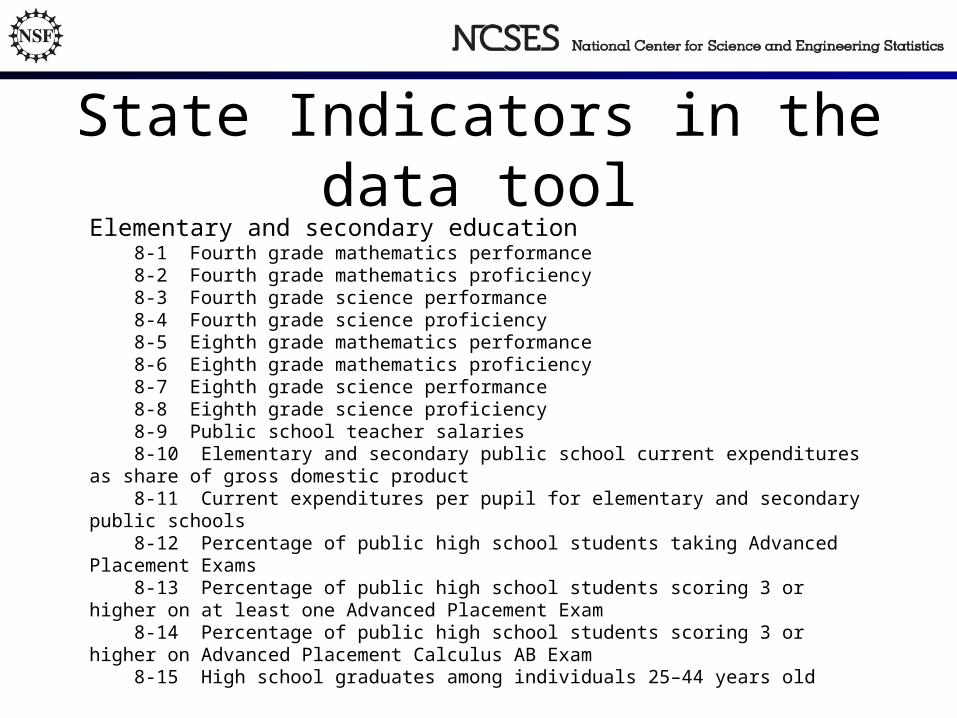
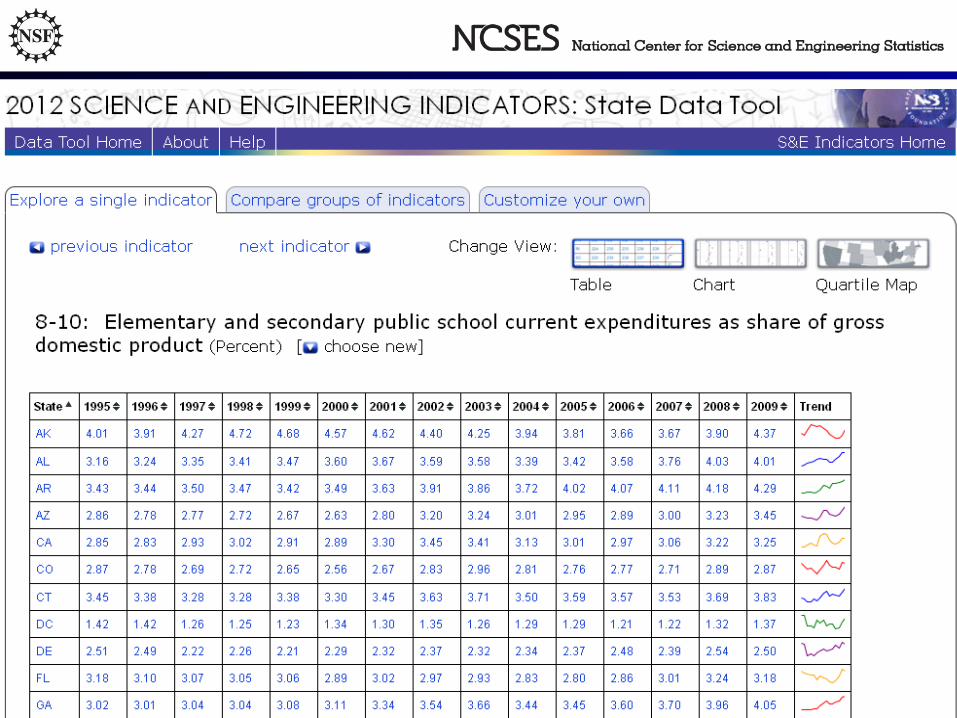
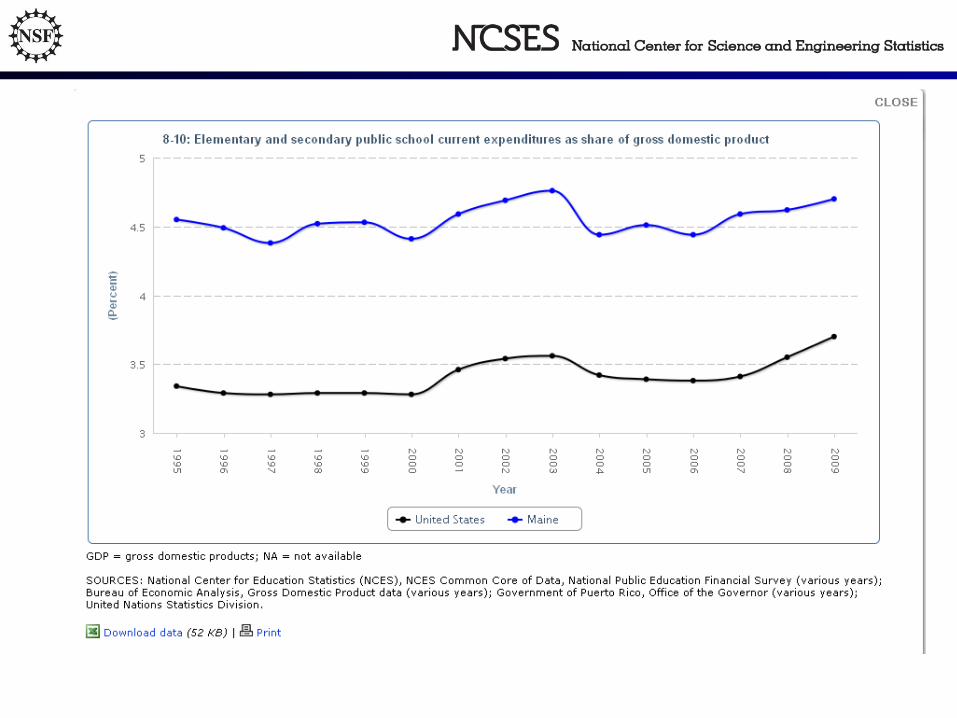
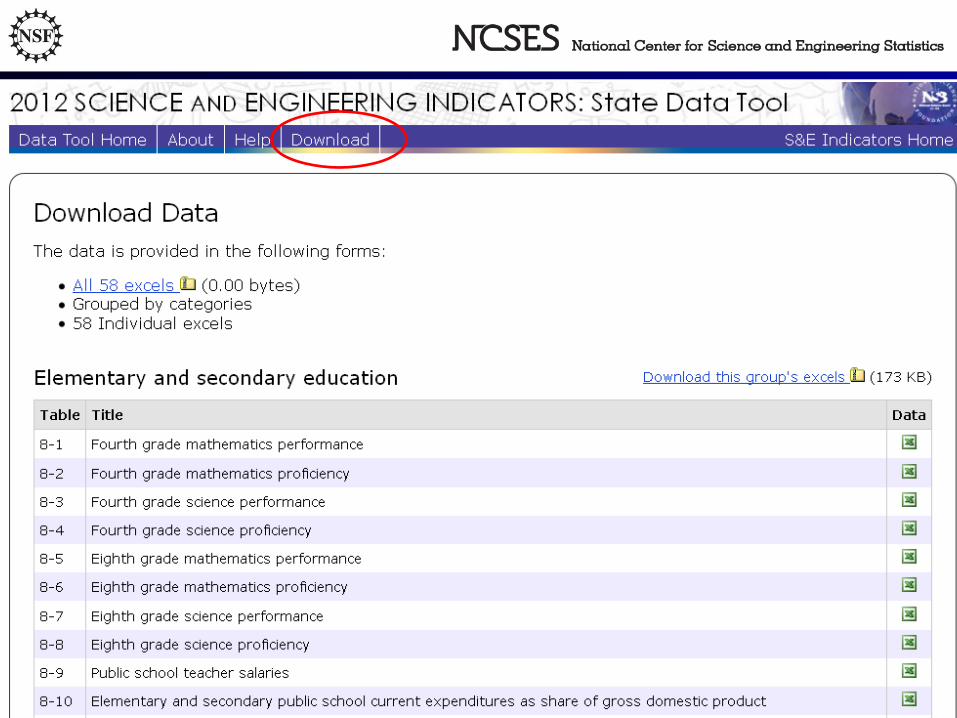
State Indicators in the data toolElementary and secondary education 8-1 Fourth grade mathematics performance 8-2 Fourth grade mathematics proficiency 8-3 Fourth grade science performance 8-4 Fourth grade science proficiency 8-5 Eighth grade mathematics performance 8-6 Eighth grade mathematics proficiency 8-7 Eighth grade science performance 8-8 Eighth grade science proficiency 8-9 Public school teacher salaries 8-10 Elementary and secondary public school current expenditures as share of gross domestic product 8-11 Current expenditures per pupil for elementary and secondary public schools 8-12 Percentage of public high school students taking Advanced Placement Exams 8-13 Percentage of public high school students scoring 3 or higher on at least one Advanced Placement Exam 8-14 Percentage of public high school students scoring 3 or higher on Advanced Placement Calculus AB Exam 8-15 High school graduates among individuals 25–44 years old
State Data Tool• Was selected for inclusion in the SCOPE (Statistical Community of
Practice and Engagement) Data Enclave project• a proof of concept exercise documenting the consolidation of
public facing web tools from statistical agencies into a shared cloud environment
• Worked with NSF IT security to ensure no vulnerabilities caused by providing database structure and code to outside organization.
• Exported our database and code set for inclusion in the project


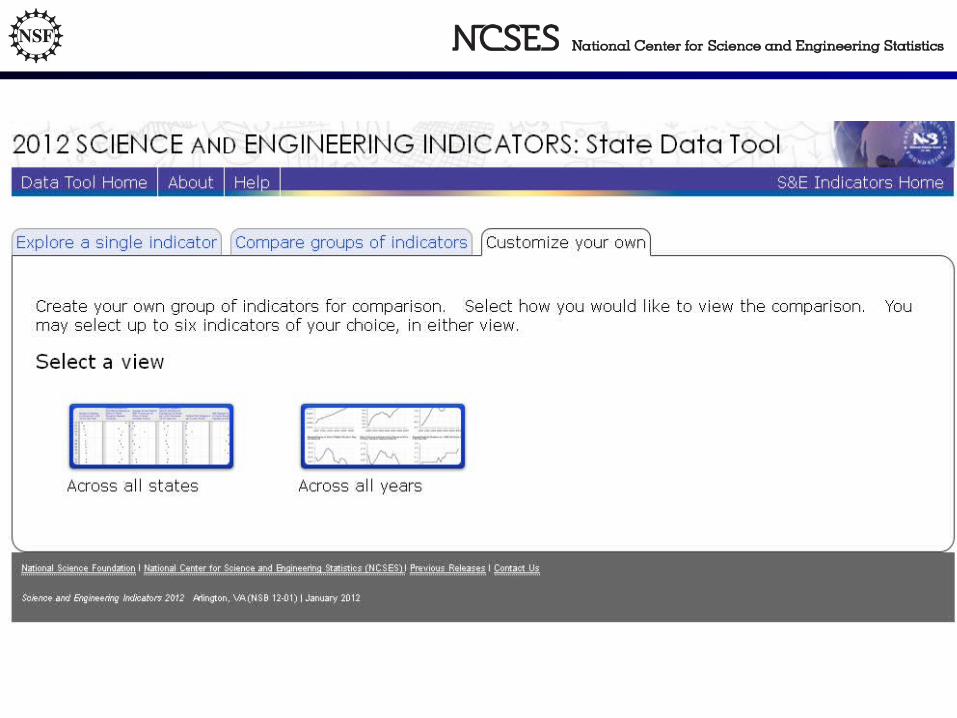


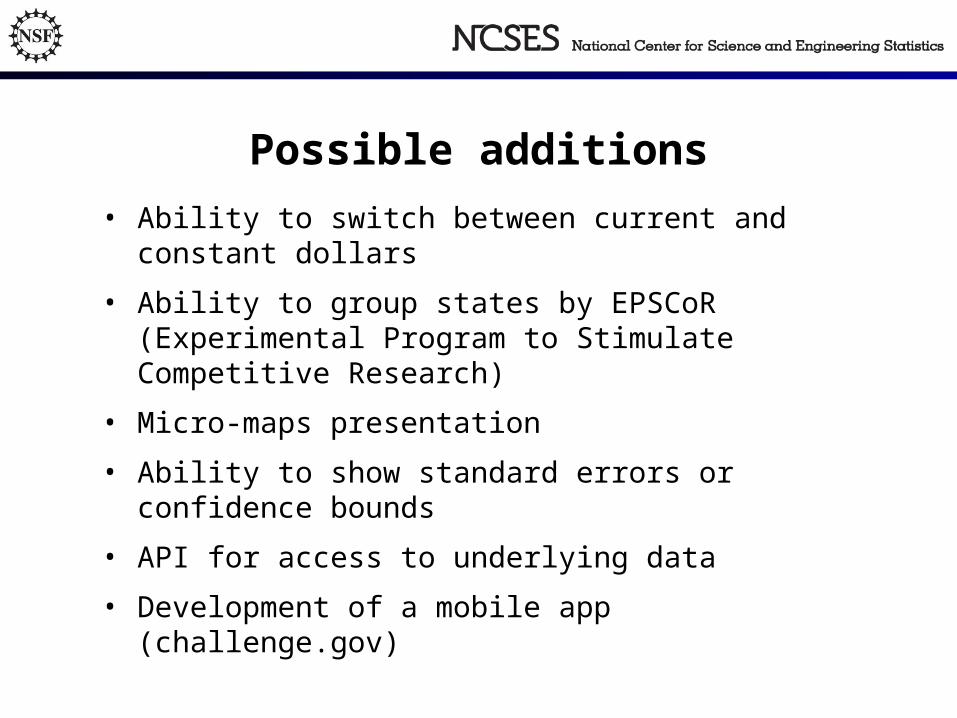
Possible additions
• Ability to switch between current and constant dollars
• Ability to group states by EPSCoR (Experimental Program to Stimulate Competitive Research)
• Micro-maps presentation
• Ability to show standard errors or confidence bounds
• API for access to underlying data
• Development of a mobile app (challenge.gov)

TechnologyHighcharts: • a charting library written in pure JavaScript, offering intuitive,
interactive charts to your web site or web application.
• Highcharts currently supports line, spline, area, area spline, column, bar, pie, scatter, angular gauges, area range, area spline range, column range and polar chart types.
Highslide JS: • an image, media and gallery viewer written in JavaScript. No
plugins like Flash or Java required.• Lots of configuration options and scalability without compromising
on simplicity. • If the user has disabled JavaScript or is using an old browser, the
browser redirects directly to the image itself or to a given HTML page.

URLs
Science and Engineering Indicators 2012: http://www.nsf.gov/statistics/seind12/
State Data Tool: http://www.nsf.gov/statistics/seind12/c8/interactive/
Acknowledgements
Without the following, there would be no State Data Tool• Jock Black, NCSES Mathematical Statistician
• Jeri Mulrow, Program Director, ITSP/NCSES
• NCSES Web support contract staff
• NCSES data collection contract staff, Taratec
o Paula Dunnigan, Cheikhou Athie, Jill Cape
*Special thanks to Lynda Carlson & Rolf Lehming

Contact Information
Robin PentolaNational Science FoundationNational Center for Science and Engineering Statistics4201 Wilson Blvd, Suite 965Arlington, VA 22205
703-292-4662