state diagrams a new programming method for programmable … · state diagrams: a new programming...
TRANSCRIPT
3
State Diagrams A New Programming Method for Programmable Logic Controllers
Dipl.-Inj. Hans-Peter Otto SiemensAG Nuremberg-Moorenbrunn, Germany, Phone 0911/895-2612, Fax 0911/895-2122
Dipl.-Ing. Gunter Rath SiemensAG Nuremberg-Moorenbrunn, Germany, Phone 0911/895-2253, Fax 0911/895-2122
Abstract A new fast and reliable way of writing programs for PLCs is the state diagram programming method. This method enables both sequential and non-sequential processes to be described in a graphical form. Automation tasks are broken down into function units, of which the states and their coordination are described graphically by state diagrams. Each state diagram has only one active state, but can exchange information with other diagrams for coordination purposes. The result is a set of interlinked state "automatons". Grouping, for example by machine subassemblies, gives the automation task a clear structure.
The subject of applying the state diagram concept to PLC programming was also dealt with by a working committee of the VDW (Association of German Machine Tool Manufacturers) to increase the efficiency of PLC programming. On the basis of these results a programming tool executable under Windows 95 has been developed which enables state diagrams to be used for programming PLCs right through from the draft stage to testing, documentation and diagnostics.
Keywords State Diagrams, Messages, Templates, Views, Status
A. Storr et al. (eds.), Software Engineering for Manufacturing Systems© Springer Science+Business Media Dordrecht 1996
28 Software Engineering for Manufacturing Systems
1 METHOD
A new fast and reliable way of writing programs for PLCs is the state diagram programming method. This method enables both sequential and - especially - non-sequential, asynchronous processes to be described in a graphical form. The key advantage for the user is that this method of representation is not only suitable for PLC programmers but also for mechanical engineers, commissioning engineers and service engineers.
The application of the state diagram concept to PLC programming with a view to increasing efficiency in PLC programming was also dealt with by a working committee of the VDW (Association of German Machine Tool Manufacturers) t 4 t. The Automation Group of SIEMENS AG has used these results to develop HiGraph, a tool for the new SIMA TIC S7 PLC family which enables you to use state diagrams for programming PLCs right through from the design stage to testing, documentation and diagnostics.
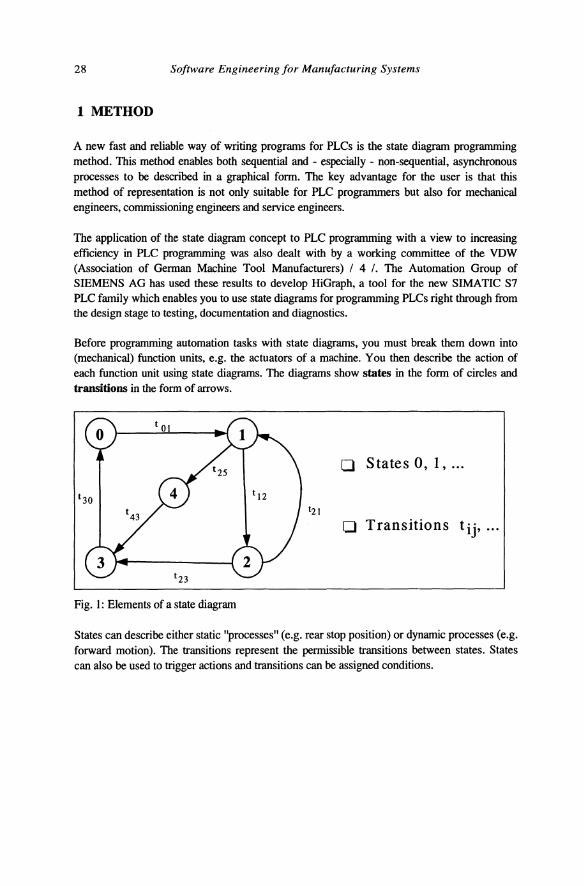
Before programming automation tasks with state diagrams, you must break them down into (mechanical) function units, e.g. the actuators of a machine. You then describe the action of each function unit using state diagrams. The diagrams show states in the form of circles and transitions in the form of arrows.
o States 0, 1, ...
o Transitions tij> .. ·
Fig. 1: Elements of a state diagram
States can describe either static "processes" (e.g. rear stop position) or dynamic processes (e.g. forward motion). The transitions represent the permissible transitions between states. States can also be used to trigger actions and transitions can be assigned conditions.

State diagrams: a new programming method 29
You can use messages to "synchronize" the function units and/or "coordinate" them with a higher-level state diagram. In this way you can obtain a set of interlinked state automatons.
Coordinator
Unit 1
Fig. 2: Exchange of messages between diagrams
It is often helpful to divide the function units into groups (e.g. to correspond with the subassemblies of a machine) and use a coordinator for each group. This gives the PLC program a clearer structure and improves the reusability of the individual sections of the program.

30 Software Engineering for Manufacturing Systems
2 PROCEDURE FOR PROGRAMMING A PLC USING STATE DIAGRAMS
2.1 Task definition
Before beginning to solve an automation problem a definition of the task must be available. This is normally provided by a specialist engineer. First of all, we expect to receive a process schematic containing all the main components (function units) of the machine, subassembly or plant to be controlled and clearly showing the mutual effect of their actions. As an example, the diagram below shows the rotary table of a milling machine for the machine tool industry with the following function units:
• Motor
• Index • End support (fixing clamp)
otor IndeJ ~S8l'ted
Fig. 3: Example of a rotary table
End SUppOtl clam pJrel8ase
In addition to the process schematic the programmer also expects to receive a functional description. In machine building this usually consists of a function chart. But what is to prevent the engineer from creating this using a state diagram editor instead of drawing it on paper? In our example, the chart would look like this:

State diagrams: a new programming method
in P~S
Motor in P~S
M change ~----C:( lA from NC
® Already in P~S
Ready to move
Check direction
Position
Release end support Retract index
Fig. 4: Coordination chart for rotary table
31
Using the HiGraph editor also has the advantage that the resulting diagram can be passed on to the programmer for expansion and the addition of finer details.
2.2 Programming
Defining the objects in the process
A task definition as described above comprises both process schematics and functional descriptions in the fonn of state diagrams. The process schematics must now be checked to ensure that they contain all the function units (motors, valves, etc.). To check the functional descriptions it is advisable to divide the machine into subassemblies such as spindle, revolver, etc. with their respective function units. You then assign a state diagram to each function unit. Since the functions of the individual subassemblies can be perfonned independently of one another, it is necessary or at least desirable to provide each subassembly with an additional state diagram as a coordinator.

32 Software Engineering for Manufacturing Systems
The rotary table in the task definition above, for example, consists of three function units: the motor, the index and the end support (fixing clamp). A state diagram is provided for each of the function units and one for coordination (i.e. 4 diagrams in our example).
Describing junctions rather than "programming" them
The ''programmer'' now uses state diagrams to describe each of the function units and the coordinator, i.e. to define the possible states and the transitions between these states. It is convenient to proceed step by step as follows:
• Describe normal operation (how you envisage the function) • Describe initialization, i.e. the conditions to be observed when switching on the controller • Analyze possible abort criteria for motion states, e.g. Reset • Derme the conditions for exiting abort states • Derme the monitoring precautions (e.g. monitoring times for motion states). You must also define the messages for coordinating the state diagrams.
Task-oriented diagram views
If all the operating states of the function units are included, the diagrams tend to become rather unwieldy. The graphic for a state diagram is therefore divided into a number of levels, which can be displayed as required. These levels are called views because they each display a different aspect of the state diagram.
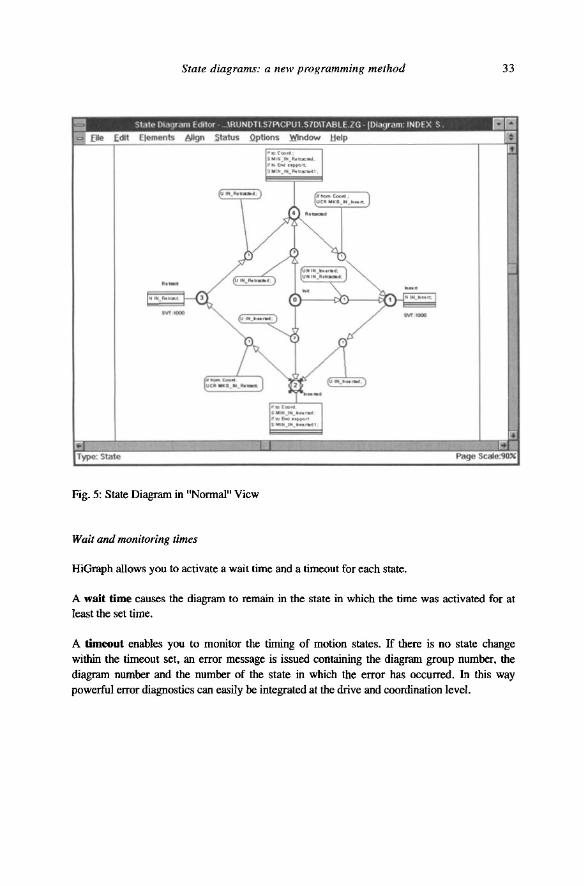
The display reproduced below shows a diagram in Basic/Norma1 view.
State diagrams: a new programming method 33
Fig. 5: State Diagram in "Normal" View
Wait and monitoring times
HiGraph allows you to activate a wait time and a timeout for each state.
A wait time causes the diagram to remain in the state in which the time was activated for at least the set time.
A timeout enables you to monitor the timing of motion states. If there is no state change within the timeout set, an error message is issued containing the diagram group number, the diagram number and the number of the state in which the error has occurred. In this way powerful error diagnostics can easily be integrated at the drive and coordination level.
34 Software Engineering for Manufacturing Systems
State-independent functions
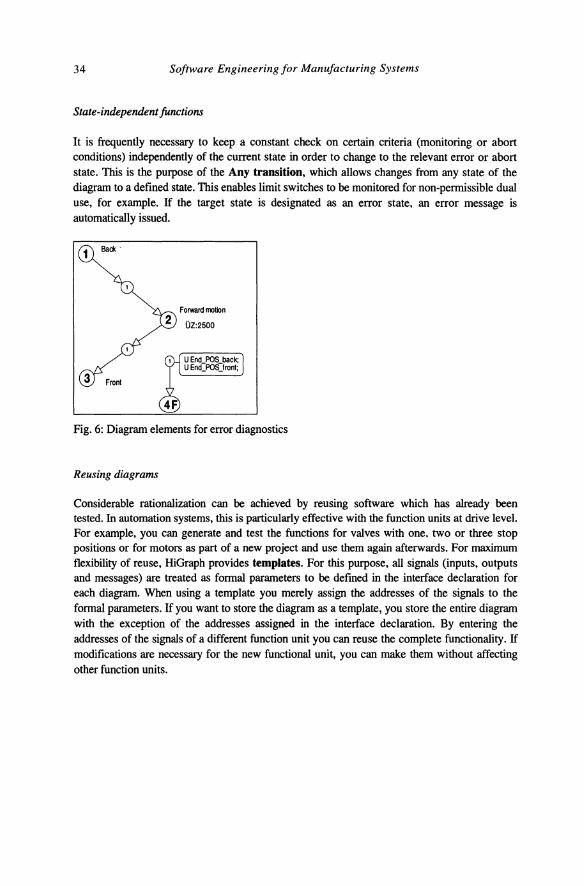
It is frequently necessary to keep a constant check on certain criteria (monitoring or abort conditions) independently of the current state in order to change to the relevant error or abort state. This is the purpose of the Any transition, which allows changes from any state of the diagram to a defined state. This enables limit switches to be monitored for non-permissible dual use, for example. If the target state is designated as an error state, an error message is automatically issued.
1 Back
Forward motion 2 OZ:2500
Fig. 6: Diagram elements for error diagnostics
Reusing diagrams
Considerable rationalization can be achieved by reusing software which has already been tested. In automation systems, this is particularly effective with the function units at drive level. For example, you can generate and test the functions for valves with one, two or three stop positions or for motors as part of a new project and use them again afterwards. For maximum flexibility of reuse, HiGraph provides templates. For this purpose, all signals (inputs, outputs and messages) are treated as formal parameters to be defined in the interface declaration for each diagram. When using a template you merely assign the addresses of the signals to the formal parameters. If you want to store the diagram as a template, you store the entire diagram with the exception of the addresses assigned in the interface declaration. By entering the addresses of the signals of a different function unit you can reuse the complete functionality. If modifications are necessary for the new functional unit, you can make them without affecting other function units.

State diagrams: a new programming method 35
2.3 Program testing
Once the program is in the PLC, the commissioning engineer can conveniently start to test it using the same method of representation as that used by the engineer and programmer to describe the tasks. The Status display at graphical level, which marks both the current state and the last transition, makes the functions more transparent. The graphic is constantly updated to keep pace with the process, so that the user can see the current transition and the subsequent state of the state diagram. This means that errors in the program logic can readily be detected by people who were not involved in the programming. The following section of a display illustrates the Status function.
/I From Index; UCR MINJNJNSERTEO;
;/to Index; S MKOJNJNSERT;
/I From Motor; UCR MMO_MOJNPOS; U RESET;
Fig. 7: Section of display showing status
Motor in position
If changes need to be made to a function in the program, they can be made in the graphic display or in the zoom, as when writing the program. The program is then recompiled and transferred to the PLC again. Since this can be done while the PLC is in operation, the program test can be continued immediately.
2.4 Service and diagnostics
Service is required when the plant or machine is out of operation as a result of a fault. In the majority of cases, the fault is not in the PLC and it can be used for diagnosis. HiGraph provides support in the form of monitoring times and Any transitions, as previously described. This

36 Software Engineering for Manufacturing Systems
enables faults to be located and corrected quickly and reliably, thus minimizing machine downtimes.
On operator panels with alphanumeric display facilities a diagnostics file can be displayed with HiGraph. This enables you to use the texts entered at the programming stage for a plaintext display of the error location and an indication of the status of the signals affected.
3 SUMMARY
The following features distinguish the state diagram programming method from the PLC programming methods commonly used at present:
• Object-oriented For each function unit (of a machine) you create a state diagram, which gives a graphical description of all the possible states of the unit. The mode of presentation is very easy to understand.
• Reusable You can store the state diagrams as templates. By adapting the formal parameters for the inputs and outputs of other function units the diagrams can be used again for the same functions. Adjustments can be made for special attendant circumstances without affecting other function units.
• Clear and easy to understand The state diagram method is the first method to provide a clear graphical representation of the sequence and unit control or drive level. You can label and enter comments for every state and every transition.
• Process independent Whether you are dealing with a lathe, a honing machine, a transfer line or any other control problem, you can always use the same programming tool.
HiGraph is a tool which enables you to describe, test and correct the functions of machines and plant sections with the same method of representation right through from the definition of the task by the engineer to programming, commissioning and ultimately servicing. And because the
documentation automatically always includes the graphics and all the details, undocumented function changes are a thing of the past.

4 REFERENCES
H.Konig
A. Herrscher
State diagrams: a new programming method
Beitrag zur Strukturanalyse und zum Entwurf von Steuerungen
fUr Fertigungseinrichtungen
Flexible Fertigungssysteme - Entwurf und Realisierung
prozeBnaher Steuerungsfunktionen, Springer-Verlag
2 J. Fleckenstein Zustandsgraphen fUr SPS GrafIkunterstiitzte
3 VDW 1013
5 BIOGRAPHY
Programmierung und steuerungsunabhangige Darstellung,
Springer-Verlag
Pflichtenheft und
durchgangigen
Dokumentation
Bewertung von
Software-Erstellung
CASE-Tools zur
und Software-
37
Hans-Peter Otto studied electrical engineering and information technology (software engineering). Since joining Siemens AG, he has worked in various development and marketing departments as a systems programmer and is now section head. As Chairman of the German standardization group in DIN DKE (German Electrotechnical Commision of DIN) and as German delegate to the corresponding international IEC Working Group, he plays an important role in the international standardization of PLC technology (IEC 1131).
Giinter Rath studied general electrical engineering. Since joining Siemens AG, he has worked in the field of development and marketing for programmable logic controllers and numerical controls. At present, his work focuses on the development and market entry of a PLC programming system for state diagrams.