state factsheet final w pg breaks - center for food safety ... for food safety – a new view of...
TRANSCRIPT


660 Pennsylvania Ave., S.E., Suite 302 Washington, D. C. 20003 www.centerforfoodsafety.org Prepared by Anne Hillson May 2006 US map illustration by: © 2004 Jared Benedict. This work is licensed under the Creative Commons Attribution-ShareAlike License. To view a copy of this license, visit http://creativecommons.org/licenses/by-sa/2.0/ or send a letter to Creative Commons, 559 Nathan Abbott Way, Stanford, California 94305, USA

Center for Food Safety – A New View of U.S. Agriculture 1
Contents:
Introduction………………………………………………………..…... 2 State Factsheets: Alabama to Wyoming………………………….... 4 Key & Sources for State Factsheets…………………………........ 36 Federal Regulation of GE Foods………………………………...... 37 Deregulated GE Crops……………………………………….....….. 38

Center for Food Safety – A New View of U.S. Agriculture 2
Introduction Genetically engineered soy has grown to dominate U.S. soy acreage, and gene altered corn accounts for about half of the nation’s crop.1 Food ingredients from these two crops, like corn syrup and soybean oil, are found in hundreds if not thousands of processed foods in American supermarkets.2 This situation has led some to conclude that the U.S. is one vast landscape of gene-spliced crops and foods. But in fact, the vast majority of foods produced in the U.S. are not gene altered. Since the first genetically engineered (GE) crop was marketed in 1994, only four major crops –cotton and canola in addition to soy and corn – have succeeded as GE varieties. In that time, commercialized varieties of GE potatoes and tomatoes were pulled from the market when Americans refused to buy them, and concerns from American consumers, farmers and food companies have helped keep GE wheat, rice, and sugar beets off the market. In addition, while the federal government maintains its largely hands-off policy regarding gene food regulation, many state and local governments have taken steps to control the spread of GE food. Nearly half of U.S. states have enacted one or more statewide or local regulations to protect consumers, farmers, and/or the environment from the risks of GE foods. States and localities have taken actions that range from requiring GE seed labels to banning GE fish to banning all GE crops outright. Despite the biotechnology industry’s propaganda, genetically engineered foods are not a national inevitability in the U.S. In fact, polls consistently show that Americans have the same concerns about GE foods as people around the world. More than a dozen polls and surveys in the last ten years have found that Americans overwhelmingly want labels on GE foods, and most would avoid eating them if they were labeled.3 When the U.S. Food and Drug Administration commissioned several focus groups to determine American views on GE food, their report found that:
“[T]here was strong consensus as to what the major worry was--unknown long-term health consequences that might be associated with the technology but which cannot be anticipated based on current science or knowledge… Virtually all participants said that bioengineered foods should be labeled as such… participants wanted to know whether the food was a product of biotechnology because they were concerned about the potential for unknown long-term effects of the technology, in particular health effects.”4
More recently, a 2005 poll by the Pew Initiative on Food and Biotechnology found that just 25% of Americans favor the introduction of GE foods into the U.S. food supply.5
1 USDA/NASS Acreage report. Released June 30, 2005. 2 Associated Press, “Americans clueless about gene-altered foods: Few aware of how many genetically modified products they eat, study finds,” March 23, 2005. The article cites an estimate by the Grocery Manufacturers of America that roughly 75 percent of U.S. processed foods contain some GE ingredient(s). 3 See http://www.truefoodnow.org/home_polls.html 4 FDA “Report on Consumer Focus Groups on Biotechnology,” October 20, 2000, online at http://www.cfsan.fda.gov/~comm/biorpt.html 5 The Mellman Group, Inc. and Public Opinion Strategies, Inc., as commissioned by the Pew Initiative on Food and Biotechnology, “Public Sentiments About Genetically Modified Food: November 2005 Update ,” online at http://pewagbiotech.org/research/2005update.
Center for Food Safety – A New View of U.S. Agriculture 3
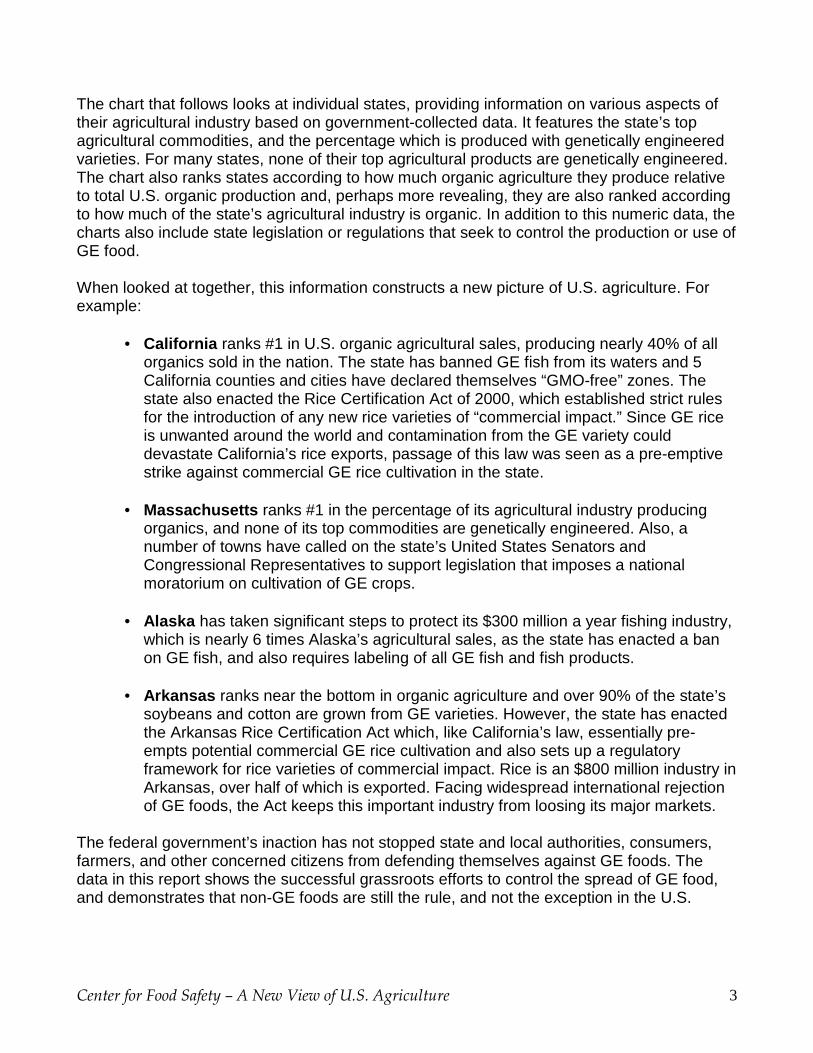
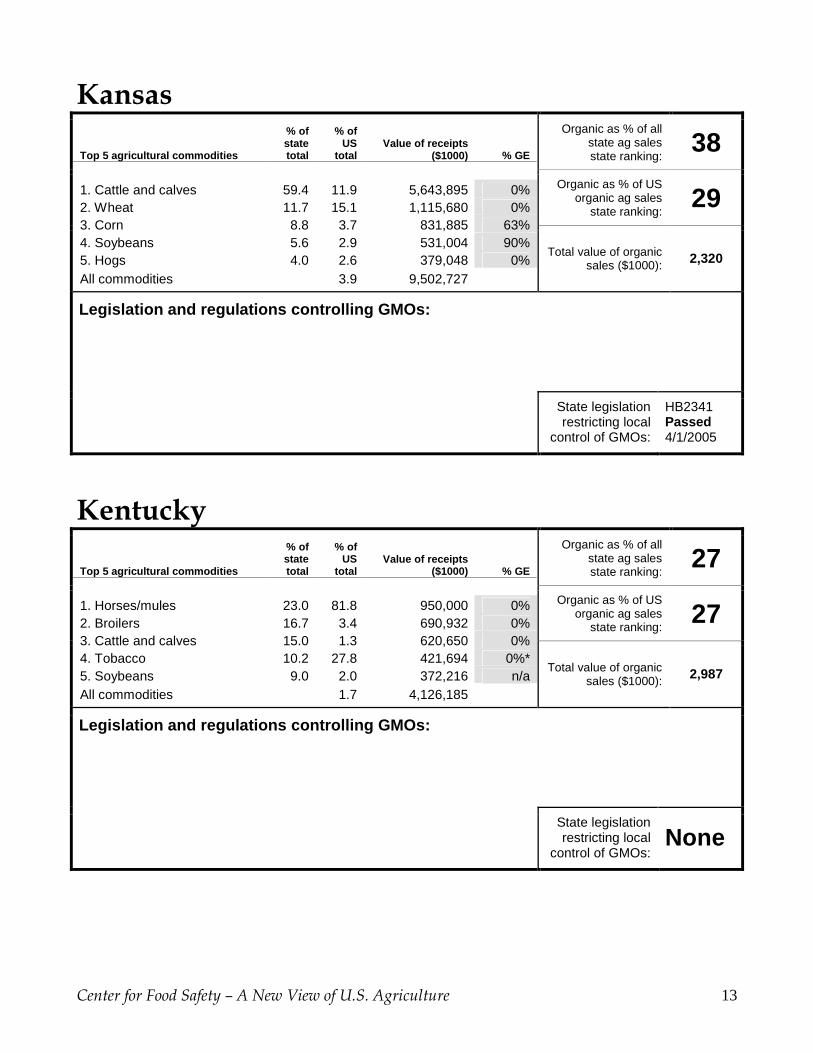
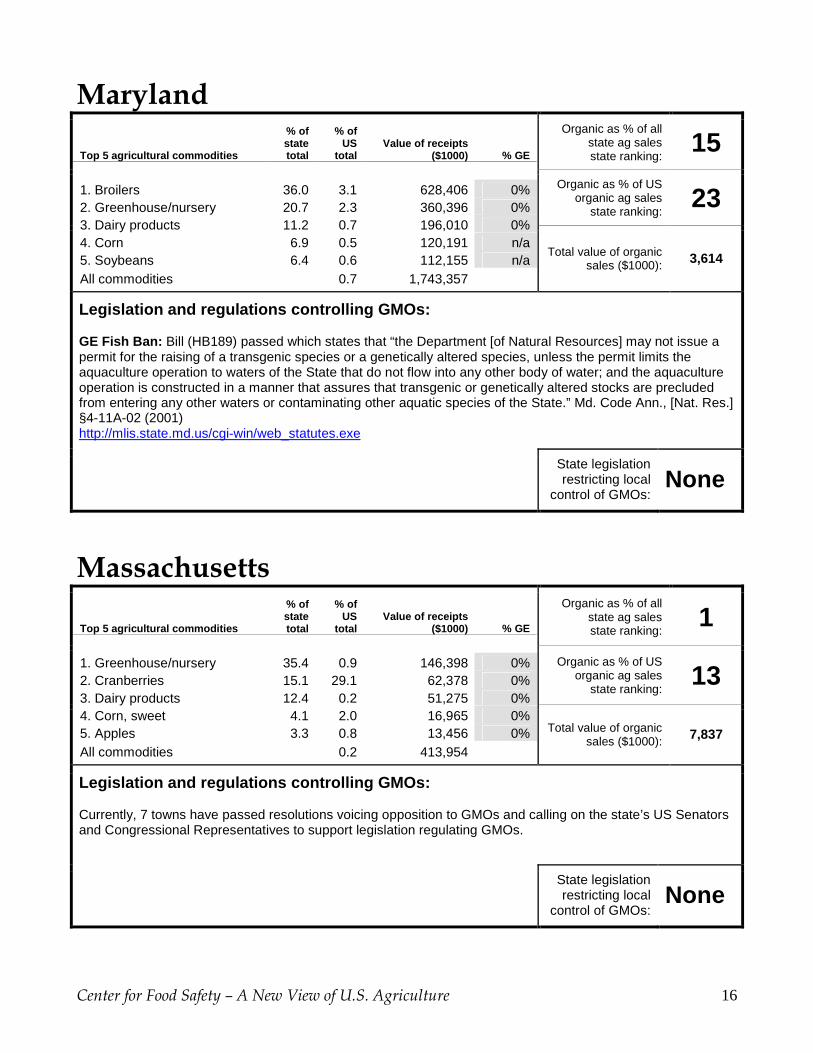
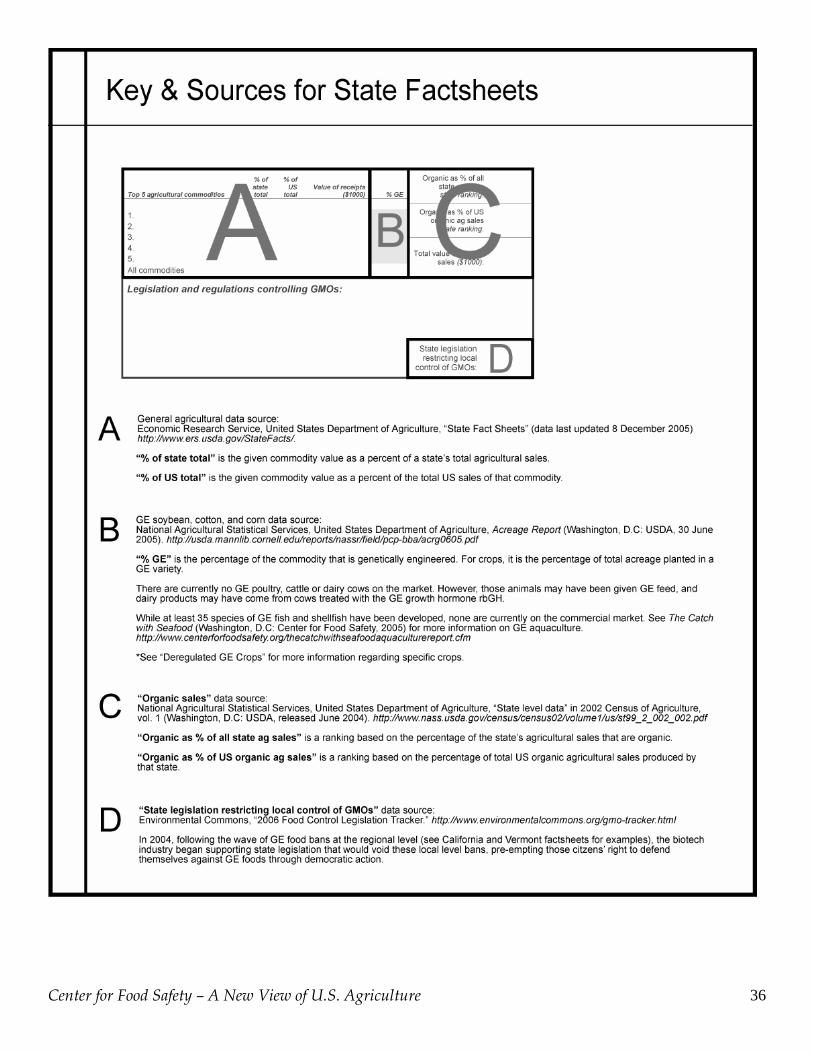
The chart that follows looks at individual states, providing information on various aspects of their agricultural industry based on government-collected data. It features the state’s top agricultural commodities, and the percentage which is produced with genetically engineered varieties. For many states, none of their top agricultural products are genetically engineered. The chart also ranks states according to how much organic agriculture they produce relative to total U.S. organic production and, perhaps more revealing, they are also ranked according to how much of the state’s agricultural industry is organic. In addition to this numeric data, the charts also include state legislation or regulations that seek to control the production or use of GE food.
When looked at together, this information constructs a new picture of U.S. agriculture. For example:
• California ranks #1 in U.S. organic agricultural sales, producing nearly 40% of all organics sold in the nation. The state has banned GE fish from its waters and 5 California counties and cities have declared themselves “GMO-free” zones. The state also enacted the Rice Certification Act of 2000, which established strict rules for the introduction of any new rice varieties of “commercial impact.” Since GE rice is unwanted around the world and contamination from the GE variety could devastate California’s rice exports, passage of this law was seen as a pre-emptive strike against commercial GE rice cultivation in the state.
• Massachusetts ranks #1 in the percentage of its agricultural industry producing
organics, and none of its top commodities are genetically engineered. Also, a number of towns have called on the state’s United States Senators and Congressional Representatives to support legislation that imposes a national moratorium on cultivation of GE crops.
• Alaska has taken significant steps to protect its $300 million a year fishing industry,
which is nearly 6 times Alaska’s agricultural sales, as the state has enacted a ban on GE fish, and also requires labeling of all GE fish and fish products.
• Arkansas ranks near the bottom in organic agriculture and over 90% of the state’s
soybeans and cotton are grown from GE varieties. However, the state has enacted the Arkansas Rice Certification Act which, like California’s law, essentially pre-empts potential commercial GE rice cultivation and also sets up a regulatory framework for rice varieties of commercial impact. Rice is an $800 million industry in Arkansas, over half of which is exported. Facing widespread international rejection of GE foods, the Act keeps this important industry from loosing its major markets.
The federal government’s inaction has not stopped state and local authorities, consumers, farmers, and other concerned citizens from defending themselves against GE foods. The data in this report shows the successful grassroots efforts to control the spread of GE food, and demonstrates that non-GE foods are still the rule, and not the exception in the U.S.

Center for Food Safety – A New View of U.S. Agriculture 4
Alabama Organic as % of all
state ag sales state ranking:
45 Organic as % of US
organic ag sales state ranking:
44
Top 5 agricultural commodities
% of state total
% of US
total Value of receipts
($1000) % GE
1. Broilers 58.7 11.8 2,406,976 0% 2. Cattle and calves 11.4 1.0 469,323 0% 3. Chicken eggs 7.0 5.4 287,956 0% 4. Greenhouse/nursery 6.4 1.7 263,092 0% 5. Cotton 4.7 3.6 193,535 n/a All commodities 1.7 4,103,235
Total value of organic sales ($1000): 186
Legislation and regulations controlling GMOs:
State legislation restricting local
control of GMOs: None
Alaska Organic as % of all
state ag sales state ranking:
50 Organic as % of US
organic ag sales state ranking:
50
Top 5 agricultural commodities
% of state total
% of US
total Value of receipts
($1000) % GE
1. Greenhouse/nursery 27.6 0.1 14,630 0% 2. Hay 7.4 0.1 3,910 0%* 3. Dairy products 5.3 0.0 2,822 0% 4. Potatoes 4.2 0.1 2,250 0%* 5. Cattle and calves 2.7 0.0 1,413 0% All commodities 0.0 52,987
Total value of organic sales ($1000): 0
Legislation and regulations controlling GMOs: GE Fish Labeling: Bill (SB25) passed requiring that “food is conspicuously labeled to identify the fish or fish product as a genetically modified fish or fish product…” Alaska Stat. §17-20-040 (2005) http://www.legis.state.ak.us/folhome.htm Aquaculture Ban: Alaska Fish and Game statutes state that “a person may not grow or cultivate finfish in captivity or under positive control for commercial purposes.” Since the statute bans all finfish, this would include GE fish. Alaska Stat. §16.40.210 (1990) http://www.legis.state.ak.us/folhome.htm
State legislation restricting local
control of GMOs: None

Center for Food Safety – A New View of U.S. Agriculture 5
Arizona Organic as % of all
state ag sales state ranking:
20 Organic as % of US
organic ag sales state ranking:
25
Top 5 agricultural commodities
% of state total
% of US
total Value of receipts
($1000) % GE
1. Cattle and calves 25.1 1.6 770,066 0% 2. Lettuce 19.2 28.5 589,896 0% 3. Dairy products 18.6 2.1 570,381 0% 4. Cotton 6.3 3.6 194,309 n/a 5. Hay 3.6 2.5 111,420 0%* All commodities 1.3 3,065,603
Total value of organic sales ($1000): 3,410
Legislation and regulations controlling GMOs:
State legislation restricting local
control of GMOs:
SB1282 Passed 4/22/05
Arkansas Organic as % of all
state ag sales state ranking:
47 Organic as % of US
organic ag sales state ranking:
46
Top 5 agricultural commodities
% of state total
% of US
total Value of receipts
($1000) % GE
1. Broilers 41.4 13.4 2,731,300 0% 2. Rice 12.2 46.8 808,021 0% 3. Soybeans 11.6 4.2 766,264 92% 4. Cattle and calves 8.4 1.2 555,145 0% 5. Cotton 7.0 8.6 464,672 96% All commodities 2.7 6,604,400
Total value of organic sales ($1000): 136
Legislation and regulations controlling GMOs: GE Rice Regulation: The Arkansas Rice Certification Act (HB2574) regards rice with “characteristics of commercial impact.” These characteristics include those “that may adversely affect the marketability of rice in the event of commingling with any other rice [and]…that cannot be identified without the aid of specialized equipment or testing.” The Act allows the State Plant Board to prohibit or place restrictions on the “selling, planting, producing, harvesting, transporting, storing, processing, or other handling” of such rice. Ark. Code Ann. §2-15-201 to 2-15-208 (2005) http://www.arkleg.state.ar.us/ftproot/acts/2005/public/act1238.pdf
State legislation restricting local
control of GMOs: None

Center for Food Safety – A New View of U.S. Agriculture 6
California Organic as % of all
state ag sales 8 Organic as % of US
organic ag sales state ranking:
1
Top 5 agricultural commodities
% of state total
% of US
total Value of receipts
($1000) % GE
1. Dairy products 16.9 19.6 5,365,992 0% 2. Greenhouse/nursery 10.5 21.2 3,328,147 0% 3. Grapes 8.7 91.5 2,758,467 0% 4. Almonds 6.9 100.0 2,200,055 0% 5. Cattle and calves 5.1 3.5 1,633,740 0% All commodities 13.2 31,835,183
Total value of organic sales ($1000): 149,137
Legislation and regulations controlling GMOs: GE Fish Ban: Bill (SB245) passed which states that “in the waters of the Pacific Ocean that are regulated by this state, it is unlawful to spawn, incubate, or cultivate any…transgenic fish species.” Cal. [Fish & Game] Code §15007 (2003) http://www.leginfo.ca.gov/calaw.html GE Rice Regulation: The Rice Certification Act of 2000 (HB2622) regulates rice that has “characteristics of commercial impact.” This is defined as characteristics that “may adversely affect the marketability of rice in the event of commingling with other rice and may include, but are not limited to, those characteristics that cannot be visually identified without the aid of specialized equipment or testing, those characteristics that create a significant economic impact in their removal from commingled rice, and those characteristics whose removal from commingled rice is infeasible.” The Act provides for regulation and potential certification of such rice varieties. Cal. [Food & Agric.] Code § 55000 to 55108 (2000) http://www.leginfo.ca.gov/calaw.html County GMO Ban: Measure H passed by voters (March 2004) in Mendocino County which states that “it shall be unlawful for any person, firm, or corporation to propagate, cultivate, raise, or grow genetically modified organisms in Mendocino County.” (Measure has yet to be codified) http://www.gmofreemendo.com/ County GMO Ban: Marin County voted for a measure which states that “it is unlawful for any person or entity to cultivate, propagate, raise or grow genetically modified organisms in Marin County.” (2004) http://www.smartvoter.org/2004/11/02/ca/mrn/meas/B/ County GMO Ban: Trinity County passed Ordinance No. 1284 which states that “it is unlawful for any person to propagate, cultivate, raise, or grow genetically engineered organisms in Trinity County.” Chpt 8.25 of County Code (2004) http://www.trinitycounty.org/ City GMO Ban: An Arcata City ordinance states that “it is unlawful for any person, partnership, corporation, firm or organization of any kind to sell, distribute, propagate, cultivate, raise or grow seeds or crops of genetically engineered organisms in the City of Arcata…” Ordinance No. 1350 (2004) http://www.environmentalcommons.org/arcata-ordinance-1350-final.pdf City GMO Ban: Point Arena passed Ordinance No. 193 which states that “it is unlawful for any person, partnership, corporation, firm or organization of any kind to sell, distribute, propagate, cultivate, raise or grow seeds, whole plants, or crops of genetically modified organisms in the City of Point Arena” Chpt 8.25 of City Code (2004) http://www.environmentalcommons.org/Point-Arena-Ordinance.pdf
State legislation restricting local
control of GMOs: None

Center for Food Safety – A New View of U.S. Agriculture 7
Colorado Organic as % of all
state ag sales state ranking:
14 Organic as % of US
organic ag sales state ranking:
8
Top 5 agricultural commodities
% of state total
% of US
total Value of receipts
($1000) % GE
1. Cattle and calves 60.8 7.1 3,342,808 0% 2. Dairy products 6.2 1.3 343,281 0% 3. Corn 5.2 1.3 285,378 n/a 4. Greenhouse/nursery 5.0 1.8 276,427 0% 5. Hogs 3.7 1.4 206,057 0% All commodities 2.3 5,501,155
Total value of organic sales ($1000): 12,516
Legislation and regulations controlling GMOs: City GMO Restriction: In the City of Boulder it is illegal to plant GMOs on public land. The City controls approximately 40,000 acres, making it the largest land owner in the area.
State legislation restricting local
control of GMOs: None
Connecticut Organic as % of all
state ag sales state ranking:
7 Organic as % of US
organic ag sales state ranking:
28
Top 5 agricultural commodities
% of state total
% of US
total Value of receipts
($1000) % GE
1. Greenhouse/nursery 44.3 1.5 233,011 0% 2. Dairy products 12.7 0.2 67,124 0% 3. Chicken eggs 8.7 0.9 45,944 0% 4. Aquaculture 3.2 1.9 16,725 0% 5. Corn, sweet 2.0 1.3 10,664 0% All commodities 0.2 526,580
Total value of organic sales ($1000): 2,822
Legislation and regulations controlling GMOs:
State legislation restricting local
control of GMOs: None

Center for Food Safety – A New View of U.S. Agriculture 8
Delaware Organic as % of all
state ag sales state ranking:
48 Organic as % of US
organic ag sales state ranking:
49
Top 5 agricultural commodities
% of state total
% of US
total Value of receipts
($1000) % GE
1. Broilers 73.5 3.4 686,458 0% 2. Soybeans 4.8 0.2 45,083 n/a 3. Corn 4.7 0.2 44,292 n/a 4. Greenhouse/nursery 3.6 0.2 33,980 0% 5. Dairy products 2.3 0.1 21,488 0% All commodities 0.4 933,843
Total value of organic sales ($1000): 8
Legislation and regulations controlling GMOs:
State legislation restricting local
control of GMOs: None

Center for Food Safety – A New View of U.S. Agriculture 9
Florida Organic as % of all
state ag sales state ranking:
24 Organic as % of US
organic ag sales state ranking:
15
Top 5 agricultural commodities
% of state total
% of US
total Value of receipts
($1000) % GE
1. Greenhouse/nursery 23.8 10.4 1,628,672 0% 2. Oranges 14.3 62.5 980,309 0% 3. Cane for sugar 8.0 55.1 549,669 0% 4. Tomatoes 7.3 24.3 500,472 0%* 5. Cattle and calves 6.5 0.9 443,145 0% All commodities 2.8 6,843,731
Total value of organic sales ($1000): 5,913
Legislation and regulations controlling GMOs: GE Fish Regulation: Under the broad mandate to regulate state aquaculture, the Division of Aquaculture within the Florida Department of Agriculture and Consumer Services created a Transgenic Aquatic Species Task Force. Under the Best Management Practices (BMPs) rule, “certified aquaculturists must apply to and receive from the FDACS, Division of Aquaculture, written authorization prior to culturing any transgenic aquatic species.” Aquaculturists must comply with the BMPs in order to receive an Aquaculture Certificate of Registration. Aquaculture Best Management Practices Rules, January 2005 (Note: To date, the Task Force has approved only one transgenic fish: the Glofish) http://www.floridaaquaculture.com/publications/BMP%20Rule-Manual112805.pdf Bt Cotton Geographic Restriction: Under current EPA regulations, the agency has “imposed sale and distribution restrictions on B.t. cotton in Florida, restricting its use to those sites North of Tampa (Route 60).” This is due to potential gene flow into the wild cotton species found in that area. Biopesticides Registration Action Document for the Bacillus thuringiensis (Bt) Plant-Incorporated Protectants, October 15, 2001 http://www.epa.gov/pesticides/biopesticides/pips/bt_brad.htm
State legislation restricting local
control of GMOs:
HB1717 Passed 5/6/2005

Center for Food Safety – A New View of U.S. Agriculture 10
Georgia Organic as % of all
state ag sales state ranking:
44 Organic as % of US
organic ag sales state ranking:
37
Top 5 agricultural commodities
% of state total
% of US
total Value of receipts
($1000) % GE
1. Broilers 46.8 14.0 2,857,580 0% 2. Cotton 8.0 9.0 487,410 95% 3. Cattle and calves 6.5 0.8 395,833 0% 4. Chicken eggs 6.5 7.4 394,223 0% 5. Peanuts 5.7 41.7 347,700 0% All commodities 2.5 6,107,025
Total value of organic sales ($1000): 671
Legislation and regulations controlling GMOs:
State legislation restricting local
control of GMOs:
SB87 Passed 2/18/2005
Hawaii Organic as % of all
state ag sales state ranking:
3 Organic as % of US
organic ag sales state ranking:
18
Top 5 agricultural commodities
% of state total
% of US
total Value of receipts
($1000) % GE
1. Greenhouse/nursery 17.2 0.6 94,525 0% 2. Pineapples 14.5 100.0 79,934 0% 3. Cane for sugar 11.9 6.6 65,429 0% 4. Macadamia nuts 7.3 100.0 40,115 0% 5. Coffee 4.1 100.0 22,365 0% All commodities 0.2 549,830
Total value of organic sales ($1000): 4,801
Legislation and regulations controlling GMOs: Bt Cotton Geographic Restriction: Under EPA regulations, “current Agency restrictions in Hawaii preclude the sale and use of B.t. cotton for commercial planting [on the islands].” This is due to potential gene flow into the wild cotton species found in those areas. Biopesticides Registration Action Document for the Bacillus thuringiensis (Bt) Plant-Incorporated Protectants, October 15, 2001 http://www.epa.gov/pesticides/biopesticides/pips/bt_brad.htm
State legislation restricting local
control of GMOs: None

Center for Food Safety – A New View of U.S. Agriculture 11
Idaho Organic as % of all
state ag sales state ranking:
6 Organic as % of US
organic ag sales state ranking:
2
Top 5 agricultural commodities
% of state total
% of US
total Value of receipts
($1000) % GE
1. Dairy products 31.2 5.0 1,358,400 0% 2. Cattle and calves 24.4 2.2 1,059,388 0% 3. Potatoes 11.6 21.2 503,034 0%* 4. Wheat 7.6 4.5 332,091 0% 5. Hay 6.1 6.0 265,042 0%* All commodities 1.8 4,349,253
Total value of organic sales ($1000): 25,328
Legislation and regulations controlling GMOs: GMO Restriction: Idaho Plant Pest Act of 2002 (HO448) passed, which states that “the shipment, introduction into or release within this state of any plant pest, biocontrol agent, or genetically engineered plant or plant pest, or any other organism which may directly or indirectly affect the plant life of this state as an injurious pest, parasite or predator of other organisms, or any arthropod, is prohibited, except under permit issued by the Department [of Agriculture].” Idaho Code Ann. §22-2016 http://www3.state.id.us/cgi-bin/newidst?sctid=220200016.K
State legislation restricting local
control of GMOs:
HB38 Passed 3/23/2005
Illinois Organic as % of all
state ag sales state ranking:
40 Organic as % of US
organic ag sales state ranking:
31
Top 5 agricultural commodities
% of state total
% of US
total Value of receipts
($1000) % GE
1. Corn 42.5 18.6 4,121,224 36% 2. Soybeans 30.3 16.0 2,944,989 81% 3. Hogs 10.6 7.2 1,027,628 0% 4. Cattle and calves 5.0 1.0 486,612 0% 5. Dairy products 3.2 1.1 308,819 0% All commodities 4.0 9,708,304
Total value of organic sales ($1000): 1,778
Legislation and regulations controlling GMOs:
State legislation restricting local
control of GMOs: None

Center for Food Safety – A New View of U.S. Agriculture 12
Indiana Organic as % of all
state ag sales state ranking:
43 Organic as % of US
organic ag sales state ranking:
35
Top 5 agricultural commodities
% of state total
% of US
total Value of receipts
($1000) % GE
1. Corn 29.6 8.0 1,786,401 26% 2. Soybeans 27.0 8.9 1,632,248 89% 3. Hogs 12.2 5.1 738,470 0% 4. Dairy products 8.1 1.8 490,646 0% 5. Chicken eggs 4.8 5.5 291,947 0% All commodities 2.5 6,043,191
Total value of organic sales ($1000): 851
Legislation and regulations controlling GMOs: Seed Contract Restriction: Bill (HB1119) passed which states that “a seed contract may not give … a seed supplier or an agent of a seed supplier the right to enter real property owned or occupied by the farmer to acquire samples [for testing] of the crop grown from the seed or any other plant growing on the real property unless” specific conditions, such as written notification, are met. Ind. Code §15-4-13 (2002) http://www.in.gov/legislative/ic/code/title15/ar4/ch13.html
State legislation restricting local
control of GMOs:
HB1302 Passed 3/25/2005
Iowa Organic as % of all
state ag sales state ranking:
23 Organic as % of US
organic ag sales state ranking:
6
Top 5 agricultural commodities
% of state total
% of US
total Value of receipts
($1000) % GE
1. Corn 28.8 19.0 4,220,252 60% 2. Hogs 25.9 26.5 3,801,018 0% 3. Soybeans 19.7 15.7 2,887,238 91% 4. Cattle and calves 14.5 4.5 2,124,600 0% 5. Dairy products 4.2 2.3 620,052 0% All commodities 6.1 14,652,946
Total value of organic sales ($1000): 13,333
Legislation and regulations controlling GMOs:
State legislation restricting local
control of GMOs:
HF642 Passed 4/6/2005
Center for Food Safety – A New View of U.S. Agriculture 13
Kansas Organic as % of all
state ag sales state ranking:
38 Organic as % of US
organic ag sales state ranking:
29
Top 5 agricultural commodities
% of state total
% of US
total Value of receipts
($1000) % GE
1. Cattle and calves 59.4 11.9 5,643,895 0% 2. Wheat 11.7 15.1 1,115,680 0% 3. Corn 8.8 3.7 831,885 63% 4. Soybeans 5.6 2.9 531,004 90% 5. Hogs 4.0 2.6 379,048 0% All commodities 3.9 9,502,727
Total value of organic sales ($1000): 2,320
Legislation and regulations controlling GMOs:
State legislation restricting local
control of GMOs:
HB2341 Passed 4/1/2005
Kentucky Organic as % of all
state ag sales state ranking:
27 Organic as % of US
organic ag sales state ranking:
27
Top 5 agricultural commodities
% of state total
% of US
total Value of receipts
($1000) % GE
1. Horses/mules 23.0 81.8 950,000 0% 2. Broilers 16.7 3.4 690,932 0% 3. Cattle and calves 15.0 1.3 620,650 0% 4. Tobacco 10.2 27.8 421,694 0%* 5. Soybeans 9.0 2.0 372,216 n/a All commodities 1.7 4,126,185
Total value of organic sales ($1000): 2,987
Legislation and regulations controlling GMOs:
State legislation restricting local
control of GMOs: None

Center for Food Safety – A New View of U.S. Agriculture 14
Louisiana Organic as % of all
state ag sales state ranking:
46 Organic as % of US
organic ag sales state ranking:
47
Top 5 agricultural commodities
% of state total
% of US
total Value of receipts
($1000) % GE
1. Cane for sugar 14.9 33.2 331,220 0% 2. Rice 10.9 14.1 243,420 0%* 3. Cattle and calves 9.2 0.4 205,490 0% 4. Soybeans 9.0 1.1 200,610 n/a 5. Cotton 8.8 3.6 196,766 95% All commodities 0.9 2,225,803
Total value of organic sales ($1000): 51
Legislation and regulations controlling GMOs:
State legislation restricting local
control of GMOs: None

Center for Food Safety – A New View of U.S. Agriculture 15
Maine Organic as % of all
state ag sales state ranking:
4 Organic as % of US
organic ag sales state ranking:
21
Top 5 agricultural commodities
% of state total
% of US
total Value of receipts
($1000) % GE
1. Dairy products 19.7 0.4 109,260 0% 2. Potatoes 16.6 3.9 92,126 0%* 3. Chicken eggs 11.1 1.2 61,408 0% 4. Greenhouse/nursery 7.5 0.3 41,322 0% 5. Aquaculture 6.8 4.2 37,385 0% All commodities 0.2 553,830
Total value of organic sales ($1000): 4,113
Legislation and regulations controlling GMOs: GE Seed Regulation: Bill (HP952) passed which states that “the manufacturer or seed dealer of the genetically engineered plants, plant parts or seeds shall provide written instructions to all growers on how to plant the plant parts, seeds or plants and how to grow and harvest the crop to minimize potential cross-contamination.” Me. Rev. Stat. Ann. tit. 7, §1052 (2001) http://janus.state.me.us/legis/statutes/7/title7sec1052.html GE Labeling: Bill (SP569) passed which states that “a label may be placed on any food, food product or food ingredient offered for sale in the State designating that food, food product or food ingredient as free of or made without recombinant deoxyribonucleic acid technology, genetic engineering or bioengineering…The rules must allow any food 1% or less of which consists of genetically engineered ingredients to be labeled as free of genetically engineered ingredients.” Law further states that “if a manufacturer, distributor, processor, wholesaler or retailer falsely labels or advertises any food, food product or food ingredient offered for sale in the State as free of or made without recombinant deoxyribonucleic acid technology, genetic engineering or bioengineering, the food, food product or food ingredient is misbranded…” Me. Rev. Stat. Ann. tit. 7, §530-A (2001) http://janus.state.me.us/legis/statutes/7/title7sec530-A.html Milk Labeling: The Department of Agriculture, Food, and Rural Resources sets out criteria for the State of Maine Quality Trademark on milk and milk products in the Code of Maine Rules. A licensed user of the label must have submitted “a sworn statement stating that the milk producer has not used recombinant bovine somatotropin (rBST) in the previous 60 days, does not possess, and does not intend to use (rBST) during the upcoming year.” 01-001 CMR Chapter 136 (1994) http://www.maine.gov/sos/cec/rules/01/001/001c136.doc Town GMO Ban: On March 25, 2006 the town of Montville approved a resolution that declared itself a GMO-free zone. “Montville Bans Genetically Modified Seeds,” Bangor Daily News, 27 March 2006 http://www.bangornews.com
State legislation restricting local
control of GMOs: None
Center for Food Safety – A New View of U.S. Agriculture 16
Maryland Organic as % of all
state ag sales state ranking:
15 Organic as % of US
organic ag sales state ranking:
23
Top 5 agricultural commodities
% of state total
% of US
total Value of receipts
($1000) % GE
1. Broilers 36.0 3.1 628,406 0% 2. Greenhouse/nursery 20.7 2.3 360,396 0% 3. Dairy products 11.2 0.7 196,010 0% 4. Corn 6.9 0.5 120,191 n/a 5. Soybeans 6.4 0.6 112,155 n/a All commodities 0.7 1,743,357
Total value of organic sales ($1000): 3,614
Legislation and regulations controlling GMOs: GE Fish Ban: Bill (HB189) passed which states that “the Department [of Natural Resources] may not issue a permit for the raising of a transgenic species or a genetically altered species, unless the permit limits the aquaculture operation to waters of the State that do not flow into any other body of water; and the aquaculture operation is constructed in a manner that assures that transgenic or genetically altered stocks are precluded from entering any other waters or contaminating other aquatic species of the State.” Md. Code Ann., [Nat. Res.] §4-11A-02 (2001) http://mlis.state.md.us/cgi-win/web_statutes.exe
State legislation restricting local
control of GMOs: None
Massachusetts Organic as % of all
state ag sales state ranking:
1 Organic as % of US
organic ag sales state ranking:
13
Top 5 agricultural commodities
% of state total
% of US
total Value of receipts
($1000) % GE
1. Greenhouse/nursery 35.4 0.9 146,398 0% 2. Cranberries 15.1 29.1 62,378 0% 3. Dairy products 12.4 0.2 51,275 0% 4. Corn, sweet 4.1 2.0 16,965 0% 5. Apples 3.3 0.8 13,456 0% All commodities 0.2 413,954
Total value of organic sales ($1000): 7,837
Legislation and regulations controlling GMOs: Currently, 7 towns have passed resolutions voicing opposition to GMOs and calling on the state’s US Senators and Congressional Representatives to support legislation regulating GMOs.
State legislation restricting local
control of GMOs: None

Center for Food Safety – A New View of U.S. Agriculture 17
Michigan Organic as % of all
state ag sales state ranking:
18 Organic as % of US
organic ag sales state ranking:
14
Top 5 agricultural commodities
% of state total
% of US
total Value of receipts
($1000) % GE
1. Dairy products 23.7 3.7 1,020,380 0% 2. Greenhouse/nursery 14.1 3.9 609,209 0% 3. Corn 10.6 2.1 458,050 40% 4. Soybeans 9.8 2.3 422,684 76% 5. Cattle and calves 6.1 0.6 262,757 0% All commodities 1.8 4,312,320
Total value of organic sales ($1000): 7,019
Legislation and regulations controlling GMOs: GE Fish Restriction: Bill (SB226) passed which states that “unless authorized by a permit issued by the department…a person shall not knowingly release or allow to be released into this state [a genetically engineered fish or a nonnative fish]…that is not naturalized in the location of release.” 2003 Mich. Pub. Acts No. 270 (effective March 2004) http://www.legislature.mi.gov/documents/2003-2004/publicact/htm/2003-PA-0270.htm GE Fish Restriction: Bill (SB229) passed which states that “…each genetically engineered variant of an aquaculture species shall be considered a distinct aquaculture species. A genetically engineered variant of an aquaculture species is not included on the list of approved aquaculture species … unless specifically identified …A genetically engineered organism that is a variant of an aquaculture species is not covered by an aquaculture research permit…” 2003 Mich. Pub. Acts No. 272 (effective March 2004) http://www.legislature.mi.gov/documents/2003-2004/publicact/htm/2003-PA-0272.htm
State legislation restricting local
control of GMOs: None

Center for Food Safety – A New View of U.S. Agriculture 18
Minnesota Organic as % of all
state ag sales state ranking:
25 Organic as % of US
organic ag sales state ranking:
11
Top 5 agricultural commodities
% of state total
% of US
total Value of receipts
($1000) % GE
1. Corn 18.7 8.2 1,827,809 66% 2. Hogs 17.6 12.0 1,724,512 0% 3. Soybeans 16.8 9.0 1,648,271 83% 4. Dairy products 13.6 4.9 1,336,334 0% 5. Cattle and calves 10.1 2.1 989,285 0% All commodities 4.1 9,794,912
Total value of organic sales ($1000): 8,330
Legislation and regulations controlling GMOs: GMO Regulation: Bill (H2212) passed which is meant to “establish permits for the release of certain genetically engineered agriculturally related organisms to protect humans and the environment from the potential for significant adverse effects of those releases.” Minn. Stat. §18F.01 to 18F.13 (1994) http://www.revisor.leg.state.mn.us/bin/getpub.php?pubtype=STAT_CHAP&year=current&chapter=18F GE Pesticide Regulation: Minnesota statutes state that “a person may not use, distribute, or conduct release experiments with a genetically engineered pesticide in any amount in the state until it is registered under this section.” It further states that “the commissioner may issue an experimental genetically engineered pesticide product registration if the commissioner determines that the applicant has adequately demonstrated that the proposed release does not have the potential for unreasonable adverse effects on the environment.” Minn. Stat. §18B.285 (1991) http://www.revisor.leg.state.mn.us/bin/getpub.php?pubtype=STAT_CHAP&year=current&chapter=18b
State legislation restricting local
control of GMOs: None

Center for Food Safety – A New View of U.S. Agriculture 19
Mississippi Organic as % of all
state ag sales state ranking:
42 Organic as % of US
organic ag sales state ranking:
38
Top 5 agricultural commodities
% of state total
% of US
total Value of receipts
($1000) % GE
1. Broilers 47.2 9.4 1,930,412 0% 2. Cotton 12.9 9.7 526,497 96% 3. Soybeans 9.6 2.1 393,188 96% 4. Aquaculture 6.8 31.0 276,971 0% 5. Cattle and calves 4.8 0.4 196,129 0% All commodities 1.7 4,089,158
Total value of organic sales ($1000): 649
Legislation and regulations controlling GMOs: GE Fish Regulation: Bill (H0336) passed which states that “an aquaculturist shall obtain a cultivation and marketing permit for cultured aquatic products produced from…any aquatic plants or animals which have been genetically modified or are to be genetically modified by means other than breeding and crossbreeding.” Miss Code Ann. §79-22-9 (2000) http://www.sos.state.ms.us/pubs/mscode
State legislation restricting local
control of GMOs: None
Missouri Organic as % of all
state ag sales state ranking:
41 Organic as % of US
organic ag sales state ranking:
34
Top 5 agricultural commodities
% of state total
% of US
total Value of receipts
($1000) % GE
1. Soybeans 20.3 6.4 1,183,646 89% 2. Cattle and calves 19.4 2.4 1,131,621 0% 3. Corn 13.5 3.5 787,566 55% 4. Hogs 10.7 4.3 623,260 0% 5. Dairy products 5.1 1.1 298,808 0% All commodities 2.4 5,818,727
Total value of organic sales ($1000): 979
Legislation and regulations controlling GMOs:
State legislation restricting local
control of GMOs: None

Center for Food Safety – A New View of U.S. Agriculture 20
Montana Organic as % of all
state ag sales state ranking:
17 Organic as % of US
organic ag sales state ranking:
22
Top 5 agricultural commodities
% of state total
% of US
total Value of receipts
($1000) % GE
1. Cattle and calves 49.3 2.3 1,104,387 0% 2. Wheat 25.3 7.7 565,647 0% 3. Barley 5.6 18.4 124,839 0% 4. Hay 3.9 2.0 86,794 0%* 5. Sugar beets 2.5 4.4 56,244 0%* All commodities 0.9 2,238,979
Total value of organic sales ($1000): 3,847
Legislation and regulations controlling GMOs:
State legislation restricting local
control of GMOs: None
Nebraska Organic as % of all
state ag sales state ranking:
33 Organic as % of US
organic ag sales state ranking:
20
Top 5 agricultural commodities
% of state total
% of US
total Value of receipts
($1000) % GE
1. Cattle and calves 52.6 13.1 6,196,896 0% 2. Corn 21.6 11.5 2,543,705 69% 3. Soybeans 10.9 7.0 1,280,621 91% 4. Hogs 6.5 5.3 761,953 0% 5. Wheat 1.8 3.0 217,810 0% All commodities 4.9 11,779,728
Total value of organic sales ($1000): 4,145
Legislation and regulations controlling GMOs: GE Pesticide Regulation: Bill (LB588) passed, known as the Pesticide Act, with the intent “to regulate, in the public interest, the labeling, distribution, storage, transportation, use, application, and disposal of pesticides for the protection of human health and the environment.” The act defines a biological control agent as “any living organism applied to or introduced into the environment that is intended to function as a pesticide against another organism” and further classifies it as a pesticide, to be regulated by the Act. Genetically engineered B.t. crops fall within the definition of “biological control agent.” Neb. Rev. Stat. §2-2622 to §2-2654 (1993) http://srvwww.unicam.state.ne.us/legislature/legaldocs/Statutes/CHAP02
State legislation restricting local
control of GMOs: None

Center for Food Safety – A New View of U.S. Agriculture 21
Nevada Organic as % of all
state ag sales state ranking:
35 Organic as % of US
organic ag sales state ranking:
24
Top 5 agricultural commodities
% of state total
% of US
total Value of receipts
($1000) % GE
1. Cattle and calves 52.6 13.1 6,196,896 0% 2. Corn 21.6 11.5 2,543,705 n/a 3. Soybeans 10.9 7.0 1,280,621 n/a 4. Hogs 6.5 5.3 761,953 0% 5. Wheat 1.8 3.0 217,810 0% All commodities 4.9 11,779,728
Total value of organic sales ($1000): 3,613
Legislation and regulations controlling GMOs:
State legislation restricting local
control of GMOs: None
New Hampshire Organic as % of all
state ag sales state ranking:
5 Organic as % of US
organic ag sales state ranking:
33
Top 5 agricultural commodities
% of state total
% of US
total Value of receipts
($1000) % GE
1. Greenhouse/nursery 36 0.4 60,819 0% 2. Dairy products 31.3 0.2 52,923 0% 3. Apples 4.5 0.4 7,618 0% 4. Cattle and calves 4.1 0.0 7,001 0% 5. Corn, sweet 3.1 0.6 5,292 0% All commodities 0.1 168,871
Total value of organic sales ($1000): 1,154
Legislation and regulations controlling GMOs:
State legislation restricting local
control of GMOs: None

Center for Food Safety – A New View of U.S. Agriculture 22
New Jersey Organic as % of all
state ag sales state ranking:
36 Organic as % of US
organic ag sales state ranking:
43
Top 5 agricultural commodities
% of state total
% of US
total Value of receipts
($1000) % GE
1. Greenhouse/nursery 42.5 2.3 368,546 0% 2. Horses/mules 12.6 9.4 109,000 0% 3. Blueberries 5.3 15.4 45,630 0% 4. Dairy products 3.7 0.1 32,308 0% 5. Chicken eggs 3.3 0.5 28,912 0% All commodities 0.4 866,719
Total value of organic sales ($1000): 222
Legislation and regulations controlling GMOs:
State legislation restricting local
control of GMOs: None
New Mexico Organic as % of all
state ag sales state ranking:
29 Organic as % of US
organic ag sales state ranking:
32
Top 5 agricultural commodities
% of state total
% of US
total Value of receipts
($1000) % GE
1. Dairy products 39.0 3.7 1,000,224 0% 2. Cattle and calves 37.0 2.0 948,659 0% 3. Hay 5.0 2.9 127,680 0%* 4. Pecans 3.5 27.2 88,920 0% 5. Greenhouse/nursery 2.3 0.4 59,873 0% All commodities 1.1 2,564,863
Total value of organic sales ($1000): 1,576
Legislation and regulations controlling GMOs:
State legislation restricting local
control of GMOs: None

Center for Food Safety – A New View of U.S. Agriculture 23
New York Organic as % of all
state ag sales state ranking:
10 Organic as % of US
organic ag sales state ranking:
7
Top 5 agricultural commodities
% of state total
% of US
total Value of receipts
($1000) % GE
1. Dairy products 53.4 7.1 1,950,144 0% 2. Greenhouse/nursery 10.4 2.4 378,415 0% 3. Apples 4.7 9.7 172,860 0% 4. Cattle and calves 3.5 0.3 127,331 0% 5. Hay 3.3 2.7 120,252 0%* All commodities 1.5 3,653,431
Total value of organic sales ($1000): 12,920
Legislation and regulations controlling GMOs:
State legislation restricting local
control of GMOs: None
North Carolina Organic as % of all
state ag sales state ranking:
28 Organic as % of US
organic ag sales state ranking:
17
Top 5 agricultural commodities
% of state total
% of US
total Value of receipts
($1000) % GE
1. Hogs 25.3 14.5 2,078,800 0% 2. Broilers 24.9 10.0 2,041,785 0% 3. Greenhouse/nursery 11.4 5.9 932,871 0% 4. Tobacco 7.6 40.8 620,085 0%* 5. Turkeys 5.5 15.0 448,812 0% All commodities 3.4 8,210,497
Total value of organic sales ($1000): 5,365
Legislation and regulations controlling GMOs:
State legislation restricting local
control of GMOs: None
Center for Food Safety – A New View of U.S. Agriculture 24
North Dakota Organic as % of all
state ag sales state ranking:
26 Organic as % of US
organic ag sales state ranking:
26
Top 5 agricultural commodities
% of state total
% of US
total Value of receipts
($1000) % GE
1. Wheat 26.3 14.6 1,075,122 0% 2. Cattle and calves 18.1 1.6 738,975 0% 3. Soybeans 13.1 2.9 536,619 89% 4. Corn 6.6 1.2 269,265 n/a 5. Sugar beets 5.9 19.0 240,853 0%* All commodities 1.7 4,090,864
Total value of organic sales ($1000): 3,262
Legislation and regulations controlling GMOs: GE Seed Inspection: Bill (SB2235) passed which states that “the commissioner shall establish procedures for inspecting, analyzing, and verifying the genetic identity or physical traits of seeds or crops. The procedures must address the compilation of all necessary documentation and other administrative functions.” N.D. Cent. Code § 4-42 (2001) http://www.legis.nd.gov/cencode/t04c42.pdf Seed Collection Restriction: Bill (HB1442) which states that “before a person holding a patent on a genetically modified seed may enter upon any land farmed by another for the purpose of obtaining crop samples to determine whether patent infringement has occurred, the person holding the patent: Shall notify the agriculture commissioner in writing of the person's belief that a patent infringement has occurred and include facts from the allegation; shall notify the farmer in writing of the allegation that a patent infringement has occurred and request written permission to enter upon the farmer's land; and must obtain the written permission of the farmer.” N.D. Cent. Code § 4-24-13 (2001) http://www.legis.nd.gov/cencode/t04c24.pdf
State legislation restricting local
control of GMOs:
SB2277 Passed 3/16/2005

Center for Food Safety – A New View of U.S. Agriculture 25
Ohio Organic as % of all
state ag sales state ranking:
21 Organic as % of US
organic ag sales state ranking:
16
Top 5 agricultural commodities
% of state total
% of US
total Value of receipts
($1000) % GE
1. Soybeans 22.4 6.6 1,220,297 77% 2. Corn 18.8 4.6 1,024,109 18% 3. Dairy products 13.8 2.7 751,980 0% 4. Greenhouse/nursery 10.8 3.8 589,124 0% 5. Hogs 7.4 2.8 402,719 0% All commodities 2.3 5,459,380
Total value of organic sales ($1000): 5,616
Legislation and regulations controlling GMOs:
State legislation restricting local
control of GMOs:
HB66 Passed 6/30/2005
Oklahoma Organic as % of all
state ag sales state ranking:
49 Organic as % of US
organic ag sales state ranking:
48
Top 5 agricultural commodities
% of state total
% of US
total Value of receipts
($1000) % GE
1. Cattle and calves 46.7 5.0 2,362,342 0% 2. Hogs 12.2 4.3 615,411 0% 3. Broilers 10.8 2.7 547,096 0% 4. Wheat 10.5 7.2 528,314 0% 5. Dairy products 4.3 0.8 218,575 0% All commodities 2.1 5,054,570
Total value of organic sales ($1000): 12
Legislation and regulations controlling GMOs:
State legislation restricting local
control of GMOs:
HB1471 Passed 4/18/2005

Center for Food Safety – A New View of U.S. Agriculture 26
Oregon Organic as % of all
state ag sales state ranking:
13 Organic as % of US
organic ag sales state ranking:
9
Top 5 agricultural commodities
% of state total
% of US
total Value of receipts
($1000) % GE
1. Greenhouse/nursery 25.8 6.1 951,452 0% 2. Cattle and calves 13.8 1.1 508,910 0% 3. Dairy products 9.7 1.3 359,520 0% 4. Hay 7.1 6.0 262,327 0%* 5. Ryegrass 5.5 100.0 204,557 0% All commodities 1.5 3,691,554
Total value of organic sales ($1000): 9,933
Legislation and regulations controlling GMOs: GE Fish Ban: Oregon Administrative Rules states that “the Department [of Fish and Wildlife] shall not authorize the release of transgenic fish into locations where such fish may gain access to wild fish populations.” Or. Admin. Rules 635-007-0595 (2004) http://arcweb.sos.state.or.us/rules/OARS_600/OAR_635/635_007.html Bentgrass Control Area: The department of agriculture, under the Oregon Administrative Rules, established “a control area…in Jefferson County to regulate the production of bentgrass. This control area is designed to provide physical separation between varieties of bentgrass produced using techniques of modern biotechnology and conventionally bred varieties with which they might cross-pollinate.” The rule prohibits using processing equipment for both GE and conventional bentgrass and restricts GE bentgrass to the control area unless shipped in sealed containers. Or. Admin. Rules 603-052-1240 (2002) http://arcweb.sos.state.or.us/rules/OARS_600/OAR_603/603_052.html
State legislation restricting local
control of GMOs: None

Center for Food Safety – A New View of U.S. Agriculture 27
Pennsylvania Organic as % of all
state ag sales state ranking:
16 Organic as % of US
organic ag sales state ranking:
10
Top 5 agricultural commodities
% of state total
% of US
total Value of receipts
($1000) % GE
1. Dairy products 36.4 6.5 1,768,976 0% 2. Cattle and calves 9.5 1.0 459,569 0% 3. Greenhouse/nursery 8.8 2.7 425,464 0% 4. Mushrooms, agaricus 7.8 58.7 380,994 0% 5. Chicken eggs 7.0 6.4 339,676 0% All commodities 2.0 4,859,336
Total value of organic sales ($1000): 8,808
Legislation and regulations controlling GMOs:
State legislation restricting local
control of GMOs:
HB2387 Passed 11/29/2004
Rhode Island Organic as % of all
state ag sales state ranking:
9 Organic as % of US
organic ag sales state ranking:
41
Top 5 agricultural commodities
% of state total
% of US
total Value of receipts
($1000) % GE
1. Greenhouse/nursery 64.5 0.3 41,155 0% 2. Corn, sweet 5.9 0.5 3,762 0% 3. Dairy products 5.4 0.0 3,434 0% 4. Potatoes 1.8 0.0 1,124 0%* 5. Cattle and calves 1.5 0.0 938 0% All commodities 0.0 63,825
Total value of organic sales ($1000): 270
Legislation and regulations controlling GMOs:
State legislation restricting local
control of GMOs: None

Center for Food Safety – A New View of U.S. Agriculture 28
South Carolina Organic as % of all
state ag sales state ranking:
32 Organic as % of US
organic ag sales state ranking:
36
Top 5 agricultural commodities
% of state total
% of US
total Value of receipts
($1000) % GE
1. Broilers 27.3 2.6 521,884 0% 2. Greenhouse/nursery 15.6 1.9 297,997 0% 3. Turkeys 9.7 6.2 185,280 0% 4. Cattle and calves 7.6 0.3 145,504 0% 5. Tobacco 6.0 7.6 115,004 0%* All commodities 0.8 1,909,099
Total value of organic sales ($1000): 746
Legislation and regulations controlling GMOs:
State legislation restricting local
control of GMOs: None

Center for Food Safety – A New View of U.S. Agriculture 29
South Dakota Organic as % of all
state ag sales state ranking:
30 Organic as % of US
organic ag sales state ranking:
30
Top 5 agricultural commodities
% of state total
% of US
total Value of receipts
($1000) % GE
1. Cattle and calves 33.6 3.5 1,639,061 0% 2. Corn 19.5 4.3 949,749 83% 3. Soybeans 16.8 4.5 820,587 95% 4. Wheat 8.8 5.8 426,961 0% 5. Hogs 7.6 2.6 371,000 0% All commodities 2.0 4,877,484
Total value of organic sales ($1000): 2,239
Legislation and regulations controlling GMOs: Seed Collection Restriction: Bill (SB179) passed titled “An Act to regulate sampling procedures for verification of transgenic seed use.” It states that “before a person holding a patent on transgenic seed may enter upon any land farmed by another for the purpose of obtaining crop samples to determine whether patent infringement has occurred, the person holding the patent” must provide written notification and receive permission of the farmer. S.D. Codified Law § 38-1-44 through 38-1-50 (2001) http://legis.state.sd.us/statutes/DisplayStatute.aspx?Statute=38-1&Type=StatuteChapter Alfalfa Restriction Agreement: Following discussions between the South Dakota Department of Agriculture, South Dakota State University, and Monsanto, the following language was added to the Roundup Ready® alfalfa technical use guide: “In geographies where conventional common alfalfa seed production is intermingled with forage production and the agronomic conditions (climate and water/irrigation availablility) are such that forage alfalfa is allowed to stand and flower late in the season, Roundup Ready alfalfa must be harvested at or before 10% bloom to minimize potential pollen flow from hay to common alfalfa seed production.” The company also sent a statement to the Department stating: “Any determination to pursue patent enforcement shall be made only in circumstances where evidence clearly points to a deliberate infringement.” S.D. Dept. of Ag. Press Release (2006) http://www.state.sd.us/news/showDoc.aspx?i=7325
State legislation restricting local
control of GMOs:
SB152 Passed 2/25/2005

Center for Food Safety – A New View of U.S. Agriculture 30
Tennessee Organic as % of all
state ag sales state ranking:
37 Organic as % of US
organic ag sales state ranking:
39
Top 5 agricultural commodities
% of state total
% of US
total Value of receipts
($1000) % GE
1. Cattle and calves 20.1 1.1 514,388 0% 2. Broilers 17.2 2.2 439,604 0% 3. Soybeans 11.0 1.5 282,763 n/a 4. Greenhouse/nursery 10.6 1.7 272,509 0% 5. Cotton 8.8 4.2 225,093 n/a All commodities 1.1 2,561,984
Total value of organic sales ($1000): 637
Legislation and regulations controlling GMOs:
State legislation restricting local
control of GMOs: None
Texas Organic as % of all
state ag sales state ranking:
22 Organic as % of US
organic ag sales state ranking:
5
Top 5 agricultural commodities
% of state total
% of US
total Value of receipts
($1000) % GE
1. Cattle and calves 48.4 16.9 7,989,786 0% 2. Cotton 9.4 28.6 1,546,320 63% 3. Broilers 8.6 7.0 1,424,520 0% 4. Greenhouse/nursery 8.4 8.8 1,388,443 0% 5. Dairy products 5.9 3.6 975,718 0% All commodities 6.8 16,498,398
Total value of organic sales ($1000): 15,183
Legislation and regulations controlling GMOs:
State legislation restricting local
control of GMOs:
HB2313 Passed 6/17/2005

Center for Food Safety – A New View of U.S. Agriculture 31
Utah Organic as % of all
state ag sales state ranking:
34 Organic as % of US
organic ag sales state ranking:
40
Top 5 agricultural commodities
% of state total
% of US
total Value of receipts
($1000) % GE
1. Cattle and calves 34.4 0.9 431,201 0% 2. Dairy products 20.0 0.9 250,415 0% 3. Hogs 12.4 1.1 155,103 0% 4. Hay 9.2 2.6 114,710 0%* 5. Greenhouse/nursery 5.9 0.5 73,726 0% All commodities 0.5 1,253,154
Total value of organic sales ($1000): 437
Legislation and regulations controlling GMOs:
State legislation restricting local
control of GMOs: None

Center for Food Safety – A New View of U.S. Agriculture 32
Vermont Organic as % of all
state ag sales state ranking:
2 Organic as % of US
organic ag sales state ranking:
12
Top 5 agricultural commodities
% of state total
% of US
total Value of receipts
($1000) % GE
1. Dairy products 74.6 1.6 433,823 0% 2. Cattle and calves 8.3 0.1 48,238 0% 3. Greenhouse/nursery 4.6 0.2 26,895 0% 4. Hay 2.7 0.4 15,746 0%* 5. Maple products 2.3 35.9 13,650 0% All commodities 0.2 581,773
Total value of organic sales ($1000): 8,136
Legislation and regulations controlling GMOs: GE Seed Labeling: Bill (H.777) passed which states that “for all seed containing genetically engineered material the label or labeling shall specify the identity and relevant traits or characteristics of such seed, plus any requirements for their safe handling, storage, transport, and use, the contact point for further information and, as appropriate, the name and address of the manufacturer, distributor, or supplier of such seed.” Additionally, “for seeds sold in Vermont which contain genetically engineered material, the manufacturer or processor distributing such seed in Vermont shall report annually…regarding sales during the previous calendar year.” Vt. Stat. Ann. tit. 6, §644 (2004) http://www.leg.state.vt.us/statutes/sections.cfm?Title=06&Chapter=035 Additionally, 83 towns have passed resolutions against GMOs. See http://www.gefreevt.org for map and information.
State legislation restricting local
control of GMOs: None

Center for Food Safety – A New View of U.S. Agriculture 33
Virginia Organic as % of all
state ag sales state ranking:
19 Organic as % of US
organic ag sales state ranking:
19
Top 5 agricultural commodities
% of state total
% of US
total Value of receipts
($1000) % GE
1. Broilers 22.0 2.9 590,172 0% 2. Cattle and calves 11.8 0.7 317,677 0% 3. Dairy products 11.5 1.1 308,417 0% 4. Greenhouse/nursery 8.7 1.5 232,453 0% 5. Turkeys 6.8 6.1 182,855 0% All commodities 1.1 2,684,393
Total value of organic sales ($1000): 4,306
Legislation and regulations controlling GMOs:
State legislation restricting local
control of GMOs: None
Washington Organic as % of all
state ag sales state ranking:
11 Organic as % of US
organic ag sales state ranking:
4
Top 5 agricultural commodities
% of state total
% of US
total Value of receipts
($1000) % GE
1. Apples 19.5 64.0 1,142,105 0% 2. Dairy products 14.6 3.1 857,010 0% 3. Cattle and calves 9.3 1.1 543,427 0% 4. Wheat 8.9 7.1 521,898 0% 5. Potatoes 7.7 19.1 453,268 0%* All commodities 2.4 5,868,196
Total value of organic sales ($1000): 20,326
Legislation and regulations controlling GMOs: GE Fish Ban: In the Washington Administrative Code, an aquatic farmer must have a valid marine finfish aquaculture permit for any fish rearing program but it states that “the use of transgenic fish (as defined by the actual transfer of genetic material from one species to another) is prohibited.” Wash. Admin. Code 220-76-100 (2003) http://apps.leg.wa.gov/WAC/default.aspx?cite=220-76-100
State legislation restricting local
control of GMOs: None

Center for Food Safety – A New View of U.S. Agriculture 34
West Virginia Organic as % of all
state ag sales state ranking:
31 Organic as % of US
organic ag sales state ranking:
45
Top 5 agricultural commodities
% of state total
% of US
total Value of receipts
($1000) % GE
1. Broilers 36.9 0.8 155,848 0% 2. Cattle and calves 20.7 0.2 87,386 0% 3. Chicken eggs 7.6 0.6 32,325 0% 4. Dairy products 7.5 0.1 31,515 0% 5. Turkeys 7.0 1.0 29,702 0% All commodities 0.2 422,871
Total value of organic sales ($1000): 176
Legislation and regulations controlling GMOs:
State legislation restricting local
control of GMOs:
SB580 Passed 4/16/2005
Wisconsin Organic as % of all
state ag sales state ranking:
12 Organic as % of US
organic ag sales state ranking:
3
Top 5 agricultural commodities
% of state total
% of US
total Value of receipts
($1000) % GE
1. Dairy products 53.7 13.5 3,687,749 0% 2. Cattle and calves 11.7 1.7 800,703 0% 3. Corn 9.7 3.0 668,997 46% 4. Greenhouse/nursery 3.5 1.5 237,404 0% 5. Soybeans 3.5 1.3 236,901 84% All commodities 2.8 6,864,150
Total value of organic sales ($1000): 20,828
Legislation and regulations controlling GMOs: GMO Release Notification: State statutes titled “Notice of release of genetically engineered organisms into the environment” sets up requirements for regulated releases, including proper notification of the Department of Agriculture. Wis Stat. §146.60 (1989) http://www.legis.state.wi.us/rsb/stats.html
State legislation restricting local
control of GMOs: None

Center for Food Safety – A New View of U.S. Agriculture 35
Wyoming Organic as % of all
state ag sales state ranking:
39 Organic as % of US
organic ag sales state ranking:
42
Top 5 agricultural commodities
% of state total
% of US
total Value of receipts
($1000) % GE
1. Cattle and calves 77.5 1.8 855,676 0% 2. Hay 3.9 1.0 43,594 0%* 3. Sugar beets 2.8 2.4 30,982 0%* 4. Hogs 2.6 0.2 28,330 0% 5. Sheep and lambs 2.5 5.4 27,574 0% All commodities 0.5 1,104,702
Total value of organic sales ($1000): 268
Legislation and regulations controlling GMOs:
State legislation restricting local
control of GMOs: None
United States Organic as % of all
state ag sales state ranking:
- Organic as % of US
organic ag sales state ranking:
-
Top 5 agricultural commodities
% of state total
% of US
total Value of receipts
($1000) % GE
1. Cattle and calves 19.6 47,295,573 0% 2. Dairy products 11.3 27,367,857 0% 3. Corn 9.2 22,198,830 52% 4. Broilers 8.5 20,446,085 0% 5. Soybeans 7.6 18,374,576 87% All commodities 241,241,402
Total value of organic sales ($1000): 392,813
Legislation and regulations controlling GMOs: Bt Cotton Geographic Restriction: Under current EPA regulations, the agency has “imposed sale and distribution restrictions on B.t. cotton in Florida, restricting its use to those sites North of Tampa (Route 60).” Also, “current Agency restrictions in Hawaii preclude the sale and use of B.t. cotton for commercial planting [on the islands].” This is due to potential gene flow into the wild cotton species found in those areas. Biopesticides Registration Action Document for the Bacillus thuringiensis (Bt) Plant-Incorporated Protectants, Oct 15, 2001 http://www.epa.gov/pesticides/biopesticides/pips/bt_brad.htm
State legislation restricting local
control of GMOs: -
Center for Food Safety – A New View of U.S. Agriculture 36

Center for Food Safety – A New View of U.S. Agriculture 37
Federal Regulation of GE Foods: The current federal system for regulation of GE foods involves three separate programs: the Animal and Plant Health Inspection Service (APHIS) of the US Department of Agriculture (USDA); the Environmental Protection Agency (EPA), which regulates GE pest-resistant crops; and the Food and Drug Administration (FDA) of the US Department of Health and Human Services. APHIS - In general, new GE crops are considered “regulated materials” and APHIS authorizes and
oversees their initial release in experimental field trials. Since the mid-1990s, APHIS has allowed the vast majority of GE field trials to occur with a simple notification system, requiring permits for only a few. Notifications require only the filling out of a short form, while permits require more detailed descriptions, including the genes and confinement methods, and give APHIS a longer period to come to a regulatory decision. Following field trials, the institution can submit a petition to APHIS for nonregulated status of the particular GMO. If the agency grants nonregulated status, it gives up authority to regulate the crop and therefore, no further authorization from the agency is required to grow the crop commercially. As a result, the institution is free to cultivate the GE crop without any additional oversight.1
EPA – The EPA is responsible for registering and approving GE pest-resistant crops (so far all such crops
have been Bt crops, engineered with a gene from the bacteria Bacillus thuringiensis). The agency uses its authority under the Federal Insecticide, Fungicide, and Rodenticide Act of 1947 (FIFRA), even though this regulation was developed decades ago for new chemicals, not engineered organisms that can reproduce and exchange genetic material in ways never imagined by chemical regulators. The result is a murky regulatory obligation where EPA technically regulates the pesticide, but not the plant itself. In practice, this means it approves field trials and commercial registration, as it does with other pesticides, but does not place use-restriction labels on the commercial seed, unlike the requirement for other pesticides. Instead, the agency relies on seed producers and dealers to ensure regulatory compliance. Without the government inspectors and compliance officials normally involved in pesticide regulation, seed dealers and growers are left with little, if any, oversight.2
FDA - The FDA claims regulatory authority under the 1958 Food Additive Amendment to the Federal
Food and Drug Act, passed decades before GE foods even became feasible. Under the Act, the FDA regulates food additives through premarket reviews, with the exception of those substances that are “generally recognized as safe” (GRAS). This exemption from regulation was originally intended for substances with a long history of human consumption, like salt or refined sugar. However, with the development of GE foods, the FDA created a statement of policy in 1992 using those same guidelines from 1958. That document claims that since every plant and animal cell already contains nucleic acid, inserted DNA is not viewed as a safety concern and would most likely be given GRAS status. The agency does note that the proteins, fats, or carbohydrates resulting from DNA insertion might not be GRAS and may need to be evaluated. The FDA continues to recommend consulting with the agency prior to commercial release of new GE foods, although it has yet to finalize a mandatory procedure.3
Center for Food Safety – A New View of U.S. Agriculture 38
Deregulated GE Crops: The National Agricultural Statistical Service of the USDA only keeps data on the production of the major GE crops in the US: cotton, soybeans, and corn. This data is collected only for some states, and has been included in the state factsheets accordingly. There have been other crops that have been granted nonregulated status and are therefore approved for commercial cultivation, however, most of these are grown in small amounts or not at all. Below is a list of all crops that have been granted nonregulated status by APHIS; the number in brackets following each crop represents the number of different gene insertions in that crop that have been granted nonregulated status.4 Brief notes on the crop’s history and current status are included as available. Alfalfa (1) In June 2005, Roundup Ready Alfalfa was de-regulated by the USDA to become the first GE
alfalfa commercially available. However, final foreign import approval from Japan, Mexico, and Canada, which assures open markets for US alfalfa exporters and is necessary for full unrestricted production, was not granted until 2006. This reduced the adoption rate of the alfalfa last year in states like California and Washington that export a lot of alfalfa. For its first summer on the market, Monsanto released approximately 1 million pounds of seed, which were planted on about 75,000 acres or 3% of total US alfalfa acreage.5 For the summer of 2006, the company hopes to release approximately 4 million pounds of seed.6
Canola/Rapeseed (7) About 90% of the US’s canola is produced in North Dakota, of which approximately
75% is Monsanto’s Roundup Ready canola (a GE herbicide-resistant variety).7 Corn (20) The main GE corn varieties are Bt corn, herbicide tolerant corn, and so-called “stacked”
varieties that include both traits. The most widely publicized contamination incident with GE food involved a GE corn from Aventis called StarLink, which was approved only for animal feed due to its potential allergenicity. In 2000, StarLink corn was discovered in processed foods, including taco shells, sparking a nationwide recall. Further testing confirmed seed contamination as well.8 Class action lawsuits were later filed on behalf of farmers whose non-StarLink corn was contaminated (settled for $110 million)9 and consumers who said they suffered allergic reactions to the corn (settled for $9 million).10
Cotton (11) Like GE corn, most GE cotton varieties are Bt, herbicide tolerant, or so-called “stacked”
varieties that include both traits. Flax (1) The USDA produces “marketing statements” designed to assure foreign markets, many of which
prohibit GMOs, that specific commodities from the US are GMO-free. Regarding flaxseed, the agency states that “[t]he United States Department of Agriculture has deregulated one variety of herbicide-tolerant flaxseed; but based upon information supplied by the developer, this variety is not for sale or in commercial production in the United States.”11
Papaya (1) In 2005, 53% of the papaya grown in Hawaii (the only state in the US which produces papaya)
was the “Rainbow” variety, genetically engineered to resist the papaya ringspot virus.12 While industry claims that GE papaya "saved" the Hawaiian papaya industry, in fact Hawaiian papaya production in 2005 was at its lowest point since before 1980, and sales were at their lowest point since 1985.13
Potato (5) No GE potatoes are currently grown in the US. According to the Executive Vice President of the
US Potato Council, the main reason for this is a lack of varieties with useful traits.14 NewLeaf, a Bt potato, was the first GE crop that Monsanto introduced, but it was a commercial failure and the company discontinued marketing in 2001. It is worth noting that in 2000, McDonald’s refused to use the GE potato, which resulted in its suppliers discontinuing cultivation.15

Center for Food Safety – A New View of U.S. Agriculture 39
Rice (2) A marketing statement from USDA regarding GE rice states the following:
“The United States Department of Agriculture has deregulated two varieties of transgenic herbicide-tolerant rice (Oryza sativa); but based upon information provided by the developer, these varieties were not available for sale as of October 11, 2005.
“Transgenic rice grown under USDA permit as a regulated article is not in commercial production for use as food or feed. USDA permit conditions require strict confinement procedures which are subject to Federal oversight and enforcement.”16
Soybean (5) 87% of the soybeans grown in the US are herbicide-resistant, making Monsanto’s Roundup
Ready soybean by far the most widely grown GE crop in the US.17 Squash (2) Genetically engineered squash acreage is not recorded by any reliable agency. As a result,
there are conflicting estimates regarding its prevalence but at best estimate, it is only cultivated in negligible amounts.18
Sugarbeet (3) While Roundup Ready sugarbeets have been de-regulated by the USDA, none are
currently in commercial cultivation. However, various field trials have been planted around the country and the first commercial demonstration is planted in Idaho. At present, the sugarbeet industry is developing seeds specific to various regions with the intention of large-scale introduction within a few years.19 However, it is unknown how the domestic and international markets will respond to sugar produced from GE sugarbeets.
Tobacco (1) Vector Tobacco has developed a nicotine-free tobacco variety that has been deregulated by
the USDA. It is used to produce Quest brand cigarettes. In 2002, the first commercial crop was planted on 5000 acres in Mississippi, Louisiana, Illinois, and Pennsylvania, all states that are not traditional tobacco-growing regions.20 However, according to a company spokesperson, there is no GE tobacco currently in cultivation although the cigarettes are still available for sale.21
Tomato (11) No GE tomatoes are currently in cultivation. However, the first commercially grown GE food
was Calgene’s Flavr Savr tomato, which the company submitted to the FDA for voluntary review in 1989 and marketed briefly beginning in 1994. Ultimately, the tomatoes were a failure, but Flavr Savr set the precedent for future regulatory procedures regarding GE foods.22
1 M. Taylor, J. Tick, and D. Sherman, Tending The Fields: State and Federal Roles in the Oversight of Genetically Modified Crops (Washington, D.C.: Pew Initiative on Food and Biotechnology, 2004) p 38. 2 Ibid, p 52. 3 Food and Drug Administration, Department of Health and Human Services, “Statement of Policy: Foods Derived from New Plant Varieties,” Federal Register 57(104):22984-23004 http://www.cfsan.fda.gov/~acrobat/fr920529.pdf. 4 Deregulated crops taken from the database supplied by Information Systems for Biotechnology, “Crops No Longer Regulated by USDA,” Online Database funded by USDA, 31 March 2006 http://www.isb.vt.edu/CFDOCS/biopetitions1.cfm (4 April 2006). 5 B. Curran, "Roundup Ready Alfalfa Approved for Sale in U.S." Penn State Field Crop News vol. 05:08, July, 8 2005 http://fcn.agronomy.psu.edu/2005/fcn0508.cfm#sale. 6 J. Dickrell, "RR Alfalfa Debuts," Dairy Today April 2006, http://www.agweb.com/get_article.asp?sigcat=dairy&pageid=126565. 7 S. Sankula, G. Marmon, E. Blumenthal, Biotechnology-Derived Crops Planted in 2004 – Impacts on US Agriculture (Washington, D.C.: National Center for Food and Agricultural Policy, 2005). 8 M. Nestle, Safe Food: Bacteria, Biotechnology, and Bioterrorism (Berkely: University of California Press, 2003); M. Kaufman, “Biotech Critics Cite Unapproved Corn in Taco Shells,” The Washington Post 18 Sept 2000. 9 For terms of settlement, see http://www.non-starlinkfarmerssettlement.com. 10 “Modified Corn Lawsuit Is Settled,” New York Times 8 March 2002. 11 GIPSA, USDA, “Letterhead Statements,” 12 September 2005 <http://archive.gipsa.usda.gov/rdd/transgenic_statements.pdf> (6 April 2006). 12 Hawaii Field Office, National Agricultural Statistical Services, United States Department of Agriculture, “Papaya Acreage Survey 2005 Results,” Online Reports Archive http://www.nass.usda.gov/hi/fruit/annpap.pdf. 13 Sean Hao, “Papaya production taking a tumble,” The Honolulu Advertiser, March 19, 2006. 14 John Keeling, Executive Vice President and CEO of the National Potato Council, personal communication, 4 April 2006.

Center for Food Safety – A New View of U.S. Agriculture 40
15 S. Kilman, “Monsanto's Genetically Modified Potatoes Find Slim Market, Despite Repelling Bugs,” The Wall Street Journal 21 March 2001. 16 GIPSA, USDA, “Letterhead Statements.” 17 Phosphinothricin-tolerant soybeans (“Liberty Link” soybeans) from Aventis have also been deregulated by the USDA, but the company has not sold the crop commercially. National Agricultural Statistical Services, United States Department of Agriculture, Acreage Report (Washington, D.C: USDA, 30 June 2005). http://usda.mannlib.cornell.edu/reports/nassr/field/pcp-bba/acrg0605.pdf; T. Redick, “Preventing Liability for Genetically Engineered Crops,” Agricultural Management Committee Newsletter 5(2), http://www.abanet.org/environ/committees/agricult/newsletter/mar01/redick.html. 18 S. Sankula, G. Marmon, E. Blumenthal, Biotechnology-Derived Crops Planted in 2004 – Impacts on US Agriculture; GEO-PIE Project, “Squash and Zucchini,” Genetically Engineered Organisms Public Issues Education Project, Cornell Cooperative Extension <http://www.geo-pie.cornell.edu/crops/squash.html> (21 April 2006). 19 Luther Markwart, Executive Vice President of the American Sugarbeet Growers Association, personal communication, 3 April 2006. 20 GEO-PIE Project, “Tobacco,” Genetically Engineered Organisms Public Issues Education Project, Cornell Cooperative Extension <http://www.geo-pie.cornell.edu/crops/tobacco.html> (21 April 2006). 21 Carrie Bloom, Public Relations, Vector Tobacco, personal communication, 28 April 2006. 22 M. Nestle, Safe Food: Bacteria, Biotechnology, and Bioterrorism.