state highway asset management manual · 2009-10-02 · this new release of the state highway asset...
TRANSCRIPT
STATE HIGHWAY
ASSET MANAGEMENT MANUAL
Manual Number: SM020 Effective From: October 1996 Re-issued: August 2000
Transit New Zealand PO Box 5084 WELLINGTON Telephone (04) 499 6600 Facsimile (04) 499 6666
Manual Owner: State Highway Manager Head Office Contact: Asset Management Team Leader Regional Office Contact: Maintenance/Area Engineer

ISBN
0-478-04700-2
Transit New Zealand, October 1996, State Highway Asset Management Manual
Re-issued August 2000

Document Status This document has the status of a guideline (M) (for State Highway compliance without alteration is mandatory) as defined in Transit New Zealand's (1993) Standards, Criteria and Guidelines Manual. The objectives of the manual are to set out Transit New Zealand's policies and procedures for managing the state highway network in a manner that meets Transit New Zealand's goals. The content is based on Transit New Zealand's current practices and those developed in the past from experience in managing the network. While all care has been taken in compiling this document, the Transit New Zealand Authority accepts no responsibility for failure in any way related to the application of this guide or any reference documents noted in it. There is a need to apply judgement to each particular set of circumstances.

Amendment Procedures
All future mandatory amendments will be issued to manual holders in the form of dated replacement pages. Changes are indicated by a vertical line in the margin. The record of amendment table (see next page) will be updated and reprinted each time a new amendment is released. The Version 3 amendment was a re-issue of the manual following extensive re-writing. Individual changes are not specifically identified in this re-issue. Amendments will be distributed to all organisations and individuals on the list of registered manual holders. If you wish to check that you are on this list, or change the number of copies of amendments that are sent to your organisation, please contact: Customer Services Standards New Zealand Private Bag 2439 WELLINGTON Telephone: (04) 498 5991 Facsimile: (04) 498 5994

AMENDMENT LIST REGISTRATION FORM [Note this form must be returned to ensure receipt of amendments] _____________________________________________________________________________
To: Customer Services Standards New Zealand
Private Bag 2439 WELLINGTON
Please change/add/delete (indicate which) my address for the amendment list for the State Highway Asset Management Manual. Current Address:
_______________________________________________________________ _______________________________________________________________
_______________________________________________________________
Title:
_______________________________________________________________ New Address:
_______________________________________________________________
_______________________________________________________________
_______________________________________________________________ Title:
_______________________________________________________________

Record of Amendments Amendment
No.
Description
Effective
Date
Updated
By
Date
Version 2 Pages Re-numbered
Version 3 Re-issued: Extensive Re-write
Table of Contents Table of Contents (i) Foreword (ii) Pavement Maintenance Management Chapter 1 Section 1: Philosophy of Pavement Maintenance Management Section 2: Business Systems Process Overview Section 3: Asset Management Process Overview Section 4: Forward Work Programme Section 5: Maintenance Interventions Section 6: Maintenance Intervention Strategies Section 7: Information Requirements Section 8: The Intellectual Process Section 9: Pavement Deterioration Modelling Section 10: Project Ranking Section 11: Performance Monitoring Section 12: Future Developments Appendices: A – H
(i)
Safety Management Strategy Chapter 2 Section 1: Overview Section 2: Development of the Safety Management Strategy Section 3: Information Requirements Section 4: Identification of Safety Problems Section 5: Work Programming Section 6: Safety Intervention Strategies Section 7: Consultant Capabilities Section 8: Future Developments
(ii)
Foreword
This new release of the State Highway Asset Management Manual has been prepared following three years of operation of the original document. Extensive re-working of the manual was necessary to reflect changes in business practices motivated by the following initiatives: • The release of the Asset Management Plan. • The adoption of Pavement Deterioration Modelling as a key input into the identification of
maintenance interventions. • Developments in Safety Management policy, and • Maintenance project prioritisation methodologies developed to compliment our Annual Plan
business practices. The asset management methodologies described in the manual represent a documentation of the business practices followed by Transit New Zealand. The manual does not describe the precise criteria used to identify projects but rather, the framework of the methodologies and principles to be employed. Users of the manual will apply standard engineering principles within this framework to identify projects that will result in cost effective maintenance of the asset. The objective is to ensure that credible effort is applied to the task and principles are applied uniformly over the entire network. The August 2000 re-issue of the manual has been finalised with assistance from Transit New Zealand’s (Transit) asset management practitioners, and from the project working group whose members were: Ewan Hunter - Network Management Consultant Andrew Skerrett - Network Management Consultant James Burnett - Transit New Zealand Peter Connors - Transit New Zealand John Donbavand - Transit New Zealand Gordon Hart - Transit New Zealand Brian Grey - Transit New Zealand Transit thanks the project team for their input in developing the manual. The Asset Management Manual is a living document and will be subject to further refinement and amendment of the existing chapters, and the addition of further methodologies covering other areas of asset management over coming years. Dr Robin Dunlop CHIEF EXECUTIVE

CHAPTER 1 PAVEMENT MAINTENANCE MANAGEMENT
CONTENTS
1: Philosophy of Pavement Maintenance Management 1.0 Underlying Philosophies ............................................................................................1 1.1 Life Cycle Asset Management....................................................................................2 1.2 Glossary of Terms......................................................................................................3 2: Process Overview 2.0 Overview ...................................................................................................................5 2.1 Investment levels .......................................................................................................5 2.2 Management Cycle ....................................................................................................5 2.3 The Roles...................................................................................................................6 2.4 Business Practices ......................................................................................................8 3: Asset Management Process Overview 3.0 Overview .................................................................................................................13 3.1 Network Segmentation.............................................................................................13 3.2 Programmes and Strategies ......................................................................................14 3.3 Alignment of Understanding ....................................................................................15 3.4 Feedback..................................................................................................................15 3.5 Monitoring ...............................................................................................................16 3.6 Life Cycle Asset Management..................................................................................18 4: Forward Work Programme 4.0 Overview .................................................................................................................23 4.1 Pavement Treatments ...............................................................................................23 4.2 Treatment Lengths ...................................................................................................26 4.3 Data Inputs...............................................................................................................26 4.4 Programme Considerations ......................................................................................27 4.5 Programme Outputs .................................................................................................28 4.6 Review.....................................................................................................................30 4.7 P 17 Resealing Treatment Selection .........................................................................31 4.8 Summarisation .........................................................................................................31 4.9 Transit’s NOMAD Software ....................................................................................32 5: Maintenance Interventions 5.0 Overview .................................................................................................................33 5.1 Application ..............................................................................................................33 5.2 Highway Environment .............................................................................................34 5.3 Intervention Levels ..................................................................................................35

6: Maintenance Intervention Strategies 6.0 Overview .................................................................................................................39 6.1 Objectives ................................................................................................................39 6.2 Alignment with Policy .............................................................................................40 6.3 Typical Strategies.....................................................................................................41 7: Information Requirements 7.0 Overview .................................................................................................................45 7.1 Use of Data Management Process ............................................................................46 7.2 Maintenance Costs ...................................................................................................46 7.3 Crash Data ...............................................................................................................47 7.4 Traffic Data..............................................................................................................48 7.5 Pavement Condition .................................................................................................49 7.6 Pavement Strength ...................................................................................................50 7.7 Skidding Resistance .................................................................................................51 7.8 Road Geometry ........................................................................................................52 7.9 Environmental Factors .............................................................................................53 7.10 Future Developments in Data Collection ..................................................................53 7.11 RAMM Inventory Data and RAMM Outputs ...........................................................54 7.12 Presentation of Multi-Year Works Programme.........................................................55 7.13 Trends and Exceptions .............................................................................................56 8: The Intellectual Process 8.0 Overview .................................................................................................................59 8.1 Stage 1: Data Assessment........................................................................................59 8.2 Stage 2: Field Assessment .......................................................................................60 8.3 Stage 3: Programme Preparation .............................................................................62 8.4 Programme Development.........................................................................................63 8.5 Performance Monitoring ..........................................................................................64 9: Pavement Deterioration Modelling 9.0 Overview .................................................................................................................67 9.1 Evolution .................................................................................................................67 9.2 Modelling Overview ................................................................................................69 9.3 Operational Implementation ....................................................................................72 9.4 Budget Optimisation ..............................................................................................73 9.5 Utilisation of Outputs .............................................................................................74 10: Project Ranking 10.0 Overview .................................................................................................................75 10.1 Pre Commitment Verification...................................................................................75 10.2 Project Ranking Methodology..................................................................................76 10.3 Specific Methodologies............................................................................................77
11: Performance Monitoring 11.0 Overview .................................................................................................................79 11.1 Monitoring Objectives..............................................................................................79 11.2 Monitoring Data .....................................................................................................80 11.3 Monitoring Level ....................................................................................................85 11.4 Analysis ..................................................................................................................85 Section 12: Future Developments ....................................................................................87 Appendices: Appendix 1A – Treatment Intelligence – Data Analysis – Flow Charts Appendix 1B – Treatment Intelligence – Data Analysis – Worked Example Appendix 1C – P 17 Reseal Treatment Selection Appendix 1D – Table of Treatments Appendix 1E – Table of Maintenance Intervention Strategies Appendix 1F – NOMAD Software Functionality Summary Appendix 1G – Area Wide Treatment Prioritisation Appendix 1H – Reseal and Rehabilitation Prioritisation
SECTION 1
PHILOSOPHY OF PAVEMENT MAINTENANCE MANAGEMENT
Asset Management Manual 1 Effective from: August 2000 Manual No. SM020
1
PHILOSOPHY OF PAVEMENT MAINTENANCE MANAGEMENT
1.0
Underlying Philosophies
Introduction:
Typically Transit New Zealand allocates 56% of its annual budget forgeneral maintenance, reseal and pavement rehabilitation works,essentially required to maintain an acceptable level of service andcounter the normal deterioration rate. In any given year this couldchange significantly. The amount of expenditure on maintenance works is significant andsmall improvements in the way the network is maintained withoutdetriment to the long term integrity of the pavement, can lead to significant savings in costs.
Pavement Management Strategies:
Pavement Management Strategies are implemented at a network leveland establish the optimal distribution of investment between variousmaintenance options (reactive maintenance vs resurfacing vs rehabilitation). The strategies are not project specific. This chapter does not discuss the derivation of Pavement ManagementStrategies. It focuses on the management methodologies applied at theproject level. These methodologies form a valuable input into resolving the Pavement Management Strategies through theidentification of recommended treatments, and continues to assist withmanaging activities within budget allocations dictated by the PMS.
Network and Project Level:
Maintenance Management improvements can be targeted at a networklevel or a project level. Network level strategies such as the PavementManagement Strategy usually comprise policy determination designedto identify deficiencies and maintenance programmes in a general manner. Project level improvements are specifically targeted toindividual highway lengths. Project level management methodologies are concerned with:
• identify project specific maintenance strategies based on allavailable indicators.
• communicate appropriate Maintenance Intervention Strategies to complement these.
• manage change in funding limitations by modifying interventionsto match approved programmes.
• communicate the resulting expectations to all parties involved inmaintaining the network.
Asset Management Manual 2 Effective from: August 2000 Manual No. SM020
Focus of this Manual:
This manual is focused at a project level and details an establishedmethod of pavement maintenance management. It relies on thecollection and interpretation of data to assist in the verification offorward work programmes and maintenance strategies for individuallengths of the State Highway.
1.1
Life Cycle Asset Management
Introduction:
Transit’s asset management strategies are based on life cycleoptimisation. All maintenance treatments applied over the life cycle of the pavement, are to be considered in optimising treatment selection.
Pavement Life Cycles:
The end of the life cycle is reached when a pavement renewal isapplied that will restore the pavement back to as new condition.Typically at this time, the pavement design will regard the existingpavement as prepared subgrade and apply sufficient new materialabove the existing pavement to carry the 25 year design life axleloading. Intermediate treatments such as area wide pavement treatment, may modify the properties of existing pavement materials or add newmaterial targeting extension of life. These intermediate treatments donot trigger the initiation of a new life cycle. Renewal works such as pavement rehabilitation that initiate a new life cycle, may be triggered either because renewal is the most costeffective treatment or because of structural condition and the resultinguser benefits resulting from the renewal. Life cycle asset management is discussed further in section 3.
Optimisation:
Optimisation techniques will consider both agency costs associatedwith maintaining the asset and user costs associated with operating onit at the particular states of condition. The methodology based on aTotal Transport Cost model is described further in section 9.
Planning Period:
Maintenance interventions are currently planned in a Ten YearForward Works Programme. This planning period is to be extended progressively to a 20 yearprogramme over the period from 2000 to 2003. In 2003 all maintenance programmes will be based on 20 years. The ability to forecast over a 20 year period, is developing with theadoption of pavement deterioration modelling tools described insection 9.

Asset Management Manual 3 Effective from: August 2000 Manual No. SM020
1.2
Glossary of Terms The following terminology is specific to this manual.
State Highway Asset Maintenance Management:
The process whereby state highways are maintained in accordancewith management systems which focus on organisation, planning andcontrol along the lines of predetermined policy directives.
Treatment Lengths:
A uniformly performing contiguous section of road, and performingdifferently from the adjacent sections.
Management Cycle:
The process by which proposed maintenance activities are proposed,considered, approved, then carried out. The effects of the workreviewed and the review conclusion applied to the future workconsiderations. See Figure 1.
Ten Year Programme:
Ten Year Forward Programme of proposed maintenance work detailedby treatment length.
Maintenance Intervention Strategies:
Generic statements of intent defining maintenance levels. A specificinstruction relating to the implementation of service level expectations.
Pavement Management Strategy:
A network level assessment of the appropriate level of service required and the mechanism for implementation of that level of service. Thestrategy includes an assessment of the optimal distribution ofinvestment between routine maintenance (intervention in thedeterioration cycle) and reseal and rehabilitation (investment in additional pavement and surfacing life).
Maintenance of Treatments:
Work classifications relevant to the Ten Year Programme – e.g., reseal, pavement rehabilitation, preventative maintenance, and routinemaintenance.
SECTION 2
BUSINESS SYSTEMS PROCESS OVERVIEW
Asset Management Manual 5 Effective from: August 2000 Manual No. SM020
2
BUSINESS SYSTEMS PROCESS OVERVIEW
2.0
Overview
Introduction:
This section provides an overview of the business systems designed toachieve co-ordinated and systematic pavement maintenance manage-ment at project level. Adoption of standardised business systems is essential to ensure theconsistency of outputs across the network. The business systemsestablish a uniform framework without constraining the input ofsuppliers in developing maintenance strategies.
In this Section:
The topics in this section are listed below:
Topic
See Page
2.1 Investment levels
5
2.2 Management Cycle
5
2.3 The Roles
6
2.4 Business Practices
8
2.1
Investment Levels
Policy direction as dictated by the Pavement Management Strategy(refer 1) determines the investment levels desirable for maintenanceworks. By managing maintenance inputs through project levelcontrols, expenditure can be controlled in accordance with these predetermined investment levels.
2.2
Management Cycle
Introduction:
The Management Cycle describes the process whereby data is collated,interpreted and judged to determine the most appropriate type ofmaintenance treatments for individual lengths of road.

Asset Management Manual 6 Effective from: August 2000 Manual No. SM020
Purpose: The Management Cycle summarises the roles and tasks of the Client,Network Management Consultant and Contractors and how these rolesand tasks are inter related.
Importance:
The Management Cycle presents diagrammatically, the expectations and inter-relationships of all parties, and emphasises the dynamicnature of the processes.
The Management Cycle:
The Management Cycle is illustrated in Figure 1.
2.3
The Roles
Introduction:
Competitive Pricing Procedures split the function of managing andmaintaining the roading asset between three parties, the Client, theConsultant and the Contractor.
The Roles:
Client • Manage funding issues • Adopt network level pavement management strategies • Agree investment needs • Regulatory control function • Appoint Consultants and Contractors • Establish policy and procedures • Audit • Collects and maintains asset condition data.
Figure 1 Management Cycle
Derive Maintenance Intervention Strategy
Execute Treatment or Maintain
Develop Forward Work Programme
Collect DataOutput Data – Condition
Input Data – Maintenance Costs
COMMUNICATEConsultant
ACT Contractor
MEASURE Consultant
DECIDE Consultant/TNZ
Asset Management Manual 7 Effective from: August 2000 Manual No. SM020
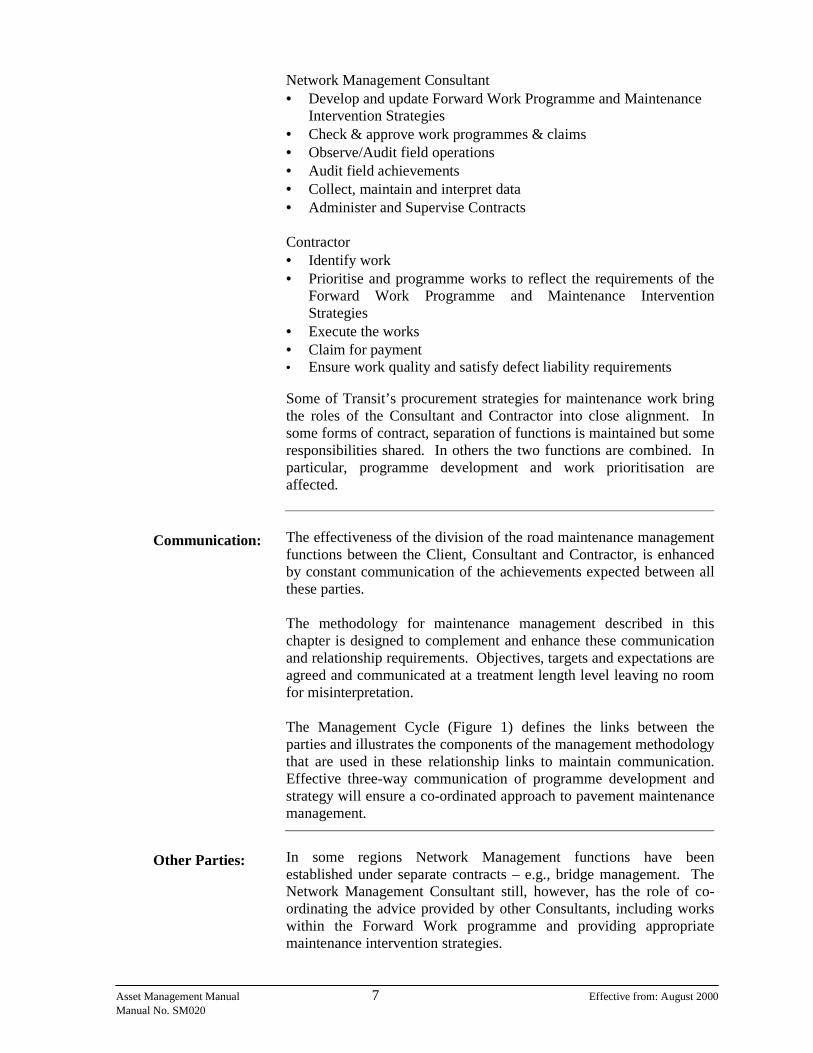
Network Management Consultant • Develop and update Forward Work Programme and Maintenance
Intervention Strategies • Check & approve work programmes & claims • Observe/Audit field operations • Audit field achievements • Collect, maintain and interpret data • Administer and Supervise Contracts Contractor • Identify work • Prioritise and programme works to reflect the requirements of the
Forward Work Programme and Maintenance InterventionStrategies
• Execute the works • Claim for payment • Ensure work quality and satisfy defect liability requirements Some of Transit’s procurement strategies for maintenance work bring the roles of the Consultant and Contractor into close alignment. Insome forms of contract, separation of functions is maintained but someresponsibilities shared. In others the two functions are combined. Inparticular, programme development and work prioritisation are affected.
Communication:
The effectiveness of the division of the road maintenance managementfunctions between the Client, Consultant and Contractor, is enhancedby constant communication of the achievements expected between all these parties. The methodology for maintenance management described in thischapter is designed to complement and enhance these communicationand relationship requirements. Objectives, targets and expectations areagreed and communicated at a treatment length level leaving no room for misinterpretation. The Management Cycle (Figure 1) defines the links between theparties and illustrates the components of the management methodologythat are used in these relationship links to maintain communication. Effective three-way communication of programme development andstrategy will ensure a co-ordinated approach to pavement maintenance management.
Other Parties:
In some regions Network Management functions have beenestablished under separate contracts – e.g., bridge management. The Network Management Consultant still, however, has the role of co-ordinating the advice provided by other Consultants, including workswithin the Forward Work programme and providing appropriatemaintenance intervention strategies.
Asset Management Manual 8 Effective from: August 2000 Manual No. SM020
2.4
Business Practices
Introduction:
The various activities undertaken must be fully integrated andunderstood in terms of Transit’s business functions to achieve effectiveasset management.
Purpose:
This section describes the relationship between the various business functions that comprise Transit’s Asset Management business practice.
Importance:
The effectiveness of the overall process and the outputs of eachindividual function, is dependant on a clear understanding of the purpose of the output.
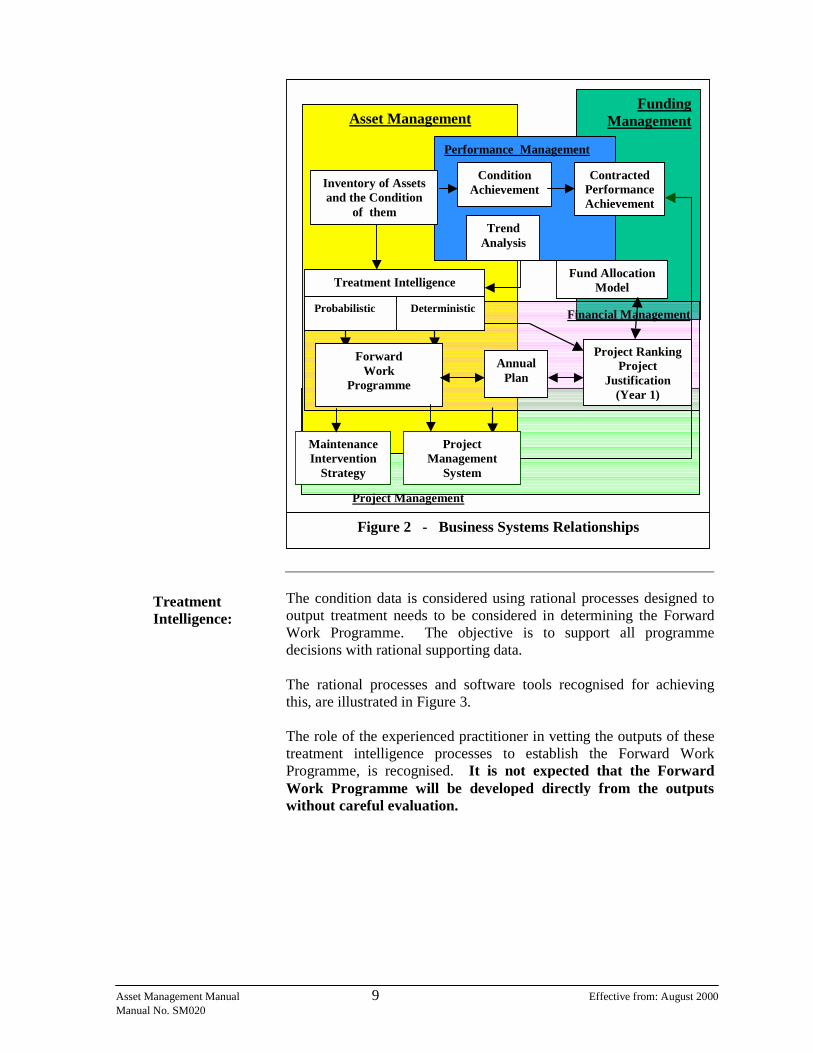
Business Practice Relationships:
Key asset management business systems and their inter-relationships, are illustrated in figure 2. The business systems are illustrated in relation to five key functionalareas: • Asset Management • Financial Management • Project Management • Funding Management, and • Performance Management
Inventory of Assets and Condition:
A nationally uniform inventory that includes a description of thephysical asset and a record of the historic condition of them. The information system known as RAMM, is the software tool thatsatisfies the majority of functional needs. Key aspects of this business function include: • The location referencing methodology which is based on State
Highway, Reference Station and displacement. • The information requirements which establishes the rules applying
to asset description, and • The asset condition rating instructions which define the condition
attributes.
Asset Management Manual 9 Effective from: August 2000 Manual No. SM020
Treatment Intelligence:
The condition data is considered using rational processes designed tooutput treatment needs to be considered in determining the ForwardWork Programme. The objective is to support all programmedecisions with rational supporting data. The rational processes and software tools recognised for achievingthis, are illustrated in Figure 3. The role of the experienced practitioner in vetting the outputs of thesetreatment intelligence processes to establish the Forward Work Programme, is recognised. It is not expected that the Forward Work Programme will be developed directly from the outputswithout careful evaluation.
Figure 2 - Business Systems Relationships
Funding ManagementAsset Management
Performance Management
Financial Management
Fund AllocationModel Treatment Intelligence
DeterministicProbabilistic
Project RankingProject
Justification (Year 1)
Forward Work
Programme
AnnualPlan
Project Management
System
Maintenance Intervention
Strategy
Contracted Performance Achievement
Condition Achievement
Trend Analysis
Inventory of Assets and the Condition
of them
Project Management

Asset Management Manual 10 Effective from: August 2000 Manual No. SM020
Forward Work Programme:
Records the predicted maintenance treatments required for each treatment length over the full programming period. The programmeindicates the year in which treatment is planned and the key reason forthe decision to establish the particular treatment at that time. The information system known as NOMAD, is used to achieve this function.
Maintenance Intervention Strategy:
A statement describing the types of normal maintenance activity thatare appropriate given the planned future maintenance treatments. Normal maintenance activities will be significantly influenced by planned future capital works and renewals. The objective is to communicate the normal maintenance intent toContractors identifying and executing this work.
Project Management:
Specific maintenance treatments other than normal maintenance which are approved in the current year, are managed as projects. Transit usesthe information system known as PROMAN to achieve this function.
Annual Plan:
Maintenance treatments programmed in Year 2 of the Forward WorkProgramme, form the basis for the funding request submitted in the Annual Plan. Transit’s Annual Plan submission therefore represents the financialneeds for the coming year, required to support the strategy representedby the Forward Work Programme.
Inventory and Condition Data
Field Inspection…
Optimised Work Programme
ComputerAnalysis…
Expert Consideration
Data Analysis
Figure 3 - Treatment Intelligence Application

Asset Management Manual 11 Effective from: August 2000 Manual No. SM020
Project Ranking And Justification:
Specific treatments drawn from the Forward Work Programme andsubmitted in the Annual Plan: • must be prioritised on a national basis if budgetary constraints are
applied, and • in some cases, are subjected to rigorous economic scrutiny test
justification. Transit utilises a methodology known as MARG (MaintenanceAllocation Review Group) for prioritising or ranking specific types oftreatment. The Project Evaluation Manual establishes the basis fortesting justification using economic investment criteria.
Fund Allocation Model:
Used to describe the methodology used by Transfund New Zealand(Transfund) to establish their view on appropriate funding levels. The negotiation of funding requests is based on Transit’s submissionmade through the Annual Plan and Transfund’s judgment based ontheir fund allocation model.
Contracted Performance:
Key performance indicators and specific condition targets form thebasis of the service agreement between Transit and Transfund.
Condition Achievement and Trend Analysis:
Analysis of the asset condition data forms a basis for: • Monitoring achievement against the contracted performance
criteria.
• Monitoring the effectiveness of strategies.
• Monitoring the overall status and change in network condition.
• Monitoring the calibration of formulae used in treatmentintelligence.

SECTION 3
ASSET MANAGEMENT PROCESS OVERVIEW

Asset Management Manual 13 Effective from: August 2000 Manual No. SM020
3
ASSET MANAGEMENT PROCESS OVERVIEW
3.0
Overview
Introduction:
This section provides an overview of the processes designed to achieve effective management of the asset. The methodology described requires the establishment of a ForwardWork Programme predicting future treatment needs at a project level,and the assignment of maintenance intervention strategies based on these predicted treatment needs.
In this Section:
The topics in this section are listed below:
Topic
See Page
3.1 Network Segmentation
13
3.2 Programmes and Strategies
14
3.3 Alignment of Understanding
15
3.4 Feedback
15
3.5 Monitoring
16
3.6 Life Cycle Asset Management
18
3.1
Network Segmentation
Definition:
The breakdown of the total road length of the network into uniformlyperforming contiguous sections of highway termed treatment lengths.
Purpose:
To provide building blocks upon which the Forward Work Programmeand maintenance intervention strategies can be structured, developedand applied.
Importance:
Treatment lengths bring the control of network maintenancemanagement down to project level.
Asset Management Manual 14 Effective from: August 2000 Manual No. SM020
3.2
Programmes and Strategies
Introduction:
Once the individual treatment lengths have been defined, anassessment of maintenance and improvements needs can be made andprogrammed for each year of the programme. Maintenanceintervention strategies are applied in recognition of the nature andtiming of proposed treatments.
Purpose:
Programmes and Strategies allow maintenance work to be optimised toprovide the most appropriate maintenance treatment at the mostappropriate time.
Importance:
Programmes and Strategies will ensure maintenance funding isexpended in the most appropriate and economic manner.
Forward Work Programme:
The Forward Work Programme is a summary of maintenance andimprovement treatments required (e.g. – routine maintenance, reseal, pavement rehabilitation) for all individual treatment lengths. Theprogramme represents a commitment to funds to achieve Year 1projects. Because future works further out in the programme becomeprogressively less determinable, confirmation in the programme is subject to these projects being retained at future reviews, including theannual funding review. The programme acts as a communication tool.
Maintenance Intervention Strategies:
The Maintenance Intervention Strategies are applied to each treatment length and describe the level of normal maintenance appropriate forthe type of future treatments planned and the timing of theimplementation of these treatments. Example: The treatment length is programmed for shape correction in Year 2 of the programme. The maintenance intervention strategy is to initiallytarget low cost high risk repairs (e.g. – crack sealing) and in general, minimise the use of long term and expensive permanent repairs. Thisinformation is communicated to and understood by the Contractor, who allows for this in the monthly work programmes provided.
NOMAD:
Transit uses the software application known as NOMAD to achievethe functional needs associated with managing the Forward WorkProgramme and associated maintenance intervention strategy.
Asset Management Manual 15 Effective from: August 2000 Manual No. SM020
3.3
Alignment of Understanding
Introduction:
The roles of the Client, Consultant and Contractor, requirecommunication and understanding between all parties with respect tothe development and implementation of programmes and strategies.
Importance:
Alignment of understanding is the key to the success of maintenancemanagement. The client’s expectations need to be conveyed to andunderstood by all parties. Without this, successful implementation of the Forward Work Programme and maintenance interventionstrategies, would be difficult if not impossible, to achieve.
Implementation:
The client’s expectations are outlined in this manual. Contractdocuments for the acquisition of network management consulting services and physical works, include requirements that arecomplimentary to these expectations. Consultants and contractorsemployed under such contracts must understand the expectations andwhere unclear, seek clarification.
3.4
Feedback
Introduction:
Controlling network management at a project level is a continuousprocess. Constant assessment, reassessment and adjustment oftreatments, treatment lengths and maintenance intervention strategies,is required.
Importance:
Pavement Maintenance Management is a dynamic process. As thepavement ages, deterioration will occur in different ways and atdifferent rates. Continual assessment of the appropriateness andsuccess of programmes and strategies, will lead to quality decisions being made for future programmes and strategies.
Feedback Sources:
The alignment of understanding between Client, Consultant andContractor, should result in feedback being provided from all theseparties.
Implementation:
Regular review of the Forward Works Programme and associatedstrategies is provided for in contract documents. Transit will assessthe value of the programmes and strategies based on their accuracy andthe extent to which they reflect field conditions and feedback onpractical operational issues.
Asset Management Manual 16 Effective from: August 2000 Manual No. SM020
3.5
Monitoring
Introduction:
Monitoring the robustness and stability of the Forward WorksProgramme, will be carried out to: • Gain an understanding of the effectiveness of the systems used to
arrive at the determination of project level treatments over the analysis period for a network, and
• Amend these systems to give an improved level of consistency in
project level treatment selection, as evidenced by the rate ofchange in treatments following the roll over in the programmes from year to year.
Decision Effectiveness:
Effectiveness of the decision process will be assessed at two levels:
• During the development of the Annual Plan. Achievement of the successful extraction of projects from Year 2of the programme and development of these to physical imple-mentation.
• Longer term planning effectiveness. Monitoring the overall stability of the programme by consideringthe extent of change that occurs in projects beyond Year 2 as theprogramme is rolled over following execution of the current year’s work.
Effectiveness in Annual Plan Development:
This assessment will be made on individual treatments at the treatmentlength level and will assess effectiveness by:
• monitoring the incidence of projects put forward which fail to meet the Project Evaluation Manual investment criteria when tested atproject feasibility reporting stage.
• monitoring the incidence of omissions and unplanned inclusionsmade between:
a) the time that Year 3 of the programme is rolled over to become Year 2, and
b) finalisation of the Annual Plan. The analysis will be based on the progression of individual projectsand will be reported in terms of the percentage of the total length ofeach treatment type which change under these monitoring criteria. The analysis will separately report the length which:
• fails the monitoring criteria and is either deferred or includedwhere no treatment previously existed, and

Asset Management Manual 17 Effective from: August 2000 Manual No. SM020
• had a treatment planned but in considering the monitoring criteria,a different type of treatment is now planned.
For the purpose of this reporting treatment will be at the highest level,i.e. – all types of reseals will be reported under the generic treatmentresealing.
Longer Term Planning Effectiveness:
This assessment considers all treatments beyond Year 3 of the programme at the time the programme is rolled over followingexecution of the current year’s work. Reporting will be against the total length programmed for each type oftreatment. Treatments will be at the highest level as defined previously. For each type of treatment and for each year of the programme, thepercentage rolled over from the previous programme without change,will be reported at a network level. For example:
• Year 4 of the programme predicts a total length of resealing of 10km.
• When the programme is rolled over, Year 4 works become Year 3works.
• Following this programme roll and review, the length of reseal inYear 3 now totals 5km.
• The effectiveness of planning for the treatment resealing in Year 3is reported as 50%.
Other Monitoring Requirements:
It is also necessary to monitor the impact of the programme onpavement condition. This monitoring focuses on the effectiveness oftreatments rather than that of the decision process. The percentage of the network treated in the current year will be monitored against an analysis of the subsequent condition data.
Treatment Summary:
For the purposes of this monitoring, treatments will be grouped intothe following classifications:
• Pavement Surfacings – all treatments that affect only the surfacing layer. Thin asphaltic concrete overlay would feature in this group.
• Pavement Structural – all treatments that affect the structural layers of the pavement.
• Combined Surfacing and Structural Works – a summation of the above two groups.

Asset Management Manual 18 Effective from: August 2000 Manual No. SM020
The length under these groups will be expressed as a percentage of thelength of the network.
Condition Summary:
The condition summary reported against this grouping of treatmentswill be taken from the high speed data survey carried out after the works have been executed. The following summarised condition data will be reported: • Skid Resistance – the percentage length of the network having a
skid resistance value below the investigatory level. • Roughness – the average NAASRA roughness for the network. • Rutting – the average depth of rutting and percentage with rutting
depth greater than 20mm. • Texture – average mean profile depth and percentage with mean
profile depth less than 0.9mm, taken from the wheelpath values.
Historic Records:
Analysis of all monitoring data against historic records is important.Therefore, it is important that the method of calculation andpresentation remains consistent so as to not invalidate a comparisonwith previous results.
3.6
Life Cycle Asset Management
Introduction:
This section provides an overview of the asset management principleswhich should be understood and considered in assessing futuremaintenance needs. The objective is to provide only an identification of the principles to be applied. It is expected that practitioners will require a detailed under-standing to achieve successful application. In all cases, a specific knowledge of how the principle applies to theparticular network in question is essential. For example, condition decay rates will vary across the network.
Purpose:
The purpose of developing an understanding of the life cycleprinciples of asset management, is to illustrate that: • The asset is always in a state of decay. It is not expected that “as
new” standard will apply to all treatment lengths.
Asset Management Manual 19 Effective from: August 2000 Manual No. SM020
• We are not targeting a standard of “as new” condition whenconsidering treatment length needs nor from the standard achievedafter a maintenance treatment.
• Intermediate treatments applied during the life cycle of the asset,
are not renewals and may target a life other than that expectedfrom a renewal.
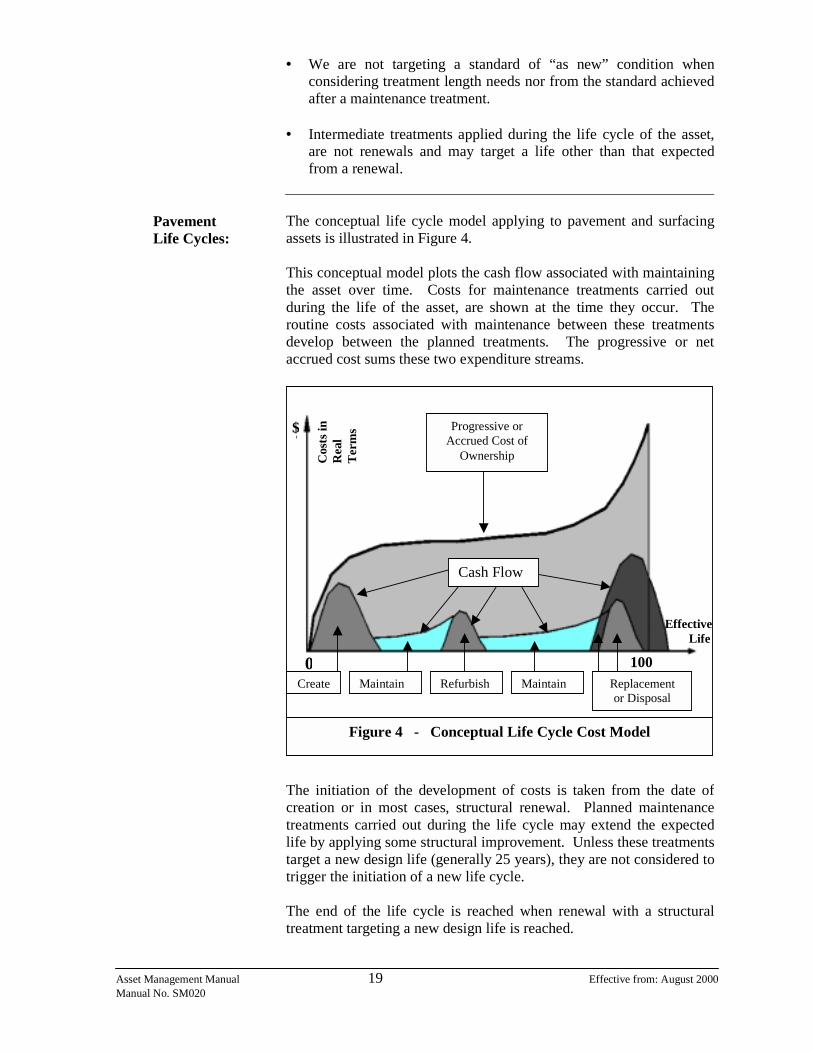
Pavement Life Cycles:
The conceptual life cycle model applying to pavement and surfacingassets is illustrated in Figure 4. This conceptual model plots the cash flow associated with maintainingthe asset over time. Costs for maintenance treatments carried outduring the life of the asset, are shown at the time they occur. Theroutine costs associated with maintenance between these treatments develop between the planned treatments. The progressive or netaccrued cost sums these two expenditure streams.
The initiation of the development of costs is taken from the date ofcreation or in most cases, structural renewal. Planned maintenance treatments carried out during the life cycle may extend the expectedlife by applying some structural improvement. Unless these treatmentstarget a new design life (generally 25 years), they are not considered totrigger the initiation of a new life cycle. The end of the life cycle is reached when renewal with a structuraltreatment targeting a new design life is reached.
$
Cos
ts in
R
eal
Ter
ms
Effective Life
Create Maintain Refurbish Maintain Replacement or Disposal
Progressive or Accrued Cost of
Ownership
0 100
$
Figure 4 - Conceptual Life Cycle Cost Model
Cash Flow
Asset Management Manual 20 Effective from: August 2000 Manual No. SM020
Asset Decay: As the asset ages: a) the condition of it deteriorates, and b) the cost of maintaining it increases.
It is necessary to monitor the development of both of these trends toensure effective and efficient asset management.
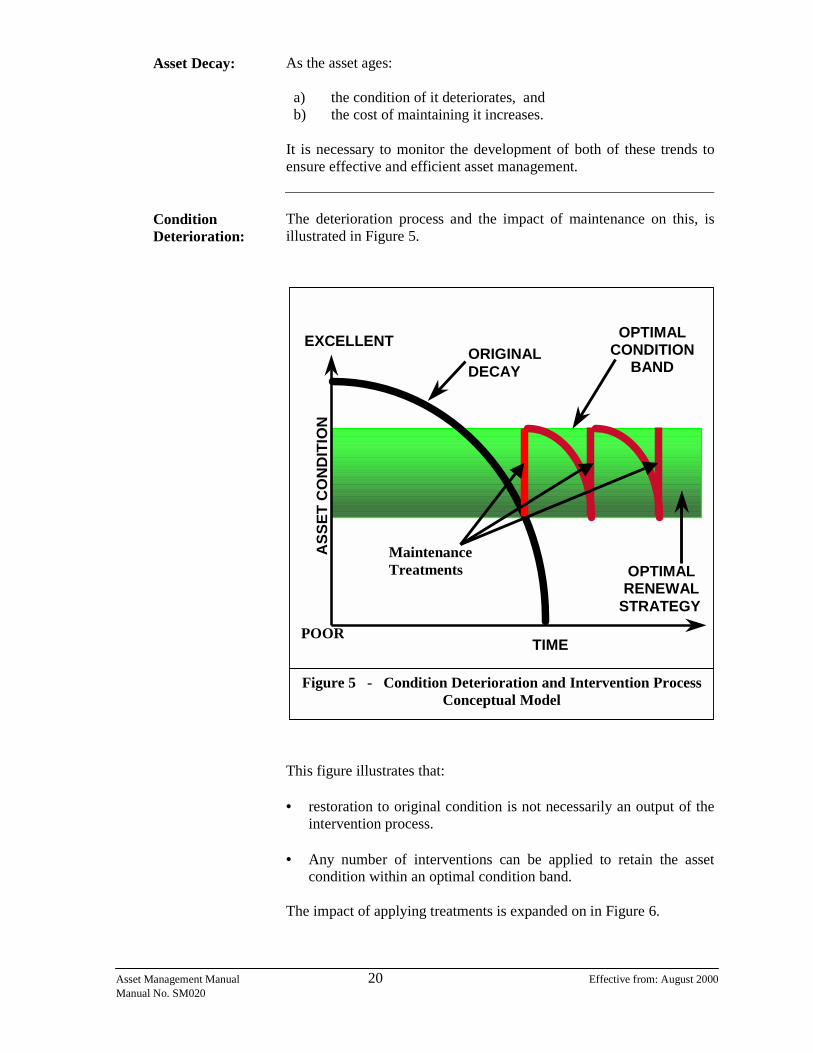
Condition Deterioration:
The deterioration process and the impact of maintenance on this, isillustrated in Figure 5.
This figure illustrates that: • restoration to original condition is not necessarily an output of the
intervention process. • Any number of interventions can be applied to retain the asset
condition within an optimal condition band. The impact of applying treatments is expanded on in Figure 6.
Figure 5 - Condition Deterioration and Intervention Process Conceptual Model
ASS
ET C
ON
DIT
ION
EXCELLENT
TIME
ORIGINAL DECAY
OPTIMALCONDITION
BAND
OPTIMAL RENEWAL
STRATEGY
Maintenance Treatments
POOR

Asset Management Manual 21 Effective from: August 2000 Manual No. SM020
The minimum acceptable standard for a particular treatment isestablished on the basis of user benefits and safety. Treatmentstrategies adopted from such models are therefore, typically justified at a project level through a benefit-cost ratio analysis.
Maintenance Cost Development:
The conceptual model for development of routine maintenance costsbetween maintenance treatments, is illustrated in Figure 7. Based on the development of routine maintenance costs, an optimalintervention point can be predicted independent of asset condition.Treatment strategies adopted from such models are typically justifiedat a project level by considering only agency costs in a Net Present Value analysis. This figure also illustrates the routine maintenance costs that can beavoided through the application of a suitable maintenance interventionstrategy, ahead of the planned treatment. At that time, the incentives for identifying routine maintenance needs would switch from acondition standard to a safety standard.
ASS
ET C
ON
DIT
ION
EXCELLENT
POOR
TIME
Minimum Acceptable Standard
Decay in Condition (DETERIORATION)
Treatment Applied
Condition Improvement(RESET)
Figure 6 - Impact of Treatment Application on Asset Condition

Asset Management Manual 22 Effective from: August 2000 Manual No. SM020
Treatment Prediction:
The prediction of future treatment needs targets consideration of bothof these conceptual models. Typically the maintenance cost development model will be theprinciple indicator for the first maintenance treatment. Conditiondecay would be the only practical indication for subsequent treatments.
The Impact Of Routine Maintenance:
A significant motivation to consider both models, originates from theimpact of routine maintenance on asset condition. The predicted rate of condition deterioration is significantly disguisedby the level of routine maintenance applied in New Zealand. Ifdependant entirely on condition indicators, cost effective maintenancetreatments may be deferred indefinitely irrespective of costconsiderations.
$ pe
r KIL
OM
ETR
E
TIME
COST DEVELOPMENT
AWT/Routine Maintenance ECONOMIC BREAK POINT
OPTIMALINTERVENTION
POINT
HOLDING MIS APPLIED
THESE COSTS ARE AVOIDED
Figure 7 - Maintenance Cost Development Conceptual Model

SECTION 4
FORWARD WORK PROGRAMME
Asset Management Manual 23 Effective from: August 2000 Manual No. SM020
4
FORWARD WORK PROGRAMME
4.0
Overview
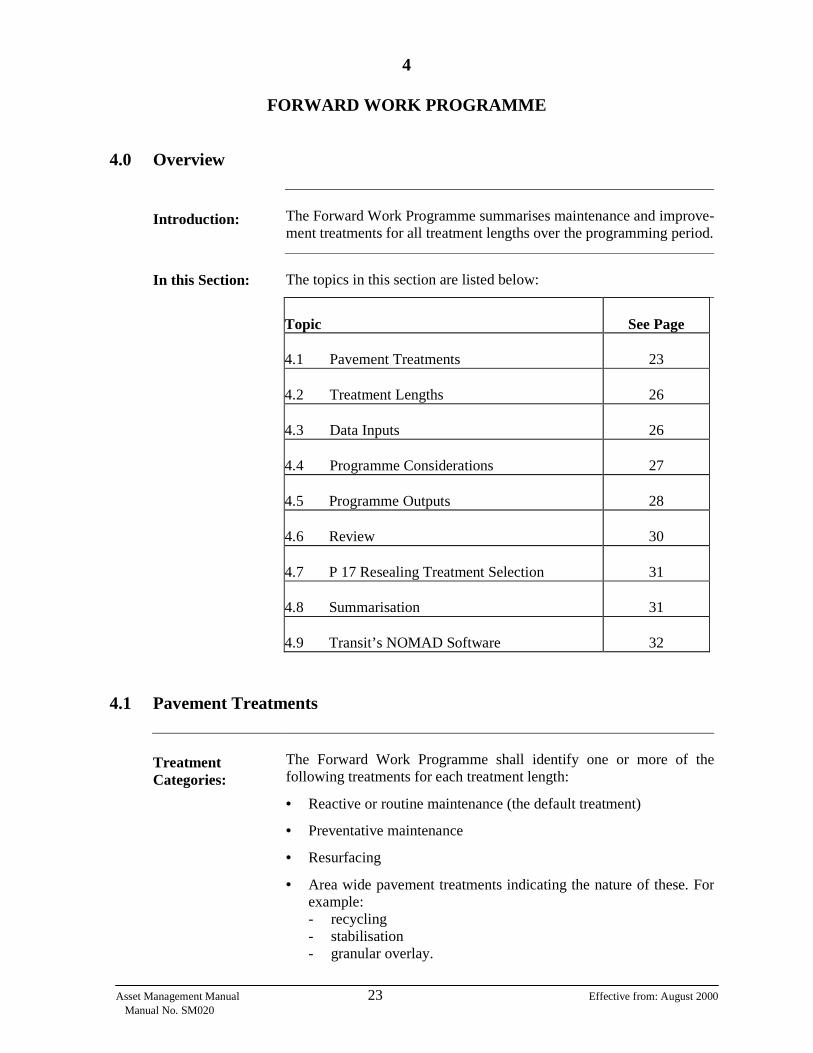
Introduction:
The Forward Work Programme summarises maintenance and improve-ment treatments for all treatment lengths over the programming period.
In this Section:
The topics in this section are listed below:
Topic
See Page
4.1 Pavement Treatments
23
4.2 Treatment Lengths
26
4.3 Data Inputs
26
4.4 Programme Considerations
27
4.5 Programme Outputs
28
4.6 Review
30
4.7 P 17 Resealing Treatment Selection
31
4.8 Summarisation
31
4.9 Transit’s NOMAD Software
32
4.1
Pavement Treatments
Treatment Categories:
The Forward Work Programme shall identify one or more of thefollowing treatments for each treatment length:
• Reactive or routine maintenance (the default treatment)
• Preventative maintenance
• Resurfacing
• Area wide pavement treatments indicating the nature of these. For example: - recycling - stabilisation - granular overlay.

Asset Management Manual 24 Effective from: August 2000 Manual No. SM020
• Pavement rehabilitation with differentiation between:
- sealed smoothing - unsealed smoothing - major rehabilitation.
• Improvements with differentiation between:
- reconstruction - safety improvements - minor safety works - bridge renewals.
Further Definition:
Treatment categories are generally aligned with the Work Categorydefinitions contained within the Transfund Programme and FundingManual. Full definition of treatment categories is contained within Transfund’smanual. For the purposes of understanding in terms of pavementmanagement, these definitions have been expanded below.
Reactive Maintenance:
This will require inspection, programming and implementation of general or routine maintenance work.
Preventative Maintenance:
This includes general maintenance work designed to:
a) reduce the amount of reactive maintenance work which may berequired in the future, and/or
b) serve as a pre-treatment for subsequent maintenance treatments. Examples of preventative maintenance include but are not limited todrainage maintenance, drainage improvements, slip repairs, culvertrepairs or replacement. Some seal widening may also be considered as preventative maintenance and this should be undertaken in advance of aprogrammed maintenance seal.
Resurfacing:
Application of an additional surfacing layer can consist of thefollowing:
• Second coat seal • Reseal • Texturising seal • Holding seal – prescribed where resealing is necessary but the life
expectancy is likely to be less than normal. Sealing is selected asthe most economic short term maintenance option. The normalstandard of preseal repair is not included.
The type of resurfacing treatment shall be identified in the Forward Work Programme.

Asset Management Manual 25 Effective from: August 2000 Manual No. SM020
Area Wide Pavement Treatment:
These are treatments applied on the basis of net present value, beingthe most cost effective maintenance solution. Cost justification for area wide pavement treatments must be based totally on agency costs. User benefits may not be used in the analysis. These treatments are used to control the development of routinemaintenance costs through reactive maintenance. They do not targetan improvement in pavement strength as a primary objective and as such, may be designed with a short life. The type of treatment will be the minimum treatment necessary toachieve the desired reduction in routine maintenance costs.
Pavement Reconstruction:
Pavement reconstruction includes smoothing and rehabilitation treatments justified on the basis of user benefits, (vehicle operatingcost savings). Treatments may include: • Structural overlays • Stabilisation of the existing pavement • A combination of overlay and stabilisation • Replacement of the existing pavement in some circumstances • Formation widening and drainage improvements. Improvements associated with major rehabilitation must be justified onan economic basis.
Improvements:
Improvement works identified through other methodologies (safety, travel time savings, capacity, etc.), must be shown in the ForwardWork Programme because they impact significantly on plannedmaintenance treatments and maintenance intervention forward workstrategies. Improvement works may include: • Reconstruction works • Safety improvements • Seal extensions • Minor safety works • Bridge renewals
Coding System:
A coding system shall be used to indicate the appropriate treatment.Routine maintenance may be indicated by the non insertion of amaintenance category code.
Asset Management Manual 26 Effective from: August 2000 Manual No. SM020
4.2
Treatment Lengths
Definition:
A treatment length is a uniformly performing contiguous section ofroad, which is performing differently from the adjacent sections.
Initial Selection:
The initial assessment of treatment length should be based on the top surface layer and the changes in chip type or other surfacing treatment.
Refinement:
When it becomes obvious that a seal length is not performing in auniform manner, the treatment length shall be redefined to restoreuniformity within the treatment length. Some maintenance treatmentsmay extend beyond a single treatment length and provide a greaterlength of uniformly performing pavement. Treatment lengths shouldbe extended or deleted under such circumstances.
4.3
Data Inputs
Types of Data:
The Forward Work Programme is prepared after consideration of thefollowing: • RAMM treatment selection outputs • RAMM Condition Rating trend analysis • HSD Rutting and Texture Data • Roughness count data • SCRIM data • Historical maintenance data, including costs and repair types • Inventory data relating to previous treatments • Crash records • Visual inspection reports • Crash reduction studies in as much as these will often highlight
maintenance deficiencies or influence the maintenance option. • Previously prepared feasibility studies, strategy studies or scheme
assessments. • Programmed improvement works.
Further Data References:
A more detailed analysis of data is contained within Section 7.

Asset Management Manual 27 Effective from: August 2000 Manual No. SM020
4.4
Programme Considerations
Introduction:
The programme development and review process involves the assetmanagement practitioner applying expertise to the outputs of thevarious treatment intelligence tools to resolve an appropriate andjustified forward programme of maintenance works.
Considerations:
Key factors considered in resolving the programme will include:
• The required level of service • Safety • Economics • Policy • Practical funding levels Resolution of appropriate strategies involves a careful balance of theseconsiderations as detailed below.
Service Level:
Transit’s key business objective is to provide a safe and efficientnetwork. Condition standards are established to define a minimumlevel of service that will be presented to users. As far as is possible,these are rationalised in terms of economics and safety. It is necessary to consider the impact on overall condition resultingfrom the application of economic principles. Transit targets networklevel key performance indicators as a means of ensuring that theimpact of application of strategies at a project level does not result inan unacceptable overall result. The impact of strategies on the networklevel indicators, must be quantified and considered.
Safety:
Investigatory levels based on a minimum level of safety, must not be compromised.
Economics:
Net Present Value and Benefit-Cost ratio economic analysis will be used to consider the nature and timing of treatments. It must berecognised that future treatments will be tested against these economicprinciples before implementation, regardless of the impact on thenetwork as a whole. In particular, economic principles will be used to resolve theappropriate timing of intervention.
Policy:
Transit has specific requirements relating to the timing of works. For example:
Asset Management Manual 28 Effective from: August 2000 Manual No. SM020
• Achievement of satisfactory drainage before executing resurfacingworks.
• Achievement of satisfactory drainage before committing the
execution of pavement works. If correction of drainagedeficiencies arrests deterioration then pavement treatments will be deferred.
• Various policies relating to the selection of resurfacing treatments
and materials. Such policies must be recognised in preparing the programme.
Practical Funding Levels:
Budgetary constraints may be a limitation on implementing a desirable programme. Programmes will be established recognising anybudgetary targets and adjusted following funding approval to reflectthe approved budgets. The impact of budget scenarios on network condition must be under-stood and presented. It is desirable that a balance of total financial needs over time beestablished. This may necessitate re-prioritisation of needs and adjust-ment of timing. Any adjustments made for balancing purposes shouldbe noted in the programme. Adjustment of the maintenance intervention strategy influences theservice level targeted at a treatment length level and has a significanteffect on funding predictions. Adjustment of maintenance interventionstrategies is to be used as the principal means of adjusting programmes to suit funding constraints.
Priority:
All treatments will be allocated a priority (high, medium, low) as anindicator to assist in the programme balancing and adjustment process.
4.5
Programme Outputs
Format:
The programme shall include the following as the minimum amount of information required:
• Treatment length referenced by route position • Treatment length reference name • Date and type of last seal coat and expected life • Maintenance intervention strategy applicable for the treatment
length • Treatments (other than reactive maintenance) against each year of
the programme
Asset Management Manual 29 Effective from: August 2000 Manual No. SM020
• Priority (high, medium, low) • The principle reason for scheduling the treatment (e.g., safety,
economics) • Comments
The application database known as NOMAD satisfies the above criteria. The functionality of this application is currently embedded inthe RAMM software and is accessed through the treatment lengthtable.
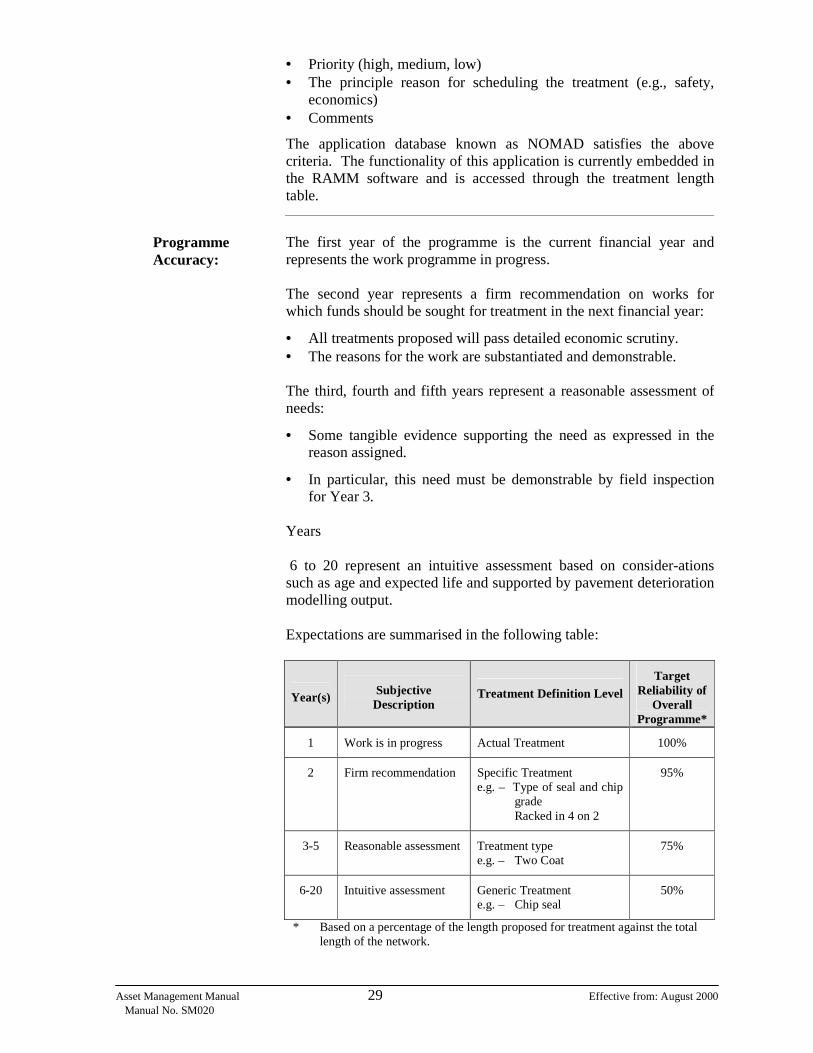
Programme Accuracy:
The first year of the programme is the current financial year andrepresents the work programme in progress. The second year represents a firm recommendation on works forwhich funds should be sought for treatment in the next financial year:
• All treatments proposed will pass detailed economic scrutiny. • The reasons for the work are substantiated and demonstrable. The third, fourth and fifth years represent a reasonable assessment ofneeds:
• Some tangible evidence supporting the need as expressed in thereason assigned.
• In particular, this need must be demonstrable by field inspection for Year 3.
Years 6 to 20 represent an intuitive assessment based on consider-ations such as age and expected life and supported by pavement deteriorationmodelling output. Expectations are summarised in the following table:
Year(s) Subjective Description
Treatment Definition Level Target
Reliability of Overall
Programme*
1 Work is in progress Actual Treatment 100%
2 Firm recommendation Specific Treatment e.g. – Type of seal and chip grade Racked in 4 on 2
95%
3-5 Reasonable assessment Treatment type e.g. – Two Coat
75%
6-20 Intuitive assessment Generic Treatment e.g. – Chip seal
50%
* Based on a percentage of the length proposed for treatment against the total length of the network.

Asset Management Manual 30 Effective from: August 2000 Manual No. SM020
Pre-treatment: Pre-treatment needs (e.g., drainage works prior to resealing) shall be indicated in the programme.
Economic Analysis:
Treatments drawn from Year 2 of the programme into the Annual Planwill be subjected to specific economic analysis scrutiny. The type ofevaluation will be dependent on the type of work. Transit will specifythe requirements in the Annual Plan instructions for a particular year.
4.6
Review
Overview:
The Forward Work Programme is subject to periodic review. Theadequacy of the proposed treatments may change as the pavement deteriorates. Other factors – e.g., crash statistics, may influence improvement works.
Review Frequency:
Two formal reviews of the programme are required. One review is required once the results of the RAMM ConditionRating, High Speed Data and SCRIM Surveys have been completedand the RAMM Treatment Selection process executed. This reviewneeds to be timed to coincide with development of the NationalRoading Programme. This is generally carried out in October.Another review is required once the level of funding for the followingyear is confirmed. Programmes and strategies will need to be alignedto approved funding levels. This is generally carried out in May. Other reviews may be required whenever any funding changes occur or pavement deterioration does not occur as expected.
Basis of the Review:
Whenever a formal review is undertaken all available data inputs shallbe updated. The following actions shall also be undertaken:
• Adjustments to the current work programme shall be made in accordance with physical works achievements.
• The programme for the following years shall be reviewed inconsideration of the best currently available information.
• Refinement of preventative maintenance or pre-treatment programmes shall be provided in terms of extent and cost.
• Priorities shall be determined for works recommended in thefollowing year.
Asset Management Manual 31 Effective from: August 2000 Manual No. SM020
4.7
P 17 Resealing Treatment Selection
Overview:
Selection of treatments to be applied under the P 17 end resultresealing specification, requires an understanding of responsibilitiesfor the validity of the selection process. Responsibility for the end result will be rejected if it can bedemonstrated that the specific reseal selected is inappropriate. The following distinctions are drawn:
• Reseal treatment selection is the process of selecting the type ofreseal (single coat, wetlock, etc.) and chip grades to be applied.
• Reseal design is the process of designing construction elementssuch as: - pre reseal treatments - binder application rates - kerosene content - etc.
to successfully apply the selected reseal treatment.
Responsibilities:
Under P 17 the Consultant is responsible for reseal treatment selectionand the Contractor for design. Flow charts illustrating the:
• selection criteria for the type of specification • Contractor/Consultant responsibilities, and • design life considerations
are included in Appendix 1C. Under the P/4 Resealing Specification, the Consultant is responsiblefor both treatment selection and reseal design.
4.8
Summarisation Levels
Treatment Groups and Funding Groups:
The Forward Work Programme schedules the particular types oftreatments. For network management and funding management, thesetreatments must be summarised under generic groups. Funding groups represent a generic grouping of treatments into theitems under which funds will be sought. Grouping will be establishedon the basis of the criteria established in the Transfund Programme andFunding Manual. Treatment groups are established for network management purposes.

Asset Management Manual 32 Effective from: August 2000 Manual No. SM020
Example:
For example, a granular overlay may be funded as either Area WidePavement Treatment (maintenance) or reconstruction (capital). Fornetwork management purposes a granular overlay would be regarded as a pavement structural treatment.
4.9
Transit’s NOMAD Software
NOMAD:
Transit has developed a specific information system known asNOMAD for managing the Forward Work Programme. This softwareis currently distributed with the RAMM inventory management software.
Further Information:
A user manual for the software is distributed with the electronic helpfile which is accessible through the software. A summary of thefunctional features of NOMAD is included as Appendix F.
SECTION 5
MAINTENANCE INTERVENTIONS
Asset Management Manual Effective from: August 2000 Manual No. SM020 33
5
MAINTENANCE INTERVENTIONS
5.0
Overview
Introduction:
Maintenance works should normally be considered for implementationonce the maintenance intervention level has been reached or exceeded.
In this Section:
This sections covers the following:
Topic
See Page
5.0 Overview
33
5.1 Application
33
5.2 Highway Environment
34
5.3 Intervention Levels
35
5.1
Application
Definition:
The maintenance intervention level describes the level of deterioration of the pavement where it is appropriate for maintenance repairs to beconsidered to ensure the integrity of the pavement or safety of roadusers. The engineering expectation may not necessarily equate to themotorists expectation. Funding limitations may be a constraint. Furtherwork is required to determine whether these expectations can bematched.
National State Highway Strategy:
This section does not override the standards established in the NationalState Highway Strategy (NSHS). The NSHS establishes target condition standards for the network as a whole and the strategicsections within it which it defines. The interventions defined within this document are intended forapplication at a treatment length level for the purpose of selecting appropriate treatments. These treatments are applied to overcomespecific deficiencies but their application must also ensure thatnetwork targets established in the NSHS, are also met.
Asset Management Manual Effective from: August 2000 Manual No. SM020 34
Investigatory Levels and Standards:
Maintenance intervention levels may be published as either:
• Investigatory levels, or • Standards. Where published as an investigatory level, the suggested interventionlevel is to be regarded as a best practice guideline. When exceeded,consideration should be given to applying corrective treatment. There may be valid reasons to defer correction. When published as a standard, corrective action must be scheduledtargeting restoration of condition. However, pavement structural standards are generally published as investigatory. An economic assessment at a project level willdetermine whether treatment can be justified.
Example:
An intervention level of 130 NAASRA counts per kilometre, has beenestablished for target roughness where AADT is greater than 5500. Where this is the only compromised condition project level economicanalysis may not substantiate treatment. However, if another conditionis also compromised, treatment may be economically justified.
Review:
Maintenance intervention levels are subject to periodic review.
5.2
Highway Environment
Introduction:
There are differences in traffic density and function for the statehighway network. The alignment and subsurface conditions will alsovary considerably. Intervention levels need to be selected in recognition of the highway environment.
Categorisation:
Prior to selection of an intervention level, consideration needs to begiven to the type of highway environment present. Highway environ-ments can be categorised according to:
• traffic volume • speed environment • vertical and horizontal alignment • subsurface conditions e.g., moisture sensitive or well drained • location of intersections, level crossings and other hazards • geology • rainfall • other weather conditions • the National State Highway Strategy classification and resulting
service level requirements • practical constraints.
Asset Management Manual Effective from: August 2000 Manual No. SM020 35
Intervention levels can be refined after evaluation of the relevance ofthe above factors and their impact on economics in a particularlocation.
5.3
Intervention Levels
Corridor and Structural:
The asset can be described as comprising two service functions: • Structural
Describing components which are influenced by demand.Typically pavement and surfacing related components thatdeteriorate under the action of traffic.
• Corridor
Describing components that facilitate the safe movement of trafficbut do not decay as a direct result of loading or demand. Forexample, the control of vegetation and provision of delineation arecorridor activities.
Pavement Management:
This section of the manual is focused on pavement management. Ittherefore utilises only structural interventions. All of Transit’s structural interventions as classified investigatory.The intervention levels are therefore, levels at which consideration should be given to the need for correction. They are not levelsassociated with a mandatory compliance expectation.
Type of Defects:
Maintenance interventions shall be determined for the followingdefects: • Depressions – e.g. rutting, shoving • Roughness • shear failure – e.g. shoving • inadequate skid resistance • surface defects – e.g. scabbing • drainage deficiency • shoulder deficiency
Structural Intervention Levels:
The current Intervention Levels are contained in Table 1.
Asset Management Manual Effective from: August 2000 Manual No. SM020 36
Considerations: An intervention level will identify a defect as either acceptable orpossibly unacceptable. The latter will require further consideration ofthe defect in relation to: • location within the pavement • safety issues • the possibility of continuing deterioration and increased repair cost• the economics of not undertaking repairs.
Future Development:
Intervention levels are targets against which pavement condition isassessed. It is unlikely that defects at a standard below the interventionlevel will require repair in every instance. Other conditions may over-ride the decision to intervene. These conditions include: • Change in maintenance standard dictated by the Maintenance
Intervention Strategy. • Location specific economics. Further review and development of the appropriate intervention levels is required based on the performance expectations of the pavement.
Alignment with MIS:
Once it has been determined that a defect requires attention, themethod of repair shall recognise the Maintenance Intervention Strategy to the treatment length (refer Section 6).
Asset Management Manual 37 Effective from: August 2000 Manual No. SM020
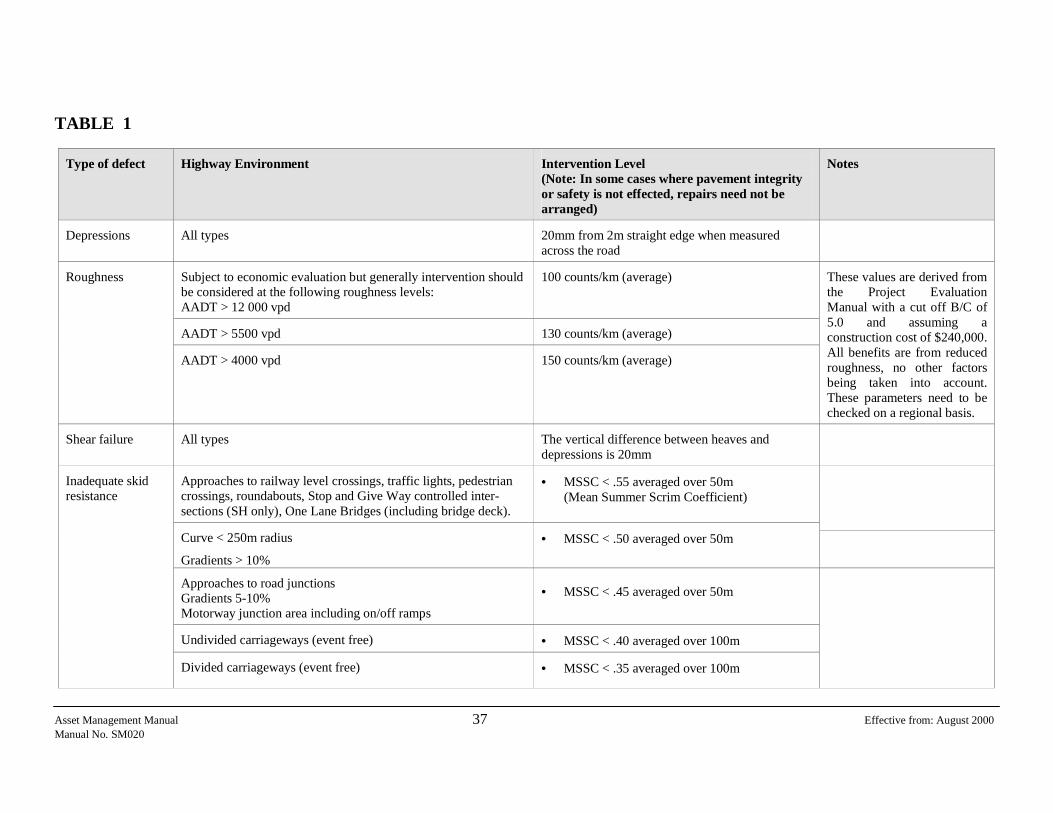
TABLE 1
Type of defect
Highway Environment
Intervention Level (Note: In some cases where pavement integrity or safety is not effected, repairs need not be arranged)
Notes
Depressions
All types
20mm from 2m straight edge when measured across the road
Subject to economic evaluation but generally intervention should be considered at the following roughness levels: AADT > 12 000 vpd
100 counts/km (average)
AADT > 5500 vpd
130 counts/km (average)
Roughness
AADT > 4000 vpd
150 counts/km (average)
These values are derived from the Project Evaluation Manual with a cut off B/C of 5.0 and assuming a construction cost of $240,000. All benefits are from reduced roughness, no other factors being taken into account. These parameters need to be checked on a regional basis.
Shear failure
All types
The vertical difference between heaves and depressions is 20mm
Approaches to railway level crossings, traffic lights, pedestrian crossings, roundabouts, Stop and Give Way controlled inter-sections (SH only), One Lane Bridges (including bridge deck).
•
MSSC < .55 averaged over 50m (Mean Summer Scrim Coefficient)
Curve < 250m radius Gradients > 10%
•
MSSC < .50 averaged over 50m
Approaches to road junctions Gradients 5-10% Motorway junction area including on/off ramps
•
MSSC < .45 averaged over 50m
Undivided carriageways (event free)
•
MSSC < .40 averaged over 100m
Inadequate skid resistance
Divided carriageways (event free)
•
MSSC < .35 averaged over 100m
Asset Management Manual Effective from: August 2000 Manual No. SM020 38
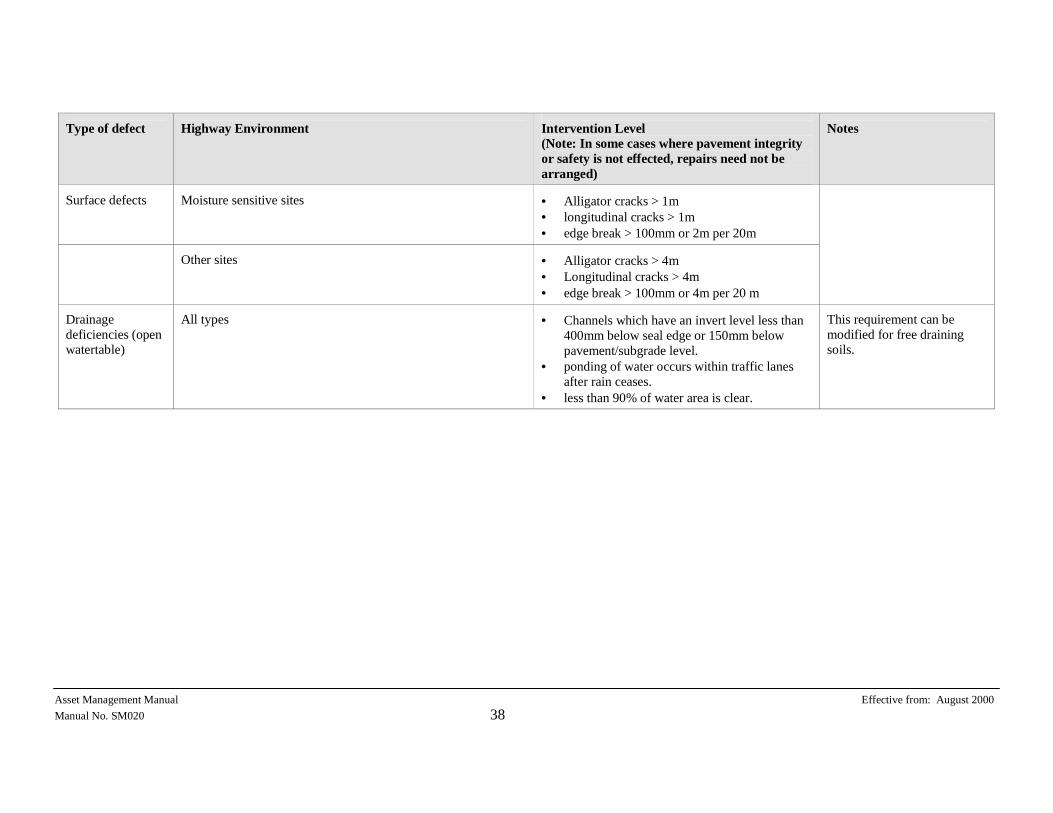
Type of defect
Highway Environment
Intervention Level (Note: In some cases where pavement integrity or safety is not effected, repairs need not be arranged)
Notes
Surface defects
Moisture sensitive sites
•
Alligator cracks > 1m� • longitudinal cracks > 1m •
edge break > 100mm or 2m per 20m
Other sites
•
Alligator cracks > 4m� •
Longitudinal cracks > 4m • edge break > 100mm or 4m per 20 m
Drainage deficiencies (open watertable)
All types
• Channels which have an invert level less than
400mm below seal edge or 150mm below pavement/subgrade level.
•
ponding of water occurs within traffic lanes after rain ceases.
• less than 90% of water area is clear.
This requirement can be modified for free draining soils.
SECTION 6
MAINTENANCE INTERVENTION STRATEGIES

Asset Management Manual 39 Effective from: August 2000 Manual No. SM020
6
MAINTENANCE INTERVENTION STRATEGIES
6.0
Overview
Introduction:
A Maintenance Intervention Strategy is a detailed statement of thetypes of maintenance activity that should be targeted within thetreatment lengths identified in the Forward Work Programme. It is theprincipal method of conveying the appropriate activities to all partiesinvolved in maintenance of the asset. Maintenance Intervention Strategies are designed to ensure theoptimum use of maintenance funding by ensuring that routine activities are appropriate given the forward programmed treatments.
In this Section:
This sections covers the following: Topic
See Page
6.1 Objectives
39
6.2 Alignment with Policy
40
6.3 Typical Strategies
41
6.1
Objectives
Alignment with Forward Work Programme:
The Maintenance Intervention Strategies are designed to providereactive maintenance treatments specific to the period prior to theimplementation of any proposed treatments in the Forward Work Programme. Each treatment length requires the nomination of a typeof maintenance intervention strategy. To provide ease of comparison Appendix 1E outlines the suggestedtypes of strategies to be adopted.
Example:
If the Forward Work Programme indicates that a structural rehabilitation will be carried out next year, routine maintenance in theintervening period may restrict the identification of repairs to thoserequired for safety reasons.
Risk Assignment:
Some maintenance intervention strategies will require specific assignment of risk to the client.
Asset Management Manual Effective from: August 2000 Manual No. SM020 40
For example, where holding strategies are used. A holding strategy islikely to require a repair with a shortened design life to be used, suchlife being sufficient to last until the programmed treatment is implemented. There is also a more general assignment of risk to the client associatedwith delays to the implementation of treatments and the possibility ofrapid pavement deterioration as a consequence.
Pre-treatment:
There will be a need to define maintenance intervention strategieswhich recognise pre-treatment needs. These strategies will focus on the nature and timing of reactive maintenance works. The bestexample of this is reseal treatments where preseal repairs are arranged in advance.
Refinement of Service Levels:
The maintenance intervention levels described in Section 5, define thecondition at which reactive maintenance works should be considerede.g., depth of depressions, roughness, inadequate skid resistance. The type of reactive maintenance treatment that is appropriate should bereferenced within the allocated maintenance intervention strategy. The preferred repair method may vary between digout to crack sealingdepending on the allocated maintenance intervention strategy. The maintenance intervention strategy is used to instruct/guide on thepreferred implementation of service standards.
Determination of Priority:
Maintenance Intervention Strategies will define the priority of work toa greater degree than the contract specifications. As an example, preseal repairs could be assigned a higher priority thanmost other reactive maintenance work.
6.2
Alignment with Policy
Introduction:
The client may require the Maintenance Intervention Strategies to reflect regional or national practices.
Policy Considerations:
Regional or national practices may be targeted to: • the timing and extent of preseal repairs. • the timing and extent of improvements required prior to reseal
work – e.g., drainage improvements, seal widening.

Asset Management Manual Effective from: August 2000 Manual No. SM020 41
• the level of service required for repairs prior to pavementrehabilitation work. This may include the use of holding strategies.
6.3
Typical Strategies
Introduction:
Maintenance Intervention Strategies should be developed on a regional basis and be tailored to the specific approach towards maintenancemanagement adopted by each region. Typical Maintenance Intervention Strategies are included in thissection for reference purposes only. Development of innovative regional Maintenance Intervention Strategies is to be encouraged. Below are three examples of types of strategies.
Example 1
Pre-Reseal Repair Strategy
Objective:
To achieve a high standard of pavement maintenance prior to resealingand to ensure all: • improvements to drainage are completed prior to sealing, and • pre-reseal repairs and seal widening are completed in time to allow
their integrity to be tested before sealing commences. This will be achieved by: 1. Completing all outstanding maintenance and improvement work
before 30 April in the year preceding that in which the reseal is nominated (Year 1). This is inclusive of removal of:
• depressions which hold water (safety/aqua-planing issue), and
• the repair of any edge of seal that suffers from roll-off of the seal edge from the extended crossfall of greater than 50mm.
This work may be carried out by Highway MaintenanceContractors or under separate contracts for Seal Widening andDrainage Improvements.
2. Reviewing the condition of all sections during July of the year
nominated for reseal and correcting any defects discovered orcompleting other outstanding work by mid August. At this stage,

Asset Management Manual Effective from: August 2000 Manual No. SM020 42
any further maintenance on these sections, unless otherwisespecified by the Engineer, will be the responsibility of the successful Resealing Tenderer/Contractor.
Notes:
The Highway Maintenance Contractor is responsible for cyclicmaintenance items, shoulder maintenance and slip removals for reseallengths right through the resealing programme/period. Where possible, pavement repairs should be completed during theprevious summer to allow adequate time for their integrity to be tested. The nominated programme of pavement burning will also becompleted during the months of April and May (fire restrictions permitting). Second coat and/or two coat sealing of pavement repairs may not berequired after 1 October (Year 1) within reseal lengths. This will be atthe discretion of the Resealing Contractor and based on the design ofthe new seal.
Example 2
P 17 – Surfacing Maintained by Others
Objective:
To ensure that:
Those who have the contracted risk of certain issues (e.g. bleeding orscabbing treatment on seals within the maintenance period, ordefective pre-seal repairs), are not relieved of their obligations due to interference by others and are adequately and quickly informed of theneed to intervene.
Implementation:
P 17 – seal and pre-reseal repairs are usually maintained for one year but maybe two years in some circumstances of major rework. The Contractor must advise the Engineer immediately with details andrecommended solutions for all surface orientated failures. TheEngineer will notify the relevant contractor as appropriate.
Example 3
Selective Maintenance
Objective:
To limit maintenance input in the interests of economy, withoutcompromise to safety or pavement integrity. This strategy could be used for a major rehabilitation treatment proposed in Year 2. Thedesign life is limited to the date of area treatment and the client accepts the risk of premature failure.

Asset Management Manual Effective from: August 2000 Manual No. SM020 43
Implementation: The strategy will be achieved by: 1. The repair of failed areas of pavement provided permanent repairs
will not become superfluous when the area treatment is provided. 2. The consideration of crack sealing, rip and remake and shallow
pavement repair where appropriate. 3. Justification of repairs as a pre-requisite to programme approval
when the repairs fall within the following limits:
• rip and remake > 30m² • digouts > 20m² • stabilising > 150mm deep • all surface levelling • all edge break repair • all shoulder work.

SECTION 7
INFORMATION REQUIREMENTS
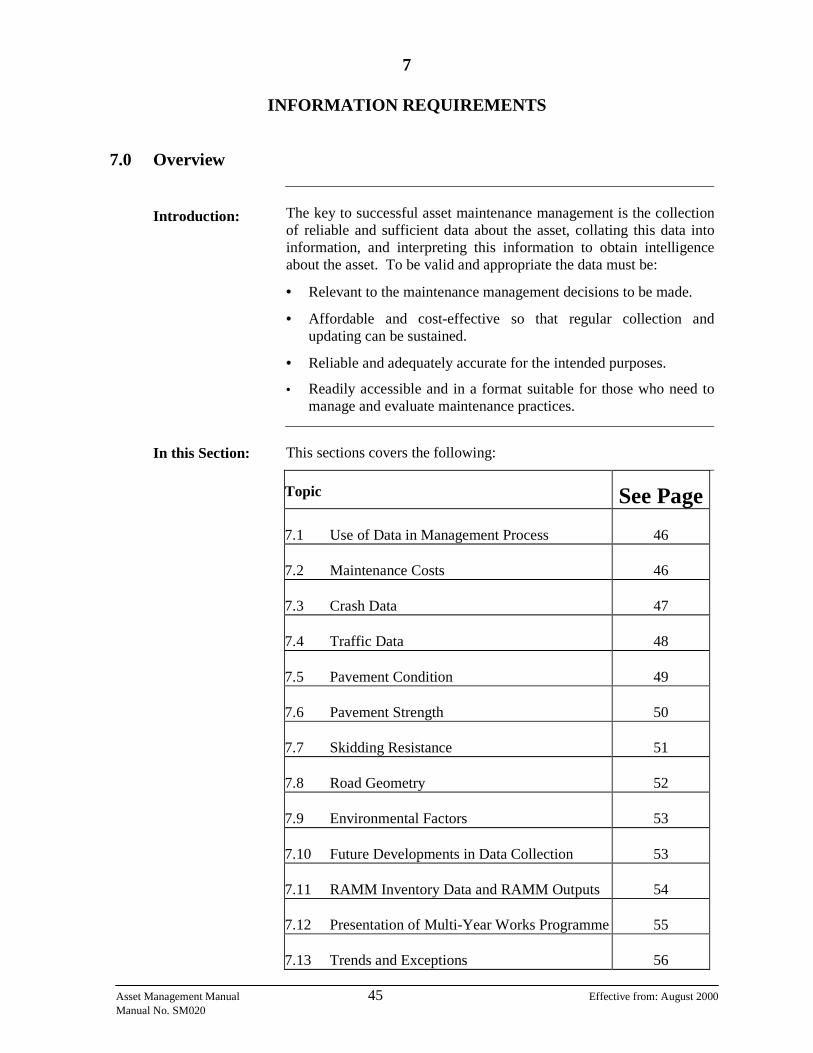
Asset Management Manual 45 Effective from: August 2000 Manual No. SM020
7
INFORMATION REQUIREMENTS
7.0
Overview
Introduction:
The key to successful asset maintenance management is the collectionof reliable and sufficient data about the asset, collating this data intoinformation, and interpreting this information to obtain intelligenceabout the asset. To be valid and appropriate the data must be:
• Relevant to the maintenance management decisions to be made.
• Affordable and cost-effective so that regular collection and updating can be sustained.
• Reliable and adequately accurate for the intended purposes.
• Readily accessible and in a format suitable for those who need tomanage and evaluate maintenance practices.
In this Section:
This sections covers the following: Topic
See Page 7.1 Use of Data in Management Process
46
7.2 Maintenance Costs
46
7.3 Crash Data
47
7.4 Traffic Data
48
7.5 Pavement Condition
49
7.6 Pavement Strength
50
7.7 Skidding Resistance
51
7.8 Road Geometry
52
7.9 Environmental Factors
53
7.10 Future Developments in Data Collection
53
7.11 RAMM Inventory Data and RAMM Outputs
54
7.12 Presentation of Multi-Year Works Programme
55
7.13 Trends and Exceptions
56
Asset Management Manual Effective from: August 2000 Manual No. SM020 46
7.1
Use of Data Management Process
Introduction:
The data collected is used for the preparation of multi-year maintenance programmes for state highways using output from eitherthe treatment selection process incorporated in Transit’s Road Assessment and Maintenance Management(RAMM) system or NZ-dTIMS. RAMM does not produce a true network wide optimum set oftreatments in contrast to NZ-dTIMS, which utilises deterioration modelling and budget optimisation.
Required Data:
In order to apply the RAMM treatment selection process, the following different types of data related to road sections is required:
• Maintenance activity history • Crash history • Traffic loading • Pavement construction and condition inventories • Condition information Application of road deterioration and maintenance effects models,such as the World Bank’s Highway Design and MaintenanceStandards Model (HDM) that is incorporated in NZ-dTIMS, requires the following additional types of data:
• Road geometry • Environmental conditions
Two Levels of Use:
Data acquired for maintenance management are used at two levels,network and project. The network level data is used for network worksprogramming and budgeting and inter-region comparisons. Project level data is used for the engineering associated with specific sectionsor projects. Network level data may not be sufficiently detailed oraccurate enough for project use, or for calibrating and enhancingdeterioration models.
7.2
Maintenance Activity
Introduction:
The key information component is a detailed maintenanceachievement record. Accurate maintenance activity data is vital ifmeaningful forward programmes and maintenance interventionstrategies are to be provided.
Categorisation of Costs:
Maintenance activity shall be recorded under the following categories:

Asset Management Manual Effective from: August 2000 Manual No. SM020 47
• Pavement related costs generally resulting from the structuralperformance of the pavement
• Surfacing related costs that result from the performance of thesurfacing layer – e.g., stripping and flushing
• Shoulder maintenance costs
• Drainage maintenance costs
• Verge maintenance costs
• Other costs
Computer Assistance:
The management of historical data can be facilitated by the use ofdatabase software. The database can be used for additional applications relevant to the management of the network. Typical applications can include:
• Providing checking facilities for monthly work programmes toensure compliance with maintenance intervention strategies.
• Managing defect liability.
• Managing contract payments.
• Determining past maintenance trends on an area or site basis.
• Outputting the maintenance work record.
• Development of maintenance cost models to quantify likely futuremaintenance expenditure patterns of pavements at any particular time in their life.
• Use of historical cost data as a surrogate measure of cracking,construction quality, maintenance practice etc in deteriorationmodels such as pavement performance models.
The database can be designed to allow easy output of data to a relational database (e.g. – Transit’s National Optimisation of Maintenance Allocation by Decade, NOMAD, or similar purposesoftware) to permit cost data reports to be readily tailored to usersrequirements.
Data Storage Standards:
Standard codes and format for the storage and transfer of maintenancecost data is defined in the State Highway Database Operations Manual.
7.3
Crash Data
Introduction:
Crash data can provide an indication of maintenance and capitaltreatments required. Crash data for each treatment length needs to be considered when preparing multi-year programme of works.

Asset Management Manual Effective from: August 2000 Manual No. SM020 48
Sources:
Official crash data can be obtained from the Land Transport SafetyAuthority’s (LTSA) Crash Analysis System (CAS) database. RAMMhas provision to store CAS sourced crash data. Crash records coveringthe five year period 1995-99 are presently held in RAMM. Crash data is also separately collected from source as tasked in theimplementation of the Safety Management Strategy.
Analysis:
Crash data needs to be analysed at both a network and project level.Network analysis will identify atypical crash frequencies, which inturn will draw attention to sites or routes requiring furtherinvestigation. The use of crash data as an input is not intended to override safety related project identification. In this context, the crash record isintended to highlight reactive maintenance deficiencies (e.g. surfacingfailure either through lack of skid resistance or lack of texture depth orponding due to rutting).
7.4
Traffic Data
Introduction:
Traffic data is extremely important in the context of long termmaintenance planning since both road user costs and the magnitudeand rate of pavement deterioration are influenced by traffic on a road section. It is therefore essential that accurate and up to date traffic datais available.
Traffic Data Items:
Traffic volume and composition are the most important data items tobe collected so that significant changes to the duty of a pavementsection can be quickly identified and implications on maintenancerequirements assessed. Traffic volumes are generally derived frompermanent or temporary counting stations though manual counting issometimes used at intersections to determine traffic split and turning movements. Data on axle loadings is also important since thisinfluences the rate of pavement deterioration. The axle loading on anetwork can be determined by the following direct methods: • Permanent weigh-bridge stations
• Portable weigh pads
• Weigh-in-motion stations that can be temporary or permanentlyinstalled.
Asset Management Manual Effective from: August 2000 Manual No. SM020 49
Provision in RAMM:
RAMM has provision to store traffic data based on traffic counts orestimated values. The distribution of traffic is done on the basis of thevehicle types defined in the Project Evaluation Manual expressed as apercentage of the total traffic. Load factors are stored in RAMM interms of average number of standard axles (ESA) per vehicle type. Nohistorical or projected traffic growth data presently exists in RAMM.
7.5
Pavement Condition
Introduction:
Both manual and automated methods are used for assessing pavementcondition. The condition data collected can be conveniently dividedinto two groups: 1. Those related to structural strength of the pavement - e.g. cracking,
deflection, roughness, rutting, and
2. Those related to safety considerations - e.g., skid resistance and texture depth.
Proper assessment of existing pavement condition is critical as boththe RAMM treatment selection process and NZ-dTIMS predict the future condition of a pavement section based on its current condition.
RAMM Condition Rating:
New Zealand state highways are visually rated using the RAMMrating system annually. Presently carriageway (rutting, shoving,cracking, potholes, edge break, and scabbing), footpath, surface waterchannel and shoulder conditions are rated during this operation. Forthe rating surveys the Treatment Lengths described in Section 4 areused as the prime section length. Where treatment lengths are greater than 800 metres, the length is subdivided into 500 metre ratingsections. The carriageway rating is based on a 10% sample. Surfacewater channels and shoulders are rated for the entire length. The RAMM visual ratings are conducted over the winter months.
High Speed Data:
Since 1994, laser based automated pavement condition surveyequipment has been employed to survey the condition of the entirestate highway network. Longitudinal and transverse pavement profilesare acquired at normal highway speeds and subsequently processed to provide measures of roughness, ruts, texture depth, shoving andflushing which are stored in RAMM. These surveys are run in bothdirections over summer as laser measurements are affected by surfacewater. The resulting total survey length is about 21,000 km, therebyproviding 100% measurement of four (roughness, rutting, texturedepth and shoving) of the ten basic road condition features required tooperate the RAMM system.
Asset Management Manual Effective from: August 2000 Manual No. SM020 50
Survey data density, data precision, speed of collection and reduced disruption to traffic, are considerable advantages of automated datacollection over manual methods. Repeatability is a further significantadvantage.
7.6
Pavement Strength
Introduction:
The strength of a pavement is a complex function of the interactions between material types and stiffnesses, layer thicknesses and depths,subgrade stiffness and surface condition. Measures that have provedeffective or popular in the past have included: • Surface deflection under creep loading (Benkleman Beam)
• Surface deflection and curvature under dynamic impact loading(Falling Weight Deflectometer)
• Structural number (AASHTO) with soil support value(AASHTO) or modified structural number (TRRL)
Empirical research has found the modified combined structural number (SNC) to be the most statistically significant measure ofpavement strength influencing the deterioration of pavements. SNCwas therefore adopted as the primary strength parameter in the HDMsealed road pavement deterioration models incorporated in NZ-dTIMS. Because the concept and application of SNC to New Zealandflexible pavements is new, research is currently being performed toassess its suitability for predicting pavement performance, particularlyfor volcanic ash pavements, and its reliable determination.
Determination of SNC:
Transit has adopted two methods for obtaining SNC: 1. Falling Weight Deflectometer (FWD)Surveys
Two procedures are used to determine the structural number fromFWD deflections. If pavement layer thicknesses are known, the SNC is calculated using layer strength coefficients derived fromlayer elastic moduli estimated from back calculation of thedeflection bowl. If pavement layer thicknesses are uncertain orunavailable, an empirical relationship is used to estimate SNC based on FWD deflections at 0, 900, and 1500mm from the centreof the loading plate under a standardised 40 kN FWD impact load.
Because New Zealand pavement materials tend to be moisturesensitive, their properties can change significantly with season. An increase in the moisture content of a material causes a decrease inthe shear strength and often a decrease in the stiffness of thematerial. This usually causes an increase in the deflection resulting
Asset Management Manual Effective from: August 2000 Manual No. SM020 51
in a decrease in the SNC. For this reason, FWD surveys are scheduled to take place over the wet season.
The FWD is the preferred method for obtaining network levelSNC.
2. In-situ CBR Method
This method provides the “true” value of SNC. It is based on thethickness of pavement layers, material-layer strength coefficients, and in-situ subgrade CBR values. The required input values aredetermined either from construction records stored in RAMM orfield test pits. Estimates of SNC obtained by this method arerecommended for volcanic ash pavements that display high deflections and for specific projects where previous structuralbehaviour of the road has not met design expectations.
7.7
Skidding Resistance
Introduction:
Skidding resistance measurements over sealed lengths of state highway are undertaken yearly in both directions. To derive maximumbenefit from these annual skidding resistance surveys, texture depthmeasurements are also simultaneously made to allow calculation of theInternational Friction Index (IFI).
Purpose:
There is a strong relationship between the wet skidding resistanceprovided by a road surface and wet-pavement crash rates. Continuous measurement of skidding resistance and texture enables identificationof sites where existing levels of skidding resistance are causing or are likely to cause crashes.
Problems Identified:
Skid resistance surveys can identify problems relating to:
• lack of macrotexture (e.g. flushing or bleeding)
• poor microtexture (e.g. polished stone)
• differential wheelpath friction which can cause loss of controlduring cornering or emergency braking.
Determination of Skidding Resistance:
In New Zealand, the Sideway-Force Coefficient Routine Investigation Machine (SCRIM) is used for annual skidding resistance surveys of the state highway network. However, detailed investigations of sitesidentified from the SCRIM survey as having deficient skiddingresistance, where required, are usually made with either the GripTesteror the Norsemeter Roar as SCRIM is not available outside the State

Asset Management Manual Effective from: August 2000 Manual No. SM020 52
Highway survey period. The GripTester and Norsemeter Roar are twotrailer-based skid testers, which have been shown to providereasonable correlations with SCRIM.
Data Stored in RAMM:
SCRIM skidding resistance measurements normalised to a temperature of 20°C and survey speed of 50 km/h and corrected for seasonalvariation effects, is stored in RAMM. This value of skidding resistanceis known as the New Zealand mean summer skid resistance,NZMSSC. In addition, the IFI value at the time of the survey is additionally stored. IFI comprises two values: • F60, which represents the harmonised estimate of wet friction at 60
km/h. • Sp, the speed number, which provides a measure of how the wet
friction reduces with speed. It is linearly related to macrotexture, a high value indicating the friction is less speed dependent.
7.8
Road Geometry
Introduction:
Road geometry data is required for the following four purposes:
• Automatic classification of SCRIM measurements according to the site categories specified in Transit’s T/10 specification.
• Calculation of road user benefits arising from maintenance worksaccording to Transfund’s Project Evaluation Manual (PEM) - e.g., travel time savings, crash risk reduction, vehicle operating costs etc.
• Calculation of surface water depth - i.e., ponding when used in conjunction with transverse road profile data (rut depth).
Required Data: The critical road geometry parameters to be collected are:
• Horizontal curvature • Longitudinal gradient • Cross-slope From these parameters, other road geometry measures required forNZ-dTIMS and the PEM such as vertical curvature and the number ofrises and falls can be derived. Road geometry data is typically acquired with vehicles fitted with inertial navigational systems comprising precision accelerometers andgyroscopes linked to GPS such as ARRB’s GipsiTrac system.
Asset Management Manual Effective from: August 2000 Manual No. SM020 53
Provision in RAMM:
Road geometry surveys of the entire State Highway network have beenperformed in 1992 with the ARRB RGDAS vehicle and in 1998 with WDM (UK) Ltd’s SCRIM vehicle. Data from the 1998 survey isstored in RAMM.
7.9
Environmental Factors
Introduction:
Environmental data is required for the application of NZ-dTIMS. The parameters required are mean monthly precipitation (m/month) along with an assessment of the pavement’s susceptibility to moisture.However, recent research shows pavement and surfacing behaviour tobe strongly correlated to:
• Road surface temperature • Thornthwaite’s moisture index
Provision in RAMM:
Data regarding the susceptibility of the pavement to moisture data hasbeen recently included in the Treatment Length Table in RAMM forWindows (v3.7). If available other environmental data such as mean,minimum, and maximum monthly precipitation, humidity, and road surface temperature would enable improved understanding of distressmechanisms of New Zealand pavements.
7.10
Future Developments in Data Collection
Manual versus Automatic:
Visual condition surveys performed by raters walking and/or driving along the road is time consuming, subjective, open to transcriptionerror, and is becoming expensive due to the need for traffic control. Asa result, Transit is pursuing a policy of replacing manual methods ofassessing pavement condition with up-to-date proven automatic methods. In this regard, introduction of the following two technologiesappears imminent:
• Automated Detection and Classification of Cracking
The Roads and Traffic Authority of NSW (RTA) has developedvehicle mounted technology (RoadCrackTM) to automate the detection and classification of cracking in road pavements. Itdetects cracks (>1mm width) and classifies them as transverse,longitudinal, or crocodile (i.e. fatigue) while operating at highwayspeeds irrespective of the surface type (chip seal or bituminousmix). It samples at 2m in 10m (20% sampling) longitudinally for adetection width of 0.75m in the outer wheelpath. Analysis of datais executed in “real time”.
Asset Management Manual Effective from: August 2000 Manual No. SM020 54
• Video Logging
Multi-camera video logging systems (either analogue or digital) allow simultaneous recording of the road and road corridor as seenby the driver and of the road surface. Information that can beobtained from these images includes road inventory details such asbridge and culvert location, road signs, road delineation, drainage, road shoulder and crash barrier location and condition, andpavement and surface condition such as flushing, edge-break, scabbing, etc.
The majority of systems available today provide text overwritten onto the image that provides location referencing with respect toeither GPS co-ordinates or route position (RP).
A basic video log of the entire state highway network is beingundertaken as part of the 1999/2000 SCRIM survey to providepanoramic views of skid deficient sites to help determine whether the cause is due to aggregate polishing or some other reason.
Multifunction Versus Unifunction Vehicle Based Systems:
There is a trend towards incorporating more and more measurementfunctions onto a vehicle. For example, the SCRIM vehicle used forthe 1999/2000 survey of the state highway network combines skiddingresistance measurement with right-of-way video logging, road geometry measurement, and longitudinal and transverse road profilemeasurement. The reason for this trend is that the cost of operating amultifunction vehicle is less than the cost of operating a group ofunifunctional vehicles. More importantly, multifunctional vehiclescollect all data simultaneously allowing better data correlation.
7.11
RAMM Data and Outputs
Introduction:
RAMM outputs include appropriate maintenance treatment for eachsection of road in the network from which multi-year works programmes can be derived. To perform treatment selection analysis,carriageway condition rating together with relevant inventory data anduser supplied treatment unit costs are required. Road user costs relatedto pavement roughness and a simplified profile of future pavementmaintenance costs are used in determining the appropriate treatment.
Inventory Data:
The most relevant data obtained from the RAMM Inventory databaseincludes:
• Physical dimensions of the road network • Surfacing records • Traffic volumes and mix • Structural condition (surface faults)

Asset Management Manual Effective from: August 2000 Manual No. SM020 55
• Functional condition (roughness) • Drainage rating • Pavement rating
Treatment Selection:
The RAMM treatment selection system analyses the road conditiondata to determine maintenance needs using technical requirements andthen provides economic justification for the work reported. Budget restraint is accommodated by allowing the user to set the benefit/cost(B/C) cut-off ratio below which rehabilitation work will not bescheduled. The treatment selection output is intended to provide a networkperspective of the condition of the roading asset. Any treatments proposed by RAMM shall be confirmed by field inspection prior toincorporation in multi-year work programmes.
Condition Rating Trends:
The results of condition rating surveys from current and past yearsshould be used to assist with requests for longer term road fundingthrough determining both network trends and trends for individualtreatment lengths.
7.12
Presentation of Multi-Year Work Programme (i.e. – Data Collection)
Introduction:
A multi-year work programme is essentially a communication andpresentation tool. It describes the current assessment of maintenancetreatments (including routine maintenance, resealing and rehabilita-tion) that are proposed for each treatment length. In order to make a large amount of data immediately available to statehighway network managers, relational database programmes such asNOMAD, are used to collect and combine information from a numberof sources, including RAMM, and to present maintenance interventionstrategies and the associated multi-year forward maintenance programmes.
Types of Data:
The types of data able to be recorded for each treatment length and the data source includes:
Data Source
Crash Data AIS database (LTSA)
Pavement Structure RAMM database Surfacing Traffic Counts Roughness Counts Rating Data Maintenance Recommendations
Historical Maintenance Activity

Asset Management Manual Effective from: August 2000 Manual No. SM020 56
Additional Information:
Information which may need to be entered directly to the relationaldatabase includes: • Treatment length definition • Last surfacing - date, chip size, type(option to overwrite a copy
of RAMM data) • Proposed next surfacing • Maintenance Intervention Strategy (coding required) • Multi-year programme treatment • Priority
Additional Reports:
A programme covering proposed treatments against treatment lengthsfor the next three years is provided to the Pavement MaintenanceContractor. This allows for the Contractor to programme and providethe appropriate repairs for each treatment length.
7.13
Trends and Exceptions (i.e. – Intelligence)
Introduction:
The collation of data does not in itself provide the means of identifyingproblem sites. The interpretation of the data is important, as this is theprocess, which identifies the trends and exceptions essential for the early identification of faults and subsequent selection of treatments foreach treatment length.
Types of Indicators:
The types of indicators which are useful for identification of treatmentneeds include: • Crash indicator - the number of crashes for the treatment length are
abnormal.
• SCRIM indicator – deficiency of a significant length of road.
• Maintenance cost indicator – the cost of maintenance has increased from previous years or is above the accepted intervention cost/km.
• Roughness indicator - the roughness for the treatment length is greater than the intervention level.
• Seal age indicator - the life cycle of reseals is a useful indicator that future maintenance works may be required.
• RAMM warning indicator – an output of RAMM is a warning of missing data.
• RAMM rating - the amount of defects which has increased from the previous rating.

Asset Management Manual Effective from: August 2000 Manual No. SM020 57
• RAMM treatment recommendation - an output of RAMM is a recommended maintenance treatment.
• Visual inspection reports - provided by the Client, Consultant or
Contractor.
Interventions:
Some indicators need an intervention level to determine whether thetreatment length is exhibiting abnormal behaviour.
Examples of Indicators:
Indicators must be developed on a Regional basis. Typically these may include: • Roughness counts per km exceeding:
100 for traffic > 6000 vehicles/lane/day 130 for traffic > 2750 vehicles/lane/day 150 for traffic > 2000 vehicles/lane/day
• Surfacing and pavement maintenance costs per km exceeding$8,000.
• Maintenance cost this year is more than 1.5 times last years costs
and greater than $4000/km. • Maintenance costs have increased following a reseal. • Maintenance costs remain significant following rehabilitation/
shape correction. • Seal age is greater than 90% of expected life. • SCRIM - the length of road which has failed is > 100m • Crashes over last five years are greater than 4 per intersection or 4
per 500m. • RAMM rating defect types have increased 20% over previous
year’s totals.
Customised Indicators:
Customised regional indicators must consider each of the above factors(with appropriate thresholds) together with any regional specificfactors.

SECTION 8
THE INTELLECTUAL PROCESS

Asset Management Manual 59 Effective from: August 2000 Manual No. SM020
8
THE INTELLECTUAL PROCESS
8.0
Overview
Introduction:
The intellectual process describes the process of applying intelligenceto decision support information to output an assignment of futuretreatments. The process includes: • the collation and interpretation of all available data • the application of intelligent decision support systems • field verification, and • consideration of all resulting information to resolve the application
of the right treatments at the right time in compiling the ForwardWork Programme.
Treatment Intelligence:
This process describes the application of the treatment intelligencefunction as it applies to Transit’s business systems explained inSection 2.
In this Section:
This sections covers the following: Topic
See Page
8.1 The Process
59
8.2 Collation and Interpretation of Data
60
8.3 Intelligent Decision Support Systems
62
8.4 Field Assessment and Verification
63
8.5 Programme Preparation
64
8.1
The Process
Components:
Components of the process are illustrated in Figure 8.

Asset Management Manual Effective from: August 2000 Manual No. SM020 60
Practitioner Role:
The process outlined in Figure 8 confirms an expectation that: • there are a number of information sources intended to form the
basis of intelligent consideration. No system in isolation isintended to be predominant in resolving the programme, and
• an expectation that intelligence is applied by the Asset
Management Practitioner to all information sources in resolvingappropriate interventions.
Forward Work Programme:
The output of this process is the Forward Work Programme.
8.2
Collation and Interpretation of Data
Introduction:
Section 7 describes the information requirements that support the assetmanagement process. It explains: • the collation process that is necessary to turn the available data into
information, and • the interpretation of this information to obtain intelligence about
the asset.
Figure 8 Treatment Intelligence Process
InventoryData
ConditionData
The Right Treatment at the
Right Time
Intelligent Decision Support Systems
Forward WorkProgramme
IntelligentConsideration
Field Verification
Collate and Interpret Intelligenceabout the
Asset
Safety
Economics

Asset Management Manual Effective from: August 2000 Manual No. SM020 61
Interpretation:
Analysis of the information looking for trends and exceptions, is theprinciple interpretation expectation. The NOMAD software provides powerful tools designed to enhance this process.
Example:
An example of an exception report used to identify treatment lengthswhere layer stability may be an issue and pavement recycling apossible treatment option follows. Select all treatment lengths where: • Flushing is evident - Flushing identified in manual rating, or - More than 15 % with mean profile depth less than 0.5mm.
• Seal cycles are reducing. • Recorded seal layers number greater than 4.
Other Data:
During the collation and interpretation of data, consideration will be given to the outputs of other business systems. Safety improvementprojects and other capital development proposals will impact on themaintenance programme.
Importance:
The bulk maintenance expenditure is likely to occur over a small percentage of the network. The example of an Expenditure CoverageCurve (Figure 9) illustrates this principle. When cumulative expenditure is plotted against cumulative length65% of expenditure occurs over 20% of the length of the network. Data collection and analysis will allow the 20% of the network withhigh maintenance costs to be more readily identified and treatmentsand maintenance intervention strategies formulated to reducemaintenance costs. An improvement in maintenance programmes and strategies will result in a trend towards a straight line (an evendistribution of needs.

Asset Management Manual Effective from: August 2000 Manual No. SM020 62
8.3
Intelligent Decision Support Systems
Introduction:
Intelligent decision support systems include any structured processes designed to analyse inventory and condition data and output specifictreatment recommendations. Transit recognises the following systems. • The RAMM Treatment Selection Algorithm. • Pavement Deterioration Modelling as presented in the national
implementation of dTIMS.
RAMM Treatment Selection Algorithm:
The RAMM Treatment Selection Algorithm is maintained and madeavailable to the industry by Transfund New Zealand. The algorithm has no capability to predict future development ofcondition or costs and its output is therefore limited to short termplanning. The output is useful as a supplement for verification of short termtreatments, and for the identification of omissions in the output ofother treatment identification methodologies. The output of this algorithm will be considered as an input into theForward Work Programming process. It is expected that reliance on itmay be phased out as effective implementation of more sophisticatedsystems is achieved.
Expenditure Coverage
0
20
40
60
80
100
0 20 40 60 80 100
Figure 9 Expenditure Coverage
Cumulative Length Maintained
Cum
ulat
ed E
xpen
ditu
re

Asset Management Manual Effective from: August 2000 Manual No. SM020 63
Documentation of the Treatment Selection Algorithm can be found in the RAMM documentation.
DTIMS Pavement Deterioration Model:
The dTIMS Pavement Deterioration Model is being implementedthrough a RIMS (Roading Information Management Systems) Groupinitiative. Transit has adopted this initiative for use on the state highway network. Transit’s implementation will be based on the RIMS Group base setup.Modification of this base setup to achieve improved calibration will becontrolled by Transit. Outputs from setups that have not been approved by Transit, will not be used in developing the Forward WorkProgramme. Transit implementation of dTIMS is detailed in Section 9.
Data Exceptions:
Section 7.13 discussed the identification of exceptions in the conditionand inventory data as a means of identifying possible treatment needs.Some examples are given. Further details are given in Section 8.2. Appendix 1 contains a series of flow charts illustrating the process thatmay be adopted in developing exception criteria for a particular network. The provision of these flow charts is not intended to inhibit thedevelopment of exception indicators based on local experience. Theintention is to promote the development of useful indicators. Anydevelopment must at least consider factors such as those identified in Appendix 1.
8.4
Field Assessment and Verification
Introduction:
Expert input by experienced practitioners guided by the outputs of thedata analysis and intelligent systems processes, is applied through fieldassessment and verification.
Objective:
During this field based process, decisions on the nature and timing oftreatments to be included in the programme, will be made based onfactors including:
• The verification of the indicators presented in the data analysis.
• Assessment of the significance of trends and exceptionshighlighted by this data.
• The treatment needs indicated by the outputs of the intelligentdecision support systems.
Asset Management Manual Effective from: August 2000 Manual No. SM020 64
• Consideration of the evidence of the cause of any deficiencies that
these indicators may be responding to.
• The experience of the practitioner.
• Field inspection.
Coverage:
The field inspection will include both assessment based on theindicators available through pre field analysis, and observation for anyomissions. Such omissions will generally result from:
• data inconsistencies, or • calibration deficiencies in intelligent systems.
8.5
Programme Preparation
Introduction:
Following the application of expert judgement in the field review, theprogramme can be finalised.
Data Review:
Any inconsistencies identified through the field inspection willnecessitate a review of data analysis or the application of intelligentsystems. Inconsistencies that indicate a calibration issue in the intelligentsystems, must be quantified and reported.
Project Justification Reporting:
Treatments proposed in Year 2 of the programme must be costed andquantified against economic criteria. The nature of these will dependon the type of work. Requirements for economic justification are given in the Transfund Project Evaluation Manual and in Transit’s Annual Plan Instructions.
Ranking and Prioritisation:
Treatments proposed in Year 2 of the programme may require formalranking. Transit has developed methodologies for ranking maintenance projects that are not easily assessed using economic ranking criteria. Thesemethodologies are explained in Section 10. A subjective priority must be assigned to each treatment. These areclassified as:
• High - economic or safety implications of deferring the project, can be quantified.
Asset Management Manual Effective from: August 2000 Manual No. SM020 65
• Medium - the project should proceed as planned. • Low - the implications of deferral will not impact on safety
and economic disbenefits are difficult to quantify. The subjective priority is particularly important in Years 1 to 5 of the programme.
Programme Review:
A review of the programme may be necessary following financialapproval if funding constraints are applied. A review that is carried out based on the need to apply fundingconstraints, will include assessment of deferring treatments orchanging the type of treatments proposed. The impact of such changesin Year 2 will be assessed over the life cycle of the asset.

SECTION 9
PAVEMENT DETERIORATION MODELLING
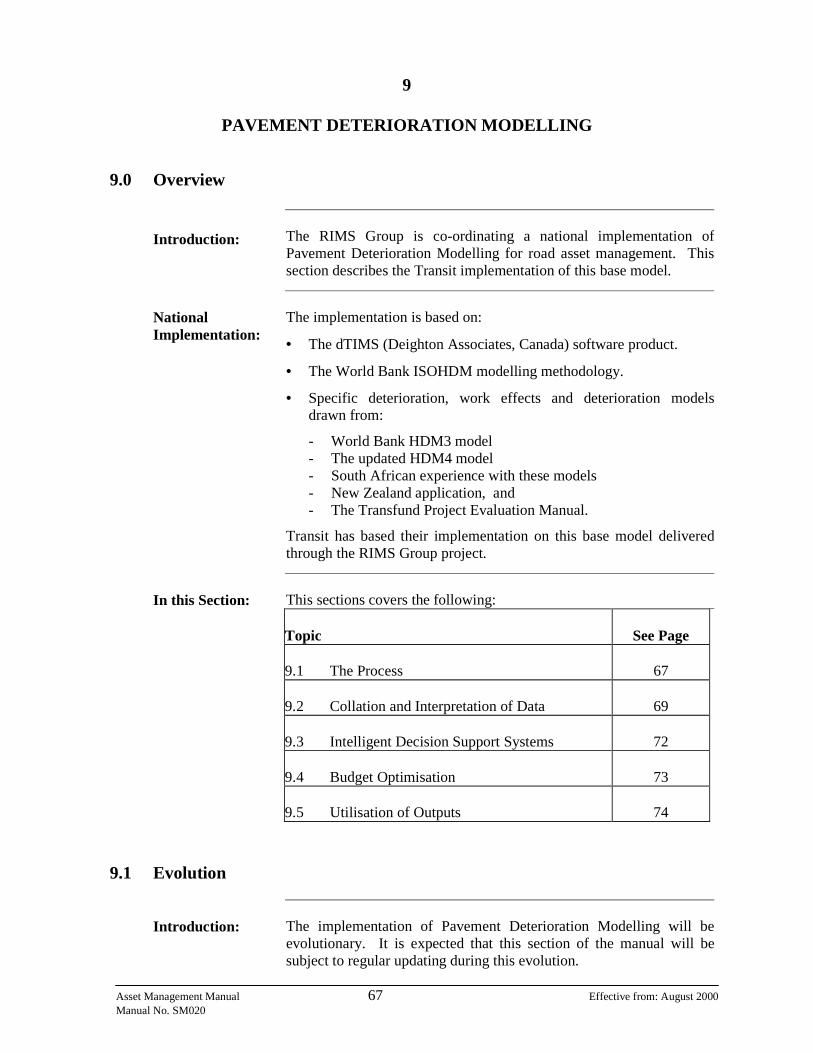
Asset Management Manual 67 Effective from: August 2000 Manual No. SM020
9
PAVEMENT DETERIORATION MODELLING
9.0
Overview
Introduction:
The RIMS Group is co-ordinating a national implementation of Pavement Deterioration Modelling for road asset management. Thissection describes the Transit implementation of this base model.
National Implementation:
The implementation is based on:
• The dTIMS (Deighton Associates, Canada) software product.
• The World Bank ISOHDM modelling methodology.
• Specific deterioration, work effects and deterioration modelsdrawn from:
- World Bank HDM3 model - The updated HDM4 model - South African experience with these models - New Zealand application, and - The Transfund Project Evaluation Manual.
Transit has based their implementation on this base model deliveredthrough the RIMS Group project.
In this Section:
This sections covers the following: Topic
See Page
9.1 The Process
67
9.2 Collation and Interpretation of Data
69
9.3 Intelligent Decision Support Systems
72
9.4 Budget Optimisation
73
9.5 Utilisation of Outputs
74
9.1
Evolution
Introduction:
The implementation of Pavement Deterioration Modelling will beevolutionary. It is expected that this section of the manual will besubject to regular updating during this evolution.

Asset Management Manual Effective from: August 2000 Manual No. SM020 68
Commitment:
Transit is committed to achieving successful, effective implementation of Pavement Deterioration as an input into the establishment ofForward Work Programmes.
Expectations:
It is not expected that the initial base model will produce reliableoutput. Initially the outputs may not form a valuable input into the programming process. However, use of the outputs in preparing the programme will form avaluable input into refining and calibrating the base model. It isimportant that all observations relating to the predictive modelling input benchmarked against the programme established, are recorded. It is expected that the field assessment and verification process will bean important input into the development of stable, reliable modelsuseful for the preparation of future programmes.
Refinement:
It is expected that refinement of the base model may include: • adjustment of the form of mathematical models included in the
base model, (based on long term research work). • inclusion of additional mathematical models to trigger treatments
using different inputs. • calibration of the base models without adjustment to the form of
them.
Evolution Process:
Implementation of the methodology involves development in four keyareas: • Intellectual – the development of expertise • Data Appropriateness • Research – as required to refine the models • Operational – how are the outputs going to be used. The expected process of evolution in these key areas, is illustrated inFigure 10. It is expected that we will not reach a state of development in these key areas sufficient to achieve reliable outputs until 2003.

Asset Management Manual Effective from: August 2000 Manual No. SM020 69
Intellectual
Data
Appropriateness Research Operational
Adoption
Development of the ability to use the tools (training, up skilling)
Condition and inventory data suitable for modelling
Refinement of models based on appropriate data
Control mechanisms, consumption and utilisation of outputs
Principles Understood Developing understanding Ability to interpret outputs
Most data inappropriate Sensitivities understood Changed collection and QA principles Appropriate data becoming available
Research based on inappropriate data (concerned with principles) Model refinement capability based on appropriate data
Principles understood Control mechanisms established Management methodologies can absorb outputs Outputs used in setting policy
True Modelling Capability
Ongoing Refinement
Figure 10 – The Process of Evolution - dTIMS Implementation
9.2
Modelling Overview
Introduction:
The documentation accompanying the RIMS Group project contains adetailed explanation of the process. This section provides only asimple overview sufficient to support an understanding of how Transitintends to manage implementation.
The Processes:
The processes associated with a dTIMS Pavement DeteriorationModelling analysis are illustrated in Figure 11. Explanation of the management of the Transit implementation willfocus on the four key functional areas: • System Setup
• Input
• Analysis, and
• Reporting.
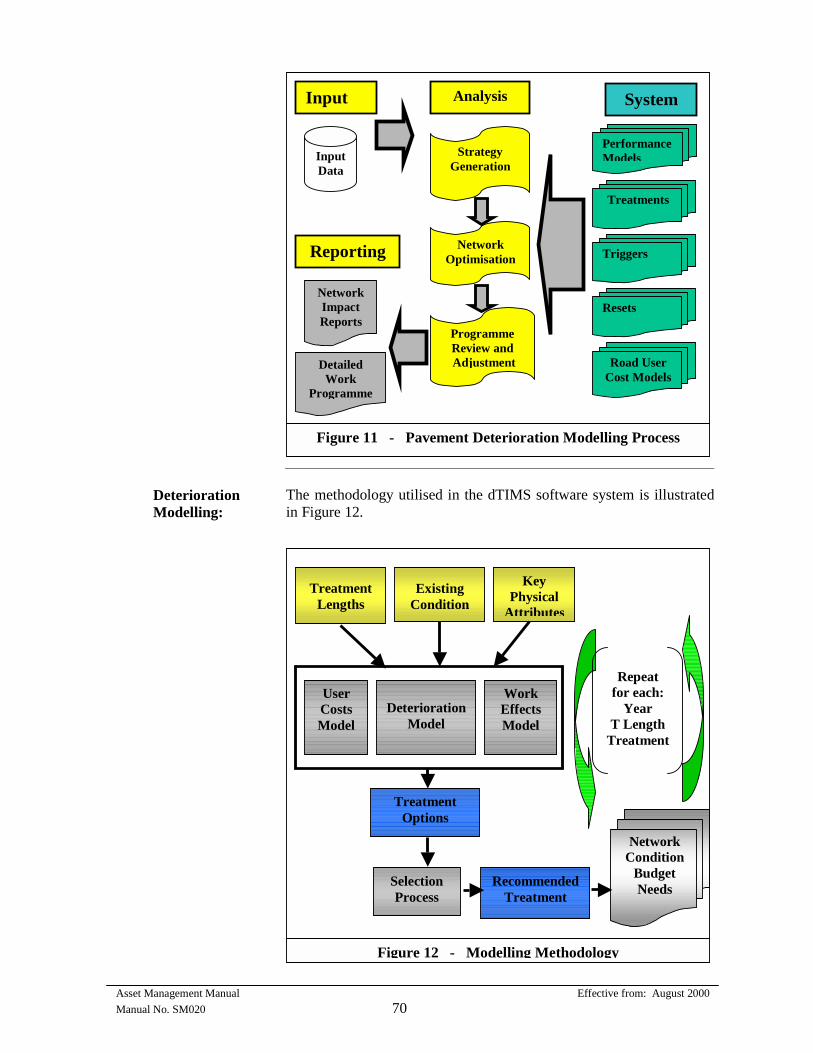
Asset Management Manual Effective from: August 2000 Manual No. SM020 70
Deterioration Modelling:
The methodology utilised in the dTIMS software system is illustratedin Figure 12.
InputData
PerformanceModels
Treatments
Triggers
Road User Cost Models
Resets
Strategy Generation
Network Optimisation
Programme Review and Adjustment
NetworkImpact Reports
Detailed Work
Programme
System Analysis Input
Reporting
Figure 11 - Pavement Deterioration Modelling Process
TreatmentLengths
Existing Condition
Key Physical
Attributes
User CostsModel
Deterioration
Model
Work EffectsModel
Treatment Options
Selection Process
Recommended Treatment
Repeat
for each:Year
T LengthTreatment
Network Condition
Budget Needs
Figure 12 - Modelling Methodology

Asset Management Manual Effective from: August 2000 Manual No. SM020 71
In simplistic terms: • A description of the existing condition and the key physical
attributes of each treatment length comprising the network is analysed against a series of mathematical models.
• These models are aware of:
- The cost to road users of operating vehicles on the network atvarying condition states.
- How the existing condition will deteriorate over time.
- Treatments available to correct this deterioration, and
- The impact that these treatments will have on condition.
• The software tests the outcome of these models for a range oftreatment options against economic principles predicting for eachcombination:
- the impact on asset condition. - the impact on agency costs, and - the impact on user costs.
• An optimisation methodology is applied to recommend a treatment
strategy for the treatment length, based on funding availability. • This process is repeated for each year of the programme and for
every treatment length on the network.
Analysis of Outputs:
The recommended treatments and impact of these on condition,agency costs, user costs, and economics are obviously sensitive to: • the validity of the data inputs, and • the degree to which the mathematical models represent reality. The outputs cannot be adopted without consideration and verificationby an expert practitioner. Section 8 describes the field assessment andvalidation process. During this process model outputs are considered against the observed insitu conditions and other data available to thepractitioner who will base his decision on all available information. The verification process may identify data anomalies or calibrationdeficiencies required to improve the validity of outputs.
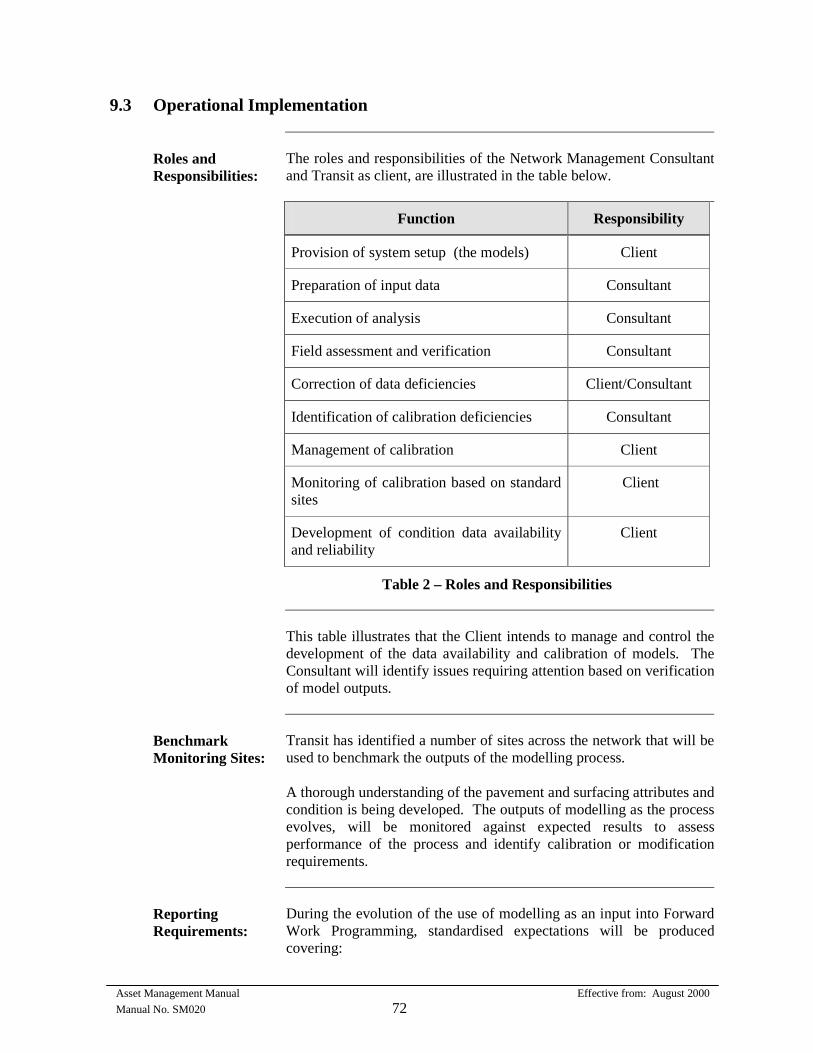
Asset Management Manual Effective from: August 2000 Manual No. SM020 72
9.3
Operational Implementation
Roles and Responsibilities:
The roles and responsibilities of the Network Management Consultantand Transit as client, are illustrated in the table below.
Function Responsibility
Provision of system setup (the models) Client
Preparation of input data Consultant
Execution of analysis Consultant
Field assessment and verification Consultant
Correction of data deficiencies Client/Consultant
Identification of calibration deficiencies Consultant
Management of calibration Client
Monitoring of calibration based on standard sites
Client
Development of condition data availability and reliability
Client
Table 2 – Roles and Responsibilities
This table illustrates that the Client intends to manage and control thedevelopment of the data availability and calibration of models. TheConsultant will identify issues requiring attention based on verificationof model outputs.
Benchmark Monitoring Sites:
Transit has identified a number of sites across the network that will beused to benchmark the outputs of the modelling process. A thorough understanding of the pavement and surfacing attributes andcondition is being developed. The outputs of modelling as the process evolves, will be monitored against expected results to assessperformance of the process and identify calibration or modificationrequirements.
Reporting Requirements:
During the evolution of the use of modelling as an input into ForwardWork Programming, standardised expectations will be producedcovering:

Asset Management Manual Effective from: August 2000 Manual No. SM020 73
• optimisation techniques • the treatment selection process • programme review and adjustment • outputs to support presentation of the forward work programme • reporting on validation work • identification of calibration needs.
Development of Expertise:
People involved in the operation of this process must be adequatelytrained. It is recognised that the development of expertise will beevolutionary. Resources involved in the preparation of input data, operation of software, and field assessment and verification, should be trained to anadvanced level. Resources considering calibration deficiencies, management ofcalibration and monitoring performance, should be expert users. Resources accepting and reviewing programmes should have at least management level training. A general knowledge of the methodologyis essential.
9.4
Budget Optimisation
Overview:
Implementation of pavement deterioration modelling provides theability to consider budget optimisation in establishing Forward WorksProgrammes. Typically, maintenance planning is based currently onprioritisation (ranking) techniques. The tools provide for predictive determination of future interventionneeds based on performance models and optimisation of these predicted needs to suit budget constraints and preferred asset conditionprofiles.
Optimisation Versus Prioritisation:
Prioritisation techniques are based on the ranking of all identifiedprojects utilising measures such as benefit cost ratio or traffic volume. Optimisation considers all potential treatments or strategies availableapplied for each year of the analysis. Thus a complex matrix oftreatments and timings is considered and optimal treatments selectedas a function of available budget and preferred condition.
Optimisation Techniques:
A number of options are available for executing the optimisationfunction. The optimisation technique to be utilised and details relatingto the method of application, is published with the documentation for Transit’s implementation.

Asset Management Manual Effective from: August 2000 Manual No. SM020 74
It is essential that these optimisation requirements are adhered to, toensure national uniformity of application of pavement deteriorationmodelling. The project documentation includes instruction on a number of other application areas where adherence is essential toensure national uniformity.
Analysis:
Optimisation techniques will be applied to investigate: • the effect of different budget levels on future network condition,
and • the effect of different budget levels on the maintenance
programme. The documentation for Transit’s implementation of pavementdeterioration modelling, details the output expectations required todemonstrate these investigations in terms of supporting the Forward Work Programme submission.
9.5
Utilisation of Outputs
Evolution:
Expectations relating to the evolutionary nature of the implementationof pavement deterioration modelling have been outlined. It is expectedthat the dependability of outputs will increase over time. Initially, outputs may be of limited value. This section establishes the intendedvision for reliable outputs.
Principal Objectives:
The outputs will be utilised to: • assist in the development of the Forward Work Programme, and • present support for the selected programme. Initially the treatments output from the optimisation process, will beconsidered as an input into establishing the Forward WorksProgramme. Having established the programme based on all available inputs, the final programme will be established within dTIMS to produce outputsquantifying the effects of this programme on network condition. Analysis of outputs for both the initial analysis and final programme,will be utilised to produce support documentation for the proposed programme. The documentation for the Transit implementation detailstechniques to be utilised and output expectations.

SECTION 10
PROJECT RANKING
Asset Management Manual 75 Effective from: August 2000 Manual No. SM020
10
PROJECT RANKING
10.0
Overview
Introduction:
Maintenance treatments drawn from Year 2 of the Forward WorkProgramme into the Annual Plan, may require further detailedconsideration before commitment.
In this Section:
This sections covers the following: Topic
See Page
10.1 Pre Commitment Verification
75
10.2 Project Ranking Methodology
76
10.3 Specific Methodologies
77
10.1
Pre Commitment Verification
Introduction:
The Forward Work Programme process does not require a detailedeconomic review of all treatments proposed. The priority indicator attached to individual treatments, is subjective and intended only toassist in the programme balancing function. Before committing works, a more detailed verification is required.The nature of this verification will depend on the nature of the work. Two methodologies are employed: • Project Justification, and • Project Ranking
Project Justification:
Comprises an economic evaluation carried out in accordance with therequirements of the Transfund Project Evaluation Manual. Transit also has standard reporting formats to be applied for some works. For example, the application of Net Present Value analysis tosupport Area Wide Treatment proposals. The specific requirements for different types of maintenance projectswill be as required by:

Asset Management Manual 76 Effective from: August 2000 Manual No. SM020
• the Transfund Project Evaluation Manual, and • Transit’s Annual Plan instructions. Where project justification analysis is required, this is a pre requisitefor inclusion in the Annual Plan.
Project Ranking:
A project ranking methodology is applied to specified treatments regardless of the outcome of the project justification analysis. The objectives of applying a ranking methodology are: a) to ensure that all potential projects are evaluated and justified in
terms of Transfund’s Work Category definitions and require-ments, and
b) to prepare a priority ranking of projects to enable deferral if the
total value of acceptable projects exceeds the total financialallocation available.
10.2
Project Ranking Methodology
The Process:
The methodology involves: • Capturing the data to support the ranking analysis. • A desk analysis of data inputs to:
- identify issues to be reviewed in subsequent stages, and - calculate a mathematical ranking based on the supporting data.
• A field inspection to review the issues identified in the desk analysis and verify the appropriateness of the mathematicalranking.
Electronic Assistance:
Transit has developed functionality within the NOMAD software toassist with mathematical ranking. The NOMAD documentation explains how this functionality is operated, the data inputs and formulae used to generate a ranking. The formulae embedded in the NOMAD software has been designedto be flexible. Transit will modify the formulae as appropriate to suitthe objectives of the ranking methodology.
Data Inputs:
The data inputs used in the ranking methodology have been selected tomatch Transit’s objectives for executing the work.

Asset Management Manual 77 Effective from: August 2000 Manual No. SM020
Ranking will only be carried out against acceptable projects whereeconomic analysis has already been executed. The objective is not to duplicate the inputs into any economic evaluation. Rather to testagainst criteria that are key to Transit’s business objectives andincentives.
10.3
Specific Methodologies
Current Application:
Ranking methodologies are currently available for: • Area Wide Pavement Treatment, and • Resurfacing. These methodologies are subject to ongoing review to suit Transit’sbusiness objectives and are therefore, not included in the text of thismanual.
The Methodologies:
A version of the methodologies is included as: • Appendix 1G – Area Wide Pavement Treatment • Appendix 1H – Resealing These will be amended from time to time with amendments beingpublished with the Annual Plan instructions. The above versions maytherefore, not be the latest available.

SECTION 11
PERFORMANCE MONITORING

Asset Management Manual Effective from: August 2000 Manual No. SM020 79
11
PERFORMANCE MONITORING
11.0
Overview
Introduction:
Historic monitoring of the performance of the asset on a consistentbasis against: • the demand placed on it that will cause it to deteriorate, and • the investment in treatments designed to counter this demand is necessary to ensure that the asset management processes areoperating effectively. This section establishes a consistent basis for collecting and storing: • demand • work inputs, and • condition outputs that will form a basis for monitoring trends over time. It is expected that the monitoring inputs will be subject to some changeas analysis methodologies develop.
In this Section:
This sections covers the following: Topic
See Page
11.1 Monitoring Objective
79
11.2 Monitoring Data
80
11.3 Monitoring Level
85
11.4 Analysis
85
11.1
Monitoring Objectives
Introduction:
This section is principally concerned with network monitoring. The objectives relate to network investment levels and the overallsustainability of service level.

Asset Management Manual Effective from: August 2000 Manual No. SM020 80
Other Monitoring Programmes:
It is necessary to establish monitoring programmes that operate at amore refined project level to satisfy specific objectives. For example: • Section 3.5 discusses a monitoring programme designed to
evaluate the effectiveness of management of the Forward WorkProgramme and the decision process used to resolve it.
• Section 9.3 explains the needs required to monitor the validity of
the mathematical models used in Pavement DeteriorationModelling.
• Monitoring programmes are also employed to gauge the effective-
ness of specific interventions. For example, the effectiveness ofthe end result sealing strategy, the performance of new treatments such as recycling, etc.
The discussion in this section does not relate to these other monitoringprogrammes.
Objectives:
The objectives of the performance monitoring programme are:
• To indicate whether investment levels are sustaining overall service needs.
• To identify trends in demand, investment levels or investmentstrategies that impact on asset performance.
• To ensure that particular investment strategies can be supported onthe basis of historic trends.
Consistency:
It is essential for historic analysis that monitoring data are historicallyconsistent. Change to the format of data or the method of collecting itwill invalidate any historic analysis. The monitoring data proposed have been, as far as possible, selected to minimise the impact of any change in collection methodologies.
11.2
Monitoring Data
Introduction:
The data to be used for historic performance monitoring is classifiedinto the following groups:
• Demand • work inputs, and • condition outputs • events.

Asset Management Manual Effective from: August 2000 Manual No. SM020 81
Discussion:
Monitoring trends in condition alone is insufficient to enable effectiveand objective analysis. Condition data must be monitored against thekey inputs that motivate changes in it, in order to understand theeffectiveness of maintenance strategies.
Analysis Period:
The analysis period for all demand data is annual. Data will bereported for the year end 30 June.
Demand:
Covering data that represents traffic and environmental demand on theasset which in turn motivates a level of investment and influences condition. Traffic demand will be based on analysis of: • AADT and • HCV counts. This data will be converted to: • VKT (vehicle kilometres travelled) and • HKT (heavy vehicle kilometres travelled) • EKT (esa kilometres travelled). Environmental demand will be represented by: • mean temperature (degrees celsius), and • total rainfall (millimetres). This data will be based on selected weather stations that arerepresentative of the network. The objective is not to localise the data.
Work Inputs:
The annual extent of maintenance work executed, obviously impactson condition and is responsive to both condition and demand. For the purpose of performance monitoring, the following will bereported:
• Net maintenance expenditure including all maintenance work activities associated with pavement and surfacing maintenanceCorridor activities will generally be excluded.
• Total kilometres resurfaced, including all resurfacing works – i.e.:
- Maintenance chip seals - Thin asphaltic concrete - Structural asphaltic concrete, and - New construction
• Total length of pavement works, including:
- Area wide pavement treatment - Rehabilitation - New construction
Work inputs will be expressed in terms of expenditure and length.
Asset Management Manual Effective from: August 2000 Manual No. SM020 82
Condition:
The condition of the pavement and surfacing component is the output resulting from demand and the extent of work inputs. The schedule of condition measures proposed represents a start pointonly. Currently insufficient data is available to monitor all outputs.For example, network data required to assess residual pavement life isonly available in selected areas, and there is no consensus on analysismethods used to derive a measure of it. The following condition measures to be monitored are scheduled inTable 3.
Events:
Any particular events that have occurred in the reporting period thatwill influence any of the monitoring data, must be noted. For example: • A particularly hot or wet season. • A change in contractor resulting in work achievement or unit rate
changes. • A change in policy – e.g.:
- increased traffic control expectations resulting in unit ratechanges.
- particular emphasis on specific deficiencies.
• Etc.
Reporting:
For each of the monitoring inputs, both the input data and the analysedperformance measure will be reported. For example, both the percentage of microtexture deficiency calculatedand the inputs: • kilometres below investigatory level, and • length of wheelpath surveyed will be reported. This is to enable aggregation of data to a networklevel.

Asset Management Manual effective from: August 2000 Manual No. SM020 83
Attribute Measure Represents Analysis Report
Smooth Travel Exposure
Structural Condition Vehicle kilometres travelled on motorways with roughness # 100 NAASRA
Vehicle kilometres travelled on urban highways with roughness < 150 NAASRA
Vehicle kilometres travelled on highways > 10,000 vpd with roughness < 110 NAASRA
Vehicle kilometres travelled on highways 4,000 - 10,000 vpd with roughness < 120 NAASRA
Vehicle kilometres travelled on highways 1,000 – 4,000 vpd with roughness < 130 NAASRA
Vehicle kilometres travelled on highways < 1,000 vpd with roughness < 150 NAASRA
VKT
Roughness
Smoothness Measure
Structural Condition Length of motorways with roughness < 100 NAASRA count NAASRA
Length of urban highways with roughness < 150 NAASRA
Length of highways > 10,000 vpd with roughness < 110 NAASRA
Length of highways 4,000 to 10,000 vpd with roughness < 120 NAASRA
Length of highway 1,000 to 4,000 vpd with roughness < 130 NAASRA
Length of highways under 1,000 vpd with roughness < 150 NAASRA
Divided by the total length of all state highways in the network; And
Expressed as a percentage and total kilometres.
KM
Rutted Length 30mm
Structural Condition Kilometres of wheelpath rutting > 20mm depth
Divided by kilometres of wheelpath in the Network, and expressed as a percentage.
% Rutting
Rutted Length 10mm
Safety Kilometres of wheelpath rutting > 10mm depth.
Divided by kilometres of road lane in the Network, and expressed as a percentage.
%
Texture Flushing Safety of Surfacing Kilometres of wheelpath with texture < 0.5mm depth.
Divided by kilometres of wheelpath in the Network, and expressed as a percentage.
%
Skid Resistance
Microtexture Safety of Surfacing Kilometres of wheelpath below the investigatory level.
Divided by the length of wheelpath surveyed.
Reported as a percentage.
%
* The hierarchies used to establish this table, are defined by the NSHS
Table 3 – Condition Measures
Asset Management Manual 85 Effective from: August 2000 Manual No. SM020
11.3
Monitoring Level
Introduction:
Performance monitoring targets the network level. However, analysis and reporting will be carried out at a more refined level to ensure thatall of the objectives can be met.
Analysis Level:
Analysis will be carried out at the link level. Links are defined in theNational State Highway Strategy. Each link will be uniquely identified and reported with the appropriate State Highway and Region reference, and road class as per the National State Highway Strategy.
11.4
Analysis
Introduction:
All reported data will be compiled into a suitable database to enable detailed analysis as required. Generally such detailed analysis will betriggered by exceptions appearing in the national analysis. This section describes only the standard analysis that will be executedand presented annually. This analysis is principally required for inclusion in the Asset Management Plan.
Standard Analysis Level:
The standard analysis will be presented for: • the entire network, and’ • for each road class.
Analysis Methodology:
The results will be presented on a series of multi axis graphs. A graph for the entire network and one for each of the road classes will be maintained for each of the analyses indicated in Table 3. In all cases, the X axis will be time.

Asset Management Manual 86 Effective from: August 2000 Manual No. SM020
Analysis Y Axis Data Unit
Structural Condition
Smoothness Measure
Rutted Length 20mm
EKT
Total Rainfall
Net Maintenance Expenditure
Pavement Works
Percentage
Percentage
EKT
Mm
$ /km
Percentage
Surfacing Condition
Flushing
Microtexture
VKT
Resurfacing Works
Percentage
Percentage
VKT
Percentage
State of Health Yet to be resolved.
Local Analysis:
It is expected that similar analysis will be carried out locally. The trends indicated in local analysis should be used to: • consider the appropriateness of the Forward Work Programme, and• to support the Annual Plan submission particularly when preparing
the network condition report required with the submission.

SECTION 12
FUTURE DEVELOPMENTS

Asset Management Manual 87 Effective from: August 2000 Manual No. SM020
12
FUTURE DEVELOPMENT
The Pavement Maintenance Management Manual is a document which is intended to be continuously improved. This will occur as more people use and understand the process and refine it to suit their own environment. Short term development will focus initially on the following areas: • Pavement Deterioration Modelling – development of specific requirements relating to the
adoption of the evolutionary treatment intelligence methodology. • Establishment of electronic linkage between the output of dTIMS and the NOMAD software.
Pavement deterioration Modelling outputs will be adopted electronically as scenarios in the NOMAD software.
• Further development of Key Performance Measures in the Performance Monitoring area.

APPENDICES
APPENDICES The Appendices to Chapter 1 are:
Appendix Contains Manual Reference
1A Treatment Intelligence – Data Analysis – Flow Charts
7.13 8.2 8.3
1B Treatment Intelligence – Data Analysis – Worked Example
7.13 8.2 8.3
1C P 17 Reseal Treatment Selection 4.7
1D Table of Treatments 4.1
1E Table of Maintenance Intervention Strategies 6.1
1F NOMAD Software Functionality 4.9
1G Area Wide Pavement Treatment Prioritisation 10.3
1H Reseal and Rehabilitation Prioritisation 10.3
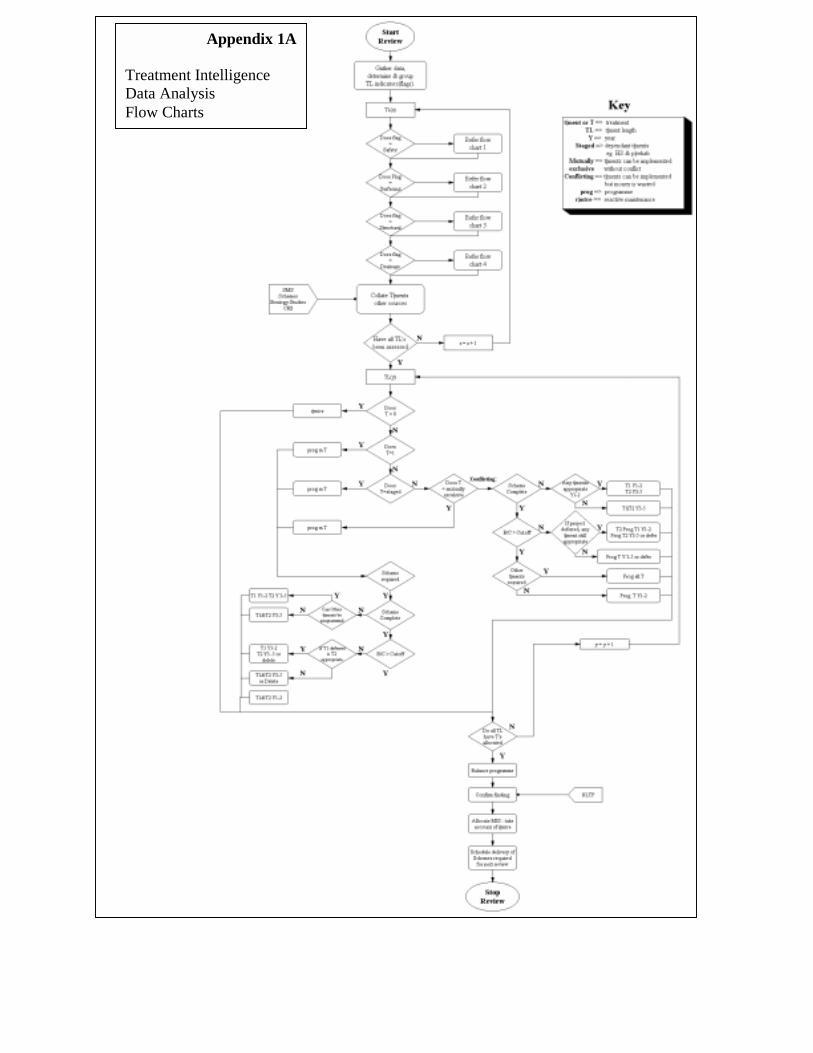
Appendix 1A Treatment Intelligence Data Analysis Flow Charts
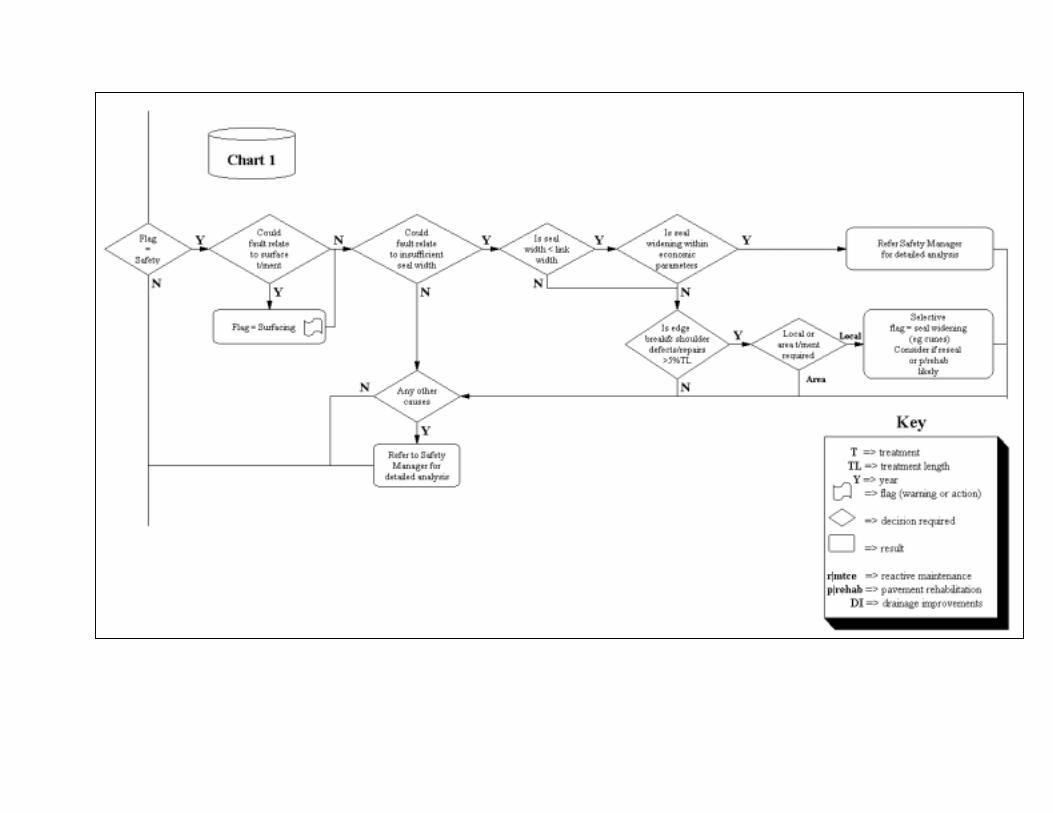
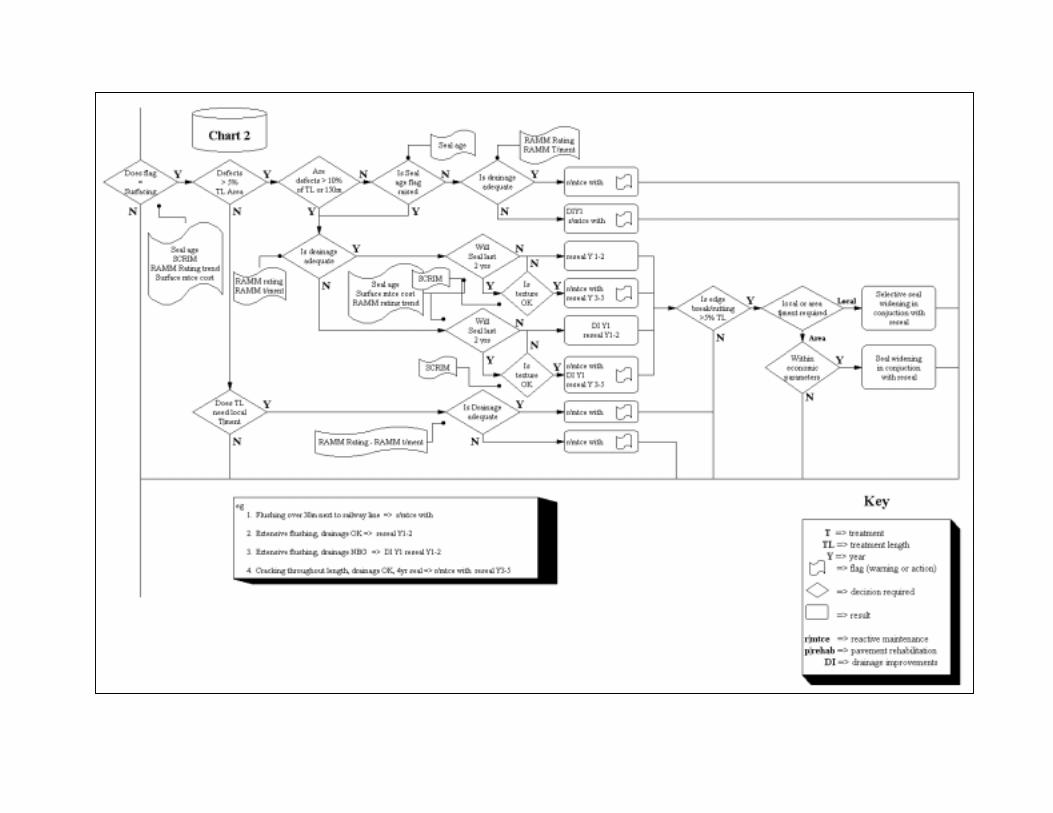
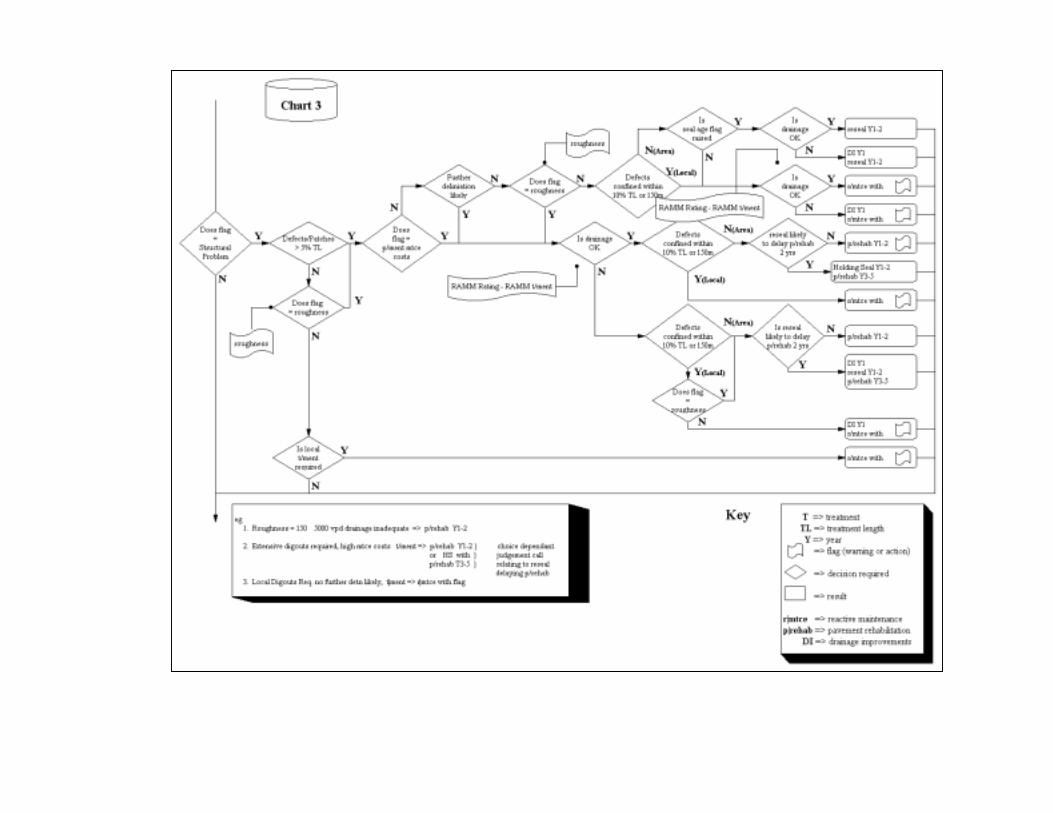


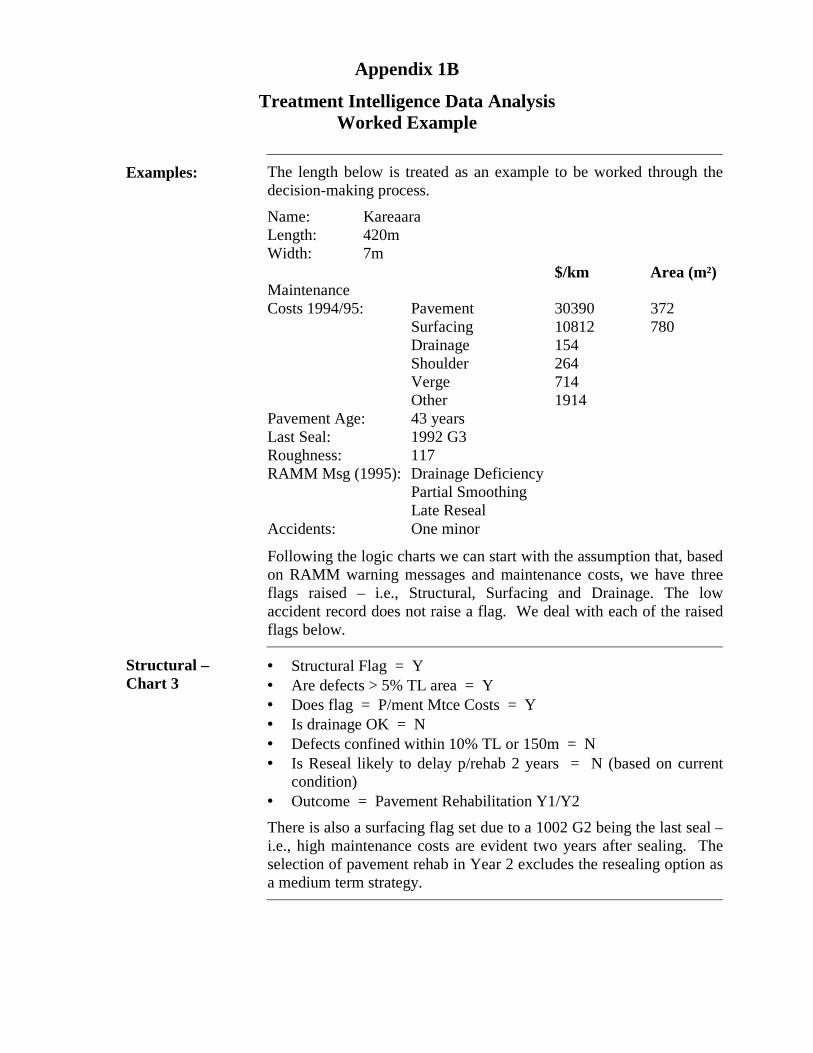
Appendix 1B
Treatment Intelligence Data Analysis Worked Example
Examples: The length below is treated as an example to be worked through the
decision-making process.
Name: Kareaara Length: 420m Width: 7m $/km Area (m²)Maintenance Costs 1994/95: Pavement 30390 372 Surfacing 10812 780 Drainage 154 Shoulder 264 Verge 714 Other 1914 Pavement Age: 43 years Last Seal: 1992 G3 Roughness: 117 RAMM Msg (1995): Drainage Deficiency Partial Smoothing Late Reseal Accidents: One minor
Following the logic charts we can start with the assumption that, basedon RAMM warning messages and maintenance costs, we have three flags raised – i.e., Structural, Surfacing and Drainage. The lowaccident record does not raise a flag. We deal with each of the raisedflags below.
Structural – Chart 3
• Structural Flag = Y • Are defects > 5% TL area = Y • Does flag = P/ment Mtce Costs = Y • Is drainage OK = N • Defects confined within 10% TL or 150m = N • Is Reseal likely to delay p/rehab 2 years = N (based on current
condition) • Outcome = Pavement Rehabilitation Y1/Y2 There is also a surfacing flag set due to a 1002 G2 being the last seal –i.e., high maintenance costs are evident two years after sealing. Theselection of pavement rehab in Year 2 excludes the resealing option asa medium term strategy.

Appendix 1C
P 17 Performance Based Resealing Specification Treatment Selection Requirements
Introduction The P 17 resealing specification is a performance based specification. It specifies the end result texture requirements at the end of a twelve month maintenance period, leaving design and method details for resolution by the Contractor. Selection and specification of a treatment that will not compromise the Contractor’s ability to achieve the twelve month texture requirement, is critical. This document outlines considerations that must be applied in selecting the treatment. It also confirms the roles and responsibilities of the parties involved. Reseal Design versus Treatment Selection An explanation of an understanding of these work elements will assist with understanding the issues outlined. Treatment Selection The treatment selection process resolves what treatments will be carried out to ensure cost effective life cycle maintenance of the network. At the highest level, the definition of treatments will differentiate between, for example, routine maintenance, resealing, recycling, rehabilitation, etc. Typically, the Ten Year Forward Work Programme will identify treatment needs at this level at Year 4 and beyond. Treatments must be defined at a refined level in Years 1, 2 and 3. In particular, Year 2, which forms the basis for the current annual plan submission must be very refined. By Year 2 treatment selection for resealing works must differentiate between, for example, thin surfacing mix (by depth – thin overlay versus structural), chip grade (for single chip grade reseals), two coat seal, racked in seal, sandwich seal etc. Inputs into resolving treatment selection are detailed fully in the Asset Maintenance Management Manual. Some guidance on inputs that should be considered in refining reseal treatment needs is given below. Inputs include, for example, layer stability, surface hardness, traffic demand, etc. This part of the process is performed by the Consultant.

Reseal Design The reseal design process is associated with designing the construction elements to provide the selected treatment given site conditions, material inputs and environmental factors. The design process outputs include: • Pre reseal treatments (texturising, burning etc) • Binder application rates • Kerosene content • Adhesion agent • Rolling requirements • Etc Note that included in this part of the process are elements that the P4 specification includes, but which are not specified in P17. Design inputs described in RD286 are also included but elements of treatment selection are excluded. This part of the process is performed by the Supplier. Intent of the P17 Specification The P17 specification was implemented to apportion responsibility/risk in a more equitable manner than provided for under P4, and to provide an environment to encourage innovation. The intent was to move away from a method-specified contract with a 48 hour maintenance period to a position of defining outputs and achieving a reasonable warranty period. It was never intended that responsibility for the adequacy of the treatment selection process would be transferred to the supplier in applying the selected treatment. It was intended that responsibility for the design and construction of the specified treatment would be transferred to the supplier. Accordingly the P17 specification excludes specification of any inputs that may affect the acceptability of the end product given the adequacy of the treatment selection. The P17 specification does specify the binder type to be used. This input is specified on the basis that binder selection has long term performance ramifications that extend well beyond the P17 maintenance period. It was also intended that the Consultant had responsibility for determining the correct treatment selection in relation to the existing pavement condition, and considering a design life that was both reasonable and achievable.
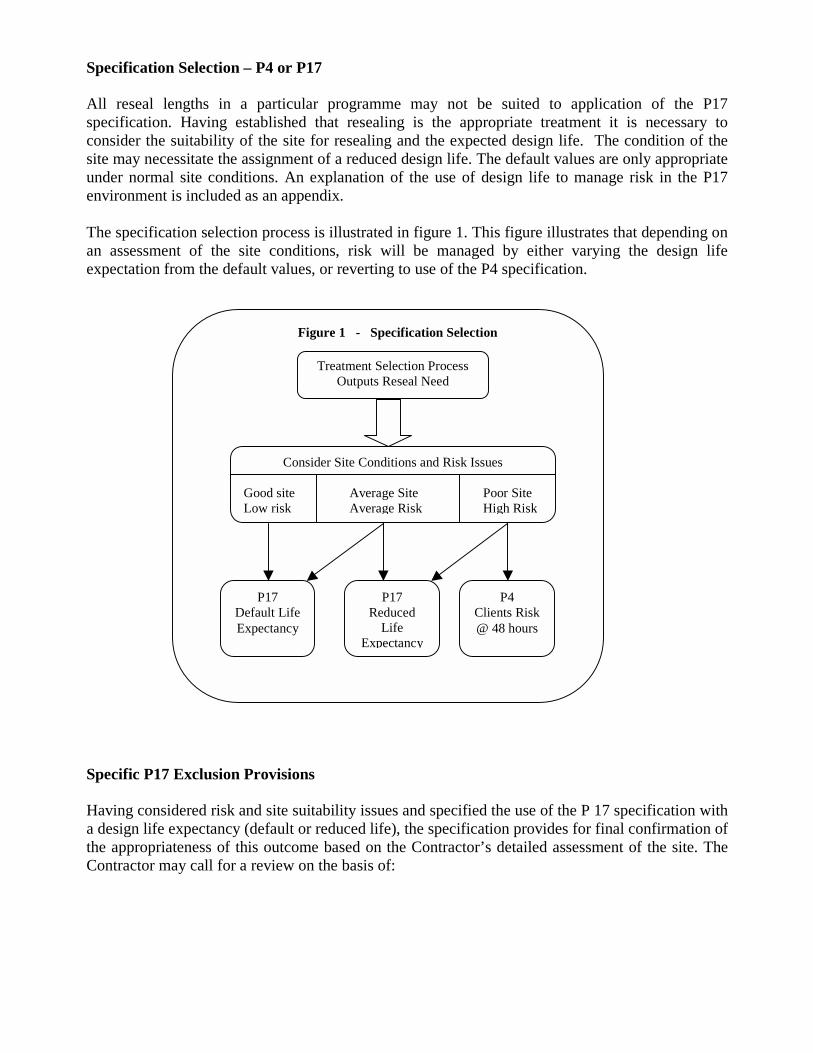
Specification Selection – P4 or P17 All reseal lengths in a particular programme may not be suited to application of the P17 specification. Having established that resealing is the appropriate treatment it is necessary to consider the suitability of the site for resealing and the expected design life. The condition of the site may necessitate the assignment of a reduced design life. The default values are only appropriate under normal site conditions. An explanation of the use of design life to manage risk in the P17 environment is included as an appendix. The specification selection process is illustrated in figure 1. This figure illustrates that depending on an assessment of the site conditions, risk will be managed by either varying the design life expectation from the default values, or reverting to use of the P4 specification.
Specific P17 Exclusion Provisions Having considered risk and site suitability issues and specified the use of the P 17 specification with a design life expectancy (default or reduced life), the specification provides for final confirmation of the appropriateness of this outcome based on the Contractor’s detailed assessment of the site. The Contractor may call for a review on the basis of:
Treatment Selection Process Outputs Reseal Need
P17 Default Life Expectancy
P17 Reduced
Life Expectancy
P4 Clients Risk @ 48 hours
Figure 1 - Specification Selection
Consider Site Conditions and Risk Issues Good site Average Site Poor Site Low risk Average Risk High Risk
• Surface Hardness based on detailed assessment using the ball penetration test method.
Discussion The expectation is that the Consultant will have carried out an assessment based on the principles illustrated in Figure 2 and the acceptability of the entire site will have received adequate consideration. The Contractors re assessment should be regarded as a confirmation of the acceptability of the entire site. The Contractor will generally focus on the acceptability of patches within the site.
• Surface Texture based on the texture measurement carried out for application rate design
purposes. Discussion It is expected that the Consultant will have considered texture in a general context using visual inspection and the high speed data texture measurements in selecting the chip size. The Contractor’s detailed assessment should generally confirm the appropriate-ness of the selected chip size, but may identify local texturising needs.
• Traffic Stress based on expert knowledge.
Discussion It is expected that the Consultant will have considered traffic stress in specifying the type of treatment. The inclusion of this exclusion clause is necessary in risk management terms. Extensive use of it should be regarded as a deficiency in the application of the philosophies outlined in this memo.
Economics Economic consideration plays a key role in resolving treatment selection. For example, a reseal with a short design life may be programmed as area treatment on economic grounds. It is essential that design life modifications applied after finalisation of the annual plan and resealing schedule result in a review of the forward work programme – i.e., a follow up economic test. This should confirm the economic appropriateness of proceeding with resealing if the design life is modified based on the exclusion provisions of the P17 specification. Failure to achieve cost effective implementation of the P17 specification, and possible long term changes in resealing rates under this specification, will have an impact on the economic processes associated with treatment selection. The incentives to ensure that the specification is implemented without undue extra cost are significant. However it should also be noted that there is no provision for the treatment selection to be placed in the “high risk” category (thereby increasing the Contractors risk) simply because the available funds do not match the most appropriate treatment.

Roles and Responsibilities The roles and responsibilities of the Contractor and Consultant in terms of the issues covered in this memo are illustrated in Figure 2. Application of the principles outlined using the methodology illustrated in the figure should ensure that the identified operational deficiencies associated with the P17 specification are overcome. Obviously these operational concerns relate almost exclusively to site acceptance and risk transfer. In Figure 2, functions that are shaded are those that are the responsibility of the Contractor. The non-shaded functions are those that are the responsibility of the Consultant.
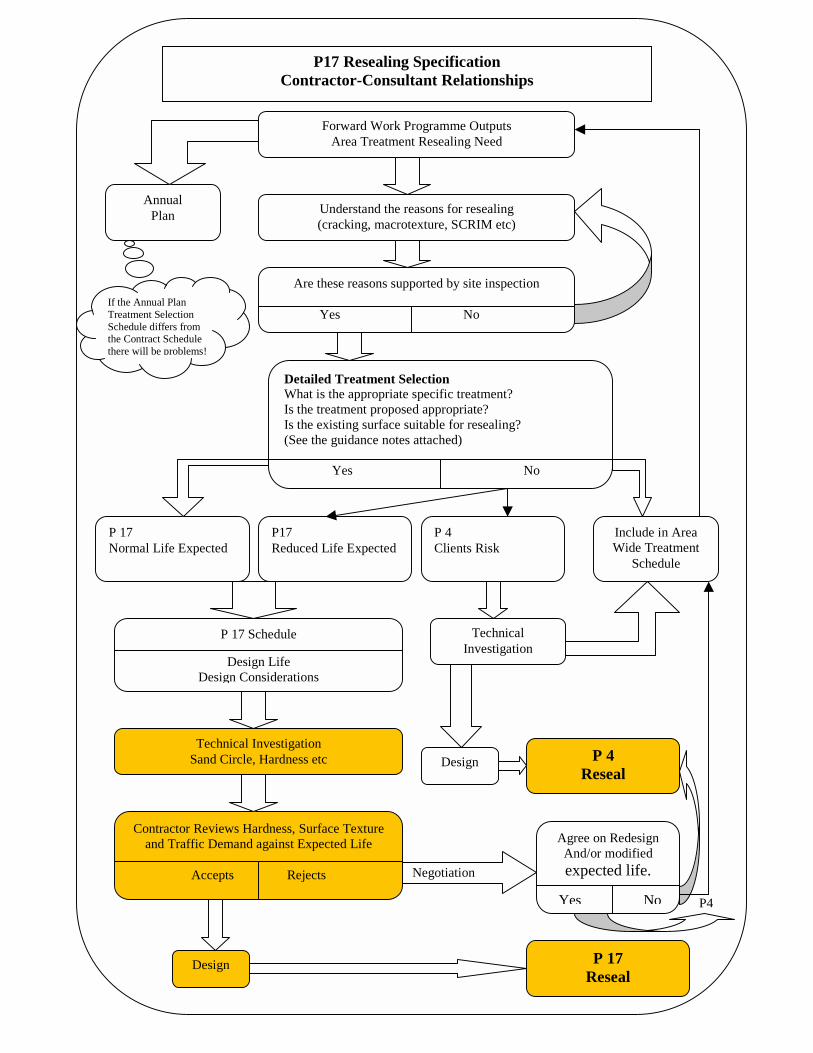
P17 Resealing Specification Contractor-Consultant Relationships
Forward Work Programme Outputs Area Treatment Resealing Need
Detailed Treatment Selection What is the appropriate specific treatment? Is the treatment proposed appropriate? Is the existing surface suitable for resealing? (See the guidance notes attached)
Yes No
P 17 Normal Life Expected
Include in Area Wide Treatment
Schedule
P 17 Schedule
Design Life Design Considerations
Contractor Reviews Hardness, Surface Texture and Traffic Demand against Expected Life
Accepts Rejects
P 17 Reseal
Negotiation
Agree on Redesign And/or modified expected life.
Yes No
P 4 Reseal
Understand the reasons for resealing (cracking, macrotexture, SCRIM etc)
P17 Reduced Life Expected
P 4 Clients Risk
Technical Investigation Sand Circle, Hardness etc
Technical Investigation
Design
Design
Annual Plan
If the Annual Plan Treatment Selection Schedule differs from the Contract Schedule there will be problems!
Are these reasons supported by site inspection
Yes No
P4
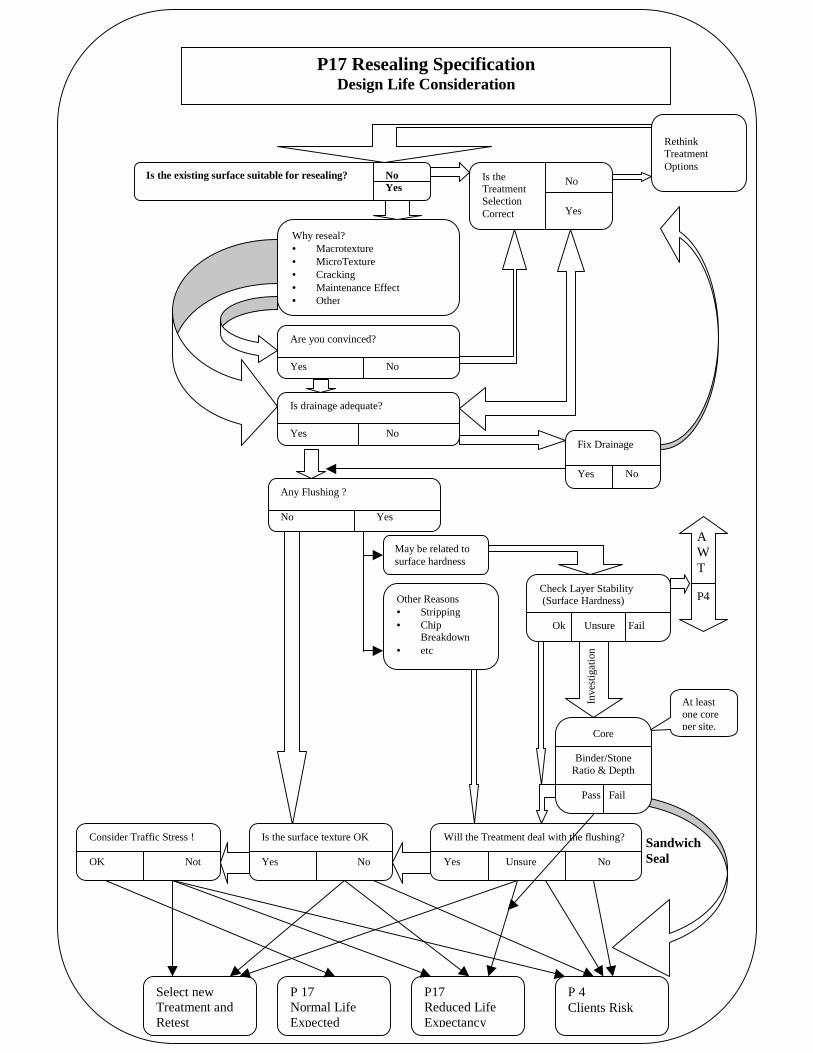
P17 Resealing Specification Design Life Consideration
Rethink Treatment Options
Why reseal? • Macrotexture • MicroTexture • Cracking • Maintenance Effect • Other
Are you convinced? Yes No
P 17 Normal Life Expected
P17 Reduced Life Expectancy
P 4 Clients Risk
Is drainage adequate? Yes No
Fix Drainage Yes No
Check Layer Stability (Surface Hardness)
Ok Unsure Fail
Inve
stiga
tion
At least one core per site.
May be related to surface hardness
Other Reasons • Stripping • Chip
Breakdown • etc
Any Flushing ? No Yes
Sandwich Seal
Will the Treatment deal with the flushing? Yes Unsure No
Core
Binder/Stone Ratio & Depth
Pass Fail
Is the surface texture OK Yes No
Consider Traffic Stress ! OK Not
Is the Treatment Selection Correct Yes
No
Select new Treatment and Retest
AWT
P4
Is the existing surface suitable for resealing? NoYes

Appendix 1 Design Life Considerations
Consideration and specification of appropriate design life expectations should be regarded as the most effective method of managing risk associated with performance based resealing. For example, the provisions of clauses 4.2, 4.3 and 4.4 of the P17 specification relating to the exclusion provisions where alternative acceptance criteria may be agreed should generally be implemented through a change in the specified design life. Modification to the specific performance criteria can only be based on fully reasoned arguments. For example, it will not generally be possible to modify the texture depth formula to suit a specific site. It may, however, (for example) be appropriate to agree to waive the texture depth requirement on specific areas within the reseal length where, for example, there are localised soft patches. A reduction in design life results in a reduction in the texture depth requirement at the twelve month inspection. Resolution of design life is subjective and very sensitive to regional factors. The default values assumed in the development of the P17 specification have been taken from those used in the RAMM system. These are appropriate in terms of national averages where substrate conditions are adequate for resealing. However, it must be emphasised that they are averages, deviations can be expected in different regions or in areas within a region. They are entirely inappropriate where substrate conditions are inadequate or marginal. This appendix identifies factors to be considered when assessing a specific design life. The list is not intended to be exhaustive but rather, to act as a starting point. It is expected that local analysis of historic reseal performance will be essential to refine assessments. Also, expert input will be required to specify them adequately. Review of the deterioration rate assumptions used to derive the performance requirements used in the specification, confirms that this rate is conservative. That is, that the “normal” service expectation will produce a profile depth that is greater than that which would be derived from the formulae. Checklist of Factors to Consider: Drainage
A reseal cannot be expected to perform adequately if there is inadequate pavement drainage provided. Rutting
Wheel track rutting will almost always be present on reseal lengths. The decision to repair it prior to resealing will be based on safety (risk of aquaplaning if water is ponding) or economics (impact on reseal, time before rehabilitation etc.) Obviously it is not possible to repair all rutting as part of the resealing strategy. We are not attempting to bring pavements back to new condition as part of a resealing programme. However, if layer instability is considered to be the cause of the rutting this will affect the life of a reseal in which case it will be necessary to review the expected reseal life, or consider sealing under the P4 specification.

Layer Stability and Binder/Stone Ratio
The process of applying seal layers to the pavement structure results in the creation of a matrix of seals that eventually acts as a bitumen bound mix similar to a gap-graded bitumen macadam with high binder content. These materials are characterised by a high binder volume, high air void volume and low stone content. Binder volumes are typically 15-20 percent and air voids can be 5-15 percent. Single sized stone makes up the balance, often being a mix of various grades of sealing chip. These layers of binder filled chip have minimal resistance to deformation, with the result that any new layers of chip seal are rapidly embedded into the underlying layer and so causing flushing. Some mechanisms associated with this process, in the context of surface flushing resulting from layer instability are detailed more fully in the publication “Pavement Area Treatment – Options and Experiences in Hawkes Bay and Gisborne, 1995 to 1998” published in 1998. This publication also details design considerations for the permanent correction of layer stability problems. Reseals applied to an increasing depth of underling seals will not achieve the same life experienced with previous seals due to the embedment process. Where flushing is the failure symptom and layer stability is a cause, demonstrated through pavement hardness testing and core thickness, a conventional reseal can only be regarded as a holding seal with an extremely short life expectation (1 to 3 years depending on the extent of flushing). A sandwich seal will provide some extent of correction of the binder/stone ratio and a reasonable life can be expected. Experience to date indicates that 4 to 6 years may be achieved. The maximum binder volume that can be corrected with a sandwich seal is currently believed to be about 20 percent. Flushing
As detailed above, if flushing is associated with layer stability issues short life must be the default unless specifying a sandwich seal, see above. Flushing associated with other factors (stripping, chip breakdown, excessive binder on previous seal etc) may have an effect on design life depending on its extent and the treatment proposed. If special treatments are proposed they should be assessed economically in terms of design life differentials. Any treatment applied to a flush surface should target a design that will minimise binder enrichment effects on the long term layer stability. Sealing History
Irrespective of layer stability issues, the previous history of reseals on the site will provide some indication of what can be expected from a subsequent layer. Consider for example previous seal cycles, the mix of chip sizes underlying the surface and the life achieved from previous reseal. Traffic Stress
Consider carefully the realistic life that can be expected from a seal under abnormal traffic stress. Default lives are associated with normal traffic stress.
Appendix 1D
Table of NOMAD Treatments
Standardisation of treatment codes used in the Forward Work Programme is necessary to facilitate national aggregation of programmes and development of network summaries. The treatments detailed in the following table will be used as the base set for the development of programmes. Any amendment to treatments available will be approved by Transit’s Asset Systems Engineer. The following understandings apply to the assignment of treatments in the programme and the use of the treatment codes in the NOMAD software: 1. The Asset Management Manual explains programme accuracy expectations and the level of
detail expected in the different years of the programme. 2. The manual confirms an expectation that:
• Year 1 of the programme represents work in progress. Treatments indicated in the programme will be the actual treatment – and thus described in detail.
• Year 2 is a firm recommendation. A similar level of detail is expected. For example,
resurfacing should be at the level of detail expected from the P 17 treatment selection process – the chip grade and type of reseal will be indicated.
• Years 3 to 10 represent a reasonable assessment. The treatments will be identified by type.
For example – resurfacing, multiple chip sizes expected.
• Years 11 to 20 represents an intuitive assessment and treatments will only be identified at a generic level – for example, resurfacing.
3. It is therefore not expected that the programme would indicate:
• A reseal in Year 6 compromising a two coat wetlock Grade 4 on a Grade 2. • Slurry sealing in Year 12.
4. Some overlap is acceptable in Years 3 and 4. In these years, identification of the detailed
treatment as a first cut assessment is acceptable. 5. Pre treatments such as pavement burning, drainage maintenance, etc., are not expected beyond
Year 5 in the programme.

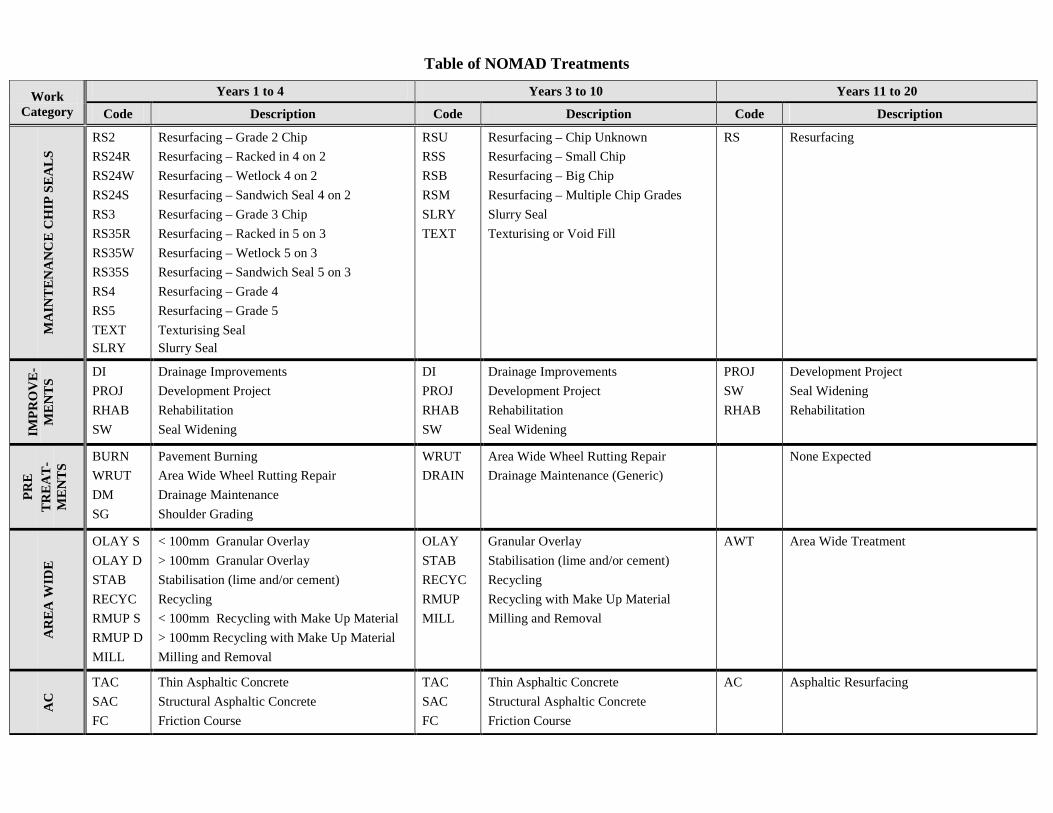
Table of NOMAD Treatments
Years 1 to 4 Years 3 to 10 Years 11 to 20 Work Category Code Description Code Description Code Description
M
AIN
TEN
AN
CE
CH
IP S
EA
LS
RS2 RS24R RS24W RS24S RS3 RS35R RS35W RS35S RS4 RS5 TEXT SLRY
Resurfacing – Grade 2 Chip Resurfacing – Racked in 4 on 2 Resurfacing – Wetlock 4 on 2 Resurfacing – Sandwich Seal 4 on 2 Resurfacing – Grade 3 Chip Resurfacing – Racked in 5 on 3 Resurfacing – Wetlock 5 on 3 Resurfacing – Sandwich Seal 5 on 3 Resurfacing – Grade 4 Resurfacing – Grade 5 Texturising Seal Slurry Seal
RSU RSS RSB RSM SLRY TEXT
Resurfacing – Chip Unknown Resurfacing – Small Chip Resurfacing – Big Chip Resurfacing – Multiple Chip Grades Slurry Seal Texturising or Void Fill
RS Resurfacing
IMPR
OV
E-M
ENTS
DI PROJ RHAB SW
Drainage Improvements Development Project Rehabilitation Seal Widening
DI PROJ RHAB SW
Drainage Improvements Development Project Rehabilitation Seal Widening
PROJ SW RHAB
Development Project Seal Widening Rehabilitation
PRE
TRE
AT-
MEN
TS BURN
WRUT DM SG
Pavement Burning Area Wide Wheel Rutting Repair Drainage Maintenance Shoulder Grading
WRUT DRAIN
Area Wide Wheel Rutting Repair Drainage Maintenance (Generic)
None Expected
A
REA
WID
E
OLAY S OLAY D STAB RECYC RMUP S RMUP D MILL
< 100mm Granular Overlay > 100mm Granular Overlay Stabilisation (lime and/or cement) Recycling < 100mm Recycling with Make Up Material > 100mm Recycling with Make Up Material Milling and Removal
OLAY STAB RECYC RMUP MILL
Granular Overlay Stabilisation (lime and/or cement) Recycling Recycling with Make Up Material Milling and Removal
AWT Area Wide Treatment
A
C TAC
SAC FC
Thin Asphaltic Concrete Structural Asphaltic Concrete Friction Course
TAC SAC FC
Thin Asphaltic Concrete Structural Asphaltic Concrete Friction Course
AC Asphaltic Resurfacing

Appendix 1E
Table of Maintenance Intervention Strategies
It is desirable that maintenance intervention strategies are presented with some extent of national uniformity. It is recognised that it is expected that significant innovation is expected in the development of the strategies and the specific work instruction guidance that they provide. Also that the strategies must be tailored to local conditions, issues and environments. The following schedule presents a list of strategies that should be common to all networks. A general description of where the strategy would be applied and the types of constraints that may be appropriate, are provided. Specific detailed work instructions are not included. 1. General Maintenance
This strategy applies to the majority of the network where repairs are programmed and undertaken in accordance with the standard specifications and budgetary constraints.
2. Pre Reseal Maintenance
This strategy applies to all treatment lengths that are due to be resealed in Year 1 of the programme. All known repairs are to be completed prior to 30 April of the current year and any additional repairs and remedial works completed prior to 30 September of Year 1. All repairs are to be designed to last the life of the reseal and that any drainage maintenance is required to be completed prior to the reseal.
3. Unsealed Pavements
This is the general maintenance required to maintain an unsealed pavement. It should include the pre and post winter re-grading.
4. Holding Maintenance
When a pavement treatment of capital works improvement is programmed in Year 2 or with the client’s authorisation in Year 3 of the Forward Work Programme, then this strategy may be applied. It is the minimum acceptable levels of repair to maintain the pavement at a safe level. The repairs may be designed with a shorter life and shallow pavement depth repairs types and surface treatments are encouraged. This strategy requires sign off by the road controlling authority as it does carry a certain level of increased risk in terms of safety and the potential damage to the pavement if the future project is delayed.

5. Post Works Maintenance
Following the completion of capital works projects or pavement treatments, the requirement for pavement and drainage maintenance should be dramatically reduced. Any works programmed in a length under this strategy, should be brought to the client’s attention because of the potential for latent defect liability claims to be investigated.
6. Special Lengths
This is reserved for lengths of the highway in which the pavements are unusual. These include but are not limited to the following: • Bridges at the point of being posted • Experimental pavements or seals
• Areas of special scientific interest.
Appendix 1F
NOMAD Forward Work Programme Management Software
Schedule of Principal Functionality
Features of NOMAD NOMAD (National Optimisation of Maintenance Allocation by Decade) is the repository for the Ten Year Forward Works Programme (TYP or FWP). It does have some simple candidate treatment identification capabilities but it will not be replaced by dTIMS; rather it will complement dTIMS by storing and allowing comparisons between the outputs of different scenarios and strategies. It is the output for dTIMS and the functional area where the practitioner adds value to the process. NOMAD has three main areas: • Core functions of FWP management; • Support functions such as condition data summarisation; and • Functions to assist with the Annual Planning process. Core Functions • Initial definition of Treatment Lengths from surfacing records. • Treatment Length maintenance – splitting, joining, inserting new Treatment Lengths. • Attaching proposed treatments and reasons for those treatments to Treatment Lengths. • Attaching Maintenance Intervention Strategies (MIS) and Safety Intervention Strategies (SIS) for
the day-to-day maintenance management of Treatment Lengths. • Attaching notes to Treatment Lengths. These functions require support tables that hold definitions of treatments, reasons, etc. • The Cost Set table defines the unit cost of treatments and routine maintenance for a Treatment
Length assigned to it. Each Treatment Length must be assigned to a Cost Set, and there may be many Cost Sets in a database such as for a particular contract area or type of road.
• The Treatment table defines what RCA-defined Treatment Group (e.g. Pavement, Surfacing etc)
and Transfund Funding Group (e.g. Maintenance Chip Seals, Rehabilitation etc) the treatment belongs to (to break down the reporting of cost into work or funding categories). It also defines a life for the treatment, a Routine Maintenance Cost Estimation (RMCE) curve reset and the MIS to use the year of and the year preceding the treatment, if necessary (e.g., a Reseal treatment might have an MIS of “Pre-Reseal Repairs” the year before the treatment and “Normal Maintenance” the year of the treatment). These three elements are used in calculating the yearly cost of the TYP.

• The Reason, Maintenance Intervention Strategy, Safety Intervention Strategy, Funding Group and Treatment Group tables contain the definitions for each of these elements. The MIS table also contains unit cost information by Cost Set.
Additions to any of these tables can be made as necessary. Support Functions
Treatment Selection Algorithm (TSA) The TSA can suggest treatments based on condition data and maintenance costs.
Treatment Length Summarise This function summarises spatial data such as surfacing data, manual rating data or high-speed survey data into a single value for the Treatment Length, such as a single surface date, average texture depth, average SCRIM value etc. Exception Reporting Exception reporting is the use of a powerful filter to identify abnormally performing Treatment Lengths. These are flagged and a report can be run to list them. Reports Reports detailing lengths that have been identified by exception reporting, lengths with a MARG score and lengths that have failed to have a MARG score calculated can be produced. A report detailing the entire TYP can be generated.
Load, Unload and Client Review The consultant constructs the FWP and supplies this programme to the client. Any changes made to treatment lengths by the consultant are also updated in the client’s database when the programme is loaded. When the consultant constructs the programme, all the treatments have a status of “Proposed”. After the client loads the programme, they start a review on it. The client cannot directly edit the current programme; the consultant must do this. The client marks the treatments either “OK” or “Please Revise” and can add notes on reasons or instructions to the consultant. This programme is then returned to the consultant who makes the changes or adds notes justifying their original recommendation. If the consultant changes a treatment it now has a status of “Changed”. This process continues until the client is satisfied with the programme, and therefore all treatments have a status of “OK”. When either party unloads a programme, it becomes locked in their database to avoid any data being lost when the new programme is loaded. Programmes can be copied and then modified to create scenarios that can be compared against each other for performance and cost. More than one programme can be unloaded or loaded at a time, so these scenarios can also be supplied to the client by the consultant in an unload.
Programmes can also be archived to save space – the programme is not saved but the cost information is.
Functions to assist with the Annual Planning Process Cost Management The annual cost of the TYP is calculated from two areas: • Where a treatment length has a treatment planned, the cost of the work and any ancillary work
(such as pre-reseal repairs before a reseal); and • The routine maintenance cost where there are no treatments planned. The cost of a treatment and MIS on a Treatment Length is determined by the Cost Set that the Treatment Length is attached to. The routine maintenance cost is estimated by using the RMCE curve that is also attached to the Cost Set. • An RMCE curve describes the pavement and surfacing components of the routine maintenance cost
progression of over the life of a road. This cost is only applied when there is no treatment or MIS attached to a treatment is planned for a year.
• Any number of RMCE curves can be developed – for example there could be one for recycled sites,
one for asphaltic concrete pavements and one for chipseals in the same database. • Each cost set also has an overhead cost to cover cyclic maintenance such as vegetation control and
litter removal. • The cost of routine maintenance is calculated using previous maintenance costs to establish the
starting position on the curve and then progressed until reset by treatments or overridden by MIS costs.
The cost Forward Work Balancing window summarises the costs into treatments, treatment groups or funding groups for each year of the TYP. Two scenarios can be compared, and budget targets can be entered against the programme cost. Prioritisation The MARG (Maintenance Allocation Review Group) weighting was developed to assist with the prioritisation of the next year’s reseal and pavement treatment lengths. At present there are two indexes: • The Reseal Index, where a score is based mainly on surfacing characteristics; and • The Pavement Area Treatment Index, where a score is based mainly on pavement characteristics.

These indexes draw mainly condition data from RAMM and a score is calculated – the greater the problem, the higher the score and therefore the priority for funding. There are weightings and factors that the user can change to reflect the relative importance of the different components of the MARG score. The user can also assign an override score if they do not think the calculated score represents the treatment length, and they can also assign a priority. Administrative Functions
End of Year (EOY) Rollover When the current financial year ends (June 30) the FWP can be “rolled over”. This means that what was the next year of the programme becomes the current year. All treatments in the current year of the programme before it was rolled over are put into a history file against the treatment length they were programmed for. NOMAD Instructions for use Detailed instructions on the use of NOMAD are contained in the help file of RAMM V4 onwards.
Appendix 1G
Prioritisation of AWT Projects
Purpose 1. The objectives are:
(a) To ensure that all potential AWT projects are evaluated and justified in terms of
Transfund’s Work Category definitions and requirements.
(b) To prepare a priority ranking of all AWT projects if the total value of the acceptable projects exceeds the total allocation available.
Policies and Rules 2. The basic rules to be followed in the selection and evaluation of Area Wide Treatment
(AWT) projects are :
(a) The treatment proposed must form part of the least whole-of-life maintenance strategy for that section of state highway, where the whole-of-life cost is the NPV of the AWT plus all future maintenance costs over the next 25 year period. The discounting rate used will be 10%. No road user benefits are to be used in justifying AWT treatments, although they may be taken into account if there is a need to prioritise projects.
(b) The treatment proposed must be a normal maintenance-type treatment. There is no limit,
however, on depth of stabilisation, thickness or type of overlay, provided it is consistent with the type of maintenance treatments carried out locally.
(c) The future maintenance costs used in the economic analysis should be supported by a
generic pavement deterioration or maintenance expenditure model and not simply be a site-specific assessment of future maintenance needs/costs.
(d) In determining future maintenance requirements, the maintenance history records will
be used to ascertain the position on the model the current pavement/surfacing is performing at. A minimum of three years of maintenance expenditure history should be averaged for evaluation purposes. This may include the two previous years of historical maintenance data as recorded in RAMM together with the current year’s expenditure to date plus any identified but not yet completed maintenance requirements.
(e) No improvement content is to be included in an AWT proposal. If additional funding is
available in any year for seal widening associated with AWT consultants will be requested to separately identify the associated cost. The allocation of associated improvement funding will be prioritised and treated separately to the approvals of the basic AWT treatment. Drainage improvements, minor safety improvements, and seal widening may also be carried out in conjunction with AWT treatments provided they are funded and justified in terms of Transfund’s rules relating to those Work Categories.
(f) AWT’s will exceed 100m in length full-width and $10,000. If less than these, the work is funded in the Pavement Maintenance Work Category, notwithstanding the fact that it may be carried out as part of a contract with other AWT projects.
RAPT: 3. A review and prioritisation Team (RAPT) may be formed to evaluate each project for
appropriateness and compliance with Transfund’s work category rules to prioritise the projects to the extent required by funding constraints. A RAPT Team is likely to undertake the following procedures:
(i) Use the Decision Chart (Appendix 1) to evaluate the selection of each project.
(ii) Carry out a desk ‘sanity check’ of the factors and assumptions used by the consultant in
developing the project. In each case this will involve:
• a review of the maintenance expenditure history held in RAMM • a review of the latest High Speed Data (HSD) survey generated reports of flushing,
rutting and shoving for each project length • a consideration of the reasonableness of the maintenance costs deterioration model
or process used for assessing future maintenance costs and how the current pavement performance was aligned to that model.
(iii) Prepare Reports for each Region briefly defining any general problems/ observations in
the submissions and for each project indicating a “status” and/or further requirements prior to funding approval.
(iv) Use the Field Inspection Form (Appendix 2) to enable a sample of projects to be
reviewed on site. The inspection will assess whether or not based on a site inspection AWT appears to be the appropriate next treatment and, if so, is the timing appropriate. This involves a measurement or assessment of maintenance works completed since the previous surfacing and currently outstanding. The inspection includes a subjective assessment of the apparent importance of the project. The results of these inspections will be provided to the Regions.
(v) Based on the desk study, field inspections, together with any further submissions
received, prepare a schedule of projects which were deemed to warrant funding as AWT will be compiled. Regional Offices will be given the opportunity to provide additional justification for projects not included in that approved schedule.
4. Should prioritisation have been required because of funding constraints, the ranking formulae
likely to be adopted was :
i. Recalculated Net Present Value (NPV) of Benefits = (one-quarter of adjusted benefits claimed) – Maintenance Cost Savings.
ii. Economic Ranking = Recalculated NPV divided by length.
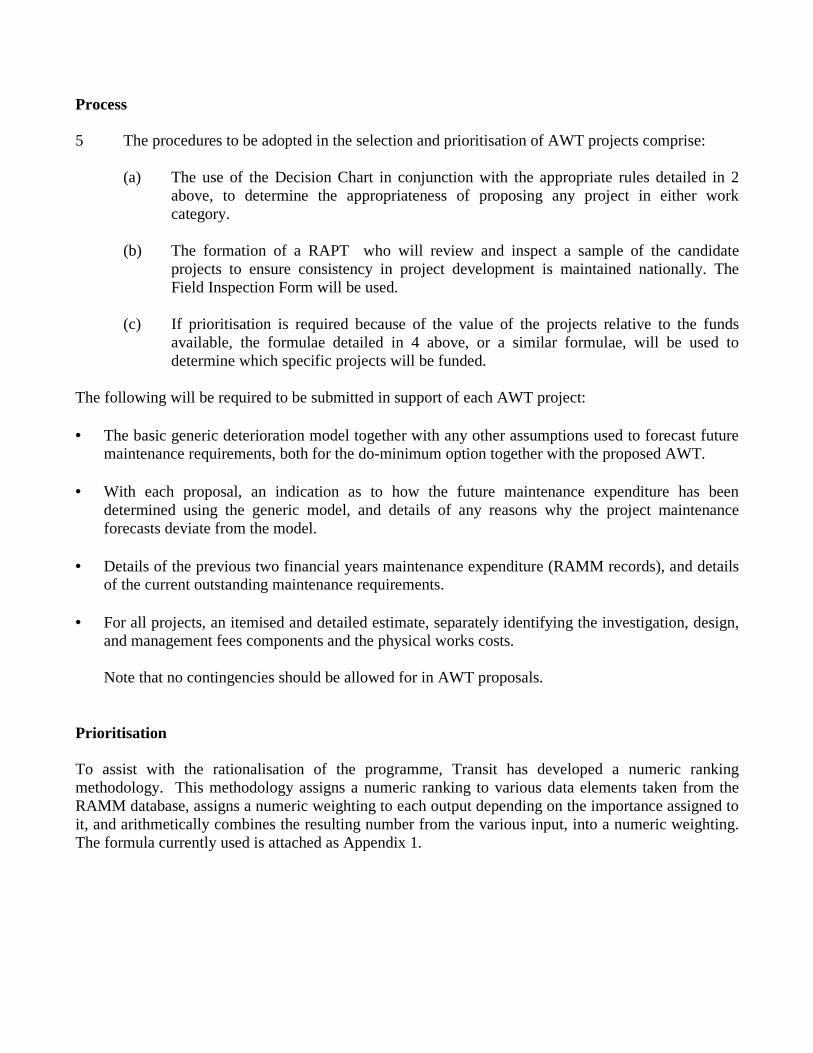
Process 5 The procedures to be adopted in the selection and prioritisation of AWT projects comprise:
(a) The use of the Decision Chart in conjunction with the appropriate rules detailed in 2 above, to determine the appropriateness of proposing any project in either work category.
(b) The formation of a RAPT who will review and inspect a sample of the candidate
projects to ensure consistency in project development is maintained nationally. The Field Inspection Form will be used.
(c) If prioritisation is required because of the value of the projects relative to the funds
available, the formulae detailed in 4 above, or a similar formulae, will be used to determine which specific projects will be funded.
The following will be required to be submitted in support of each AWT project: • The basic generic deterioration model together with any other assumptions used to forecast future
maintenance requirements, both for the do-minimum option together with the proposed AWT. • With each proposal, an indication as to how the future maintenance expenditure has been
determined using the generic model, and details of any reasons why the project maintenance forecasts deviate from the model.
• Details of the previous two financial years maintenance expenditure (RAMM records), and details
of the current outstanding maintenance requirements. • For all projects, an itemised and detailed estimate, separately identifying the investigation, design,
and management fees components and the physical works costs. Note that no contingencies should be allowed for in AWT proposals.
Prioritisation To assist with the rationalisation of the programme, Transit has developed a numeric ranking methodology. This methodology assigns a numeric ranking to various data elements taken from the RAMM database, assigns a numeric weighting to each output depending on the importance assigned to it, and arithmetically combines the resulting number from the various input, into a numeric weighting. The formula currently used is attached as Appendix 1.
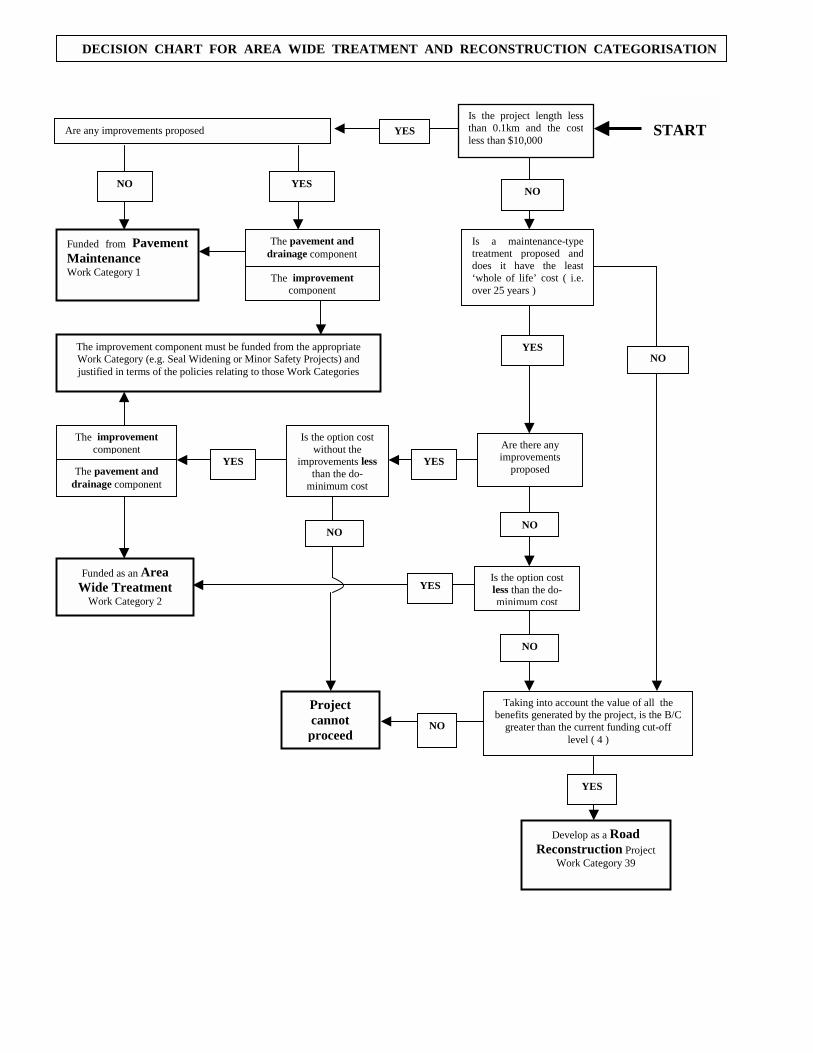
Is a maintenance-type treatment proposed and does it have the least ‘whole of life’ cost ( i.e. over 25 years )
Are any improvements proposed
Funded as an Area Wide Treatment
Work Category 2
Project cannot proceed
Develop as a Road Reconstruction Project
Work Category 39
YES
The pavement and drainage component
DECISION CHART FOR AREA WIDE TREATMENT AND RECONSTRUCTION CATEGORISATION
START
Is the option cost less than the do-minimum cost
Is the project length lessthan 0.1km and the costless than $10,000
Funded from Pavement Maintenance Work Category 1
Taking into account the value of all the benefits generated by the project, is the B/C
greater than the current funding cut-off level ( 4 )
The improvement component must be funded from the appropriate Work Category (e.g. Seal Widening or Minor Safety Projects) and justified in terms of the policies relating to those Work Categories
YES
NO
YES
NO NO YES
The improvement component Are there any
improvements proposed The pavement and
drainage component
The improvement component
Is the option cost without the
improvements lessthan the do-
minimum cost
YES YES
NO
YES
NO
NO
NO
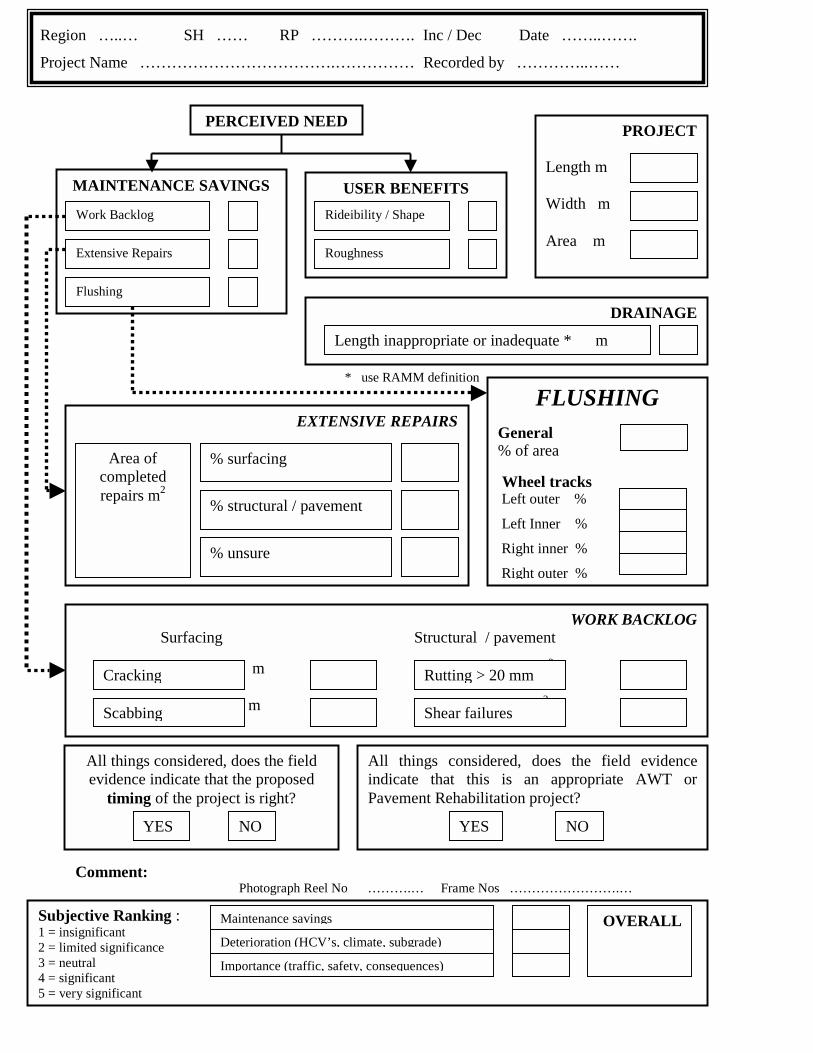
* use RAMM definition
Comment: Photograph Reel No ……….… Frame Nos …………………….…
Prioritisation of Pavement Area Treatment Weighting Methodology
Region …..… SH …… RP ……….………. Inc / Dec Date ……..…….
Project Name ……………………………….…………… Recorded by …………..……
MAINTENANCE SAVINGS USER BENEFITS
PERCEIVED NEED
Rideibility / Shape
Roughness
Work Backlog
Extensive Repairs
Flushing
WORK BACKLOG Surfacing Structural / pavement m� m2 m� m2
Cracking
DRAINAGE
PROJECT
Length m Width m Area m�
Length inappropriate or inadequate * m
FLUSHING General % of area Wheel tracks Left outer %
Left Inner %
Right inner %
Right outer %
EXTENSIVE REPAIRS
Area of completed repairs m2
% unsure
% surfacing
% structural / pavement
All things considered, does the field evidence indicate that the proposed
timing of the project is right?
Scabbing
Rutting > 20 mm
Shear failures
YES NO
Subjective Ranking : 1 = insignificant 2 = limited significance 3 = neutral 4 = significant 5 = very significant
Maintenance savings
Deterioration (HCV’s, climate, subgrade)
Importance (traffic, safety, consequences)
OVERALL
All things considered, does the field evidence indicate that this is an appropriate AWT orPavement Rehabilitation project?
YES NO

1 Pavement Area Treatment
The prioritisation of pavement area treatments is based upon the following three criteria: • Maintenance the pavement and surfacing maintenance history and requirements;
• Deterioration the rate at which the pavement is likely to deteriorate further based on the
type of pavement, its sensitivity to moisture, and the effects of traffic loadings; and
• User Benefits the current roughness condition and its location.
The analyses and subsequent determination of a prioritisation index for each of these criteria utilises information which is, or should be, readily available or obtainable. The majority of the information is as already measured or recorded in systems and processes external to this project and which should be readily available to Transit’s network consultants. It is also preferable that the data used in these analyses is readily obtained by field measurement at any time for use in instances where the data is not otherwise available or clearly out-of-date.
Data sources utilised include:
• RAMM • High Speed Data Collection and Roughness Surveys • Asset Management Maintenance Records
1.1 MAINTENANCE (M)
1.1.1 Repair History (RH)
The current condition is indicated by the pavement and surfacing repairs carried out in recent years, together with the quantity of outstanding pavement and surfacing repairs. Greater emphasis is placed on outstanding and recent repairs.
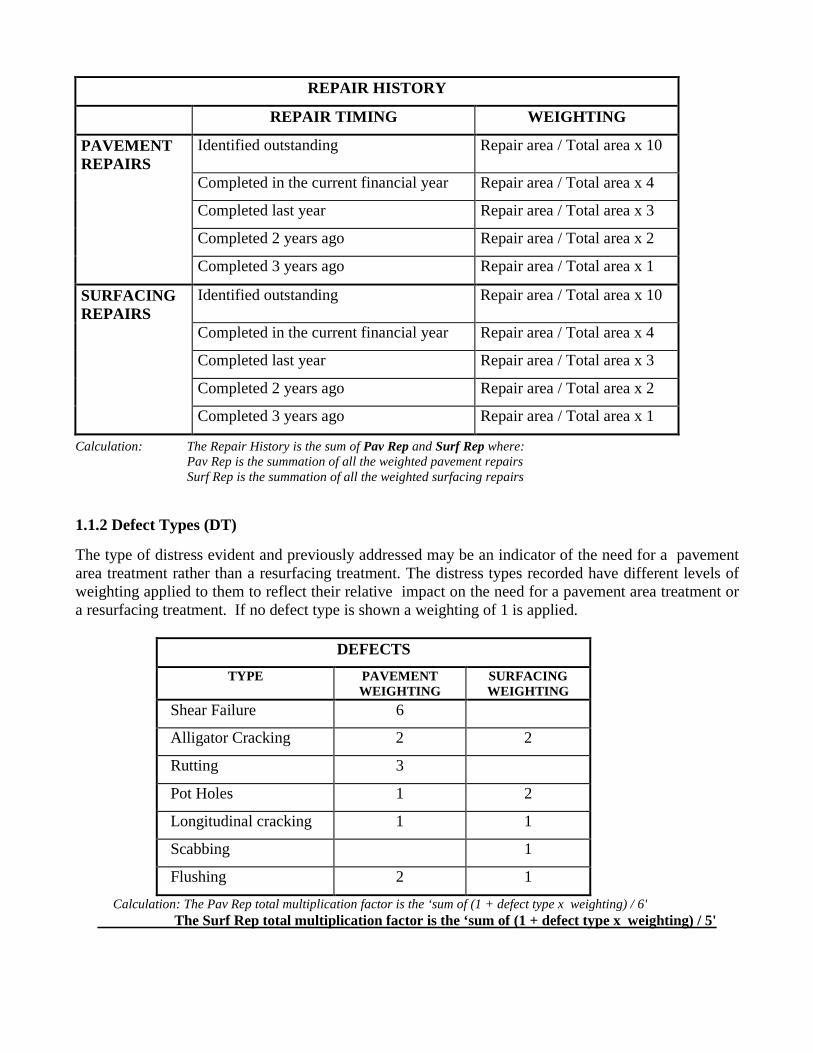
REPAIR HISTORY
REPAIR TIMING WEIGHTING
PAVEMENT REPAIRS
Identified outstanding Repair area / Total area x 10
Completed in the current financial year Repair area / Total area x 4
Completed last year Repair area / Total area x 3
Completed 2 years ago Repair area / Total area x 2
Completed 3 years ago Repair area / Total area x 1
SURFACING REPAIRS
Identified outstanding Repair area / Total area x 10
Completed in the current financial year Repair area / Total area x 4
Completed last year Repair area / Total area x 3
Completed 2 years ago Repair area / Total area x 2
Completed 3 years ago Repair area / Total area x 1
Calculation: The Repair History is the sum of Pav Rep and Surf Rep where: Pav Rep is the summation of all the weighted pavement repairs Surf Rep is the summation of all the weighted surfacing repairs
1.1.2 Defect Types (DT) The type of distress evident and previously addressed may be an indicator of the need for a pavement area treatment rather than a resurfacing treatment. The distress types recorded have different levels of weighting applied to them to reflect their relative impact on the need for a pavement area treatment or a resurfacing treatment. If no defect type is shown a weighting of 1 is applied.
DEFECTS TYPE PAVEMENT
WEIGHTING SURFACING WEIGHTING
Shear Failure 6
Alligator Cracking 2 2
Rutting 3
Pot Holes 1 2
Longitudinal cracking 1 1
Scabbing 1
Flushing 2 1
Calculation: The Pav Rep total multiplication factor is the ‘sum of (1 + defect type x weighting) / 6' The Surf Rep total multiplication factor is the ‘sum of (1 + defect type x weighting) / 5'

1.1.3 Defect Number (DN)
The number of outstanding defects is an indicator, together with the quantity of outstanding defects, of the spread of defects throughout the treatment length and extent of the current problem. A weighting is therefore applied to the Pav Rep and Surf Rep totals to ensure provide those proposals where the extent of outstanding repair is likely to cover the greatest portion of the treatment length.
Calculation: The Repair History total is multiplied by 1 + (the percentage of the total area
covered by the total of the outstanding pavement and surfacing repair work multiplied by the number of defects) / 100
1.1.4 Drainage Inadequacies (DI)
The Repair History may be influenced significantly by the adequacy of the drainage system, especially where pavement materials are sensitive to moisture. In such situations the need for pavement area treatments on sections where there is currently inadequate storm water drainage may need to be re-addressed following the provision of adequate drainage. A weighting is therefore applied to the Pavement and Surfacing Repair totals to reflect the likely reduction in maintenance attributable to the provision of an adequate stormwater drainage system.
The formula is: If MS=N, DI=1- ((Deficient Length/(TL Length*2))*0.25) If MS=L, DI=1- ((Deficient Length/(TL Length*2))*0.5) If MS=M, DI=1- ((Deficient Length/(TL Length*2))*0.6) If MS=H, DI=1- ((Deficient Length/(TL Length*2))*0.8)
1.2 DETERIORATION (D)
The rate at which a pavement showing signs of distress deteriorates is essentially a function of its current surfacing needs and the loadings applied to it. 1.2.1 Surfacing Needs (SN)
Generally the retention of a surfacing which prevents moisture entering the pavement layers will extent the life of the pavement. a weighting can therefore be applied to the need for a pavement area treatment relative to the integrity of the surfacing layer on the basis that the surfacing layer becomes less effective as a waterproofing layer towards the end of its life.
The weighting will be based on the number of years between the current year and when the next surfacing treatment will have to be carried out if an area pavement treatment is not implemented.
Calculation: Determine the number of years between next surfacing due and current year.
Weighting is (20 - 2 x years).
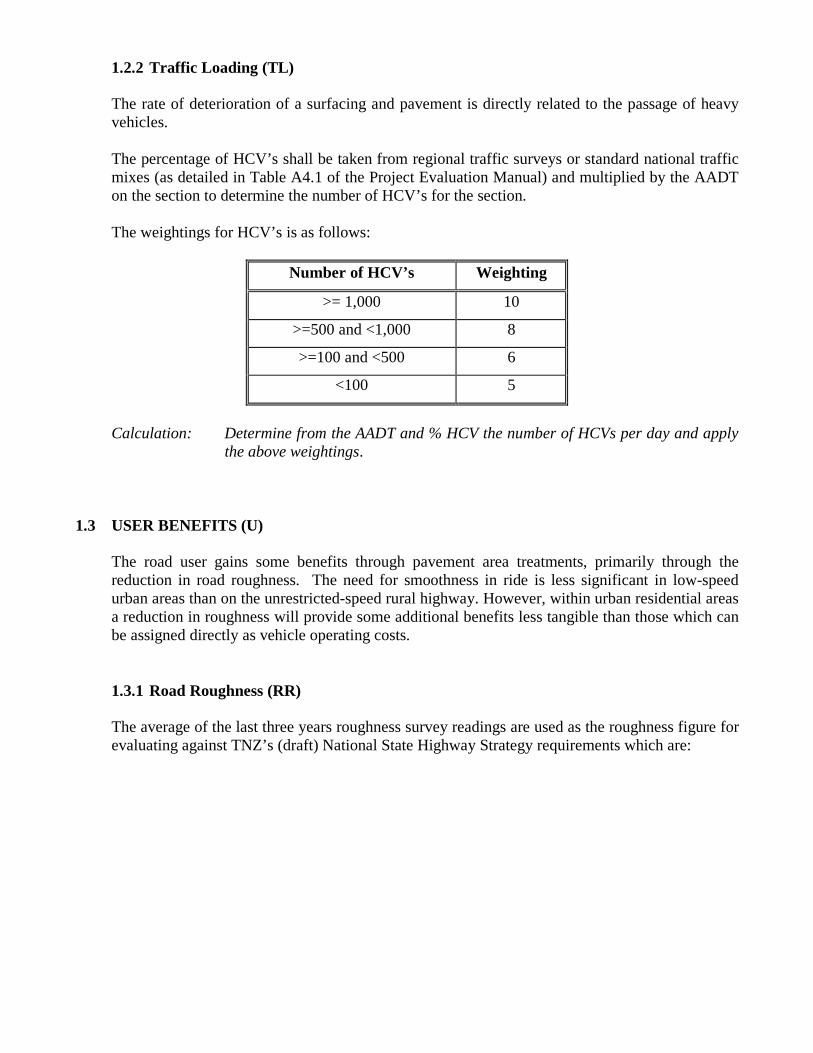
1.2.2 Traffic Loading (TL)
The rate of deterioration of a surfacing and pavement is directly related to the passage of heavy vehicles.
The percentage of HCV’s shall be taken from regional traffic surveys or standard national traffic mixes (as detailed in Table A4.1 of the Project Evaluation Manual) and multiplied by the AADT on the section to determine the number of HCV’s for the section.
The weightings for HCV’s is as follows:
Number of HCV’s Weighting
>= 1,000 10
>=500 and <1,000 8
>=100 and <500 6
<100 5
Calculation: Determine from the AADT and % HCV the number of HCVs per day and apply
the above weightings.
1.3 USER BENEFITS (U)
The road user gains some benefits through pavement area treatments, primarily through the reduction in road roughness. The need for smoothness in ride is less significant in low-speed urban areas than on the unrestricted-speed rural highway. However, within urban residential areas a reduction in roughness will provide some additional benefits less tangible than those which can be assigned directly as vehicle operating costs.
1.3.1 Road Roughness (RR)
The average of the last three years roughness survey readings are used as the roughness figure for evaluating against TNZ’s (draft) National State Highway Strategy requirements which are:
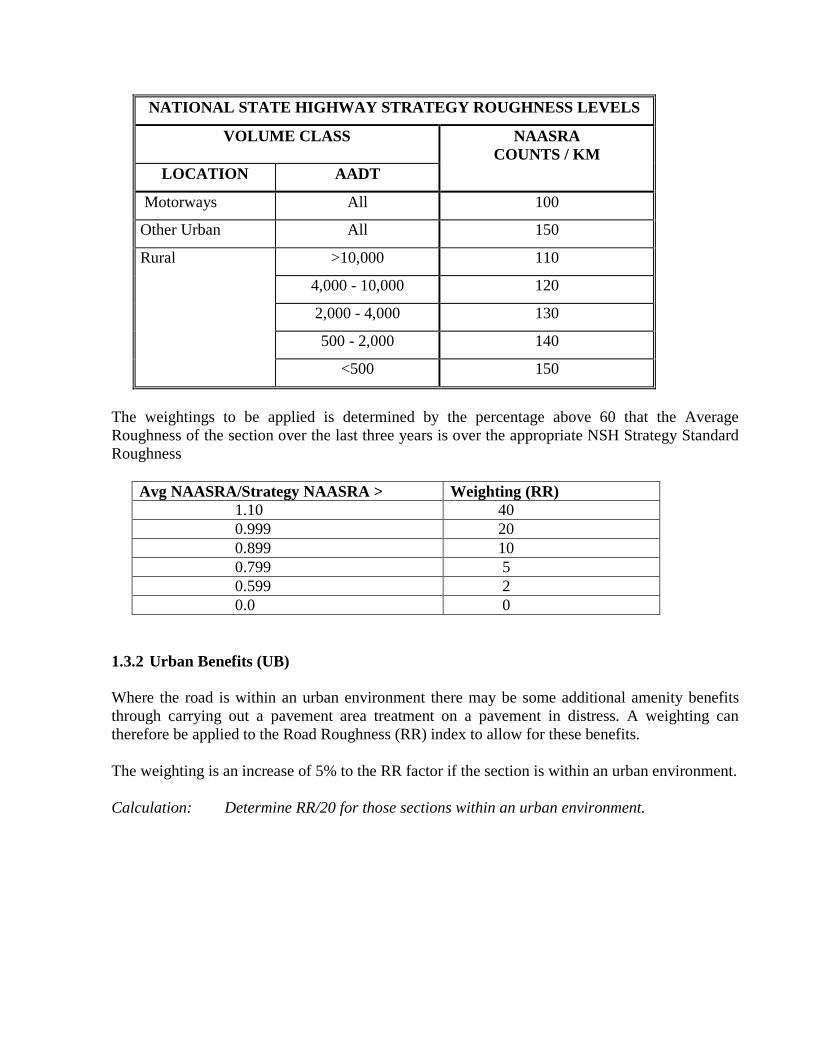
NATIONAL STATE HIGHWAY STRATEGY ROUGHNESS LEVELS
VOLUME CLASS NAASRA COUNTS / KM
LOCATION AADT
Motorways All 100
Other Urban All 150
Rural >10,000 110
4,000 - 10,000 120
2,000 - 4,000 130
500 - 2,000 140
<500 150
The weightings to be applied is determined by the percentage above 60 that the Average
Roughness of the section over the last three years is over the appropriate NSH Strategy Standard Roughness
Avg NAASRA/Strategy NAASRA > Weighting (RR) 1.10 40 0.999 20 0.899 10 0.799 5 0.599 2 0.0 0
1.3.2 Urban Benefits (UB)
Where the road is within an urban environment there may be some additional amenity benefits through carrying out a pavement area treatment on a pavement in distress. A weighting can therefore be applied to the Road Roughness (RR) index to allow for these benefits.
The weighting is an increase of 5% to the RR factor if the section is within an urban environment.
Calculation: Determine RR/20 for those sections within an urban environment.
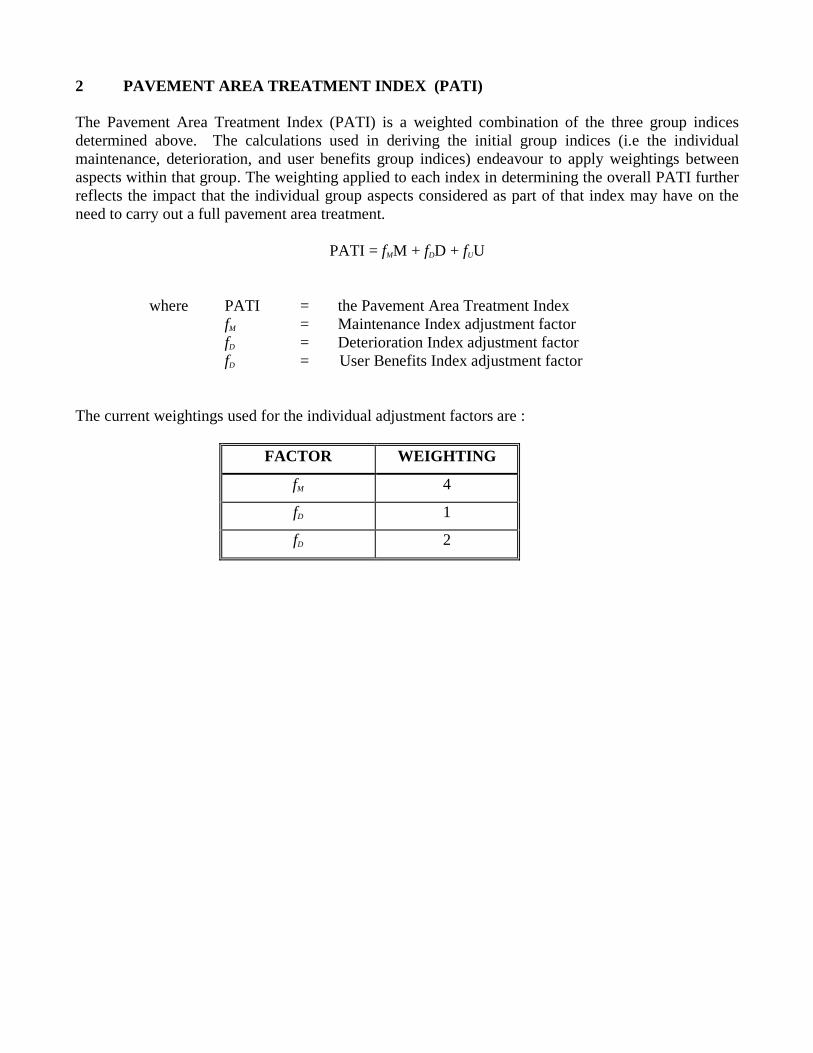
2 PAVEMENT AREA TREATMENT INDEX (PATI) The Pavement Area Treatment Index (PATI) is a weighted combination of the three group indices determined above. The calculations used in deriving the initial group indices (i.e the individual maintenance, deterioration, and user benefits group indices) endeavour to apply weightings between aspects within that group. The weighting applied to each index in determining the overall PATI further reflects the impact that the individual group aspects considered as part of that index may have on the need to carry out a full pavement area treatment.
PATI = fMM + fDD + fUU
where PATI = the Pavement Area Treatment Index fM = Maintenance Index adjustment factor fD = Deterioration Index adjustment factor fD = User Benefits Index adjustment factor
The current weightings used for the individual adjustment factors are :
FACTOR WEIGHTING
fM 4
fD 1
fD 2

Appendix 1H
Prioritisation of Reseal and Rehabilitation Projects
Introduction Transit has developed a methodology for the ranking and assessment of rehabilitation and reseal projects similar to that used for Area Wide Treatment (AWT). The resealing methodology includes a similar numeric ranking formula similar to that used for AWT. The rehabilitation methodology utilises BCR for formal ranking. The AWT numeric ranking will be applied where it is necessary to compare rehabilitation and AWT projects for ranking purposes. Purpose The objectives are: a) To facilitate ranking for the purposes of applying budget constraints. Using a common
methodology enables national ranking. b) To assist in the identification of projects where field inspection may be warranted to confirm
justification. The Methodologies The methodologies are outlined in the following appendices. Data collection forms, the explanation of these and an explanation of the numeric calculation, are provided.
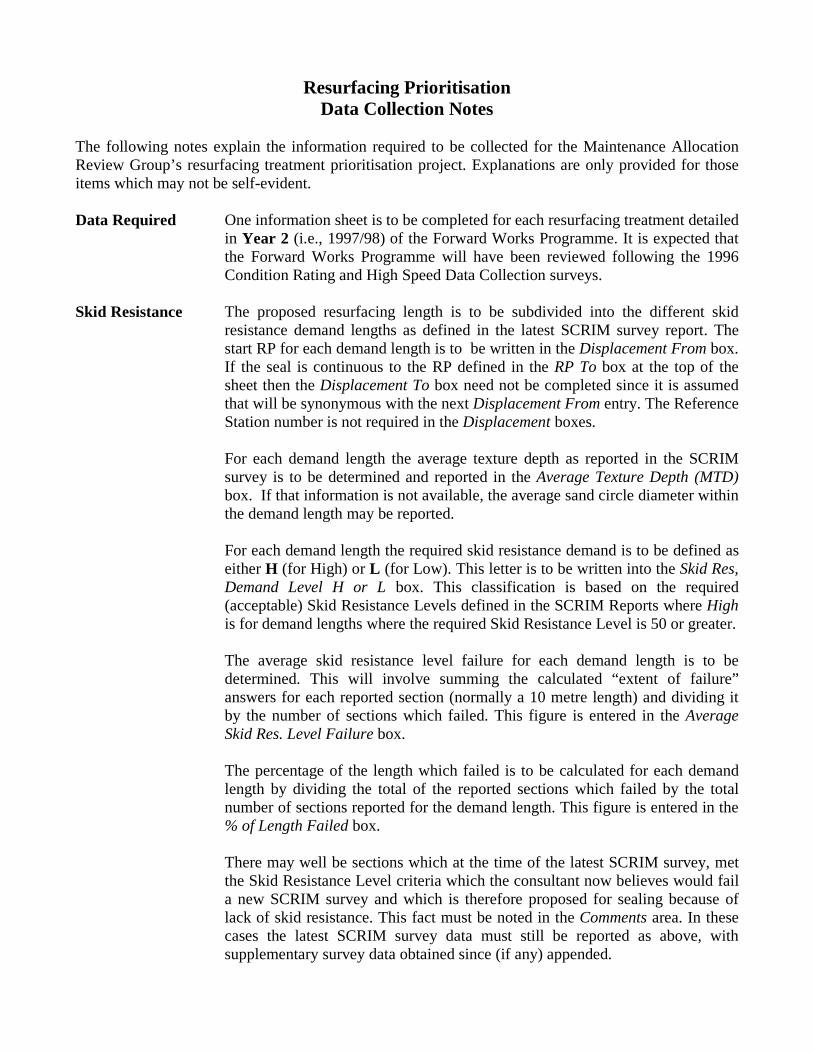
Resurfacing Prioritisation
Data Collection Notes The following notes explain the information required to be collected for the Maintenance Allocation Review Group’s resurfacing treatment prioritisation project. Explanations are only provided for those items which may not be self-evident. Data Required One information sheet is to be completed for each resurfacing treatment detailed
in Year 2 (i.e., 1997/98) of the Forward Works Programme. It is expected that the Forward Works Programme will have been reviewed following the 1996 Condition Rating and High Speed Data Collection surveys.
Skid Resistance The proposed resurfacing length is to be subdivided into the different skid
resistance demand lengths as defined in the latest SCRIM survey report. The start RP for each demand length is to be written in the Displacement From box. If the seal is continuous to the RP defined in the RP To box at the top of the sheet then the Displacement To box need not be completed since it is assumed that will be synonymous with the next Displacement From entry. The Reference Station number is not required in the Displacement boxes.
For each demand length the average texture depth as reported in the SCRIM survey is to be determined and reported in the Average Texture Depth (MTD) box. If that information is not available, the average sand circle diameter within the demand length may be reported.
For each demand length the required skid resistance demand is to be defined as either H (for High) or L (for Low). This letter is to be written into the Skid Res, Demand Level H or L box. This classification is based on the required (acceptable) Skid Resistance Levels defined in the SCRIM Reports where High is for demand lengths where the required Skid Resistance Level is 50 or greater.
The average skid resistance level failure for each demand length is to be determined. This will involve summing the calculated “extent of failure” answers for each reported section (normally a 10 metre length) and dividing it by the number of sections which failed. This figure is entered in the Average Skid Res. Level Failure box.
The percentage of the length which failed is to be calculated for each demand length by dividing the total of the reported sections which failed by the total number of sections reported for the demand length. This figure is entered in the % of Length Failed box.
There may well be sections which at the time of the latest SCRIM survey, met the Skid Resistance Level criteria which the consultant now believes would fail a new SCRIM survey and which is therefore proposed for sealing because of lack of skid resistance. This fact must be noted in the Comments area. In these cases the latest SCRIM survey data must still be reported as above, with supplementary survey data obtained since (if any) appended.
Pavement The percentage of the pavement area which has been repaired since 1 July or
which has been identified for pavement repair prior to 31 December, is to be recorded. This area is to include the normal pavement and surfacing repairs of the following types:
- Crack seal repairs - Digout repairs - Insitu - stabilised repairs - Scabbing repairs - Flushing repairs Together with other outstanding surfacing defects requiring general maintenance now.
Pre-reseal repairs which primarily address surface shape defects are to be excluded.
If the pavement materials are moisture sensitive (i.e., moisture-generated pavement failures will occur within weeks of the surfacing cracking) then the degree of moisture sensitivity of the materials the pavement is constructed of (allowing for any stabilising treatments already applied) is to be defined as severe, moderate or minor. If the combination of pavement materials and climatic conditions/location make frost-heave a problem on the length then the extent of the problem is to be defined as severe, moderate or minor. The extent of either or both of the above problems is to be recorded as sev (for severe), mod (for moderate), min (for minor) or not in the second Pavement box. The box may be left blank if these are not a problem.
Current Surfacing The existing surfacing type is to be shown as the type it is recorded in RAMM.
The year the existing surfacing was applied is to be shown as it is recorded in RAMM.
The “Optimum Life” year is the calendar year in which the seal reached, or will reach, the point where it would appear to be at the end of its useful life due solely to physical and/or chemical changes in the bitumen binder. If the binder appears to be still ‘active’ (i.e. not dull and brittle in summer) then the year of its optimum life has not been reached. The optimum life is not necessarily the same as the design life as used in RAMM, or for other treatment selection processes, which may incorporate other considerations leading to resurfacing needs being indicated earlier.
Accidents Where accidents are known to have occurred on a particular treatment length
because of pavement surfacing conditions, the number is to be where all four of the following conditions are met: • they are recorded in the LTSA AIS database; and

• they have occurred within the last 24 months; and
• they were partially or fully a result of substandard seal or paved surfacing
conditions; and
• there have been two or more such accidents on the proposed treatment length.
If accidents are not known to be a problem, or are being used as the basis for justifying the resurfacing of the length, then they do not need to be investigated and recorded.
Consultant The consultant is to place all the proposed resurfacing treatments Resur- Prioritisation facing Prioritisation Data Reports within his/her network management area into
the order he/she would wish to see them prioritised. The total list is then to be subdivided into five equal portions (by report sheets and not by actual seal length) and their “prioritisation position” recorded on the sheet by ticking the appropriate box (i.e., highest priority 20% being ticked against the 80-100 box).
The consultant should also indicate the major reason(s) he believes justifies the resurfacing treatment by ticking as appropriate against the safety, defects or seal age boxes.
Associated Detail any general maintenance costs likely to be incurred in the next Expenditure financial year associated with the resurfacing treatment. It is accepted that in
most situations the majority of pre-reseal repairs and drainage maintenance works associated with next seasons resurfacing treatments will be substantially completed within the current financial year.

RESURFACING PRIORITISATION DATA
REGION RP From SH RP To
Length
SKID RESISTANCE DEMAND LENGTHS Location Micro Texture
Displacement From
Displacement To
Skid Res. Demand Level
H or L
Average Skid Res.
Level Failure
% of Length Failed
Average texture depth or average sand circle diameter (mm)
PAVEMENT TRAFFIC AADT HCV %% of pavement repaired last year
and requiring general maintenance now
CONSULTANT PRIORITISATIONMoisture sensitivity and/or frost heave Severe / moderate / minor / not -20
-20
EXISTING SURFACING -20
Existing surfacing type -20 Year existing surfacing laid
Taking into account all the sections you are submitting for prioritisation, in which 20% would you prioritise this particular section (Please tick box : 100 = top priority)
-20
Current year 1997 Defects "Optimum Life" year Safety
What do you consider to be the principal reason(s) which justifies this resurfacing.
Seal Age
ACCIDENTSNumber of accidents in last two years ASSOCIATED COSTS IN NEXT FINANCIAL YEAR
Contributed to by surfacing deficiencies Expenditure required for : $ Pre reseal repairs
Drainage maintenance
Comment : Consultant: Date: Other (specify)

Prioritisation of Reseals Weighting Methodology
1. THE RESEAL INDEX The Reseal Index (RI) is based upon three main criteria as follows: • Safety including macro and micro texture, reported traffic accidents and AADT. • Surface Defects including pavement maintenance history and requirements, pavement
materials and heavy commercial vehicles. • Seal Age relative to the ‘optimum life’ of the current seal. The analyses and subsequent determination of the impact on the Reseal Index of each of these criteria utilises information which is, or should be, readily available or obtainable. The majority of the information is as already measured or recorded in systems and processes external to this project and which should be readily available to TNZ’s network consultants. It is also preferable that the data used in these analyses is readily obtained by field measurement at any time for use in instances where the data is not otherwise available or clearly out-of-date. Data sources utilised include: • RAMM • High Speed Data Collection Surveys • SCRIM Surveys • LTSA (AIS) Crash Database • Asset Management Maintenance Records Looking at each of the criteria separately 1.1 SAFETY When considering safety factors the first considerations should be based on the data which is automatically available from RAMM, High Speed (Rapid) Data Collection, Scrim surveys and other inventories, and preferably utilising data which may be collected in the field in the absence of RAMM etc. data or that data being out of date. Four factors contribute to the Safety Weighting of the Index: • Macro Texture • Micro Texture • AADT • Traffic Accidents.

1.1.1 Macro Texture Macro texture is used as an overall measure of seal condition, in terms of the extent of flushing. Macro texture measurements are available through the High Speed Data Collection results and also through manual sand circle readings. The weighting that shall be applied is to be based upon the average macro texture based on the following weightings which assume a sand circle of 225mm or better is good, between 225 and 275 is less than desirable but still acceptable, and that greater than 275 requires addressing.
MACRO TEXTURE WEIGHTINGS
Average Sand Circle
Diameter
Mean Texture Depth
(MTD)
Weighting
<225 >1.13 0
>=225 & <250 <=1.13 & >0.92 2
>=250 & <275 <=0.92 & >0.76 3
>=275 & <300 <=0.76 & >0.64 10
>300 <=0.64 20
1.1.2 Micro Texture Micro texture is used as a measure of the skid resistance of the current seal. Micro texture measurements are available typically from SCRIM surveys. In the absence of SCRIM, other resistance measures could be used, such as the Grip Tester. The weightings have been set as the area of the seal (based on the portion of the readings recorded and reported) which fails to meet the intervention level of the particular test for the location of the seal. In the absence of such data then no weighting shall be used. The average deficiency is the average of the differences between the measured skid resistance level (SRL) and Transit’s deficiency for each particular demand length based on each of the 10 metre averaged SCRIM readings reported for that particular demand length. On longer reseal lengths of highway where there are changes in the levels of demand within the length, it will be necessary to “sub-divide” the total length into the lengths of each demand level in order to obtain an average weighting for the total section. It should be noted that there may be high demand sections within a total length where sealing is required because of inadequate skid resistance notwithstanding the fact the average weighting is relatively low and such that sealing of the total length cannot be justified. In such cases the seal length must be reduced to that specifically required by the lack of skid resistance. Such work may simply extend over a few metres in which case it could be carried out by a maintenance

contractor or one or two hundred metres which would justify its inclusion in a normal reseal contract.
SCRIM DEFICIENCY (MICROTEXTURE) WEIGHTINGS % of TL failed Average Deficiency
⇓ Def > -0.05 -0.05 ≥ Def > -0.08 -0.08 ≥ Def > -0.1 Def ≤ -0.1 % <5 0 5 10 20 5 ≤ % < 20 5 10 30 60 20 ≤ % < 40 10 30 100 100 % ≥ 40 20 60 100 100
1.1.3 AADT The traffic that uses the pavement section has a bearing on the Reseal Index since the likelihood for an incident resulting from a surfacing deficiency increases as traffic volumes increase. The weightings for various AADT’s is as follows:
AADT Weighting
>10,000 2
4000<= x < 10,000 1.5
2000<= x < 4000 1.25
<2000 1
1.1.4 Traffic Accidents Traffic Accidents may play an important role in determining whether a reseal should proceed. The number of accidents that have occurred in a particular reseal length where surfacing deficiencies may have been a contributory factor shall be determined and given a weighting which will form part of the Reseal Index. The only traffic accidents that can be used in the Reseal Index calculation are:
• those that are recorded in the LTSA AIS database; and
• those which have occurred within the last 24 months; and
• which were partially or fully a result of substandard seal or paved surfacing conditions; and
• those where there have been two or more accidents on the proposed treatment length. **** All four conditions must be met.

Typically these accidents will be those where skidding has occurred in wet or dry weather and which have a high probability of being reduced by a reseal. The accidents which are most likely to have occurred from a sealed or paved surface deficiency are those where the Movement Codes in the LTSA’s Crash Database are :
BC Head on - swung wide on corner BD Head on - cut or swung wide on corner or unknown BE Head on - lost control on straight or curve DA Lost control turning right DB Lost control turning left FA Rear ended a slow vehicle FD Rear ended a queue
and those where the recorded contributory factors are:
800 Slippery 801 Slipper in rain 900 Weather 901 Heavy rain
The above list is not exclusive, and many accidents recorded with the above movement codes or contributory factors will occur on sections of highway with surfacings in an acceptable condition. It is therefore necessary to consider each accident individually to assess whether or not the highway surface condition was a contributory factor to the extent that, had it been resurfaced prior to the accident, the accident would not have occurred and/or the extent of injuries would have been reduced a class (eg fatal to serious, serious to minor and minor to property damage only). The weightings for traffic accidents are as follows:
TRAFFIC ACCIDENT WEIGHTINGS
AADT
Surface Deficiency Related Accidents per km per year
>0 <1 >1 <1.5 >1.5 <2 >2 <2.5 >2.5 <3 >3 <6 >6
< 1,500 100 100 100 100 100 100 100
1,500 - 3,000 69 100 100 100 100 100 100
3,000 - 5,000 31 58 86 100 100 100 100
5,000 - 7,500 12 30 48 66 85 100 100
7,500 - 10,000 3 17 31 44 58 86 100
> 10,000 1 10 26 32 46 65 100

1.2 Surface Defects The three key components that contribute to this factor are: • Maintenance History • Heavy Commercial Vehicles (HCV) • Pavement Type
1.2.1 Maintenance History All pavement and surfacing defects that may be impacted upon by a reseal are to be taken into account. The area of the normal pavement and surfacing repairs (excluding pre-reseal repairs) in the previous financial year, together with any outstanding pavement and surfacing defects which require a general maintenance treatment now, are to be taken into account when determining the weighting to apply. The type of repairs to be considered when determining the overall pavement maintenance area are as follows: • Crack seal repairs; • Digout repairs; • Stabilising repairs; • Scabbing repairs; • Flushing repairs; • Other outstanding surfacing defects requiring general maintenance now. The area of repair for the section being proposed for reseal is to be put forward in terms of % of area of seal repaired. The weighting for the respective costs per km is as follows:
% of Area Repaired Weighting
>= 10% 40
>=5% and <10% 20
>=2% and < 5% 10
>0% and < 2 % 5
1.2.2 HCV’s HCV’s are a significant component of the maintenance costs factor. The rate of deterioration of a surfacing and pavement is directly related to the passage of heavy vehicles.
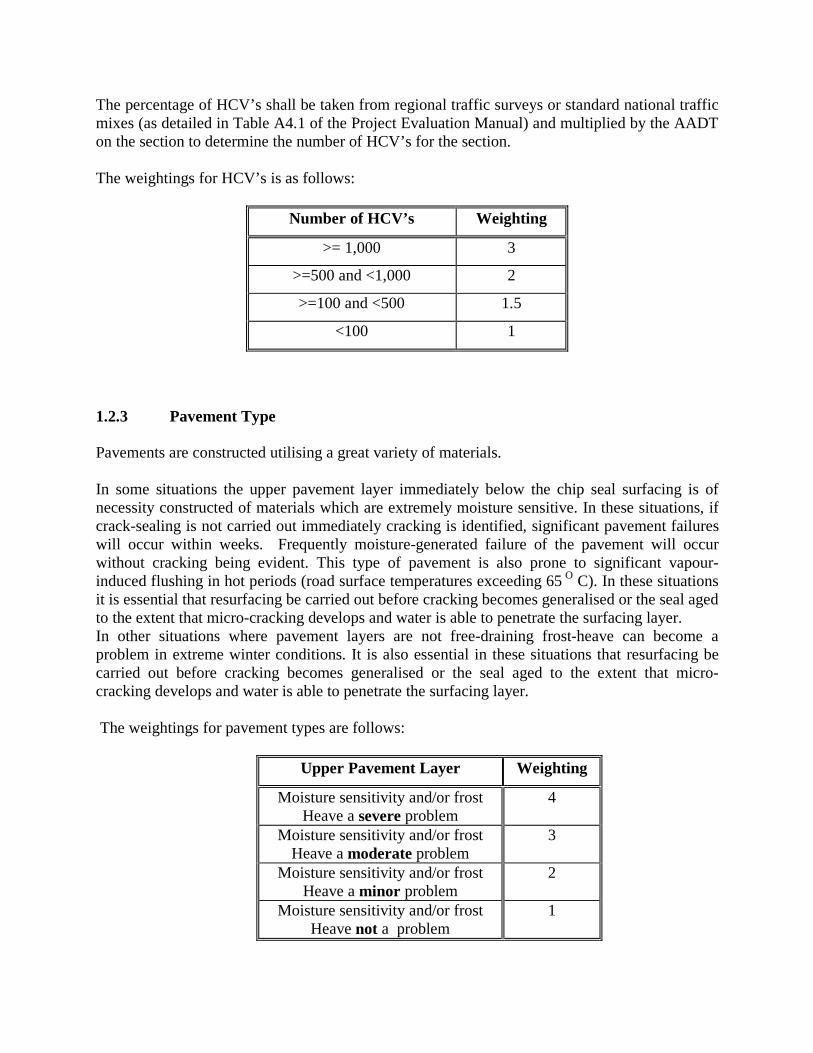
The percentage of HCV’s shall be taken from regional traffic surveys or standard national traffic mixes (as detailed in Table A4.1 of the Project Evaluation Manual) and multiplied by the AADT on the section to determine the number of HCV’s for the section. The weightings for HCV’s is as follows:
Number of HCV’s Weighting
>= 1,000 3
>=500 and <1,000 2
>=100 and <500 1.5
<100 1
1.2.3 Pavement Type Pavements are constructed utilising a great variety of materials. In some situations the upper pavement layer immediately below the chip seal surfacing is of necessity constructed of materials which are extremely moisture sensitive. In these situations, if crack-sealing is not carried out immediately cracking is identified, significant pavement failures will occur within weeks. Frequently moisture-generated failure of the pavement will occur without cracking being evident. This type of pavement is also prone to significant vapour-induced flushing in hot periods (road surface temperatures exceeding 65 O C). In these situations it is essential that resurfacing be carried out before cracking becomes generalised or the seal aged to the extent that micro-cracking develops and water is able to penetrate the surfacing layer. In other situations where pavement layers are not free-draining frost-heave can become a problem in extreme winter conditions. It is also essential in these situations that resurfacing be carried out before cracking becomes generalised or the seal aged to the extent that micro-cracking develops and water is able to penetrate the surfacing layer. The weightings for pavement types are follows:
Upper Pavement Layer Weighting
Moisture sensitivity and/or frost Heave a severe problem
4
Moisture sensitivity and/or frost Heave a moderate problem
3
Moisture sensitivity and/or frost Heave a minor problem
2
Moisture sensitivity and/or frost Heave not a problem
1
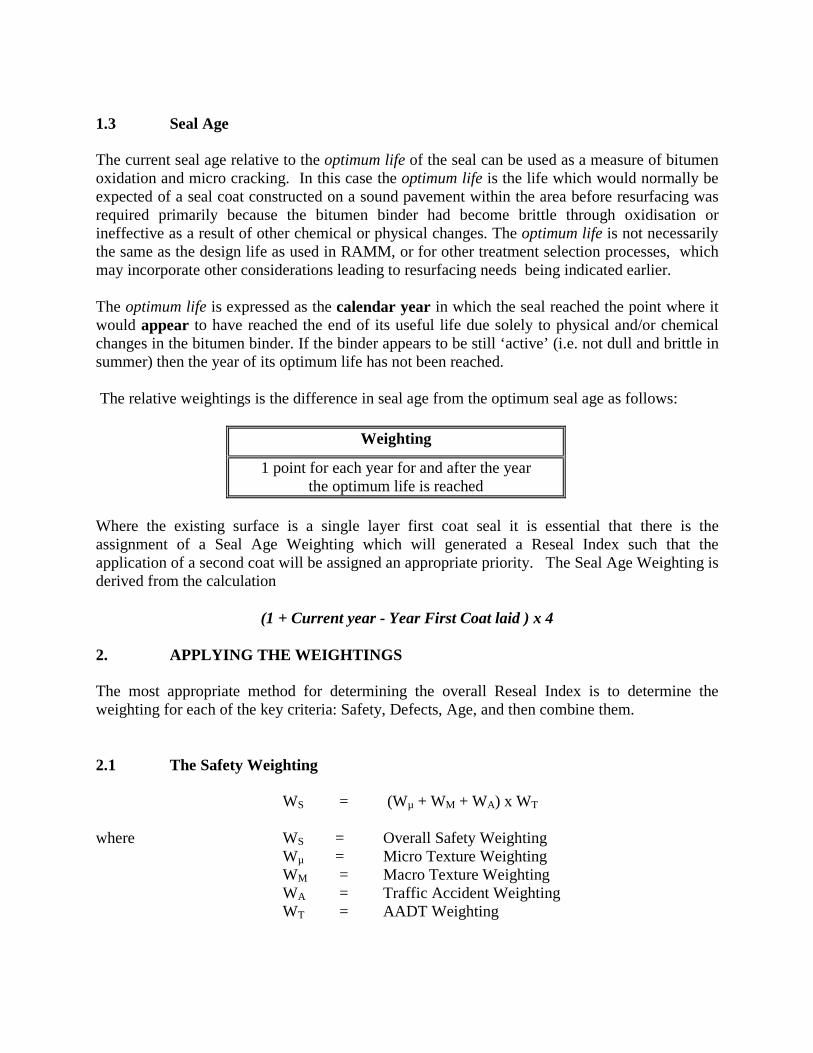
1.3 Seal Age The current seal age relative to the optimum life of the seal can be used as a measure of bitumen oxidation and micro cracking. In this case the optimum life is the life which would normally be expected of a seal coat constructed on a sound pavement within the area before resurfacing was required primarily because the bitumen binder had become brittle through oxidisation or ineffective as a result of other chemical or physical changes. The optimum life is not necessarily the same as the design life as used in RAMM, or for other treatment selection processes, which may incorporate other considerations leading to resurfacing needs being indicated earlier. The optimum life is expressed as the calendar year in which the seal reached the point where it would appear to have reached the end of its useful life due solely to physical and/or chemical changes in the bitumen binder. If the binder appears to be still ‘active’ (i.e. not dull and brittle in summer) then the year of its optimum life has not been reached. The relative weightings is the difference in seal age from the optimum seal age as follows:
Weighting
1 point for each year for and after the year the optimum life is reached
Where the existing surface is a single layer first coat seal it is essential that there is the assignment of a Seal Age Weighting which will generated a Reseal Index such that the application of a second coat will be assigned an appropriate priority. The Seal Age Weighting is derived from the calculation
(1 + Current year - Year First Coat laid ) x 4 2. APPLYING THE WEIGHTINGS The most appropriate method for determining the overall Reseal Index is to determine the weighting for each of the key criteria: Safety, Defects, Age, and then combine them. 2.1 The Safety Weighting WS = (Wµ + WM + WA) x WT where WS = Overall Safety Weighting
Wµ = Micro Texture Weighting WM = Macro Texture Weighting WA = Traffic Accident Weighting WT = AADT Weighting
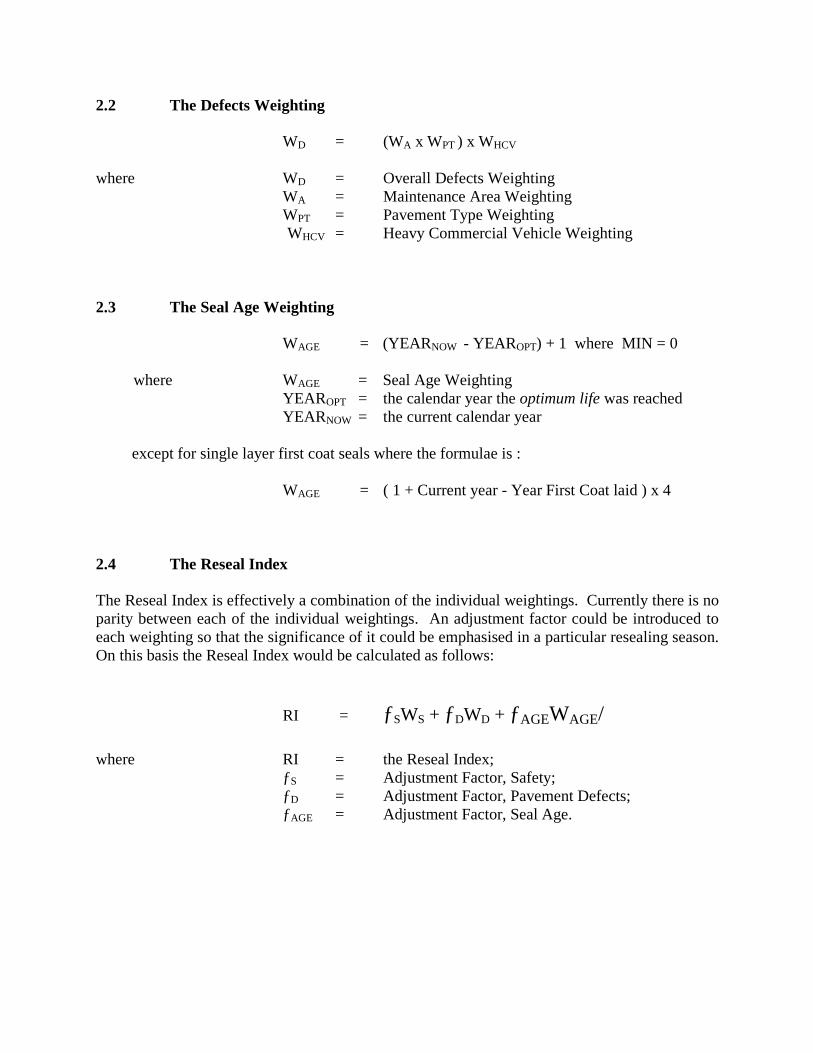
2.2 The Defects Weighting WD = (WA x WPT ) x WHCV where WD = Overall Defects Weighting
WA = Maintenance Area Weighting WPT = Pavement Type Weighting
WHCV = Heavy Commercial Vehicle Weighting
2.3 The Seal Age Weighting WAGE = (YEARNOW - YEAROPT) + 1 where MIN = 0 where WAGE = Seal Age Weighting
YEAROPT = the calendar year the optimum life was reached YEARNOW = the current calendar year
except for single layer first coat seals where the formulae is :
WAGE = ( 1 + Current year - Year First Coat laid ) x 4
2.4 The Reseal Index The Reseal Index is effectively a combination of the individual weightings. Currently there is no parity between each of the individual weightings. An adjustment factor could be introduced to each weighting so that the significance of it could be emphasised in a particular resealing season. On this basis the Reseal Index would be calculated as follows:
RI = ƒSWS + ƒDWD + ƒAGEWAGE/ where RI = the Reseal Index;
ƒS = Adjustment Factor, Safety; ƒD = Adjustment Factor, Pavement Defects; ƒAGE = Adjustment Factor, Seal Age.

The suggested weightings for each of the individual adjustment factors is as follows:
Factor Weighting
ƒS 0.5
ƒD 0.5
ƒAGE 4.0
3.0 SENSITIVITY ANALYSIS Using the above adjustment factors a rough sensitivity analysis has been performed on the outer limits of the weightings to determine if the Reseal Index is going to be realistic for the various ranges. The results of the analysis are given:
Range Safety
Wµ WM WA WT WS ƒS WS Lowest 0 0 0 1.0 0 0 Lower 8 2 0 1.2 12 6 Median 35 5 30 1.25 88 44 Upper 90 10 80 1.4 252 126
Highest 100 20 100 1.5 330 165
Range Defects
WA WPT WHCV WD ƒD WD
Lowest 0 1 1 0 0 Lower 5 2 1.5 15 8 Median 10 2.5 1.8 45 23 Upper 20 3 2 120 60
Highest 40 4 3 480 240
Range Age Range Reseal Index
WAGE ƒAGE SAGE Lowest 0 0 Lowest 0 Lower 1 4 Lower 18 Median 3 12 Median 79 Upper 5 20 Upper 206
Highest 7 28 Highest 433

Note: For a section of highway to score in the Upper or Highest bounds it would need to have a high accident record, a significant quantity of defects, and be subject to a very high traffic volume. It is unlikely that there will be many sections which fall into this range. Because most sections proposed for sealing tend to “qualify” for one predominant reason (e.g. safety or defects) rather than both, it is expected that the actual range will tend to be generally from the “median” as detailed above to the “lowest”.
4.0 SUMMARY
Every endeavour has been made to keep the Reseal Index as simple as possible (despite the fancy formulae above). There is an assumption that there is a basic knowledge of the network available in terms of micro texture (SCRIM), traffic accidents and maintenance costs. The adjustment factors could be set annually or at the start of the process, but it offers the opportunity to alter the emphasis of a particular resealing programme.

Rehabilitation Projects Data Collection Notes Introduction The following notes explain the information required to be collected for the Maintenance Allocation Review Group’s rehabilitation prioritisation project. 1. Site Description The site description fields are defined as follows: Region - Transit region in which the section is located
SH - State Highway number
RP Start - the Route Position at the start of the project length
RP End - the Route Position at the end of the project length
Length - the length in kilometres of the project section
Ex. Width - the average existing width of the project section in metres
Date - date on which the collection was compiled
Compiled by - the person who gathered the information
2. Maintenance Fields 2.1 Area of Pavement Repairs (m²)
This is the area in square metres of all pavement repairs. Included in this category are: • Digouts • Rip and remake (stabilised and unstabilised)
2.2 Area of Surfacing Repairs (m²)
This is the area of repairs for defects in the surfacing of the pavement and includes: • Crack sealing • Potholes (if known) • Rut filling
2.3 Time Periods
To be done - indicate those defects on the highway which are evident at time of inspection that have not yet been repaired, but would be if the pavement were not to be rehabilitated.
Completed since last June - the area of repairs carried in the current financial year up to the date of inspection (should be available from contract records).
Three years prior to June - historical area of repairs determined from contract records.
2.4 Modes of Failure
Describe the mode of failure: Basecourse Failure Subgrade Failure Other % Rutting: Percentage of length of section with evident rutting
– i.e., length identified divided by 4 x the length (4 wheel tracks)
% Length of Inadequate SWC: This is the percentage length of side water channel
which would not effectively remove water from the pavement structure – i.e., length identified divided by 2 x the length.
3. Adjacent Sections If the length under consideration has a pavement of the same age as adjacent sections and these sections have recently been rehabilitated, then mark “Yes”. Otherwise mark “No”. 4. History 4.1 Top Surface
The “previous treatment” is the surfacing applied most recently. “Type” is the type of treatment defined in terms of the following codes:

AC
COAT1
COAT2
CONC
FC
LOCK
OGEM
RSEAL
Asphaltic Concrete
First Coat Seal
Second Coat Seal
Concrete
Friction Course
Locking Coat Seal
Open Graded Emulsion Mix
Reseal
SLRY
TEXT
TWO1
TWO2
TWORS
VFILL
Slurry Seal
Texturising Seal
Two Coat Seal at First Surfacing
Two Coat Seal at Second Surfacing
Two Coat Seal as a Reseal
Void Fill Seal
Year is the year in which the last treatment was placed. The “next treatment due” is the surfacing which would be applied if rehabilitation was not programmed.
4.2 Pavement
The “previous treatment” is the most recent rehabilitation treatment on the project section. The type is to include depth of treatment and material used – e.g., 100 AP40 or 450 AP 65/AP40. Material description can be any of the following: • Granular Basecourse • Structural Asphaltic Concrete • Stabilised
4.3 Roughness
The roughness history is the average roughness in NAASRA counts for the project section from the previous years national roughness surveys.
5. Other Factors 5.1 Miscellaneous
This information is an assessment of likely conditions based on the consultant’s local experience. Use rock, gravels, sand, silt, clay, organic, or specific own. Typical subgrade CBR may be able to be assessed based on local experience and recent investigations adjacent.

“Frost Heave/Moisture Sensitive” is to be an assessment of the susceptibility of the whole pavement structure, including subgrade to either of these problems.
5.2 Location
Urban is defined as all areas which have a regulatory speed of 70 km/hr or less. This is being recorded as there is a view that roughness is not as critical at lower speeds.
5.3 Traffic Volumes
This data should be the most recently published data for the project section. 5.4 Consultant Prioritisation
The consultant is to place all the proposed resurfacing treatments Resurfacing Prioritisation Data Reports within his/her network management area, into the order he/she would wish to see them prioritised. The total list is then to be subdivided into five equal portions (by report sheets and not by actual seal length) and their “prioritisation position” recorded on the sheet by ticking the appropriate box (i.e. highest priority 20% being ticked against the 80-100 box). The consultant should also indicate the major reason(s) he believes justifies the resurfacing treatment by ticking as appropriate against the safety, defects or seal ages boxes.
5.5 Comments
Annotate any other comments that you believe would have an important bearing on the decision-making process.

Rehabilitation Projects (Data Collection Sheet)
Region RP Start Date
SH RP End Compiled by
Length
Ex. Width Maintenance
Three Years Prior to June To Be Done If not Rehab’d
Completed Since Last June
1 yr ago 2 yrs ago 3 yrs ago
Areas of Pavement Repairs (m²)
Area of Surfacing Repairs (m²) Modes of Failure: Describe Rutting % Length of Inadequate SWC % Adjacent Sections
Adjacent Section
Section Under Inspection
Adjacent Section
Length of similar aged and construction pavements in similar environment situation rehabilitated in last 5 years 3km either side of this section.
History
Top Surface Pavement Type Year Type Year Previous Treatments Previous Treatment Next Treatment Due if not Rehab’d
Roughness History NAASRA Counts
1996 1995 1994 Other Factors
Miscellaneous Traffic Volume
Foundation Material AADT Subgrade Material & CBR % HCV Frost Heave/Moisture Sensitive Y/N
Urban Location (tick one) Rural
Consultant Prioritisation Comments: 80-100 60-80 40-60 20-40
Taking into account all the sections you are submitting for prioritisation in which 20% would you prioritise this particular section Tick Box: 100 = top priority 0-20
Consultant: ……………………………………………………… Date: ………………………

CHAPTER 2
SAFETY MANAGEMENT STRATEGY

CONTENTS
Chapter 2 Safety Management Strategy
1: Overview 1.0 Overview .................................................................................................................. 1 1.1 Definition and Purpose.............................................................................................. 1 1.2 The Roles.................................................................................................................. 2 1.3 The Components ....................................................................................................... 2 1.4 The Document........................................................................................................... 3 2: Development of the Safety Management Strategy 2.0 Overview .................................................................................................................. 5 2.1 Consideration............................................................................................................ 5 2.2 Content ..................................................................................................................... 7 2.3 Interaction with the Forward Programme .................................................................. 8 3: Information Requirements 3.0 Overview ................................................................................................................ 11 3.1 Data Processing....................................................................................................... 11 3.2 Crash Data .............................................................................................................. 11 3.3 Crash Reports.......................................................................................................... 12 3.4 Crash Reporting Network........................................................................................ 13 4: Identification of Safety Problem 4.0 Overview ................................................................................................................ 15 4.1 Information Sources ................................................................................................ 15 4.2 Crash Data Analysis................................................................................................ 16 4.3 Regular Inspections................................................................................................. 17 4.4 Special Inspection ................................................................................................... 18 4.5 Inspection Requirements ......................................................................................... 19 4.6 Safety Deficiencies ................................................................................................. 21 4.7 Reporting Requirements.......................................................................................... 24 4.8 Crash Site Monitoring ............................................................................................. 25 5: Work Programming 5.0 Overview ................................................................................................................ 27 5.1 General Work Categories ........................................................................................ 27 5.2 Data Sources ........................................................................................................... 28 5.3 Remedial Measures ................................................................................................. 38 5.4 Treatment Selection ................................................................................................ 30 5.5 Safety Projects Programme ..................................................................................... 31
6: Safety Intervention Strategies 6.0 Overview ................................................................................................................ 33 6.1 Overview ................................................................................................................ 33 6.2 Intervention Levels ................................................................................................. 34 6.3 Considerations ........................................................................................................ 34 6.4 Hazard Register....................................................................................................... 35 7: Consultant Capabilities 7.0 Overview ................................................................................................................ 37 7.1 Training .................................................................................................................. 37 7.2 Response................................................................................................................. 38 7.3 Consultant Safety .................................................................................................... 38 8: Future Developments ............................................................................................ 39

SECTION 1
PROCESS OVERVIEW
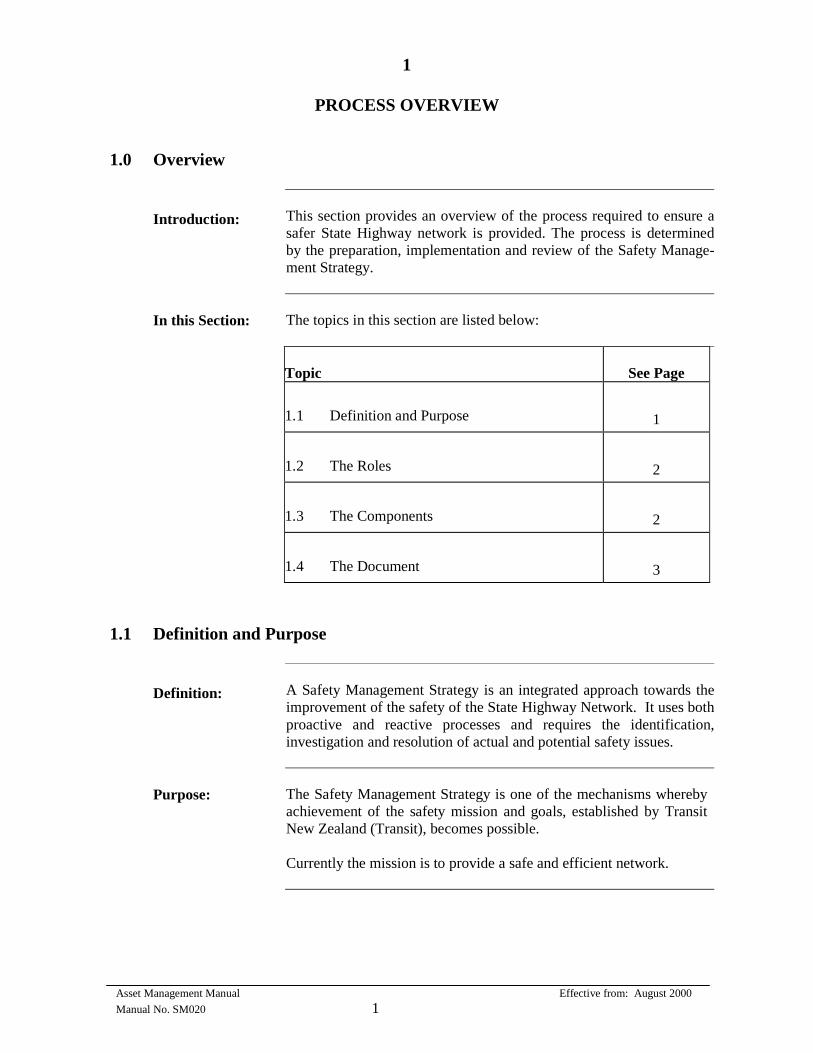
Asset Management Manual Effective from: August 2000 Manual No. SM020 1
1
PROCESS OVERVIEW
1.0
Overview
Introduction:
This section provides an overview of the process required to ensure asafer State Highway network is provided. The process is determinedby the preparation, implementation and review of the Safety Manage-ment Strategy.
In this Section:
The topics in this section are listed below: Topic
See Page
1.1 Definition and Purpose
1 1.2 The Roles
2 1.3 The Components
2 1.4 The Document
3 1.1
Definition and Purpose
Definition:
A Safety Management Strategy is an integrated approach towards theimprovement of the safety of the State Highway Network. It uses both proactive and reactive processes and requires the identification,investigation and resolution of actual and potential safety issues.
Purpose:
The Safety Management Strategy is one of the mechanisms whereby achievement of the safety mission and goals, established by Transit New Zealand (Transit), becomes possible. Currently the mission is to provide a safe and efficient network.
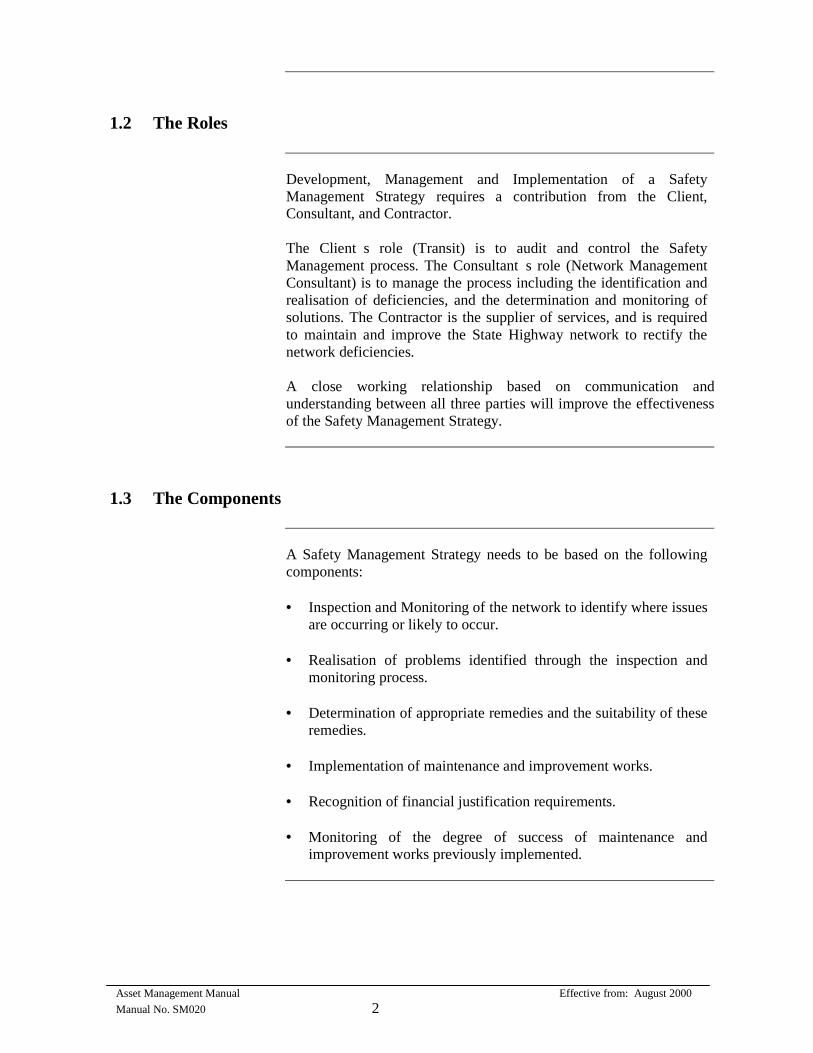
Asset Management Manual Effective from: August 2000 Manual No. SM020 2
1.2
The Roles
Development, Management and Implementation of a Safety Management Strategy requires a contribution from the Client, Consultant, and Contractor. The Client�s role (Transit) is to audit and control the Safety Management process. The Consultant�s role (Network Management Consultant) is to manage the process including the identification and realisation of deficiencies, and the determination and monitoring of solutions. The Contractor is the supplier of services, and is required to maintain and improve the State Highway network to rectify the network deficiencies. A close working relationship based on communication andunderstanding between all three parties will improve the effectiveness of the Safety Management Strategy.
1.3
The Components
A Safety Management Strategy needs to be based on the following components: • Inspection and Monitoring of the network to identify where issues
are occurring or likely to occur. • Realisation of problems identified through the inspection and
monitoring process. • Determination of appropriate remedies and the suitability of these
remedies. • Implementation of maintenance and improvement works. • Recognition of financial justification requirements. • Monitoring of the degree of success of maintenance and
improvement works previously implemented.

Asset Management Manual Effective from: August 2000 Manual No. SM020 3
1.4
The Document
The Safety Management Strategy is documented as the processes and procedures the Consultant has to implement and manage to ensure safety of the network. The document needs to be subject to continual review. The problems and issues associated with safety on the State Highway network are constantly changing in scope and extent and the strategy needs to be adapted accordingly. Specific requirements which need to be incorporated into thedocument, are identified throughout this chapter.

SECTION 2
DEVELOPMENT OF THE SAFETY MANAGEMENT STRATEGY
Asset Management Manual Effective from: August 2000 Manual No. SM020 5
2
DEVELOPMENT OF THE SAFETY MANAGEMENT STRATEGY
2.0
Overview
Introduction:
A Safety Management Strategy will reflect current Transit policy andprocedures. The Consultant’s knowledge of the State Highwaynetwork will need to be supplemented by the collection and analysis ofasset data. Implementation of remedies is arranged throughmaintenance or improvement programmes. Monitoring of the degreeof success of remedial works will contribute towards the continualimprovement of the Safety Management process.
In this Section:
The topics in this section are listed below: Topic
See Page
2.1 Considerations
5 2.2 Content
7 2.3 Interaction with the Forward Work
Programme
8
2.1
Considerations
Introduction:
Development of the Safety Management Strategy needs to beundertaken in recognition of the following: • policy and procedures
• local environment
• data requirements
• current programmes and strategies.
Consideration 1 - Policy and Procedures:
The Safety Management Strategy shall be prepared after consideration of at least the following documents: • Safety Management System Manual.
• Policy Guidelines for Traffic Accident Reduction and Prevention.
Asset Management Manual Effective from: August 2000 Manual No. SM020 6
• Safety Audit Policy and Procedures.
• Accident Investigation Procedures.
• National and local Transit standards and policies, especially those relating to the provision of safety services and maintenance, seal widths and other safety works.
Requirements of the State Highway Control Manual and the TransfundProgramme and Funding Manual, particularly as they relate to thejustification, approval and funding of works.
Consideration 2 - Local Environment:
The Safety Management Strategy needs to be prepared after consideration of the local environment. Factors which need to be considered include:
• Inputs from the client, public, road safety committees and other agencies.
• Knowledge of local conditions and special events and features which may impact on highway safety.
• Local weather conditions, including storm history.
Highway usage (e.g., traffic volumes, % and type of heavy vehiclecomponent, growth, numbers of overseas tourists).
Consideration 3 - Data Requirements:
A certain amount of data relating to condition or deficiency of the asset will be available from separately arranged studies or surveys. This data needs to be supplemented by inspection of the State Highway network. Asset data can be obtained from the following sources:
• LTSA AIS database • SCRIM data • RGDAS data • RAMM condition rating and roughness • Strategy Studies or Crash Reduction Studies • Regular highway inspections • Special highway safety inspections • Other special safety studies
Consideration 4 - Current Programmes and Strategies:
The Safety Management Strategy shall recognise existing programmes and strategies and their effectiveness. These programmes and strategies include:
• Pavement Management Strategy • Maintenance Intervention Strategies • Forward Works Programme • Current Safety Management Strategy • Current Safety Intervention Strategies
Asset Management Manual Effective from: August 2000 Manual No. SM020 7
2.2
Content
Introduction:
The Safety Management Strategy shall determine the required procedures for the following tasks: • Identification and realisation of problems and issues. • Determination and implementation of remedial measures. • Performance review of completed projects and tasks.
Identification and Realisation:
The identification of sites and routes where there are safety deficiencies relies on the collation of data from official sources (e.g., LTSA AIS database, Crash Reduction Studies) and other fault recording systems established by the Consultant. These systems shall include: • Procedures for establishing and maintaining a network of safety
and crash reporting contacts. • The maintenance and updating of a local area crash database to
supplement and cross reference the LTSA AIS database. • Procedures for addressing safety related concerns from the
general public, local authorities and other organisations. • Procedures for the establishment of a network inspection system
aimed at both prevention and cure.
Remedy:
Procedures are required for the determination of appropriate treatments and remedial measures to address existing or potential deficiencies. Remedial measures may be implemented by one or more of the following methods:
• Inclusion in pavement or safety maintenance programmes.
• Correction of maintenance defects through existing maintenance contracts.
• Inclusion in improvements programmes - e.g., Minor Safety Works or Safety Improvements programmes.
• Incorporation into other improvements being implemented at the
site (e.g., shape correction). • Opportunities other than the NLTP - e.g., education on changing
highway use.

Asset Management Manual Effective from: August 2000 Manual No. SM020 8
Proactive resolution of safety deficiencies is also required of theNetwork Maintenance Contractors. By communication to theContractor of the clients expectations relating to the identification and remedy of safety maintenance works, proactive or reactive problemsand solutions can be identified and implemented at the earliestopportunity. Communication of the client’s expectations occurs by thedevelopment of the Safety Intervention Strategy (SIS) (refer Section 6).
Performance Review:
The Safety Management Strategy shall be subject to constant review. The Consultant shall look for continuous improvements of the processes contained within the document. The adequacy of completed maintenance and improvement works shall be monitored. The minimum level of monitoring required is as follows: • During special safety inspections the general adequacy of
completed works shall be assessed. • For sites subject to Crash Reduction Studies the Consultant shall
record changes in the road environment and record implementationdates of completed works and record status change on the LTSAImplementation Report.
Capability: The Consultant shall provide and maintain the skills required to successfully develop, manage and implement the Safety Management Strategy. To effect this the Consultant shall: • Establish procedures for the safety of the Consultant’s staff and
the public during highway inspections and other on-site activity. • Provide on-going training of Consultancy staff in safety
inspection and safety deficiency identification and treatment. Ensure Contractors involved in network maintenance understand andimplement the requirements of the SIS.
2.3
Interaction with the Forward Work Programme
Introduction:
The Safety Management Strategy must be aligned to the production ofthe Forward Works Programme and the Maintenance InterventionStrategies. Feedback and input from the Safety Manager is requiredduring the preparation and review of these documents.

Asset Management Manual Effective from: August 2000 Manual No. SM020 9
Treatment Length Adjustments:
The Forward Works Programme is based on treatment lengths (uniformly performing contiguous lengths of pavement) and will not generally identify curves, intersections or other sites that may be the subject of a safety concern. These shorter lengths may: • Influence treatment selection on the length if this is sensible, or • be managed within the Forward Works Programme by the
identification of a new treatment length, or • be programmed for treatment as a minor safety works, or • be identified as a site specific maintenance treatment, and carried
out as part of the maintenance works programmes.

SECTION 3
INFORMATION REQUIREMENTS
Asset Management Manual Effective from: August 2000 Manual No. SM020 11
3
INFORMATION REQUIREMENTS
3.0
Overview
Introduction:
The key to successful safety management is the collection, collationand interpretation of relevant safety and crash data.
In this Section:
The topics in this section are listed below: Topic
See Page
3.1 Data Processing 11 3.2 Crash Data 11 3.3 Crash Reports 12 3.4 Crash Reporting Network 13
3.1
Data Processing
Requirements:
The Safety Management Strategy shall detail the Consultant�s proposals with respect to the maintenance and transfer of electronicdata. All data shall be made available to the Client in electronic format which is consistent with the format and software applicationsused by the Client.
3.2
Crash Data
Introduction:
The Consultant shall obtain and record crash data from the followingsources:
• The LTSA AIS database. • A network of local contacts established by the Consultant.
Importance:
The list of crashes officially reported by the New Zealand Police iscompiled into the LTSA AIS database. There is usually a delaybetween the crash occurring and the database being updated. Also in many areas under reporting of crashes is high especially at remoterural sites.

Asset Management Manual Effective from: August 2000 Manual No. SM020 12
The network of local contacts is intended to provide a prompt andmore comprehensive record of crashes. This provides the opportunity for the early identification of issues and a more extensive source ofcrash data.
LTSA AIS Database:
The Consultant must have ready access to the LTSA AIS database. Inaddition, Transit may hold records of crashes not reported by Policewhich will be made available to the Consultant. These records arecurrently held in a database compatible with the LTSA database toenable the crash details from both databases to be analysedsimultaneously using the LTSA�s crash analysis programme.
Local Area Database:
The Consultant shall provide a database for the collation of local crashreports. The Consultant shall establish a crash reporting network oflocal residents and organisations willing to provide data for the localarea database.
Database Maintenance:
Constant updating of each database is required so that early detection of actual or potential problems becomes possible. The frequency of updating shall be such that by 31 March each year the Consultant will hold all the previous calendar year�s crash records which appear in the LTSA AIS database and that the local area database will hold all reports for known crashes which occurred prior to 1 March that year. An updated copy of the local area database in electronic format andhard copy, shall be delivered to the Client together with the SafetyProjects Programme. Prior to delivery, records common to bothdatabases shall be removed from the local area database.
3.3
Crash Reports
Introduction:
The Safety Management Strategy shall define the Consultants procedures for investigating and reporting on fatal crashes and theidentification of, reporting and recording of non-fatal crashes.
Fatal Crash Reports:
The consultant shall prepare appropriate crash reports on all fatal crashes, and any serious crashes for which the client requests a report. Where crashes are of a more serious nature involving multiple deaths (e.g., passenger bus) or where highway conditions appear to have been a major contributing factor, the client is to be verbally advised of the circumstances as soon as practical with an interim report.
Asset Management Manual Effective from: August 2000 Manual No. SM020 13
In the formal fatal crash report: • The route position must be accurately defined. • A plan will only be required when specifically requested by the
client. The latest skid resistance test results from the high speed datacollection programme shall be provided together with an interpretationof the results and a recommendation for any action.
Non Fatal Crash Reports:
Other crashes will be recorded on a “Road Crash Record” report form with a copy being forwarded to the client with the Consultant�s monthly report. The “Road Crash Record” form records data in aformat compatible with the electronic LTSA database. A one pageform is currently being developed by the NZ Police.
3.4
Crash Reporting Network
Introduction:
The Safety Management Strategy shall define the consultant’s proposals for the development, extension and maintenance of a crashreporting network.
Contact Network:
To obtain accurate and complete information relating to safety issueson the state highway network, a network of contacts should be established. These contacts need to provide details of crashes andincidents which occur at specific sites or on a particular length ofhighway and will supplement the details being supplied by Police andmaintenance contractors.
Site Selection:
The development of contacts is more important on remote sections ofstate highways where official crash data reporting is very often limited and where the consultant believes the crash rate may be increasing butwhere crashes are unlikely to be attended or recorded by Police. It is important that all crashes are reported, particularly non-injury crashes.
Personnel:
Appropriate personnel for inclusion in the crash reporting network could include, but not be limited to: • NZ Police, particularly in remote locations • Emergency services such as ambulance and NZ Fire Service • Service Stations • Crash recovery and tow truck operators

Asset Management Manual Effective from: August 2000 Manual No. SM020 14
• Service authorities such as Telecom and ESA�s • District Council staff and councillors • Reliable residents living adjacent to the site • Transport companies
Black Spot Development:
The network of contacts shall be developed to foster trust andunderstanding for the motives behind seeking safety related feedback.In particular the consultant shall establish a proactive response to avoid, wherever possible, the development of crash black spots.
Schedule of Contacts:
A copy of the schedule of all the contacts in the consultants crash reporting network together with their contact addresses and telephone numbers shall be supplied to the client with the update of the local area crash database. Copies of the “Road Crash Record” form shall be distributed, togetherwith self addressed envelopes, to all contact personnel.

SECTION 4
IDENTIFICATION OF SAFETY ISSUES

Asset Management Manual Effective from: August 2000 Manual No. SM020 15
4
IDENTIFICATION OF SAFETY ISSUES
4.0
Overview
Introduction:
The identification of safety issues requires the collection of data fromseveral sources and the subsequent realisation that there is a problemor issue which needs to be investigated and resolved.
SMS Document:
The procedures for identification and remedy of safety issues shall beincluded within the Safety Management Strategy.
In this Section:
The topics in this section are listed below: Topic
See Page
4.1 Information Sources 15 4.2 Crash data analysis 16 4.3 Regular Inspections 17 4.4 Special Inspections 18 4.5 Inspection Requirements 19 4.6 Safety Deficiency Database 21 4.7 Reporting requirements 24 4.8 Crash site monitoring 25
4.1
Information Sources
Introduction:
Data sources are discussed in Section 2.1. SCRIM, RGDAS, RAMMLTSA AIS and the consultant’s local area database data need to besupplemented by: • regular inspections of the highway network to identify deficiencies,
and • consideration of separate studies (e.g., Strategy Studies, Crash
Reduction and Monitoring Studies, and other special safetystudies)
Asset Management Manual Effective from: August 2000 Manual No. SM020 16
Inspections: Inspection of the highway network needs to be undertaken:
• in conjunction with the inspection and monitoring of maintenance contracts.
• as special safety inspections at the frequency defined by the client.
Other Studies:
Crash Reduction Studies and Strategy Studies will have separatelyidentified most of the safety issues and problems relevant to the highway. The Consultant will be advised by the Client as to how thesolutions provided will be investigated further. Approved works willneed to be incorporated into maintenance activities or included in theForward Works Programme.
4.2
Crash Data Analysis
Introduction:
The information in the LTSA AIS database and the local area database will facilitate the identification of safety deficiencies or potential safety problems. These databases will also enable analysis of crash rates at specific sites and along sections of highway. Trends in crash rates and the types andnature of crashes occurring will also be provided. This is likely toidentify where route or mass action treatments may be appropriate.
SMS Document:
The Safety Management Strategy shall define the consultants procedures relating to the analysis of these databases, both on acontinuous basis and for specific purposes.
Triggers:
It is expected that the Consultant�s procedures for crash database analysis will incorporate “triggers”�which will alert the consultant to the development of a safety related problem. One “trigger” should at least recognise a second crash at a specific location within a twelve month period. This would then enable the consultant to establish whether a common cause to the crashes existed and, if so, whether and how it should be addressed by the Client. Other “triggers” will need to be developed to assimilate crash trendsthat warrant further investigation.
Frequency of Analysis:
Prior to carrying out special safety inspections the Consultant shall analyse the LTSA and local area crash databases, to identify any common locations, trends or conditions which may be indicating potential safety problems.

Asset Management Manual Effective from: August 2000 Manual No. SM020 17
This will enable the safety inspectors to pay particular attention to those locations or features which may be contributing to particular safety problems and identify where more detailed inspection and analysis may be necessary. Analysis of the database shall not be confined, however, solely to the period prior to special safety inspections. Ongoing database analysis isrequired in conjunction with the day to day process of identification ofsafety issues.
4.3
Regular Inspections
Introduction:
The identification and remedy of deficiencies or potential safety problems should be occurring continuously and not only inconjunction with special safety inspections. The Consultant shall monitor the network for safety deficiencies inconjunction with other activities undertaken on the highway.
SMS Document:
The Safety Management Strategy shall define the practices andprocedures to be adopted for identifying, recording and addressingsafety issues in the course of the Consultants regular contractssurveillance activities, and other normal use of the highway.
Procedures:
As part of the quality assurance checking and regular inspections of maintenance contracts, the Consultant shall attend to any items which impact on highway safety. Irrespective of whether or not they relate to the works being inspected, the consultant shall adopt the inspection practices and procedures which are most likely to identify, and remedy any obvious new or existing condition which may effect highway safety. The timing of special safety inspections may preclude the Consultant from identifying deficiencies relating to: • rank spring vegetation growth • flushing development • snow and ice problems • frost heave The network needs to be inspected to ascertain where thesedeficiencies may exist. This shall be undertaken in conjunction with maintenance contract monitoring inspections and other networkactivities.
Asset Management Manual Effective from: August 2000 Manual No. SM020 18
Temporary Traffic Control:
At all times the Consultant will take particular note of any temporary traffic control being provided. This includes work not under the Consultant�s control. Any deficiencies identified must be addressed by the Consultant immediately, irrespective of who is or should be responsible for the provision of temporary traffic control. In the monthly report the Consultant shall list all actions taken with respect to inadequate traffic control. The report shall detail:
• the deficiency identified • the Contractor responsible • the organisation who engaged the services of the Contractor • remedial actions taken and the outcome.
4.4
Special Inspections
Introduction:
Special safety inspections shall be arranged by the consultant at thedefined frequency.
SMS Document:
The Safety Management Strategy shall include a detailed programmeof the proposed highway safety inspections. No change to the programme shall be made without prior Client agreement as the clientmay wish to programme subsequent or associated activities.
Inspection Types:
Inspections will be carried out by the Consultants Safety Manager andother appropriately trained and experienced staff, to the consultantsprogramme, and at a frequency not less than that detailed in thecontract document. The type of special safety inspections required are:
• daytime • night time and • side road.
Programme Consideration:
A daytime and nighttime inspection is to be carried out within a month prior to the Consultants development and reviews of the Safety Intervention Strategy and Safety Projects Programme. When programming the Daytime, Nighttime and Side Road inspections it should be noted that:

Asset Management Manual Effective from: August 2000 Manual No. SM020 19
(i) An inspection carried out in July/August with the Safety
Inspection Report and Safety Projects Programme being provided to the client by the end of August enables:
• Minor safety projects identified to be included in the current financial years programme;
• Safety construction items to have Minor Safety Reports or Simplified Procedure Reports completed in time for the project to be included in the National Roading Programme for the following financial year;
• Other identified works to be programmed and completed early in the construction season and before holiday periods.
(ii) An inspection carried out in January/February with the Safety
Inspection Report and Safety Project Programme being provided to the client by the end of February enables:
• Urgent works to be addressed in the current construction season.
• Funding for non-urgent works to be obtained through financial reviews with a view to having the works completed within the current financial year and during the late construction season.
• Safety work to be completed before onset of autumn/winter weather patterns.
4.5
Inspection Requirements
Purpose:
The object of the highway safety inspections is to:
• identify existing and potential safety problems
• determine their causes
• determine appropriate measures to remove, mitigate or contain theproblem, and
• categorise the measures in terms of urgency of attention.
Pre-Inspection Analysis:
Prior to carrying out the inspections, the Consultant shall assess andanalyse the LTSA and local area crash databases together with anyother details and information he has received relating to highwaysafety issues. The Consultant is required to identify any commonlocations, trends or conditions which may be indicating potential safety problems.

Asset Management Manual Effective from: August 2000 Manual No. SM020 20
The safety inspectors shall be briefed to pay particular attention to those locations or features which may be contributing to particular safety problems, making detailed inspections where necessary. Notwithstanding the fact that some of the following items are addressed in regular inspections, special safety inspections will address, but not be limited to, the following: Visibility • Vegetation and Tree Growth Control (applies to both visibility
and ice reduction) • Visibility/Intervisibility • Nighttime visibility • Intersection conspicuity Traffic Services • Signs (permanent and temporary) • Pavement Marking • Flush medians • Delineation/Bridge End Markers/RRPM’s/Edge Marker Posts/
Hazard Markers (condition, cleanliness, suitability) Road Condition • Surfacing condition (skid resistance, ride) • Small traffic splitter islands • Guardrailing/side protection • Slow vehicle bays • Railway crossings • Highway geometry (horizontal/vertical) Services • Service Poles • Highway Lighting/flag lighting and deficiencies in level of
lighting Commercial Activities • Consequences of Advertising Signs (road and private property) • Consequences of unauthorised activities and developments
Specific Requirement – Daytime Inspections:
The Daytime Inspections following the analysis of crash data, will take the form of an extensive drive over the full length of the state highways in both directions. Whenever possible, inspection of a high-way section in both directions shall be completed in the same day. If pre-inspection crash analysis triggers a possible intersection deficiency, then a side road inspection shall be arranged at the site. The safety inspection shall be undertaken by the consultant's Safety Manager and at least one other suitably trained and qualified person.

Asset Management Manual Effective from: August 2000 Manual No. SM020 21
On at least one full inspection annually the Inspection Team shall include an appropriately qualified and experienced highway safety inspector/safety auditor who is not directly involved in the network management team and who is not a frequent user of the highways being inspected. Defects noted during this inspection will be recorded in a DeficiencyDatabase.
Specific Requirement - Nighttime Inspections:
The same requirements for the daytime highway safety inspections shall apply to the nighttime highway safety inspections with the following modifications and additions:
• Analysis of crash data shall attempt to identify locations where there are a significant number of night crashes.
• The nighttime safety inspection shall focus primarily on the aspects of the state highway network that are apparent during the hours of darkness.
The independent inspector/auditor is still required for one of the night-time inspections each year.
Specific Requirement – Side Road Inspections:
Side road safety inspections require the inspection of a minimum of 200 metres of the side road to identify safety deficiencies relating to vehicles approaching or turning off the state highway. The side road shall be inspected for both directions of travel. The Side Road Safety Inspection may be carried out in conjunction with a Daytime or Nighttime Highway Safety Inspection.
4.6
Safety Deficiency Database
Introduction:
The Consultant shall develop and maintain in electronic format asafety deficiency database to record information, priority and action with regard to each deficiency identified during regular or specialinspection, or reported by the client or other sources. Copies of this database shall be provided to the client in hardcopy orelectronic format at the conclusion of the contract term and at any other time upon request from the client.
SMS Document:
The Safety Management Strategy shall detail the consultants proposalsfor the development, updating, maintenance, and use of the SafetyDeficiency Database and the associated classifying and prioritisationof remedial works.
Asset Management Manual Effective from: August 2000 Manual No. SM020 22
Information Required:
The database shall record at least the following information: Locality Data • State Highway Number
• Route Position by Reference Station Number and Displacement. For deficiencies and problems which are not site-specific both the Route Positions at the start (lowest RP) and Route Position at the end (highest RP) will be recorded.
• Deficiency location (e.g., RHS or LHS; 3m from edge of seal). Deficiency data • Description of the deficiency (a site-specific explanation of the
problem).
• Priority to be accorded for addressing the problem.
• Action required - A brief description of the proposed course of action.
• Tasking action - the person or contractor who has been tasked to provide remedial measures or further action. A coding system maybe used.
Critical Dates • The date the safety deficiency was identified.
• The date each specified action was formally tasked.
• The date each tasked action was completed.
• The date all proposed actions were completed (noting that theprojects may not be executed but all the necessary actions forwhich the consultant is responsible have been completed).
Priority: The Safety deficiency database shall have one of the following priorities allocated to each item: Priority A • The safety of the road user is being endangered, work must be
implemented urgently to rectify the deficiency.
• Items which are a defect of the network maintenance contracts (e.g., vegetation obscuring traffic signs), repair required as soon as possible.
• Items which require urgent investigation before tasking of defect repairs or which are urgent but normally subject to economic justification, funding or programming restraints in which case a time-frame should be defined.
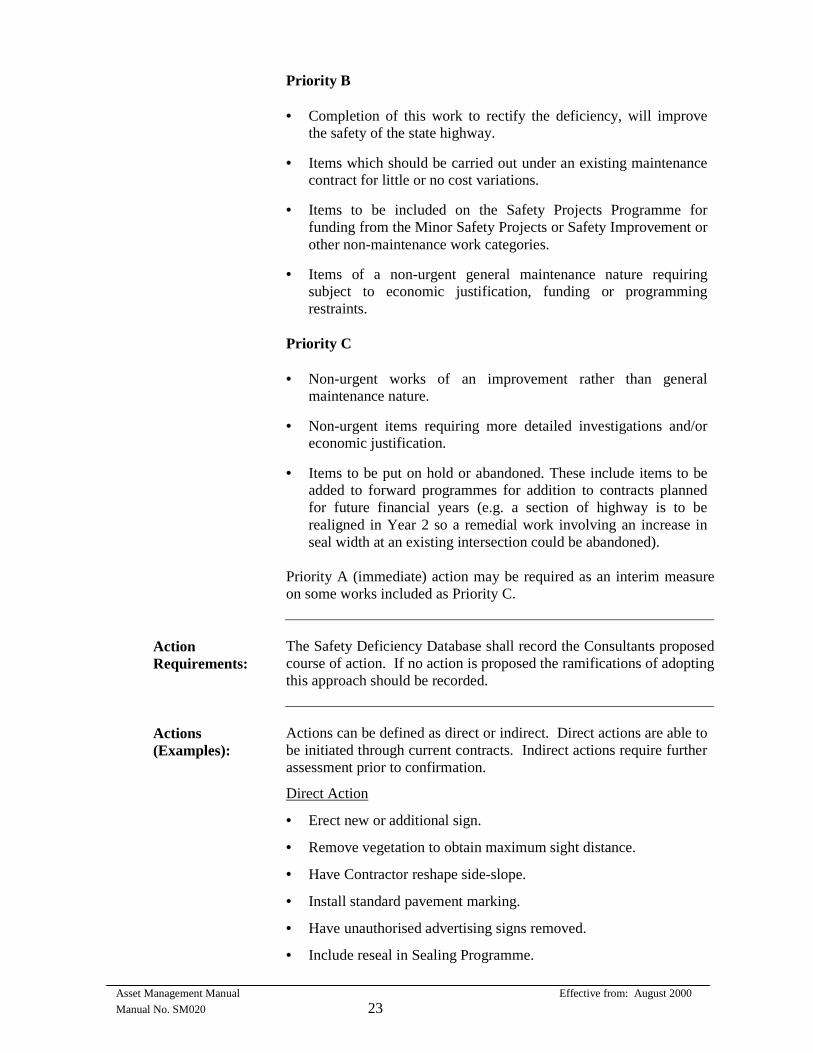
Asset Management Manual Effective from: August 2000 Manual No. SM020 23
Priority B • Completion of this work to rectify the deficiency, will improve
the safety of the state highway.
• Items which should be carried out under an existing maintenance contract for little or no cost variations.
• Items to be included on the Safety Projects Programme for funding from the Minor Safety Projects or Safety Improvement or other non-maintenance work categories.
• Items of a non-urgent general maintenance nature requiring subject to economic justification, funding or programming restraints.
Priority C • Non-urgent works of an improvement rather than general
maintenance nature.
• Non-urgent items requiring more detailed investigations and/or economic justification.
• Items to be put on hold or abandoned. These include items to be added to forward programmes for addition to contracts planned for future financial years (e.g. a section of highway is to be realigned in Year 2 so a remedial work involving an increase in seal width at an existing intersection could be abandoned).
Priority A (immediate) action may be required as an interim measureon some works included as Priority C.
Action Requirements:
The Safety Deficiency Database shall record the Consultants proposedcourse of action. If no action is proposed the ramifications of adopting this approach should be recorded.
Actions (Examples):
Actions can be defined as direct or indirect. Direct actions are able to be initiated through current contracts. Indirect actions require further assessment prior to confirmation.
Direct Action
• Erect new or additional sign.
• Remove vegetation to obtain maximum sight distance.
• Have Contractor reshape side-slope.
• Install standard pavement marking.
• Have unauthorised advertising signs removed.
• Include reseal in Sealing Programme.
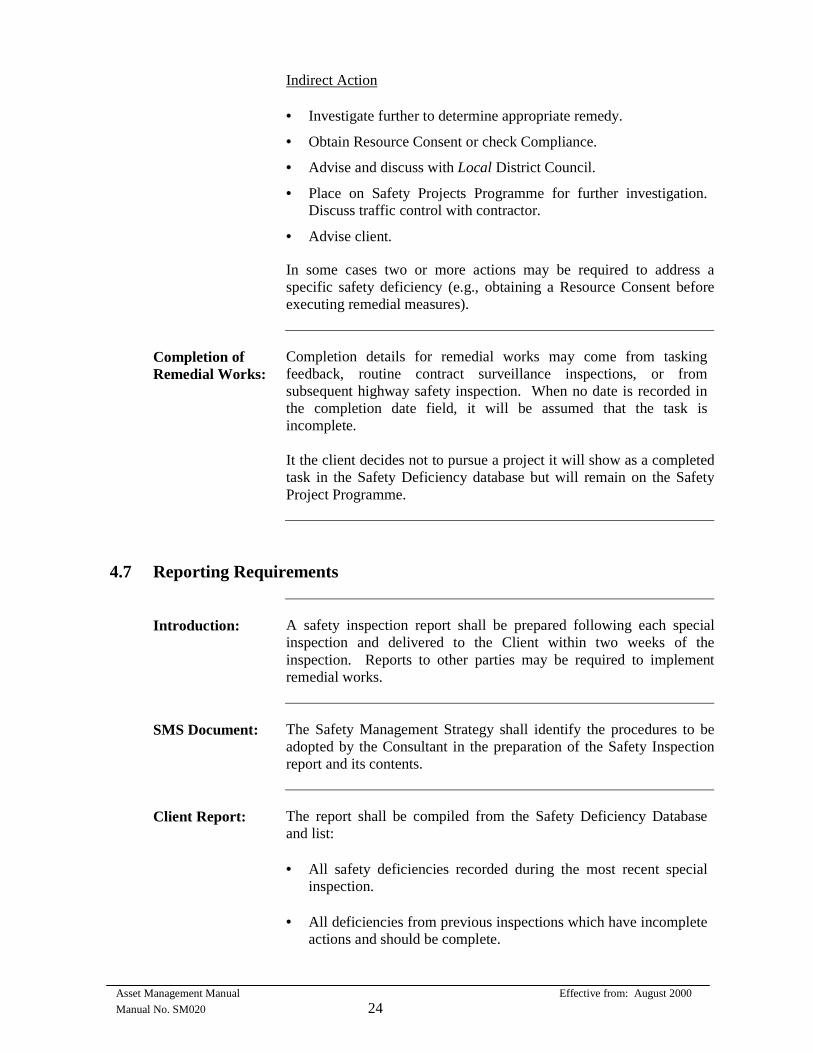
Asset Management Manual Effective from: August 2000 Manual No. SM020 24
Indirect Action • Investigate further to determine appropriate remedy.
• Obtain Resource Consent or check Compliance.
• Advise and discuss with Local District Council.
• Place on Safety Projects Programme for further investigation. Discuss traffic control with contractor.
• Advise client.
In some cases two or more actions may be required to address aspecific safety deficiency (e.g., obtaining a Resource Consent beforeexecuting remedial measures).
Completion of Remedial Works:
Completion details for remedial works may come from tasking feedback, routine contract surveillance inspections, or from subsequent highway safety inspection. When no date is recorded in the completion date field, it will be assumed that the task is incomplete. It the client decides not to pursue a project it will show as a completed task in the Safety Deficiency database but will remain on the SafetyProject Programme.
4.7
Reporting Requirements
Introduction:
A safety inspection report shall be prepared following each specialinspection and delivered to the Client within two weeks of theinspection. Reports to other parties may be required to implementremedial works.
SMS Document:
The Safety Management Strategy shall identify the procedures to beadopted by the Consultant in the preparation of the Safety Inspection report and its contents.
Client Report:
The report shall be compiled from the Safety Deficiency Database and list: • All safety deficiencies recorded during the most recent special
inspection. • All deficiencies from previous inspections which have incomplete
actions and should be complete.

Asset Management Manual Effective from: August 2000 Manual No. SM020 25
• All deficiencies from previous inspections which practically have
completion dates subsequent to the most recent special inspection. • Improvement works completed since the previous special
inspection. • Other works completed since the previous special inspection. The deficiencies shall be listed in state highway and route positionorder.
Other Reports:
In addition to the safety inspection report, it is envisaged that the Consultant will also prepare a variety of other reports from the safety deficiency database, to assist in identifying to specific contractors or other agencies, the deficiencies they may be required to address. For example, a report based on the field which identifies to whom further action has been tasked.
4.8
Crash Site Monitoring
Introduction:
The Consultant shall monitor routes and sites being investigated as part of Crash Reduction Studies to determine changes in road condition, signage or other factors which may affect safety. Where Crash Reduction Studies and monitoring of all CRS sites is undertaken by a consultant under separate contract, the Consultant shall provide input to the monitoring process and note the output. The Consultant shall provide a nominee with experience in CRS’s and who is conversant with the SH being monitored. The nominee will provide:
• Input of local knowledge.
• Details and implementation of previous work done at old or new sites (routine maintenance activity).
• Expertise as a liaison person for the full resources of the consultant’s database and other relevant expertise.
• Ongoing liaison with the Client and the CRS monitoring consultanton all matters pertaining to CRS reporting and implementation.
SMS Document: The Safety Management Strategy shall identify the specific items to beaddressed in each monitoring inspection and how inspections will beresourced and carried out to ensure all items are adequately covered.

Asset Management Manual Effective from: August 2000 Manual No. SM020 26
Monitoring Report:
The Consultant shall provide by 31 March each year a report for each site or route monitored, covering the previous calendar year. The report shall detail: Site data • The Crash Reduction Study number. • The site number and name used in the study. • The inspection date and inspectors name. Implementation Status • LTSA implementation report for each site marked up with the
completed remedial works and status change noted • Details of any works identified for execution within the study but
not yet completed and comment on when any such works will be completed.
General comments on changes to and condition of the site. Adjacent Site Status • Other works completed within the year within 250 metres of the
site which may impact on safety at the site. • A schedule of crashes, both injury and non injury which occurred
at the site and 250 metres either side of the site during the yearincluding those from the consultants local area database.

SECTION 5
WORK PROGRAMMING

Asset Management Manual Effective from: August 2000 Manual No. SM020 27
5
WORK PROGRAMMING
5.0
Overview
Introduction:
Following the identification of safety deficiencies and potentialproblems, analysis is required to identify a proposal for addressingeach deficiency. Remedial works will be identified as maintenanceworks or improvements.
SMS Document:
The Safety Management Strategy shall detail the procedures whichshall be used to ensure all known safety deficiencies are identified forprogramming, categorised and tasked.
In this Section:
The topics in this section are listed below: Topic
See Page
5.1 General Work Categories 27 5.2 Data sources 28 5.3 Remedial measures 28 5.4 Treatment Selection 30 5.5 Safety Projects Programme 31
5.1
General Work Categories
Introduction:
The identified deficiencies which have been prioritised in the Safety Deficiency Database need to be further categorised to determinesubsequent actions.
Alignment with Strategies:
The Safety problems identified shall first be checked against theMaintenance Intervention Strategy (see Chapter 1) and the Safety Intervention Strategy applicable for each treatment length, prior to theimplementation of any programme of action.
Categories:
The solutions to identified safety deficiencies will usually be able to be split into one of the following categories :

Asset Management Manual Effective from: August 2000 Manual No. SM020 28
• Reactive maintenance tasks that can be actioned automatically by
a maintenance contractor and which are paid for as part of a current contract.
• Maintenance tasks that are subject to a combination of: - economic justification - funding - programming constraints
• Tasks which improve rather than simply maintain the highway asset.
• Do nothing (accepting that on-going monitoring of the problem will occur as part of the Safety Management Strategy).
The categorisation selected should reflect the priority assigned to the remedial measures in the Safety Deficiency database. Irrespective of the work category the solution falls within, theConsultant shall take the actions which ensure remedial measures areundertaken or addressed in an appropriate manner and time frame. This will require all safety works, other than where the "do nothing"option is proposed, to be tasked or programmed.
5.2
Data Sources
The safety works to be programmed will include:
• Improvements identified within the Safety Deficiency Database.
• Those projects known to the Client which have been previously identified but not yet approved. The Client will provide to the Consultant a schedule of any such projects.
• Projects and other safety improvement works identified throughCrash Reduction and Monitoring Studies or by other agenciesincluding road safety committees, Police, LTSA and localauthorities.
5.3
Remedial Measures
Introduction:
Generally remedial measures requiring reactive maintenance will betasked directly to the appropriate maintenance contractor for inclusion in the work programme, with an appropriate prioritisation. Otherworks will require programming. Non-maintenance type emergency works shall be identified to the client immediately for a decision onhow they are to be addressed and funded.
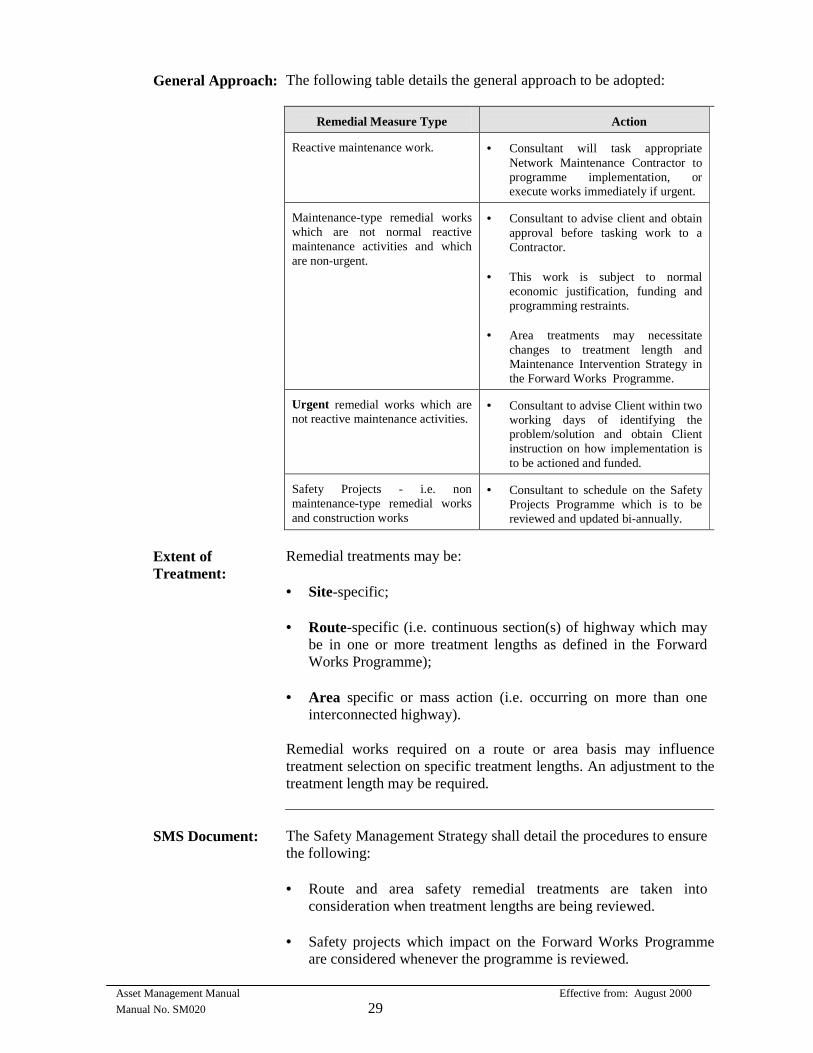
Asset Management Manual Effective from: August 2000 Manual No. SM020 29
General Approach:
The following table details the general approach to be adopted:
Remedial Measure Type Action
Reactive maintenance work.
• Consultant will task appropriate
Network Maintenance Contractor to programme implementation, or execute works immediately if urgent.
Maintenance-type remedial works which are not normal reactive maintenance activities and which are non-urgent.
• Consultant to advise client and obtain
approval before tasking work to a Contractor.
• This work is subject to normal
economic justification, funding and programming restraints.
• Area treatments may necessitate
changes to treatment length and Maintenance Intervention Strategy in the Forward Works Programme.
Urgent remedial works which are not reactive maintenance activities.
• Consultant to advise Client within two
working days of identifying the problem/solution and obtain Client instruction on how implementation is to be actioned and funded.
Safety Projects - i.e. non maintenance-type remedial works and construction works
• Consultant to schedule on the Safety
Projects Programme which is to be reviewed and updated bi-annually.
Extent of Treatment:
Remedial treatments may be: • Site-specific; • Route-specific (i.e. continuous section(s) of highway which may
be in one or more treatment lengths as defined in the Forward Works Programme);
• Area specific or mass action (i.e. occurring on more than one
interconnected highway). Remedial works required on a route or area basis may influence treatment selection on specific treatment lengths. An adjustment to thetreatment length may be required.
SMS Document:
The Safety Management Strategy shall detail the procedures to ensure the following: • Route and area safety remedial treatments are taken into
consideration when treatment lengths are being reviewed. • Safety projects which impact on the Forward Works Programme
are considered whenever the programme is reviewed.

Asset Management Manual Effective from: August 2000 Manual No. SM020 30
5.4
Treatment Selection
Introduction:
In many instances a particular deficiency could be addressed by a number of solutions, with a range of costs and degrees of risk. There isa need to determine which treatment is most appropriate for eachproblem being addressed.
SMS Document:
The Safety Management Strategy shall detail the procedures to be adopted for treatment selection. Process definition is required for theaddressing of individual safety problems and providing the client withan understanding on the assessment and assignment of risk relating tothe adoption of alternative treatments or practices.
Considerations:
The solutions may cover a significant range of costs and have various degrees of risk (i.e. varying success rates, effective over different time spans, offering additional benefits to road users). The selection of a single treatment to be adopted in each instance toaddress a particular safety deficiency does not optimise opportunitiesfor innovation, efficiencies, and the use of maintenance funds. There isa need to determine which treatment within the spectrum of low-cost/high-risk to high-cost/low-risk treatments is most appropriate for each problem being addressed.
Treatment Selection Example:
A slick or flushed surface which appears to be contributing to loss of control type accidents could be addressed by, at least: • pavement burning
• removal of surface binder by other techniques (e.g. waterblasting)
• application of diluent and chip
• resealing or resurfacing using a number of techniques
• overlaying with a granular material or high void content material
• cold milling or rip and remake repair
• removal of the surfacing layer and resealing Clearly the solution will depend on the extent of the problem area, itslocation, other future works proposed on the treatment length in theForward Works Programme, economic justification and programming/funding restraints. Strategies therefore need to be developed to ensurethe most appropriate treatment is selected.

Asset Management Manual Effective from: August 2000 Manual No. SM020 31
5.5
Safety Projects Programme
Introduction:
A Safety Projects Programme is to be prepared and reviewed monthly and reported at the normal monthly client liaison meeting.
SMS Document:
The Safety Management Strategy shall detail the format of theConsultants Safety Projects Programme and the procedures which willbe used to develop, review and maintain it.
Work Categories:
Based on the preliminary investigations, previous economic or other analysis, these safety projects will be separately scheduled in the Safety Projects Programme as either : • Minor Safety Projects; or • Safety Improvement Projects. The definitions relating to this categorisation are contained in theTransfund Programme and Funding Manual.
Programme Requirements:
The details to be shown in the Safety Projects Programme for each item will include: • State Highway Number. • Route Position by Reference Station Number and Displacement
(for both start and finish if not site-specific). • Name and description of project • Cost Estimate • Benefit/Cost Ratio, if known • The "status" of the Cost Estimate and B/C which will indicate the
level of accuracy for this data and when it was determined. • The consultant's assessed priority for the project. This will enable
Minor Safety Project works for which B/C's can not be readily determined with any accuracy to be considered for funding.
• Comment should also be provided on how the project may interact
with any other project or works proposed.
Example:
The table below indicates the minimum information requirements for aSafety Projects Programme.
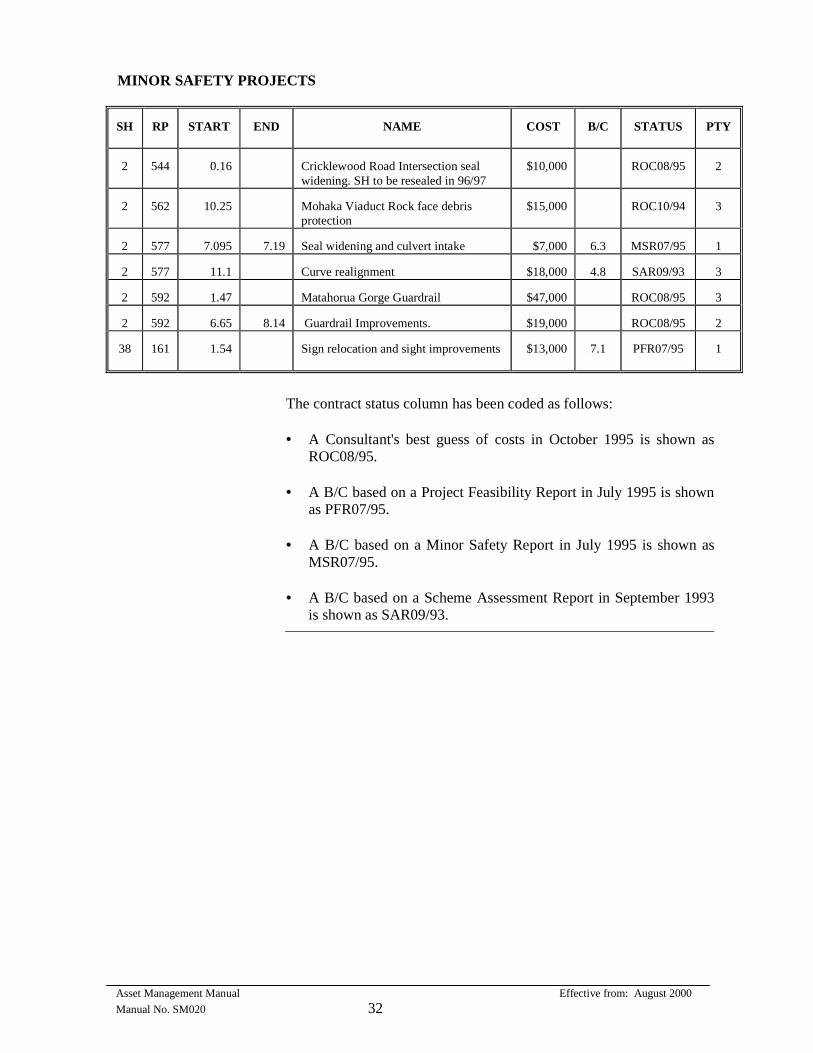
Asset Management Manual Effective from: August 2000 Manual No. SM020 32
MINOR SAFETY PROJECTS
SH
RP
START
END
NAME
COST
B/C
STATUS
PTY
2
544
0.16
Cricklewood Road Intersection seal widening. SH to be resealed in 96/97
$10,000
ROC08/95
2
2
562
10.25
Mohaka Viaduct Rock face debris protection
$15,000
ROC10/94
3
2
577
7.095
7.19
Seal widening and culvert intake
$7,000
6.3
MSR07/95
1
2
577
11.1
Curve realignment
$18,000
4.8
SAR09/93
3
2
592
1.47
Matahorua Gorge Guardrail
$47,000
ROC08/95
3
2
592
6.65
8.14
Guardrail Improvements.
$19,000
ROC08/95
2
38
161
1.54
Sign relocation and sight improvements
$13,000
7.1
PFR07/95
1
The contract status column has been coded as follows: • A Consultant's best guess of costs in October 1995 is shown as
ROC08/95. • A B/C based on a Project Feasibility Report in July 1995 is shown
as PFR07/95. • A B/C based on a Minor Safety Report in July 1995 is shown as
MSR07/95. • A B/C based on a Scheme Assessment Report in September 1993
is shown as SAR09/93.

SECTION 6
SAFETY INTERVENTION STRATEGIES

Asset Management Manual Effective from: August 2000 Manual No. SM020 33
6
SAFETY INTERVENTION STRATEGIES
6.0
Overview
Introduction:
A Safety Intervention Strategy (SIS) shall form part of the SafetyManagement Strategy. The SIS shall be provided as a separatedocument and be used by Contractors as a guide to the programming and implementation of maintenance works.
SMS Document:
The Safety Management Strategy shall define the procedures to beadopted in preparing and reviewing the Safety Intervention Strategyand which will ensure the SIS fully covers all areas and aspects ofhighway safety covered by general maintenance operations.
In this Section:
The topics in this section are listed below:
Topic
See Page
6.1 Definition and Purpose 33 6.2 Intervention Levels 34 6.3 Considerations 34 6.4 Hazard Register 35
6.1
Definition and Purpose
Definition:
An SIS will define the basic approaches the Consultant will expect themaintenance contractors to adopt in their inspections, workprioritisation and programming, treatment selection, work execution, monitoring and recording, which will ensure the Clients expectationswith respect to safety maintenance activities are met and met in anefficient and cost-effective manner.
Purpose:
The SIS is applicable to all treatment lengths. The SIS shall be supplied to all the appropriate physical workscontractors and used as a guide by those contractors as to how safety-related matters should be addressed and assigned priority in theprogramming and execution of their contract works.
Asset Management Manual Effective from: August 2000 Manual No. SM020 34
Review:
Review of the SIS will be carried out continuously as required. Thefull SIS will be developed and formally reviewed annually inconjunction with the Safety Management Strategy and forwarded tothe client with the SMS for acceptance.
6.2
Intervention Levels
Definition:
The intervention level describes the level of deterioration at whichmaintenance works need to be considered. Deterioration could applyto:
• a safety service • facility or, • level of service being provided to the road user.
Previous Levels of Service:
Minimum acceptable levels of service are defined in the NRB StateHighway Maintenance Standards, Transit Specifications and othernational and local policy and standards. The intervention levels do not imply a minimum standard but rather when consideration for remedialworks is appropriate.
6.3
Considerations
The safety intervention strategies will take account of at least: • Traffic volumes, composition. • Speed environment. • Horizontal and vertical alignments. • Location of intersections, level crossings and other 'high demand'
areas.
• Driver expectation (noting that Transit's engineering expectationsmay not necessarily equate to motorists expectations and thatsatisfaction of all driver expectations may not be attainable).
Introduction: The SIS shall provide clear guidance to maintenance contractors andothers, on treatment selection, when addressing deficiencies.
Example 1:
The SIS may address the identification of maintenance needs on edge delineators beyond road works sites or on metal roads during wetweather conditions more specifically than the more generalised Transitstandards.
Asset Management Manual Effective from: August 2000 Manual No. SM020 35
Example 2:
The SMS will provide detailed guidance to the maintenance contractoron the identification, prioritisation and treatment of sections ofhighway which are flushed or have inadequate skid resistance andwhere clearly the extent and nature of the problem in one area is likelyto impact on highway safety to a far greater extent than in other areas.
6.4
Hazard Register
The Consultant shall include in the Safety Intervention Strategy a listby highway route position of all sites of possible recurring hazards(e.g., three or more crashes in the previous five calendar years). These sites shall be listed in the SIS to ensure that the contractorsinvolved in safety maintenance are aware of where their work needs tobe carried out to the highest standards, thus ensuring that no lack ofmaintenance of a safety feature could become a contributory factor in another crash. The list will also identify the sites which may justify additionalmonitoring and inspection by the Consultant as part of hisadministration of the maintenance works programme.
SECTION 7
CONSULTANT CAPABILITIES
Asset Management Manual Effective from: August 2000 Manual No. SM020 37
7
CONSULTANT CAPABILITIES
7.0
Overview
Introduction:
The Consultant shall be required to provide the appropriately trainedand experienced staff necessary to instigate, develop and manage theSafety Management Strategy.
In this Section:
The topics in this section are listed below: Topic
See Page
7.1 Training 37 7.2 Response 38 7.3 Consultant Safety 38
7.1
Training
Introduction:
The Consultant shall provide trained and experienced staff, capable ofundertaking safety inspections, audit and analysis.
SMS Document:
The Safety Management Strategy shall detail the Consultantsproposals for training his own staff and passing on knowledge andskills in Safety Management to others involved in highwayconstruction and maintenance activities.
Specific Requirements:
Consultancy staff must be suitably trained and experienced in safety inspections and safety audits of existing road facilities and proposed works. Only suitably qualified staff shall be allocated the following tasks:
• Safety inspections
• Crash analysis
• Crash reduction treatment selection
• Crash reduction analysis for Simplified Procedure Reports and minor safety reports.
The Consultant shall have a formal system of skill assessment andtraining needs analysis.

Asset Management Manual Effective from: August 2000 Manual No. SM020 38
Dissemination of Knowledge:
The knowledge and experience gained will be passed to othersinvolved in the construction and maintenance of highways whereappropriate. Transit wishes to expand the spread of expertise in safetyinspection and monitoring. To facilitate this, the client may nominate personnel to accompany and contribute to one or more Daytime and/orNight-time Inspection Teams. These persons may be a staff member from the LTSA, NZ Police Traffic Safety Branch or from a local authority or other agency.
7.2
Response
Introduction:
The Consultant shall provide prompt response to all safety issues.
SMS Document:
The Safety Management Strategy shall detail the procedures fordealing with questions relating to safety which will ensure accurate and timely responses are provided.
Specific Requirements:
All comments or queries regarding safety issues from road users, thepublic or other source received either by the client and forwarded tothe consultant, or received directly by the consultant, are to be investigated promptly and a written reply provided to the enquirer witha copy to the client if requested. If required an interim verbal replywill be provided to the enquirer or client.
7.3
Consultant Safety
Introduction:
The Consultant shall ensure that proper standard of safety is providedfor staff using the highway.
SMS Document:
The Safety Management Strategy shall detail the Consultant�s Traffic Management Plan and the procedures he shall adopt to maximise safety while operating on the highway.
Specific Requirements:
It is important that the consultant exercises in his own operations,highway safety practices to a standard as high as that expected of themaintenance and other contractors who work on the highway network. The consultant's inspection, surveillance and investigation activitieswill at times place his staff in positions of risk and/or impact onhighway safety. The consultant is therefore required to develop aTraffic Management Plan in terms of the requirements of Transit's latest Specifications or Codes of Practice covering his on-highway activities and to develop procedures for his operations which willmaximise highway safety while he is operating on the highway.

SECTION 8
FUTURE DEVELOPMENT

Asset Management Manual Effective from: August 2000 Manual No. SM020 39
8
FUTURE DEVELOPMENT
Dynamics:
The Safety Management Strategy, together with the associated SafetyIntervention Strategy, is a dynamic document. The strategy for the management of safety issues on the highwaynetwork may need to change as the Consultant becomes more aware ofthe following: • Local conditions and mechanisms which impact on highway
safety. • The effectiveness of various treatments used to resolve safety
issues. • Changes in technology relevant to the addressing of safety
deficiencies. • The specific problems experienced by road users on the state
highway network. • The SMS developed for one situation may well not be applicable
for other situations.
SMS Document:
The SMS will detail the procedures to be adopted to identify the need for changes within the SMS (and SIS) and ensure those changes areincorporated in the next formal review of the SMS (and SIS).