state machine diagrams (state chart in uml 1) specifying control (ref: chapter 11 bennett, mc robb...
Post on 21-Dec-2015
220 views
TRANSCRIPT

State Machine Diagrams (State Chart in UML 1)
Specifying Control(ref: Chapter 11 Bennett, Mc Robb
and Farmer)

• “A model of state behaviour in a state machine captures all possible responses of a single object to all the use cases in which it is involved.”(Bennett et al)
• models the different states that a class can be in and how that class transitions from state to state
• “depict the dynamic behavior of an entity based on its response to events, showing how the entity reacts to various events depending on the current state that it is in.” (agilemodelling.com)

• All objects have a STATE
What determines an object’s state?
What can change an object’s state?
How can we describe an object’s state?
Can an object respond differently to the same message depending on what state it is in?

e.g. Frogger
• A frog object can be ....
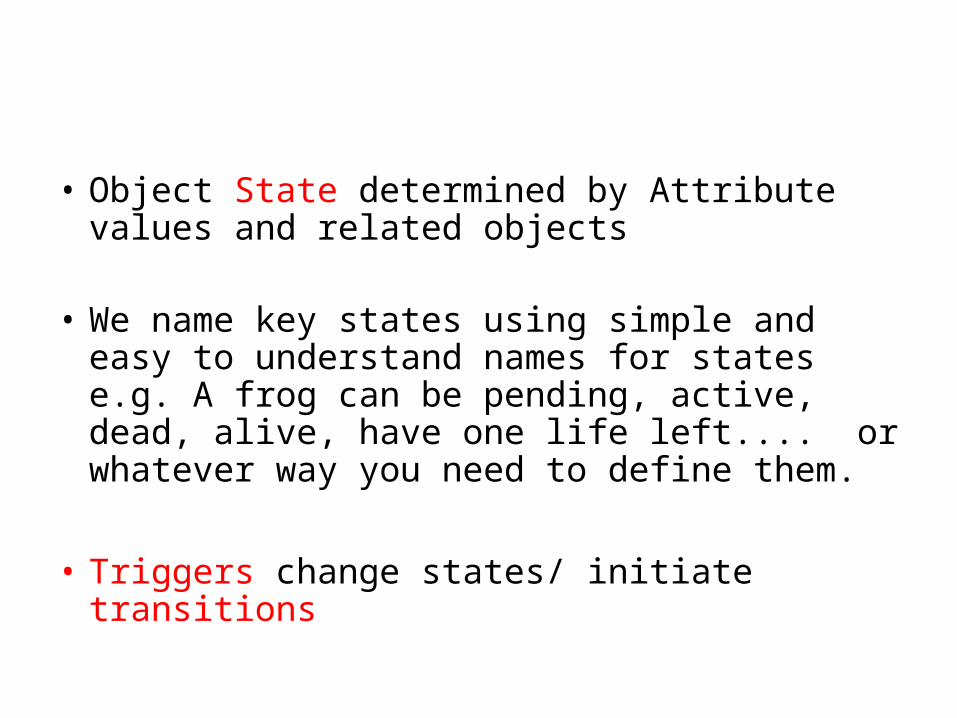
• Object State determined by Attribute values and related objects
• We name key states using simple and easy to understand names for states e.g. A frog can be pending, active, dead, alive, have one life left.... or whatever way you need to define them.
• Triggers change states/ initiate transitions

Triggers
• Triggers are events which start state changes in objects.
• Where have we seen the word ‘trigger’ used before?
A transition is the movement from one state to another

Types of trigger• Change trigger : some condition becomes true – described
as a boolean expression[...]– Need to distinguish from a guard condition [..] which is
evaluated when its associated event fires.
• Call trigger : object gets sent a message- described by message signature
• Signal trigger : Object receives a signal – described by signature
• Relative time trigger : passage of a designated amount of time after an event- described by time expressions

What triggers might affect the state of a frog?

Notation for state machine diagrams
–Each node is known as a vertex- black dot for start- arrows denote transitions and triggers can be specified for these
- - a state is a rounded box
- circled black dot for endstate

• See fig 11.1 page 306 Bennett et al

Example
• Draw the different states a current bank account can be in. Note that an account can be opened and closed.
• How will the response to a “withdraw money” event depend on the state of the bank account?

• Question “Black Hole” States. A black hole state is one that has transitions into it but none out.
• Question “Miracle” States. A miracle state is one that has transitions out of it but none into it.
(agilemodelling.com)

Example – lifecycle of a seminar(module)
(source: http://www.agilemodeling.com/style/stateChartDiagram.htm )

More detailed diagram
(A seminar is in the Open For Enrolment state when it has been flagged as open and there are seats available to be filled. adapted from source: http://www.agilemodeling.com/style/stateChartDiagram.htm )
Examples of guardsStart Initial state
trigger
Final state
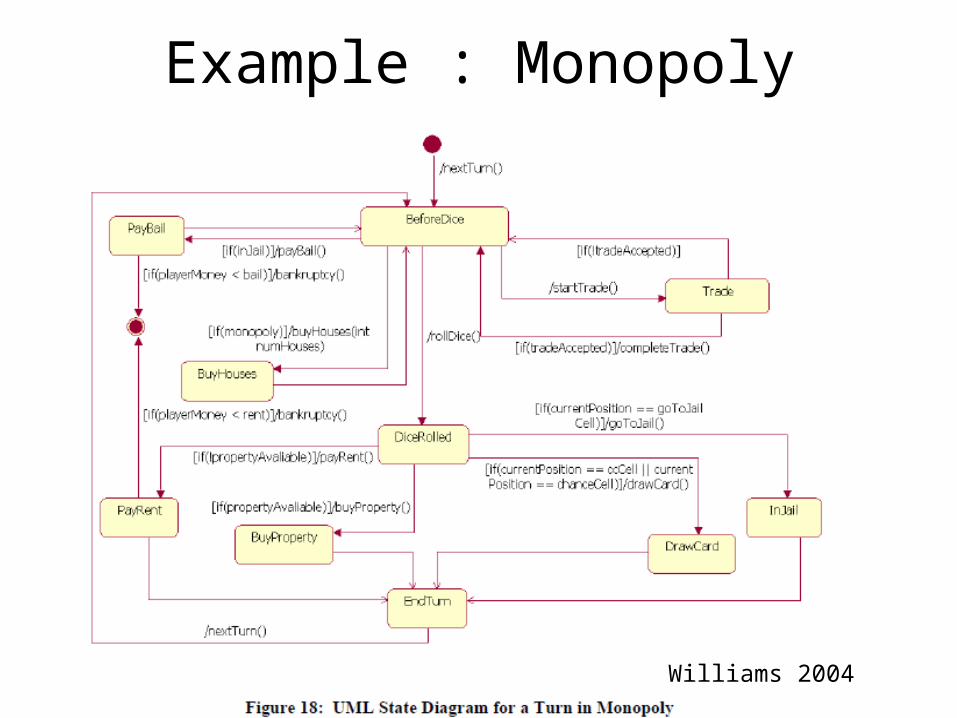
Example : Monopoly
Williams 2004

Adding detail• See fig 11.5 page 310 Bennett et al
• Note that more detail can go into the state box and that different activities can be specified for entry and exit
• See fig 11.6 page 310 Bennett et al• Note the detail for each transition:
– Trigger signature of the operation that triggered the transition– Guard condition ensuring that it is OK to transition– Activity expression listing things to do then

• Sequence or interaction diagrams can be used to help draw state machine diagrams as they show message passing between objects over time.
• We look at all messages sent to an object in all the interaction diagrams for use cases and examine the impact of these on the state of the object
• Through this identify what states the object might go through.

• See fig 11.18 page 321 Bennett et al

• See fig 11.19 page 322 Bennett et al• Note the active state expanded to provide
more detail • This means that we can have sub-states within
a state.

Lifecycle approach to state modelling
• Identify major system events and which classes they affect
• For each class affected draw rough (1st cut) state machine diagrams
• Examine and elaborate• Enhance with alternative scenarios• Review for consistency and check constraints

Concurrent States
See Bennett et al p332 Fig A4.4
• Note that an object’s state can be the product of two or more sub-states if different things can happen concurrently

History pseudostate
• See Bennett et al p331 Fig A4.3• See what happens when the campaign goes
into a suspended state. The history of where it was needs to be saved and re-instated when the suspended state ends.

Summary
• State machine diagrams show the dynamic behaviour of systems by showing the different states that objects can be in and the events/ triggers and rules that determine the transition from one state to another.

References
• http://www.agilemodeling.com/style/stateChartDiagram.htm
• Bennett et al Chapter 11