state of california • arnold schwarzenegger, governor ... · building green • buying green •...
TRANSCRIPT
BUILDING GREEN • BUYING GREEN • WORKING GREEN
Sta te o f Ca l i fo rn ia • Arno ld Schw arzenegger , Go vernor S ta te and Consumer Ser vices Agency
D E P A R T M E N T O F G E N E R A L S E R V I C E S Executive Office 707 Third Street West Sacramento, CA 95605 (916) 376-5000 Fax (916) 376-5018 • www.dgs .ca .gov
May 18, 2007 The Honorable Denise Moreno Ducheny, Chair Joint Legislative Budget Committee 1020 N Street, Room 553 Sacramento, CA 95814 Attn: Peggy Collins, Principal Consultant Dear Senator Ducheny: Pursuant to the requirements of the 2006 Budget Act, Item 1760-101-0022, the Department of General Services (DGS) is submitting the Analysis of Gaps In Statewide 9-1-1 Services report. In keeping with our commitment to encourage conservation, we have posted this report to our website. This report can be viewed at http://www.legi.dgs.ca.gov/Publications/2007LegislativeReports.htm. The report is entitled An Analysis of Gaps In Statewide 9-1-1 Services. If you wish to receive a printed copy of this report, please contact Daphne Rhoe, Chief, California 9-1-1 Emergency Communications Office, Telecommunications Division, Department of General Services at (916) 657-9494. Sincerely, Will Bush Interim Director cc: See attached distribution list
Daphne Rhoe, Chief, California 9-1-1 Emergency Communications Office, Telecommunications Division, Department of General Services
SUPPLEMENTAL REPORT LEGISLATIVE REPORT DISTRIBUTION LIST
ORIGINAL LETTER TO EACH OF THE FOLLOWING: The Honorable Denise Moreno Ducheny, Chair (Hand carry 17 copies) The Honorable Mark Leno, Chair Joint Legislative Budget Committee Assembly Appropriations Committee 1020 N Street, Room 553 State Capitol, Room 2114 Sacramento, CA 95814 Sacramento, CA 95814 Attn: Peggy Collins, Principal Consultant Attn: Geoff Long, Director The Honorable Denise Moreno Ducheny, Chair The Honorable John Laird, Chair Senate Budget & Fiscal Review Committee Assembly Budget Committee State Capitol, Room 5019 State Capitol, Room 6026 Sacramento, CA 95814 Sacramento, CA 95814 Attn: Danny Alvarez, Staff Director Attn: Chris Woods, Chief Consultant The Honorable Mike Machado, Chair Ms. Diane Boyer-Vine Senate Budget Subcommittee, #4 Legislative Counsel State Capitol, Room 5019 925 L Street, Suite 900, B-30 Sacramento, CA 95814 Sacramento, Ca 95814 The Honorable Juan Arambula, Chair Mr. Gregory Palmer Schmidt Assembly Budget Subcommittee, #4 Secretary of the Senate State Capitol, Room 2141 State Capitol, Room 400, E-22 Sacramento, CA 95814 Sacramento, CA 95814 The Honorable Tom Torlakson, Chair (Attn: Bob Franzoia, Director) Mr. E. Dotson Wilson Senate Appropriations Committee Chief Clerk of the Assembly State Capitol, Room 2206 State Capitol, Room 3196, E-24 Sacramento, CA 95814 Sacramento, CA 95814 Ms. Elizabeth G. Hill (Hand carry) Legislative Analyst 925 L Street, Suite 1000, B-29 Sacramento, CA 95814 ____________________________________________________________________________________________________________ COPY OF JLBC LETTER TO EACH OF THE FOLLOWING: The Honorable John Laird, Vice Chair Craig Cornett, Budget Director Joint Legislative Budget Committee Assembly Speaker’s Office State Capitol, Room 6026 State Capitol, Room 219 Sacramento, CA 95814 Sacramento, CA 95814 Seren Taylor, Fiscal Director The Honorable Dennis Hollingsworth, Vice Chair Senate Minority Fiscal Office Senate Budget & Fiscal Review Committee 1020 N Street, Room 234 State Capitol, Room 5064 Sacramento, CA 95814 Sacramento, CA 95814 Pete Schaafsma, Director The Honorable Roger Niello, Vice Chair Assembly Minority Fiscal Office Assembly Budget Committee State Capitol, Room 6027 State Capitol, Room 6027 Sacramento, CA 95814 Sacramento, CA 95814 Will Semmes, Chief Deputy Director The Honorable Dave Cox, Vice Chair Department of General Services Senate Appropriations Committee 707 Third Street, 8th Floor, Z-1 State Capitol, Room 2068 West Sacramento, CA 95605 Sacramento, CA 95814 Attn: Doug Yoakam, Minority Director Jan Boel, Deputy Director–Legislation Department of General Services The Honorable Mimi Walters, Vice Chair 707 Third Street, 8th Floor, Z-1 Assembly Appropriations Committee West Sacramento, CA 95605 State Capitol, Room 6027 Sacramento, CA 95814 Gary Fujii, Budget and Planning Officer Attn: Gina Sari, Minority Director Office of Fiscal Services Department of General Services Chris Kahn, Legislative Affairs Secretary 707 Third Street, 9th Floor, Z-1 Office of the Governor West Sacramento, CA 95605 State Capitol, First Floor, E-15 Sacramento, CA 95814 California State Library Government Publications Section Happy Chastain, Deputy Secretary-Legislation 914 Capitol Mall, E-29 State and Consumer Services Agency Sacramento, CA 95814 915 Capitol Mall, Room 200, C-14 Sacramento, CA 95814 Office of Legislative Counsel Attention: Indexing Division Diane Cummins, Fiscal Consultant 925 L Street, Suite 1150, B-30 Office of the Senate President pro Tem Sacramento, CA 95814 State Capitol, Room 412

Sacramento, CA 95814 Kathy Curtis, Principal Fiscal & Policy Analyst Legislative Analyst’s Office Originating Office 925 L Street, Suite 1000 Sacramento, CA 95814 SUPPLEMENTAL REPORT REVISED 4/20/07 Todd Jerue, Program Budget Manager Department of Finance 915 L Street, A-15 Sacramento, CA 95814
REPORT TO THE LEGISLATURE
ON
AN ANALYSIS OF GAPS IN STATEWIDE 9-1-1 SERVICES Supplemental Report of the 2006 Budget Act,
Item 1760-101-0022, #1
STATE OF CALIFORNIA
DEPARTMENT OF GENERAL SERVICES TELECOMMUNICATIONS DIVISION
Daphne Rhoe, Chief
California 9-1-1 Emergency Communications Office
February 2007
Report to the Legislature on AN ANALYSIS OF GAPS IN STATEWIDE 9-1-1 SERVICES
February 2007
California Department of General Services i Telecommunications Division
CONTENTS
EXECUTIVE SUMMARY………………………………………………… 1
INTRODUCTION…………………………………………………………. 2
NATIONAL 9-1-1 CALL STANDARDS………………………………... 4
CALIFORNIA 9-1-1 CALL STANDARDS..……………………………. 5
CALL DATA………………………………………………………………… 6
CONTRIBUTING FACTORS/BARRIERS………………………………. 11
RECOMMENDATIONS……………………………………………………. 13
APPENDIX………………………………………………………………….. A.1
Report to the Legislature on AN ANALYSIS OF GAPS IN STATEWIDE 9-1-1 SERVICES
February 2007
California Department of General Services Page 1 of 13 Telecommunications Division
EXECUTIVE SUMMARY The Department of General Services (DGS), Telecommunications Division (TD), prepared this report pursuant to the Supplemental Report of the 2006 Budget Act, Item 1760-101-0022, #1 regarding gaps in Statewide 9-1-1 services that states: The DGS shall complete an analysis of gaps in Statewide 9-1-1 services and, on or before February 1, 2007, submit a report to the Joint Legislative Budget Committee. The report shall include, but not be limited to, identification of substandard call wait times and the contributing factors at the applicable State and local levels. Where appropriate, the report shall identify barriers, make recommendations for improvement, and to the extent possible, estimate time frames and resources needed to achieve wait time reduction goals. Call statistics were compiled over a 12-month period from local public safety answering points (PSAPs) Statewide. These entities have the responsibility of answering calls placed to 9-1-1 and for ensuring that emergency assistance is dispatched expeditiously. For purposes of this report, the TD is reporting solely on the efficiencies in the 9-1-1 call answer process. Overall, the performance of local PSAPs is well within the California 9-1-1 call answering standard, which mirrors the national call standard. A full 93 percent of PSAPs reporting call data answered 9-1-1 calls within 10 seconds. Although the standard provides, at a minimum, that PSAPs should answer 95 percent of 9-1-1 call traffic within 20 seconds, the California data shows a full 98 percent conformed to the 20-second standard. While there are no established standards for abandoned call rates, a reasonable goal for this parameter would be 15 percent or less. The California PSAPs averaged 13.13 percent over the study period. Based on the report findings, it is recommended that a course of action be taken that will help to improve 9-1-1 service overall. The ability to hire and retain competent call takers, or telecommunicators, is key. Ongoing public education concerning how and when to use 9-1-1 is also a major factor. Understanding the differences between wire line and wireless call characteristics can help reduce the number of calls received on a single incident. Because of the nature of wireless 9-1-1 calls, it is critical that local jurisdictions take their calls directly. By doing so, calls are answered at the appropriate response agencies immediately, without being routed to an intermediate agency first.
Report to the Legislature on AN ANALYSIS OF GAPS IN STATEWIDE 9-1-1 SERVICES
February 2007
California Department of General Services Page 2 of 13 Telecommunications Division
INTRODUCTION The TD, in concert with all public safety agencies in California, is dedicated to providing its residents and visitors the best emergency services possible. With a population exceeding 37 million, the universality of 9-1-1 in California is imperative. The mission of the TD’s California 9-1-1 Emergency Communications Office (9-1-1 Office) is to enable PSAPs to provide the fastest, most reliable, cost-effective telephone access to emergency services for any 9-1-1 caller in California. Commonly referred to as the Warren 9-1-1 Emergency Assistance Act, California Government Code Section 53100 et seq. provide the authority under which the TD maintains administrative oversight of 392 primary PSAPs – those agencies that receive a 9-1-1 call directly from the caller – and about 100 secondary PSAPs. The TD also has authority rooted in the Revenue and Taxation Code Section 43100 et seq., which provides for the distribution of proceeds from the State Emergency Telephone Number Account under specified conditions. Costs associated with the planning, implementation, and replacement of 9-1-1 equipment and services are disbursed from this Account. Typically, PSAPs must meet established criteria in order to receive funding at various levels. Nonetheless, local government entities have a great deal of autonomy where their 9-1-1 centers are concerned. With the exception of some basic universal standards required by the TD, each PSAP determines how best to meet the emergency calling needs of their public. The PSAP, among other things, determines the particular 9-1-1 equipment that will deliver the best performance to suit the PSAP’s needs. In addition, it defines how many call takers or dispatchers to staff during each shift and to what training and performance standards they must adhere. By contrast, the TD renders Statewide coordination and communication where planned deployment of common services provides economy-of-scale opportunities. For example, a master purchase agreement for 9-1-1 customer premise equipment was competitively bid and awarded by the TD. By leveraging competition and Statewide purchase opportunities, the TD was able to make available to public safety agencies a simplified and expedited purchase vehicle for quality 9-1-1 equipment and services at quantity discount prices. PSAPs can take advantage of the fact that purchases made under the contract meet established technical and administrative requirements. Other TD-sponsored projects offer similar benefits wherein PSAPs are afforded input into standards and formats, but coordination efforts rest at the State level. Issues or goals shared by multiple agencies are addressed in a collaborative environment with follow through and resolutions spearheaded by TD. Planning and implementation of the California wireless enhanced 9-1-1 (E9-1-1) exemplifies this synergy, as does the voice over internet protocol deployment project. Both projects required months of planning, identifying the needs of the PSAP community, defining requirements, and coordinating
Report to the Legislature on AN ANALYSIS OF GAPS IN STATEWIDE 9-1-1 SERVICES
February 2007
California Department of General Services Page 3 of 13 Telecommunications Division
these requirements with numerous service providers. Alone, PSAPs would be overwhelmed both in time and cost to accomplish these feats. Thus, a prime role of the TD is not only to strive for adherence to sound fiscal management practices and to be fair and equitable in the disbursement of funding, but also to be a champion of the PSAP community’s interests.
Report to the Legislature on AN ANALYSIS OF GAPS IN STATEWIDE 9-1-1 SERVICES
February 2007
California Department of General Services Page 4 of 13 Telecommunications Division
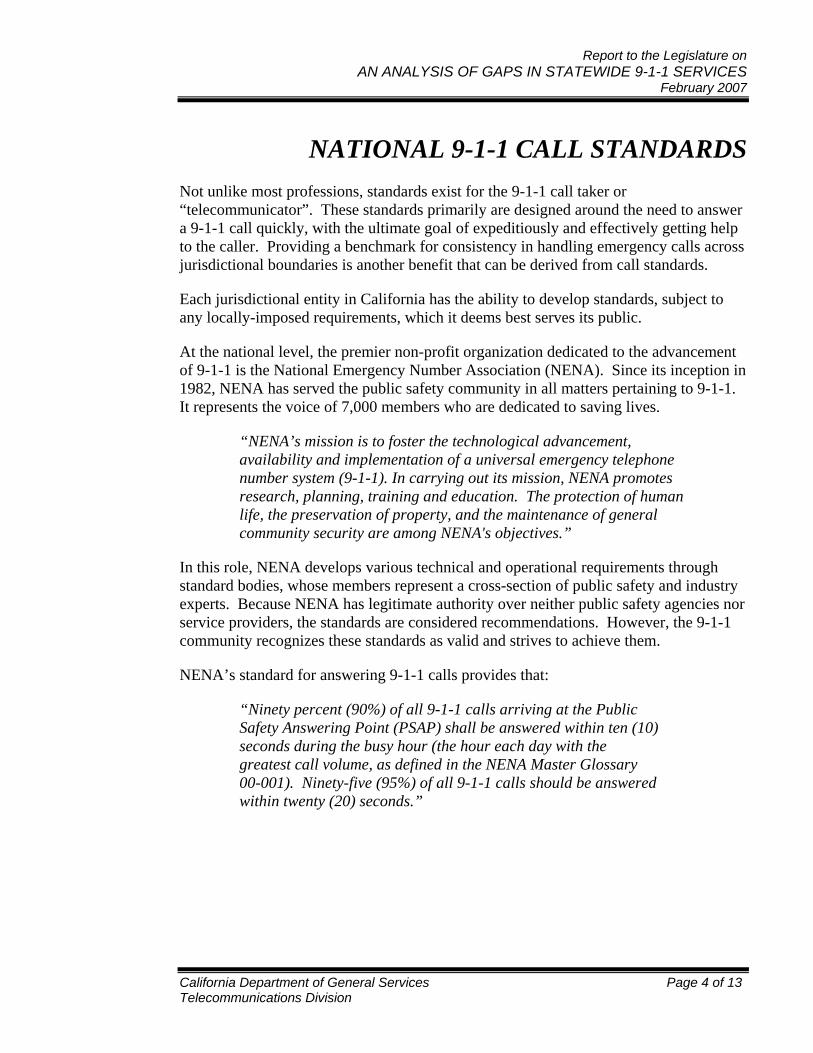
NATIONAL 9-1-1 CALL STANDARDS Not unlike most professions, standards exist for the 9-1-1 call taker or “telecommunicator”. These standards primarily are designed around the need to answer a 9-1-1 call quickly, with the ultimate goal of expeditiously and effectively getting help to the caller. Providing a benchmark for consistency in handling emergency calls across jurisdictional boundaries is another benefit that can be derived from call standards.
Each jurisdictional entity in California has the ability to develop standards, subject to any locally-imposed requirements, which it deems best serves its public.
At the national level, the premier non-profit organization dedicated to the advancement of 9-1-1 is the National Emergency Number Association (NENA). Since its inception in 1982, NENA has served the public safety community in all matters pertaining to 9-1-1. It represents the voice of 7,000 members who are dedicated to saving lives.
“NENA’s mission is to foster the technological advancement, availability and implementation of a universal emergency telephone number system (9-1-1). In carrying out its mission, NENA promotes research, planning, training and education. The protection of human life, the preservation of property, and the maintenance of general community security are among NENA's objectives.”
In this role, NENA develops various technical and operational requirements through standard bodies, whose members represent a cross-section of public safety and industry experts. Because NENA has legitimate authority over neither public safety agencies nor service providers, the standards are considered recommendations. However, the 9-1-1 community recognizes these standards as valid and strives to achieve them.
NENA’s standard for answering 9-1-1 calls provides that:
“Ninety percent (90%) of all 9-1-1 calls arriving at the Public Safety Answering Point (PSAP) shall be answered within ten (10) seconds during the busy hour (the hour each day with the greatest call volume, as defined in the NENA Master Glossary 00-001). Ninety-five (95%) of all 9-1-1 calls should be answered within twenty (20) seconds.”
Report to the Legislature on AN ANALYSIS OF GAPS IN STATEWIDE 9-1-1 SERVICES
February 2007
California Department of General Services Page 5 of 13 Telecommunications Division
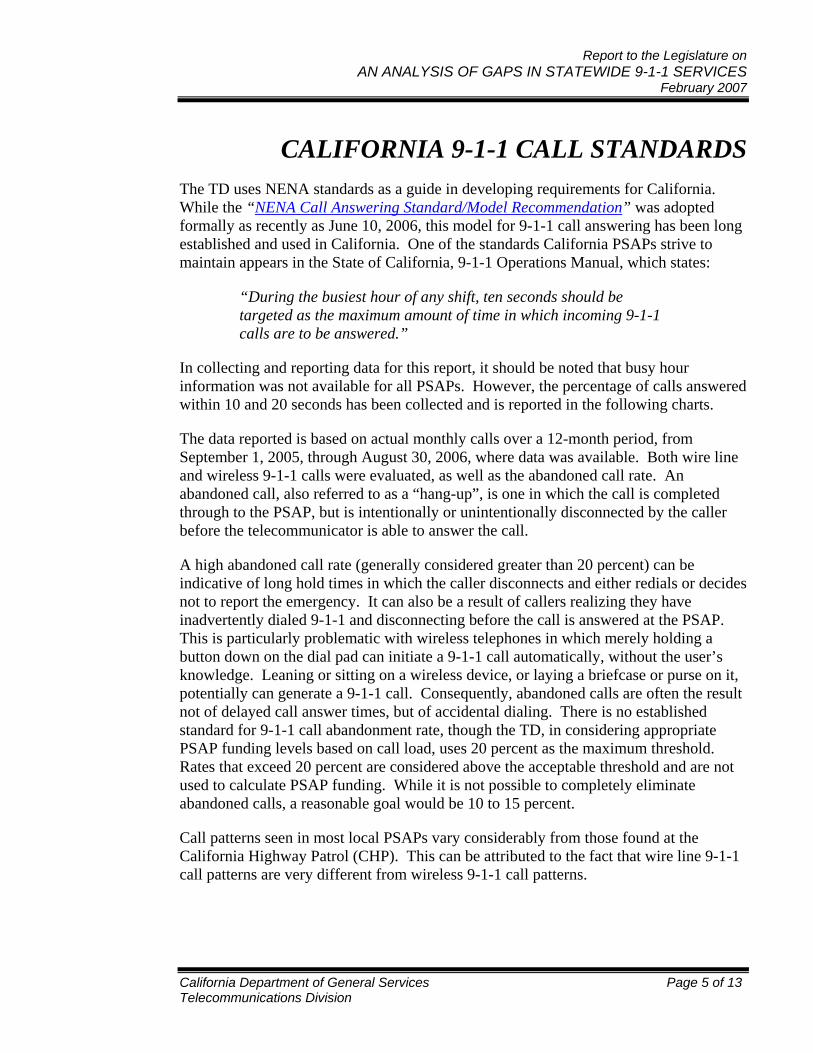
CALIFORNIA 9-1-1 CALL STANDARDS The TD uses NENA standards as a guide in developing requirements for California. While the “NENA Call Answering Standard/Model Recommendation” was adopted formally as recently as June 10, 2006, this model for 9-1-1 call answering has been long established and used in California. One of the standards California PSAPs strive to maintain appears in the State of California, 9-1-1 Operations Manual, which states:
“During the busiest hour of any shift, ten seconds should be targeted as the maximum amount of time in which incoming 9-1-1 calls are to be answered.”
In collecting and reporting data for this report, it should be noted that busy hour information was not available for all PSAPs. However, the percentage of calls answered within 10 and 20 seconds has been collected and is reported in the following charts.
The data reported is based on actual monthly calls over a 12-month period, from September 1, 2005, through August 30, 2006, where data was available. Both wire line and wireless 9-1-1 calls were evaluated, as well as the abandoned call rate. An abandoned call, also referred to as a “hang-up”, is one in which the call is completed through to the PSAP, but is intentionally or unintentionally disconnected by the caller before the telecommunicator is able to answer the call.
A high abandoned call rate (generally considered greater than 20 percent) can be indicative of long hold times in which the caller disconnects and either redials or decides not to report the emergency. It can also be a result of callers realizing they have inadvertently dialed 9-1-1 and disconnecting before the call is answered at the PSAP. This is particularly problematic with wireless telephones in which merely holding a button down on the dial pad can initiate a 9-1-1 call automatically, without the user’s knowledge. Leaning or sitting on a wireless device, or laying a briefcase or purse on it, potentially can generate a 9-1-1 call. Consequently, abandoned calls are often the result not of delayed call answer times, but of accidental dialing. There is no established standard for 9-1-1 call abandonment rate, though the TD, in considering appropriate PSAP funding levels based on call load, uses 20 percent as the maximum threshold. Rates that exceed 20 percent are considered above the acceptable threshold and are not used to calculate PSAP funding. While it is not possible to completely eliminate abandoned calls, a reasonable goal would be 10 to 15 percent.
Call patterns seen in most local PSAPs vary considerably from those found at the California Highway Patrol (CHP). This can be attributed to the fact that wire line 9-1-1 call patterns are very different from wireless 9-1-1 call patterns.
Report to the Legislature on AN ANALYSIS OF GAPS IN STATEWIDE 9-1-1 SERVICES
February 2007
California Department of General Services Page 6 of 13 Telecommunications Division
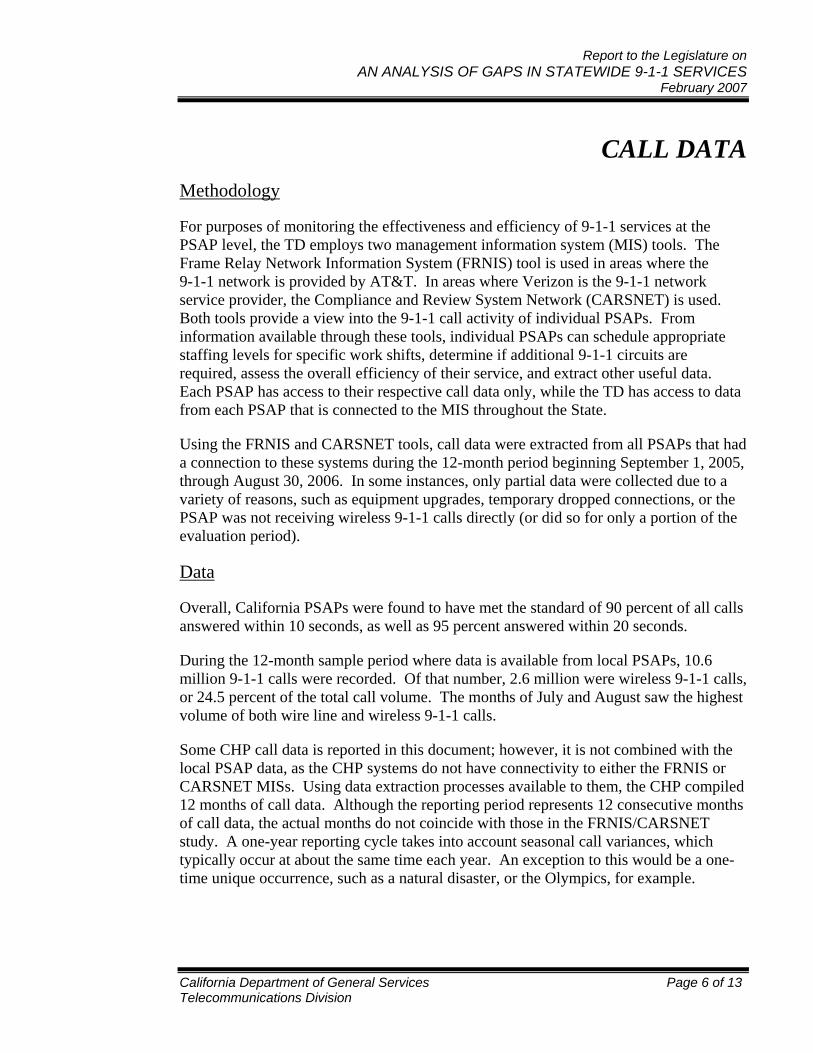
CALL DATA Methodology
For purposes of monitoring the effectiveness and efficiency of 9-1-1 services at the PSAP level, the TD employs two management information system (MIS) tools. The Frame Relay Network Information System (FRNIS) tool is used in areas where the 9-1-1 network is provided by AT&T. In areas where Verizon is the 9-1-1 network service provider, the Compliance and Review System Network (CARSNET) is used. Both tools provide a view into the 9-1-1 call activity of individual PSAPs. From information available through these tools, individual PSAPs can schedule appropriate staffing levels for specific work shifts, determine if additional 9-1-1 circuits are required, assess the overall efficiency of their service, and extract other useful data. Each PSAP has access to their respective call data only, while the TD has access to data from each PSAP that is connected to the MIS throughout the State.
Using the FRNIS and CARSNET tools, call data were extracted from all PSAPs that had a connection to these systems during the 12-month period beginning September 1, 2005, through August 30, 2006. In some instances, only partial data were collected due to a variety of reasons, such as equipment upgrades, temporary dropped connections, or the PSAP was not receiving wireless 9-1-1 calls directly (or did so for only a portion of the evaluation period).
Data
Overall, California PSAPs were found to have met the standard of 90 percent of all calls answered within 10 seconds, as well as 95 percent answered within 20 seconds.
During the 12-month sample period where data is available from local PSAPs, 10.6 million 9-1-1 calls were recorded. Of that number, 2.6 million were wireless 9-1-1 calls, or 24.5 percent of the total call volume. The months of July and August saw the highest volume of both wire line and wireless 9-1-1 calls.
Some CHP call data is reported in this document; however, it is not combined with the local PSAP data, as the CHP systems do not have connectivity to either the FRNIS or CARSNET MISs. Using data extraction processes available to them, the CHP compiled 12 months of call data. Although the reporting period represents 12 consecutive months of call data, the actual months do not coincide with those in the FRNIS/CARSNET study. A one-year reporting cycle takes into account seasonal call variances, which typically occur at about the same time each year. An exception to this would be a one-time unique occurrence, such as a natural disaster, or the Olympics, for example.
Report to the Legislature on AN ANALYSIS OF GAPS IN STATEWIDE 9-1-1 SERVICES
February 2007
California Department of General Services Page 7 of 13 Telecommunications Division
Total 9-1-1 Calls By Type
0
200000
400000
600000
800000
1000000
1200000
1400000
Sep-05
Oct-05
Nov-05
Dec-05
Jan-06
Feb-06
Mar-06
Apr-06
May-06
Jun-06
Jul-06
Aug-06
Month/Year
Num
ber o
f Cal
ls#WIRELINE CALLS
#WIRELESS CALLS
TOTAL CALLS
Figure 1
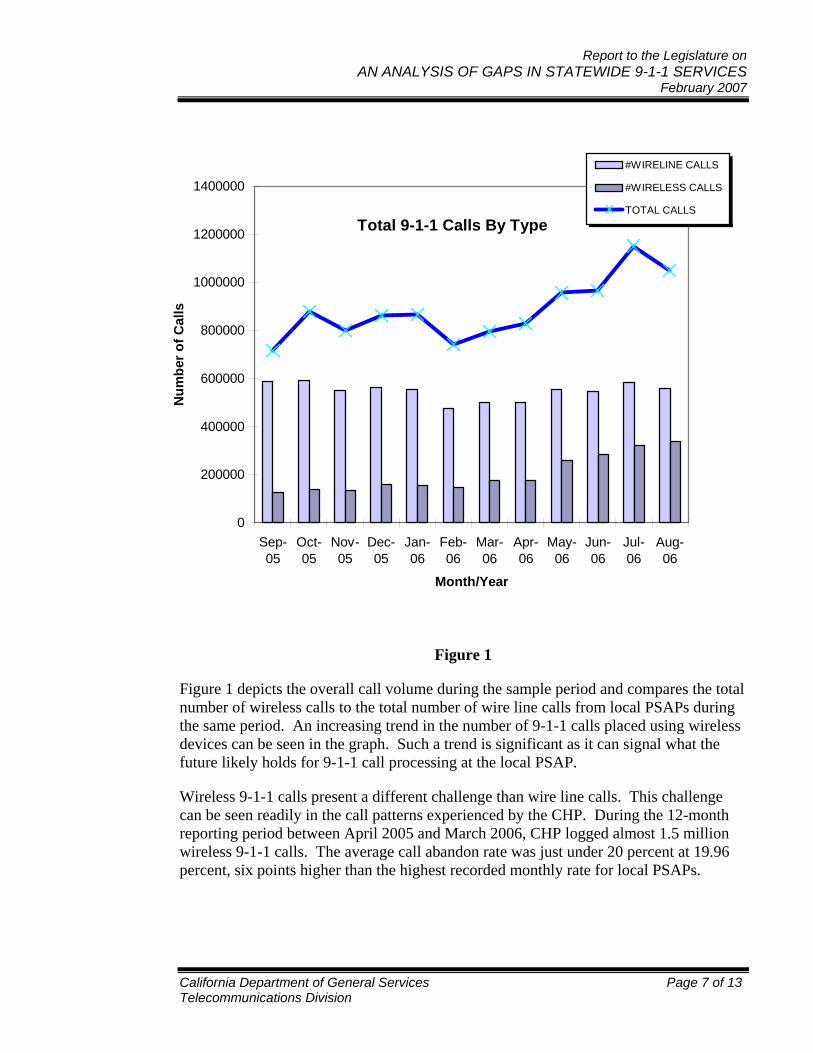
Figure 1 depicts the overall call volume during the sample period and compares the total number of wireless calls to the total number of wire line calls from local PSAPs during the same period. An increasing trend in the number of 9-1-1 calls placed using wireless devices can be seen in the graph. Such a trend is significant as it can signal what the future likely holds for 9-1-1 call processing at the local PSAP.
Wireless 9-1-1 calls present a different challenge than wire line calls. This challenge can be seen readily in the call patterns experienced by the CHP. During the 12-month reporting period between April 2005 and March 2006, CHP logged almost 1.5 million wireless 9-1-1 calls. The average call abandon rate was just under 20 percent at 19.96 percent, six points higher than the highest recorded monthly rate for local PSAPs.
Report to the Legislature on AN ANALYSIS OF GAPS IN STATEWIDE 9-1-1 SERVICES
February 2007
California Department of General Services Page 8 of 13 Telecommunications Division
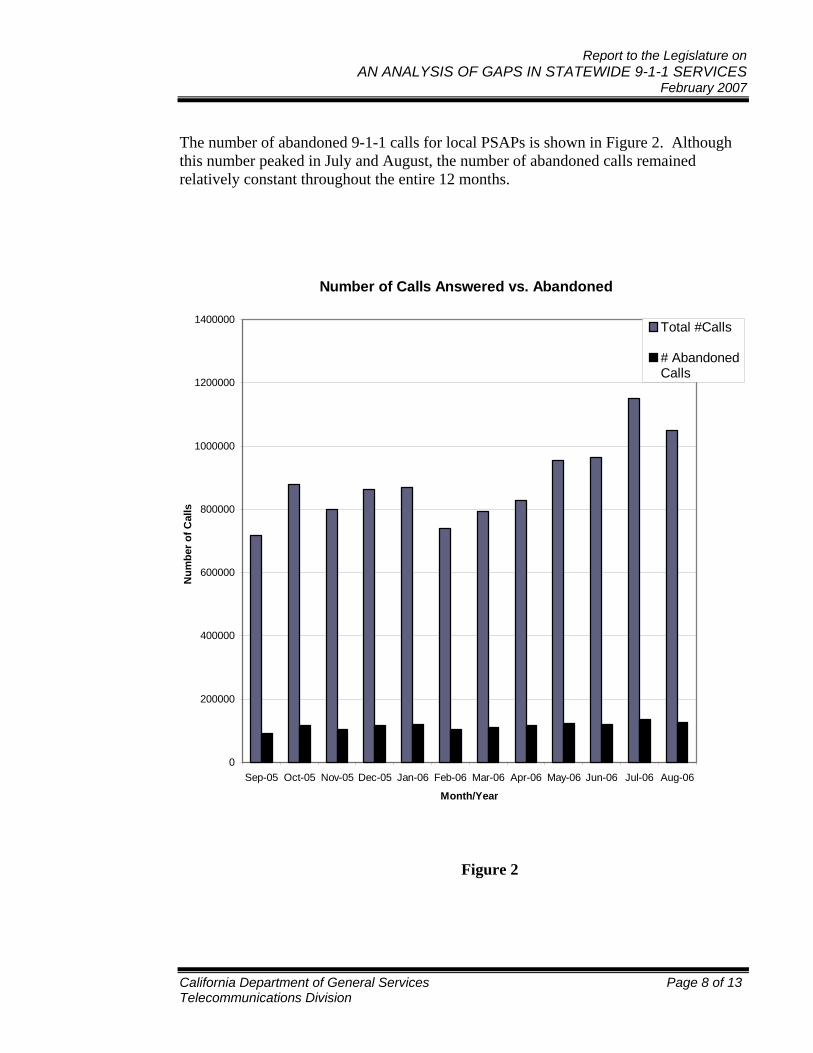
The number of abandoned 9-1-1 calls for local PSAPs is shown in Figure 2. Although this number peaked in July and August, the number of abandoned calls remained relatively constant throughout the entire 12 months.
Number of Calls Answered vs. Abandoned
0
200000
400000
600000
800000
1000000
1200000
1400000
Sep-05 Oct-05 Nov-05 Dec-05 Jan-06 Feb-06 Mar-06 Apr-06 May-06 Jun-06 Jul-06 Aug-06
Month/Year
Num
ber o
f Cal
ls
Total #Calls
# AbandonedCalls
Figure 2
Report to the Legislature on AN ANALYSIS OF GAPS IN STATEWIDE 9-1-1 SERVICES
February 2007
California Department of General Services Page 9 of 13 Telecommunications Division
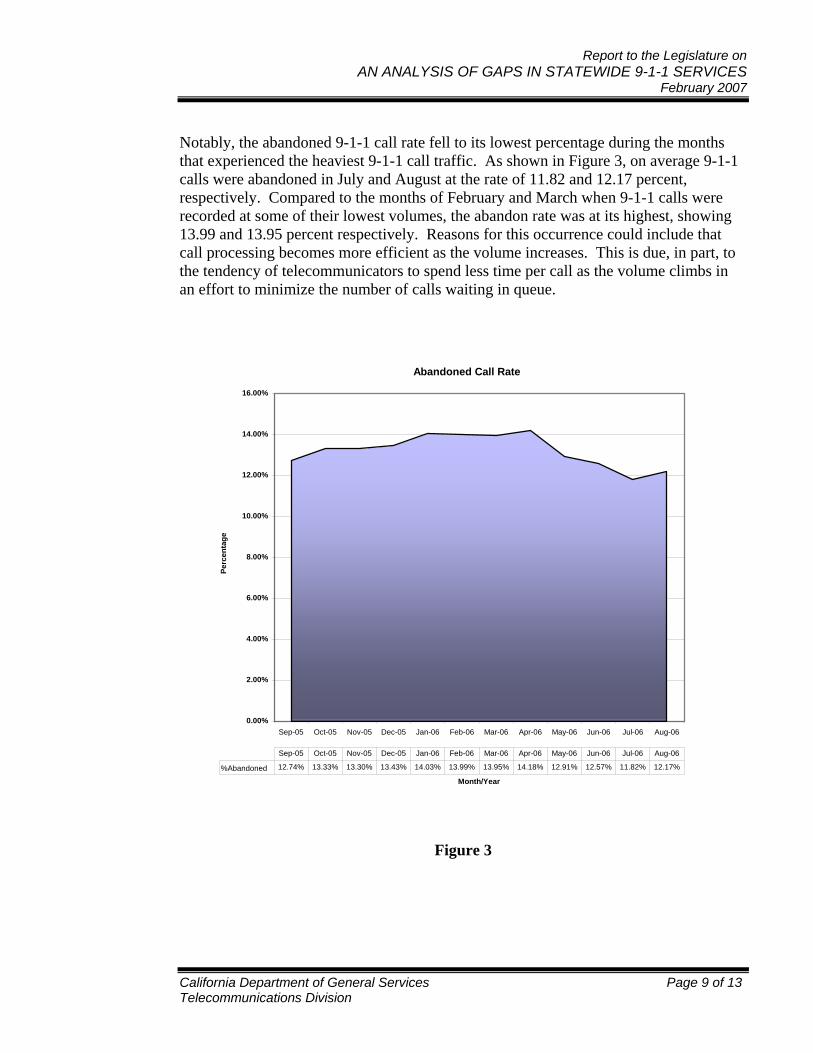
Notably, the abandoned 9-1-1 call rate fell to its lowest percentage during the months that experienced the heaviest 9-1-1 call traffic. As shown in Figure 3, on average 9-1-1 calls were abandoned in July and August at the rate of 11.82 and 12.17 percent, respectively. Compared to the months of February and March when 9-1-1 calls were recorded at some of their lowest volumes, the abandon rate was at its highest, showing 13.99 and 13.95 percent respectively. Reasons for this occurrence could include that call processing becomes more efficient as the volume increases. This is due, in part, to the tendency of telecommunicators to spend less time per call as the volume climbs in an effort to minimize the number of calls waiting in queue.
Abandoned Call Rate
0.00%
2.00%
4.00%
6.00%
8.00%
10.00%
12.00%
14.00%
16.00%
Sep-05 Oct-05 Nov-05 Dec-05 Jan-06 Feb-06 Mar-06 Apr-06 May-06 Jun-06 Jul-06 Aug-06
Month/Year
Perc
enta
ge
%Abandoned 12.74% 13.33% 13.30% 13.43% 14.03% 13.99% 13.95% 14.18% 12.91% 12.57% 11.82% 12.17%
Sep-05 Oct-05 Nov-05 Dec-05 Jan-06 Feb-06 Mar-06 Apr-06 May-06 Jun-06 Jul-06 Aug-06
Figure 3
Report to the Legislature on AN ANALYSIS OF GAPS IN STATEWIDE 9-1-1 SERVICES
February 2007
California Department of General Services Page 10 of 13 Telecommunications Division
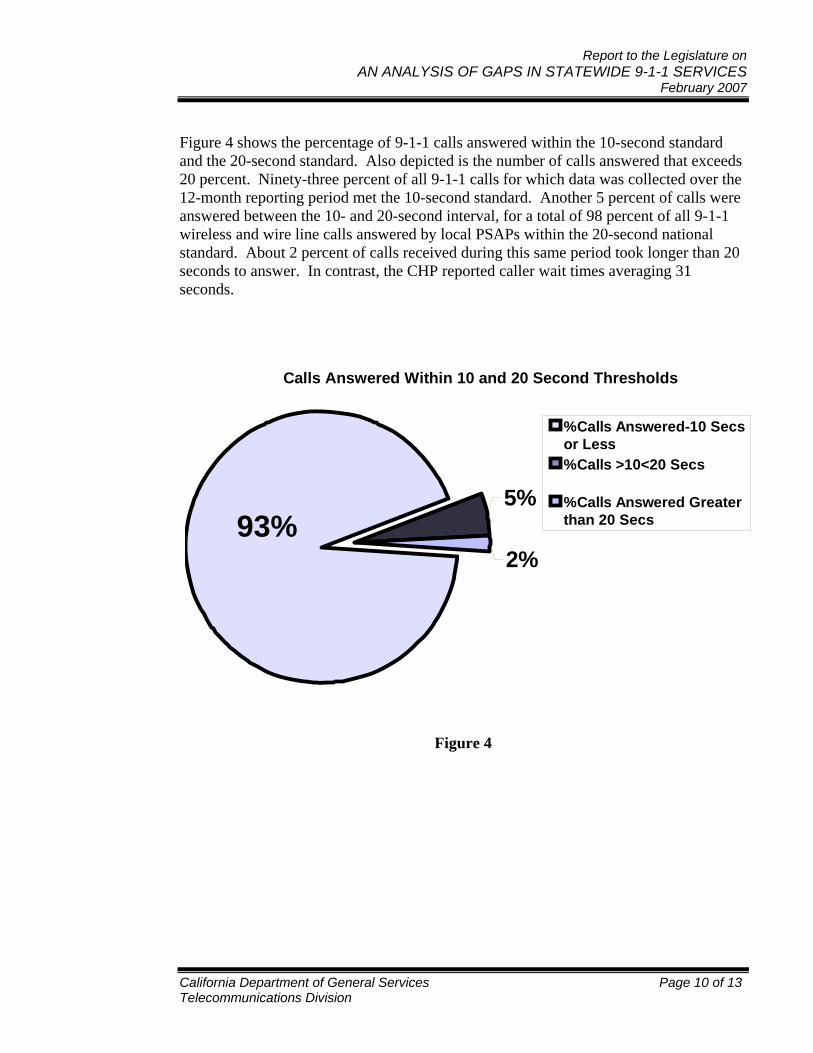
Figure 4 shows the percentage of 9-1-1 calls answered within the 10-second standard and the 20-second standard. Also depicted is the number of calls answered that exceeds 20 percent. Ninety-three percent of all 9-1-1 calls for which data was collected over the 12-month reporting period met the 10-second standard. Another 5 percent of calls were answered between the 10- and 20-second interval, for a total of 98 percent of all 9-1-1 wireless and wire line calls answered by local PSAPs within the 20-second national standard. About 2 percent of calls received during this same period took longer than 20 seconds to answer. In contrast, the CHP reported caller wait times averaging 31 seconds.
Calls Answered Within 10 and 20 Second Thresholds
93%5%
2%
%Calls Answered-10 Secsor Less%Calls >10<20 Secs
%Calls Answered Greaterthan 20 Secs
Figure 4
Report to the Legislature on AN ANALYSIS OF GAPS IN STATEWIDE 9-1-1 SERVICES
February 2007
California Department of General Services Page 11 of 13 Telecommunications Division
CONTRIBUTING FACTORS AND BARRIERS Call patterns can vary widely depending on the type of call. Wireless 9-1-1 calls exhibit a very different pattern than calls from wire line telephones. For example, on a freeway during peak commute times hundreds of drivers can witness an accident, or its aftermath, over the course of 30 minutes. As “Good Samaritans”, each of these drivers (or a passenger) may dial 9-1-1 from their wireless device to report the same incident. Within minutes, hundreds of calls can flood a PSAP to report an incident that, under different conditions, may have generated only one or a few calls. Unfortunately, calls to report other exigent situations may get caught “in queue” behind the dozens of wireless callers, all vying for the limited number of telecommunicators and 9-1-1 circuits each PSAP has to offer. Under these conditions, no PSAP can staff adequately for the number of calls that are generated from wireless devices.
The CHP answers approximately 72 percent of all 9-1-1 calls generated from wireless devices Statewide. Consequently, the CHP communication centers experience the greatest number of calls (about 1.5 million per month) and, not surprisingly, the longest wait times as well. The CHP is in the process of hiring an additional 150 telecommunicators Statewide, which should mitigate, but not eliminate, the higher call wait times. As more non-CHP PSAPs take on wireless 9-1-1 calls directly, these PSAPs may experience an increase in call wait times as well, although not to the extent experienced by the CHP. Local PSAPs receive only a fraction of the volume of wireless 9-1-1 calls answered by the CHP.
By comparison, calls from wire line telephones usually are from individuals at a residence or business who personally are involved in an incident or witnessed an incident, that requires emergency response. This type of emergency may generate one or two calls to a PSAP. Because there is no public audience, no passersby, calls do not flood the 9-1-1 center.
Recruitment and retention pose a particularly difficult challenge among all PSAPs. As a result of several factors, including the requirement for shift work, long hours, low pay, and a stressful work environment, PSAPs often function with less than optimum staffing levels. Some agencies try to compensate by increasing the workday from eight hours to 10 or 12 hours. Others offer signing bonuses or cash incentives to attract competent telecommunicators, but still widespread shortages persist.
Also, the ability to monitor, extract, and compile accurate 9-1-1 call-related data is fundamental to identifying and documenting changes. Without this tool, it would be very difficult to determine what improvements may have been achieved.
Public education plays a major role in a PSAP’s ability to manage their call load as well. Often, in their zeal to assist, individuals will dial 9-1-1 to report an incident when there
Report to the Legislature on AN ANALYSIS OF GAPS IN STATEWIDE 9-1-1 SERVICES
February 2007
California Department of General Services Page 12 of 13 Telecommunications Division
are already emergency vehicles on scene. They will also hang up and re-dial 9-1-1 if their initial call is not answered within the time frame the caller expects. Not realizing they are now lower in the call queue after re-dialing, the caller has just exacerbated the problem. The public needs to be educated, and routinely reminded, about the appropriate use and characteristics of the 9-1-1 system. A general understanding of how the caller can help to improve the emergency response, depending on the type of device they are using, will go a long way toward alleviating high call wait times and help to improve service levels.
Report to the Legislature on AN ANALYSIS OF GAPS IN STATEWIDE 9-1-1 SERVICES
February 2007
California Department of General Services Page 13 of 13 Telecommunications Division
RECOMMENDATIONS Based on an analysis of the data extracted from PSAPs over the course of 12 months, it is clear that improvements can be achieved. While there are some technical barriers that can hinder improvements in call answer time and abandoned call rates, the human factor is the one that has the potential to provide the greatest value. Staffing the right number of telecommunicators during the right time will achieve the biggest return on service improvements.
The following recommendations would serve to enhance 9-1-1 service delivery and emergency response:
1. PSAP Staffing Levels – Using the MIS system tools, the PSAP should develop and apply criteria to evaluate 9-1-1 call performance. Where feasible, adjust staffing accordingly to achieve the national standard of 90 percent of all calls answered within 10 seconds; and 95 percent of all calls answered within 20 seconds.
2. Public Education – Develop and implement a public education program at the local level that meets the needs of their PSAP community. The more the public understands how 9-1-1 operates, the better the PSAP is able to respond to their calls for emergency assistance.
3. Access to Improved Data Collection Tools – Enhance the MIS tools used to collect and analyze 9-1-1 call data. Ensure each PSAP, as well as the TD, is connected to the MIS tool and ensure PSAP managers are trained on how to extract, compile, and analyze data available through the MIS tool.
4. PSAPs Should Elect to Take their Wireless 9-1-1 Calls Directly – To reduce wait times for wireless 9-1-1 calls, it is imperative that local jurisdictions agree to have these calls routed directly to their PSAP. Service improvements will be twofold: 1) the caller will be directed to the appropriate response agency immediately without having to be transferred by another agency; and 2) calls going to local PSAPs will not be stuck in queue behind other callers reporting traffic-related incidents. This is especially troublesome for the caller and the CHP alike during peak commute times.