state of climate action
TRANSCRIPT

WRI.ORG
KATIE LEBLING, MENGPIN GE, KELLY LEVIN, RICHARD WAITE, JOHANNES FRIEDRICH, CYNTHIA ELLIOTT, CHRISTINA CHAN, KATHERINE ROSS, FRED STOLLE, AND NANCY HARRIS
STATE OF CLIMATE ACTIONAssessing Progress toward 2030 and 2050

Design and layout by: Bill Dugan [email protected]
Rosie Ettenheim [email protected]
ABOUT THE AUTHORSKatie Lebling is an Associate in the Global and U.S. Climate Programs at WRI.Contact: [email protected]
Mengpin Ge is an Associate II in the Global Climate Program at WRI.Contact: [email protected]
Kelly Levin is a Senior Associate in the Global Climate Program and the Director of Tracking and Strengthening Climate Action at WRI.Contact: [email protected]
Richard Waite is a Senior Research Associate in WRI’s Food Program.Contact: [email protected]
Johannes Friedrich is a Senior Associate in the Global Climate Program at WRI.Contact: [email protected]
Cynthia Elliott is an Associate II for the Global Climate Program at WRI. Contact: [email protected]
Christina Chan is the Director of WRI’s Climate Resilience Practice. Contact: [email protected]
Katherine Ross is an Associate II in the Global Climate Program at WRI.Contact: [email protected]
Fred Stolle is the Deputy Director of WRI’s Forests Program. Contact: [email protected]
Nancy Harris is the Research Manager of Global Forest Watch at WRI. Contact: [email protected]
ACKNOWLEDGMENTSThe authors would like to acknowledge the following for their guidance, critical reviews, and research support:
• This report was conducted in partnership between ClimateWorks Foundation and World Resources Institute. The report benefited not only from ClimateWorks Foundation’s financial support but also from the work of its Global Intelligence team, Dan Plechaty and Surabi Menon, who were pivotal in conceiving the idea for the analysis and provided guidance throughout the research and writing process.
• The Climate Action Tracker consortium designed sectoral indicators and targets for four of the sectors. Contributing colleagues from the consortium included Louise Jeffery, Anna Nilsson, Niklas Höhne, and Markus Hagemann from NewClimate Institute and Marie-Camille Attard, Ursula Fuentes Hutfilter, Andreas Geiges, Matthew Gidden, Bill Hare, Michiel Schaeffer, and Ryan Wilson from Climate Analytics.
• WRI’s Pankaj Bhatia, Helen Mountford, and Rhys Gerholdt provided valuable review and strategic guidance.
We thank our external reviewers who have shared their expertise and insights: Thomas Andre, Susan Cook-Patton, Todd Edwards, Andreas Geiges, Anne Hammill, Louise Jeffery, Maxine Jordan, Fridolin Krausmann, Surabi Menon, Annett Moehner, Dan Plechaty, Stephanie Roe, Alex Tankou, and Jen Wilcox.
Thanks also go to our WRI colleagues for their thoughtful reviews: Rebecca Carter, Sebastian Castellanos, Chen Chen, Cynthia Cummis, Ed Davey, Crystal Davis, Pamli Deka, Wee Kean Fong, Arya Harsono, Kevin Kennedy, Jennifer Layke, Xiangyi Li, Michelle Manion, Liqing Peng, Alex Perera, Ethan Roday, Viviane Romeiro, Dayuma Ruiz, Cristina Rumbaitis del Rio, Tim Searchinger, Joe Thwaites, David Waskow, Mikaela Weisse, Debbie Weyl, Arief Wijaya, and Jessica Zionts.
While the contributions from reviewers are greatly appreciated, the views presented in this paper are those of the authors alone.
The authors are grateful to WRI colleagues Emily Matthews and Laura Malaguzzi Valeri for their research advice and guidance. We also wish to acknowledge WRI colleagues for their support in the production of the report, including administrative assistance, editing, graphic design, and layout: Emilia Suarez, Emily Matthews, Romain Warnault, Bill Dugan, Rosie Ettenheim, and Mary Levine. We received communications and outreach support from Rhys Gerholdt, Molly Bergen, and Anthony Yazaki. We would also like to thank Clea Schumer for her data verification support.
We are pleased to acknowledge our institutional strategic partners, who provide core funding to WRI: the Netherlands Ministry of Foreign Affairs, the Royal Danish Ministry of Foreign Affairs, and the Swedish International Development Cooperation Agency.

TABLE OF CONTENTS3 Foreword
5 Executive Summary6 Context7 About This Report7 Key Findings
21 Snapshot of a Changing Climate
27 Snapshot of Climate Action
39 Methodology, Assumptions, and Limitations for Assessing Progress by Sector
42 Assessment of Progress toward Our Targets
45 Assessment of Progress by Sector
99 Conclusion
102 Appendix A: Compilation of Data Organized by Country
117 Endnotes118 References

3State of Climate Action: Assessing Progress toward 2030 and 2050
FOREWORDFor at least two decades, countries, companies, cities, and communities have been claiming they are “doing better” on climate change. Annual reports have been full of ratios showing greenhouse emissions per unit of output falling, and sometimes emissions falling in absolute terms. All good—but unfortunately, rarely enough. All over the world, as leaders and CEOs have been honestly claiming they are doing better, the situation has been getting worse.
We now know that the situation is indeed much worse than we had earlier understood. The world’s leaders now recognize that to protect future prosperity and well-being we must limit global warming to an average of 1.5 degrees Celsius. This requires not incremental change, but radical change—roughly a halving of carbon emissions each decade through 2050. All sectors must play a part in this massive and exciting transition. But which sectors are doing their part? And which are falling short?
In this State of Climate Action report, the World Resources Institute and ClimateWorks Foundation ask how we are doing on this journey. It explores global and country-level progress across six key sectors—using 21 benchmark indicators developed by the Climate Action Tracker and WRI. In most cases progress is being made, but in only 2 cases out of 21 is the pace of progress enough. Sadly, in 2 cases we are headed in the wrong direction altogether, and in 4 cases there is simply not enough data to say where things stand.
To get on track, the world must—among other actions—rapidly transition to clean electricity generation, accelerate the uptake
of electric vehicles, reduce emissions from industrial production, boost agricultural productivity, shift to more sustainable food consumption patterns, and increase annual tree cover gain. For these and other goals, the report specifies the much faster rate of progress needed to meet most of these global targets.
None of these transitions is easy. They require not incremental change, but systems change that no individual actor can deliver. They require multistakeholder engagement of governments, corporations, citizens, financial institutions, philanthropy, and the scientific community. The good news is that in all these transformations, there is a path forward that makes good sense economically, socially, and politically, as well as environmentally.
The report shows that these transitions are essential for developing and developed countries, but that developing countries will require significant financial investments, technology transfer, and capacity building to drive climate action. History has shown that transformative change can happen at an exponential, nonlinear rate; just look at how quickly cars, phones, and connected computers revolutionized our world. With the right support, low-emissions technologies such as electric vehicles, renewable energy, and low-carbon steel could be next.
By revealing how goes the battle, this report shows us the path to victory: a zero-emissions world in which all people can thrive.
Andrew SteerPresident & CEOWorld Resources Institute
Charlotte PeraPresident & CEOClimateWorks Foundation


5State of Climate Action: Assessing Progress toward 2030 and 2050
EXECUTIVE SUMMARYThis report provides an overview of climate action to date and
assesses global and country-level progress across benchmarks
for six sectors that would limit global warming to 1.5 degrees
Celsius (°C) and therefore prevent its most dangerous impacts.
We found that while advancements are happening within some
sectors, for most the rate of change is much too slow for the world
to achieve these goals.

WRI.org6
HIGHLIGHTS
▪ The world is already being ravaged by the impacts of a changing climate—from the spread of fires to more intense storms, heat waves, the breakup of ice sheets, and disappearing glaciers.
▪ Commitments and action by countries, cities, and companies, as well as levels of climate finance, still fall woefully short of the ambition necessary to meet the Paris Agreement’s goals.
▪ This report assesses progress toward 2030 and 2050 emissions-reduction targets in the power, buildings, industry, and transport sectors, based on indicators and targets designed by the Climate Action Tracker (CAT) consortium, and in the forests and agriculture sectors, based on indicators and targets designed by World Resources Institute (WRI).
▪ Of the 21 indicators assessed, 2 show a historical rate of change that is sufficient to meet both 2030 and 2050 targets, 13 indicators show change headed in the right direction but too slowly, and 2 show change headed in the wrong direction altogether. Data are insufficient to assess progress in 4 indicators.
▪ This coming year, leading up to the 26th Conference of the Parties (COP26), is critical to commit to transformative action to limit warming to 1.5°C. Countries will update their nationally determined contributions (NDCs) under the Paris Agreement and submit long-term strategies, at the same time that trillions of dollars will be mobilized for COVID-19 recovery.
ContextThe decisions countries make in the lead-up to COP26 on future climate commitments could lock us into a carbon-intensive trajectory or help steer us toward one that avoids the worst climate impacts and increases resilience. We have a narrow window of time to change direction. Countries are invited this year to update their national climate pledges (known as nationally determined contributions, or NDCs) and develop long-term low-emissions development strategies. As governments seek to rebuild their economies and societies in response to COVID-19, recovery packages could lock us into a carbon-intensive trajectory and compound the challenges we are already confronting. An understanding of what different sectors can and should contribute to climate mitigation through midcentury will help guide the necessary actions of transitioning to a low-carbon society.
We should consider this next decade as our decisive decade to change our course to arrive at a different low-carbon future by midcentury. A sole focus on action through 2030 may achieve short-term goals but could ultimately lead to a more carbon-intensive pathway that does not embrace the deep decarbonization required to limit warming to 1.5°C. A sole focus on 2050, however, may not deliver the required shorter-term reductions needed to achieve feasible decarbonization rates and avoid lock-in of carbon-intensive infrastructure, technologies, and behavior.
For the majority of sectors, the required transformations are a significant departure from our current level of climate action and our everyday investments, behavior, technologies, and decision-making. And given that our ever-shrinking carbon budget does not accommodate delay, this level of change will require scaling finance, technology transfer, and capacity building for countries needing support. These transformations must be just and accompanied by measures that support those who will be most adversely affected.

7State of Climate Action: Assessing Progress toward 2030 and 2050
About This ReportThis report provides an overview of how we are collectively doing in addressing the climate crisis. Taking stock of change to date is critical for informing where best to focus our attention and change our future course of action. The report starts with a snapshot of the latest climate impacts, then describes the state of national, subnational, and corporate climate mitigation commitments, climate finance, and adaptation action. Following this discussion, this report assesses the pace of action on mitigation to date in key sectors and compares it with where we need to go by 2030 and by 2050 to limit warming to 1.5°C, and accordingly avoid the worst climate impacts. The report builds upon a previous assessment WRI conducted toward 2020 climate milestones (Ge et al. 2019) but extends it to 2030 and 2050. For this report, several indicators were identified that the literature suggests are the best ways to monitor sectoral decarbonization pathways. The targets presented in this report for power (energy), buildings, industry, and transport were developed by the Climate Action Tracker consortium, which provides independent analysis and comprises Climate Analytics and the New Climate Institute, and are designed to be compatible with limiting warming to 1.5°C. The forests and agriculture targets were developed by WRI and are also aligned with the 1.5°C goal. Given the longer time horizon, it is not possible to definitively say whether we are on or off track to meet our climate targets, but it is possible to measure the rate of progress to date and compare it with the rate of change required to meet 2030 and 2050 targets in an effort to inform future action. Progress toward targets is assessed at the global level as well as for key emitting countries: Brazil, China, EU28 (the European Union including the United Kingdom), India, Indonesia, South Africa, and the United States.
This report aims to support key governmental decision-makers, companies, investors, and funders who are considering where to accelerate action. A secondary audience is subject experts who support such decision-makers in strengthening implementation of existing commitments, as well as increasing ambition in the future.
Key FindingsEven with only 1°C of warming, the impacts of human-induced climate change are mounting already—from the spread of fires, to more intense storms, to heat waves. While numerous countries, cities, and companies have committed to greater emissions cuts, much greater ambition is needed if we are to meet the Paris Agreement’s objectives of limiting warming to 1.5–2˚C. Adaptation efforts are gaining traction, given the onset of impacts already happening across the globe, but greater resources are needed. While climate finance has increased significantly in recent years, it is not equal to the level needed to transform our energy system, protect our forests, and adapt to increasing impacts of climate change.
Progress on reducing emissions is uneven across indicators compatible with the Paris Agreement in key sectors (power, buildings, industry, transport, forests, and agriculture) (Box ES-1). While change will very likely not occur linearly, meaning that we cannot simply extrapolate from historical rates of change, comparing historical rates of change with the pace and scale of change that will be necessary in the future can shed light on the scale of action needed.
While national progress varies across countries, at a global level, the assessment of sectoral indicators is as follows:
▪ Two of the 21 indicators assessed illustrate a historical rate of change that is at or above the required rate for achieving both 2030 and 2050 targets. Green
▪ For 13 of the 21 indicators assessed, the historical rate of change is heading in the right direction but well below required levels for 2030 and 2050. Yellow
▪ For 2 indicators, historical change has been headed in the wrong direction. Red
▪ For 4 of the indicators assessed, data are insufficient to assess the rate of historical change and the gap in action. Gray

WRI.org8
Figure ES-1 | Summary of indicator assessment for sectoral emissions reductions
The historical rate of change is at or above the required rate of change through 2030 and 2050
The historical rate of change is heading in the right direction but well below required levels for 2030 and 2050
AGRICULTURECrop yields (t/ha/yr)
INDUSTRYCarbon intensity of cement production (kgCO2/t)
BUILDINGSEnergy Intensity of buildings: residentiala (kgCO2/m2)
BUILDINGSEnergy Intensity of buildings: commerciala (kgCO2/m2)
BUILDINGSBuilding renovation rateb (%)
AGRICULTURERuminant meat consumption (kcal/capita/day)
Rate of acceleration needed to 2050
Rate of accleration needed to 2030
Historical rate of change
How to read the arrows:3x3x
AGRICULTUREProductivity of ruminant meat production (kcal/capita/day)
TRANSPORTShare of low carbon fuels in the transport sector (%)
TRANSPORTShare of EVs in annual new car salesc (%)
POWERCarbon intensity of electricity generation (gCO2/kWh)
POWERShare of unabated coal in electricity generation (%)
POWERShare of renewables in electricity generation (%)
Share of EVs in total light-duty vehicle fleetc (%)TRANSPORTINDUSTRY
Share of electricity in final energy use in industry (%)
20302017 205015
7.5
0
7.49
6.5
20302017 205060
30
0
5151.748.8
5.6x
20302018 2050100
50
0
98-100%
55-90%
25.3%
3.3x
20302018 205050
25
0 0%0-3%
38%
5.1x 2x
20302017 2050500
250
0 050-125
488
1.6x3.6x
20302015 2050100
50
0
10-70%
40%
n.d.20302015 2040
5
2.5
0
2.5-3.5%
3.5%
1-2%
20302015 2050100
50
0
20-70%35-50%
n.d.
20302017 2050700
350
0
360-370
55-90
614
20302017 205060
30
0
50-55%
35%27%
1.8x
1.4x
20302017 2050100
50
00.8%
20-40%
85-100%28x
22x
2030Baseline 2050100
50
0
100%75-95%
2.60%
12x5x
20302017 2050100
50
0
4%15%
70-95%24x
8x
2030 target2017 205050
25
0
26
33 41.12x
2x
Targets
Historical change has been headed in the wrong direction
Data are insu�icient to assess the rate of historical change and the gap in action.
INDUSTRYCarbon intensity of steel production (kgCO2/t)
The historical rate of change is heading in the right direction but well below required levels for 2030 and 2050 (continued)
FORESTSGross tree cover gain (Mha/yr)
FORESTSGross carbon removals from reforestation (MtCO2/yr)
FORESTSDeforestation (Mha/yr)
AGRICULTUREEmissions from agricultural production (MtCO2e)
BUILDINGSCarbon intensity of buildings - residential (kWh/m2)
BUILDINGSCarbon intensity of buildings - commercial (kWh/m2)
TRANSPORTCarbon intensity of land-based passenger transport (gCO2/pkm)
AGRICULTUREFood loss and waste (kg/capita/yr)
20302018 205040
20
0
21.7
35
6.7
5x 3x
20302018 2050
69.3 750
25002500
1250
011x
36x
20302019 205010
5
0 0.332
6.5
20302017 20508,000
4,000
0
7,117
5,551 4,358
20302015 2050100
50
0 5%20-35%
302015 2030 2050
100
50
0 0%10-25%
6120302017 2050
2000
1000
0
1850
1335-1350
0-130
20302019 2050150
75
0 0
35-60
104
94
141188
20302019 2050200
100
0

9State of Climate Action: Assessing Progress toward 2030 and 2050
Figure ES-1 | Summary of indicator assessment for sectoral emissions reductions (cont'd.)
Historical change has been headed in the wrong direction
Data are insu�icient to assess the rate of historical change and the gap in action.
INDUSTRYCarbon intensity of steel production (kgCO2/t)
The historical rate of change is heading in the right direction but well below required levels for 2030 and 2050 (continued)
FORESTSGross tree cover gain (Mha/yr)
FORESTSGross carbon removals from reforestation (MtCO2/yr)
FORESTSDeforestation (Mha/yr)
AGRICULTUREEmissions from agricultural production (MtCO2e)
BUILDINGSCarbon intensity of buildings - residential (kWh/m2)
BUILDINGSCarbon intensity of buildings - commercial (kWh/m2)
TRANSPORTCarbon intensity of land-based passenger transport (gCO2/pkm)
AGRICULTUREFood loss and waste (kg/capita/yr)
20302018 205040
20
0
21.7
35
6.7
5x 3x
20302018 2050
69.3 750
25002500
1250
011x
36x
20302019 205010
5
0 0.332
6.5
20302017 20508,000
4,000
0
7,117
5,551 4,358
20302015 2050100
50
0 5%20-35%
302015 2030 2050
100
50
0 0%10-25%
6120302017 2050
2000
1000
0
1850
1335-1350
0-130
20302019 2050150
75
0 0
35-60
104
94
141188
20302019 2050200
100
0
Notes:a While no global target is set for building energy intensity, available historical data (IEA 2020h) indicate that current progress is not sufficient to achieve what is needed for a sustainable development scenario in 2030.
b While limited historical value of renovation rate data are available to calculate the historical rate of change and the rate of change needed to achieve the targets, the 1–2 percent of typical current rate of energy renovation (energy intensity reduction of around 15 percent) (IEA 2020a) is not sufficient for the deep renovation target set for 2030 and 2040.
c Historical level and historical rate of change are based on IEA (2020d) as a proxy to assess progress made, which is not sufficient for the pace of change needed to achieve the 2030 and 2050 targets.
d Notes on targets with insufficient data:• The buildings sector carbon intensity of buildings target is marked as “insufficient data” because only 2017 historical data are available to assess historical rate of change globally.
From the select regions discussed here the progress is insufficient for some regions or heading in the wrong direction for others. • The industry carbon intensity of steel production target is marked as “insufficient data” because only 2018 historical data are available to assess the historical progress globally. • The transport carbon intensity of land-based passenger transport target is marked as “insufficient data” because historical data are not available to assess the historical rate of change.• The agriculture food loss and waste target is marked as “insufficient data” because historical data are not yet available to track this indicator. • Acceleration factors are missing in cases where data was insufficient to calculate.
WRI.org10
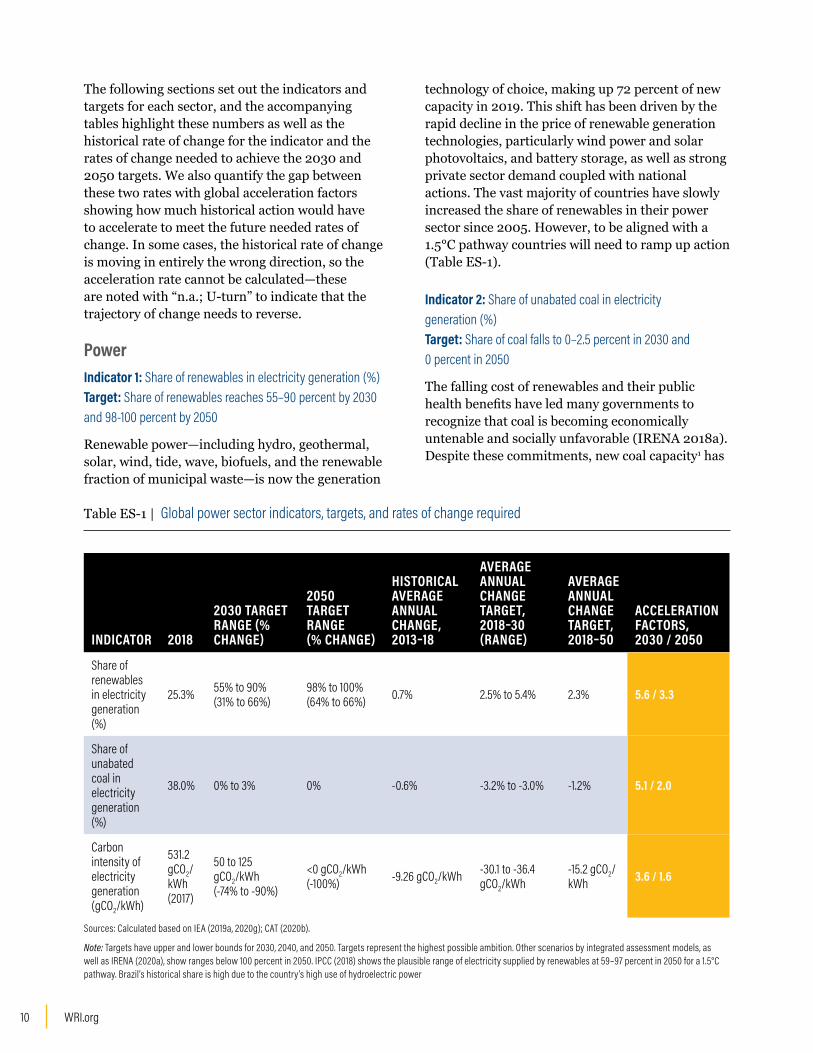
The following sections set out the indicators and targets for each sector, and the accompanying tables highlight these numbers as well as the historical rate of change for the indicator and the rates of change needed to achieve the 2030 and 2050 targets. We also quantify the gap between these two rates with global acceleration factors showing how much historical action would have to accelerate to meet the future needed rates of change. In some cases, the historical rate of change is moving in entirely the wrong direction, so the acceleration rate cannot be calculated—these are noted with “n.a.; U-turn” to indicate that the trajectory of change needs to reverse.
PowerIndicator 1: Share of renewables in electricity generation (%) Target: Share of renewables reaches 55–90 percent by 2030 and 98-100 percent by 2050
Renewable power—including hydro, geothermal, solar, wind, tide, wave, biofuels, and the renewable fraction of municipal waste—is now the generation
technology of choice, making up 72 percent of new capacity in 2019. This shift has been driven by the rapid decline in the price of renewable generation technologies, particularly wind power and solar photovoltaics, and battery storage, as well as strong private sector demand coupled with national actions. The vast majority of countries have slowly increased the share of renewables in their power sector since 2005. However, to be aligned with a 1.5°C pathway countries will need to ramp up action (Table ES-1).
Indicator 2: Share of unabated coal in electricity generation (%) Target: Share of coal falls to 0–2.5 percent in 2030 and 0 percent in 2050
The falling cost of renewables and their public health benefits have led many governments to recognize that coal is becoming economically untenable and socially unfavorable (IRENA 2018a). Despite these commitments, new coal capacity1 has
Table ES-1 | Global power sector indicators, targets, and rates of change required
INDICATOR 2018
2030 TARGET RANGE (% CHANGE)
2050 TARGET RANGE(% CHANGE)
HISTORICAL AVERAGE ANNUAL CHANGE, 2013–18
AVERAGE ANNUAL CHANGE TARGET, 2018–30 (RANGE)
AVERAGE ANNUAL CHANGE TARGET, 2018–50
ACCELERATION FACTORS, 2030 / 2050
Share of renewables in electricity generation (%)
25.3% 55% to 90%(31% to 66%)
98% to 100%(64% to 66%) 0.7% 2.5% to 5.4% 2.3% 5.6 / 3.3
Share of unabated coal in electricity generation (%)
38.0% 0% to 3% 0% -0.6% -3.2% to -3.0% -1.2% 5.1 / 2.0
Carbon intensity of electricity generation (gCO2/kWh)
531.2 gCO2/kWh (2017)
50 to 125 gCO2/kWh(-74% to -90%)
<0 gCO2/kWh (-100%) -9.26 gCO2/kWh -30.1 to -36.4
gCO2/kWh -15.2 gCO2/kWh 3.6 / 1.6
Sources: Calculated based on IEA (2019a, 2020g); CAT (2020b).
Note: Targets have upper and lower bounds for 2030, 2040, and 2050. Targets represent the highest possible ambition. Other scenarios by integrated assessment models, as well as IRENA (2020a), show ranges below 100 percent in 2050. IPCC (2018) shows the plausible range of electricity supplied by renewables at 59–97 percent in 2050 for a 1.5°C pathway. Brazil’s historical share is high due to the country’s high use of hydroelectric power

11State of Climate Action: Assessing Progress toward 2030 and 2050
not sufficiently slowed in recent years; coal capacity is being added, primarily in China and India, to meet increasing demand (CoalSwarm 2020).
Indicator 3: Carbon intensity of electricity generation2 (gCO2/kWh) Target: Carbon intensity falls to 50–125 gCO2/kWh in 2030 and below zero in 2050
To limit warming to 1.5°C we will need to reduce the global emissions intensity of electricity generation to below zero in 2050, but we have not seen much progress toward this target in the last 30 years. Progress to date is far from the levels required through 2030 and 2050.
The following table shows baseline data, targets for 2030 and 2050, the historical rate of change, and the needed future rates of change to meet the targets. The last column quantifies the gap between the historical and future rates of change with an acceleration factor—or how much the historical rate of change needs to accelerate to be on track to meet the targets.
BuildingsIndicator 1: Carbon intensity of buildings (kgCO2/m2) Targets: Carbon intensity of residential buildings is 45–65 percent lower than 2015 levels by 2030 for select regions. Carbon intensity of commercial buildings is 65–75 percent lower than 2015 levels by 2030 for select regions. All buildings reach near-zero emissions intensity globally by 2050.
The carbon intensity of buildings is measured in terms of kilograms of carbon dioxide (CO2) emitted per square meter of floor area (kgCO2/m2), and covers only emissions associated with building operation. The targets for emissions intensity imply that by 2050, almost all buildings will operate at zero or near-zero emissions. Available data are insufficient to assess global progress toward the target, though recent progress in some regions is either insufficient or heading in the wrong direction (Table ES-2).
Indicator 2: Energy intensity of buildings (kWh/m2) Targets: Energy intensity of residential buildings is 20–30 percent lower than 2015 levels by 2030. Energy intensity of commercial buildings is 10–30 percent lower than 2015 levels
by 2030 in key countries and regions. Energy intensity is 20–60 percent lower for residential buildings and 15–50 percent lower for commercial buildings than 2015 levels by 2050 in key countries and regions.
Energy intensity of buildings is measured as kilowatt-hours per square meter of floor space (kWh/m2). The growth in energy intensity will be driven by regions with growing demand for energy services that improve quality of life—for example, hot regions with increased need for and access to space cooling. Efficiency gains in all energy demand activities in buildings and improvement in building envelopes will be required. The energy use per square meter must be cut almost by half in most regions in 2050 compared to 2015 levels.
Globally, the energy intensity of buildings has been decreasing by 0.5–1 percent per year since 2010, though the rate of change needs to be accelerated to at least 2.5 percent decrease per year to be on track with the sustainable development scenario (IEA 2020h). A global goal for energy intensity has not been established in this report given the significant variation in countries’ climates and national circumstances. Instead, targets are set for select countries and regions to guide potential future pathways, and the ranges of the targets are listed in Table ES-2.
Indicator 3: Renovation rate of buildings (%/yr) Target: The share of the world’s buildings that is renovated each year rises to 2.5–3.5 percent in 2030 and 3.5 percent in 2040. No more renovation is needed in 2050.
Renovating buildings can help improve building efficiency by saving energy and reducing emissions, as well as bringing the benefit of improved well-being and comfort. Renovation here refers to deep renovation, which includes upgrades to building envelopes and shifts to zero-carbon heating and cooling technologies. The target global renovation rate would provide a Paris-compatible pathway and lead to a fully renovated building stock by 2050. Currently the world’s building stock is renovated at an average rate of around 1–2 percent per year (IEA 2020a), but the rate varies widely by region.

WRI.org12
IndustryIndicator 1: Carbon intensity of cement production (kgCO2/t) Target: Emissions intensity is 40 percent lower than 2015 levels in 2030 and 85–91 percent lower than 2015 levels in 2050, with an aspirational target to achieve 100 percent reduction in 2050.
Cement production is a carbon-intensive process and the largest contributor (27 percent) to industrial CO2 emissions. Its emissions intensity has been relatively stable over the past few years, but drastic reductions will be required to decarbonize the cement production process (Table ES-3). Cement production has been relatively stable over the past five years, at around 4.1 billion to 4.2 billion tonnes per year, and is projected to continue to grow moderately (IEA 2020b).
Indicator 2: Carbon intensity of steel production (kgCO2/t) Target: Carbon intensity is 25–30 percent lower than 2015 values in 2030 and falls to near net zero in 2050.
Table ES-2 | Buildings sector indicators, targets, and rates of change required
INDICATOR 2015a
2030 TARGET RANGE (% CHANGE FROM 2015 LEVELS)
2050 TARGET RANGE (% CHANGE FROM 2015 LEVELS)
HISTORICAL AVERAGE ANNUAL CHANGE, 2012–17
AVERAGE ANNUAL CHANGE TARGET, 2015–30 (RANGE)
AVERAGE ANNUAL CHANGE TARGET, 2015–50(RANGE)
ACCELERATION FACTORS, 2030 / 2050
Residential buildings, carbon intensity (kgCO2/m²)
30b -45% to -65%e -95% n.d. -0.3 to -2.1e -0.9 n.d. / n.d.
Commercial buildings, carbon intensity (kgCO2/m²)
61b -65% to -75%e -100% n.d. -1.8 to -6.1e -1.8 n.d. / n.d.
Residential buildings, energy intensity (kWh/m²)
n.d. -20% to -30% -20 to -60% -0.8%d -0.9 to -3.2 -0.4 to -2.8 n.d. / n.d.
Commercial buildings, energy intensity (kWh/m²)
n.d. -10% to -30% -15% to -50% -0.8%d -0.5 to -5.1 -0.6 to -4.4 n.d. / n.d.
HISTORICAL (ESTIMATED AVERAGE)
2030 TARGET
2040c TARGET
Renovation rate for commercial and residential buildings
1% to 2%f 2.5% to 3.5% 3.5% n.d.f n.d.f n.d.f n.d. / n.d.
Notes: n.d. indicates no data.
a The targets are defined as percentage reduction from 2015 levels. Percent reduction needed values are rounded to the closest 5 percent. While 2017 historical data are available for most countries assessed, 2015 is chosen as the base year for establishing targets in the Climate Action Tracker (CAT 2020a).
b Due to data availability, 2017 world historical data are used to calculate percentage change needed.
c Target assumes all buildings have been renovated by 2050; accordingly, no renovation target is needed in 2050.
d No global target was set in CAT (2020a) for energy intensity of buildings, so the sustainable development scenario target is included here as a reference. The world annualized percentage change is based on index (2000 = 100) data during 2014–19 available from the International Energy Agency (IEA 2020h). The rate does not differentiate between residential and commercial buildings and is used as a reference here.
e For building carbon intensity, a global target was only set for 2040 and 2050, thus 2030 ranges based on targets for select regions are shown here for the 2030 target, and average annual change needed during 2015–30.
f While limited historical value of renovation rate data are available to calculate the historical rate of change and the rate of change needed to achieve the targets, the 1–2 percent of typical current rate of energy renovation (energy intensity reduction of around 15 percent) is not sufficient for the deep renovation target set for 2030 and 2040.
Source: CAT (2020a).

13State of Climate Action: Assessing Progress toward 2030 and 2050
IndustryIndicator 1: Carbon intensity of cement production (kgCO2/t) Target: Emissions intensity is 40 percent lower than 2015 levels in 2030 and 85–91 percent lower than 2015 levels in 2050, with an aspirational target to achieve 100 percent reduction in 2050.
Cement production is a carbon-intensive process and the largest contributor (27 percent) to industrial CO2 emissions. Its emissions intensity has been relatively stable over the past few years, but drastic reductions will be required to decarbonize the cement production process (Table ES-3). Cement production has been relatively stable over the past five years, at around 4.1 billion to 4.2 billion tonnes per year, and is projected to continue to grow moderately (IEA 2020b).
Indicator 2: Carbon intensity of steel production (kgCO2/t) Target: Carbon intensity is 25–30 percent lower than 2015 values in 2030 and falls to near net zero in 2050.
Iron and steel production is the second-largest contributor (25 percent) to CO2 emissions in the industrial sector after cement (IEA 2020e). Over the past couple of decades, the carbon intensity of steel production has been improving slightly (CAT 2020a). Global data are missing for the historical rate of change of carbon intensity in the steel sector, so it is not possible to compare it with the rate of change required in the future and assess whether we are on track to achieve the targets for this indicator.
Indicator 3: Share of electricity in final energy use in industry (%) Target: The share of electricity in final energy use in industry reaches 35 percent in 2030, 45–55 percent in 2040, and 50–55 percent in 2050, compared to 27 percent in 2017.
Fossil fuels are used to provide high-temperature heat required in industrial processes like cement and steel production. Electrification of these subsectors can be increased, but it cannot fully replace fossil fuels, and alternative fuels like green hydrogen may also play a role in the future.
Table ES-2 | Buildings sector indicators, targets, and rates of change required
INDICATOR 2015a
2030 TARGET RANGE (% CHANGE FROM 2015 LEVELS)
2050 TARGET RANGE (% CHANGE FROM 2015 LEVELS)
HISTORICAL AVERAGE ANNUAL CHANGE, 2012–17
AVERAGE ANNUAL CHANGE TARGET, 2015–30 (RANGE)
AVERAGE ANNUAL CHANGE TARGET, 2015–50(RANGE)
ACCELERATION FACTORS, 2030 / 2050
Residential buildings, carbon intensity (kgCO2/m²)
30b -45% to -65%e -95% n.d. -0.3 to -2.1e -0.9 n.d. / n.d.
Commercial buildings, carbon intensity (kgCO2/m²)
61b -65% to -75%e -100% n.d. -1.8 to -6.1e -1.8 n.d. / n.d.
Residential buildings, energy intensity (kWh/m²)
n.d. -20% to -30% -20 to -60% -0.8%d -0.9 to -3.2 -0.4 to -2.8 n.d. / n.d.
Commercial buildings, energy intensity (kWh/m²)
n.d. -10% to -30% -15% to -50% -0.8%d -0.5 to -5.1 -0.6 to -4.4 n.d. / n.d.
HISTORICAL (ESTIMATED AVERAGE)
2030 TARGET
2040c TARGET
Renovation rate for commercial and residential buildings
1% to 2%f 2.5% to 3.5% 3.5% n.d.f n.d.f n.d.f n.d. / n.d.
Notes: n.d. indicates no data.
a The targets are defined as percentage reduction from 2015 levels. Percent reduction needed values are rounded to the closest 5 percent. While 2017 historical data are available for most countries assessed, 2015 is chosen as the base year for establishing targets in the Climate Action Tracker (CAT 2020a).
b Due to data availability, 2017 world historical data are used to calculate percentage change needed.
c Target assumes all buildings have been renovated by 2050; accordingly, no renovation target is needed in 2050.
d No global target was set in CAT (2020a) for energy intensity of buildings, so the sustainable development scenario target is included here as a reference. The world annualized percentage change is based on index (2000 = 100) data during 2014–19 available from the International Energy Agency (IEA 2020h). The rate does not differentiate between residential and commercial buildings and is used as a reference here.
e For building carbon intensity, a global target was only set for 2040 and 2050, thus 2030 ranges based on targets for select regions are shown here for the 2030 target, and average annual change needed during 2015–30.
f While limited historical value of renovation rate data are available to calculate the historical rate of change and the rate of change needed to achieve the targets, the 1–2 percent of typical current rate of energy renovation (energy intensity reduction of around 15 percent) is not sufficient for the deep renovation target set for 2030 and 2040.
Source: CAT (2020a).
Table ES-3 | Industry sector indicators, targets and rates of change required
INDICATOR 2017
2030 TARGET RANGE (% CHANGE)
2050 TARGET RANGE (% CHANGE)
HISTORICAL AVERAGE ANNUAL CHANGE, 2012–17
AVERAGE ANNUAL CHANGE TARGET, 2017–30 (RANGE)
AVERAGE ANNUAL CHANGE TARGET, 2017–50 (RANGE)
ACCELERATION FACTORS, 2030 / 2050
Carbon intensity of cement production(kgCO2/t)
614360 to 370(-40% to -41%)
55 to 90(-85% to -91%)
0 -19 to -20 -16 to -17 n.d.c
Carbon intensity of steel production (kgCO2/t)a
1,8501,335 to 1,350(-27% to -28%)
0 to 130(-93% to -100%)
n.d. -42 to -43 -54 to -58 n.d.
Share of electricity in final energy use in industry (%)
27% 35% 50% to 55% 0.44%b 0.6% 0.7% to 0.8% 1.4 / 1.8
Notes: n.d. indicates no data.a 2018 was the year of historical value for carbon intensity of steel production. It is used for calculating average annual change targets.b 2010–17 was used to calculate historical average annual change for share of electricity in final energy use in industry due to data availability.c Acceleration factor cannot be calculated because the baseline rate of change is zero.Source: CAT (2020a).

WRI.org14
has expanded rapidly, from 1.5 percent in 2017 to 2.6 percent in 2019 (IEA 2020d). However, this rate of increase is still not sufficient and must accelerate to reach what is needed by 2030 and 2050.
Indicator 3: Carbon intensity of land-based passenger transport (gCO2/pkm) Target: Carbon intensity per passenger-kilometer traveled cut in half in 2030 compared to 2014 levels and reaches near zero in 2050.
A key opportunity to decarbonize the transport sector lies in reducing the fossil fuel combusted in vehicles and switching to electricity or low-carbon fuel types. It is also important to incentivize behavioral changes such as choosing to use more public transport and car-sharing rather than private vehicles. There are no historical data for
Table ES-4 | Transport sector indicators, targets and rates of change required
2017
2030 TARGET RANGE (% CHANGE)
2050 TARGET RANGE (% CHANGE)
HISTORICAL AVERAGE ANNUAL CHANGE, 2010–17
AVERAGE ANNUAL CHANGE TARGET, 2017–30 (RANGE)
AVERAGE ANNUAL CHANGE TARGET, 2017–50 (RANGE)
ACCELERATION FACTORS, 2030 / 2050
EV share (%) in total vehicle stock 0.8%b 20% to 40% 85% to
100% 0.1%d 1.5% to 3.0% 2.6% to 3.0% 22 / 28
EV share (%) in new vehicle sales 2.6%c 75% to 95% 100% 0.6%c 5.7% to 7.2% 3.0% 12 / 5.2
Carbon intensity of land-based transport (gCO2/pkm)a
10435 to 60(-42% to -66%)
0(-100%) n.d. -2.8 to -4.3 -2.9 n.d.
Share of low-carbon fuels in transport sector (%)
4% 15% 70% to 95% 0.10% 0.8% 2.0% to 2.8% 8 / 24
Notes: n.d. indicates no data.
a Historical value and calculations of percentage change needed are based on 2014 data for carbon intensity of land-based transport.
b 2019 numbers based on IEA (2020d) as a proxy for historical level. Historical rate of change is during 2014–19. Both battery electric vehicles (BEVs) and plug-in hybrid electric vehicles (PHEVs) are covered here.
c 2019 numbers based on IEA (2020d) as a proxy for historical level and rate of change. Both BEVs and PHEVs are covered in the share. Historical rate of change is during 2017–19 based on available data.
Source: CAT (2020a).
This indicator, however, considers not just cement and steel but all of industry. The historical electrification rate of industry is similar to the rate of change required over the next decade, but a large gap remains by midcentury. Electrification of industrial processes can only bring decarbonization benefits to the sector when powered by a low- or zero-carbon grid. Meeting the energy demand in the industry sector with low-carbon sources such as waste and sustainably produced biomass would be essential to fully decarbonize the sector.
TransportIndicator 1: Share of electric vehicles (EVs) in the global light-duty vehicle fleet Target: Share of EVs in global light-duty vehicles reaches 20–40 percent by 2030, and 85–100 percent by 2050.
Globally, EVs are rapidly penetrating the road transport fleet. In 2010, there were about 17,000 electric cars in the world, but the stock rose to more
than 7 million passenger EVs in 2019, representing almost 1 percent of the global car fleet (IEA 2020d). While promoting EVs is only part of the solution to meet the increasing travel demand with low-carbon and safe options, a rapid and accelerated transition would be required to reach the level of EV share necessary to align with the temperature goals (Table ES-4).
Indicator 2: Share of EVs in annual new car sales (%) Target: Sale of EVs as a percentage of all new car sales reaches 45–100 percent in 2030, and 95–100 percent by 2050.
In order to decarbonize transport, all new passenger vehicles need to be zero-carbon vehicles powered by a decarbonized grid. Currently the share of EVs in new car sales is still quite small, with European countries taking the lead: EVs account for more than 1 percent of new sales in 20 countries, and Norway leads with 56 percent. The share is much lower in most other countries (IEA 2020d). Globally the share of EVs in new car sales
15State of Climate Action: Assessing Progress toward 2030 and 2050
has expanded rapidly, from 1.5 percent in 2017 to 2.6 percent in 2019 (IEA 2020d). However, this rate of increase is still not sufficient and must accelerate to reach what is needed by 2030 and 2050.
Indicator 3: Carbon intensity of land-based passenger transport (gCO2/pkm) Target: Carbon intensity per passenger-kilometer traveled cut in half in 2030 compared to 2014 levels and reaches near zero in 2050.
A key opportunity to decarbonize the transport sector lies in reducing the fossil fuel combusted in vehicles and switching to electricity or low-carbon fuel types. It is also important to incentivize behavioral changes such as choosing to use more public transport and car-sharing rather than private vehicles. There are no historical data for
this indicator, and accordingly the pace of historical change cannot be compared with what is needed by 2030 and 2050.
Indicator 4: Share of low-carbon fuels in the transport sector (%) Target: Share of low-carbon fuels reaches 15 percent by 2030 and 70–95 percent by 2050.
Currently the transport sector is still largely dependent on fossil fuels. While we have seen improvement in the share of low-emissions fuels in transport over the past two decades, the rate of change needs to about double in the next decade and increase multifold by midcentury. The modeling does not prescribe the specific low-carbon fuels to be used in each country, although options can include, among others, electricity powered by a decarbonized grid, sustainably produced biomass, and hydrogen.
Table ES-4 | Transport sector indicators, targets and rates of change required
2017
2030 TARGET RANGE (% CHANGE)
2050 TARGET RANGE (% CHANGE)
HISTORICAL AVERAGE ANNUAL CHANGE, 2010–17
AVERAGE ANNUAL CHANGE TARGET, 2017–30 (RANGE)
AVERAGE ANNUAL CHANGE TARGET, 2017–50 (RANGE)
ACCELERATION FACTORS, 2030 / 2050
EV share (%) in total vehicle stock 0.8%b 20% to 40% 85% to
100% 0.1%d 1.5% to 3.0% 2.6% to 3.0% 22 / 28
EV share (%) in new vehicle sales 2.6%c 75% to 95% 100% 0.6%c 5.7% to 7.2% 3.0% 12 / 5.2
Carbon intensity of land-based transport (gCO2/pkm)a
10435 to 60(-42% to -66%)
0(-100%) n.d. -2.8 to -4.3 -2.9 n.d.
Share of low-carbon fuels in transport sector (%)
4% 15% 70% to 95% 0.10% 0.8% 2.0% to 2.8% 8 / 24
Notes: n.d. indicates no data.
a Historical value and calculations of percentage change needed are based on 2014 data for carbon intensity of land-based transport.
b 2019 numbers based on IEA (2020d) as a proxy for historical level. Historical rate of change is during 2014–19. Both battery electric vehicles (BEVs) and plug-in hybrid electric vehicles (PHEVs) are covered here.
c 2019 numbers based on IEA (2020d) as a proxy for historical level and rate of change. Both BEVs and PHEVs are covered in the share. Historical rate of change is during 2017–19 based on available data.
Source: CAT (2020a).

WRI.org16
ForestsIndicator 1: Deforestation (million hectares) Target: Reduce deforestation by 70 percent relative to the 2019 level by 2030 and by 95 percent by 2050.
Forest losses caused by conversion to other land uses, such as commodity production, urbanization, and in some cases shifting agriculture, are most likely to be permanent (i.e., deforestation). To be on track to keep temperature rise below 1.5°C, it is critical to reduce total deforestation 70 percent by 2030 and 95 percent by 2050 (Roe et al. 2019) (Table ES-5). In 2014, a broad coalition of national governments and other organizations adopted the New York Declaration on Forests—one of many initiatives aimed at reducing deforestation—with a goal of halving deforestation by 2020 and eliminating it by 2030. Since then, tree cover loss has not declined but rather has increased (NYDF Assessment Partners 2019).
Indicator 2: Gross tree cover gain (million hectares) Target: Restore tree cover on 350 million hectares3 of land by 2030 and 678 million hectares by 2050.
Political will for reforestation is high, but translating commitments to action has proved more difficult for a number of reasons, including competition for land for food production and limited capacity to collect data and report progress. There are no globally consistent data for reforestation specifically, but some data are available for landscape restoration, which includes reforestation and is the best proxy measure available. Countries have pledged to restore 349 million hectares (Mha) of land by 2030 under the Bonn Challenge4 and in nationally determined contributions (Cook-Patton forthcoming). Since 2000, however, only 26.7 Mha have actually been restored based on available data, which are not yet comprehensive (Bonn Challenge 2020; NYDF Assessment Partners 2019).
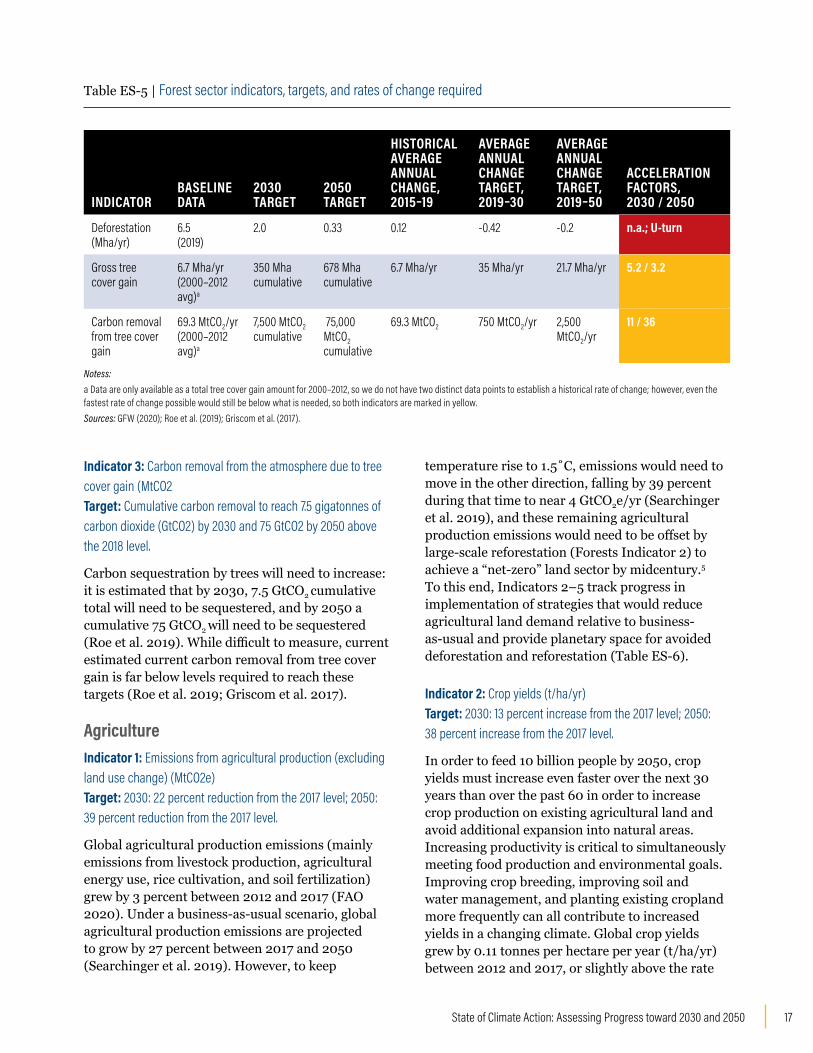
Table ES-5 | Forest sector indicators, targets, and rates of change required
INDICATORBASELINE DATA
2030 TARGET
2050 TARGET
HISTORICAL AVERAGE ANNUAL CHANGE, 2015–19
AVERAGE ANNUAL CHANGE TARGET, 2019–30
AVERAGE ANNUAL CHANGE TARGET, 2019–50
ACCELERATION FACTORS, 2030 / 2050
Deforestation (Mha/yr)
6.5 (2019)
2.0 0.33 0.12 -0.42 -0.2 n.a.; U-turn
Gross tree cover gain
6.7 Mha/yr(2000–2012 avg)a
350 Mha cumulative
678 Mha cumulative
6.7 Mha/yr 35 Mha/yr 21.7 Mha/yr 5.2 / 3.2
Carbon removal from tree cover gain
69.3 MtCO2/yr(2000–2012 avg)a
7,500 MtCO2cumulative
75,000 MtCO2 cumulative
69.3 MtCO2 750 MtCO2/yr 2,500 MtCO2/yr
11 / 36
Notess:a Data are only available as a total tree cover gain amount for 2000–2012, so we do not have two distinct data points to establish a historical rate of change; however, even the fastest rate of change possible would still be below what is needed, so both indicators are marked in yellow. Sources: GFW (2020); Roe et al. (2019); Griscom et al. (2017).
17State of Climate Action: Assessing Progress toward 2030 and 2050
Indicator 3: Carbon removal from the atmosphere due to tree cover gain (MtCO2 Target: Cumulative carbon removal to reach 7.5 gigatonnes of carbon dioxide (GtCO2) by 2030 and 75 GtCO2 by 2050 above the 2018 level.
Carbon sequestration by trees will need to increase: it is estimated that by 2030, 7.5 GtCO2 cumulative total will need to be sequestered, and by 2050 a cumulative 75 GtCO2 will need to be sequestered (Roe et al. 2019). While difficult to measure, current estimated current carbon removal from tree cover gain is far below levels required to reach these targets (Roe et al. 2019; Griscom et al. 2017).
Agriculture Indicator 1: Emissions from agricultural production (excluding land use change) (MtCO2e) Target: 2030: 22 percent reduction from the 2017 level; 2050: 39 percent reduction from the 2017 level.
Global agricultural production emissions (mainly emissions from livestock production, agricultural energy use, rice cultivation, and soil fertilization) grew by 3 percent between 2012 and 2017 (FAO 2020). Under a business-as-usual scenario, global agricultural production emissions are projected to grow by 27 percent between 2017 and 2050 (Searchinger et al. 2019). However, to keep
temperature rise to 1.5˚C, emissions would need to move in the other direction, falling by 39 percent during that time to near 4 GtCO2e/yr (Searchinger et al. 2019), and these remaining agricultural production emissions would need to be offset by large-scale reforestation (Forests Indicator 2) to achieve a “net-zero” land sector by midcentury.5 To this end, Indicators 2–5 track progress in implementation of strategies that would reduce agricultural land demand relative to business-as-usual and provide planetary space for avoided deforestation and reforestation (Table ES-6).
Indicator 2: Crop yields (t/ha/yr) Target: 2030: 13 percent increase from the 2017 level; 2050: 38 percent increase from the 2017 level.
In order to feed 10 billion people by 2050, crop yields must increase even faster over the next 30 years than over the past 60 in order to increase crop production on existing agricultural land and avoid additional expansion into natural areas. Increasing productivity is critical to simultaneously meeting food production and environmental goals. Improving crop breeding, improving soil and water management, and planting existing cropland more frequently can all contribute to increased yields in a changing climate. Global crop yields grew by 0.11 tonnes per hectare per year (t/ha/yr) between 2012 and 2017, or slightly above the rate
Indicator 2: Gross tree cover gain (million hectares) Target: Restore tree cover on 350 million hectares3 of land by 2030 and 678 million hectares by 2050.
Political will for reforestation is high, but translating commitments to action has proved more difficult for a number of reasons, including competition for land for food production and limited capacity to collect data and report progress. There are no globally consistent data for reforestation specifically, but some data are available for landscape restoration, which includes reforestation and is the best proxy measure available. Countries have pledged to restore 349 million hectares (Mha) of land by 2030 under the Bonn Challenge4 and in nationally determined contributions (Cook-Patton forthcoming). Since 2000, however, only 26.7 Mha have actually been restored based on available data, which are not yet comprehensive (Bonn Challenge 2020; NYDF Assessment Partners 2019).
Table ES-5 | Forest sector indicators, targets, and rates of change required
INDICATORBASELINE DATA
2030 TARGET
2050 TARGET
HISTORICAL AVERAGE ANNUAL CHANGE, 2015–19
AVERAGE ANNUAL CHANGE TARGET, 2019–30
AVERAGE ANNUAL CHANGE TARGET, 2019–50
ACCELERATION FACTORS, 2030 / 2050
Deforestation (Mha/yr)
6.5 (2019)
2.0 0.33 0.12 -0.42 -0.2 n.a.; U-turn
Gross tree cover gain
6.7 Mha/yr(2000–2012 avg)a
350 Mha cumulative
678 Mha cumulative
6.7 Mha/yr 35 Mha/yr 21.7 Mha/yr 5.2 / 3.2
Carbon removal from tree cover gain
69.3 MtCO2/yr(2000–2012 avg)a
7,500 MtCO2cumulative
75,000 MtCO2 cumulative
69.3 MtCO2 750 MtCO2/yr 2,500 MtCO2/yr
11 / 36
Notess:a Data are only available as a total tree cover gain amount for 2000–2012, so we do not have two distinct data points to establish a historical rate of change; however, even the fastest rate of change possible would still be below what is needed, so both indicators are marked in yellow. Sources: GFW (2020); Roe et al. (2019); Griscom et al. (2017).

WRI.org18
of change needed between 2017 and 2050. While this is encouraging, two caveats are necessary. First, this global yield growth represents an enormous amount of effort, and just maintaining the necessary level of improvement for another three decades, in a changing climate, will be a major undertaking. Second, this recent global trend masks wide variation between regions. In particular, sub-Saharan Africa, where crop yields are the lowest in the world, saw slow yield growth from 2012 to 2017 (only 0.01 t/ha/yr), when compared to the regional target of 0.11 t/ha/yr between 2017 and 2050 to meet projected growth in regional food demand without further deforestation and/or increasing reliance on food imports.
Indicator 3: Productivity of ruminant meat production (kg/ha/yr) Target: 2030: increase of 27 percent above the 2017 level; 2050: increase of 58 percent above the 2017 level.
As incomes rise, demand for meat and milk from ruminant animals (e.g., cattle, sheep, goats) is likely to grow even more than demand for crops out to the year 2050. At a global scale, the pace of productivity gains between 2017 and 2050 would need to be
even faster than between 2012 and 2017, a period that saw a 5 percent increase in ruminant meat production per hectare of pasture per year (FAO 2020).
Indicator 4: Food loss and waste (kg/capita/yr) Target: 2030: 25 percent reduction below the 2017 level; 2050: 50 percent reduction from the 2017 level.
Roughly one-third of all food produced in the world each year (by weight) is lost or wasted between the farm and the fork (FAO 2011a). Because of the many complexities across regions and supply chains and gaps in food loss and waste data, we have set equal targets of 25 percent reductions in per capita food loss and waste across all regions by 2030 and 50 percent by 2050.
Indicator 5: Ruminant meat consumption (kcal/person/day) Target: 2030: limit increase to 5 percent above the 2017 level; 2050: limit increase to 6 percent above the 2017 level.
As incomes rise and people move to cities, diets tend to become more varied and also higher in resource-intensive foods like meat and dairy. For this reason, consumption of animal-based foods
Table ES-6 | Agriculture sector indicators, targets, and rates of change required
INDICATORBASELINE DATA 2017
2030 TARGET (% CHANGE)
2050 TARGET (% CHANGE)
AVERAGE ANNUAL CHANGE, 2012–17
AVERAGE ANNUAL CHANGE TARGET, 2017–30
AVERAGE ANNUAL CHANGE TARGET, 2017–50
ACCELERATION FACTORS, 2030 / 2050
Emissions from agricultural production (MtCO2e)
7,117 5,551 (-22%) 4,358 (-39%) 36.9 -120.5 -83.6 n.a.; U-turn
Crop yields (t/ha/yr) 6.5 7.4 (13%) 9.0 (38%) 0.11 0.07 0.08 On track
Productivity of ruminant meat production (kg/ha/yr)
26.0 33.0 (27%) 41.1 (58%) 0.24 0.54 0.46 2.3 / 1.9
Food loss and waste (kg/capita/yr)
188a 141 (-25%) 94 (-50%) n.d. n.d. n.d. n.d.
Ruminant meat consumption (kcal meat/capita/day)
48.8 51.0 (5%) 51.7 (6%) -0.3 0.2 0.1 On track
Note:
a Estimate is for year 2009, given in FAO (2011a). More current global estimates are not yet available.
Sources: FAO (2020) for years 2012 and 2017; GlobAgri-WRR model in Searchinger et al. (2019) for 2030 and 2050 targets.

19State of Climate Action: Assessing Progress toward 2030 and 2050
is projected to grow by nearly 70 percent between 2010 and 2050 (Searchinger et al. 2019). Modest increases in consumption of animal-based foods can boost nutrition in low-income countries, but in countries where meat consumption is high, shifting diets toward plant-based foods can reduce agricultural land demand and GHG emissions. If ruminant meat consumption in high-consuming countries declined by 40 percent by 2050 to 52 kcal/person/day, or about 1.5 burgers/person/week, it would reduce agricultural land demand by more than 500 million hectares relative to business-as-usual (Searchinger et al. 2019). Per
capita ruminant meat consumption declined at the global level between 2012 and 2017, but this global trend hides regional variation. The trend from 2012 to 2017 shows that the Americas and Europe would need to reduce consumption three times more quickly to meet 2050 regional targets. Meanwhile, low-income regions such as sub-Saharan Africa actually reduced ruminant meat consumption between 2012 and 2017, even though their 2050 regional target allows for growth. Therefore, the world saw recent progress toward the global target but in a suboptimal way that maintained inequality of consumption between regions.
even faster than between 2012 and 2017, a period that saw a 5 percent increase in ruminant meat production per hectare of pasture per year (FAO 2020).
Indicator 4: Food loss and waste (kg/capita/yr) Target: 2030: 25 percent reduction below the 2017 level; 2050: 50 percent reduction from the 2017 level.
Roughly one-third of all food produced in the world each year (by weight) is lost or wasted between the farm and the fork (FAO 2011a). Because of the many complexities across regions and supply chains and gaps in food loss and waste data, we have set equal targets of 25 percent reductions in per capita food loss and waste across all regions by 2030 and 50 percent by 2050.
Indicator 5: Ruminant meat consumption (kcal/person/day) Target: 2030: limit increase to 5 percent above the 2017 level; 2050: limit increase to 6 percent above the 2017 level.
As incomes rise and people move to cities, diets tend to become more varied and also higher in resource-intensive foods like meat and dairy. For this reason, consumption of animal-based foods
Table ES-6 | Agriculture sector indicators, targets, and rates of change required
INDICATORBASELINE DATA 2017
2030 TARGET (% CHANGE)
2050 TARGET (% CHANGE)
AVERAGE ANNUAL CHANGE, 2012–17
AVERAGE ANNUAL CHANGE TARGET, 2017–30
AVERAGE ANNUAL CHANGE TARGET, 2017–50
ACCELERATION FACTORS, 2030 / 2050
Emissions from agricultural production (MtCO2e)
7,117 5,551 (-22%) 4,358 (-39%) 36.9 -120.5 -83.6 n.a.; U-turn
Crop yields (t/ha/yr) 6.5 7.4 (13%) 9.0 (38%) 0.11 0.07 0.08 On track
Productivity of ruminant meat production (kg/ha/yr)
26.0 33.0 (27%) 41.1 (58%) 0.24 0.54 0.46 2.3 / 1.9
Food loss and waste (kg/capita/yr)
188a 141 (-25%) 94 (-50%) n.d. n.d. n.d. n.d.
Ruminant meat consumption (kcal meat/capita/day)
48.8 51.0 (5%) 51.7 (6%) -0.3 0.2 0.1 On track
Note:
a Estimate is for year 2009, given in FAO (2011a). More current global estimates are not yet available.
Sources: FAO (2020) for years 2012 and 2017; GlobAgri-WRR model in Searchinger et al. (2019) for 2030 and 2050 targets.


21State of Climate Action: Assessing Progress toward 2030 and 2050
SNAPSHOT OF A CHANGING CLIMATE We have already seen a 1°C rise in global average temperature
since the Industrial Revolution. This has had major impacts on
people (with those most vulnerable disproportionately impacted),
ecosystems, and infrastructure. Temperature could increase by
more than 3°C, even with full implementation of countries’ climate
commitments.

WRI.org22
Under the Paris Agreement, countries agreed to limit warming to well below 2°C above preindustrial levels and to pursue efforts to limit warming to 1.5°C to avoid the worst impacts of climate change. According to the latest science from the Intergovernmental Panel on Climate Change (IPCC 2018), global greenhouse gas (GHG) emissions
will need to be halved by 2030 and reach net zero by midcentury in order to have a good chance of holding temperature increase to 1.5°C.6 The sooner emissions peak and the lower they are at the time of peaking, the greater the likelihood of reaching net-zero emissions in time.
Figure 1 | Impact of COVID-19 on fossil CO2 emissions
Source: Le Quéré et al. (2020).
Greenhouse gas emissions from fossil fuel combustion, deforestation, and other causes have already resulted in 1.1°C of warming above preindustrial levels (WMO 2020), which has radically altered our climate. The impacts of a changing climate are already bringing catastrophic damage to communities around the world, leading to loss of life, livelihoods, ecosystems, homes, and other infrastructure we depend on. Already as a result of changes in temperature, precipitation, and sea level rise, we are seeing extreme weather events unfold around the world. Recent research confirms that these events are getting more frequent and severe. This year, extreme fires burned 18 million hectares in Australia, and the conditions that sparked and spread the fires were found to be at least 30 percent more likely because of human-induced climate change (Phillips 2020). As of mid-September, 2020’s record-setting fires on the U.S. West Coast had claimed 30 lives,
displaced thousands, and burned houses and other infrastructure over more than 5 million acres (Migliozzi et al. 2020).
The odds of drought have increased significantly in the Mediterranean region as a result of human-caused emissions, and heat waves are increasing around the world as temperatures rise (IPCC 2014b). There also is significant evidence that the frequency, intensity, and/or amount of heavy precipitation events have increased due to anthropogenic warming (IPCC 2019a).
A definitive report from the IPCC (2018) found that the world will face severe climate impacts even with 1.5°C temperature rise. Without increased ambition in countries’ climate commitments and climate actions, we can anticipate at least 3˚C of warming by the end of the century (UNEP 2019), which could lead to an almost unrecognizable planet. The world’s most vulnerable people will be
0
5000
10000
15000
20000
25000
30000
35000
40000
1970 1975 1980 1985 1990 1995 2000 2005 2010 2015 2020
MtCO
2e

23State of Climate Action: Assessing Progress toward 2030 and 2050
most disproportionally impacted (IPCC 2019a), compounding other global challenges and our ability to meet societal goals.
Greenhouse Gas Emissions While global emissions showed no recent signs of peaking (Levin and Rich 2017), the COVID-19 crisis has led to an unprecedented decline in GHG emissions over the past half year. According to a study in May 2020 (Le Quéré et al. 2020), by early April global daily CO2 emissions had declined by 17 percent compared with average 2019 emissions (Figure 1). However, only two months later, by mid-June, as governments and businesses started to reopen, emissions had already returned to 5 percent below 2019 levels (Le Quéré et al. 2020). The choices governments and investors make in the coming months as they plan to rebuild their economies will dictate our emissions trajectory
for decades to come. And experience has shown us that emissions reductions caused by economic downturns are only temporary (Peters et al. 2012).
The 2019 UNEP Emissions Gap Report found that emissions need to be halved by 2030 to have a good chance of limiting warming to 1.5°C, which translates to reductions of 7.6 percent per year over the next decade.
Warming TemperaturesThe buildup of greenhouse gases in the atmosphere is rapidly warming the planet. The year 2019 was the second warmest since modern recordkeeping began (NASA 2020c), after 2016. The last five years have been the warmest since the Industrial Revolution (Figure 2). The past decade was the warmest on record, with each decade warmer than the one that preceded it (NASA 2020c). This warming has not been evenly distributed; the poles are warming the fastest.

WRI.org24
Figure 2 | Global mean temperature rise relative to 1951-1980 (°C)
Source: Met Office (2019).
-0.6
-0.4
-0.2
0
0.2
0.4
0.6
0.8
1
1.2
1880 1888 1896 1904 1912 1920 1928 1936 1944 1952 1960 1968 1976 1984 1992 2000 2008 2016
Climate Impacts on Ice and GlaciersIn 2019, Arctic sea ice minimum was the second lowest on record. Ice loss has been accelerating in Greenland and Antarctica (NASA 2020a) (Figure 3). In February 2020, temperatures climbed to 18.3°C (65°F) in Antarctica, its hottest day on record (NASA 2020d). Greenland’s melting in the summer of 2020 was well above average, although not as high as some recent previous summers (NSIDC 2020). In 2019 ice lost from the Greenland Ice Sheet was almost 2.5 times the average annual loss between 2002 and 2019 (Veliconga et al. 2020).
Figure 3 | Antarctic ice mass loss, 2002–20
Source: NASA (2020a).
Anta
rctic
a mas
s (Gt
)
-3000
-2500
-2000
-1500
-1000
-500
0
500
2002 2004 2006 2008 2010 2012 2014 2016 2018 2020
Glaciers around the world are also losing ice at a rate that is accelerating with each passing year. Per decade, the average loss of liquid water from glaciers nearly doubled from 460 millimeters (18 inches) of liquid water in the 1990s to 850 millimeters (33 inches) in 2010–18 (NOAA 2019).
Climate Impacts on Our OceansGlobal mean sea level rise was roughly 3.3 millimeters (mm) per year (0.13 inch/yr) between 1993 and 2020 (Figure 4) (NASA 2020b). This trend accelerated significantly during this past decade: between 2010 and 2018, sea level rise grew

25State of Climate Action: Assessing Progress toward 2030 and 2050
to about 4.4 mm/yr (0.17 inch/yr) (NASA 2020b). In 2019, sea level rise reached its highest value on record (WMO 2020).
As oceans absorb almost a quarter of CO2 emissions, the ocean has been acidifying, with a decline in pH of 0.017–0.027 per decade since the late 1980s (WMO 2020). The ocean also absorbs 90 percent of the excess heat retained by the earth, and has been warming rapidly. In 2019, the heat content of the ocean reached record highs (WMO 2020). As a
result of this heat, this year Australia experienced a new coral bleaching event that is the most widespread on record, and the third major bleaching event in only five years (Kann 2020). The IPCC’s Special Report on the Ocean and Cryosphere in a Changing Climate, documented that marine heatwaves are becoming more extensive, intense, and long-lasting. Large-scale coral bleaching events have become more frequent over the past two decades due to warming (IPCC 2019b).
Figure 4 | Sea level change (mm) since 2010
Source: NASA (2020b).
0
10
20
30
40
50
60
70
80
90
100
Sea H
eight
Varia
tion (
mm)
2010 2011 2012 2013 2014 2015 2016 2017 2018 2019 2020


27State of Climate Action: Assessing Progress toward 2030 and 2050
SNAPSHOT OF CLIMATE ACTIONCommitments by countries, cities, and companies are increasing,
but they are still far below what is needed to meet the Paris
Agreement’s goals to limit warming to well below 2°C, with efforts
to limit the rise in temperature to 1.5°C. Adaptation efforts are
gaining traction, given the onset of impacts already happening
across the globe, but greater resources are needed. And
climate finance flows, which are needed to support all of these
transformations, have been growing but need to be scaled up
significantly.

WRI.org28
National-Level ActionNationally determined contributions: In 2019, 103 countries representing 38.4 percent of global GHG emissions committed to enhancing their NDCs in 2020 (COP25 Presidency 2019) (ClimateWatch 2020a). Fifteen countries had submitted NDCs to the UN Framework Convention on Climate Change (UNFCCC) by November 2020, but these countries only account for 4.6 percent of global GHG emissions, and not all of these submissions reflected strengthened commitments.
Long-term strategies: As of November 2020, 19 Parties representing 26.5 percent of global GHG emissions had submitted their long-term strategies (ClimateWatch 2020c).
Net-zero targets: As of September 2020, 20 countries and the European Union had adopted net-zero targets, and over 100 more were considering doing so (Levin et al. 2020). However, the percentage of global emissions covered by an adopted national net-zero target still hovers at 10 percent.
Climate laws and policies: As of October 2020 there were 2,070 climate laws and policies worldwide (LSE, GRICCE 2020) and 64 carbon-pricing initiatives that had been implemented or were scheduled for implementation, representing 22.3 percent of global GHG emissions (World Bank 2020). At the end of 2019, 166 countries had targets for renewable electricity generation, 49 countries had targets for renewable energy sources for heating and cooling, and 46 countries had targets for renewable transportation fuels (REN21 2020).
The Paris Agreement, adopted in 2015, was instrumental in establishing the goals and processes to limit global warming to 1.5–2°C, enhance adaptation, and channel finance toward low GHG emissions and climate-resilient development. The question today is, How are countries responding to the Agreement? And, what additional action is expected?7
Based on a review of major national commitments, it is clear that some countries are stepping up their efforts to address climate change, from setting bolder emission reduction targets (in both the near and longer term) to enacting new legislation
and drafting adaptation plans. But the overall global scale of ambition is still unclear, as many major emitters have yet to put forward new or updated NDCs and long-term low GHG emissions development strategies (long-term strategies). The global COVID-19 pandemic, and the resulting delay in COP26, adds uncertainty.
Nationally determined contributionsNationally determined contributions (NDCs) submitted under the Paris Agreement set out national goals for addressing climate change, typically with a time frame ending in 2030. All of the first NDCs communicated in 2015 include targets, policies, and/or actions to mitigate climate change (i.e., reduce GHG emissions); 131 NDCs also include policies and/or actions to adapt to climate change and improve resilience (Murphy 2019).
The first NDCs communicated in 2015 are collectively insufficient to meet the Paris Agreement’s temperature goals. If all commitments that do not hinge on international support are implemented, global average temperature is projected to increase by 3.2°C by the end of the century (UNEP 2019).
To help close this “emissions gap,” countries are expected to prepare progressively more ambitious NDCs over time (UNFCCC 2015; Article 4). The first official request to enhance the ambition of NDCs is in 2020 (UNFCCC 2015; Decision 1/CP.21). Some countries are already responding to this call. In 2019, 103 countries committed to enhancing their NDCs in 2020, representing 38.4 percent of global GHG emissions (ClimateWatch 2020a). Fifteen countries had submitted NDCs to the UNFCCC by November 2020 (Figure 5), but these countries only account for 4.6 percent of global GHG emissions, and not all of these submissions reflected strengthened commitments. Major emitters in particular will need to come forward with significantly enhanced mitigation contributions in order to limit global temperature rise to well below 2°C.
Figure 5 | Status of countries’ intent to enhance NDCs, November 2020
Source: ClimateWatch (2020c).
33 countries have stated their intention to update an NDC by 2020 (including the European Union), representing 8.3% of global emissions
103 countries have stated their intention to enhance ambition or action in an NDC by 2020, representing 38.4% of global emissions
15 countries have submitted a 2020 NDC, representing 4.6% of global emissions

29State of Climate Action: Assessing Progress toward 2030 and 2050
and drafting adaptation plans. But the overall global scale of ambition is still unclear, as many major emitters have yet to put forward new or updated NDCs and long-term low GHG emissions development strategies (long-term strategies). The global COVID-19 pandemic, and the resulting delay in COP26, adds uncertainty.
Nationally determined contributionsNationally determined contributions (NDCs) submitted under the Paris Agreement set out national goals for addressing climate change, typically with a time frame ending in 2030. All of the first NDCs communicated in 2015 include targets, policies, and/or actions to mitigate climate change (i.e., reduce GHG emissions); 131 NDCs also include policies and/or actions to adapt to climate change and improve resilience (Murphy 2019).
The first NDCs communicated in 2015 are collectively insufficient to meet the Paris Agreement’s temperature goals. If all commitments that do not hinge on international support are implemented, global average temperature is projected to increase by 3.2°C by the end of the century (UNEP 2019).
To help close this “emissions gap,” countries are expected to prepare progressively more ambitious NDCs over time (UNFCCC 2015; Article 4). The first official request to enhance the ambition of NDCs is in 2020 (UNFCCC 2015; Decision 1/CP.21). Some countries are already responding to this call. In 2019, 103 countries committed to enhancing their NDCs in 2020, representing 38.4 percent of global GHG emissions (ClimateWatch 2020a). Fifteen countries had submitted NDCs to the UNFCCC by November 2020 (Figure 5), but these countries only account for 4.6 percent of global GHG emissions, and not all of these submissions reflected strengthened commitments. Major emitters in particular will need to come forward with significantly enhanced mitigation contributions in order to limit global temperature rise to well below 2°C.
Figure 5 | Status of countries’ intent to enhance NDCs, November 2020
Source: ClimateWatch (2020c).
33 countries have stated their intention to update an NDC by 2020 (including the European Union), representing 8.3% of global emissions
103 countries have stated their intention to enhance ambition or action in an NDC by 2020, representing 38.4% of global emissions
15 countries have submitted a 2020 NDC, representing 4.6% of global emissions
Long-term strategiesUnder the Paris Agreement, all countries are invited to communicate midcentury “long-term low GHG emissions development strategies” by 2020. These strategies reveal the scale of transformation needed to bring national climate action in line with global ambition—while at the same time focusing on sustainable development. Long-term strategies also play a key role in informing near-term decisions, helping to avoid investments that are incompatible with a low-carbon and climate-resilient future. Long-term strategies can also be a particularly
helpful guide as countries begin to establish national economy recovery plans in response to COVID-19—ideally aligned with long-term low-emissions and climate-resilient development. As of November 2020, 19 Parties had submitted their long-term strategies, representing 26.5 percent of global GHG emissions (ClimateWatch 2020c) (Figure 6). Many other countries, including major emitters, have initiated domestic preparations in order to meet the 2020 deadline (2050 Pathways Platform 2016).
Figure 6 | Status of long-term strategies communicated to the UN Framework Convention on Climate Change, November 2020
Source: ClimateWatch (2020c).
19 Parties have submitted a long-term strategy document, representing 39 countries
of global emissions26.5%
19 Parties
178 Parties
Long-term strategy submitted
No document submitted

WRI.org30
Net-zero targetsThere is growing momentum from countries to set net-zero emissions targets, to be achieved by 2050 or sooner. By September 2020, eight countries have enacted net-zero legislation (Sweden, Marshall Islands, Hungary, Portugal, the United Kingdom, France, Denmark, and New Zealand), seven have tabled legislation (Austria, Costa Rica, Finland, Norway, Slovenia, Switzerland, and the European Union), and six have included net-zero goals in policy documents (Andorra, Bhutan, Singapore, Fiji, Iceland, and Japan) (Levin et al. 2020). More than 100 other countries “are working towards achieving net zero CO2 emissions by 2050” (COP25 Presidency 2019). Only around 10 percent of global emissions are, however, covered by some form of an adopted net-zero target (Levin et al. 2020).
Laws and policiesAccording to the Grantham Research Institute on Climate Change and the Environment at the London School of Economics (LSE, GRICCE 2020), as of October 2020 there were 2,070 climate laws and policies worldwide.
Looking just at carbon-pricing initiatives, as of October 2020, 64 emissions trading schemes or carbon taxes had been implemented or were scheduled for implementation, representing 22.3 percent of global GHG emissions (World Bank 2020) (Figure 7). Of these initiatives, 33 were carbon taxes and 31 were emissions trading systems (World Bank 2020).
Figure 7 | Status of carbon-pricing initiatives, July 2020
Source: World Bank (2020).
No price on carbon
ETS
Carbon tax
Carbon tax and ETS
At the end of 2019, 166 countries had targets for renewable energy in power, 49 countries had targets for renewable energy in heating and cooling, and 46 countries had targets for renewable energy in transport (REN21 2020).
Subnational ActionSubnational climate action: As of November 2020, 10,984 cities and regions had committed to 12,577 climate actions registered on the UNFCCC Global Climate Action portal (UNFCCC 2020).
Net-zero carbon emissions by 2050: As of September 2020, 470 cities and regions had committed to achieving net-zero carbon emissions by 2050 through the Race to Zero global campaign (UNFCCC 2020).
City climate action: Current commitments of member cities of the Global Covenant of Mayors representing 21 percent of the global urban population could reduce GHG emissions by 2.3 GtCO2e by 2030 and 4.2 GtCO2e by 2050. However, city-level efforts currently fall short of the ambition needed to align with a 1.5-degree pathway (GCOM 2019). To date, 115 cities have committed to developing 1.5˚C-aligned climate action plans and 12 member cities of C40 (2020) have already completed their plans.
Progress of states and regions: Of the states and regions disclosing on their climate action, 80 percent are making positive emissions reductions toward 2030 targets. This effort

31State of Climate Action: Assessing Progress toward 2030 and 2050
is not in line with the 1.5°C trajectory in 2030, however, and these actors should raise their ambition (Quintana and Gorman 2019).
More than half of the world’s population resides in cities, and by 2050 the share of the urban population is expected to grow to two-thirds (UN 2019). The climate footprint of cities, combined with their anticipated growth, underscores the importance of cities in addressing climate change. Several factors make city climate action significant: high energy consumption and waste production, familiarity with translating global goals into local practice, the ability to trigger action by others, and experience with addressing localized environmental impacts (Bulkeley and Betsill 2003).
The number of cities and subnational regions committing to climate action has grown steadily (Figure 8). There are currently 10,932 cities and regions, primarily from developed countries, with recorded climate actions on the Global Climate Action portal (UNFCCC 2020), more than three times the number only four years ago. These cities are committing to various types of actions, including emissions reductions, renewable energy and energy efficiency targets; over 400 cities are now committing to net-zero emissions by 2050 through the Climate Ambition Alliance (Chile 2020). Many of these commitments are more ambitious than their national counterparts.8
Figure 8 | Growing number of cities and regions with recorded climate actions
Sources: Drawn from UNFCCC (2020).
2016 2018 2020
2,714
9,602
10,984Number of cities and regions with recorded climate actions
Several examples demonstrate that cities and regions are working to address climate change, even when many countries are not. Recent analysis of more than 1,000 cities that are part of the EU Covenant of Mayors shows that 60 percent are on track to achieve their 2020 emission reduction targets (Hsu et al. 2020). In addition, 80 percent of the states and regions disclosing information on their climate action are making positive reductions. For example, the Scottish government, as part of the Under2 Coalition, is making significant progress toward its ambitious net-zero 2045 target, having reduced current emissions by 47 percent since 1990
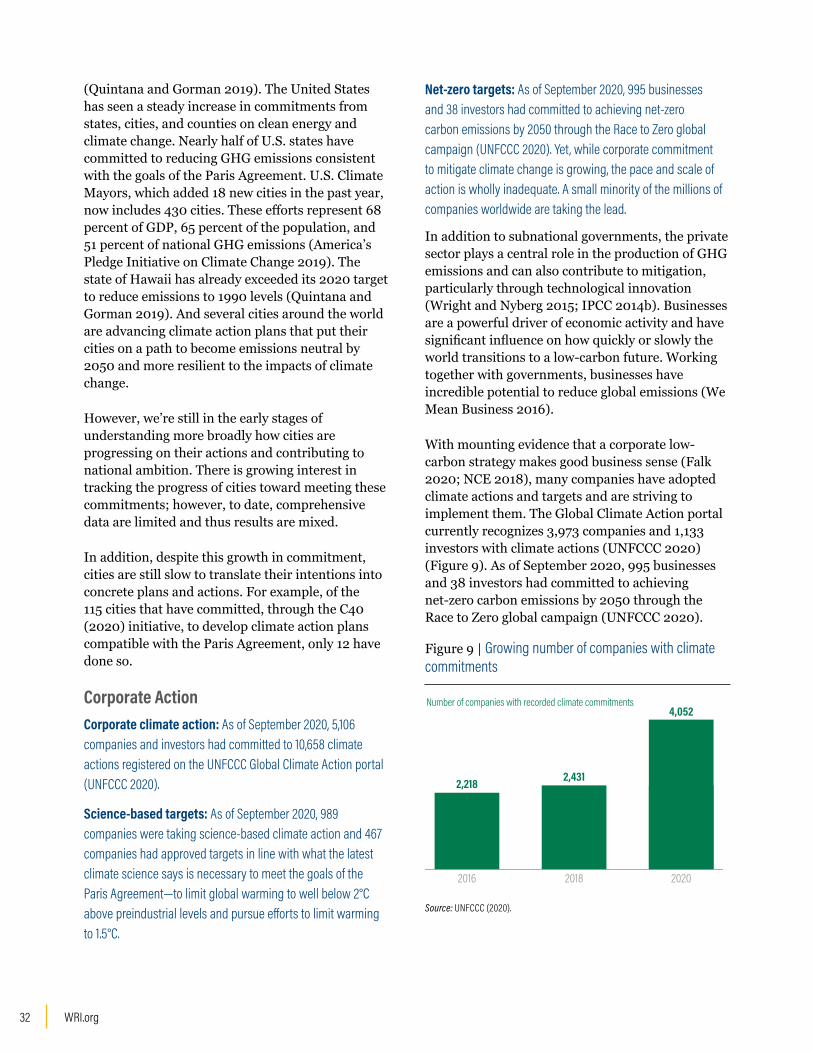
WRI.org32
(Quintana and Gorman 2019). The United States has seen a steady increase in commitments from states, cities, and counties on clean energy and climate change. Nearly half of U.S. states have committed to reducing GHG emissions consistent with the goals of the Paris Agreement. U.S. Climate Mayors, which added 18 new cities in the past year, now includes 430 cities. These efforts represent 68 percent of GDP, 65 percent of the population, and 51 percent of national GHG emissions (America’s Pledge Initiative on Climate Change 2019). The state of Hawaii has already exceeded its 2020 target to reduce emissions to 1990 levels (Quintana and Gorman 2019). And several cities around the world are advancing climate action plans that put their cities on a path to become emissions neutral by 2050 and more resilient to the impacts of climate change.
However, we’re still in the early stages of understanding more broadly how cities are progressing on their actions and contributing to national ambition. There is growing interest in tracking the progress of cities toward meeting these commitments; however, to date, comprehensive data are limited and thus results are mixed.
In addition, despite this growth in commitment, cities are still slow to translate their intentions into concrete plans and actions. For example, of the 115 cities that have committed, through the C40 (2020) initiative, to develop climate action plans compatible with the Paris Agreement, only 12 have done so.
Corporate Action Corporate climate action: As of September 2020, 5,106 companies and investors had committed to 10,658 climate actions registered on the UNFCCC Global Climate Action portal (UNFCCC 2020).
Science-based targets: As of September 2020, 989 companies were taking science-based climate action and 467 companies had approved targets in line with what the latest climate science says is necessary to meet the goals of the Paris Agreement—to limit global warming to well below 2°C above preindustrial levels and pursue efforts to limit warming to 1.5°C.
Net-zero targets: As of September 2020, 995 businesses and 38 investors had committed to achieving net-zero carbon emissions by 2050 through the Race to Zero global campaign (UNFCCC 2020). Yet, while corporate commitment to mitigate climate change is growing, the pace and scale of action is wholly inadequate. A small minority of the millions of companies worldwide are taking the lead.
In addition to subnational governments, the private sector plays a central role in the production of GHG emissions and can also contribute to mitigation, particularly through technological innovation (Wright and Nyberg 2015; IPCC 2014b). Businesses are a powerful driver of economic activity and have significant influence on how quickly or slowly the world transitions to a low-carbon future. Working together with governments, businesses have incredible potential to reduce global emissions (We Mean Business 2016).
With mounting evidence that a corporate low-carbon strategy makes good business sense (Falk 2020; NCE 2018), many companies have adopted climate actions and targets and are striving to implement them. The Global Climate Action portal currently recognizes 3,973 companies and 1,133 investors with climate actions (UNFCCC 2020) (Figure 9). As of September 2020, 995 businesses and 38 investors had committed to achieving net-zero carbon emissions by 2050 through the Race to Zero global campaign (UNFCCC 2020).
Figure 9 | Growing number of companies with climate commitments
Source: UNFCCC (2020).
2016 2018 2020
Number of companies with recorded climate commitments
2,218 2,431
4,052

33State of Climate Action: Assessing Progress toward 2030 and 2050
The Science Based Targets initiative has seen a rapid increase in companies joining and setting targets. As of August 2020, 972 companies had publicly joined, and 407 of these had had their targets officially approved, including several which have met their goals and are looking to renew them (SBTi 2020a) (Figure 10).
More broadly, there has been growth in target-setting by the world’s largest companies, although many major corporations still lack a serious commitment to climate change. By 2019, only 23 percent of Fortune 500 companies had committed to carbon neutrality, using 100 percent renewable power, or meeting a science-based target by 2030 (Natural Capital Partners 2019). A 2019 expanded look at the world’s largest companies, including the Global Forbes 2000, shows that more than 450 companies, or just over 20 percent, have climate commitments (NewClimate Institute 2019).
Despite the flurry of commitments and regular reporting on climate performance by many, there are still limited data to assess progress toward targets, with many companies not fully disclosing their GHG emissions. Third-party analysis suggests that four-fifths of companies are not on track to meet the global 1.5°C goal by 2050 based on their current emissions intensity and sector-specific emissions projections (Arabesque 2020).
While corporate commitment to mitigating climate change is growing, the pace and scale of action is wholly inadequate. A small minority of the millions of companies worldwide are taking the lead. Of the roughly 7,000 companies that regularly report
climate information, only around 875 are showing year-on-year emissions decreases. Despite their commitment, the level of ambition is often still below the effort needed to achieve the goals of the Paris Agreement. The majority of companies’ targets aim for roughly half of the ambition required by the Paris Agreement (e.g., aiming for 15 percent reductions instead of 30 percent for short-term targets, and only 50 percent reductions by 2050) (World Economic Forum 2019). Combined with a lack of transparency, including irregular and inconsistent reporting, in reality, companies may actually be doing very little to mitigate climate change.
Climate FinanceTotal global flows of tracked public and private climate finance exceeded half a trillion dollars for the first time, averaged across 2017 and 2018, a 40 percent increase from the 2013–14 average (CPI 2019). However, even though climate finance has increased over recent years, estimates show that it falls far short of what will be needed.
Although carbon pricing currently covers around 15 percent of global greenhouse gas emissions, less than 5 percent of global emissions are priced at a level consistent with achieving the goals of the Paris Agreement (World Bank 2019; IPCC 2018). At the same time, fossil fuel subsidies are not being phased out fast enough (OECD and IEA 2019).
Despite a growing number of commitments, only around half of major private sector banks have sustainable finance commitments, and many are still investing more in fossil fuels than they are in sustainable finance, including those with commitments (WRI 2019; Pinchot and Christianson 2019).
Increasing climate finance is critical to tackling the climate crisis because large-scale investments are needed across sectors to decarbonize the economy and adapt to the impacts of climate change, through efforts like switching from fossil fuels to renewable energy, electrifying transport, protecting forests and coastal wetlands, and improving building efficiency. Climate finance flows have, on average, been increasing year over year, but they still fall short of what is needed to meet temperature goals under the Paris Agreement. At the same time, support for fossil fuels is not decreasing fast enough.
Figure 10 | Number of companies that have joined Science Based Targets
Source: SBTi (2020a)
20162015 2017 2018 2019 2020
Number of companies that have joined the Science Based Targets initiativeNumber of companies that have joined the Science Based Targets initiative
840
686
334250
11030

WRI.org34
Total global flows of tracked public and private climate finance exceeded half a trillion dollars for the first time, averaged across 2017 and 2018, a 40 percent increase from the 2013–14 average (Figure 11). The majority of climate finance flows come from private actors and are directed toward renewable energy, low-carbon transport, and other mitigation activities. While climate finance has increased steadily over recent years, estimates indicate that between $1.6 trillion and $3.8 trillion per year will be needed through 2050 to transform the energy system, and an additional $280 billion to $500 billion will be needed annually for adaptation in developing countries by 2050 (CPI 2019).
Aside from total climate finance flows, a few other indicators help show where and how the finance sector is incorporating the risks of climate change and investing in its opportunities.
As an indicator of investment interest in climate-aligned projects, green bond issuance has been growing steadily, from less than $10 billion in 2012 to $258 billion in 2019, representing a more than 50 percent increase from the 2018 figure of $171 billion. While this represents significant growth, it is still a small portion of the global $100 trillion bond market.
Carbon pricing—either through a carbon tax or an emissions trading scheme (ETS)—currently covers around 15 percent of global greenhouse gas emissions. This coverage is expected to jump to 20 percent when China’s national ETS comes into effect, which could be as early as the end of 2020 (World Bank 2020; Xu and Stanway 2020). While the number of jurisdictions covered has been
increasing, less than 5 percent of global emissions are priced at a level consistent with achieving the goals of the Paris Agreement, which the IPCC identifies as at least $135/tCO2e in 2030 and at least $245/tCO2e in 2050 (World Bank 2019; IPCC 2018).
At the same time, fossil fuel subsidies are not being phased out fast enough (Figure 12). Because around two-thirds of subsidies go to oil, volatility in global oil markets that may raise energy prices leaves recent reforms fragile (OECD and IEA 2019). More recent data from the International Energy Agency (IEA 2020f) on just consumption subsidies indicate lower subsidy values in 2019 and estimated for 2020, due in part to declining oil prices during the COVID-19 pandemic, which also provides a favorable environment to further reduce subsidies and solidify recent reductions.
While most policy changes may not be advancing at the speed needed, private sector action has picked up pace. The Task Force on Climate-Related Financial Disclosures, founded in late 2015, issued its recommendations for what types of climate-related information companies should include in their financial filings in 2017 to increase transparency around climate-related risks. Since then more than 930 organizations with a combined market capitalization of $11 trillion have signed on, but recent progress assessments show that disclosures are often still insufficient for investors (TCFD 2019).
Other notable commitments and announcements in the past year indicate that the financial sector is beginning to incorporate the impacts of climate change:
▪ BlackRock became the largest signatory (with just under $7 trillion in assets under management) to join the Climate Action 100+, an investor initiative to ensure that corporate greenhouse gas emitters take necessary action on climate change.
▪ The European Union pledged to become a net-zero emitter by 2050—a key objective of the Green Deal—and mobilize €1 trillion for sustainable investments over the coming decade (European Commission 2020a).
Figure 11 | Tracked global climate finance flows
Source: CPI (2019).
145
220
215
249
253
326
0
100
200
300
400
500
600
700
2013-14 2015-16 2017-18
Billio
n US
$
Publicfinance
Privatefinance
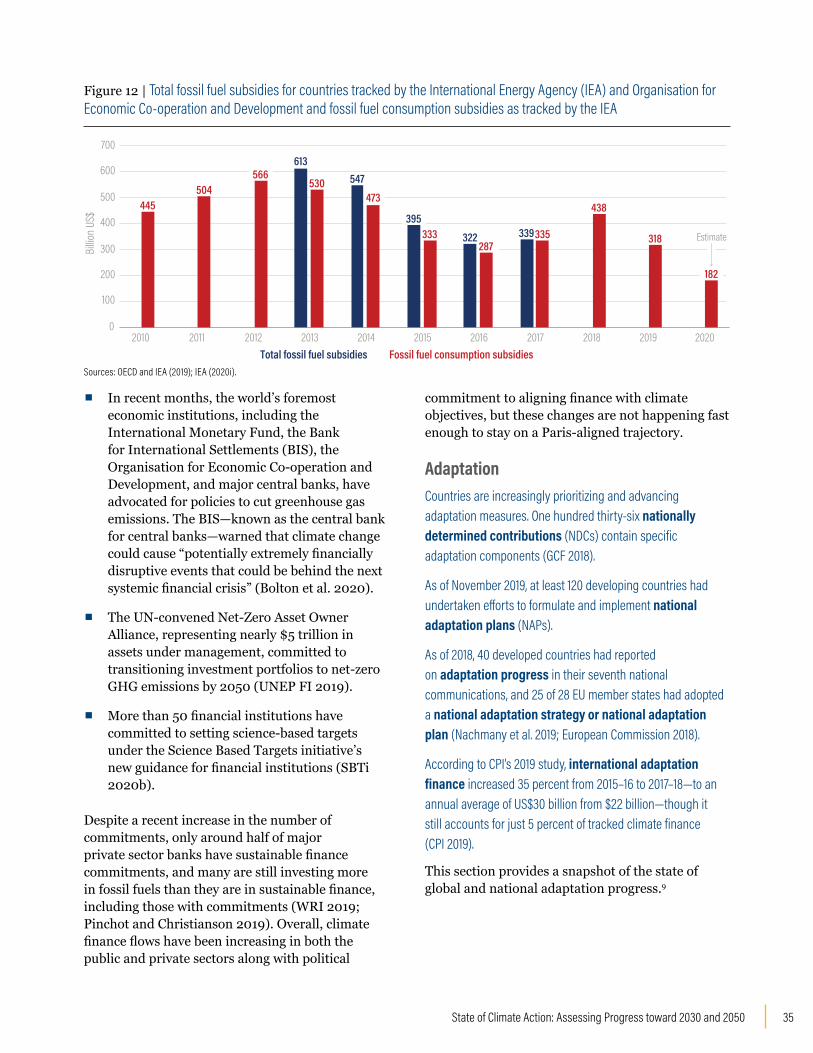
35State of Climate Action: Assessing Progress toward 2030 and 2050
▪ In recent months, the world’s foremost economic institutions, including the International Monetary Fund, the Bank for International Settlements (BIS), the Organisation for Economic Co-operation and Development, and major central banks, have advocated for policies to cut greenhouse gas emissions. The BIS—known as the central bank for central banks—warned that climate change could cause “potentially extremely financially disruptive events that could be behind the next systemic financial crisis” (Bolton et al. 2020).
▪ The UN-convened Net-Zero Asset Owner Alliance, representing nearly $5 trillion in assets under management, committed to transitioning investment portfolios to net-zero GHG emissions by 2050 (UNEP FI 2019).
▪ More than 50 financial institutions have committed to setting science-based targets under the Science Based Targets initiative’s new guidance for financial institutions (SBTi 2020b).
Despite a recent increase in the number of commitments, only around half of major private sector banks have sustainable finance commitments, and many are still investing more in fossil fuels than they are in sustainable finance, including those with commitments (WRI 2019; Pinchot and Christianson 2019). Overall, climate finance flows have been increasing in both the public and private sectors along with political
commitment to aligning finance with climate objectives, but these changes are not happening fast enough to stay on a Paris-aligned trajectory.
AdaptationCountries are increasingly prioritizing and advancing adaptation measures. One hundred thirty-six nationally determined contributions (NDCs) contain specific adaptation components (GCF 2018).
As of November 2019, at least 120 developing countries had undertaken efforts to formulate and implement national adaptation plans (NAPs).
As of 2018, 40 developed countries had reported on adaptation progress in their seventh national communications, and 25 of 28 EU member states had adopted a national adaptation strategy or national adaptation plan (Nachmany et al. 2019; European Commission 2018).
According to CPI’s 2019 study, international adaptation finance increased 35 percent from 2015–16 to 2017–18—to an annual average of US$30 billion from $22 billion—though it still accounts for just 5 percent of tracked climate finance (CPI 2019).
This section provides a snapshot of the state of global and national adaptation progress.9
Figure 12 | Total fossil fuel subsidies for countries tracked by the International Energy Agency (IEA) and Organisation for Economic Co-operation and Development and fossil fuel consumption subsidies as tracked by the IEA
Sources: OECD and IEA (2019); IEA (2020i).
613547
395339
445504
566530
473
333287
335
438
318
182
0
100
200
300
400
500
600
700
2010 2011 2012 2013 2014 2015 2016 2017 2018 2019 2020
Billio
n US
$
Total fossil fuel subsidies Fossil fuel consumption subsidies
322 Estimate
WRI.org36
The importance of adaptationRecent statements and commitments by countries signal that adaptation action is critical. This is in part due to the impetus provided by the Paris Agreement. Scientific evidence also continues to mount on the importance of urgent and immediate adaptation action (IPCC 2018, 2019a). Moreover, as communities around the world experience the adverse impacts of climate change, there is also greater recognition that adaptation can help avert or reduce losses and damage associated with these impacts (with benefit-cost ratios ranging from 2:1 to 10:1, and in some cases are even higher) (GCA 2019).
▪ One hundred thirty-six nationally determined contributions (NDCs) contain specific adaptation components (GCF 2018).
▪ As of November 2019, at least 120 developing countries had undertaken efforts to formulate and implement national adaptation plans (NAPs), and all 49 least developed countries (LDCs) are working on submitting their first NAPs by the end of 2020 or soon after. Most countries are explicitly addressing adaptation through laws or policies.
▪ As of 2018, 40 developed countries had reported on adaptation progress in their seventh national communications, and 25 of 28 EU member states had adopted a national adaptation strategy or national adaptation plan (Nachmany et al. 2019; European Commission 2018).
▪ Furthermore, in 2019, more than 170 countries endorsed the 2019 UN Climate Action Summit’s Call for Action on Adaptation and Resilience, and the Global Commission on Adaptation (GCA), convened by the heads of state of 23 countries, spurred financial commitments and major initiatives to accelerate adaptation action and support.
The COVID-19 pandemic has also been a painful wake-up call, exposing the compound risks that people, especially the most vulnerable, face. There is recognition that taking action today to reduce, prepare for, and better manage risks—including those related to health, the economy, and climate change—is imperative (GCA 2020).
Emerging trendsNationally determined contributions, one manner in which countries communicate their adaptation actions and commitments to the UNFCCC, offer insight into which sectors and issues developing-country governments are prioritizing. An analysis conducted by WRI for the Green Climate Fund in 2018 (GCF 2018) found that in the 136 NDCs that include an adaptation component, some identify priority sectors or describe general sector-level goals, while others describe specific activities within different sectors. About 85 percent of NDCs with adaptation components include agriculture as a priority area. More than 50 percent of NDCs with adaptation components mention freshwater supply, disaster reduction, forests, and ecosystems. More than 50 percent reference health. Less than a quarter of NDCs with adaptation components refer to gender-, women-, or gender-responsive approaches, and less than a fifth reference the rights and knowledge of Indigenous Peoples.
A 2018 analysis of EU member states’ national adaptation strategies and plans also underscores certain trends. All member states with a national adaptation strategy or plan have a basic governance structure in place for adaptation policymaking. Climate change scenarios are widely available at the national level. Most member states use detailed vulnerability and/or risk assessments to prioritize adaptation options. And while most member states have begun implementing their national adaptation strategies or plans and have planned periodic reviews, monitoring and reporting are limited.
A 2019 global review of national laws and policies in developed and developing countries (Nachmany et al. 2019) found that many countries now have legislative and policy frameworks that set priorities for adaptation action. The most common areas of focus are information generation and sharing, adaptation planning, establishing institutional arrangements, building capacity for adaptation, and processes for monitoring and evaluating action. Key enablers missing from many of these laws and policies include greater investment in public goods (beyond early warning systems), integration of climate risk considerations in building codes and land use planning, and incentives to facilitate adaptation action.
37State of Climate Action: Assessing Progress toward 2030 and 2050
Progress on mainstreaming adaptation into economic and development sectors is uneven. A 2015 study by the International Institute for Sustainable Development (IISD) of 15 developing countries in Asia and Africa found that some were actively mainstreaming adaptation into policy and programming while others were not (IISD 2015). A 2018 review of more than 100 mainstreaming efforts in developed and developing countries found that while many had integrated adaptation into sectoral policy documents and plans, only half reported concrete projects and activities (Runhaar et al. 2018). And while major bilateral donors and multilateral development banks have put in place processes to screen whether programs and projects may be at risk of climate change impacts, it is still unclear how screening results are used to change what decisions are made and how they are made (Larsen et al. 2018).
Requests for support also offer insight into the state of adaptation. Requests from developing countries for support to advance their NAP processes have increased dramatically. As of April 2020, the Green Climate Fund had approved 50 proposals, with 6 more in the final stages of approval; these 56 proposals had a combined value of US$132 million (GCF 2020). As of March 2020, 52 percent of adaptation requests from member countries to the NDC Partnership focused on finance and investment, as identified through a Support Unit analysis of adaptation requests (NDCP forthcoming). Requests range from support in identifying incentives to attract the private sector and understanding the risks of climate change from a financial and macroeconomic perspective to support in analyzing costs and benefits of adaptation options and developing bankable projects. The NAP Global Network, based on the analysis of requests of NDC Partnership member countries, reports a consistent demand for support in developing sector strategies as well as financing and resource mobilization strategies, communications, and capacity extension. The network also reports an increase in demand for support of monitoring and evaluation, as countries become increasingly aware of the need to define and track adaptation progress and effectiveness, as well as of private sector engagement and gender-responsive adaptation action.
Barriers to adaptation actionBarriers to accelerated adaptation action remain, and these barriers are well documented. They include lack of data and understanding about climate risks and about what works and why, short-term planning biases, fragmented responsibilities, poor institutional cooperation, lack of resources, and the often-limited ability of people most at risk to shape decisions.
Adaptation financeIn the absence of a comprehensive global-level assessment of how much governments currently spend on adaptation, Oxford Policy Management examined in 2019 for the Global Commission on Adaptation (Allan et al. 2020) regional- and country-level spending assessments, including climate public expenditure and institutional reviews and climate financing frameworks. The report concluded that a significant volume of investment in adaptation is already coming from public domestic sources (in some cases exceeding that from international sources) and that this falls short of current and projected needs and domestic policy ambitions. The most common reason for this shortfall in the short term is that climate change adaptation competes with other development objectives, and decisions on how public funds are allocated, spent, and reported against do not adequately prioritize adaptation.
According to a 2019 study by the Climate Policy Institute (CPI), international adaptation finance increased 35 percent from 2015–16 to 2017–18—from an annual average of $22 billion to $30 billion—though it still accounts for just 5 percent of tracked climate finance (CPI 2019). Three sectors account for 78 percent of total adaptation finance annually: water and wastewater management (32 percent), agriculture and land use (24 percent), and disaster risk management (22 percent). Public finance for disaster risk management projects grew the fastest, increasing 128 percent, from an annual average of $2.9 billion in 2015–16 to $6.6 billion in 2017–18. Public finance for adaptation in agriculture, forestry, and land use also increased significantly, from $4.5 billion in 2015–16 to $7 billion in 2017–18. While increasing, these flows fall far below adaptation finance needs, which in developing countries alone are projected to be between $140 billion to $300 billion annually by 2030 (UNEP 2016).


39State of Climate Action: Assessing Progress toward 2030 and 2050
METHODOLOGY, ASSUMPTIONS, AND LIMITATIONS FOR ASSESSING PROGRESS BY SECTOR The science indicates what is required globally to limit warming to
safe levels, but stocktaking is necessary to inform investments and
policymaking. This study presents a set of sector indicators with global and
national targets to measure progress toward limiting emissions to a level
aligned with the Paris Agreement’s goals. It reviews trends in recent years
and assesses progress toward—or away from—the targets established for
2030 and 2050. We have chosen to assess 2030 and 2050 to inform near-
term action, especially in the context of NDC updates, which are invited this
year, and indicate the longer-term transformation that is required.

WRI.org40
Choice of IndicatorsThe report assesses progress toward global and national targets in power, buildings, industry, transport, forests, and agriculture for 2030 and 2050. For each sector, several indicators were identified that the literature suggests are the best way to monitor sectoral decarbonization pathways. However, the indicator selection is not comprehensive due to practical constraints, and there are some omissions, such as indicators to measure performance of aviation and maritime transport. Also, the targets are not completely independent, since progress on one indicator could further another; for example, penetration of renewables on the electric grid would assist progress in decarbonizing industrial processes. Additionally, internal assumptions are consistent across sectors; for example, the indicator related to low-carbon transport fuels assumes the rate of decarbonization in the power sector that that target implies. There are different options for achieving some of the indicators, such as for reducing steel emissions intensity, whether this is achieved through a scrap route or a hydrogen route.
Design of TargetsThe targets for power, buildings, industry, and transport were developed by the Climate Action Tracker (CAT) consortium to be compatible with limiting warming to 1.5°C.10 They were designed to represent the highest plausible ambition while taking technology and infrastructure into account, and to increase our chances of meeting the Paris Agreement’s long-term temperature goals.
The CAT team used both top-down and bottom-up methods to establish the targets (CAT 2020a):
▪ Integrated assessment models (IAMs): The CAT team first considered the IAMs that were able to limit warming to 1.5°C (“no overshoot” and “low overshoot” scenarios in which a brief and limited overshoot of average warming occurred). The team then refined their selection to include only those scenarios that assumed sustainable use of carbon removal (bioenergy combined with carbon capture and storage, reforestation and afforestation).
These pathways are defined on a least-cost pathway and do not take into account equitable distribution of costs and required action.
▪ Downscaled IAMs: In addition to the global scenarios from the IAMs, the CAT team used a simplified IAM11 to downscale regional IAM pathways to the country level. These modeled pathways on the country level account for the initial energy mix of the countries and the regional transition. The downscaling is done for 1.5°C-compatible pathways that are harmonized to country-specific historical data.
▪ Bottom-up sectoral modeling and studies at the national level: The CAT team also used a combination of its own bottom-up modeling (e.g., steel, EVs, cement, buildings) and other independent literature. For these studies, technical feasibility, rather than a full economic analysis, and the countries’ current status for a given indicator were taken into account for the country-specific targets. Each sectoral target that was derived from such bottom-up analyses was still compared with 1.5°C-compatible IAMs to ensure that, if there was any discrepancy, the bottom-up approaches were more ambitious in achieving decarbonization more rapidly.
When targets are presented as a range of values, the lower end of the range represents what can be achieved with current technologies and strategies. The more ambitious end of the range relies on technologies and strategies that are known but have not been developed and deployed at scale, or in some cases represent trade-offs in decarbonization with other sectors (CAT 2020a). For more information on the design of targets, see CAT (2020b).
The forests and agriculture targets were developed by WRI. Forest indicators and targets for 2030 and 2050 are based on what the literature suggests is needed in terms of reduced deforestation and increased reforestation to be in line with 1.5°C temperature rise. National targets are determined through burden-sharing of global targets based on area of reforestation potential. Agriculture targets were set using a model from Searchinger et al. (2019). Determining criteria for these targets were food security for 10 billion people, nearly 600 million hectares of reforestation, and no more than

41State of Climate Action: Assessing Progress toward 2030 and 2050
4 GtCO2e/yr of agricultural production emissions. The regional- and country-level 2050 targets for Indicators 1–3 and 5 in this section are also outputs of the model. Additional details are provided in Box 1. Indicator 4’s targets are based on Sustainable Development Goal 12.3 on food loss and waste reduction.
It should be noted that the indicators chosen in this report represent a set of critical actions but are not comprehensive.
Country Selection and Consideration of EquityTargets were chosen at the global level, as well as for China, the United States, India, the European Union (EU28),12 Indonesia, Brazil (six of the top seven emitters, excluding Russia), and South Africa (as the highest emitter in Africa). For the forests sector, we also include Bolivia, Colombia, the Democratic Republic of the Congo, and Malaysia, because these countries have among the highest levels of deforestation and related emissions.
The targets for power, buildings, industry, and transport take into account the current status of an indicator in a given country, thereby recognizing current practice and differing national capacities to more readily bring about change. However, given the very small remaining carbon budget consistent with limiting warming to 1.5°C, very rapid and deep reductions are required across all major emitting countries and sectors. Accordingly, at least for major emitters, there is little room for staggered decarbonization, which allows some countries to reduce emissions more slowly given historical responsibility for emissions or current capabilities. And to the extent developing countries have a slower decarbonization pathway in the near term, this implies faster progress from developed countries. This means that, while the developed countries included in this study have targets as or more stringent than other countries, there is often convergence among national targets, especially toward midcentury. It will be essential that countries without the domestic capacity or financial resources to decarbonize sufficiently to reach their targets be supported by higher-income countries

WRI.org42
(CAT 2020a). Targets for the forests sector are based largely on the relative availability of land area for reforestation, and agriculture targets are based on socioeconomic and technology developments (see sections for more detail). For all sectors, higher-income countries will need to support other countries’ decarbonization pathways and help them leapfrog antiquated carbon-intensive technologies, for example, through finance, technology transfer, and other support. Future research should assess the required finance, technology-transfer, and capacity-building needs associated with supporting such transformations.
LimitationsWhile the scale of change described in this report is technically feasible, this report does not assess feasibility from a policy, regulatory, or societal standpoint. In many countries, significant barriers
stand in the way of advancing change on this order of magnitude, and these hurdles must be overcome if we are to realize the targets described below. Furthermore, if these targets are to be successfully achieved, these transformations must be pursued in a just manner, and with care, building support over time to ensure durability and legitimacy.
Assessment of Progress toward Our TargetsIn order to show a snapshot of progress, we start by collecting historical data. In some cases, no data, or limited data, exist to show how the current level of effort measures up against a particular target, and this has been noted accordingly. The historical datasets we chose were those that are open, independent of bias, reliable, consistent, and cover the greatest number of countries included in our analysis.

43State of Climate Action: Assessing Progress toward 2030 and 2050
There is often a time lag before data become available (for most indicators assessed here between one and three years, but a handful lag between five and nine years), and the year of most recent data varies among indicators. There is another lag between implementation of climate action and its impacts. Accordingly current data may not capture change in the so-called real economy that is occurring in some countries and globally, which may lead to measurable change in indicators only several years later.
To assess progress toward the 2030 and 2050 targets, we calculate the historical rate of change for each indicator—over the last five years13 to capture the most recent rate of change—and compare that to the rate of change needed to reach the targets for 2030 and 2050. In the large majority of cases, the rate of change needs to increase to reach the
targets, so to understand how much acceleration is needed, we have calculated acceleration factors for each indicator that provide an indication of the gap in effort. These acceleration factors show whether the rate of change needs to increase twofold or twentyfold, for example.
Change very likely will not occur linearly, especially for changes that rely on technology development and deployment, so we cannot simply extrapolate from historical rates of change. The complicated process of systemic change often follows an S-curve, with change occurring at different rates during different stages in the transformation (Figure 13). Importantly, changes that seem impossible at first can, over time, develop momentum, become more durable, and expand to the point where they become the new normal (Victor et al. 2019).
Figure 13 | Systems change
Source: Victor et al. (2019).
TIME OR CUMULATIVE PRODUCTION
LOW
OR
ZERO
EM
ISSI
ONTE
CHNO
LOGY
MAR
KET
SHAR
E
Plas
tics
Cem
ent
Stee
lSh
ippi
ngAv
iatio
nAg
ricul
ture
and
land
use
Truc
ks
Build
ings
Cars Po
wer
EMERGENCE DIFFUSION RECONFIGURATION*Development and testing of
new technologies Policies to expand deployment
*Standards and incentives to ensure change throughout entire sector


45State of Climate Action: Assessing Progress toward 2030 and 2050
ASSESSMENT OF PROGRESS BY SECTORAchieving deep decarbonization will require action across all
sectors; each one plays a critical role and in some cases can
support decarbonization in other sectors as well. The sections
in this chapter assess progress on decarbonization in economic
sectors by measuring indicators selected for each sector.
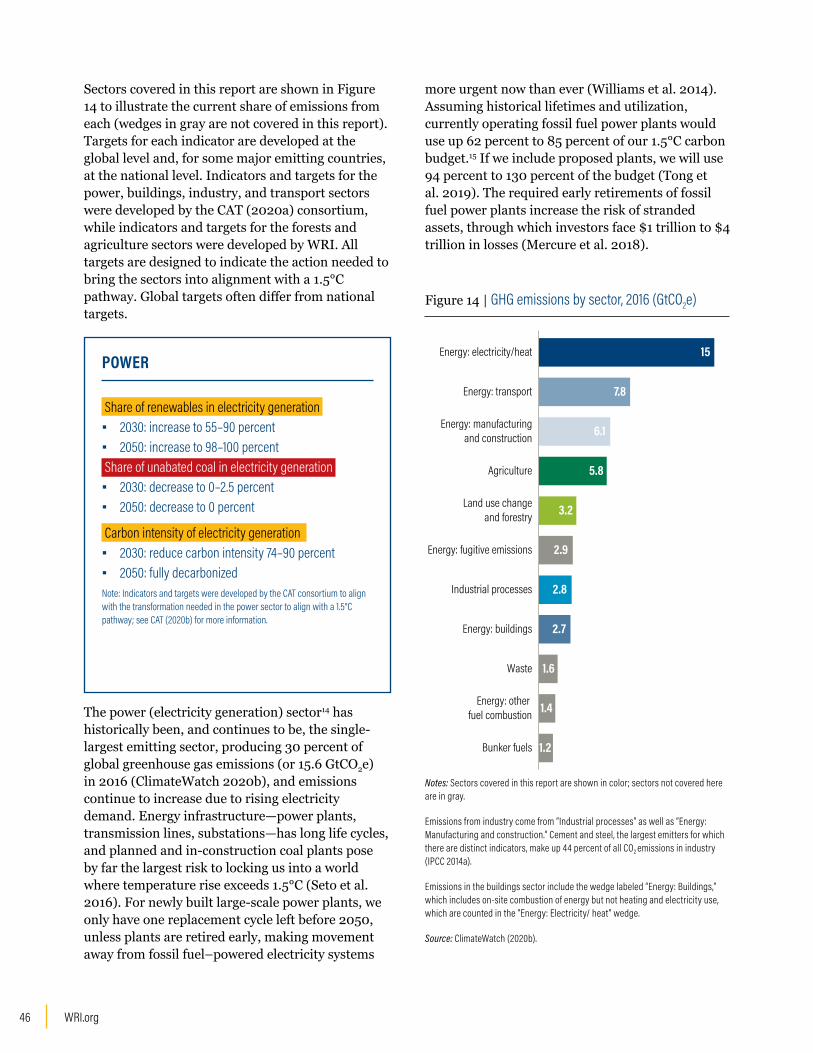
WRI.org46
Sectors covered in this report are shown in Figure 14 to illustrate the current share of emissions from each (wedges in gray are not covered in this report). Targets for each indicator are developed at the global level and, for some major emitting countries, at the national level. Indicators and targets for the power, buildings, industry, and transport sectors were developed by the CAT (2020a) consortium, while indicators and targets for the forests and agriculture sectors were developed by WRI. All targets are designed to indicate the action needed to bring the sectors into alignment with a 1.5°C pathway. Global targets often differ from national targets.
The power (electricity generation) sector14 has historically been, and continues to be, the single-largest emitting sector, producing 30 percent of global greenhouse gas emissions (or 15.6 GtCO2e) in 2016 (ClimateWatch 2020b), and emissions continue to increase due to rising electricity demand. Energy infrastructure—power plants, transmission lines, substations—has long life cycles, and planned and in-construction coal plants pose by far the largest risk to locking us into a world where temperature rise exceeds 1.5°C (Seto et al. 2016). For newly built large-scale power plants, we only have one replacement cycle left before 2050, unless plants are retired early, making movement away from fossil fuel–powered electricity systems
Figure 14 | GHG emissions by sector, 2016 (GtCO2e)
Notes: Sectors covered in this report are shown in color; sectors not covered here are in gray.
Emissions from industry come from “Industrial processes” as well as “Energy: Manufacturing and construction.” Cement and steel, the largest emitters for which there are distinct indicators, make up 44 percent of all CO2 emissions in industry (IPCC 2014a).
Emissions in the buildings sector include the wedge labeled “Energy: Buildings,” which includes on-site combustion of energy but not heating and electricity use, which are counted in the “Energy: Electricity/ heat” wedge.
Source: ClimateWatch (2020b).
Energy: electricity/heat
Energy: transport
Agriculture
Land use changeand forestry
Energy: fugitive emissions
Industrial processes
Energy: buildings
Waste
Energy: other fuel combustion
Bunker fuels
Energy: manufacturingand construction
15
7.8
6.1
5.8
3.2
2.9
2.8
2.7
1.6
1.4
1.2
POWER
Share of renewables in electricity generation ▪ 2030: increase to 55–90 percent ▪ 2050: increase to 98–100 percent
Share of unabated coal in electricity generation ▪ 2030: decrease to 0–2.5 percent ▪ 2050: decrease to 0 percent
Carbon intensity of electricity generation ▪ 2030: reduce carbon intensity 74–90 percent ▪ 2050: fully decarbonized
Note: Indicators and targets were developed by the CAT consortium to align with the transformation needed in the power sector to align with a 1.5°C pathway; see CAT (2020b) for more information.
more urgent now than ever (Williams et al. 2014). Assuming historical lifetimes and utilization, currently operating fossil fuel power plants would use up 62 percent to 85 percent of our 1.5°C carbon budget.15 If we include proposed plants, we will use 94 percent to 130 percent of the budget (Tong et al. 2019). The required early retirements of fossil fuel power plants increase the risk of stranded assets, through which investors face $1 trillion to $4 trillion in losses (Mercure et al. 2018).

47State of Climate Action: Assessing Progress toward 2030 and 2050
The case for shifting to renewable sources of energy is clear when we look at their many benefits to economic development, human health, and climate-impact risk reduction. A transition away from fossil fuel–based electricity production can reduce air pollution and water consumption, offer cost-efficient energy access, provide more jobs, and increase the resilience of the power sector to climate impacts (NCE 2018).
Given the past and future expected decrease in the cost of renewables, the International Renewable Energy Agency (IRENA) estimates that replacing the costliest 500 gigawatts of coal power plants with solar and wind would save up to $23 billion per year ($244 billion to $463 billion over 20 years) and yield a stimulus worth around 1 percent of global GDP (IRENA 2020c). For every $1 spent on this transformation, we could receive up to $7 in return benefits (IRENA 2018a).16
Getting to a net-zero energy sector (including transport and buildings) will require us to electrify, optimize, and decarbonize. This means we need to switch the transport and buildings sectors to electricity, while also investing in energy efficiency to reduce overall demand. At the same time we need to decarbonize the electricity sector through the deployment of renewables. We examine this transition through two indicators—share of
renewables and share of unabated coal in electricity generation, which will in turn drive the overall carbon intensity of electricity generation.
Indicator 1: Share of renewables in electricity generation (%)2030: share of renewables increases to 55–90 percent
2050: share of renewables increases to 98–100 percent
Emissions from the power sector are driven by coal-, oil-, and gas-fired power plants, with coal being the biggest offender in terms of emissions per unit of electricity produced. To reduce emissions to net zero by 2050, we will need to rapidly replace fossil fuel generation with renewables (hydro, geothermal, solar, wind, tide, wave, and biofuels) and at the same time slow the growth of electricity demand through energy efficiency to enable even more rapid replacement.
The unprecedented decline in the price of renewable generation technologies and battery storage has driven adoption of renewables as the global power generation technology of choice. The share of renewables in global electricity generation has increased from 19.7 percent in 1990 to 25.3 percent in 2018 (IEA 2020g).17 For 2019, we see an increase to 26.9 percent or 27.3 percent, the highest annual increase in renewable share to date (IEA 2020j; REN21 2020) (Figure 15).
Figure 15 | Share of renewables generation, showing acceleration of annual increase, 2000–19
Note: Y axis ranges from 17 percent to 27 percent to clearly show acceleration of growth. 2019 value sourced from IEA (2020j), SDS scenario.
Source: Calculated based on IEA (2020g).
17%
18%
19%
20%
21%
22%
23%
24%
25%
26%
27%
2000 2001 2002 2003 2004 2005 2006 2007 2008 2009 2010 2011 2012 2013 2014 2015 2016 2017 2018 2019*
Rene
wable
ener
gy in
elec
tricit
y gen
erat
ion

WRI.org48
per year in the last five years and will need to accelerate this growth 5.5 times to reach the 2030 target and 3.3 times for the 2050 target.
By 2040, the IEA’s scenarios expect 44 percent of power to come from renewable generation under current policies and 67 percent from renewable generation under the IEA’s sustainable development scenario (IEA 2019b). Both of these percentages are lower than what is needed to stay under 1.5°C temperature rise. However, the IEA’s scenarios are often seen as conservative, and the cost reductions and rapid growth of renewables have outpaced its previous scenarios (Evans 2019) (Figure 18), so it is possible that actual growth rates will exceed what is laid out in IEA scenarios, as they have done in the past.
At the national level, we need a similar level of ambition. Most countries have slowly increased the share of renewables in their energy mix since 2005. However, to be aligned with a 1.5°C pathway major emitters will need to ramp up to a minimum of 45 percent power generation from renewables by 2030; 75–100 percent by 2040; and 98–100 percent by 2050 (Table 1).
In 2019 renewables accounted for 72 percent of new capacity additions worldwide (IRENA 2020b) (Figure 16). The IEA predicts that this trend will continue, and IRENA (2018b) projects that in 2020, three-quarters of wind and four-fifths of solar photovoltaic (PV) projects will be cheaper than fossil fuels, even without financial assistance. The increase in renewable generating capacity in recent years has surpassed previous projections, showing that renewable deployment has started to accelerate, and indicating the start of an S-curve transformation.
As electricity demand continues to grow in many parts of the world, the speed at which renewables replace existing fossil fuel power plants must accelerate to achieve targets that are aligned with a 1.5°C pathway.18 Figure 17 shows that renewables would need to grow at an unprecedented rate to reach 98–100 percent by 2050.
While data from REN21 (2020) show that renewable capacity had its largest increase ever (200 GW) in 2019, we are not on track to meet the 2030 and 2050 targets. We have seen a global annual increase of renewables share of 0.7 percent
Figure 16 | Growing share of renewables in annual additions to global installed generating capacity, 2001–19
Source: IEA (2019a).
0%
20%
40%
60%
80%
100%
2001 2002 2003 2004 2005 2006 2007 2008 2009 2010 2011 2012 2013 2014 2015 2016 2017 2018 2019
Non-renewable Wind Solar PV Other renewables Hydro
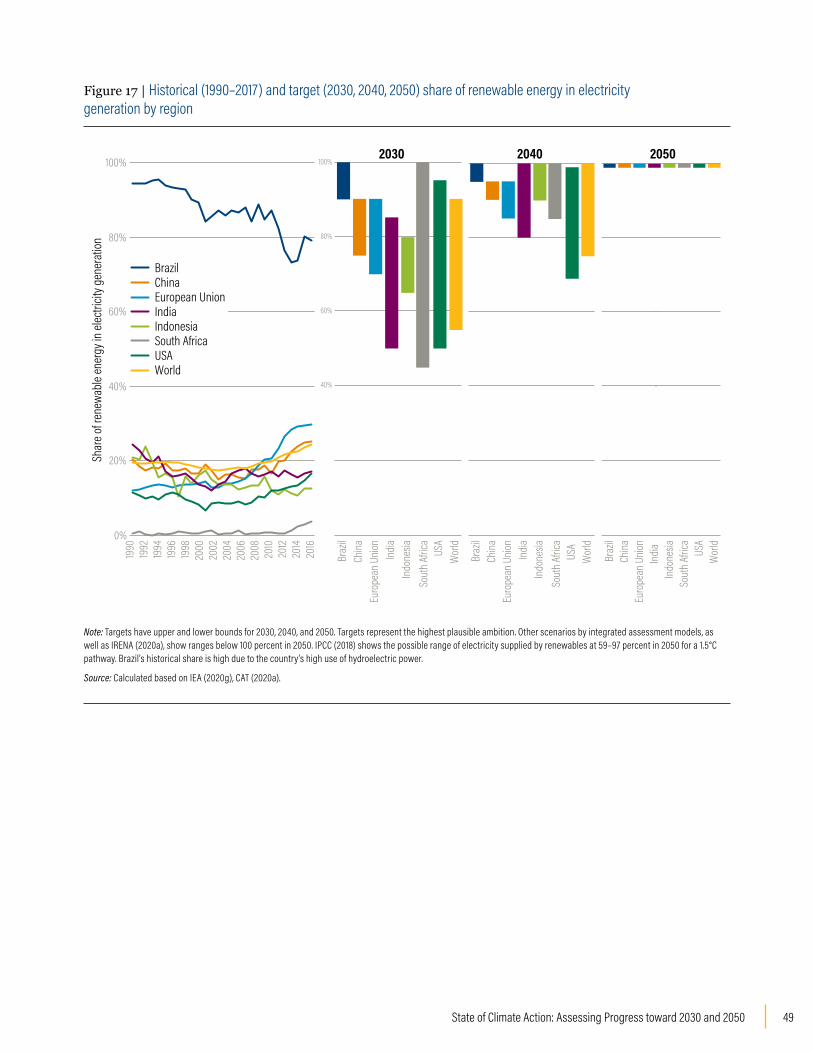
49State of Climate Action: Assessing Progress toward 2030 and 2050
Figure 17 | Historical (1990–2017) and target (2030, 2040, 2050) share of renewable energy in electricity generation by region
Note: Targets have upper and lower bounds for 2030, 2040, and 2050. Targets represent the highest plausible ambition. Other scenarios by integrated assessment models, as well as IRENA (2020a), show ranges below 100 percent in 2050. IPCC (2018) shows the possible range of electricity supplied by renewables at 59–97 percent in 2050 for a 1.5°C pathway. Brazil’s historical share is high due to the country’s high use of hydroelectric power.
Source: Calculated based on IEA (2020g), CAT (2020a).
0%
20%
40%
60%
80%
100%
1990 1992
1994
1996
1998
2000
2002
2004
2006
2008
2010
2012
2014
2016
Shar
e of r
enew
able
ener
gy in
elec
tricit
y gen
erat
ion
South AfricaUSAWorld
European UnionChina
India
Brazil
Indonesia
40%
60%
80%
100%
Wor
ldUS
A
Euro
pean
Unio
n
Braz
il
Indo
nesia
China
Sout
h Af
rica
India
Wor
ldUS
A
Braz
il
Indo
nesia
Sout
h Af
rica
India
Wor
ldUS
A
Euro
pean
Unio
n
Braz
il
Indo
nesia
China
Sout
h Af
rica
India
Euro
pean
Unio
nCh
ina
2030 2040 2050

WRI.org50
Table 1 | Share of renewables in electricity generation, historical trends, and change needed to achieve 2030 and 2050 targets
COUNTRY
2018 SHARE OF RENEWABLES (%)
2030 HIGHEST POSSIBLE AMBITION (%)
2050 HIGHEST POSSIBLE AMBITION (%)
HISTORICAL AVERAGE ANNUAL CHANGE, 2013–18 (%)
AVERAGE ANNUAL CHANGE TARGET, 2018–30 (%) (RANGE)
AVERAGE ANNUAL CHANGE TARGET, 2018–50 (%) (RANGE)
Brazil 82.3 90 to 100 98 to 100 1.1 0.6 to 1.5 0.5 to 0.6
China 26.0 75 to 90 98 to 100 1.1 4.1 to 5.3 2.3
European Union (28) 32.3 70 to 90 98 to 100 1.1 3.1 to 4.8 2.1
India 18.9 65 to 80 98 to 100 0.3 3.8 to 5.1 2.5
Indonesia 17.2 55 to 85 98 to 100 1.0 3.1 to 5.7 2.6
South Africa 6.6 45 to 100 98 to 100 1.0 3.2 to 7.8 2.9
United States 17.0 50 to 95 98 to 100 0.8 2.8 to 6.5 2.6
World 25.3 55 to 90 98 to 100 0.7 2.5 to 5.4 2.3
Global acceleration needed
5.6x to 2030 3.3x to 2050
Notes: Renewables include electricity from hydro, geothermal, solar, wind, tide, wave, biofuels, and the renewable fraction of municipal waste.
For biofuels, modeling scenarios do not often account for full lifecycle emissions (e.g., from the production and gathering of biomass feedstocks). Especially where the production of feedstocks causes direct and indirect land use change, proper accounting of these lifecycle emissions could reduce the range of biofuels. Similarly historical renewable shares include 1.9 percent biofuels, which might not be zero-carbon.
Acceleration factors are averaged where the targets include a range.
The Climate Action Tracker targets are set at the highest level of ambition that is technically achievable based on national energy transition studies. Integrated assessment models build scenarios for the whole economy (not just the power sector) across all countries and come to a wider range of share of renewables (71–95 percent) across the above countries. This indicates that there are 1.5°C-compatible scenarios with a renewable penetration of less than 98–100 percent.
Sources: IEA (2020g); CAT (2020a).
While the increase in global power generation is mostly driven by growth in India and China, these countries have also met a lot of their new demand with renewables and are major investors in renewables, with China representing 32 percent of investments in 2018 (IRENA 2020b).
Global demand for electricity will continue to grow as other sectors, like transport and buildings, are electrified, which will require even more renewable generating capacity. Globally, investments in renewables increased rapidly in the first decade of the century and then stayed relatively constant between 2011 and 2018 (Figure 19). However, because of declining prices, new installed capacity of renewables still increased from 109 GW in 2011
to 200 GW in 2019 (REN21 2020). Investments in grid flexibility will also be critical to achieving a high percentage of renewables in the grid.
Many changes on the ground indicate that we are reaching a tipping point for renewable energy generation and energy storage, driven mostly by cost reductions (Figure 17) but also by policies, political signals, and increased demand from electricity consumers, investors, and companies. Action on renewables takes place at all levels, with the private sector playing a key role in driving renewable deployment (Figure 20). However, we need to see rapid change in the coming years to shift from the continued buildout of fossil fuel power plants that risks locking us into a pathway incompatible with the 1.5°C goal. To achieve the
Figure 18 | Decreases in solar and wind power generation technology prices, indexed to 2009, and battery storage prices, indexed to 2010
Notes: PV = photovoltaic; LCOE: levelized cost of energy.
Renewables’ cost reduction has helped these technologies compete in major markets. Solar PV prices have seen the biggest drop, with PV modules only costing about one-tenth of their price in 2009. An often-overlooked success story has been the improvements in battery technology, a key requirement for renewable energy storage. Tesla, General Motors, and Volkswagen all announced that they will have prices down to $100/kWh in the course of 2020, which would be another 50 percent reduction compared to 2019 prices (Ewing 2020; Holland 2018; Beresford 2020). At the same time, battery energy density has almost tripled, making batteries smaller, lighter, and more suitable for a variety of uses.
Sources: Lazard (2020); BNEF (2020b).
0
0.2
0.4
0.6
0.8
1
2009 2010 2011 2012 2013 2014 2015 2016 2017 2018 2019
Solar PV -Mean LCOE ($/kWh)
Wind – Mean LCOE ($/kWh)
Battery Pack Costs, Market Average ($/kWh)
0.30
0.130.11
Figure 19 | Public and private investment in installed capacity of renewable electricity generation
Source: IRENA (2020b).
2004 2005 2006 2007 2008 2009 2010 2011 2012 2013 2014 2015 2016 2017 20180
50
100
150
200
250
300
350
Billio
n US
$
Americas (excluding U.S. and Brazil)
Asia and Oceania (excluding China and India)
Brazil
China
Europe
India
Middle East and Africa
United States
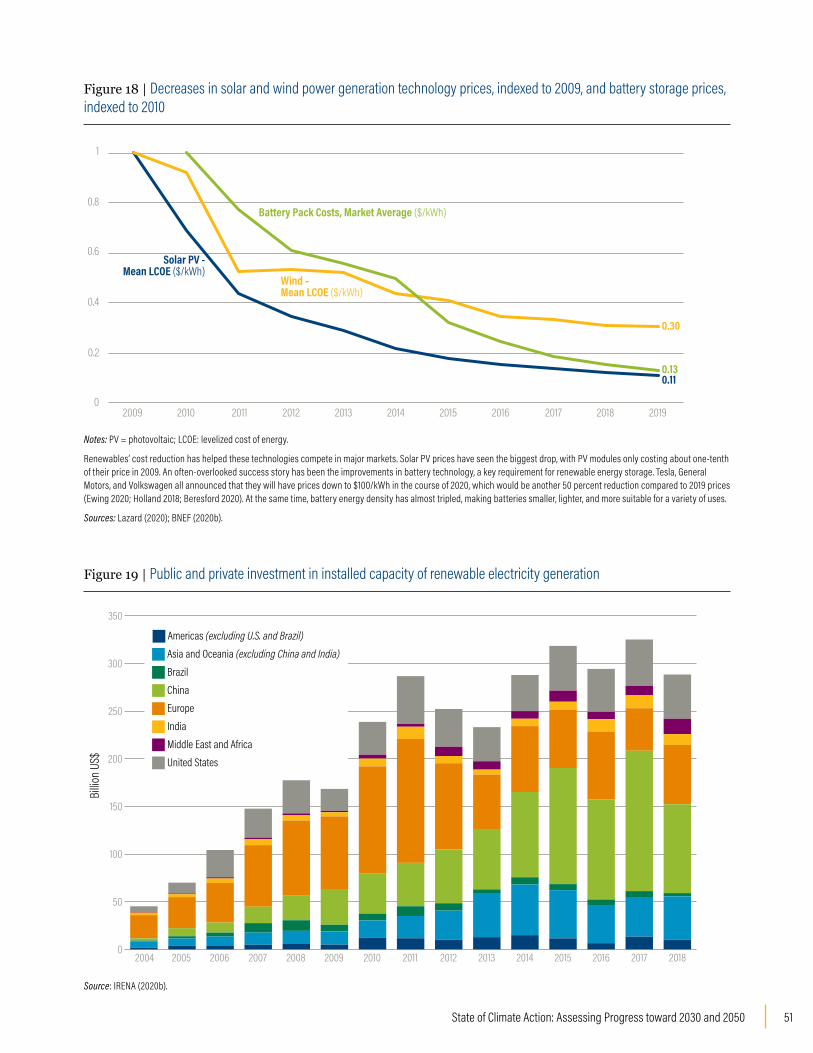
51State of Climate Action: Assessing Progress toward 2030 and 2050
Table 1 | Share of renewables in electricity generation, historical trends, and change needed to achieve 2030 and 2050 targets
COUNTRY
2018 SHARE OF RENEWABLES (%)
2030 HIGHEST POSSIBLE AMBITION (%)
2050 HIGHEST POSSIBLE AMBITION (%)
HISTORICAL AVERAGE ANNUAL CHANGE, 2013–18 (%)
AVERAGE ANNUAL CHANGE TARGET, 2018–30 (%) (RANGE)
AVERAGE ANNUAL CHANGE TARGET, 2018–50 (%) (RANGE)
Brazil 82.3 90 to 100 98 to 100 1.1 0.6 to 1.5 0.5 to 0.6
China 26.0 75 to 90 98 to 100 1.1 4.1 to 5.3 2.3
European Union (28) 32.3 70 to 90 98 to 100 1.1 3.1 to 4.8 2.1
India 18.9 65 to 80 98 to 100 0.3 3.8 to 5.1 2.5
Indonesia 17.2 55 to 85 98 to 100 1.0 3.1 to 5.7 2.6
South Africa 6.6 45 to 100 98 to 100 1.0 3.2 to 7.8 2.9
United States 17.0 50 to 95 98 to 100 0.8 2.8 to 6.5 2.6
World 25.3 55 to 90 98 to 100 0.7 2.5 to 5.4 2.3
Global acceleration needed
5.6x to 2030 3.3x to 2050
Notes: Renewables include electricity from hydro, geothermal, solar, wind, tide, wave, biofuels, and the renewable fraction of municipal waste.
For biofuels, modeling scenarios do not often account for full lifecycle emissions (e.g., from the production and gathering of biomass feedstocks). Especially where the production of feedstocks causes direct and indirect land use change, proper accounting of these lifecycle emissions could reduce the range of biofuels. Similarly historical renewable shares include 1.9 percent biofuels, which might not be zero-carbon.
Acceleration factors are averaged where the targets include a range.
The Climate Action Tracker targets are set at the highest level of ambition that is technically achievable based on national energy transition studies. Integrated assessment models build scenarios for the whole economy (not just the power sector) across all countries and come to a wider range of share of renewables (71–95 percent) across the above countries. This indicates that there are 1.5°C-compatible scenarios with a renewable penetration of less than 98–100 percent.
Sources: IEA (2020g); CAT (2020a).
While the increase in global power generation is mostly driven by growth in India and China, these countries have also met a lot of their new demand with renewables and are major investors in renewables, with China representing 32 percent of investments in 2018 (IRENA 2020b).
Global demand for electricity will continue to grow as other sectors, like transport and buildings, are electrified, which will require even more renewable generating capacity. Globally, investments in renewables increased rapidly in the first decade of the century and then stayed relatively constant between 2011 and 2018 (Figure 19). However, because of declining prices, new installed capacity of renewables still increased from 109 GW in 2011
to 200 GW in 2019 (REN21 2020). Investments in grid flexibility will also be critical to achieving a high percentage of renewables in the grid.
Many changes on the ground indicate that we are reaching a tipping point for renewable energy generation and energy storage, driven mostly by cost reductions (Figure 17) but also by policies, political signals, and increased demand from electricity consumers, investors, and companies. Action on renewables takes place at all levels, with the private sector playing a key role in driving renewable deployment (Figure 20). However, we need to see rapid change in the coming years to shift from the continued buildout of fossil fuel power plants that risks locking us into a pathway incompatible with the 1.5°C goal. To achieve the
Figure 18 | Decreases in solar and wind power generation technology prices, indexed to 2009, and battery storage prices, indexed to 2010
Notes: PV = photovoltaic; LCOE: levelized cost of energy.
Renewables’ cost reduction has helped these technologies compete in major markets. Solar PV prices have seen the biggest drop, with PV modules only costing about one-tenth of their price in 2009. An often-overlooked success story has been the improvements in battery technology, a key requirement for renewable energy storage. Tesla, General Motors, and Volkswagen all announced that they will have prices down to $100/kWh in the course of 2020, which would be another 50 percent reduction compared to 2019 prices (Ewing 2020; Holland 2018; Beresford 2020). At the same time, battery energy density has almost tripled, making batteries smaller, lighter, and more suitable for a variety of uses.
Sources: Lazard (2020); BNEF (2020b).
0
0.2
0.4
0.6
0.8
1
2009 2010 2011 2012 2013 2014 2015 2016 2017 2018 2019
Solar PV -Mean LCOE ($/kWh)
Wind – Mean LCOE ($/kWh)
Battery Pack Costs, Market Average ($/kWh)
0.30
0.130.11
Figure 19 | Public and private investment in installed capacity of renewable electricity generation
Source: IRENA (2020b).
2004 2005 2006 2007 2008 2009 2010 2011 2012 2013 2014 2015 2016 2017 20180
50
100
150
200
250
300
350
Billio
n US
$
Americas (excluding U.S. and Brazil)
Asia and Oceania (excluding China and India)
Brazil
China
Europe
India
Middle East and Africa
United States

WRI.org52
necessary high proportion of renewables in global power generation, we simultaneously require better system integration and expansion of electricity storage.
Private sector actions show that the markets are ripe to drive this transition. India’s largest electric utility company, Tata Power, announced that most of its future capacity will be renewables, and similar commitments have been made in Spain and the United States in 2019 (REN21 2020). The private sector can show continued ambition by
target-setting at the portfolio level and reporting on progress,19 and large energy consumers can set ambitious renewable targets through the Science Based Targets initiative.
Government policies still run counter to the trajectory of private sector action in some cases. For example, recent policy uncertainties in China and India and tax changes in Spain contributed to slowdowns in the national solar PV market in those countries. The request to Parties to submit new and enhanced nationally determined contributions (NDCs) over the coming year gives governments the opportunity to send strong market signals. Most NDCs are not in line with a 1.5°C pathway and do not recognize the potential for increased
renewable deployment, as well as energy efficiency, grid flexibility, and other measures that would help enhance action in the sector.
Several additional actions by governments can accelerate private sector adoption and investment. Fossil fuel subsidies, estimated to be double those of renewable energy in 2016, can be reduced and eliminated (NCE 2018). Governments can expand effective carbon pricing, enact additional policies to integrate variable renewable energy in supply-and-demand systems (REN21 2019), expand
distributed renewable electricity to the 860 million people without access to electricity (REN21 2020), invest in energy efficiency (REN21 2019), and implement utility reform to better address demand by renewable energy customers.
Indicator 2: Share of unabated coal in electricity generation (%)2030: 0–2.5 percent unabated coal in electricity generation
2050: zero unabated coal in electricity generation
Coal has the highest emissions intensity of all electricity sources and presents the highest risk of locking us into a pathway above 1.5°C of temperature rise (Seto et al. 2016). All scenarios that limit warming to 1.5°C nearly phase out
Figure 20 | Climate actions and commitments by different actors
FPOCountries
By the end of 2019, 166 countries had national targets for renewable energy (RE) in the power sector (49 countries had an RE target for heating and cooling, and 46 had an RE target for transport) (REN21 2020).
By the end of 2019, at least 32 countries had more than 10 GW of renewable power capacity in operation, up from 19 countries in 2009, showing that others can follow their example (REN21 2020).
Cities
Of the more than 650 global cities reporting to the CDP (formerly known as the Climate Disclosure Project), over 100 now get at least 70% of their electricity from renewable sources such as hydro, geothermal, solar, and wind (REN21 2020).
190 cities have set renewable power sector targets through the CDP (REN21 2020).
In 2019, over 250 cities had 100% renewables targets in at least one sector (REN21 2020).
Investors
Climate Action 100+ (2020) has shown clear leadership, bringing together 450 investors with over $40 trillion in assets.
The Net-Zero Asset Owner Alliance, a group of the world’s largest pension funds and insurers, plans to oversee more than $5 trillion in investments committed to carbon-neutral investment portfolios by 2050 (UNEP FI 2020).
Companies
RE100 commits over 228 companies to going 100% renewable.
The Science Based Targets initiative includes over 1,000 companies that set targets in line with 2°C or 1.5°C, increasing demand for renewable electricity and creating clear market signals.
$468 million of corporate-level funding was invested in the o�-grid electricity access sector in 2019 (REN21 2020).
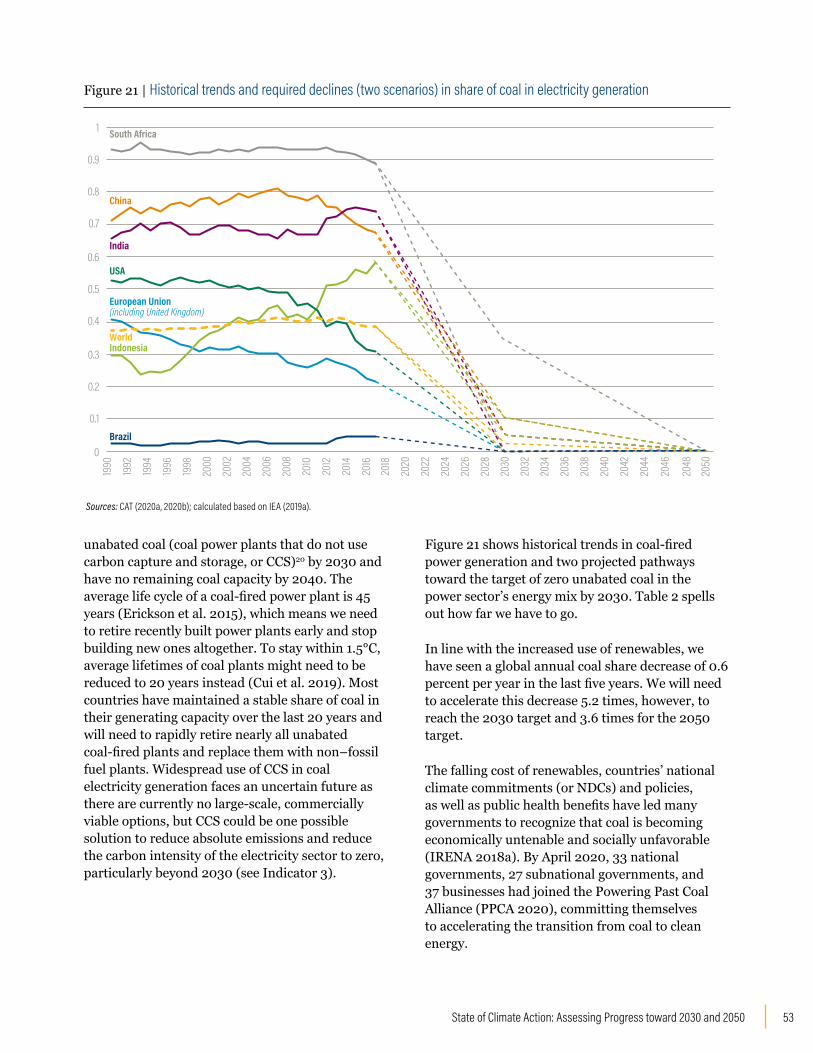
53State of Climate Action: Assessing Progress toward 2030 and 2050
unabated coal (coal power plants that do not use carbon capture and storage, or CCS)20 by 2030 and have no remaining coal capacity by 2040. The average life cycle of a coal-fired power plant is 45 years (Erickson et al. 2015), which means we need to retire recently built power plants early and stop building new ones altogether. To stay within 1.5°C, average lifetimes of coal plants might need to be reduced to 20 years instead (Cui et al. 2019). Most countries have maintained a stable share of coal in their generating capacity over the last 20 years and will need to rapidly retire nearly all unabated coal-fired plants and replace them with non–fossil fuel plants. Widespread use of CCS in coal electricity generation faces an uncertain future as there are currently no large-scale, commercially viable options, but CCS could be one possible solution to reduce absolute emissions and reduce the carbon intensity of the electricity sector to zero, particularly beyond 2030 (see Indicator 3).
Figure 21 shows historical trends in coal-fired power generation and two projected pathways toward the target of zero unabated coal in the power sector’s energy mix by 2030. Table 2 spells out how far we have to go.
In line with the increased use of renewables, we have seen a global annual coal share decrease of 0.6 percent per year in the last five years. We will need to accelerate this decrease 5.2 times, however, to reach the 2030 target and 3.6 times for the 2050 target.
The falling cost of renewables, countries’ national climate commitments (or NDCs) and policies, as well as public health benefits have led many governments to recognize that coal is becoming economically untenable and socially unfavorable (IRENA 2018a). By April 2020, 33 national governments, 27 subnational governments, and 37 businesses had joined the Powering Past Coal Alliance (PPCA 2020), committing themselves to accelerating the transition from coal to clean energy.
Figure 21 | Historical trends and required declines (two scenarios) in share of coal in electricity generation
Sources: CAT (2020a, 2020b); calculated based on IEA (2019a).
0
0.1
0.2
0.3
0.4
0.5
0.6
0.7
0.8
0.9
1
Brazil
USA
WorldIndonesia
China
India
South Africa
European Union(including United Kingdom)
1990
2016
1992
1994
1996
1998
2000
2002
2004
2006
2008
2010
2012
2014
2018
2044
2020
2022
2024
2026
2028
2030
2032
2034
2036
2038
2040
2042
2046
2048
2050

WRI.org54
At least 28 major banks have stopped direct financing to new coal plants worldwide (BankTrack 2020). Additionally, over 1,110 institutions with more than $11 trillion in assets committed to divesting from fossil fuels, compared to just $52 billion in 2014 (Cadan et al. 2019).
Despite these commitments, new coal capacity21 has not sufficiently slowed down in recent years. In 2019 the addition of new coal was double the capacity that was retired (68 GW added; 34 GW retired) (Figure 22). While coal plant retirements
have increased from just 2 GW in 2006, this is still vastly outside the necessary trajectory, given that most coal plants will need to be retired by 2030.
Between 2010 and 2019, 1,523 GW of planned coal plant capacity was canceled (by comparison, about 2,000 GW is currently in operation), and about 800 GW of coal capacity is still in the pipeline as of January 2020. Capacity is mostly being added in India and China (76 percent of new additions in 2019) to meet increasing demand (CoalSwarm 2020).
Table 2 | Share of coal in electricity generation in 2017 and targets for 2030 and 2050
COUNTRY
SHARE OF COAL IN ELECTRICITY GENERATION, 2018 (%)
2030 TARGET (%)
2050 TARGET (%)
HISTORICAL AVERAGE ANNUAL CHANGE, 2013–18 (%)
AVERAGE ANNUAL CHANGE TARGET, 2018–30 (%)
AVERAGE ANNUAL CHANGE TARGET, 2018–50 (%)
Brazil 3.9 0 0 0.01 -0.3 -0.1
China 66.5 5 to 10 0 -1.7 -5.1 to -4.7 -2.1
European Union (28) 20.1 0 0 -1.5 -1.7 -0.6
India 73.5 5 to 10 0 0.1 -5.7 to -5.3 -2.3
Indonesia 56.4 5 to 10 0 1.0 -4.3 to -3.9 -1.8
South Africa 88.8 0 to 35 0 -0.8 -7.4 to -4.5 -2.8
United States 28.6 0 0 -2.2 -2.4 -0.9
World 38.0 0 to 3 0 -0.6 -3.2 to -2.9 -1.2
Global acceleration needed
5.1x to 2030 2.0x to 2050
Note: Acceleration factors are averaged where the targets include a range.
Sources: Calculated based on IEA (2019a, 2020a); CAT (2020b).
Figure 22 | New coal capacity and retirements, 2006–19
Source: CoalSwarm (2020).
200020012002200320042005200620072008200920102011201220132014201520162017201820192020
-40,000 -20,000 0 20,000 40,000 60,000 80,000 100,000 120,000
China - New coal India - New coal Indonesia - New coal United States - New coal South Africa - New coal Brazil - New coal European Union (28) - New coal Rest of the World - New coal China - Retirements India - Retirements Indonesia - RetirementsUnited States - Retirements South Africa - Retirements Brazil - Retirements European Union (28) - Retirements Rest of the World - Retirements
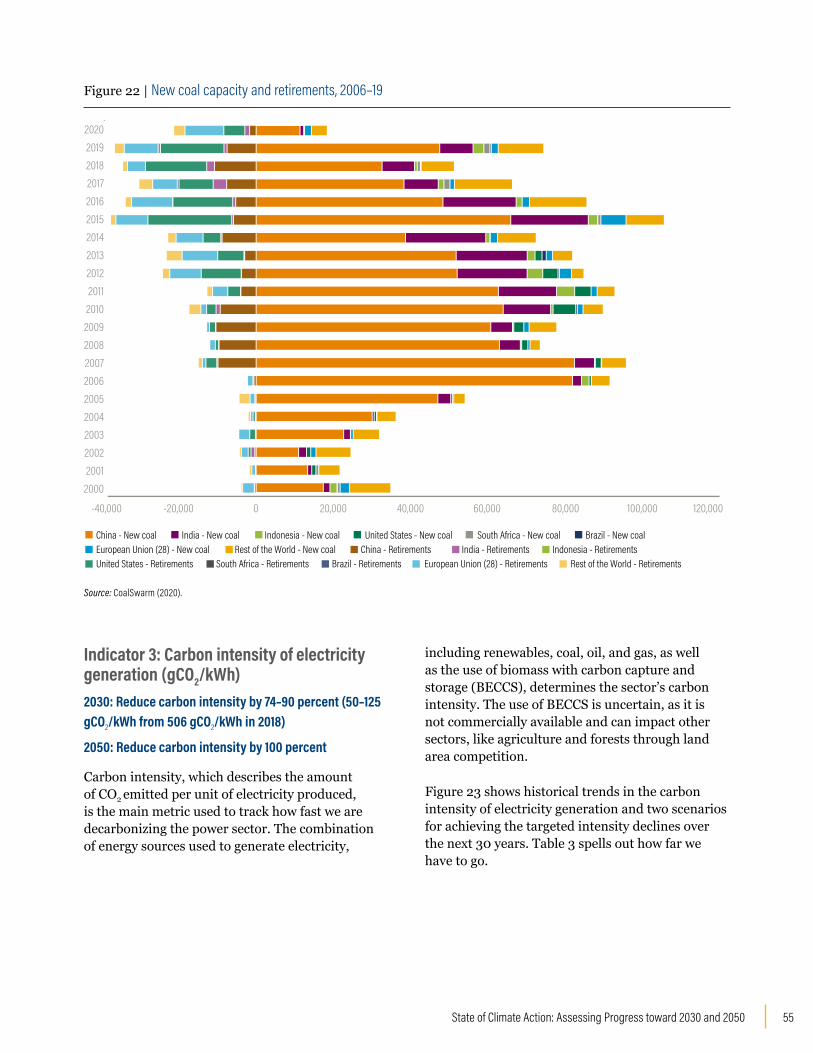
55State of Climate Action: Assessing Progress toward 2030 and 2050
Indicator 3: Carbon intensity of electricity generation (gCO2/kWh)2030: Reduce carbon intensity by 74–90 percent (50–125 gCO2/kWh from 506 gCO2/kWh in 2018)
2050: Reduce carbon intensity by 100 percent
Carbon intensity, which describes the amount of CO2 emitted per unit of electricity produced, is the main metric used to track how fast we are decarbonizing the power sector. The combination of energy sources used to generate electricity,
including renewables, coal, oil, and gas, as well as the use of biomass with carbon capture and storage (BECCS), determines the sector’s carbon intensity. The use of BECCS is uncertain, as it is not commercially available and can impact other sectors, like agriculture and forests through land area competition.
Figure 23 shows historical trends in the carbon intensity of electricity generation and two scenarios for achieving the targeted intensity declines over the next 30 years. Table 3 spells out how far we have to go.
have increased from just 2 GW in 2006, this is still vastly outside the necessary trajectory, given that most coal plants will need to be retired by 2030.
Between 2010 and 2019, 1,523 GW of planned coal plant capacity was canceled (by comparison, about 2,000 GW is currently in operation), and about 800 GW of coal capacity is still in the pipeline as of January 2020. Capacity is mostly being added in India and China (76 percent of new additions in 2019) to meet increasing demand (CoalSwarm 2020).
Figure 22 | New coal capacity and retirements, 2006–19
Source: CoalSwarm (2020).
200020012002200320042005200620072008200920102011201220132014201520162017201820192020
-40,000 -20,000 0 20,000 40,000 60,000 80,000 100,000 120,000
China - New coal India - New coal Indonesia - New coal United States - New coal South Africa - New coal Brazil - New coal European Union (28) - New coal Rest of the World - New coal China - Retirements India - Retirements Indonesia - RetirementsUnited States - Retirements South Africa - Retirements Brazil - Retirements European Union (28) - Retirements Rest of the World - Retirements

WRI.org56
To limit warming to 1.5°C we will need to reduce the global carbon intensity to below zero in 2050, but we have not seen much progress toward this target in the last 30 years. Global carbon intensity of electricity was 482.9 gCO2/kWh in 2017, only a small reduction from the 528.6 gCO2/kWh in 1990 (IEA 2020g).
To achieve the benchmarks we will need to accelerate this decrease 3.6 times to reach the 2030 target and 1.6 times for the 2050 target.
With growing demand for electricity from other sectors like transport and industry, we must switch from all fossil fuel–fired power generation to renewable generation. A key challenge is that fossil fuel subsidies are still double the support that renewable energy receives (REN21 2019), which increases investments in fossil fuels and depletes government funding. The expansion of renewables (Indicator 1) and retirement of coal (Indicator 2) are interlinked and will drive reductions in emission intensity, but we also need to reduce our reliance on oil and gas. Opportunities for action that address climate change and provide jobs and economic growth include investment in flexible grids, energy efficiency, and expansion of renewables as part of the stimulus packages being implemented in response to the coronavirus pandemic.
Figure 23 | Historical trends and required decline (two scenarios) in carbon intensity of the power sector
Sources: CAT (2020a); calculated based on IEA (2019a).
0
100
200
300
400
500
600
700
800
900
1,000
1,100
Brazil
China
Indonesia
India
USAWorld
South Africa
European Union(including United Kingdom)
1990
2016
1992
1994
1996
1998
2000
2002
2004
2006
2008
2010
2012
2014
2018
2044
2020
2022
2024
2026
2028
2030
2032
2034
2036
2038
2040
2042
2046
2048
2050
gCO2
/kW
h
Table 3 | Carbon intensity of electricity generation in 2017 and target reductions for 2030 and 2050 (gCO2/kWh)
COUNTRY 2018 2030 TARGET RANGE
2050 TARGET
HISTORICAL AVERAGE ANNUAL CHANGE, 2010–17A
AVERAGE ANNUAL CHANGE TARGET, 2017–30 (RANGE)
AVERAGE ANNUAL CHANGE TARGET, 2017–50
Brazil 116.6 0 to 20 <0 4.1 -7.4 to -9.0 -3.5
China 699.5 100 to 110 <0 -19.4 -45.3 to -46.1 -21.2
European Union (28) 341.1 75 to 80 <0 -9.8 -20.1 to -20.5 -10.3
India 718.1 115 to 155 <0 -12.4 -43.3 to -46.4 -21.8
Indonesia 768.5 50 to 255 <0 6.6 -39.5 to -55.3 -23.3
South Africa 899.6 45 to 377 <0 -6.6 -40.2 to -65.7 -27.3
United States 427.5 30 to 130 <0 -15.9 -22.9 to -30.6 -13.0
World 531.2 50 to 125 <0 -7.2 -31.2 to -37.0 -16.1
Global acceleration needed
4.7x to 2030 2.2x to 2050
Note: Acceleration factors are averaged where the targets include a range.
Sources: Calculated based on IEA (2019a); CAT (2020b).
BUILDINGS
Carbon intensity of building operation
▪ 2040: Residential: 90 percent below 2015 levels; Commercial: 90–95 percent below 2015 levels
▪ 2050: Residential: 95 percent below 2015 levels; Commercial: 100 percent below 2015 levels
Energy intensity of building operation
▪ 2030: no global target
▪ Residential: 20–30 percent below 2015 levels in select regions
▪ Commercial: 10–30 percent below 2015 levels in select regions
▪ 2050: no global target
▪ Residential: 20–60 percent below 2015 levels in select regions
▪ Commercial: 15–50 percent below 2015 levels in select regions
Renovation rate
▪ 2030: 2.5–3.5 percent per year
▪ 2040: 3.5 percentNote: Indicators and targets were developed by the CAT consortium to align with the transformation needed in the power sector to align with a 1.5°C pathway; see CAT (2020b) for more information.

57State of Climate Action: Assessing Progress toward 2030 and 2050
To limit warming to 1.5°C we will need to reduce the global carbon intensity to below zero in 2050, but we have not seen much progress toward this target in the last 30 years. Global carbon intensity of electricity was 482.9 gCO2/kWh in 2017, only a small reduction from the 528.6 gCO2/kWh in 1990 (IEA 2020g).
To achieve the benchmarks we will need to accelerate this decrease 3.6 times to reach the 2030 target and 1.6 times for the 2050 target.
With growing demand for electricity from other sectors like transport and industry, we must switch from all fossil fuel–fired power generation to renewable generation. A key challenge is that fossil fuel subsidies are still double the support that renewable energy receives (REN21 2019), which increases investments in fossil fuels and depletes government funding. The expansion of renewables (Indicator 1) and retirement of coal (Indicator 2) are interlinked and will drive reductions in emission intensity, but we also need to reduce our reliance on oil and gas. Opportunities for action that address climate change and provide jobs and economic growth include investment in flexible grids, energy efficiency, and expansion of renewables as part of the stimulus packages being implemented in response to the coronavirus pandemic.
Figure 23 | Historical trends and required decline (two scenarios) in carbon intensity of the power sector
Sources: CAT (2020a); calculated based on IEA (2019a).
0
100
200
300
400
500
600
700
800
900
1,000
1,100
Brazil
China
Indonesia
India
USAWorld
South Africa
European Union(including United Kingdom)
1990
2016
1992
1994
1996
1998
2000
2002
2004
2006
2008
2010
2012
2014
2018
2044
2020
2022
2024
2026
2028
2030
2032
2034
2036
2038
2040
2042
2046
2048
2050
gCO2
/kW
h
Table 3 | Carbon intensity of electricity generation in 2017 and target reductions for 2030 and 2050 (gCO2/kWh)
COUNTRY 2018 2030 TARGET RANGE
2050 TARGET
HISTORICAL AVERAGE ANNUAL CHANGE, 2010–17A
AVERAGE ANNUAL CHANGE TARGET, 2017–30 (RANGE)
AVERAGE ANNUAL CHANGE TARGET, 2017–50
Brazil 116.6 0 to 20 <0 4.1 -7.4 to -9.0 -3.5
China 699.5 100 to 110 <0 -19.4 -45.3 to -46.1 -21.2
European Union (28) 341.1 75 to 80 <0 -9.8 -20.1 to -20.5 -10.3
India 718.1 115 to 155 <0 -12.4 -43.3 to -46.4 -21.8
Indonesia 768.5 50 to 255 <0 6.6 -39.5 to -55.3 -23.3
South Africa 899.6 45 to 377 <0 -6.6 -40.2 to -65.7 -27.3
United States 427.5 30 to 130 <0 -15.9 -22.9 to -30.6 -13.0
World 531.2 50 to 125 <0 -7.2 -31.2 to -37.0 -16.1
Global acceleration needed
4.7x to 2030 2.2x to 2050
Note: Acceleration factors are averaged where the targets include a range.
Sources: Calculated based on IEA (2019a); CAT (2020b).
BUILDINGS
Carbon intensity of building operation
▪ 2040: Residential: 90 percent below 2015 levels; Commercial: 90–95 percent below 2015 levels
▪ 2050: Residential: 95 percent below 2015 levels; Commercial: 100 percent below 2015 levels
Energy intensity of building operation
▪ 2030: no global target
▪ Residential: 20–30 percent below 2015 levels in select regions
▪ Commercial: 10–30 percent below 2015 levels in select regions
▪ 2050: no global target
▪ Residential: 20–60 percent below 2015 levels in select regions
▪ Commercial: 15–50 percent below 2015 levels in select regions
Renovation rate
▪ 2030: 2.5–3.5 percent per year
▪ 2040: 3.5 percentNote: Indicators and targets were developed by the CAT consortium to align with the transformation needed in the power sector to align with a 1.5°C pathway; see CAT (2020b) for more information.

WRI.org58
Decarbonizing residential, commercial, and industrial buildings is a crucial part of keeping global warming below 1.5°C. Building construction and operation are major energy consumers and GHG emitters. Globally, buildings account for 30 percent of energy use, 27 percent of energy-related CO2 emissions, and around 20 percent of GHG emissions (Figure 24). If we include the energy consumption and emissions from manufacturing of building construction materials,22 the sector accounted for the largest share of energy use and emissions in 2018 (GlobalABC et al. 2020). In this section, the targets focus on the emissions and energy intensity from building operations, as well as deep renovation of existing buildings. The construction industry is covered by the cement and steel targets in the Industry section.
Population growth and urbanization have rapidly increased demand for energy in buildings, especially electricity. It is estimated that energy consumed in residential and commercial buildings will increase by 65 percent between 2018 and 2050 (EIA 2019). Improving building energy performance not only can save energy and reduce emissions but also can bring economic benefits such as savings in operational energy costs and
reduced demand-side pressure on the power sector, as well as social benefits such as improved comfort and quality of life.
Decarbonization of the buildings sector can only be achieved with measures taken throughout the building life cycle, including constructing new buildings to net-zero or near-net-zero emissions standards using construction materials with low embodied carbon, improving the energy efficiency of existing buildings through retrofit and improved appliance efficiency, as well as decarbonizing the power grid (GlobalABC et al. 2020). Policies that regulate the energy performance of buildings need to be introduced to encourage new and existing buildings to be built and renovated to the highest standards. Building codes are being introduced in an increasing number of countries.
Indicator 1: Carbon intensity of buildings (kgCO2/m2) 2030: residential buildings 45–65 percent lower than 2015 levels; commercial buildings 65–75 percent lower than 2015 levels in select regions
2050: residential and commercial buildings 95–100 percent lower than 2015 levels
Figure 24 | The buildings sector’s share of global energy consumption and CO2 emissions, 2018
Note: “Construction industry” (left chart) refers to energy associated with manufacturing building construction materials such as steel, cement, and glass. “Indirect” emissions (right chart) refer to emissions associated with electricity generation. Emissions presented here cover energy-relevant CO2 emissions only and are allocated to end-use categories.
Source: GlobalABC et al. (2019).
Residentialbuildings
Residential(direct)
Non residential(direct)
Non residential(indirect)
Residential(indirect)
Non residentialbuildings
Constructionindustry
Constructionindustry
Other industry
Other
Transport
Other industry
Other
Transport
Final Energy Emissions
28%22%
8%
23%
6%
11%
3%
8%
11%
31%
7%
6%
32%
4%
Figure 25 | Historical trends and required decline in the carbon intensity of residential buildings
Note: No data available for Indonesia.
Source: CAT (2020b).
0
10
20
30
40
50
60
70
80
2005 2010 2015 2020 2025 2030 2035 2040 2045 2050
kg C
O2/m
2
RESIDENTIAL
South AfricaUSA
WorldEuropean Union (28)
ChinaIndiaBrazil

59State of Climate Action: Assessing Progress toward 2030 and 2050
The carbon intensity of buildings is measured in terms of kilograms of carbon dioxide emitted per square meter of floor area (kgCO2/m2) from building operations. It is thus a measure of decarbonization of the energy supply to buildings, although efficiency gains also play an important role in reducing emissions. The targets for carbon intensity imply that by 2050, almost all buildings will operate at net-zero or near-net-zero carbon emissions. Figures 25 and 26 show historical trends and projected declines in the carbon intensity of
residential and commercial buildings, respectively, that will be necessary to achieve the 2030 and 2050 targets. Tables 4 and 5 spell out how far we have to go. Globally, building-related CO2 emissions were again on a rise in 2017–18 after leveling off in 2013–16 (GlobalABC et al. 2019). It is important to note that with floor area and population projected to continue to increase, it is crucial to reduce overall emissions from the buildings sector in addition to intensity improvements.
reduced demand-side pressure on the power sector, as well as social benefits such as improved comfort and quality of life.
Decarbonization of the buildings sector can only be achieved with measures taken throughout the building life cycle, including constructing new buildings to net-zero or near-net-zero emissions standards using construction materials with low embodied carbon, improving the energy efficiency of existing buildings through retrofit and improved appliance efficiency, as well as decarbonizing the power grid (GlobalABC et al. 2020). Policies that regulate the energy performance of buildings need to be introduced to encourage new and existing buildings to be built and renovated to the highest standards. Building codes are being introduced in an increasing number of countries.
Indicator 1: Carbon intensity of buildings (kgCO2/m2) 2030: residential buildings 45–65 percent lower than 2015 levels; commercial buildings 65–75 percent lower than 2015 levels in select regions
2050: residential and commercial buildings 95–100 percent lower than 2015 levels
Figure 25 | Historical trends and required decline in the carbon intensity of residential buildings
Note: No data available for Indonesia.
Source: CAT (2020b).
0
10
20
30
40
50
60
70
80
2005 2010 2015 2020 2025 2030 2035 2040 2045 2050
kg C
O2/m
2
RESIDENTIAL
South AfricaUSA
WorldEuropean Union (28)
ChinaIndiaBrazil

WRI.org60
Decarbonization of the buildings sector is closely tied to decarbonizing the fuels used in buildings for lighting, heating, cooking, and cooling. A decarbonized power grid is thus a prerequisite for decarbonizing a building’s operations associated with electricity consumption. The carbon emissions of a building’s operations could also be reduced by meeting energy demand with on-site zero carbon or near-net-zero carbon renewable energy, such as solar thermal heating and geothermal heating, as well as an alternative low-carbon energy source (renewable or electric) for cooking, cooling, and heating.
Indicator 2: Energy intensity of buildings (kWh/m2) 2030: residential buildings 20–30 percent lower than 2015 levels; commercial buildings 10–30 percent lower than 2015 levels in select countries and regions
2050: residential buildings 20–60 percent lower than 2015 levels; commercial buildings 15–50 percent lower than 2015 levels in select countries and regions
The energy intensity of buildings is measured in kilowatt-hours per square meter (kWh/m2). It is thus a measure of the efficiency with which energy is used in buildings. Space cooling has become the fastest growing end use of energy in buildings, and the energy intensity of buildings in hot regions has been increasing due to greater cooling demand (GlobalABC et al. 2019). By comparison, globally, energy intensity has been improving in space heating and lighting, and has remained steady for water heating, cooking, and appliances (GlobalABC et al. 2019). Total energy consumption, however, has been on the rise as increased activities outpace efficiency gains (IEA 2020h).
Figures 27 and 28 show historical trends and projected declines in the energy intensity of residential and commercial buildings, respectively, that will be necessary to achieve the 2030 and 2050 targets.
Figure 26 | Historical trends and required declines in the carbon intensity of commercial buildings
Note: No data available for Indonesia.
Source: CAT (2020b).
kg C
O2/m
2
COMMERCIAL
0
20
40
60
80
100
120
140
160
180
2005 2010 2015 2020 2025 2030 2035 2040 2045 2050
South AfricaUSAWorldEuropean Union (28)ChinaIndiaBrazil

61State of Climate Action: Assessing Progress toward 2030 and 2050
Table 4 | Carbon intensity of residential buildings in 2015 and target reductions for 2030 and 2050 (kg CO2/m²)
COUNTRY2015a (KGCO2/M2)
2030 TARGET (% CHANGE FROM 2015 LEVELS)
2050 TARGET (% CHANGE FROM 2015 LEVELS)
HISTORICAL AVERAGE ANNUAL CHANGE, 2012–17 (KGCO2/M2)
AVERAGE ANNUAL CHANGE TARGET, 2015–30 (KGCO2/M2)
AVERAGE ANNUAL CHANGE TARGET, 2015–50 (KGCO2/M2)
Brazil 9 -50 -95 to -100 0.2 -0.3 -0.2 to -0.3
China 22 -60 -100 0.4 -0.9 -0.6
European Union (28) 36 -60 -100 -1.7 -1.4 -1.0
India 21 -45 to -55 -95 to -100 -0.1 -0.6 to -0.8 -0.6
Indonesia n.d. n.d. n.d. n.d. n.d. n.d.
South Africab 64 -50 -100 0 -2.1 -1.8
United States 46 -65 -100 -1.5 -2.0 -1.3
World 30c n.d. -95 n.d. n.d. -0.9c
Notes: Targets are framed as percentage reduction from 2015 levels. Percentage reduction needed values are rounded to closest 5 percent; ranges are derived from CAT scenarios representing different options for emissions reductions. No global target is established for 2030. The absolute values shown here carry high uncertainty and should be viewed with caution. n.d. indicates no data available from Climate Action Tracker.a Targets are defined as percentage reduction from 2015 levels. While 2017 historical data are available for most countries assessed, 2015 is chosen as the base year for
establishing targets in CAT (2020a).b 2005–15 percentage change is calculated for South Africa due to data availability.c Only 2017 historical data are available for World and are used in percentage change needed calculation.Source: CAT (2020a).

WRI.org62
Table 5 | Commercial buildings carbon intensity in 2015 and target reductions for 2030 and 2050 (kg CO2/m²)
COUNTRY
2015a
(KGCO2/M2)
2030 TARGET(% CHANGE FROM 2015 LEVELS)
2050 TARGET(% CHANGE FROM 2015 LEVELS)
HISTORICAL AVERAGE ANNUAL CHANGE, 2012–17 (KGCO2/M2)
AVERAGE ANNUAL CHANGE TARGET, 2015–30 (KGCO2/M2)
AVERAGE ANNUAL CHANGE TARGET, 2015–50 (KGCO2/M2)
Brazil 63 -75 -100 1.4 -3.2 -1.8
China 49 -65 -100 -1.1 -2.1 -1.4
European Union (28)
60 -75 -100 -2.4 -3.0 -1.7
India 38 -70 -100 -0.8 -1.8 -1.1
Indonesia n.d. n.d. n.d. n.d. n.d. n.d.
South Africa 130 -70 -100 -1.1b -6.1 -3.7
United States 113 -75 -100 -3.3 -5.7 -3.2
World 61c n.d. -100 n.d. n.d. -1.8c
Notes: Targets are framed as percentage reduction from 2015 levels. Percentage reduction needed values are rounded to closest 5 percent; ranges are derived from CAT scenarios representing different options for emissions reductions. No global target is established for 2030. The absolute values shown here carry high uncertainty and should be viewed with caution. n.d. indicates no data available from Climate Action Tracker.a Targets are defined as % reduction from 2015 levels. While 2017 historical data are available for most countries assessed, 2015 is chosen as the base year for establishing
targets in CAT (2020).b 2010–15 percentage change is calculated for South Africa due to data availability.c Only 2017 historical data are available for World and are used in percentage change needed calculation. No global target is established for 2030.Source: CAT (2020a).
The targets are established such that, with efficiency gains in all energy end uses in buildings—including space heating and cooling, water heating, lighting, cooking, and appliances—energy use per square meter will be cut almost by half in most regions in 2050 compared to 2015 levels. A global target for Figure 27 | Historical trends and required declines in the energy intensity of residential buildings
Source: CAT (2020b).
0
50
100
150
200
250
2005 2010 2015 2020 2025 2030 2035 2040 2045 2050
kWh/
m2
RESIDENTIAL
South AfricaUSA
European Union (28)
ChinaIndia
Brazil

63State of Climate Action: Assessing Progress toward 2030 and 2050
The targets are established such that, with efficiency gains in all energy end uses in buildings—including space heating and cooling, water heating, lighting, cooking, and appliances—energy use per square meter will be cut almost by half in most regions in 2050 compared to 2015 levels. A global target for
energy intensity has not been established given the wide variety in local climate conditions, which significantly affect energy demand. Tables 6 and 7 spell out how far we have to go.
Figure 27 | Historical trends and required declines in the energy intensity of residential buildings
Source: CAT (2020b).
0
50
100
150
200
250
2005 2010 2015 2020 2025 2030 2035 2040 2045 2050
kWh/
m2
RESIDENTIAL
South AfricaUSA
European Union (28)
ChinaIndia
Brazil
Figure 28 | Historic trends and required declines in the energy intensity of commercial buildings
Source: CAT (2020b).
kWh/
m2
0
50
100
150
200
250
300
350
400
2005 2010 2015 2020 2025 2030 2035 2040 2045 2050
South Africa
USA
European Union (28)
ChinaIndia
Brazil
COMMERCIAL
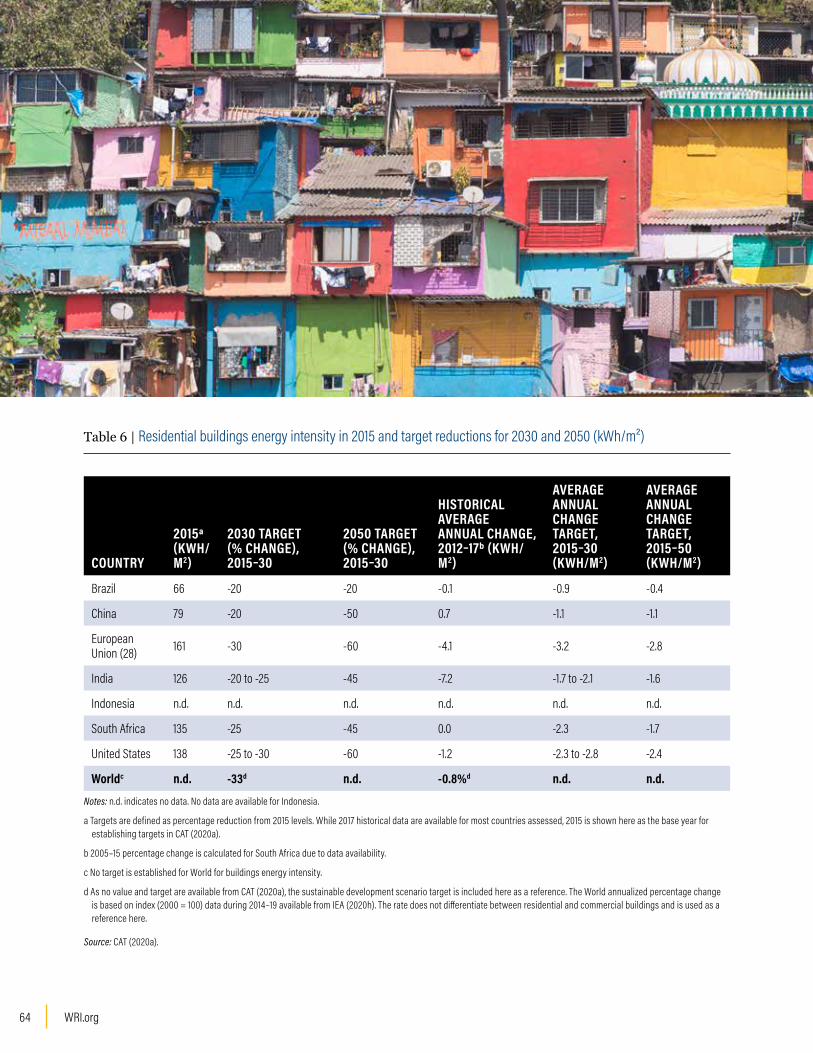
WRI.org64
Table 6 | Residential buildings energy intensity in 2015 and target reductions for 2030 and 2050 (kWh/m²)
COUNTRY
2015a
(KWH/M2)
2030 TARGET(% CHANGE), 2015–30
2050 TARGET(% CHANGE), 2015–30
HISTORICAL AVERAGE ANNUAL CHANGE, 2012–17b (KWH/M2)
AVERAGE ANNUAL CHANGE TARGET, 2015–30 (KWH/M2)
AVERAGE ANNUAL CHANGE TARGET, 2015–50 (KWH/M2)
Brazil 66 -20 -20 -0.1 -0.9 -0.4
China 79 -20 -50 0.7 -1.1 -1.1
European Union (28) 161 -30 -60 -4.1 -3.2 -2.8
India 126 -20 to -25 -45 -7.2 -1.7 to -2.1 -1.6
Indonesia n.d. n.d. n.d. n.d. n.d. n.d.
South Africa 135 -25 -45 0.0 -2.3 -1.7
United States 138 -25 to -30 -60 -1.2 -2.3 to -2.8 -2.4
Worldc n.d. -33d n.d. -0.8%d n.d. n.d.
Notes: n.d. indicates no data. No data are available for Indonesia.
a Targets are defined as percentage reduction from 2015 levels. While 2017 historical data are available for most countries assessed, 2015 is shown here as the base year for establishing targets in CAT (2020a).
b 2005–15 percentage change is calculated for South Africa due to data availability.
c No target is established for World for buildings energy intensity.
d As no value and target are available from CAT (2020a), the sustainable development scenario target is included here as a reference. The World annualized percentage change is based on index (2000 = 100) data during 2014–19 available from IEA (2020h). The rate does not differentiate between residential and commercial buildings and is used as a reference here.
Source: CAT (2020a).
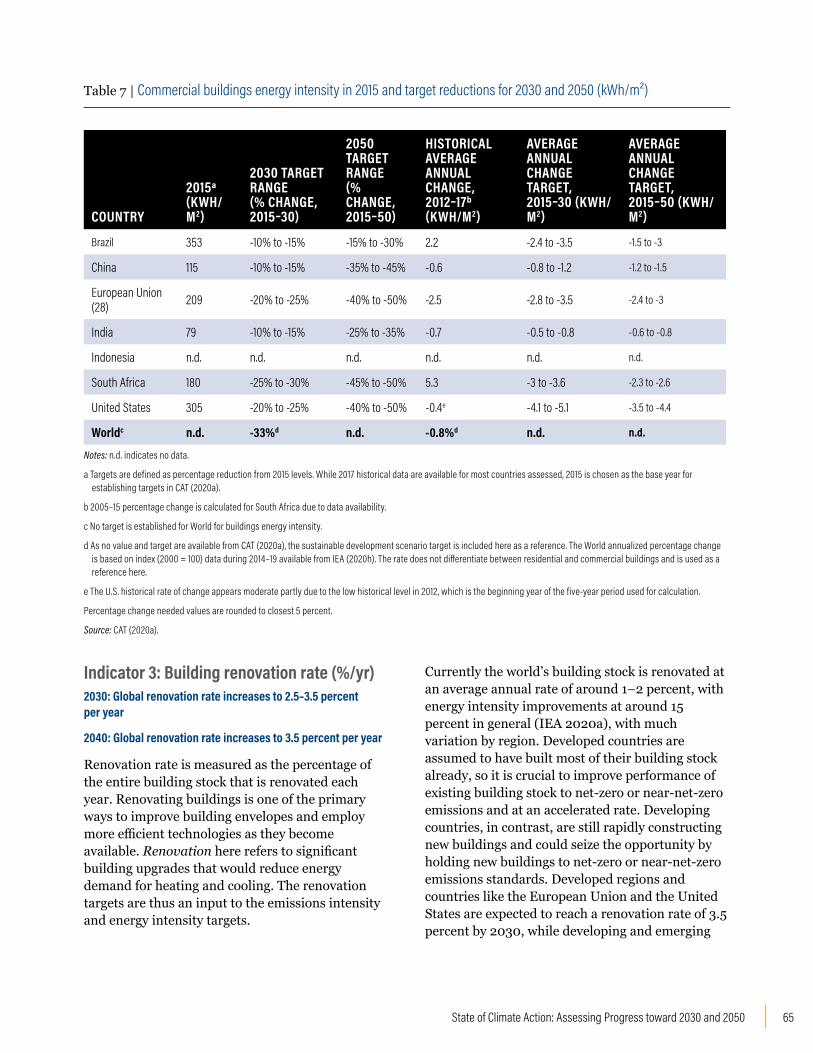
65State of Climate Action: Assessing Progress toward 2030 and 2050
Table 7 | Commercial buildings energy intensity in 2015 and target reductions for 2030 and 2050 (kWh/m²)
COUNTRY
2015a (KWH/M2)
2030 TARGET RANGE(% CHANGE, 2015–30)
2050 TARGET RANGE(% CHANGE, 2015–50)
HISTORICAL AVERAGE ANNUAL CHANGE, 2012–17b(KWH/M2)
AVERAGE ANNUAL CHANGE TARGET, 2015–30 (KWH/M2)
AVERAGE ANNUAL CHANGE TARGET, 2015–50 (KWH/M2)
Brazil 353 -10% to -15% -15% to -30% 2.2 -2.4 to -3.5 -1.5 to -3
China 115 -10% to -15% -35% to -45% -0.6 -0.8 to -1.2 -1.2 to -1.5
European Union (28) 209 -20% to -25% -40% to -50% -2.5 -2.8 to -3.5 -2.4 to -3
India 79 -10% to -15% -25% to -35% -0.7 -0.5 to -0.8 -0.6 to -0.8
Indonesia n.d. n.d. n.d. n.d. n.d. n.d.
South Africa 180 -25% to -30% -45% to -50% 5.3 -3 to -3.6 -2.3 to -2.6
United States 305 -20% to -25% -40% to -50% -0.4e -4.1 to -5.1 -3.5 to -4.4
Worldc n.d. -33%d n.d. -0.8%d n.d. n.d.
Notes: n.d. indicates no data.
a Targets are defined as percentage reduction from 2015 levels. While 2017 historical data are available for most countries assessed, 2015 is chosen as the base year for establishing targets in CAT (2020a).
b 2005–15 percentage change is calculated for South Africa due to data availability.
c No target is established for World for buildings energy intensity.
d As no value and target are available from CAT (2020a), the sustainable development scenario target is included here as a reference. The World annualized percentage change is based on index (2000 = 100) data during 2014–19 available from IEA (2020h). The rate does not differentiate between residential and commercial buildings and is used as a reference here.
e The U.S. historical rate of change appears moderate partly due to the low historical level in 2012, which is the beginning year of the five-year period used for calculation.
Percentage change needed values are rounded to closest 5 percent.
Source: CAT (2020a).
Indicator 3: Building renovation rate (%/yr) 2030: Global renovation rate increases to 2.5–3.5 percent per year
2040: Global renovation rate increases to 3.5 percent per year
Renovation rate is measured as the percentage of the entire building stock that is renovated each year. Renovating buildings is one of the primary ways to improve building envelopes and employ more efficient technologies as they become available. Renovation here refers to significant building upgrades that would reduce energy demand for heating and cooling. The renovation targets are thus an input to the emissions intensity and energy intensity targets.
Currently the world’s building stock is renovated at an average annual rate of around 1–2 percent, with energy intensity improvements at around 15 percent in general (IEA 2020a), with much variation by region. Developed countries are assumed to have built most of their building stock already, so it is crucial to improve performance of existing building stock to net-zero or near-net-zero emissions and at an accelerated rate. Developing countries, in contrast, are still rapidly constructing new buildings and could seize the opportunity by holding new buildings to net-zero or near-net-zero emissions standards. Developed regions and countries like the European Union and the United States are expected to reach a renovation rate of 3.5 percent by 2030, while developing and emerging

WRI.org66
economies including Brazil, China, India, and South Africa are expected to increase their renovation rate to 2.5 percent in 2030, and 3.5 percent in 2040 (Table 8). Note that no target rates are established for 2050 because, if targets for 2030 and 2040 are achieved, renovation should be completed by 2050.
Table 8 | Historical and target renovation rates for residential and commercial buildings
RENOVATION RATE (PER YEAR)
Country/Region
Historical (Estimated World Average, %)
2030 Target (%)
2040 Target (%)
Brazil
1 to 2a
2.5 3.5
China 2.5 3.5
European Union (28) 3.5 3.5
India 2.5 3.5
South Africa 2.5 3.5
United States 3.5 3.5
World 2.5 to 3.5 3.5
Notes: a The IEA estimates that the typical energy renovation rate is 1–2 percent for building stock per year, with less than 15 percent energy intensity reduction in general, while deep renovation of 30–50 percent energy intensity reduction is what’s needed for a sustainable development scenario. No country-level historical data are available for this indicator. Target values are rounded to the nearest 0.5 percent.
Source: CAT (2020a). Historical estimate: IEA (2020a).
The industry sector accounts for more than half of end-use energy consumption globally, followed by transport and buildings (EIA 2019). It is also projected to see the most growth between 2018 and 2050 compared with the other two sectors (Figure 29).
Figure 29 | World end-use energy consumption by sector, 2010–50
Source: EIA (2019).
INDUSTRY
Carbon intensity of cement production (kgCO2/t)
▪ 2030: 40 percent lower than 2015 levels
▪ 2050: 85–90 percent lower than 2015 levels, aspirational target to reach 100 percent
Carbon intensity of steel production (kgCO2/t)
▪ 2030: 25–30 percent lower than 2015 levels
▪ 2050: 95–100 percent lower than 2015 levels
Share of electricity in final energy use in industry (%)
▪ 2030: 35 percent
▪ 2050: 50–55 percentNote: Indicators and targets were developed by the CAT consortium to align with the transformation needed in the power sector to align with a 1.5°C pathway; see CAT (2020b) for more information.
0
50
100
150
200
250
300
350
2010 2015 2020 2025 2030 2035 2040 2045 2050
Industry
Transport
Buildings(residential)Buildings(commercial)Qu
adril
lion
Britis
h Th
erm
al Un
its

67State of Climate Action: Assessing Progress toward 2030 and 2050
Heavy industries such as iron and steel, cement, and chemicals production contribute more than 65 percent of direct CO2 emissions from the industry sector (IEA 2020e). Heavy industry remains hard to decarbonize—due to factors including the need for very high heat, emissions inherent in some of the chemical conversion processes, and long facility lifetimes with high capital expenditure needed for upgrades—although this is not unachievable (Energy Transitions Commission 2018).
Switching to less carbon-intensive processes for energy-intensive industries can improve material efficiency and energy efficiency, bringing economic benefits in addition to the environmental and social benefits brought through reduced emissions.
Less energy-intensive manufacturing and nonmanufacturing subsectors, which account for around half of energy consumption by the industrial sector, are not set with individual carbon intensity targets here. Service industries are not discussed here.
Indicator 1: Carbon intensity of cement production (kgCO2/t) 2030: 40 percent lower than 2015 levels
2050: 85–91 percent lower than 2015 levels, aspirational target to reach 100 percent reduction
The carbon intensity of cement production is measured as kilograms of carbon dioxide emitted per tonne of cement produced (kgCO2/t). Global demand for cement is likely to continue growing through 2050, especially in developing countries, where most urbanization and infrastructure expansion is expected in the coming decades. Emissions intensity has been relatively stable over the past few years (Figure 30), but drastic reductions are required to decarbonize the cement production process.
Cement emissions are considered hard to abate because more than half are process emissions that are inherent in the chemical conversion of raw materials to clinker, the main ingredient in cement. The remaining emissions come from the energy needed to power that calcining process. The primary options to reduce process emissions in cement production are carbon capture and storage (CCS), clinker substitution, or fundamentally altering the chemistry of cement, which is not yet widely practiced (IEA and CSI 2018). Clinker substitution can only go so far. Therefore, while the potential of CCS is uncertain, it presents one of the more promising emissions reduction strategies for conventional Portland cement.
Figure 30 | Carbon intensity of cement production, 2012–17
Sources: CAT (2020a). China: Wei and Cen (2019); other countries: WBCSD (2016).
0
100
200
300
400
500
600
700
800
900
2012 2013 2014 2015 2016 2017
KgCO
2/t C
emen
t
South Africa
USA
World
European Union (28)China
IndiaBrazil
Indonesia

WRI.org68
Ranges in the target for each country mainly reflect various levels of application. In the longer term, there are many different types of novel cement in development; some in production use fundamentally different chemistries that reduce both process and thermal emissions. Accelerating the deployment of these would likely be critical to meeting the targets. Other approaches can be used to reduce energy-related emissions, including improving energy efficiency and switching to alternative fuels like hydrogen.
Additional efforts on the demand side, like increasing the recycling of concrete, reducing overuse in construction, incentivizing longer-lived buildings, or replacing concrete with materials like mass timber, may not reduce emissions intensity but would reduce the overall production and total emissions.
If we are to get on a pathway compatible with the Paris Agreement, the carbon intensity of cement production needs to be significantly reduced to 360–80 kgCO2/t of cement produced in 2030, and 55–90 kg/CO2/t of product in 2050, compared to current levels of around 615 kgCO2/t of cement produced (Figure 31). Table 9 shows in detail how far we have to go.
Figure 31 | Carbon intensity of cement production in 2017 and targets for 2030 and 2050
Source: CAT (2020a).
0
100
200
300
400
500
600
700
800
Brazil China EU28 India Indonesia South Africa USA World
KgCO
2/t C
emen
t Pro
duce
d
201720302030 max20502050 max

69State of Climate Action: Assessing Progress toward 2030 and 2050
Table 9 | Carbon intensity of cement production in 2017 and targets for 2030 and 2050 (kgCO2/t)
COUNTRY 2017
2030 TARGET RANGE (% CHANGE FROM 2015 LEVELS)
2050 TARGET RANGE (% CHANGE FROM 2015 LEVELS)
HISTORICAL AVERAGE ANNUAL CHANGE, 2012–17b
AVERAGE ANNUAL CHANGE TARGET, 2017–30
AVERAGE ANNUAL CHANGE TARGET, 2017–50
Brazil 585 410 to 420 (-28% to -30%)
60 to 95 (-84% to -90%) 5 -12.7 to -13.4 -14.8 to -15.9
Chinaa 550 395 to 405 (-26% to -28%)
60 to 90 (-84% to -89%) -13 -11.1 to -11.9 -13.9 to -14.8
European Union (28) 559 355 to 365
(-35% to -36%)60 to 95 (-83% to -89%) -3 -14.9 to -15.7 -14.1 to -15.1
India 569 350 to 355 (-38% to -38%)
60 to 100 (-84% to -90%) -2 -16.5 to -16.8 -14.2 to -15.4
Indonesia 654 400 to 410 (-37% to -39%)
60 to 95 (-85% to -91%)
-2 -18.8 to -19.5 -16.9 to -18
South Africa 633 335 to 345 (-45% to -47%)
55 to 90 (-86% to -91%) 2 -22.2 to -22.9 -16.5 to -17.5
United States 731 380 to 390 (-47% to -48%)
55 to 90 (-86% to-92%) 5 -26.2 to -27 -19.4 to -20.5
World 614 360 to 370 (-40% to -41%)
55 to 90 (-85% to -91%) 0 -18.8 to -19.5 -15.9 to -17
Notes:
a The latest available historical data for China are from 2015.
b Historical trend data are available only for 2012–17.
Source: CAT (2020a).
Indicator 2: Carbon intensity of steel production (kgCO2/t) 2030: 25–30 percent lower than 2015 levels
2050: 95–100 percent lower than 2015 levels
The carbon intensity of steel production is measured as kilograms of carbon dioxide emitted per tonne of steel produced (kgCO2/t). Iron and steel production is the second-largest emitter (25 percent) in the industrial sector (IEA 2020e), contributing around 8 percent of global CO2
emissions (Hoffmann et al. 2020). A wide range of technologies could be considered to decarbonize the steel subsector, and the only way to deliver net-zero emissions will be through a combination of approaches. An aspirational target of 100 percent
emissions carbon intensity reduction by 2050 is set for all countries, which could be achieved with innovative technologies and developments currently being researched.
In recent years, the carbon intensity of steel production has been improving slightly in key countries except Brazil (Figure 32). Most progress has been achieved through energy efficiency improvements, but opportunities for further improvements in that area are limited. On the supply side, innovative technology, adoption of low-carbon fuel, and CCS are needed, while improvement of material efficiency as well as substitution of other materials like mass timber for steel, where possible, could help reduce demand.

WRI.org70
Steel can be produced in two main ways: through a blast furnace (BF)/basic oxygen furnace (BOF) or an electric arc furnace (EAF). The BF/BOF uses iron ore as an input and depends on the use of coal to produce steel from the iron ore, while the EAF uses primarily recycled steel and direct reduced iron (though the BF/BOF process can use up to 30 percent recycled steel). Globally, around 70 percent of steel is produced using BF/BOF and the remaining 30 percent with EAF (World Steel Association 2019).
Increasing the share of scrap-based EAFs can help reduce emissions, but EAF-produced steel may not be of sufficient quality for some end uses, where BF/BOF is generally used. Increasing the share of EAF also depends on a decarbonized grid to supply low-carbon electricity and the availability of high-quality scrap steel.
In addition to increasing the use of recycled scrap steel, two technology routes for BF/BOF are considered when setting targets for the steel sector;
the ranges in the targets represent the impacts of following these different routes. One route assumes the phaseout of BF/BOF by 2050 and smelt reduction technology built with CCS by 2050; the other route assumes that the BF/BOF steel production route does not phase out till 2070, and CCS technology is applied to those BF/BOF plants (CAT 2020a).
For a pathway compatible with the Paris Agreement, the carbon intensity of global steel production needs to reach 1,335–50 kg CO2 per tonne of steel produced in 2030, and 0–130 kg CO2
per tonne of steel produced in 2050 (Figure 33). National targets are established for Chinese and U.S. steel production to reach nearly 100 percent decarbonization in 2050, while targets for countries with lower scrap availability, such as South Africa and Indonesia, are less stringent since this is the highest prioritized decarbonization technology considered in the modeling. Table 10 spells out how far we have to go.
Figure 32 | Carbon intensity of steel production, 2005–19
Note: South Africa, Indonesia, and World only have single-year data points available.
Source: CAT (2020a).
0
500
1,000
1,500
2,000
2,500
3,000
2004 2006 2008 2010 2012 2014 2016 2018 2020
KgCO
2/t St
eel P
rodu
ced
South AfricaUSAWorldEuropean Union 28
ChinaIndiaBrazilIndonesia
Figure 33 | Carbon intensity of steel production in 2018 and targets for 2030 and 2050
Notes: Shaded areas indicate ranges.For Indonesia and South Africa, the most recent available historical data are from 2016. Source: CAT (2020a).
0
500
1,000
1,500
2,000
2,500
China EU28 India USA Brazil Indonesia South Africa World
KgCO
2/t St
eel P
rodu
ced
201820302030 range2050 range

71State of Climate Action: Assessing Progress toward 2030 and 2050
the ranges in the targets represent the impacts of following these different routes. One route assumes the phaseout of BF/BOF by 2050 and smelt reduction technology built with CCS by 2050; the other route assumes that the BF/BOF steel production route does not phase out till 2070, and CCS technology is applied to those BF/BOF plants (CAT 2020a).
For a pathway compatible with the Paris Agreement, the carbon intensity of global steel production needs to reach 1,335–50 kg CO2 per tonne of steel produced in 2030, and 0–130 kg CO2
per tonne of steel produced in 2050 (Figure 33). National targets are established for Chinese and U.S. steel production to reach nearly 100 percent decarbonization in 2050, while targets for countries with lower scrap availability, such as South Africa and Indonesia, are less stringent since this is the highest prioritized decarbonization technology considered in the modeling. Table 10 spells out how far we have to go.
Figure 33 | Carbon intensity of steel production in 2018 and targets for 2030 and 2050
Notes: Shaded areas indicate ranges.For Indonesia and South Africa, the most recent available historical data are from 2016. Source: CAT (2020a).
0
500
1,000
1,500
2,000
2,500
China EU28 India USA Brazil Indonesia South Africa World
KgCO
2/t St
eel P
rodu
ced
201820302030 range2050 range
Table 10 | Carbon intensity of steel production in 2018 and targets for 2030 and 2050 (kg CO2/t)
COUNTRY 2018
2030 TARGET RANGE c (% CHANGE FROM 2015 LEVELS)
2050 TARGET RANGEc (% CHANGE FROM 2015 LEVELS)
HISTORICAL AVERAGE ANNUAL CHANGE, 2013–18
AVERAGE ANNUAL CHANGE TARGET, 2018–30
AVERAGE ANNUAL CHANGE TARGET, 2018–50b
Brazil 1,436 1,305 to 1,390 (-3% to -9%) 0 to 195 (-86% to -100%) 12 -3.8 to -10.9 -38.8 to -44.9
China 1,856 1,290 to 1,335 (-28% to -30%) 0 to 100 (-95% to -100%) -37 -43.4 to -47.2 -54.9 to -58
European Union (28) 1,178 680 to 700
(-41% to -42%) 0 to 75 (-94% to -100%) -29 -39.8 to -41.5 -34.5 to -36.8
India 2,285 1,280 to 1,295 (-43% to -44%) 0 to 155 (-93% to -100%) -25 -82.5 to -83.8 -66.6 to -71.4
Indonesia 1,656a 1,585 to 1,600 (-3% to -4%) 0 to 190 (-89% to -100%) n.d. -4.7 to -5.9 -45.8 to -51.8
South Africa 2,295a 1,620 to 1,630 (-29% to -29%) 0 to 215 (-91% to -100%) n.d. -55.4 to -56.3 -65 to -71.7
United States 1,142 930 to 945
(-17% to -19%) 0 to 70 (-94% to -100%) -27 -16.4 to -17.7 -33.5 to -35.7
World 1,850 1,335 to 1,350 (-27% to -28%) 0 to 130 (-93% to -100%) n.d. -41.6 to -42.9 -53.8 to -57.8
Notes: n.d. indicates no data.
a For Indonesia and South Africa, the most recent available historical data are from 2016; no complete time-series data are available to calculate historical average annual change.
b An aspirational target of 100 percent emissions intensity reduction by 2050 is set for all countries. This may be achieved with innovative technologies and developments currently being researched.
c Targets for steel are expressed to the nearest 5 percent to reflect the accuracy and leeway in the underlying analysis.Source: CAT (2020a).

WRI.org72
Indicator 3: Share of electricity in final energy use in industry (%) 2030: Increase to 35 percent from 27 percent in 2017 globally
2050: Increase to 50–55 percent globally
The electrification of industry is measured as the percentage of final energy demand in industry that is met by electricity and considers all industry, not just cement and steel. Fossil fuels still provide the majority of energy for the industrial sector globally, but electricity provides one option for decarbonization if the grid uses low-carbon generation sources. Of the total energy consumed by the industrial sector, 35 percent takes the form of fuels used for feedstock, 44 percent is fuel consumed for energy, and 20 percent is consumed as electricity, which is used mostly to drive machines such as pumps, robotic arms, and conveyor belts (Roelofsen et al. 2020).
Fossil fuels are used to provide the high-temperature heat that is essential in many industrial processes; for example, production of metal, chemicals, and cement, where heat demand
ranges from 400°C to more than 1,400°C. The higher temperatures are not easily provided by electricity using commercially available technologies. Alternative fuels like green hydrogen (produced through electrolysis of water powered by renewable energy) could play a role in the longer term, with the largest potential reductions when paired with EAF technology (Hoffmann et al. 2020). Emerging research is also focused on the potential of using solar concentrating mirrors to achieve high heat.
A range of electrification pathways compatible with achieving the goals of the Paris Agreement are presented in Figure 34, recognizing that 100 percent electrification cannot be achieved anywhere and that the cement sector is inherently difficult to electrify (CAT 2020b). The electrification rate targets vary among countries, according to different national circumstances. China, the European Union, and the United States have high availability of scrap metal for steel production. Given the high use of electricity in the steel recycling process, their upper bound targets are higher. Table 11 spells out how far we have to go.
Figure 34 | Share of electricity in industrial energy use (%)
Source: CAT (2020a).
20500
20
40
60
80
100
1990 2000 2010 2020 2030 2040
India (%)
0
20
40
60
80
100
1990 2000 2010 2020 2030 2040 2050
United States (%)
0
20
40
60
80
100
1990 2000 2010 2020 2030 2040 2050
World (%)
0
20
40
60
80
100Brazil (%)
1990 2000 2010 2020 2030 2040 20500
20
40
60
80
100China (%)
1990 2000 2010 2020 2030 2040 20500
20
40
60
80
100European Union (%)
1990 2000 2010 2020 2030 2040 20500
20
40
60
80
100
1990 2000 2010 2020 2030 2040 2050
Indonesia (%)
0
20
40
60
80
100
1990 2000 2010 2020 2030 2040 2050
South Africa (%)

73State of Climate Action: Assessing Progress toward 2030 and 2050
Table 11 | Share of electricity in industry sector final energy demand in 2017 and targets for 2030 and 2050 (%)
COUNTRY 2017
2030 TARGET RANGE
2050 TARGET RANGE
HISTORICAL AVERAGE ANNUAL CHANGE, 2010–17
AVERAGE ANNUAL CHANGE TARGET, 2017–30
AVERAGE ANNUAL CHANGE TARGET, 2017–50
Brazil 22 30 to 35 50 to 60 -0.03 0.6 to 1.0 0.9 to 1.2
China 30 45 to 55 60 to 85 1.16 1.2 to 1.9 0.9 to 1.7
European Union (28) 34 40 to 60 45 to 75 0.18 0.5 to 2.0 0.3 to 1.2
India 20 35 to 40 45 to 55 0.32 1.2 to 1.5 0.8 to 1.1
Indonesia 14 20 to 35 25 to 50 0.40 0.5 to 1.6 0.3 to 1.1
South Africa 42 45 to 60 55 to 75 -0.05 0.2 to 1.4 0.4 to 1.0
United States 26 35 to 50 55 to 70 -0.10 0.7 to 1.9 0.9 to 1.3
World 27 35 50 to 55 0.44 0.6 0.7 to 0.8
Global acceleration needed
1.4x to 2030 1.8x to 2050
Note: Acceleration factors are averaged where the targets include a range.
Source: CAT (2020a).
Decarbonizing the industry sector through electrification can only be achieved with concurrent decarbonization of the power grid. Electric equipment for industrial heating in general brings only slight efficiency benefits compared to fossil fuel–based options. Thus, achieving the power sector targets is a prerequisite for achieving carbon emissions reductions by electrifying industrial processes.
TRANSPORT
Share of electric vehicles (EVs) in the total light-duty vehicle fleet
▪ 2030: reach 20–40 percent ▪ 2050: reach 85–100 percent
Share of EVs in annual new car sales
▪ 2030: reach 75–95 percent ▪ 2050: reach 100 percent
Emissions per passenger kilometer traveled
▪ 2030: reduce by 55 percent compared to 2014 levels ▪ 2050: reach near zero
Share of low-emissions fuels in transport sector final energy demand
▪ 2030: reach 15 percent ▪ 2050: reach 70–95 percent
Note: Indicators and targets were developed by the CAT consortium to align with the transformation needed in the power sector to align with a 1.5°C pathway; see CAT (2020b) for more information.

WRI.org74
The transport sector is the second-fastest-growing source of GHG emissions after industry. Globally it accounts for almost one-quarter of the world’s total CO2 emissions from the burning of fossil fuels (IEA 2018). Emissions from the sector are expected to continue growing at a faster rate than most other sectors, posing a major challenge to reducing emissions and meeting the temperature goals of the Paris Agreement.
Transitioning to a more sustainable and decarbonized transport sector will require a combination of measures, including managing travel demand and encouraging behavior change to more efficient travel modes such as public transit, fuel switching to electricity and other low-carbon fuels, more stringent vehicle emissions and efficiency standards, better city planning, and more. In addition to emissions reductions and improved air quality, a more sustainable transport sector can also mean better road safety, reduced congestion, and more livable urban conditions overall. Following CAT (2020b), this section focuses on electric vehicles and low-emissions fuels.
Indicator 1: Share of EVs in total light-duty vehicle fleet (%)2030: 20–40 percent globally
2050: 85–100 percent globally
The indicator covers light-duty vehicles (passenger cars) only; share is defined as the percentage of electric light-duty vehicles (LDVs) in the overall LDV fleet. It refers only to battery electric vehicles (BEVs) and excludes plug-in hybrid electric vehicles (PHEVs). It is important to note that the uptake of EVs needs to be accompanied by the decarbonization of the power grid to achieve emissions reductions.
Deployment of EVs is one of the most important measures to reduce emissions from the transport sector. Both Indicators 1 and 2 in this section look at the uptake of electric vehicles in passenger cars. The indicators are limited in that EV adoption provides only a partial solution to decarbonizing the transport sector. The indicators and targets set here provide a possible pathway toward a future compatible with the Paris temperature goal, based on available technology. However, achieving this goal will take behavior change: reducing traffic demand, promoting public transit and low-carbon modes of travel, improving technologies and fuels, and equitably allocating public investment both to meet the growing travel demand and to address the impacts of climate change. We also acknowledge that scaling up EVs comes with challenges related to extraction of raw materials and that environmental and social harm from these activities should be minimized.
Figure 35 | Global battery electric vehicle stock (thousand vehicles)
Note: This covers only battery electric vehicles.
Source: IEA (2020d).
0
1,000
2,000
3,000
4,000
5,000
6,000
2005 2006 2007 2008 2009 2010 2011 2012 2013 2014 2015 2016 2017 2018 2019
Batte
ry el
ectri
c car
stoc
k (th
ousa
nd ve
hicle
s)
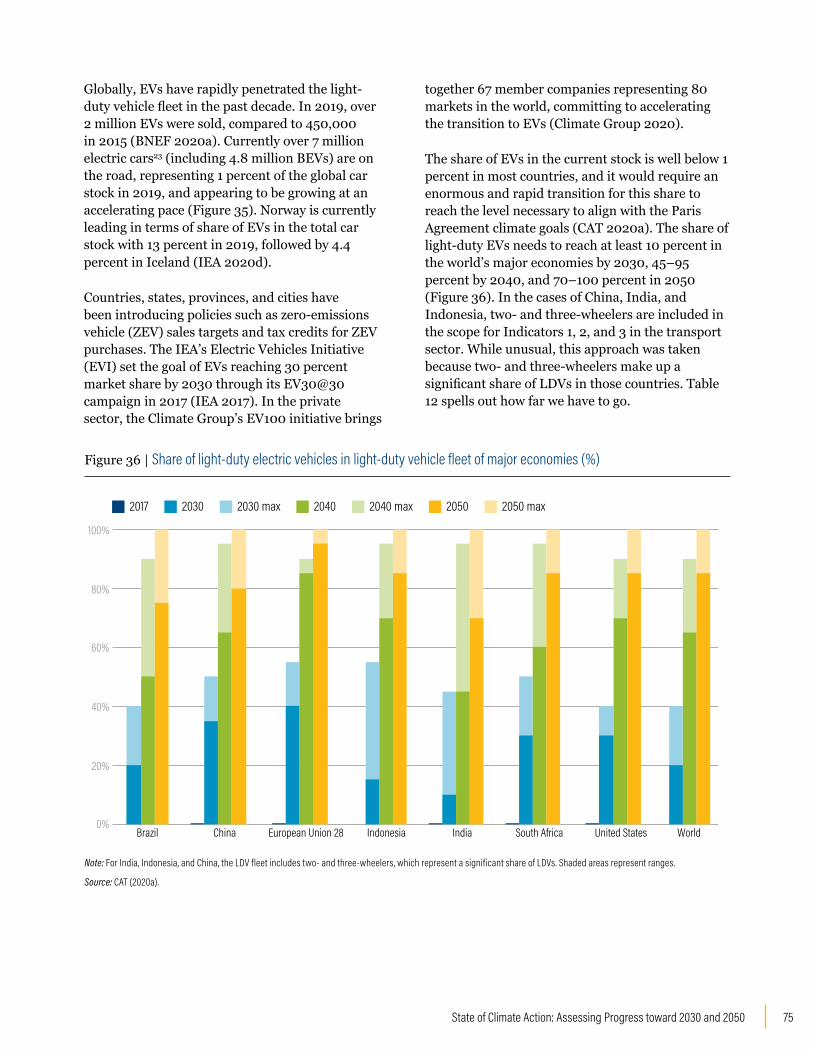
75State of Climate Action: Assessing Progress toward 2030 and 2050
Globally, EVs have rapidly penetrated the light-duty vehicle fleet in the past decade. In 2019, over 2 million EVs were sold, compared to 450,000 in 2015 (BNEF 2020a). Currently over 7 million electric cars23 (including 4.8 million BEVs) are on the road, representing 1 percent of the global car stock in 2019, and appearing to be growing at an accelerating pace (Figure 35). Norway is currently leading in terms of share of EVs in the total car stock with 13 percent in 2019, followed by 4.4 percent in Iceland (IEA 2020d).
Countries, states, provinces, and cities have been introducing policies such as zero-emissions vehicle (ZEV) sales targets and tax credits for ZEV purchases. The IEA’s Electric Vehicles Initiative (EVI) set the goal of EVs reaching 30 percent market share by 2030 through its EV30@30 campaign in 2017 (IEA 2017). In the private sector, the Climate Group’s EV100 initiative brings
together 67 member companies representing 80 markets in the world, committing to accelerating the transition to EVs (Climate Group 2020).
The share of EVs in the current stock is well below 1 percent in most countries, and it would require an enormous and rapid transition for this share to reach the level necessary to align with the Paris Agreement climate goals (CAT 2020a). The share of light-duty EVs needs to reach at least 10 percent in the world’s major economies by 2030, 45–95 percent by 2040, and 70–100 percent in 2050 (Figure 36). In the cases of China, India, and Indonesia, two- and three-wheelers are included in the scope for Indicators 1, 2, and 3 in the transport sector. While unusual, this approach was taken because two- and three-wheelers make up a significant share of LDVs in those countries. Table 12 spells out how far we have to go.
Figure 36 | Share of light-duty electric vehicles in light-duty vehicle fleet of major economies (%)
Note: For India, Indonesia, and China, the LDV fleet includes two- and three-wheelers, which represent a significant share of LDVs. Shaded areas represent ranges.
Source: CAT (2020a).
0%
20%
40%
60%
80%
100%
WorldEuropean Union 28Brazil Indonesia IndiaChina United StatesSouth Africa
2017 2030 2030 max 2050 2050 max2040 2040 max

WRI.org76
Table 12 | Share of light-duty electric vehicles in total light-duty vehicle fleet (%)
COUNTRY 2017
2030 TARGET RANGE
2050 TARGET RANGE
HISTORICAL AVERAGE ANNUAL CHANGEC
AVERAGE ANNUAL CHANGE TARGET, 2017–30
AVERAGE ANNUAL CHANGE TARGET, 2017–50
Brazil 0.0b 20 to 40 75 to 100 n.d. 1.5 to 3.1 2.3 to 3.0
Chinaa 0.17 35 to 50 80 to 100 n.d. 2.7 to 3.8 2.4 to 3.0
European Union (28) 0.29 40 to 55 95 to 100 n.d. 3.1 to 4.2 2.9 to 3.0
Indiaa 0.06 15 to 55 85 to 100 n.d. 1.2 to 4.2 2.6 to 3.0
Indonesiaa 0.0b 10 to 45 70 to 100 n.d. 0.8 to 3.5 2.1 to 3.0
South Africa 0.02 30 to 50 85 to 100 n.d. 2.3 to 3.8 2.6 to 3.0
United States 0.31 30 to 40 85 to 100 n.d. 2.3 to 3.1 2.6 to 3.0
World 0.8d 20 to 40 85 to 100 0.1d 1.5 to 3.0 2.6 to 3.0
Global acceleration needed
22x to 2030 28x to 2050
Notes: n.d. indicates no data.
a Two- and three-wheelers included.
b 2010 data shown for Brazil; 2015 data shown for Indonesia.
c Historical rate of change is not calculated here since the base level is 0.
d 2019 numbers based on IEA (2020d) as a proxy for historical level globally. Historical average annual change is calculated for 2014–19. Both BEVs and PHEVs are covered here.
Acceleration factors are averaged where the targets include a range.
Source: CAT (2020a).
Indicator 2: Share of EVs in annual new car sales (%)2030: 75–95 percent globally
2050: 100 percent globally
This indicator covers light-duty vehicles (passenger cars) only; share is defined as the market share (percentage) of electric light-duty vehicles (LDVs) in total light-duty vehicle sales. EV here refers only to battery electric vehicles (BEVs) and excludes plug-in hybrid electric vehicles (PHEVs). The indicator does not discuss the utilization rate of EVs once purchased. The estimated effect of EVs in reducing emissions from the transport sector is discussed in Indicator 3 below.
To decarbonize transportation, all new passenger vehicles will need to be zero-carbon vehicles. In 2017, the share of EVs in new car sales was still quite small, around 1 percent in the United States and European Union, and much lower in other countries (CAT 2020a). In 2019, 2.6 percent of the cars sold worldwide were electric,24 and Norway has the highest market share of EVs, at 56 percent. Twenty countries reached EV market shares above 1 percent (IEA 2020c). The targets aligned with a 1.5°C temperature pathway indicate that EVs should make up at least 45 percent of new cars sold in 2030, more than 85 percent in 2040, and nearly 100 percent globally in 2050 (Figure 37). Table 13 spells out how far we have to go.

77State of Climate Action: Assessing Progress toward 2030 and 2050
Figure 37 | Target shares of electric vehicles in new car sales, 2030, 2040, and 2050 (%)
Notes: Shaded areas represent target ranges. In the case of China, India, and Indonesia, the percentage also includes two-wheelers and three-wheelers. Acceleration factors are averaged where the targets include a range.Source: CAT (2020a).
Table 13 | Share of electric vehicles in new car sales in 2017 and targets for 2030 and 2050 (%)
COUNTRY 2017
2030 TARGET (RANGE)
2050 TARGET (RANGE)
HISTORICAL AVERAGE ANNUAL CHANGE
AVERAGE ANNUAL CHANGE TARGET, 2017–30 (RANGE)
AVERAGE ANNUAL CHANGE TARGET, 2017–50 (RANGE)
Brazil 0.02 45 to 95 95 to 100 n.d. 3.5 to 7.3 2.9 to 3.0
Chinaa 0.54 95 to 100 100 n.d. 7.3 to 7.7 3.0
European Union (28) 1.0 95 to 100 100 n.d. 7.2 to 7.6 3.0
Indiaa 0.06 80 to 95 100 n.d. 6.1 to 7.3 3.0
Indonesiaa 0.0b 95 100 n.d. 7.3 3.0
South Africa 0.1 50 to 95 100 n.d. 3.8 to 7.3 3.0
United States 1.1 95 to 100 100 n.d. 7.2 to 7.6 3.0
World 2.6c 75 to 95 100 0.6c 6.6 to 8.4 3.1
Global acceleration needed
12x to 2030 5.2x to 2050
Notes: n.d. indicates no data.a Two- and three-wheelers included.b 2015 data shown for Indonesia.c 2019 numbers based on IEA (2020d) as a proxy for historical level and rate of change. Both battery electric vehicles (BEVs) and plug-in hybrid electric vehicles (PHEVs) are
covered in the share. Historical rate of change is during 2017–19 based on available data.Acceleration factors are averaged where the targets include a range.Source: CAT (2020a).
0%
20%
40%
60%
80%
100%
WorldEuropean Union 28 Indonesia IndiaChina United StatesSouth Africa
2030 2030 max 2050 2050 max2040 2040 max
Brazil

WRI.org78
The expansion of EVs poses a challenge in terms of the need for new infrastructure, such as charging stations, which is likely to constrain the EV market in the 2030s (BNEF 2020a). In 2019 there were 7 million LDV chargers, the vast majority (90 percent) of which were private. It is expected that private chargers will continue to account for a major share in 2030 (IEA 2020c).
As the cost of ownership of EVs has yet to reach a tipping point that makes them competitive with internal combustion engine (ICE) vehicles, the short-term uptake of EVs is still mostly driven by supportive policies. Policies in China, for example, include an EV credit system, fuel economy regulations, and city policies such as road space rationing that give road access priority to EVs (Li et al. 2020). China also leads in terms of electric buses, with 99 percent of the world’s e-bus fleet, driven by strong policy incentives such as national and local subsidies.
The successful deployment of electric vehicles so far has been heavily driven by policy incentives. Countries should adopt ambitious targets with longer-term visions to phase out ICE vehicles and achieve 100 percent EV stock by midcentury.
Several countries, particularly in Europe, have announced targets of 100 percent EVs or complete phaseout of internal combustion engine vehicles between 2030 and 2050. Norway aims to achieve 100 percent zero-emissions vehicle sales by 2025 (IEA 2020c).
Indicators 1 and 2 mainly set targets for uptake of private electric vehicles. However, decarbonizing the transport sector needs to be achieved equitably. Investment in public transportation would be crucial in countries where trips are mostly made through nonmotorized transport, so that the increasing travel demand is met with public transportation instead of private car ownership.
Indicator 3: Carbon intensity of land-based passenger transport (gCO2/pkm)2030: Around 50 percent reduction from 2014 levels
2050: Near-zero carbon emissions intensity
This indicator is measured as grams of carbon dioxide emitted per kilometer of passenger travel (gCO2/pkm) by cars, buses, and rail. A key opportunity to decarbonize passenger transport lies in incentivizing behavior change; for example,
Figure 38 | Carbon dioxide emissions per passenger kilometer in 2014 and targets for 2030, and 2040
Note: Shaded areas indicate target ranges.
Source: CAT (2020a).
0
50
100
150
200
250
WorldEuropean Union 28Brazil Indonesia IndiaChina United StatesSouth Africa
gCO2
/pkm
2014 2030 2030 max 2040 2040 max

79State of Climate Action: Assessing Progress toward 2030 and 2050
encouraging people to walk and cycle where possible, and use more public transportation and car-sharing rather than private vehicles.25 It is also important to shift from fossil-fuel combustion engine vehicles to electric or low-carbon-fuel vehicles.
The indicator covers the passenger transport modes of cars, buses, trains, and, in the case of China, Indonesia, and India, two- and three-wheeled vehicles. The targets aligned with a Paris-compatible pathway require emissions per passenger kilometer to be lower than 50 gCO2/pkm in most world regions by 2030, between 0 and 30 gCO2/km in 2040, and reach zero in 2050 (Figure 38). Table 14 spells out how far we have to go.
Reducing the emissions intensity of passenger transport could be accomplished by various measures; for example, by reducing the miles traveled by more carbon-intensive modes through behavior change and encouraging public transport, as well as reducing emissions intensities with more efficient engine technologies or a switch from ICE to electric vehicles. China has built the world’s largest fleet of electric buses, which could effectively reduce both the carbon intensity of passenger travel and emissions from the transport sector overall. In the European Union, the new regulation regarding the
emissions performance standard for cars and vans is in effect. The standard sets a target to reduce carbon intensity (CO2/km) by 37.5 percent for cars and 31 percent for vans in 2030 relative to levels in 2021 (European Commission 2020b).
Indicator 4: Share of low-carbon fuels in the transport sector (%)2030: 15 percent globally
2050: 70–95 percent globally
This indicator is defined as the share of low-carbon fuels in the final energy demand of the transport sector. Currently the transport sector is still largely dependent on fossil fuels and, in 2017, just 4 percent of global final energy demand for transportation was met with low-carbon fuels (Figure 39) (CAT 2020a). In 2017, transportation accounted for around two-thirds of global oil consumption (IEA 2019b), of which half was for road transport. Around one-quarter of CO2
emissions from the transport sector are from nonroad modes such as shipping, aviation, and rail. Electrification is playing a major role in reducing emissions from rail transport. This is much less true for shipping and aviation.
Table 14 | Carbon intensity of land-based passenger transport in 2014 and targets for 2030, 2040, and 2050 (gCO2/pkm)
COUNTRY 2014
2030 TARGET RANGE (% CHANGE) FROM 2014 LEVELS
2050 TARGET (% CHANGE) FROM 2014 LEVELS
HISTORICAL AVERAGE ANNUAL CHANGE
AVERAGE ANNUAL CHANGE TARGET, 2014–30 (RANGE)
AVERAGE ANNUAL CHANGE TARGET, 2014–50
Brazil 70 30 to 40 (-43% to -57%) 0 (-100%) n.d. -1.9 to -2.5 -1.9
China 62 25 to 40 (-35% to -60%) 0 (-100%) n.d. -1.4 to -2.3 -1.7
European Union (28) 118 50 (-58%) 0 (-100%) n.d. -4.3 -3.3
India 43 25 to 30 (-57% to -75%) 0 (-100%) n.d. -0.8 to -1.1 -1.2
Indonesia 81 20 to 35 (-30% to -42%) 0 (-100%) n.d. -2.9 to -3.8 -2.3
South Africa 92 30 to 70 (-24% to -67%) 0 (-100%) n.d. -1.4 to -3.9 -2.6
United States 237 50 to 100 (-58% to -79%) 0 (-100%) n.d. -8.6 to -11.7 -6.6
World 104 35 to 60 (-42% to -66%) 0 (-100%) n.d. -2.8 to -4.3 -2.9
Notes: n.d. indicates no data. Historical data are only available for 2014, thus no historical rate of change was calculated.
Source: CAT (2020a).

WRI.org80
Figure 39 | Share of zero-carbon fuels in transportation, 1990–2017 (%)
Source: CAT (2020a).
To be compatible with Paris Agreement temperature goals, zero-carbon fuels will need to supply 15–30 percent of total transport energy needs in 2030, increasing to 35–65 percent in 2040 and 70–95 percent in 2050 (Figure 40). Several zero-carbon fuel options can be considered, such
as electricity, hydrogen, and biofuels. EVs offer the possibility of fully decarbonizing the passenger car fleet and buses when powered by a low-carbon grid, but shipping, air transport, and heavy freight transport remain hard to decarbonize. Table 15 spells out how far we have to go.
Figure 40 | Target shares of zero-carbon fuels in transportation for 2030, 2040, and 2050 (%)
Source: CAT (2020a).
0%
4%
8%
12%
16%
20%
1990 1995 2000 2005 2010 2015
South AfricaUSAWorldEuropean Union (28)
ChinaIndiaBrazilIndonesia
0%
20%
40%
60%
80%
100%
2017 2030 2030 max 2050 2050 max2040 2040 max
WorldEuropean Union 28Brazil IndonesiaIndiaChina United StatesSouth Africa

81State of Climate Action: Assessing Progress toward 2030 and 2050
Table 15 | Target shares of low-carbon fuels in the transport sector (% of final energy demand)
COUNTRY 2017
2030 TARGET RANGE
2050 TARGET RANGE
HISTORICAL AVERAGE ANNUAL CHANGE, 2010–17
AVERAGE ANNUAL CHANGE TARGET, 2017–30
AVERAGE ANNUAL CHANGE TARGET, 2017–50
Brazil 16.80 30 85 to 95 -0.01 1.0 2.1 to 2.4
China 4.11 15 to 20 70 to 95 0.07 0.8 to 1.2 2.0 to 2.8
European Union (28) 6.06 15 to 20 80 to 95 0.08 0.7 to 1.1 2.2 to 2.7
India 1.66 20 to 25 80 to 90 -0.03 1.4 to 1.8 2.2 to 2.7
Indonesia 3.61 15 to 20 75 to 95 0.43 0.9 to 1.3 2.2 to 2.8
South Africa 1.77 20 80 to 90 -0.03 1.4 2.4 to 2.7
United States 5.88 15 to 20 75 to 95 0.29 0.7 to 1.1 2.1 to 2.7
World 3.97 15 70 to 95 0.10 0.8 2.0 to 2.8
Global acceleration needed 8.0x to 2030 24x to 2050
Note: Acceleration factors are averaged where the targets include a range.
Source: CAT (2020a).
FORESTS
Deforestation
▪ 2030: reduce by 70 percent
▪ 2050: reduce by 95 percent
Gross tree cover gain
▪ 2030: increase by 350 million hectares (Mha)
▪ 2050: increase by 678 Mha
Gross carbon removal from tree cover gain
▪ 2030: Increase by 7.5 GtCO2
▪ 2050: Increase by 75 GtCO2Notes: Targets were developed according to assessment of what is needed to be on track for 1.5°C temperature rise, adapted from Roe et al. (2019) and using data from GFW (2020) and Griscom et al. (2017). Targets associated with tree cover gain are marked as “insufficient data” because a historical rate of change cannot be established to compare with the rate of change needed. The one historical data point we have indicates we are not on track.
Despite broad commitment across governments, civil society, and companies to reduce deforestation and increase reforestation, we continue to see persistently high levels of deforestation and insufficient levels of reforestation. In net terms, global forest area has been declining at a rate of around 0.1 percent to 0.2 percent per year for the past few decades, according to FAO (2020). However, these numbers hide some critical dynamics about what kinds of trees are being lost and gained, in what regions, and for what reasons. It is essential to look at tree cover gain and loss separately because gaining a softwood plantation in the United States, for example, is not the equivalent of losing primary tropical forest in Brazil in terms of biodiversity, carbon storage, and livelihood opportunities (Brown and Zarin 2013). Even natural regeneration takes decades to develop ecosystems comparable to mature forests that are lost. The world’s capacity to protect and restore millions of hectares of forests in the coming decades, in turn, depends on its ability to feed a growing world population while also peaking and then reducing the amount of land dedicated to agriculture (see Agriculture section below).

WRI.org82
Indicator 1: Deforestation (million hectares)2030: reduce by 70 percent from 2019 level26
2050: reduce by 95 percent from 2019 level
The area of tree cover lost each year has gradually increased since 2001 and has, on average, been driven roughly one-third by forestry (logging), one-quarter by commodity agriculture–driven land clearance, one-fifth each by fire and shifting agriculture, and the remaining 3 percent by urbanization (Figure 41). Fires and forestry are
likely to be cyclical, causing temporary loss with near-term effects on carbon stocks, and are found largely in nontropical areas (GFW 2020). In contrast, commodity agriculture–driven deforestation, urbanization, and shifting agriculture are more likely to cause permanent loss (i.e., deforestation) from land use change, and are mostly found in the tropics. Given these dynamics, tropical forest loss should be the main focus of forest protection and restoration efforts.
Figure 41 | Regional distribution of dominant drivers of tree cover loss, 2001–18
Source: GFW (2020).
In 2014, a broad coalition of national governments and other organizations adopted the New York Declaration on Forests, with a goal of halving global deforestation by 2020 and eliminating it by 2030. Since then, tree cover loss has not declined but increased (NYDF Assessment Partners 2019).
A number of companies with supply chain exposure to major commodities including beef, soy, palm oil, and pulp and paper have made commitments to sustainable or zero-deforestation sourcing (Rothrock et al. 2019). However, only 8 percent have a zero-deforestation commitment that covers
all their supply chains and operations (NYDF Assessment Partners 2019), and none of the world’s 350 largest companies will be able to achieve the target of eliminating deforestation from their production chains by 2020, to which 57 percent of them committed (Climate Chance 2019).
Figure 42 shows the trend in tree cover loss, deforestation, and tropical primary forest loss since 2001. Table 16 spells out how far we have to go.
Commodity-drivendeforestation*
Shiftingagriculture
Forestry
Wildfire
Urbanization*83 Mha
NORTHAMERICA
97 Mha
LATIN AMERICA
77 Mha
RUSSIA, CHINA,SOUTH ASIA
46 Mha
AFRICA
50 Mha
SOUTH-EAST ASIA
21 MhaEUROPE
8 MhaOCEANIA
53%Forestry
96%Forestry
38%Forestry
58%Commodity-drivendeforestation
81%Commodity-drivendeforestation
43%Wildfire
60%Wildfire
35%Shifting
agriculture
95%Shifting
agriculture
31%Shifting
agriculture
*Permanent deforestation

83State of Climate Action: Assessing Progress toward 2030 and 2050
Figure 42 | Tree cover loss, 2001–19, and targets for 2030 and 2050
Notes:
Permanent deforestation includes tree cover loss from commodity-driven deforestation, urbanization, and shifting agriculture in primary tropical forests. Data include only tropical humid primary forest; tropical dry primary forest is excluded, but its area is comparatively small.Deforestation is a subset of tree cover loss, and tropical primary forest loss is a subset of deforestation.Source: GFW (2020).
The disappearance of tropical humid primary forest is a particularly important component of total tree cover loss. Primary forests are irreplaceable in terms of biodiversity and ecosystem services like carbon storage, and trees can be hundreds or even thousands of years old (Weisse and Goldman 2019). Tropical primary forest loss increased to an average of 4.3 Mha per year in 2014–18, after the adoption of the New York Declaration on Forests, from an
average of 3 Mha per year in 2002–13, an increase of 44 percent (NYDF Assessment Partners 2019) (Figure 42).
Carbon dioxide emissions from deforestation closely track the area of deforestation (Figure 43) and would be expected to decline as deforestation is reduced.
0
5
10
15
20
25
30
2001 2002 2003 2004 2005 2006 2007 2008 2009 2010 2011 2012 2013 2014 2015 2016 2017 2018 2019 2030 2050
Millio
n he
ctare
s
Tree cover loss Deforestation Proportion of forest loss from tropical primary forests
Targets
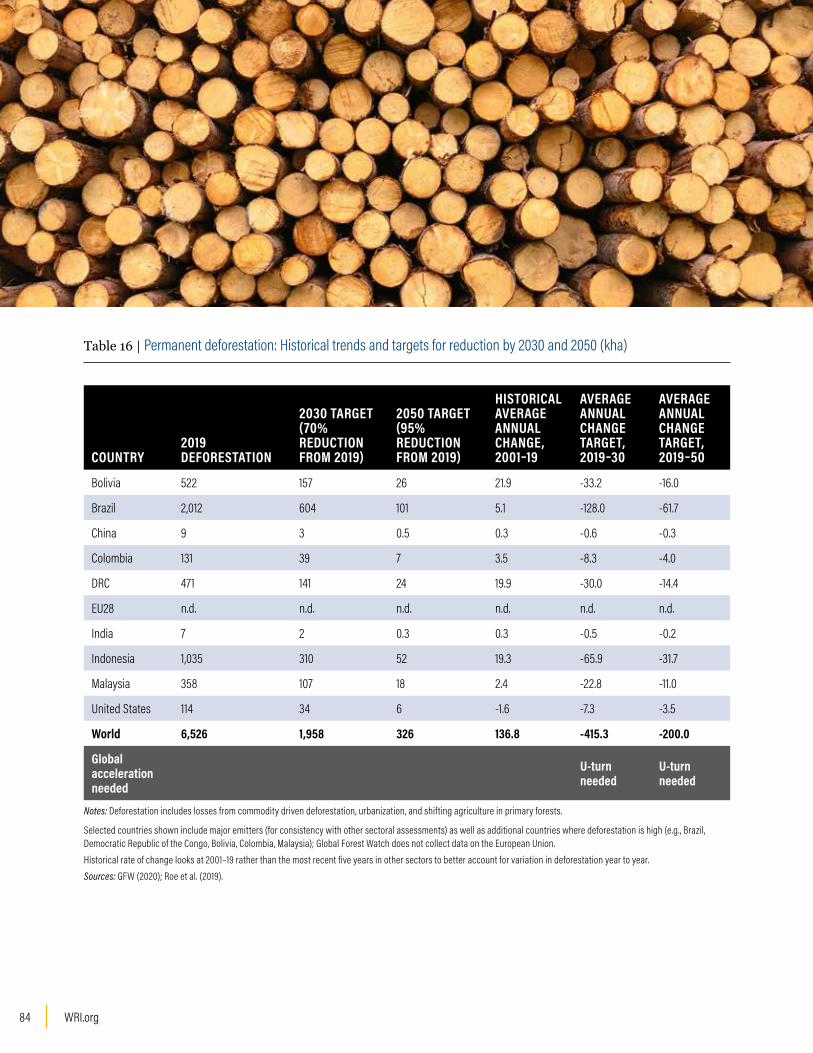
WRI.org84
Table 16 | Permanent deforestation: Historical trends and targets for reduction by 2030 and 2050 (kha)
COUNTRY2019 DEFORESTATION
2030 TARGET (70% REDUCTION FROM 2019)
2050 TARGET (95% REDUCTION FROM 2019)
HISTORICAL AVERAGE ANNUAL CHANGE, 2001–19
AVERAGE ANNUAL CHANGE TARGET, 2019–30
AVERAGE ANNUAL CHANGE TARGET, 2019–50
Bolivia 522 157 26 21.9 -33.2 -16.0
Brazil 2,012 604 101 5.1 -128.0 -61.7
China 9 3 0.5 0.3 -0.6 -0.3
Colombia 131 39 7 3.5 -8.3 -4.0
DRC 471 141 24 19.9 -30.0 -14.4
EU28 n.d. n.d. n.d. n.d. n.d. n.d.
India 7 2 0.3 0.3 -0.5 -0.2
Indonesia 1,035 310 52 19.3 -65.9 -31.7
Malaysia 358 107 18 2.4 -22.8 -11.0
United States 114 34 6 -1.6 -7.3 -3.5
World 6,526 1,958 326 136.8 -415.3 -200.0
Global acceleration needed
U-turn needed
U-turn needed
Notes: Deforestation includes losses from commodity driven deforestation, urbanization, and shifting agriculture in primary forests.
Selected countries shown include major emitters (for consistency with other sectoral assessments) as well as additional countries where deforestation is high (e.g., Brazil, Democratic Republic of the Congo, Bolivia, Colombia, Malaysia); Global Forest Watch does not collect data on the European Union.Historical rate of change looks at 2001–19 rather than the most recent five years in other sectors to better account for variation in deforestation year to year. Sources: GFW (2020); Roe et al. (2019).

85State of Climate Action: Assessing Progress toward 2030 and 2050
Figure 43 | Global annual gross emissions from tropical tree cover loss
Source: GFW (2020).
Indicator 2: Gross tree cover gain (cumulative Mha)2030: gain of 350 Mha above 2014 level27
2050: gain of 678 Mha above 2017 level
Halting deforestation is critical, but it will not be enough to meet the Paris Agreement temperature goals—more trees also need to be added back to the landscape. The IPCC (2018) found that up to 950 Mha of land will need to be reforested by 2050 to hold temperature rise to 1.5°C; Griscom et al. (2017) found that 678 Mha of tree cover gain is feasible provided that grazing land is freed up through sustainable intensification of ruminant meat production and/or dietary shifts away from meat and toward more consumption of plant-based foods (see Agriculture section below).
In the near term, countries have coalesced around a target of restoring 350 Mha of degraded and deforested land by 2030, through the Bonn Challenge.28 We establish national targets here by dividing the total tree cover gain targets by the proportion of reforestation area potential identified in Griscom et al. (2017) (Table 17).
We note that the terms restoration and reforestation are not interchangeable: restoration covers a wide range of landscape improvements that can include tree-planting, agroforestry, and agriculture, while reforestation means replanting trees. Because there are no global data on reforestation, we include restoration targets to illustrate the scale of effort required.
While political will for reforestation and restoration is high, translating commitments to action has proved more difficult for a number of reasons, including competition for land for food production and limited capacity to collect data and report progress. Despite restoration pledges of 349 Mha under the Bonn Challenge and in countries’ nationally determined contributions (Cook-Patton forthcoming), only 26.7 Mha of land have actually been restored since 2000, according to available data, though data are not yet comprehensive (Bonn Challenge 2020; NYDF Assessment Partners 2019) (Figure 44).
2,363
2,756
2,233
3,079 3,133 2,884 2,970 2,883
3,267 3,372
2,876
3,814
3,016
4,202
3,465
5,994
5,300
4,134 4,038
0
1,000
2,000
3,000
4,000
5,000
6,000
7,000
2001 2002 2003 2004 2005 2006 2007 2008 2009 2010 2011 2012 2013 2014 2015 2016 2017 2018 2019
Millio
n to
nnes
of C
O2
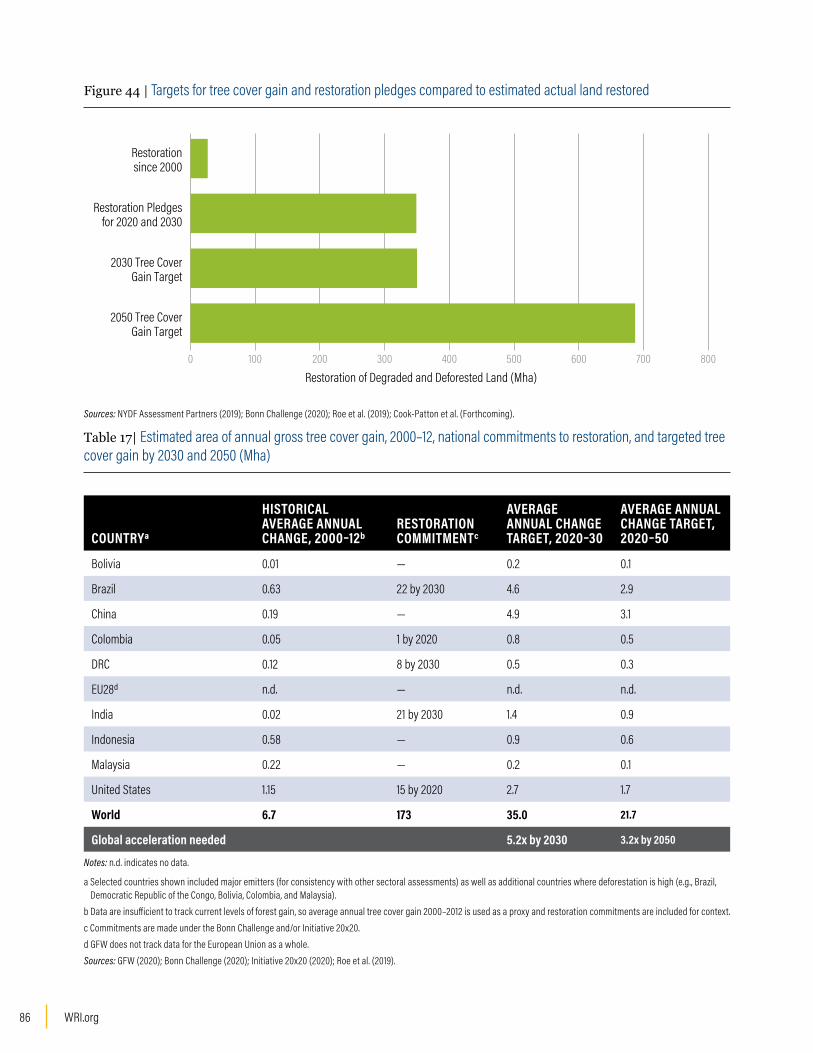
WRI.org86
Figure 44 | Targets for tree cover gain and restoration pledges compared to estimated actual land restored
Sources: NYDF Assessment Partners (2019); Bonn Challenge (2020); Roe et al. (2019); Cook-Patton et al. (Forthcoming).
Table 17| Estimated area of annual gross tree cover gain, 2000–12, national commitments to restoration, and targeted tree cover gain by 2030 and 2050 (Mha)
COUNTRYa
HISTORICAL AVERAGE ANNUAL CHANGE, 2000–12b
RESTORATION COMMITMENTc
AVERAGE ANNUAL CHANGE TARGET, 2020–30
AVERAGE ANNUAL CHANGE TARGET, 2020–50
Bolivia 0.01 — 0.2 0.1
Brazil 0.63 22 by 2030 4.6 2.9
China 0.19 — 4.9 3.1
Colombia 0.05 1 by 2020 0.8 0.5
DRC 0.12 8 by 2030 0.5 0.3
EU28d n.d. — n.d. n.d.
India 0.02 21 by 2030 1.4 0.9
Indonesia 0.58 — 0.9 0.6
Malaysia 0.22 — 0.2 0.1
United States 1.15 15 by 2020 2.7 1.7
World 6.7 173 35.0 21.7
Global acceleration needed 5.2x by 2030 3.2x by 2050
Notes: n.d. indicates no data.
a Selected countries shown included major emitters (for consistency with other sectoral assessments) as well as additional countries where deforestation is high (e.g., Brazil, Democratic Republic of the Congo, Bolivia, Colombia, and Malaysia).
b Data are insufficient to track current levels of forest gain, so average annual tree cover gain 2000–2012 is used as a proxy and restoration commitments are included for context.c Commitments are made under the Bonn Challenge and/or Initiative 20x20. d GFW does not track data for the European Union as a whole. Sources: GFW (2020); Bonn Challenge (2020); Initiative 20x20 (2020); Roe et al. (2019).
0 100 200 300 400 500 600 700 800
2050 Tree CoverGain Target
2030 Tree CoverGain Target
Restoration Pledgesfor 2020 and 2030
Restorationsince 2000
Restoration of Degraded and Deforested Land (Mha)

87State of Climate Action: Assessing Progress toward 2030 and 2050
The ambitious scales of action outlined above will require, among other things, the mobilization of sufficient financing. Estimates point to the need for up to $49 billion to $67 billion annually in funding for large-scale restoration interventions (Löfqvist and Ghazoul 2019; NCE 2018). Most finance for restoration currently comes from public budgets since the benefits from restoration can be long-term and difficult to monetize, and projects may be perceived as risky (Ding et al. 2017). Activation of the private sector is thus a critical need in accelerating action. At the same time, studies indicate that restoring 350 Mha of forest land could create approximately $170 billion in net benefits per year over the next 50 years (Ding et al. 2017). This estimate includes both public benefits, like improved soil quality and biodiversity and reduced erosion, as well as private benefits like the sale of timber or other forest products.
Indicator 3: Gross carbon removal through tree cover gain (GtCO2)2030: cumulative increase of 7.5 GtCO2 over 2018 level
2050: cumulative increase of 75 GtCO2 over 2018 level
The removal of carbon dioxide from the atmosphere (carbon sequestration) by trees through the process of photosynthesis will need to increase dramatically. IPCC data show that 100–1,000 GtCO2 total needs to be removed from the atmosphere by the end of the century; at the moment, adding trees is the best approach most readily deployable on a large scale (NYDF Assessment Partners 2019; IPCC 2018).
Our targets are drawn from Roe et al. (2019), who conducted a bottom-up assessment of mitigation potential of land-based activities, considering only cost-effective (<$100/tCO2) mitigation that does not negatively impact food and fiber production or biodiversity (Roe et al. 2019; Griscom et al. 2017). Available data to estimate recent levels of carbon removal from tree cover increase date from 2012, but the levels they indicate are far below those required to reach these targets (Table 18).
A separate target for carbon removal from tree cover gain is established because increased carbon removal will not track exactly with tree cover gain—it will take years for carbon stocks to accumulate
after trees are added. In contrast, emissions from deforestation track more closely time-wise to the deforestation. In addition, for trees to be permanent they need to fulfill other local ecosystem and economic functions and not be treated only as carbon sinks for the global community. Areas are thus important to understand the inputs needed and benefits gained besides carbon removal. As with all land-based carbon removal, however, uncertainty remains about permanence because reforested land may lose tree cover again.
Table 18 | Historical trends and targets for gross carbon dioxide removal from tree cover gain (MtCO2)
COUNTRY
HISTORICAL AVERAGE ANNUAL CHANGE (2000–12)
AVERAGE ANNUAL CHANGE TARGET (2020–30)
AVERAGE ANNUAL CHANGE TARGET (2020–50)
Australia 1.2 24 80
Bolivia 0.3 4 13
Brazil 10.9 98 325
China 1.9 105 348
Colombia 0.8 18 59
DRC 2.0 12 39
EU28 n.d. n.d. n.d.
India 0.4 29 97
Indonesia 10.0 20 65
Malaysia 3.7 4 14
United States 11.9 57 192
World 69.3 750 2,500
Global accel.needed
11x by 2030 36x by 2050
Notes: n.d. indicates no data.
Country shares of global target based on potential area for reforestation.
Baseline carbon removal is calculated from area gain in GFW (2020) and tCO2/ha removed from Griscom et al. (2017).
Global Forest Watch does not collect data for the European Union as a whole.
Sources: Emissions data estimated from GFW (2020) (for area) and Griscom et al. (2017) (for emission factors); targets adapted from Roe et al. (2019).

WRI.org88
By 2050, there will be nearly 10 billion people on the planet (UNDESA 2019). Population and income growth are likely to lead to a roughly 50 percent increase in food demand between 2010 and 2050 under a business-as-usual scenario (Searchinger et al. 2019; FAO 2018). At the same time, the world needs to greatly reduce deforestation and increase forest restoration (see Forests section above) while also reducing GHG emissions from food production. Indeed, Sustainable Development Goal (SDG) 2 to end hunger and attain food security can
only be truly achieved by simultaneously making progress toward SDGs around poverty reduction, human health, water, climate, forests, and oceans (FAO 2018). The World Resources Report: Creating a Sustainable Food Future (Searchinger et al. 2019) set a global goal of no more than 4 GtCO2e/yr of net emissions from the land sector (agricultural production plus land use change) by 2050 to keep global temperature rise below 2°C, and net-zero emissions from the land sector (made possible by large-scale reforestation offsetting ongoing agricultural production emissions of around 4 GtCO2e/yr) to stay within 1.5⁰C.
With increasing global demand for food, feed, and fiber, large-scale reductions in deforestation and increases in reforestation will only be possible if the world greatly improves the efficiency of land use. This will require increasing crop yields and output of meat and milk per hectare of pasture at higher than historical rates, while protecting soil health and freshwater resources. At the same time, it will be essential to slow the rate of growth in food and agricultural land demand by reducing food loss and waste, shifting diets away from high levels of meat (especially beef and lamb) consumption, and avoiding further expansion of biofuel production. Linking agricultural intensification with forest protection will be necessary to achieve the agriculture and forest targets simultaneously.
Drawing from modeling done by Searchinger et al. (2019), we propose five indicators to track progress in implementation of these solutions with targets for 2030 and 2050. We use publicly available data while updating the base year to 2017, and also show changes in these indicators since 2012. Targets were developed through a combination of global goal-setting and national- or regional-level model outputs but are subject to a range of uncertainties (Box 1).
AGRICULTURE
Emissions from agricultural production
▪ 2030: 22 percent reduction from 2017 level
▪ 2050: 39 percent reduction from 2017 level
Crop yields
▪ 2030: 13 percent increase from 2017 level (7.4 t/ha)
▪ 2050: 38 percent increase from 2017 level (9.0 t/ha)
Productivity of ruminant meat production
▪ 2030: 27 percent increase from 2017 level
▪ 2050: 58 percent increase from 2017 level
Food loss and waste
▪ 2030: 25 percent reduction from 2017 level
▪ 2050: 50 percent reduction from 2017 level
Ruminant meat consumption
▪ 2030: limit increase to 5 percent from 2017 level
▪ 2050: limit increase to 6 percent from 2017 level Note: Targets were developed based on the findings of Searchinger et al. (2019).

89State of Climate Action: Assessing Progress toward 2030 and 2050
Indicator 1: GHG emissions from agricultural production (MtCO2e) 2030: 22 percent reduction from 2017 level
2050: 39 percent reduction from 2017 level
This indicator measures annual emissions of greenhouse gases (expressed in terms of carbon dioxide equivalent) from agricultural production, including fossil fuel use, livestock and rice production, and use of synthetic fertilizers and manure. It excludes emissions from land use change caused by agriculture, which are largely covered in the Forests section above. Global agricultural production emissions grew by 3 percent between 2012 and 2017 (FAO 2020), and under
a business-as-usual scenario, global agricultural production emissions are projected to grow by 27 percent between 2017 and 2050 (Searchinger et al. 2019). However, to keep global temperature rise below 1.5°C, emissions in 2050 would need to move in the other direction, falling by 39 percent relative to the year 2017 (Table 19) to near 4 GtCO2e (Searchinger et al. 2019).29
Emissions reductions would be required across all world regions relative to the year 2017, falling by between 20 and 60 percent (Table 19). In regions such as sub-Saharan Africa with high projected population and food demand growth, emissions targets are less stringent, whereas in areas of stable population and food demand growth, targets are
BOX 1 | Overview of the agriculture target-setting approach and caveats regarding data sources
The World Resources Report: Creating a Sustainable Food Future used a global accounting and biophysical model called GlobAgri-WRR to quantify the effects of different scenarios of food production and consumption patterns on agricultural land use demands and GHG emissions. With food security for 10 billion people, nearly 600 Mha of reforestation, and no more than 4 GtCO2e/yr of agricultural production emissions as the major global targets for the year 2050, Searchinger et al. (2019) analyzed the effects of various scenarios across all world regions. Only the most ambitious scenario, called “Breakthrough Technologies,” achieved the global environmental targets while feeding the world population in 2050. This scenario considered a shift toward current best practices as well as a range of technological improvements from farm to plate, including crop and animal breeding, feed additives to reduce livestock emissions, low-cost manure management technologies, various ways to reduce nitrogen losses from fertilizer use, compounds to prevent food spoilage, and plant-based meat substitutes.
The regional- and country-level 2050 targets for Indicators 1–3 and 5 in this section (dealing with GHG emissions, agricultural productivity, and dietary changes) are outputs of the GlobAgri-WRR model and take into account various factors, including projected population growth, previous and projected changes in incomes and consumption patterns, and technical potential for future productivity gains and GHG emissions reductions. Indicator 4’s targets are based on SDG Target 12.3 on food loss and waste reduction. Modeled reductions in agricultural land demand and GHG emissions for reaching targets in Indicators 2–5 are from Searchinger et al. (2019) but are not additive (e.g., if
pasture intensification is achieved as in Indicator 3 but ruminant meat consumption also declines as in Indicator 5, the land and GHG effects of each “achievement” would be somewhat lower than shown).
Global-, regional-, and country-level 2030 targets were obtained by calculating the mean between 2010 (observed) indicators and the 2050 targets. Because the base year of this report is 2017, and progress across indicators between 2010–17 was uneven, there were several regional- or country-level examples where no additional “progress” was needed by 2030. In these cases, we set the 2030 target as “zero change from 2017.”
A major caveat regarding the baseline and target values in this section is the reliance on data from FAOSTAT. Although FAOSTAT data have several strengths, including coverage of most countries, relatively consistent methods across countries, and open access, they rely on national data submission, which can be subject to differences in definitions and quantification methods across countries and time. There can be discrepancies between methods used to generate FAOSTAT data and other measurement methods (e.g., using satellite data to map cropland and pastureland, or dietary surveys to estimate per capita food consumption patterns). As globally consistent data sets improve, it may become necessary in the future to reestimate baseline and target values for these indicators.
For more on the GlobAgri-WRR model, scenario assumptions, and global-level targets for these five indicators, see Box 2-1 and Table 32-1 in Searchinger et al. (2019).

WRI.org90
more stringent (Table 1). Annual agricultural emissions data are available from FAOSTAT and would need to be adjusted as in Searchinger et al. (2019) and in Table 1 to match the 2030 and 2050 targets.30 Both supply-side (e.g., improvements in livestock feed and manure management, improvements in nitrogen use efficiency, improvements in rice management and breeds) and demand-side (e.g., reductions in food loss and waste and dietary shifts) actions could contribute to emissions reductions.
Unlike emissions from the power sector, emissions from agriculture are quite uncertain and variable and must be estimated indirectly. Most analyses
and reporting of national agricultural emissions are based on simplified emissions factors recommended by the IPCC. Estimates can be done using very simple assumptions, such as constant emissions per cow, or they can be done in a somewhat more complicated fashion, such as varying emissions estimates based on cattle feeds. Although countries can develop and use their own national emissions factors, for consistency purposes, FAO uses simpler factors—which hides important limitations and uncertainties across countries.
Table 19 | Agricultural production emissions: Historical trends and targets for 2030 and 2050 (MtCO2e)
REGION 2017
2030 TARGET (% CHANGE)
2050 TARGET (% CHANGE)
HISTORICAL AVERAGE ANNUAL CHANGE, 2012–17
AVERAGE ANNUAL CHANGE TARGET, 2017–30
AVERAGE ANNUAL CHANGE TARGET, 2017–50
Asia (excluding China and India) 1,130 905 (-20%) 784 (-31%) 16.2 -17.3 -10.5
Brazil 434 346 (-20%) 270 (-38%) 3.0 -6.8 -5.0
U.S. and Canada 588 468 (-20%) 361 (-39%) 1.6 -9.2 -6.9
China 1,389 979 (-30%) 580 (-58%) 1.8 -31.5 -24.5
Former Soviet Union 307 241 (-22%) 201 (-35%) 5.2 -5.1 -3.2
India 974 802 (-18%) 655 (-33%) 3.8 -13.2 -9.7
Latin America (excluding Brazil) 455 361 (-21%) 281 (-38%) 2.2 -7.2 -5.3
Middle East and North Africa 295 245 (-17%) 211 (-28%) 1.4 -3.8 -2.5
Other OECD 294 198 (-33%) 155 (-47%) -16.8 -7.4 -4.2
Sub-Saharan Africa 697 572 (-18%) 537 (-23%) 15.9 -9.6 -4.8
European Union 554 435 (-22%) 321 (-42%) 2.6 -9.2 -7.1
World 7,117 5,551 (-22%) 4,358 (-39%) 36.9 -120.5 -83.6
Global acceleration needed
U-turn in action needed
U-turn in action needed
Note: FAOSTAT emissions adjustments include a higher global warming potential value for methane (methane absorbs approximately 34 times more heat energy than carbon dioxide over a period of 100 years) based on the most recent IPCC recommendations, and a higher amount of agricultural energy use calculated by the GlobAgri-WRR model based on estimates from the U.S. Environmental Protection Agency and FAO.
Sources: FAO (2020) for 2012–17 change and with adjustments for year 2017; GlobAgri-WRR model in Searchinger et al. (2019) for 2030 and 2050 targets.

91State of Climate Action: Assessing Progress toward 2030 and 2050
Indicator 2: Crop yields (t/ha/yr)2030: 13 percent increase from 2017 level (7.4 t/ha)
2050: 38 percent increase from 2017 level (9.0 t/ha)
Even as crop yields31 are expected to continue to increase in coming decades (FAO 2018), models tend to project continued cropland expansion out to 2050 as the global population grows (Schmitz et al. 2014; Bajzelj et al. 2014; Searchinger et al. 2019), implying continued encroachment of cropland on forests. Therefore, yields must increase even faster than historical rates over the next 30 years in order to increase crop production on existing agricultural land and avoid additional expansion. Increasing productivity is the single most important step
toward simultaneously meeting food production and environmental goals—and underpins the forest protection and restoration goals in the previous section—but it must be done in ways that protect soil health and water quantity and quality. Improving crop breeding, improving soil and water management, and planting existing cropland more frequently can all contribute to increased yields in a changing climate.
Yield gains would be necessary across all world regions relative to the year 2017 (Table 20), with particular attention in areas like sub-Saharan Africa and India where current yields are well below the global average and where climate change without
Table 20 | Global and regional crop yield targets (t/ha/yr)
REGION 2017
2030 TARGET (% CHANGE)
2050 TARGET (% CHANGE)
HISTORICAL AVERAGE ANNUAL CHANGE, 2012–17
AVERAGE ANNUAL CHANGE TARGET, 2017–30
AVERAGE ANNUAL CHANGE TARGET, 2017–50
Asia (excluding China and India) 7.5 7.8 (3.8%) 9.4 (24.5%) 0.26 0.02 0.06
Brazil 13.7 16.6 (20.9%) 19.3 (40.0%) -0.05 0.22 0.17
United States and Canada 6.5 6.5 (0.2%) 7.4 (14.0%) 0.24 0.00 0.03
China 9.6 10.9 (14.0%) 13.9 (45.3%) 0.11 0.10 0.13
Former Soviet Union 4.1 4.0 (0.0%) 4.5 (9.6%) 0.11 0.00 0.01
India 5.0 6.6 (34.3%) 8.8 (78.4%) 0.01 0.12 0.12
Latin America (excluding Brazil) 7.6 8.0 (5.6%) 9.5 (25.0%) 0.19 0.03 0.06
Middle East and North Africa 6.1 7.7 (20.8%) 9.4 (54.3%) 0.11 0.12 0.10
Other OECD 5.5 5.1 (0.0%) 5.5 (1.0%) 0.12 0.00 0.00
Sub-Saharan Africa 3.0 4.6 (53.2%) 6.6 (117.6%) 0.01 0.12 0.11
European Union 7.9 7.8 (0.0%) 9.1 (15.7%) 0.19 0.00 0.04
World 6.5 7.4 (13.3%) 9.0 (38.4%) 0.11 0.07 0.08
Global acceleration needed
On track; sustain action
On track; sustain action
Notes: Yields are weighted averages across all crops, as given in FAO (2020). Outlying observations (e.g., in former Soviet Union) are likely due to data limitations rather than being truly representative of conditions.
Sources: FAO (2020) for years 2012–17; GlobAgri-WRR model in Searchinger et al. (2019) for 2030 and 2050 targets.
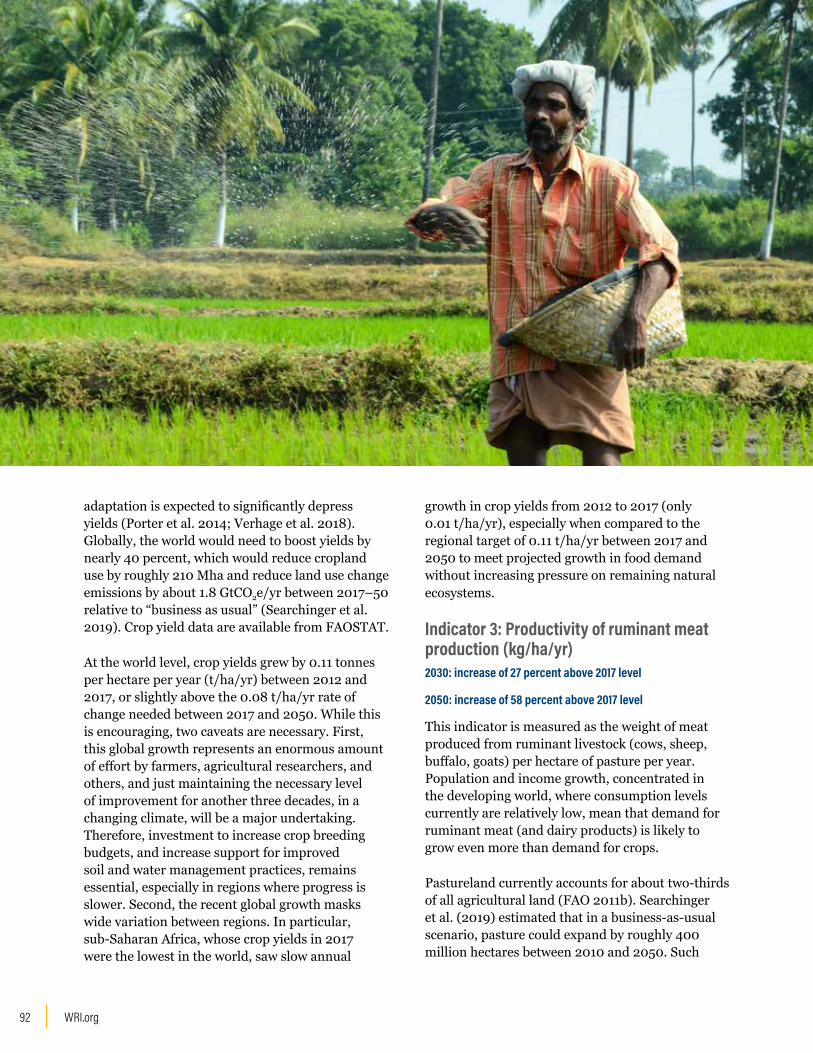
WRI.org92
adaptation is expected to significantly depress yields (Porter et al. 2014; Verhage et al. 2018). Globally, the world would need to boost yields by nearly 40 percent, which would reduce cropland use by roughly 210 Mha and reduce land use change emissions by about 1.8 GtCO2e/yr between 2017–50 relative to “business as usual” (Searchinger et al. 2019). Crop yield data are available from FAOSTAT.
At the world level, crop yields grew by 0.11 tonnes per hectare per year (t/ha/yr) between 2012 and 2017, or slightly above the 0.08 t/ha/yr rate of change needed between 2017 and 2050. While this is encouraging, two caveats are necessary. First, this global growth represents an enormous amount of effort by farmers, agricultural researchers, and others, and just maintaining the necessary level of improvement for another three decades, in a changing climate, will be a major undertaking. Therefore, investment to increase crop breeding budgets, and increase support for improved soil and water management practices, remains essential, especially in regions where progress is slower. Second, the recent global growth masks wide variation between regions. In particular, sub-Saharan Africa, whose crop yields in 2017 were the lowest in the world, saw slow annual
growth in crop yields from 2012 to 2017 (only 0.01 t/ha/yr), especially when compared to the regional target of 0.11 t/ha/yr between 2017 and 2050 to meet projected growth in food demand without increasing pressure on remaining natural ecosystems.
Indicator 3: Productivity of ruminant meat production (kg/ha/yr)2030: increase of 27 percent above 2017 level
2050: increase of 58 percent above 2017 level
This indicator is measured as the weight of meat produced from ruminant livestock (cows, sheep, buffalo, goats) per hectare of pasture per year. Population and income growth, concentrated in the developing world, where consumption levels currently are relatively low, mean that demand for ruminant meat (and dairy products) is likely to grow even more than demand for crops.
Pastureland currently accounts for about two-thirds of all agricultural land (FAO 2011b). Searchinger et al. (2019) estimated that in a business-as-usual scenario, pasture could expand by roughly 400 million hectares between 2010 and 2050. Such

93State of Climate Action: Assessing Progress toward 2030 and 2050
an area (larger than the size of India) would put forest protection and restoration goals out of reach. Improvements in livestock production efficiency and pasture productivity can increase meat and milk production while reducing the pressure to clear more land for grazing. Sustainable intensification strategies include improvements to pasture grasses and supplemental feeds, animal breeds, veterinary care, and management practices (e.g., rotational grazing).
Productivity improvements would be required across all world regions (Table 21). At a global scale, the pace of productivity gains between
2017 and 2050 would need to be even faster than between 2012 and 2017, a period that saw a 5 percent increase in ruminant meat production per hectare of pasture (FAO 2020). Because much of the world’s pastureland is dry or sloped, achieving a global goal of a nearly 60 percent increase in ruminant meat production per hectare by 2050 would require improvements on nearly every suitable hectare of wetter pastureland. This achievement would reduce pastureland use by roughly 110 Mha and reduce land use change emissions by about 1.1 GtCO2e/yr between 2017 and 2050 relative to “business as usual” (Searchinger et al. 2019).
Table 21 | Global and regional pasture intensification targets
RUMINANT MEAT OUTPUT PRODUCTIVITY (KG MEAT/HA PASTURE/YR)
REGION 20172030 TARGET (% CHANGE)
2050 TARGET (% CHANGE)
HISTORICAL AVERAGE ANNUAL CHANGE, 2012–17
AVERAGE ANNUAL CHANGE TARGET, 2017–30
AVERAGE ANNUAL CHANGE TARGET, 2017–50
Asia (excluding China and India) 37.1 38.5 (4%) 44.8 (21%) 0.98 0.11 0.23
Brazil 56.1 63.3 (13%) 78.7 (40%) 0.20 0.55 0.68
U.S. and Canada 49.8 62.3 (25%) 73.6 (48%) 0.13 0.96 0.72
China 28.2 39.2 (39% 52.7 (87%) 0.44 0.85 0.74
Former Soviet Union 13.5 18.1 (33%) 23.8 (76%) 0.12 0.35 0.31
India 325.5 443.9 (36%) 551.7 (69%) 0.83 9.11 6.85
Latin America (excluding Brazil) 24.8 31.6 (28%) 39.0 (58%) 0.20 0.52 0.43
Middle East and North Africa 16.6 18.1 (9%) 22.3 (34%) 0.28 0.12 0.17
Other OECD 13.1 16.1 (23%) 20.2 (54%) 0.09 0.23 0.22
Sub-Saharan Africa 10.6 13.6 (28%) 17.2 (61%) 0.20 0.23 0.20
European Union 131.0 160.4 (22%) 188.1 (44%) 0.70 2.26 1.73
World 26.0 33.0 (27%) 41.1 (58%) 0.24 0.54 0.46
Global acceleration needed
2.3x by 2030 1.9x by 2050
Note: Outlying observations (e.g., in India) are likely due to data limitations rather than being truly representative of conditions.
Sources: FAO (2020) for years 2012–17; GlobAgri-WRR model in Searchinger et al. (2019) for 2030 and 2050 targets.

WRI.org94
Ruminant meat production and pastureland extent data are available from FAOSTAT, but data on pasture area are currently of poor quality. Comparisons between national-level pasture area data in FAOSTAT and satellite analyses show large discrepancies both in the precise areas designated as pasture and in the net pasture areas (Oliveira et al. 2020; Fetzel et al. 2017). Although there is clear evidence of clearing of tropical forest for pasture—suggesting that combining pasture productivity improvements with forest protection is a necessary strategy to meet food, forest, and climate goals—analyses of pasture area must be improved to hone targets and track progress.
Indicator 4: Food loss and waste (kg/capita/yr)2030: 25 percent reduction below 2017 level
2050: 50 percent reduction from 2017 level
Roughly one-third of all food produced in the world each year (by weight) is lost or wasted between the farm and the fork (FAO 2011a) (Figure 45),
resulting in high economic losses, contributing to food insecurity in lower-income countries, adding to GHG emissions, and representing a “waste” of agricultural land and water resources. Sustainable Development Goal Target 12.3 calls for reducing per capita global food waste at the retail and consumer levels by 50 percent and reducing food losses (including postharvest losses) where possible along production and supply chains (UN 2015). In lower-income countries, food loss and waste tends to occur closer to the farm, while in higher-income countries it occurs closer to the fork—although supply chain disruptions related to COVID-19 also caused significant losses in higher-income countries in 2020 (FAO 2020).
Because of the many complexities across regions and supply chains and gaps in food loss and waste data, we have set equal targets of 25 percent reductions in rates of food loss and waste across all regions by 2030 and 50 percent by 2050 (Table 22). Reducing food loss and waste by 50 percent by 2050 would reduce agricultural land demand by
Figure 45 | Per capita food losses and waste by region (kg/yr), 2009
Source: FAO (2011a).
0
50
100
150
200
250
300
350
Europe NorthAmerica and
Oceania
IndustrializedAsia
Sub-SaharanAfrica
North Africa,West and
Central Asia
South andSoutheast
Asia
Latin America
ConsumerProduction to retailing
(kg/
year
)

95State of Climate Action: Assessing Progress toward 2030 and 2050
Table 22 | Global food loss and waste targets (kg/capita/yr)
REGION 2017
2030 TARGET (% CHANGE)
2050 TARGET (% CHANGE)
HISTORICAL AVERAGE ANNUAL CHANGE, 2012–17
AVERAGE ANNUAL CHANGE TARGET, 2017–30
AVERAGE ANNUAL CHANGE TARGET, 2017–50
World 188a 141 (-25%) 94 (-50%) n.d. -3.6 -2.8
Note: a Estimate is for year 2009. More current global estimates are not yet available. National data are also not yet available.
Source: FAO (2011a).
about 310 Mha and annual agriculture and land use change emissions by roughly 3 GtCO2e, relative to “business as usual” (Searchinger et al. 2019).
Global- and country-level monitoring data are not yet available for this indicator, but FAO and partners are developing a Food Loss Index and Food Waste Index to measure countries’ progress over time. A preliminary Food Loss Index estimate by FAO suggests that, globally, 14 percent of food production is lost from the postharvest stage up to, but not including, the retail stage of the food supply chain (FAO 2019). The Food Waste Index will measure retail- and consumption-level food waste.
Indicator 5: Ruminant meat consumption (kcal/person/day)2030: limit increase to 5 percent from 2017 level
2050: limit increase to 6 percent from 2017 level
As incomes rise and people move to cities, diets tend to become more varied and higher in resource-intensive foods like meat and dairy. For this reason, consumption of animal-based foods is projected to grow by nearly 70 percent between 2010 and 2050 (Searchinger et al. 2019), an estimate roughly in line with several other researchers’ estimates (e.g., Willett et al. 2019; Tilman and Clark 2014; Springmann et al. 2016). This projected growth makes forest protection and climate mitigation goals much more challenging: for instance, beef production requires 20 times more land and leads to 20 times more GHG emissions per gram of protein than beans. Beef and other ruminant meat production is also roughly seven times as land- and GHG-intensive as poultry and pork production (Ranganathan et al. 2016).

WRI.org96
Modest increases in consumption of animal-based foods can boost nutrition in low-income countries. However, in high-income countries, where protein consumption is well above dietary requirements and substitutes for animal protein are widely available, shifting diets toward plant-based foods and especially away from beef and lamb can reduce agricultural land demand and GHG emissions. While additional shifts away from animal-based foods beyond ruminant meats (e.g., pork and poultry) in high-income countries have been recommended by other researchers for environmental and health reasons (e.g., Willett et al. 2019), and could reduce cropland demand, such shifts require larger behavioral changes and do not
confer the same relative land and GHG benefits as shifts from ruminant meat, so they are not the focus of this indicator.
If ruminant meat consumption in high-consuming countries declined by 2050 to 52 kcal/person/day, or about 1.5 burgers/person/week, it would reduce agricultural land demand by more than 500 Mha, and reduce agriculture and land use change emissions by more than 5 GtCO2e, relative to “business-as-usual” (Searchinger et al. 2019). In China, for example, this goal would translate to higher consumption than in 2017 but lower than business-as-usual in 2050. For more than 5 billion people across sub-Saharan Africa and
Table 23 | Global and regional ruminant meat consumption targets
RUMINANT MEAT AVAILABILITY (KCAL MEAT/CAPITA/DAY)
REGION 2017
2030 TARGET (% CHANGE)
2050 TARGET (% CHANGE)
HISTORICAL AVERAGE ANNUAL CHANGE, 2012–17
AVERAGE ANNUAL CHANGE TARGET, 2017–30
AVERAGE ANNUAL CHANGE TARGET, 2017–50
Asia (excluding China and India) 28.4 35.0 (23%) 41.5 (46%) 0.5 0.5 0.4
Brazil 156.0 105.2 (-33%) 60.0 (-62%) -1.6 -3.9 -2.9
U.S. and Canada 101.1 81.3 (-20%) 60.0 (-41%) -0.7 -1.5 -1.3
China 48.0 49.4 (3%) 60.0 (25%) 0.8 0.1 0.4
Former Soviet Union 96.9 83.6 (-14%) 60.0 (-38%) -2.8 -1.0 -1.1
India 5.0 19.9 (298%) 27.4 (448%) -0.4 1.2 0.7
Latin America (excluding Brazil) 87.5 74.3 (-15%) 60.0 (-31%) -0.9 -1.0 -0.8
Middle East and North Africa 59.4 58.9 (-1%) 60.0 (1%) -0.5 0.0 0.0
Other OECD 62.1 61.7 (-1%) 60.0 (-3%) 0.7 0.0 -0.1
Sub-Saharan Africa 38.5 55.2 (43%) 60.0 (56%) -0.7 1.3 0.7
European Union 73.7 69.7 (-5%) 60.0 (-19%) 0.7 -0.3 -0.4
World 48.8 51.0 (5%) 51.7 (6%) -0.3 0.2 0.1
Global acceleration needed
On track; sustain action
On track; sustain action
Sources: FAO (2020) for years 1990–2017; GlobAgri-WRR model in Searchinger et al. (2019) for 2030 and 2050 targets.
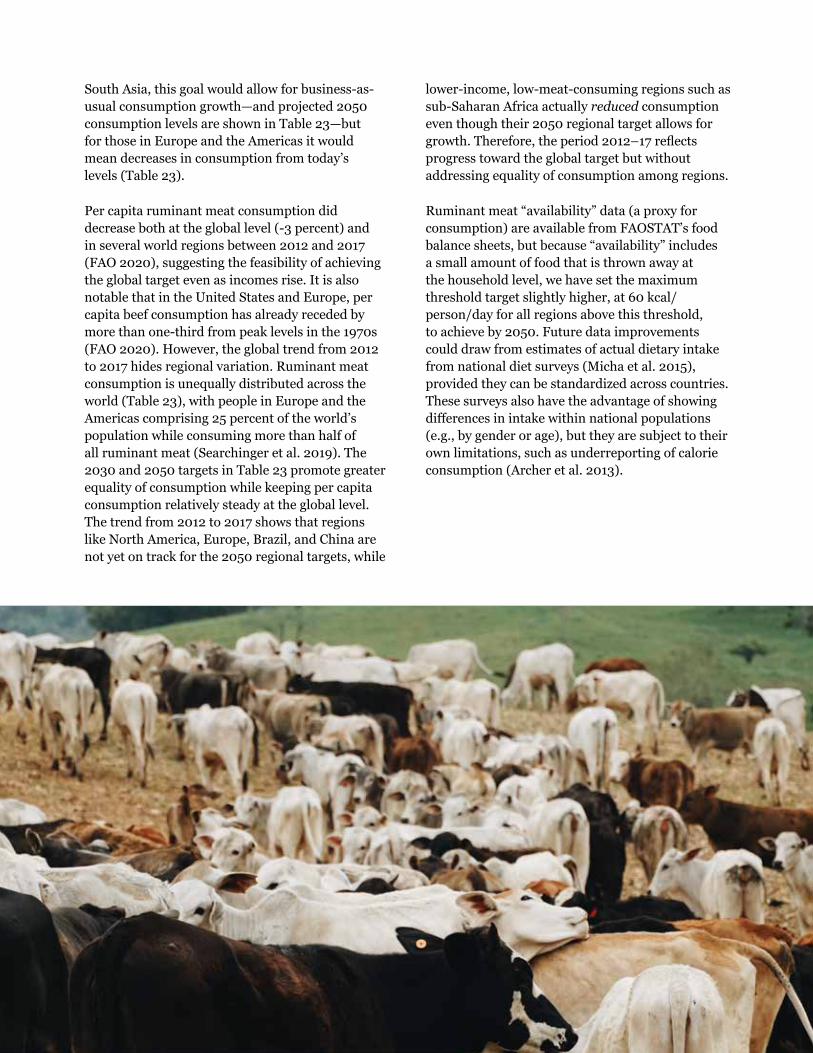
97State of Climate Action: Assessing Progress toward 2030 and 2050
South Asia, this goal would allow for business-as-usual consumption growth—and projected 2050 consumption levels are shown in Table 23—but for those in Europe and the Americas it would mean decreases in consumption from today’s levels (Table 23).
Per capita ruminant meat consumption did decrease both at the global level (-3 percent) and in several world regions between 2012 and 2017 (FAO 2020), suggesting the feasibility of achieving the global target even as incomes rise. It is also notable that in the United States and Europe, per capita beef consumption has already receded by more than one-third from peak levels in the 1970s (FAO 2020). However, the global trend from 2012 to 2017 hides regional variation. Ruminant meat consumption is unequally distributed across the world (Table 23), with people in Europe and the Americas comprising 25 percent of the world’s population while consuming more than half of all ruminant meat (Searchinger et al. 2019). The 2030 and 2050 targets in Table 23 promote greater equality of consumption while keeping per capita consumption relatively steady at the global level. The trend from 2012 to 2017 shows that regions like North America, Europe, Brazil, and China are not yet on track for the 2050 regional targets, while
lower-income, low-meat-consuming regions such as sub-Saharan Africa actually reduced consumption even though their 2050 regional target allows for growth. Therefore, the period 2012–17 reflects progress toward the global target but without addressing equality of consumption among regions.
Ruminant meat “availability” data (a proxy for consumption) are available from FAOSTAT’s food balance sheets, but because “availability” includes a small amount of food that is thrown away at the household level, we have set the maximum threshold target slightly higher, at 60 kcal/person/day for all regions above this threshold, to achieve by 2050. Future data improvements could draw from estimates of actual dietary intake from national diet surveys (Micha et al. 2015), provided they can be standardized across countries. These surveys also have the advantage of showing differences in intake within national populations (e.g., by gender or age), but they are subject to their own limitations, such as underreporting of calorie consumption (Archer et al. 2013).

99State of Climate Action: Assessing Progress toward 2030 and 2050
CONCLUSIONThis report has provided a snapshot of climate action and
assessed progress toward 2030 and 2050 targets in key sectors. It
is clear that tremendous gaps in action exist. Countries, cities, and
companies are advancing climate action but not yet at the level
of ambition needed to reach the goals of the Paris Agreement. In
the run-up to COP26, countries have the opportunity to set more
ambitious commitments to scale up action.

WRI.org100
Countries have adopted a variety of commitments, but they still fall woefully short of the required ambition to meet the Paris Agreement’s goals. In 2019, 104 countries committed to enhancing their NDCs in 2020 (COP25 Presidency 2019), representing roughly 15 percent of global GHG emissions (ClimateWatch 2020a). Eleven countries had submitted NDCs to the UNFCCC by June 2020, but these countries account for only about 3 percent of global GHG emissions, and not all of these submissions reflect strengthened commitments. As of September 2020, 17 Parties had submitted their long-term strategies, representing a quarter of global GHG emissions (ClimateWatch 2020c). Yet despite this action, countries’ commitments are far off track if we are to avoid the most dangerous climate impacts. The impacts of a 1˚C world to date have affected us all—from more intense storms in regions around the world, to heat waves, to more extreme fires, and increased the odds of droughts. Even the temperature rise expected if countries implement their current climate commitments—3˚C above preindustrial levels (UNEP 2019)—will lead us to a very different world.
Cities and companies are also making strides in advancing climate action. As of September 2020, 10,932 cities and regions had committed to 12,577 climate actions registered on the UNFCCC Global Climate Action portal (UNFCCC 2020). And as of September 2020, 470 cities and regions had committed to achieving net-zero carbon emissions by 2050 through the Race to Zero global campaign (UNFCCC 2020). However, city-level efforts currently also fall short of the ambition needed to align with a 1.5-degree pathway (GCOM 2019).
Regarding corporate action, as of September 2020, 5,106 companies and investors had committed to 10,658 climate actions registered on the UNFCCC Global Climate Action portal (UNFCCC 2020). Almost 1,000 companies are taking science-based
climate action, and 467 companies have approved targets in line with what the latest climate science says is necessary to meet the goals of the Paris Agreement—to limit global warming to well below 2°C above preindustrial levels and pursue efforts to limit warming to 1.5°C. And as of September 2020, 995 businesses and 38 investors had committed to achieving net-zero carbon emissions by 2050 through the Race to Zero global campaign (UNFCCC 2020). Yet, while corporate commitment to mitigate climate change is growing, only a small fraction of the millions of companies worldwide are taking the lead.
We find that countries are increasingly prioritizing and advancing adaptation efforts given the impetus of the Paris Agreement and the impacts of climate change that communities are already experiencing around the world. And while climate finance has increased significantly in recent years, it is not on scale with the finance needed to transform our energy system and for adaptation.
Lastly, an analysis of progress toward key decarbonization targets indicates that only 2 of the 21 indicators assessed have a historical pace of change commensurate with that required through 2030 and 2050 (see Box 2). However, options exist in all sectors to align emissions trajectories with what the science suggests is necessary to avoid the worst climate impacts.
This year, in the run-up to COP26, countries are requested under the Paris Agreement to update their nationally determined contributions (NDCs) and submit long-term strategies. These commitments to rapidly scale up action will be critical to ensuring that our future is safer, more equitable, and just.

101State of Climate Action: Assessing Progress toward 2030 and 2050
BOX 2 | Summary of sectoral target assessment
The historical rate of change is at or above the required rate of change through 2030 and 2050.
▪ Agriculture: Crop yields
▪ Agriculture: Ruminant meat consumption
The historical rate of change is heading in the right direction but well below required levels for 2030 and 2050.
▪ Power: Share of renewables in electricity generation
▪ Power: Carbon intensity of electricity generation
▪ Power: Share of unabated coal in electricity generation
▪ Buildings: Energy intensity of buildingsa
▪ Buildings: Building renovation rateb
▪ Industry: Carbon intensity of cement production
▪ Industry: Share of electricity in final energy use in industry
▪ Transport: Share of electric vehicles (EVs) in global vehicle fleetc
▪ Transport: Share of EVs in annual new car salesc
▪ Transport: Share of low-carbon fuels in the transport sector
▪ Agriculture: Productivity of ruminant meat production
▪ Forests: Gross tree cover gain
▪ Forests: Gross carbon removals from reforestation
Historical change has been headed in the wrong direction.
▪ Forests: Area of permanent deforestation
▪ Agriculture: Emissions from agricultural production
Data are insufficientd to assess the rate of historical change and the gap in action.
▪ Buildings: Carbon intensity of buildings
▪ Industry: Carbon intensity of steel production
▪ Transport: Carbon intensity of land-based passenger transport
▪ Agriculture: Food loss and wasteNotes: a While no global target is set for building energy intensity, from available historical data (IEA 2020h) current progress is not sufficient to achieve what is needed for a sustainable development scenario in 2030. b While limited historical value of renovation rate data are available to calculate historical rate of change and the rate of change needed to achieve the targets, the 1–2 percent typical current rate of energy renovation (energy intensity reduction of around 15 percent) (IEA 2020a) is not sufficient for the deep renovation target set for 2030 and 2040. c Historical level and historical rate of change are based on IEA (2020d) as a proxy to assess progress made, which is not sufficient with the pace of change needed to achieve the 2030 and 2050 targets.d Notes on targets with insufficient data:The buildings sector carbon intensity of buildings target is marked as “insufficient data” because insufficient (only 2017) historical data are available to assess historical rate of change globally. From the select regions discussed here, the progress is insufficient for some regions or heading in the wrong direction for others. The industry carbon intensity of steel production target is marked as “insufficient data” because insufficient (only 2018) historical data are available to assess the historical progress globally. The transport carbon intensity of land-based passenger transport target is marked as “insufficient data” because historical data are not available to assess the historical rate of change.The agriculture food loss and waste target is marked as “insufficient data” because historical data are not yet available to track this indicator.

WRI.org102
APPENDIX A: COMPILATION OF DATA ORGANIZED BY COUNTRYNotes a–d and g–p in the first table (Brazil) are applicable to all tables. For tables after the one for Brazil, only notes applicable to that country are included.
Brazil
POWER 2018
2030 TARGET (RANGE)
2050 TARGET (RANGE)
HISTORICAL AVERAGE ANNUAL CHANGE
AVERAGE ANNUAL CHANGE TARGET (RANGE), 2018–30
AVERAGE ANNUAL CHANGE TARGET (RANGE), 2018–50
Share of renewablesa in electricity generation (%)
82.3 90 to 100 98 to 100 1.1 0.6 to 1.5 0.5 to 0.6
Share of unabated coal in electricity generation (%)
3.9 0 0 0.01 -0.3 -0.1
Carbon intensity of electricity generation (gCO2/kWh)
99.4 0 to 20 0 -7.42 -6.6 to -8.3 -3.1
BUILDINGS 2015
2030 TARGET (RANGE)
2050 TARGET (RANGE)
HISTORICAL AVERAGE ANNUAL CHANGE
AVERAGE ANNUAL CHANGE TARGET (RANGE), 2018–30
AVERAGE ANNUAL CHANGE TARGET (RANGE), 2018–50
Residential buildingscarbon intensityb
9kgCO2/m²
-50% -95% to-100%
0.2 kgCO2/m² -0.3 kgCO2/m² -0.2 to -0.3kgCO2/m²
Commercial buildings carbon intensityb
63 kgCO2/m²
-75% -100% 1.4 kgCO2/m² -3.2 kgCO2/m² -1.8 kgCO2/m²
Residential buildings energy intensityb
66 kWh/m2 -20% -20% -0.1 kWh/m2 -0.9 kWh/m2 -0.4 kWh/m2
Commercial buildings energy intensityb
353 -10% to -15%
-15% to -30% 2.2 kWh/m2 -2.4 to -3.5 kWh/m2
-1.5 to -3 kWh/m2
Renovation rate for commercial and residential buildingsc
n.d. 2.5% 3.5%p n.d. n.d. n.d.
INDUSTRY 2017
2030 TARGET (RANGE)
2050 TARGET (RANGE)
HISTORICAL AVERAGE ANNUAL CHANGE
AVERAGE ANNUAL CHANGE TARGET (RANGE), 2017–30
AVERAGE ANNUAL CHANGE TARGET (RANGE), 2017–50
Carbon intensity of cement production (kgCO2/t)
585 410 to 420(-28% to 30%)
60 to 95(-84% to -90%)
5d -12.7 to -13.4 -14.8 to -15.9
Carbon intensity of steel production (kgCO2/t)
1,436a 1,305 to 1,390(-3% to -9%)
0 to 195(-86% to -100%)m
12 -3.8 to -10.9 -38.8 to -44.9
Share of electricity in final energy use in industry (%)
22 30 to 35 50 to 60 -0.03 0.6 to 1.0 0.9 to 1.2
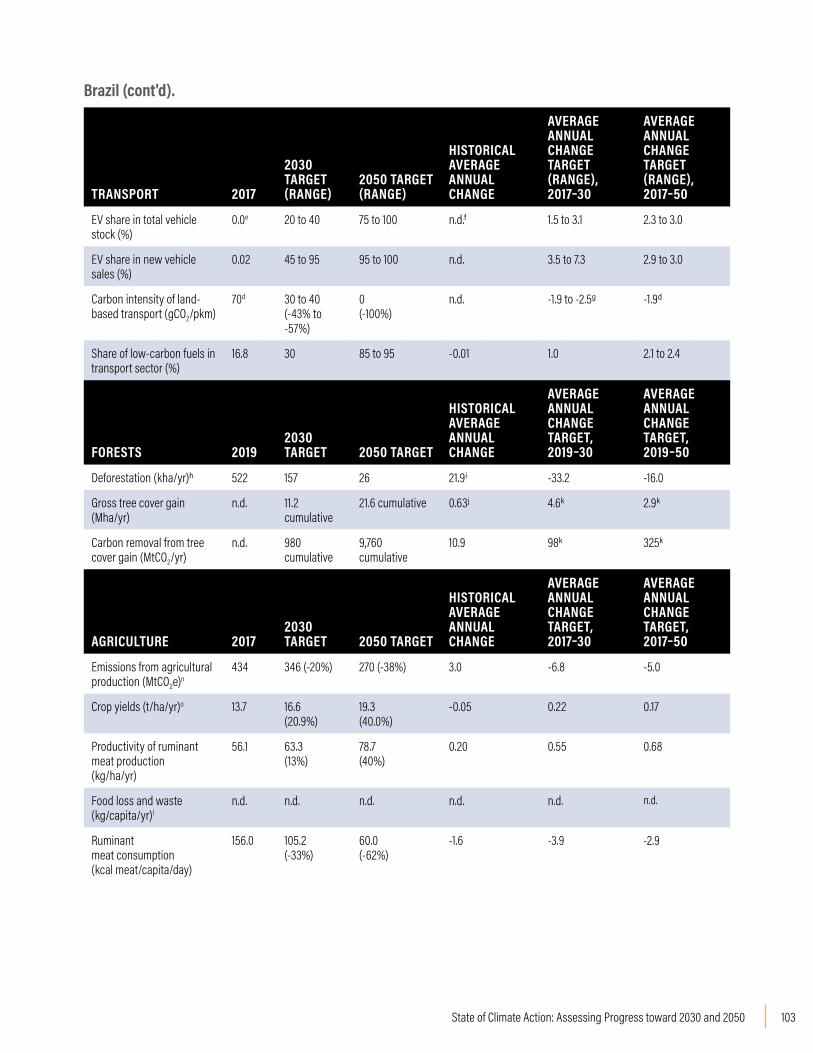
103State of Climate Action: Assessing Progress toward 2030 and 2050
TRANSPORT 2017
2030 TARGET (RANGE)
2050 TARGET (RANGE)
HISTORICAL AVERAGE ANNUAL CHANGE
AVERAGE ANNUAL CHANGE TARGET (RANGE), 2017–30
AVERAGE ANNUAL CHANGE TARGET (RANGE), 2017–50
EV share in total vehicle stock (%)
0.0e 20 to 40 75 to 100 n.d.f 1.5 to 3.1 2.3 to 3.0
EV share in new vehicle sales (%)
0.02 45 to 95 95 to 100 n.d. 3.5 to 7.3 2.9 to 3.0
Carbon intensity of land-based transport (gCO2/pkm)
70d 30 to 40(-43% to -57%)
0(-100%)
n.d. -1.9 to -2.5g -1.9d
Share of low-carbon fuels in transport sector (%)
16.8 30 85 to 95 -0.01 1.0 2.1 to 2.4
FORESTS 20192030 TARGET 2050 TARGET
HISTORICAL AVERAGE ANNUAL CHANGE
AVERAGE ANNUAL CHANGE TARGET, 2019–30
AVERAGE ANNUAL CHANGE TARGET, 2019–50
Deforestation (kha/yr)h 522 157 26 21.9i -33.2 -16.0
Gross tree cover gain (Mha/yr)
n.d. 11.2 cumulative
21.6 cumulative 0.63j 4.6k 2.9k
Carbon removal from tree cover gain (MtCO2/yr)
n.d. 980cumulative
9,760cumulative
10.9 98k 325k
AGRICULTURE 20172030 TARGET 2050 TARGET
HISTORICAL AVERAGE ANNUAL CHANGE
AVERAGE ANNUAL CHANGE TARGET, 2017–30
AVERAGE ANNUAL CHANGE TARGET, 2017–50
Emissions from agricultural production (MtCO2e)n
434 346 (-20%) 270 (-38%) 3.0 -6.8 -5.0
Crop yields (t/ha/yr)o 13.7 16.6(20.9%)
19.3(40.0%)
-0.05 0.22 0.17
Productivity of ruminant meat production(kg/ha/yr)
56.1 63.3(13%)
78.7(40%)
0.20 0.55 0.68
Food loss and waste (kg/capita/yr)l
n.d. n.d. n.d. n.d. n.d. n.d.
Ruminant meat consumption (kcal meat/capita/day)
156.0 105.2(-33%)
60.0(-62%)
-1.6 -3.9 -2.9
Brazil (cont'd).

WRI.org104
Notes:
n.d. indicates no data.
a Renewables include electricity from hydro, geothermal, solar, wind, tide, wave, biofuels, and the renewable fraction of municipal waste.
b Targets are defined as percent reduction from 2015 levels. While 2017 historical data are available for most countries assessed, 2015 is chosen as the base year for establishing targets in CAT (2020).
c The IEA estimates that the typical energy renovation rate is 1–2 percent for building stock per year, with less than 15 percent energy intensity reduction in general, while deep renovation of 30–50 percent energy intensity reduction is what’s needed for a sustainable development scenario. No country-level historical data are available for this indicator.
d Historical trend data are available only for 2012–17.
e 2010 data shown for Brazil.
f Historical rate of change is not calculated here since the base level is 0.
g Initial carbon intensity of land-based passenger transport data are from 2014.
h Deforestation includes losses from commodity driven deforestation, urbanization, and shifting agriculture in primary forests.
i Historical rate of change looks at 2001–19 rather than the most recent five years in other sectors to better account for variation in deforestation year to year.
j Data are insufficient to track current levels of forest gain, so average annual tree cover gain 2000–2012 is used as a proxy.
k Average annual change target is reported from 2020 to 2030.
l National data are not available.
m An aspirational target of 100 percent emissions intensity reduction by 2050 is set for all countries. This may be achieved with innovative technologies and developments currently being researched.
n FAOSTAT emissions adjustments include a higher global warming potential value for methane (methane absorbs approximately 34 times more heat energy than carbon dioxide over a period of 100 years) based on the most recent IPCC recommendations, and a higher amount of agricultural energy use calculated by the GlobAgri-WRR model based on estimates from the U.S. Environmental Protection Agency and FAO.
o Yields are weighted averages across all crops, as given in FAO (2020). Outlying observations (e.g., in former Soviet Union) are likely due to data limitations rather than being truly representative of conditions.
p Target is for 2040. No target is established for 2050 because it is expected that all buildings will be renovated by that time.
Sources: IEA (2020a, 2020g, 2019a); CAT (2020a, 2020b); GFW (2020); Roe et al. (2019); Griscom et al. (2017); FAO (2020, 2011a); Searchinger et al. (2019).
China
POWER 2018
2030 TARGET (RANGE)
2050 TARGET (RANGE)
HISTORICAL AVERAGE ANNUAL CHANGE
AVERAGE ANNUAL CHANGE TARGET (RANGE), 2018–30
AVERAGE ANNUAL CHANGE TARGET (RANGE), 2018–50
Share of renewables in electricity generation (%)
26 90 to 100 98 to 100 1.1 4.1 to 5.3 2.3
Share of unabated coal in electricity generation (%)
66.5 5 to 10 0 -1.7 -5.1 to -4.7 -2.1
Carbon intensity of electricity generation(gCO2/kWh)
634.3 100 to 110 0 -21.14 -43.7 to -44.5 -19.8

105State of Climate Action: Assessing Progress toward 2030 and 2050
BUILDINGS 2015
2030 TARGET (RANGE)
2050 TARGET (RANGE)
HISTORICAL AVERAGE ANNUAL CHANGE
AVERAGE ANNUAL CHANGE TARGET (RANGE), 2015-30
AVERAGE ANNUAL CHANGE TARGET (RANGE), 2015-50
Residential buildingscarbon intensity
22 kgCO2/m2 -60% -100% 0.4 kgCO2/m2 -0.9 kgCO2/m2 -0.6 kgCO2/m2
Commercial buildings carbon intensity
49 kgCO2/m2 -65% -100% -1.1 kgCO2/m2 -2.1 kgCO2/m2 -1.4 kgCO2/m2
Residential buildings energy intensity
79 kWh/m2 -20% -50% 0.7 kWh/m2 -1.1 kWh/m2 -1.1 kWh/m2
Commercial buildings energy intensity
115 kWh/m2 -10% to -15% -35% to -45% -0.6 kWh/m2 -0.8 to -1.2 kWh/m2 -1.2 to -1.5 kWh/m2
Renovation rate for commercial and residential buildings
n.d. 2.5% 3.5 n.d. n.d. n.d.
INDUSTRY 2017
2030 TARGET (RANGE)
2050 TARGET (RANGE)
HISTORICAL AVERAGE ANNUAL CHANGE
AVERAGE ANNUAL CHANGE TARGET (RANGE), 2017–30
AVERAGE ANNUAL CHANGE TARGET (RANGE), 2017–50
Carbon intensity of cement production (kgCO2/t)b
550 395 to 405(-26% to-28%)
60 to 90(-84% to-89%)
-13 -11.1 to -11.9 -13.9 to -14.8
Carbon intensity of steel production (kgCO2/t)
1,856 1,290 to 1,335 (-28% to -30%)
0 to 100 (-95% to -100%)
-37 -43.4 to -47.2 -54.9 to -58 kgCO2/t
Share of electricity in final energy use in industry (%)
30 45 to 55 60 to 85 1.16 1.2 to 1.9 0.9 to 1.7
TRANSPORT 2017
2030 TARGET (RANGE
2050 TARGET (RANGE)
HISTORICAL AVERAGE ANNUAL CHANGE
AVERAGE ANNUAL CHANGE TARGET (RANGE), 2017–30
AVERAGE ANNUAL CHANGE TARGET (RANGE), 2017–50
EV share in total vehicle stocka (%)
0.17 35 to 50 80 to 100 n.d. 2.7 to 3.8 2.4 to 3.0
EV share in new vehicle salesa (%)
0.54 95 to 100 100 n.d. 7.3 to 7.7 3.0
Carbon intensity of land-based transport (gCO2/pkm)
62 25 to 40 (-35% to -60%)
0 (-100%) n.d. -1.4 to -2.3 -1.7
Share of low-carbon fuels in transport sector (%)
4.1 15 to 20 70 to 95 0.07 0.8 to 1.2 2.0 to 2.8
China (cont'd).

WRI.org106
FORESTS 20192030 TARGET
2050 TARGET
HISTORICAL AVERAGE ANNUAL CHANGE
AVERAGE ANNUAL CHANGE TARGET, 2019–30
AVERAGE ANNUAL CHANGE TARGET, 2019–50
Deforestation (kha/yr) 9 3 0.5 0.3 -0.6 -0.3
Gross tree cover gain (Mha/yr)
n.d. 48.8 cumulative
94.5 cumulative
0.63 4.6 2.9
Carbon removal from tree cover gain (MtCO2/yr)
n.d. 1,050cumulative
10,450 cumulative
1.9 105 348
AGRICULTURE 2017
2030 TARGET (% CHANGE)
2050 TARGET (% CHANGE)
HISTORICAL AVERAGE ANNUAL CHANGE
AVERAGE ANNUAL CHANGE TARGET, 2017–30
AVERAGE ANNUAL CHANGE TARGET, 2017–50
Emissions from agricultural production (MtCO2e)
1,389 979(-30%)
580(-58%)
1.8 -31.5 -24.5
Crop yields (t/ha/yr) 9.6 10.9 (14.0%) 13.9(45.3%)
0.11 0.10 0.1
Productivity of ruminant meat production (kg/ha/yr)
28.2 39.2 (39%) 52.7 (87%) 0.44 0.85 0.7
Food loss and waste (kg/capita/yr)
n.d. n.d. n.d. n.d. n.d. n.d.
Ruminant meat consumption (kcal meat/capita/day)
48.0 49.4(3%)
60.0 (25%) 0.8 0.1 0.4
Notes: n.d. indicates no data.a Two- and three-wheelers included.b The latest available historical data for China are from 2015.Sources: IEA (2020a, 2020g, 2019a); CAT (2020a, 2020b); GFW (2020); Roe et al. (2019); Griscom et al. (2017); FAO (2020, 2011a); Searchinger et al. (2019).
EU28
POWER 2018
2030 TARGET (RANGE)
2050 TARGET (RANGE)
HISTORICAL AVERAGE ANNUAL CHANGE
AVERAGE ANNUAL CHANGE TARGET (RANGE), 2018–30
AVERAGE ANNUAL CHANGE TARGET (RANGE), 2018–50
Share of renewables in electricity generation (%)
32.3 70 to 90 98 to 100 1.1 3.1 to 4.8 2.1
Share of unabated coal in electricity generation (%)
20.1 0 0 -1.5 -1.7 -0.6
Carbon intensity of electricity generation (gCO2/kWh)
283.0 75 to 80 0 -11.11 -16.9 to -17.3 -8.8
China (cont'd).

107State of Climate Action: Assessing Progress toward 2030 and 2050
BUILDINGS 2015
2030 TARGET (RANGE)
2050 TARGET (RANGE)
HISTORICAL AVERAGE ANNUAL CHANGE
AVERAGE ANNUAL CHANGE TARGET (RANGE), 2018–30
AVERAGE ANNUAL CHANGE TARGET (RANGE), 2018–50
Residential buildingscarbon intensity
36kgCO2/m²
-60% -100% -1.7 kgCO2/m² -1.4 kgCO2/m² -1.0 kgCO2/m²
Commercial buildings carbon intensity
60 kgCO2/m2
-75% -100% -2.4 kgCO2/m² -3.0 kgCO2/m² -1.7 kgCO2/m²
Residential buildings energy intensity
161 kWh/m²
-30% -60% -4.1 kWh/m² -3.2 kWh/m² -2.8 kWh/m²
Commercial buildings energy intensity
209 kWh/m²
-20% to -25%
-40% to -50% -2.5 kWh/ m² -2.8 to -3.5 kWh/m² -0.6 to -0.8 kWh/m²
Renovation rate for commercial and residential buildings
n.d. 3.5% 3.5% n.d. n.d. n.d.
INDUSTRY 2017
2030 TARGET (RANGE)
2050 TARGET (RANGE)
HISTORICAL AVERAGE ANNUAL CHANGE
AVERAGE ANNUAL CHANGE TARGET (RANGE), 2017–30
AVERAGE ANNUAL CHANGE TARGET (RANGE), 2017–50
Carbon intensity of cement production (kgCO2/t)
559 355 to 365(-35% to 36%)
60 to 95(-83% to -89%)
-3 -14.9 to -15.7 -14.1 to -15.1
Carbon intensity of steel production (kgCO2/t)
1,178a 680 to 700(-41% to -42%)
0 to 75(-94% to -100%)
-29a -39.8 to -41.5a -34.5 to -36.8a
Share of electricity in final energy use in industry (%)
34 40 to 60 45 to 75 0.18 0.5 to 2.0 0.3 to 1.2
TRANSPORT 2017
2030 TARGET (RANGE)
2050 TARGET (RANGE)
HISTORICAL AVERAGE ANNUAL CHANGEB
AVERAGE ANNUAL CHANGE TARGET (RANGE), 2017–30
AVERAGE ANNUAL CHANGE TARGET (RANGE), 2017–50
EV share in total vehicle stock (%)
0.29 40 to 55 95 to 100 n.d. 3.1 to 4.2 2.9 to 3.0
EV share in new vehicle sales (%)
1.0 95 to 100 100 n.d. 7.3 to 7.7 3.0
Carbon intensity of land-based transport (gCO2/pkm)
118d 50 (-58%) 0 (-100%) n.d. -4.3d -3.3d
Share of low-carbon fuels in transport sector (%)
6.1 15 to 20 80 to 95 0.08 0.7 to 1.1 2.2 to 2.7
EU28 (cont'd).

WRI.org108
FORESTSc 20192030 TARGET
2050 TARGET
HISTORICAL AVERAGE ANNUAL CHANGE
AVERAGE ANNUAL CHANGE TARGET, 2019–30
AVERAGE ANNUAL CHANGE TARGET, 2019–50
Deforestation (kha/yr) n.d. n.d. n.d. n.d. n.d. n.d.
Gross tree cover gain (Mha/yr)
n.d. n.d. n.d. n.d. n.d. n.d.
Carbon removal from tree cover gain (MtCO2/yr)
n.d. n.d. n.d. n.d. n.d. n.d.
AGRICULTURE 20172030 TARGET
2050 TARGET
HISTORICAL AVERAGE ANNUAL CHANGE
AVERAGE ANNUAL CHANGE TARGET, 2017–30
AVERAGE ANNUAL CHANGE TARGET, 2017–50
Emissions from agricultural production (MtCO2e)
554 435 (-22%) 321 (-42%) 2.6 -9.2 -7.1
Crop yields (t/ha/yr) 7.9 7.8 (0%) 9.1 (15.7%) 0.2 0.0 0.04
Productivity of ruminant meat production (kg/ha/yr)
131.0 160.4 (22%) 188.1 (44%) 0.7 2.3 1.7
Food loss and waste (kg/capita/yr)
n.d. n.d. n.d. n.d. n.d. n.d.
Ruminant meat consumption (kcal meat/capita/day)
73.7 69.7 (-5%) 60.0(-19%)
0.7 -0.3 -0.4
Notes:
n.d. indicates no data.a Initial carbon intensity of steel production data are from 2018. b Historical rate of change is not calculated here since the base level is 0.c GFW does not track data for the European Union as a whole.d Initial carbon intensity of land-based passenger transport data are from 2014.Sources: IEA (2020a, 2020g, 2019a); CAT (2020a, 2020b); GFW (2020); Roe et al. (2019); Griscom et al. (2017); FAO (2020, 2011a); Searchinger et al. (2019).
India
POWER 2018
2030 TARGET (RANGE)
2050 TARGET (RANGE)
HISTORICAL AVERAGE ANNUAL CHANGE
AVERAGE ANNUAL CHANGE TARGET (RANGE)
AVERAGE ANNUAL CHANGE TARGET (RANGE)
Share of renewables in electricity generation (%)
18.9 65 to 80 98 to 100 0.3 3.8 to 5.1 2.5
Share of unabated coal in electricity generation (%)
73.5 5 to 10 0 0.1 -5.7 to -5.3 -2.3
Carbon intensity of electricity generation (gCO2/kWh)
737.1 115 to 155 0 -13.02 -48.5 to -51.8 -23.0
EU28 (cont'd).
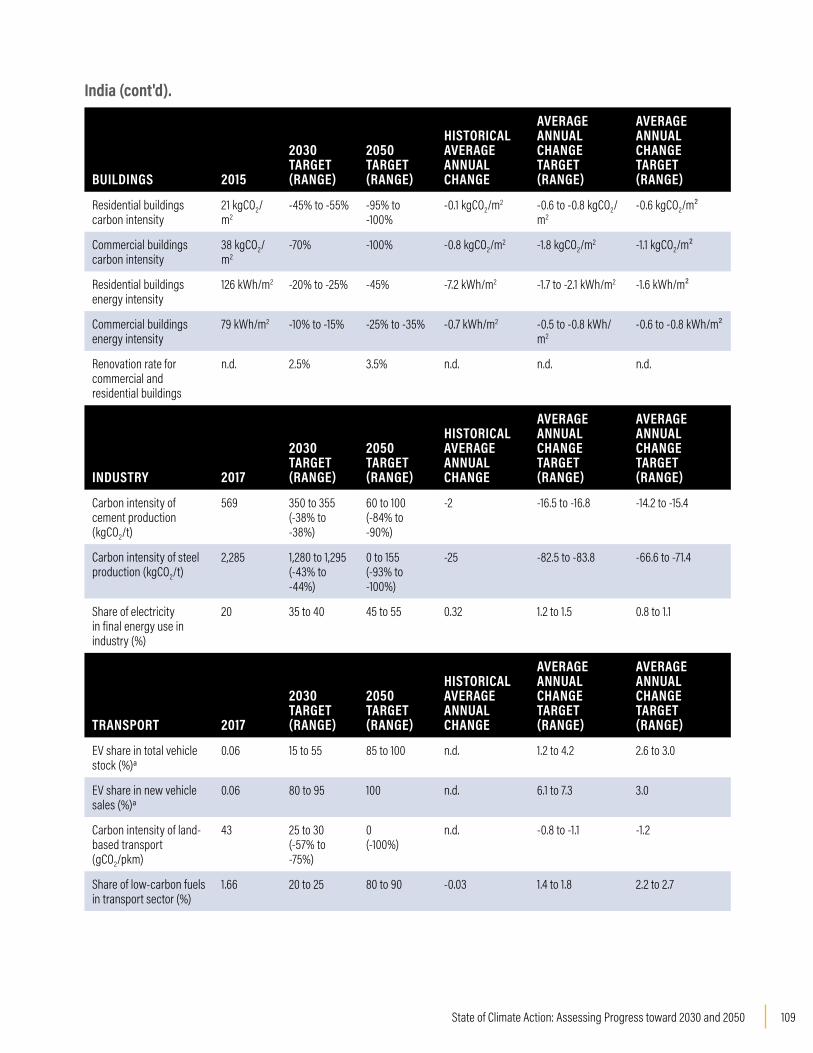
109State of Climate Action: Assessing Progress toward 2030 and 2050
BUILDINGS 2015
2030 TARGET (RANGE)
2050 TARGET (RANGE)
HISTORICAL AVERAGE ANNUAL CHANGE
AVERAGE ANNUAL CHANGE TARGET (RANGE)
AVERAGE ANNUAL CHANGE TARGET (RANGE)
Residential buildingscarbon intensity
21 kgCO2/m2
-45% to -55% -95% to -100%
-0.1 kgCO2/m2 -0.6 to -0.8 kgCO2/m2
-0.6 kgCO2/m²
Commercial buildings carbon intensity
38 kgCO2/m2
-70% -100% -0.8 kgCO2/m2 -1.8 kgCO2/m2 -1.1 kgCO2/m²
Residential buildings energy intensity
126 kWh/m2 -20% to -25% -45% -7.2 kWh/m2 -1.7 to -2.1 kWh/m2 -1.6 kWh/m²
Commercial buildings energy intensity
79 kWh/m2 -10% to -15% -25% to -35% -0.7 kWh/m2 -0.5 to -0.8 kWh/m2
-0.6 to -0.8 kWh/m²
Renovation rate for commercial and residential buildings
n.d. 2.5% 3.5% n.d. n.d. n.d.
INDUSTRY 2017
2030 TARGET (RANGE)
2050 TARGET (RANGE)
HISTORICAL AVERAGE ANNUAL CHANGE
AVERAGE ANNUAL CHANGE TARGET (RANGE)
AVERAGE ANNUAL CHANGE TARGET (RANGE)
Carbon intensity of cement production (kgCO2/t)
569 350 to 355(-38% to -38%)
60 to 100(-84% to -90%)
-2 -16.5 to -16.8 -14.2 to -15.4
Carbon intensity of steel production (kgCO2/t)
2,285 1,280 to 1,295 (-43% to -44%)
0 to 155(-93% to -100%)
-25 -82.5 to -83.8 -66.6 to -71.4
Share of electricity in final energy use in industry (%)
20 35 to 40 45 to 55 0.32 1.2 to 1.5 0.8 to 1.1
TRANSPORT 2017
2030 TARGET (RANGE)
2050 TARGET (RANGE)
HISTORICAL AVERAGE ANNUAL CHANGE
AVERAGE ANNUAL CHANGE TARGET (RANGE)
AVERAGE ANNUAL CHANGE TARGET (RANGE)
EV share in total vehicle stock (%)a
0.06 15 to 55 85 to 100 n.d. 1.2 to 4.2 2.6 to 3.0
EV share in new vehicle sales (%)a
0.06 80 to 95 100 n.d. 6.1 to 7.3 3.0
Carbon intensity of land-based transport (gCO2/pkm)
43 25 to 30(-57% to -75%)
0(-100%)
n.d. -0.8 to -1.1 -1.2
Share of low-carbon fuels in transport sector (%)
1.66 20 to 25 80 to 90 -0.03 1.4 to 1.8 2.2 to 2.7
India (cont'd).

WRI.org110
FORESTS 20192030 TARGET
2050 TARGET
HISTORICAL AVERAGE ANNUAL CHANGE
AVERAGE ANNUAL CHANGE TARGET
AVERAGE ANNUAL CHANGE TARGET
Deforestation (kha/yr) 7 2 0.3 0.3 -0.5 -0.2
Gross tree cover gain (Mha/yr)
n.d. 13.6 cumulative
26.4 cumulative
0.02 1.4 0.9
Carbon removal from tree cover gain (MtCO2/yr)
n.d. 290cumulative
2,920cumulative
0.4 29 97
AGRICULTURE 20172030 TARGET
2050 TARGET
HISTORICAL AVERAGE ANNUAL CHANGE
AVERAGE ANNUAL CHANGE TARGET
AVERAGE ANNUAL CHANGE TARGET
Emissions from agricultural production (MtCO2e)
974 802 (-18%) 655 (-33%) 3.8 -13.2 -9.7
Crop yields (t/ha/yr) 5.0 6.6 (34.3%) 8.8 (78.4%) 0.01 0.12 0.12
Productivity of ruminant meat production (kg/ha/yr)b
325.5 443.9 (36%) 551.7 (69%) 0.83 9.11 6.85
Food loss and waste (kg/capita/yr)
n.d. n.d. n.d. n.d. n.d. n.d.
Ruminant meat consumption (kcal meat/capita/day)
5.0 19.9 (298%) 27.4 (448%) -0.4 1.2 0.7
Notes: n.d. indicates no data.
a Two- and three-wheelers included.
b Outlying observations (e.g., in India) are likely due to data limitations rather than being truly representative of conditions.
Sources: IEA (2020a, 2020g, 2019a); CAT (2020a, 2020b); GFW (2020); Roe et al. (2019); Griscom et al. (2017); FAO (2020, 2011a); Searchinger et al. (2019).
Indonesia
POWER 2018
2030 TARGET (RANGE)
2050 TARGET (RANGE)
HISTORICAL AVERAGE ANNUAL CHANGE
AVERAGE ANNUAL CHANGE TARGET (RANGE)
AVERAGE ANNUAL CHANGE TARGET (RANGE)
Share of renewables in electricity generation (%)
17.2 55 to 85 98 to 100 1.0 3.1 to 5.7 2.6
Share of unabated coal in electricity generation (%)
56.4 5 to 10 0 1.0 -4.3 to -3.9 -1.8
Carbon intensity of electricity generation (gCO2/kWh)
761.1 50 to 255 0 19.15 -42.2 to -59.3 -23.9
India (cont'd).

111State of Climate Action: Assessing Progress toward 2030 and 2050
BUILDINGS 2015
2030 TARGET (RANGE)
2050 TARGET (RANGE)
HISTORICAL AVERAGE ANNUAL CHANGE
AVERAGE ANNUAL CHANGE TARGET (RANGE)
AVERAGE ANNUAL CHANGE TARGET (RANGE)
Residential buildingscarbon intensity
n.d. n.d. n.d. n.d. n.d. n.d.
Commercial buildings carbon intensity
n.d. n.d. n.d. n.d. n.d. n.d.
Residential buildings energy intensity
n.d. n.d. n.d. n.d. n.d. n.d.
Commercial buildings energy intensity
n.d. n.d. n.d. n.d. n.d. n.d.
Renovation rate for commercial and residential buildings
n.d. n.d. n.d. n.d. n.d. n.d.
INDUSTRY 2017
2030 TARGET (RANGE)
2050 TARGET (RANGE)
HISTORICAL AVERAGE ANNUAL CHANGE
AVERAGE ANNUAL CHANGE TARGET (RANGE)
AVERAGE ANNUAL CHANGE TARGET (RANGE)
Carbon intensity of cement production (kgCO2/t)
654 400 to 410 (-37% to-39%)
60 to 95 (-85% to-91%)
-2 -18.8 to -19.5 -16.9 to -18
Carbon intensity of steel production (kgCO2/t)
1,656a 1,585 to 1,600 (-3% to -4%)
0 to 190 (-89% to -100%)
n.d. -4.7 to -5.9 -45.8 to -51.8
Share of electricity in final energy use in industry (%)
14 20 to 35 25 to 50 0.40 0.5 to 1.6 0.3 to 1.1
TRANSPORT 2017
2030 TARGET (RANGE)
2050 TARGET (RANGE)
HISTORICAL AVERAGE ANNUAL CHANGE
AVERAGE ANNUAL CHANGE TARGET (RANGE)
AVERAGE ANNUAL CHANGE TARGET (RANGE)
EV share in total vehicle stock (%)b
0.0c 10 to 45 70 to 100 n.d. 0.8 to 3.5 2.1 to 3.0
EV share in new vehicle sales (%)b
0.0c 95 100 n.d. 7.3 3.0
Carbon intensity of land-based transport (gCO2/pkm)
81 20 to 35(-30% to -42%)
0 (-100%) n.d. -2.9 to -3.8 -2.3
Share of low-carbon fuels in transport sector (%)
3.61 15 to 20 75 to 95 0.43 0.9 to 1.3 2.2 to 2.8
Indonesia (cont'd).
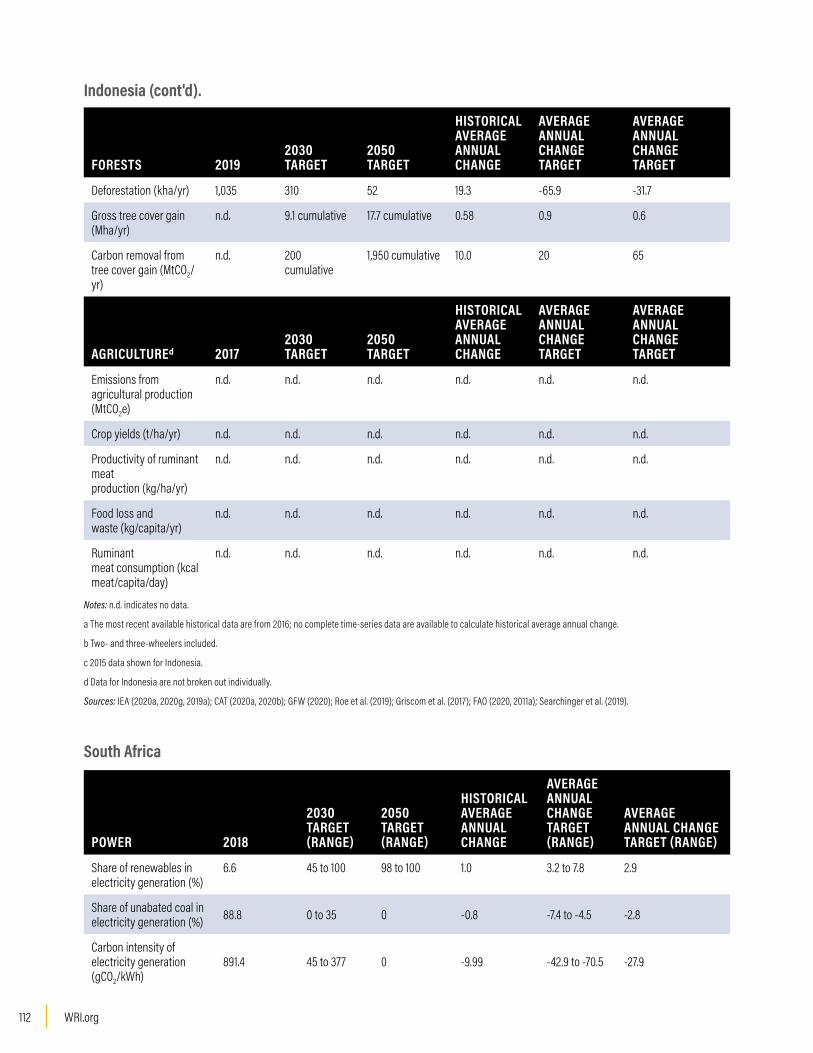
WRI.org112
FORESTS 20192030 TARGET
2050 TARGET
HISTORICAL AVERAGE ANNUAL CHANGE
AVERAGE ANNUAL CHANGE TARGET
AVERAGE ANNUAL CHANGE TARGET
Deforestation (kha/yr) 1,035 310 52 19.3 -65.9 -31.7
Gross tree cover gain (Mha/yr)
n.d. 9.1 cumulative 17.7 cumulative 0.58 0.9 0.6
Carbon removal from tree cover gain (MtCO2/yr)
n.d. 200 cumulative
1,950 cumulative 10.0 20 65
AGRICULTUREd 20172030 TARGET
2050 TARGET
HISTORICAL AVERAGE ANNUAL CHANGE
AVERAGE ANNUAL CHANGE TARGET
AVERAGE ANNUAL CHANGE TARGET
Emissions from agricultural production (MtCO2e)
n.d. n.d. n.d. n.d. n.d. n.d.
Crop yields (t/ha/yr) n.d. n.d. n.d. n.d. n.d. n.d.
Productivity of ruminant meat production (kg/ha/yr)
n.d. n.d. n.d. n.d. n.d. n.d.
Food loss and waste (kg/capita/yr)
n.d. n.d. n.d. n.d. n.d. n.d.
Ruminant meat consumption (kcal meat/capita/day)
n.d. n.d. n.d. n.d. n.d. n.d.
Notes: n.d. indicates no data.
a The most recent available historical data are from 2016; no complete time-series data are available to calculate historical average annual change.
b Two- and three-wheelers included.
c 2015 data shown for Indonesia.
d Data for Indonesia are not broken out individually.
Sources: IEA (2020a, 2020g, 2019a); CAT (2020a, 2020b); GFW (2020); Roe et al. (2019); Griscom et al. (2017); FAO (2020, 2011a); Searchinger et al. (2019).
South Africa
POWER 2018
2030 TARGET (RANGE)
2050 TARGET (RANGE)
HISTORICAL AVERAGE ANNUAL CHANGE
AVERAGE ANNUAL CHANGE TARGET (RANGE)
AVERAGE ANNUAL CHANGE TARGET (RANGE)
Share of renewables in electricity generation (%)
6.6 45 to 100 98 to 100 1.0 3.2 to 7.8 2.9
Share of unabated coal in electricity generation (%) 88.8 0 to 35 0 -0.8 -7.4 to -4.5 -2.8
Carbon intensity of electricity generation (gCO2/kWh)
891.4 45 to 377 0 -9.99 -42.9 to -70.5 -27.9
Indonesia (cont'd).

113State of Climate Action: Assessing Progress toward 2030 and 2050
BUILDINGS 2015
2030 TARGET (RANGE)
2050 TARGET (RANGE)
HISTORICAL AVERAGE ANNUAL CHANGE
AVERAGE ANNUAL CHANGE TARGET (RANGE)
AVERAGE ANNUAL CHANGE TARGET (RANGE)
Residential buildingscarbon intensitya
64 kgCO2/m2 -50% -100% 0 kgCO2/m2 -2.1 kgCO2/m2 -1.8 kgCO2/m2
Commercial buildings carbon intensity
130 kgCO2/m2 -70% -100% -1.1b kgCO2/m2 -6.1 kgCO2/m2 -3.7 kgCO2/m2
Residential buildings energy intensity
135 kWh/m2 -25% -45% 0.0 kWh/m2 -2.3 kWh/m2 -1.7 kWh/m2
Commercial buildings energy intensity
180 kWh/m2 -25% to -30% -45% to -50% 5.3 kWh/m2 -3 to -3.6 kWh/m2
-2.3 to -2.6 kWh/m2
Renovation rate for commercial and residential buildings
n.d. 2.5% 3.5% n.d. n.d. n.d.
INDUSTRY 2017
2030 TARGET (RANGE)
2050 TARGET (RANGE)
HISTORICAL AVERAGE ANNUAL CHANGE
AVERAGE ANNUAL CHANGE TARGET (RANGE)
AVERAGE ANNUAL CHANGE TARGET (RANGE)
Carbon intensity of cement production (kgCO2/t)
633 335 to 345(-45% to -47%)
55 to 90(-86% to -91%)
2 -22.2 to -22.9 -16.5 to -17.5
Carbon intensity of steel production (kgCO2/t)
2,295b 1,620 to 1,630 (-29% to -29%)
0 to 215 (-91% to -100%)
n.d. -55.4 to -56.3 -65 to -71.7
Share of electricity in final energy use in industry (%)
42 45 to 60 55 to 75 -0.05 0.2 to 1.4 0.4 to 1.0
TRANSPORT 2017
2030 TARGET (RANGE)
2050 TARGET (RANGE)
HISTORICAL AVERAGE ANNUAL CHANGE
AVERAGE ANNUAL CHANGE TARGET (RANGE)
AVERAGE ANNUAL CHANGE TARGET (RANGE)
EV share in total vehicle stock (%)
0.02 30 to 50 85 to 100 n.d. 2.3 to 3.8 2.6 to 3.0
EV share in new vehicle sales (%)
0.1 50 to 95 100 n.d. 3.8 to 7.3 3.0
Carbon intensity of land-based transport (gCO2/pkm)
92 30 to 70(-24% to -67%)
0 (-100%) n.d. -1.4 to -3.9 -2.6
Share of low-carbon fuels in transport sector (%)
1.77 20 80 to 90 -0.03 1.4 2.4 to 2.7
South Africa (cont'd).

WRI.org114
FORESTS 20172030 TARGET
2050 TARGET
HISTORICAL AVERAGE ANNUAL CHANGE
AVERAGE ANNUAL CHANGE TARGET
AVERAGE ANNUAL CHANGE TARGET (RANGE)
Deforestation (kha/yr) n.d. n.d. n.d. n.d. n.d. n.d.
Gross tree cover gain (Mha/yr)
n.d. n.d. n.d. n.d. n.d. n.d.
Carbon removal from tree cover gain (MtCO2/yr)
n.d. n.d. n.d. n.d. n.d. n.d.
AGRICULTURE 20192030 TARGET
2050 TARGET
HISTORICAL AVERAGE ANNUAL CHANGE
AVERAGE ANNUAL CHANGE TARGET
AVERAGE ANNUAL CHANGE TARGET (RANGE)
Emissions from agricultural production (MtCO2e)
n.d. n.d. n.d. n.d. n.d. n.d.
Crop yields (t/ha/yr) n.d. n.d. n.d. n.d. n.d. n.d.
Productivity of ruminant meat production (kg/ha/yr)
n.d. n.d. n.d. n.d. n.d. n.d.
Food loss and waste (kg/capita/yr)
n.d. n.d. n.d. n.d. n.d. n.d.
Ruminant meat consumption (kcal meat/capita/day)
n.d. n.d. n.d. n.d. n.d. n.d.
Notes: n.d. indicates no data.
a 2005–15 percentage change is calculated for South Africa due to data availability.
b The most recent available historical data are from 2016; no complete time-series data are available to calculate historical average annual change.
Sources: IEA (2020a, 2020g, 2019a); CAT (2020a, 2020b); GFW (2020); Roe et al. (2019); Griscom et al. (2017); FAO (2020, 2011a); Searchinger et al. (2019).
United States
POWER 2018
2030 TARGET (RANGE)
2050 TARGET (RANGE)
HISTORICAL AVERAGE ANNUAL CHANGE
AVERAGE ANNUAL CHANGE TARGET (RANGE)
AVERAGE ANNUAL CHANGE TARGET (RANGE)
Share of renewables in electricity generation (%)
17.0 50 to 95 98 to 100 0.8 2.8 to 6.5 2.6
Share of unabated coal in electricity generation (%)
28.6 0 0 -2.2 -2.4 -0.9
Carbon intensity of electricity generation (gCO2/kWh)
396.9 30 to 130 0 -15.01 -22.2 to -30.6 -12.4
South Africa (cont'd).

115State of Climate Action: Assessing Progress toward 2030 and 2050
BUILDINGS 2015
2030 TARGET (RANGE)
2050 TARGET (RANGE)
HISTORICAL AVERAGE ANNUAL CHANGE
AVERAGE ANNUAL CHANGE TARGET (RANGE)
AVERAGE ANNUAL CHANGE TARGET (RANGE)
Residential buildingscarbon intensity
46 kgCO2/m2
-65% -100% -1.5 kgCO2/m2 -2.0 kgCO2/m2 -1.3 kgCO2/m2
Commercial buildings carbon intensity
113 kgCO2/m2
-75% -100% -3.3 kgCO2/m2 -5.7 kgCO2/m2 -3.2 kgCO2/m2
Residential buildings energy intensity
138 kWh/m2 -25% to -30% -60% -1.2 kWh/m2 -2.3 to -2.8 kWh/m2
-2.4 kWh/m2
Commercial buildings energy intensity
305 kWh/m2
-20% to -25% -40% to -50% -0.4a -4.1 to -5.1 -3.5 to -4.4
Renovation rate for commercial and residential buildings
n.d. 3.5% 3.5% n.d. n.d. n.d.
INDUSTRY 2017
2030 TARGET (RANGE)
2050 TARGET (RANGE)
HISTORICAL AVERAGE ANNUAL CHANGE
AVERAGE ANNUAL CHANGE TARGET (RANGE)
AVERAGE ANNUAL CHANGE TARGET (RANGE)
Carbon intensity of cement production (kgCO2/t)
731 380 to 390 (-47% to-48%)
55 to 90 (-86% to-92%)
5 -26.2 to -27 -19.4 to -20.5
Carbon intensity of steel production (kgCO2/t)
1,142 930 to 945 (-17% to-19%)
0 to 70 (-94% to -100%)
-27 -16.4 to -17.7 -33.5 to -35.7
Share of electricity in final energy use in industry (%)
26 35 to 50 55 to 70 -0.10 0.7 to 1.9 0.9 to 1.3
TRANSPORT 2017
2030 TARGET (RANGE)
2050 TARGET (RANGE)
HISTORICAL AVERAGE ANNUAL CHANGE
AVERAGE ANNUAL CHANGE TARGET (RANGE)
AVERAGE ANNUAL CHANGE TARGET (RANGE)
EV share in total vehicle stock (%)
0.31 30 to 40 85 to 100 n.d. 2.3 to 3.1 2.6 to 3.0
EV share in new vehicle sales (%)
1.1 95 to 100 100 n.d. 7.2 to 7.6 3.0
Carbon intensity of land-based transport (gCO2/pkm)
237 50 to 100 (-58% to -79%)
0 (-100%) n.d. -8.6 to -11.7 -6.6
Share of low-carbon fuels in transport sector (%)
5.88 15 to 20 75 to 95 0.29 0.7 to 1.1 2.1 to 2.7
United States (cont'd).
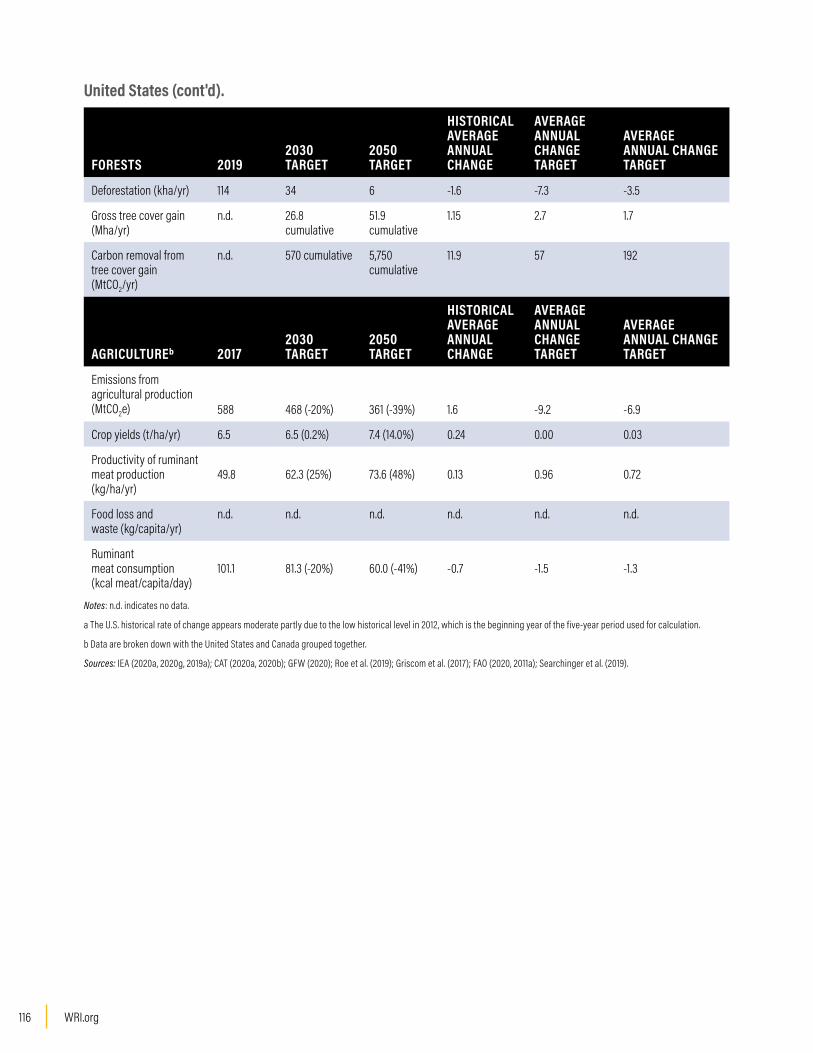
WRI.org116
FORESTS 20192030 TARGET
2050 TARGET
HISTORICAL AVERAGE ANNUAL CHANGE
AVERAGE ANNUAL CHANGE TARGET
AVERAGE ANNUAL CHANGE TARGET
Deforestation (kha/yr) 114 34 6 -1.6 -7.3 -3.5
Gross tree cover gain (Mha/yr)
n.d. 26.8 cumulative
51.9 cumulative
1.15 2.7 1.7
Carbon removal from tree cover gain (MtCO2/yr)
n.d. 570 cumulative 5,750 cumulative
11.9 57 192
AGRICULTUREb 20172030 TARGET
2050 TARGET
HISTORICAL AVERAGE ANNUAL CHANGE
AVERAGE ANNUAL CHANGE TARGET
AVERAGE ANNUAL CHANGE TARGET
Emissions from agricultural production (MtCO2e) 588 468 (-20%) 361 (-39%) 1.6 -9.2 -6.9
Crop yields (t/ha/yr) 6.5 6.5 (0.2%) 7.4 (14.0%) 0.24 0.00 0.03
Productivity of ruminant meat production (kg/ha/yr)
49.8 62.3 (25%) 73.6 (48%) 0.13 0.96 0.72
Food loss and waste (kg/capita/yr)
n.d. n.d. n.d. n.d. n.d. n.d.
Ruminant meat consumption (kcal meat/capita/day)
101.1 81.3 (-20%) 60.0 (-41%) -0.7 -1.5 -1.3
Notes: n.d. indicates no data.
a The U.S. historical rate of change appears moderate partly due to the low historical level in 2012, which is the beginning year of the five-year period used for calculation.
b Data are broken down with the United States and Canada grouped together.
Sources: IEA (2020a, 2020g, 2019a); CAT (2020a, 2020b); GFW (2020); Roe et al. (2019); Griscom et al. (2017); FAO (2020, 2011a); Searchinger et al. (2019).
United States (cont'd).

117State of Climate Action: Assessing Progress toward 2030 and 2050
ENDNOTES1. Installed capacity refers to the potential electricity generation a
facility could produce if it were to run at full capacity. Generation refers to the actual electricity produced during a time period. Even if capacity is installed, it might not generate electricity, leading to lower emissions and the power plant becoming less economically viable.
2. Based on the Climate Action Tracker (CAT), this emission intensity can include biomass with carbon capture and storage (BECCS). CAT benchmarks are not prescriptive in terms of how targets are reached; they indicate only that targets are compatible with the Paris Agreement. BECCS in particular remains uncertain as there are currently no large-scale, commercially viable options. BECCS can also have knock-on effects on other sectors, like land use emissions, that are not further covered here. BECCS included in integrated as-sessment models can be part of the possible solutions to reduce the carbon intensity of the electricity sector to zero, particularly beyond 2030. For the benchmarks, CAT has filtered the full scenario range based on sustainability criteria established by the Intergovernmental Panel on Climate Change (IPCC); namely, BECCS and reforestation and afforestation. The use of BECCS is therefore limited in the scenar-ios considered.
3. This target was established in 2014. The New York Declaration on Forests’ recent assessment shows that around 27 Mha have been restored so far.
4. Regional commitments like AFR100 (to restore 100 Mha of degrad-ed land in Africa by 2030), Initiative 20x20 (to restore 20 Mha of degraded land in Latin America), and ECCA 2030 (to restore 30 Mha of degraded land in Europe, the Caucasus, and Central Asia by 2030) also feed into these global goals.
5. Searchinger et al. (2019) modeled a number of global food produc-tion and consumption scenarios in 2050 and found that even under very ambitious scenarios it was not possible to keep agricultural production emissions below 4 GtCO2e while adequately feeding 9–10 billion people. Further reductions in land sector emissions would need to come from large-scale forest restoration (see Forests sec-tion). This 2050 target is also similar to the 5 GtCO2e/yr agricultural greenhouse gas (GHG) target defined in the EAT-Lancet Commission report (Willett et al. 2019).
6. Carbon dioxide is reduced to net zero by 2050 and total GHG emis-sions reach net zero by 2063–68 on average for 1.5°C scenarios with low or no overshoot of 1.5°C.
7. Prior to COP26, all countries are invited to raise their ambition under the Paris Agreement.
8. The Initiative for Climate Action Transparency (ICAT) has developed a methodology and tool for assessing the potential GHG emissions reductions from nonstate and subnational commitments and actions. The application and use of the ICAT tool can support deeper understanding of how cities, as well as businesses and other actors, are contributing to national ambition.
9. Due to space limitations, the section does not cover the state of adaptation by geography, across sectors, in the private sector, or by key aspects of adaptation such as climate information services, mon-itoring, evaluation and learning, knowledge about good practices, or financial tools.
10. CAT refers to “targets” as “benchmarks” in its report and methodolo-gy. See CAT (2020a, 2020b).
11. SIAMESE, or the Simplified Integrated Assessment Model with Energy System Emulator.
12. Targets were calculated on the basis of EU28, before the United Kingdom left the European Union.
13. For the forest sector we use the last 19 years because the highest levels of deforestation were in 2015 and 2016, so looking at the last five years gives a somewhat distorted view that doesn’t account for the general increase over time but would only consider a slight decrease from a recent peak.
14. The electricity (or power) sector includes electricity generation and is part of the larger energy sector, which also includes transport, manufacturing, and buildings.
15. The remaining carbon budget to stay within 1.5°C with probability of 66 to 50 percent (420–580 gigatonnes CO2) is based on Rogelj et al. (2018).
16. This depends on how externalities are valued.
17. The IEA reports that renewable sources include electricity from hy-dro, geothermal, solar, wind, tide, wave, biofuels, and the renewable fraction of municipal waste. This will be the definition used in this section if not otherwise stated.
18. Based on CAT (2020b), for the power sector the “Paris Agreement–compatible benchmarks for these indicators reflect a synthesis of the values in the chosen interval years (2030, 2040, 2050) of the 75th percentile across the Paris Agreement–compatible pathways analysed and the highest level of ambition found to be viable in the relevant literature.”
19. For example, through the Net-Zero Asset Owner Alliance.
20. The uncertainty about the use of CCS in scenarios is quite large. CAT targets assume that a large share of this modeled CCS-based power generation could be renewables.
21. Installed capacity refers to the potential electricity generation a facility could produce if it were to run at full capacity. Generation refers to the actual electricity produced during a time period. Even if capacity is installed, a power plant might not generate electricity, leading to lower emissions and the power plant’s becoming less economically viable.
22. Emissions associated with construction are covered by the cement and steel benchmarks in the Industry section.
23. In the Global EV Outlook (IEA 2020c), the share also includes plug-in hybrid EVs in the passenger LDVs, which is a larger scope than the target.
24. In the Global EV Outlook (IEA 2020c), “electric cars” also include plug-in hybrid EVs in the passenger LDVs, which is a larger scope than the target.
25. The behavior changes will not be reflected in this indicator, however, as it covers only passenger transport.
26. These targets come from a survey and reconciliation of median estimates of top-down models (integrated assessment models) and bottom-up assessments in the literature that are then divided into a set of mitigation measures based on feasibility and sustainability.
WRI.org118
REFERENCESAllan, S., A.V. Bahadur, S. Venkatramani, and V. Soundarajan. 2020. “The Role of Domestic Budgets in Financing Climate Change Adaptation: A Background Paper for the Global Committee on Adaptation.” Oxford Policy Management. https://cdn.gca.org/assets/2020-01/The_Role_of_Domestic_Budgets_in_Financing_Paper__Final.pdf.
America’s Pledge Initiative on Climate Change. 2019. “Accelerating America’s Pledge.” https://www.americaspledgeonclimate.com/accel-erating-americas-pledge-2/.
Arabesque. 2020. “Analysing the Temperature Score.” February 4. https://www.arabesque.com/2020/02/04/analysing-the-tempera-ture-score/.
Archer, E., G. Hand, and S. Blair. 2013. “Validity of U.S. Nutritional Surveillance: National Health and Nutrition Examination Survey Caloric Energy Intake Data, 1971–2010.” PLOS ONE, October. doi:10.1371/journal.pone.0076632.
Bajzelj, B., K. Richards, J. Allwood, and P. Smith. 2014. “The Importance of Food Demand Management for Climate Mitigation.” https://www.repository.cam.ac.uk/handle/1810/245933.
BankTrack. 2020. “BankTrack: Banks.” https://www.banktrack.org/.
Beresford, C. 2020. “GM Unveils Battery with Capacity Twice as Big as Tesla’s.” Car and Driver, March 4. https://www.caranddriver.com/news/a31226611/gm-ultium-electric-vehicle-battery-revealed/.
BNEF (Bloomberg New Energy Finance). 2020a. “Electric Vehicle Outlook 2020: Executive Summary.” https://about.bnef.com/electric-ve-hicle-outlook/.
BNEF. 2020b. BNEF Talk 2020: Electric Mobility: The End of the Begin-ning. https://vimeo.com/389506892.
Bolton, P., M. Despres, L.A. Pereira da Silva, R. Svartzman, F. Samama, and Bank for International Settlements. 2020. “The Green Swan: Central Banking and Financial Stability in the Age of Climate Change.” Green Finance Platform. https://greenfinanceplatform.org/research/green-swan-central-banking-and-financial-stability-age-climate-change.
Bonn Challenge. 2020. “Bonn Challenge.” https://www.bonnchallenge.org/.
Brown, S., and D. Zarin. 2013. “What Does Zero Deforestation Mean?” Science 342 (6160): 805–7. doi:10.1126/science.1241277.
Bulkeley, H., and M. Betsill. 2003. Cities and Climate Change: Urban Sustainability and Global Environmental Governance. New York: Routledge. http://www.routledge.com/shopping_cart/products/product_detail.asp?sku=&isbn=9780415273794&parent_id=&pc=/shopping_cart/search/search.asp?search%3DCities%2520and%-2520Climate%2520Change.
Cadan, Y., A. Mokgopo, and C. Vondrich. 2019. “$11 Trillion and Counting.” DivestInvest, December 16. https://www.divestinvest.org/fr/11-tril-lion-counting-divestinvest/.
CAT (Climate Action Tracker). 2020a. Methods Report: Elaborating the Decarbonisation Roadmap. https://climateactiontracker.org/docu-ments/753/CAT_2020-07-10_ParisAgreementBenchmarks_FullReport.pdf.
The 70 percent and 95 percent reduction targets refer to gross forest loss reductions as well as the subset of that gross number that is permanent deforestation.
27. Both targets divide the cumulative target by the number of years from 2020 to the target year to establish an annual target for rate of change comparison.
28. Regional commitments like AFR100, to restore 100 Mha of degraded land in Africa by 2030, Initiative 20x20, to restore 20 Mha of degraded land in Latin America, and ECCA 2030, to restore 30 Mha of degraded land in Europe, the Caucasus and Central Asia by 2030, also feed into these global goals.
29. Searchinger et al. (2019) modeled a number of global food produc-tion and consumption scenarios in 2050 and found that even under very ambitious scenarios it was not possible to keep agricultural production emissions below 4 GtCO2e while adequately feeding 9–10 billion people. Further reductions in land sector emissions would need to come from large-scale forest restoration (see Forests section above). This 2050 target is also similar to the 5 GtCO2e/yr agricultural GHG target defined in the EAT-Lancet Commission report (Willett et al. 2019).
30. FAOSTAT emissions adjustments in Searchinger et al. (2019) included a higher global warming potential value for methane (34 kg of CO2e) based on the most recent IPCC recommendations, and a higher amount of agricultural energy use calculated by the GlobAgri-WRR model based on estimates from the U.S. Environmental Protection Agency and FAO.
31. This report considers all crops tracked in FAOSTAT. According to FAO (2020), these include cereals, coarse grains, fruits, jute and jute-like fibers, oil crops, pulses, roots and tubers, treenuts, and vegetables.

119State of Climate Action: Assessing Progress toward 2030 and 2050
CAT. 2020b. Summary Report: Elaborating the Decarbonisation Road-map. https://climateactiontracker.org/documents/754/CAT_2020-07-10_ParisAgreementBenchmarks_SummaryReport.pdf.
C40. 2020. “C40 Climate Action Planning Resource Centre.” https://resourcecentre.c40.org/.
Chile. 2020. “Annex Enhanced Ambition in National Climate Plans.” https://cop25.mma.gob.cl/en/home/#/cop-news/6uwx6gJHfS-FV5TdOF6r9.
Climate Action 100+. 2020. “Climate Action 100+: Global Investors Driv-ing Business Transition.” https://climateaction100.wordpress.com/.
Climate Chance. 2019. “Synthesis Report on Climate Action by Sector.” https://www.climate-chance.org/wp-content/uploads/2019/12/en_c1_complet_def.pdf.
Climate Group. 2020. EV100 Progress and Insights Annual Report. https://www.theclimategroup.org/sites/default/files/downloads/ev100_annual_progress_and_insights_report_2020.pdf.
ClimateWatch. 2020a. “ClimateWatch: 2020 NDC Tracker.” https://www.climatewatchdata.org/.
ClimateWatch. 2020b. “ClimateWatch: GHG Emissions.” https://www.climatewatchdata.org/.
ClimateWatch. 2020c. “ClimateWatch: Long-Term Strategies.” https://www.climatewatchdata.org/lts-tracker.
CoalSwarm. 2020. “End Coal: Summary Statistics.” https://endcoal.org/global-coal-plant-tracker/summary-statistics/.
Cook-Patton, S. Forthcoming. Nature.
COP25 Presidency. 2019. “Climate Ambition Alliance: Nations Renew Their Push to Upscale Action by 2020 and Achieve Net Zero CO2
Emissions by 2050: Annex 1 and Annex 2.” https://unfccc.int/news/cli-mate-ambition-alliance-nations-renew-their-push-to-upscale-action-by-2020-and-achieve-net-zero.
CPI (Climate Policy Initiative). 2019. “2019 Global Landscape of Climate Finance.” https://climatepolicyinitiative.org/wp-content/up-loads/2019/11/2019-Global-Landscape-of-Climate-Finance.pdf.
Cui, R.Y., N. Hultman, M.R. Edwards, L. He, A. Sen, K. Surana, H. McJeon, et al. 2019. “Quantifying Operational Lifetimes for Coal Power Plants under the Paris Goals.” Nature Communications 10 (1): 4759. doi:10.1038/s41467-019-12618-3.
Ding, H., S. Faruqi, A. Wu, J.C. Altamirano, A.A. Ortega, M. Verdone, R.Z. Cristales, R. Chazdon, and W. Vergara. 2017. “Roots of Prosperity: The Economics and Finance of Restoring Land.” World Resources Institute. https://www.wri.org/sites/default/files/roots-of-prosperity.pdf.
EIA (U.S. Energy Information Administration). 2019. “International Energy Outlook 2019.” https://www.eia.gov/outlooks/ieo/pdf/ieo2019.pdf.
Energy Transitions Commission. 2018. Mission Possible: Reaching Net-Zero Carbon Emissions from Harder-to-Abate Sectors by Mid-century. http://www.energy-transitions.org/sites/default/files/ETC_MissionPos-sible_FullReport.pdf.
Erickson, P., S. Kartha, M. Lazarus, and K. Tempest. 2015. “Assessing Carbon Lock-In.” Environmental Research Letters 10 (8): 084023. doi:10.1088/1748-9326/10/8/084023.
European Commission. 2018. “Annex IX Horizontal Assessment of the Adaptation Preparedness Country Fiches.” https://ec.europa.eu/clima/sites/clima/files/adaptation/what/docs/horizontal_assess-ment_en.pdf.
European Commission. 2020a. “2050 Long-Term Strategy.” https://ec.europa.eu/clima/policies/strategies/2050_en.
European Commission. 2020b. “CO2 Emission Performance Standards for Cars and Vans (2020 Onwards).” Climate Action. https://ec.europa.eu/clima/policies/transport/vehicles/regulation_en.
Evans, S. 2019. “‘Profound Shifts’ Underway in Energy System, Says IEA World Energy Outlook.” Carbon Brief, November 13. https://www.carbonbrief.org/profound-shifts-underway-in-energy-system-says-iea-world-energy-outlook.
Ewing, J. 2020. “Volkswagen Hopes Fresh Logo Signals an Emis-sion-Free Future.” New York Times, published September 8, 2019, updated September 14, 2020. https://www.nytimes.com/2019/09/08/business/volkswagen-trademark-electric-vehicles.html.
Falk, J. 2020. “The 1.5C Business Playbook.” Exponential Road-map, January. https://exponentialroadmap.org/wp-content/up-loads/2020/01/1.5C-business-playbook-1.0_digital-spread.pdf.
FAO (Food and Agriculture Organization of the United Nations). 2011a. Global Food Losses and Food Waste: Extent, Causes and Prevention. Rome: FAO.
FAO. 2011b. The State of the World’s Land and Water Resources for Food and Agriculture: Managing Systems at Risk. 1st ed. London: Routledge. doi:10.4324/9780203142837.
FAO. 2018. “The Future of Food and Agriculture: Alternative Pathways to 2050.” http://www.fao.org/global-perspectives-studies/resources/detail/en/c/1157074/.
FAO. 2019. Moving Forward on Food Loss and Waste Reduction. http://www.fao.org/3/ca6030en/ca6030en.pdf.
FAO. 2020. “FAOSTAT: Data.” http://www.fao.org/faostat/en/#data.
Fetzel, T., P. Havlik, M. Herrero, J.O. Kaplan, T. Kastner, C. Kroisleitner, S. Rolinski, et al. 2017. “Quantification of Uncertainties in Global Grazing Systems Assessment.” Global Biogeochemical Cycles 31 (7): 1089–102. doi:10.1002/2016GB005601.
GCA (Global Commission on Adaptation). 2019. “Adapt Now: A Global Call for Leadership on Climate Resilience.” https://cdn.gca.org/as-sets/2019-09/GlobalCommission_Report_FINAL.pdf.
GCA. 2020. “Call to Action for a Climate-Resilient Recovery from COVID-19.” https://files.wri.org/s3fs-public/global-commission-adapa-tion-covid-resilience-statement.pdf.
GCF (Green Climate Fund). 2018. “GCF/B.21/Inf.03/Add.01: Approach and Scope for Providing Support to Adaptation Activities—Addendum I: The GCF’s Approach to Adaptation: Analysis and Implications for the Fund.” https://www.greenclimate.fund/document/gcf-b21-inf03-add01.

WRI.org120
GCF. 2020. “GCF in Brief: Adaptation Planning.” https://www.greencli-mate.fund/sites/default/files/document/gcf-brief-adaptation-planning.pdf.
GCOM (Global Conference of Mayors). 2019. “Climate Emergency: Unlocking the Urban Opportunity Together.” https://www.globalcove-nantofmayors.org/wp-content/uploads/2019/12/2019-GCoM-Aggrega-tion-Report.pdf.
Ge, M., K. Lebling, K. Levin, and J. Friedrich. 2019. “Tracking Progress of the 2020 Climate Turning Point.” Working Paper. Washington, DC: World Resources Institute. https://wri.org/2020-turning-point-progress.
GFW (Global Forest Watch). 2020. “Global Forest Watch: Forest Monitor-ing Designed for Action.” https://www.globalforestwatch.org/.
GlobalABC (Global Alliance for Buildings and Construction), IEA (In-ternational Energy Agency), and UNEP (UN Environment Programme). 2019. 2019 Global Status Report for Buildings and Construction. https://globalabc.org/sites/default/files/2020-03/GSR2019.pdf.
GlobalABC, IEA, and UNEP. 2020. “GlobalABC Roadmap for Buildings and Construction, 2020–2050: Towards a Zero-Emission, Efficient and Resilient Buildings and Construction Sector.” Paris: IEA. https://www.iea.org/reports/globalabc-roadmap-for-buildings-and-construc-tion-2020-2050.
Griscom, B.W., J. Adams, P.W. Ellis, R.A. Houghton, G. Lomax, D.A. Miteva, W.H. Schlesinger, et al. 2017. “Natural Climate Solutions.” Proceedings of the National Academy of Sciences 114 (44): 11645–50. doi:10.1073/pnas.1710465114.
Hoffmann, C., M. Van Hoey, and B. Zeumer. 2020. “Decarbonization in Steel.” 2020. McKinsey. https://www.mckinsey.com/industries/met-als-and-mining/our-insights/decarbonization-challenge-for-steel.
Holland, M. 2018. “$100/KWh Tesla Battery Cells This Year, $100/KWh Tesla Battery Packs In 2020.” CleanTechnica, June 9. https://cleantech-nica.com/2018/06/09/100-kwh-tesla-battery-cells-this-year-100-kwh-tesla-battery-packs-in-2020/.
Hsu, A., N. Goyal, and A. Weinfurter. 2020. “City-Level Emissions Reductions: What Can Successful Cities Teach Us.” Energy Post (blog), September 11. https://energypost.eu/city-level-emissions-reductions-what-can-successful-cities-teach-us/.
IEA (International Energy Agency). 2017. “New CEM Campaign Aims for Goal of 30% New Electric Vehicle Sales by 2030.” https://www.iea.org/newsroom/news/2017/june/new-cem-campaign-aims-for-goal-of-30-new-electric-vehicle-sales-by-2030.html.
IEA. 2018. “CO2 Emissions from Fuel Combustion 2018 Highlights.” Paris: OECD and IEA.
IEA. 2019a. “Energy Transitions Indicators.” https://www.iea.org/re-ports/energy-transitions-indicators.
IEA. 2019b. “World Energy Outlook 2019.” https://www.iea.org/reports/world-energy-outlook-2019.
IEA. 2020a. “Building Envelopes.” https://www.iea.org/reports/build-ing-envelopes.
IEA. 2020b. “Cement—Analysis.” https://www.iea.org/reports/cement.
IEA. 2020c. “Electric Vehicles.” https://www.iea.org/reports/electric-ve-hicles.
IEA. 2020d. “Global EV Outlook 2020.” https://www.iea.org/reports/global-ev-outlook-2020.
IEA. 2020e. “Industry Direct CO2 Emissions in the Sustainable Develop-ment Scenario, 2000-2030.” https://www.iea.org/data-and-statistics/charts/industry-direct-co2-emissions-in-the-sustainable-develop-ment-scenario-2000-2030.
IEA. 2020f. “Low Fuel Prices Provide a Historic Opportunity to Phase Out Fossil Fuel Consumption Subsidies.” https://www.iea.org/articles/low-fuel-prices-provide-a-historic-opportunity-to-phase-out-fossil-fu-el-consumption-subsidies.
IEA. 2020g. “Share of Renewables in Power Generation in the Sus-tainable Development Scenario, 2000–2030.” https://www.iea.org/data-and-statistics/charts/share-of-renewables-in-power-genera-tion-in-the-sustainable-development-scenario-2000-2030.
IEA. 2020h. “Tracking Buildings 2020.” https://www.iea.org/reports/tracking-buildings-2020.
IEA. 2020i. “Low Fuel Prices Provide a Historic Opportunity to Phase Out Fossil Fuel Consumption Subsidies.” https://www.iea.org/articles/low-fuel-prices-provide-a-historic-opportunity-to-phase-out-fossil-fu-el-consumption-subsidies.
IEA. 2020j. “Tracking Power 2020.” https://www.iea.org/reports/track-ing-power-2020.
IEA and CSI (Cement Sustainability Initiative). 2018. “Technology Road-map Low-Carbon Transition in the Cement Industry.” https://webstore.iea.org/technology-roadmap-low-carbon-transition-in-the-cement-in-dustry#:~:text=It%20provides%20an%20update%20of,that%20are%20less%20carbon%20intensive%2C.
IISD (International Institute for Sustainable Development). 2015. “Review of Adaptation Action in 15 Asian and African Countries.” https://www.iisd.org/project/review-adaptation-action-15-asian-and-african-coun-tries.
Initiative 20x20. 2020. “Initiative 20x20: Countries.” https://initia-tive20x20.org/home.
IPCC (Intergovernmental Panel on Climate Change). 2014a. “Climate Change 2014: Mitigation of Climate Change. Contribution of Working Group III to the Fifth Assessment Report of the Intergovernmental Panel on Climate Change.” Cambridge: Cambridge University Press. https://www.ipcc.ch/report/ar5/wg3/.
IPCC. 2014b. “Climate Change 2014 Synthesis Report Summary for Policymakers.” https://www.ipcc.ch/site/assets/uploads/2018/02/AR5_SYR_FINAL_SPM.pdf.
IPCC. 2018. Special Report: Global Warming of 1.5 oC. https://www.ipcc.ch/sr15/.
IPCC. 2019a. “Chapter 3: Impacts of 1.5°C of Global Warming on Natural and Human Systems,” 138.
IPCC. 2019b. Special Report on the Ocean and Cryosphere in a Changing Climate. https://www.ipcc.ch/srocc/.

121State of Climate Action: Assessing Progress toward 2030 and 2050
IRENA (International Renewable Energy Agency). 2018a. “Renewable Power Generation Costs in 2017.” https://www.irena.org/publica-tions/2018/Jan/Renewable-power-generation-costs-in-2017.
IRENA. 2018b. “Renewable Power Generation Costs in 2018.” https://www.irena.org/publications/2019/May/Renewable-power-genera-tion-costs-in-2018.
IRENA. 2020a. “Global Renewables Outlook: Energy Transformation 2050.” https://www.irena.org/publications/2020/Apr/Global-Renew-ables-Outlook-2020.
IRENA. 2020b. “IRENA: Finance Dashboard.” http://resourceirena.irena.org/gateway/dashboard/?topic=6&subTopic=11.
IRENA. 2020c. “Renewable Power Generation Costs in 2019.” https://www.irena.org/publications/2020/Jun/Renewable-Pow-er-Costs-in-2019.
Kann, D. 2020. “The Great Barrier Reef Likely Just Experienced Its Most Widespread Bleaching Event on Record.” https://www.cnn.com/2020/03/25/world/great-barrier-reef-bleaching-2020-climate-change-trnd/index.html?utm_campaign=Hot%20News&utm_source=hs_email&utm_medium=email&utm_con-tent=85298678&_hsenc=p2ANqtz-87h0k6YlYFyZg-OrpqxDZWcxGWM-Vi07I0xVAobFkN0RaPOd-fcP0LA_zKXv-ElGK5_hnwFD487JadmuENFH-78vXdFPIw&_hsmi=85298678.
Larsen, G., C. Smith, N. Krishnan, L. Weischer, S. Bartosch, and H. Fekete. 2018. “Toward Paris Alignment.” World Resources Institute. https://www.wri.org/publication/toward-paris-alignment.
Lazard. 2020. “Levelized Cost of Energy and Levelized Cost of Storage: 2020.” Lazard.com. http://www.lazard.com/perspective/levelized-cost-of-energy-and-levelized-cost-of-storage-2020/.
Le Quéré, C., R.B. Jackson, M.W. Jones, A.J.P. Smith, S. Abernethy, R.M. Andrew, A.J. De-Gol, et al. 2020. “Temporary Reduction in Daily Global CO2 Emissions during the COVID-19 Forced Confinement.” Nature Climate Change 10 (7): 647–53. doi:10.1038/s41558-020-0797-x.
Levin, K., and D. Rich. 2017. “Turning Points: Trends in Countries’ Reaching Peak Greenhouse Gas Emissions over Time.” Working paper. Washington, DC: World Resources Institute. http://www.wri.org/ publi-cation/turning-points.
Levin, K., D. Rich, K. Ross, T. Fransen, and C. Elliott. 2020. “Designing and Communicating Net-Zero Targets.” Working paper. Washington, DC: World Resources Institute. www.wri.org/design-net-zero.
Li, X., S. Qiu, and G. Shi. 2020. “3 Lessons from China’s Rocket Growth in Electric Vehicles.” TheCityFix (blog), August 5. https://thecityfix.com/blog/3-lessons-chinas-rocket-growth-electric-vehicles-xiangyi-li-shiy-ong-qiu-ge-shi/.
Löfqvist, S., and J. Ghazoul. 2019. “Private Funding Is Essential to Leverage Forest and Landscape Restoration at Global Scales.” Nature Ecology & Evolution 3 (12): 1612–15. doi:10.1038/s41559-019-1031-y.
LSE, GRICCE (London School of Economics, Grantham Research Insti-tute on Climate Change and the Environment). 2020. “Climate Change Laws of the World.” https://climate-laws.org/.
Mercure, J.-F., H. Pollitt, J.E. Viñuales, N.R. Edwards, P.B. Holden, U. Chewpreecha, P. Salas, et al. 2018. “Macroeconomic Impact of Stranded Fossil Fuel Assets.” Nature Climate Change 8 (7): 588–93. doi:10.1038/s41558-018-0182-1.
Met Office. 2019. “Forecast Suggests Earth’s Warmest Period on Record.” https://www.metoffice.gov.uk/about-us/press-office/news/weather-and-climate/2019/forecast-suggests-earths-warmest-period.
Micha, R., S. Khatibzadeh, P. Shi, K. Andrews, R. Engell, and D. Mozaf-farian. 2015. “Global, Regional and National Consumption of Major Food Groups in 1990 and 2010: A Systematic Analysis Including 266 Country-Specific Nutrition Surveys Worldwide.” BMJ Open, September. doi:10.1136/bmjopen-2015-008705.
Migliozzi, B., S. Reinhard, N. Popovich, T. Wallace, and A. McCann. 2020. “Record Wildfires on the West Coast Are Capping a Disastrous Decade.” New York Times, September 24. https://www.nytimes.com/interac-tive/2020/09/24/climate/fires-worst-year-california-oregon-washing-ton.html.
Murphy, D. 2019. “Adaptation Actions in NDC Partnership Plans: Oppor-tunities for Alignment with NAP Processes.” NAP Global Network (blog), June 7. https://ndcpartnership.org/news/adaptation-actions-ndc-part-nership-plans-opportunities-alignment-nap-processes.
Nachmany, M., R. Byrnes, and S. Surminski. 2019. “Policy Brief National Laws and Policies on Climate Change Adaptation: A Global Review.” London School of Economics, Grantham Research Institute on Climate Change and the Environment, December 9. https://www.lse.ac.uk/granthaminstitute/publication/national-laws-and-policies-on-cli-mate-change-adaptation-a-global-review/ .
NASA (National Aeronautics and Space Administration). 2020a. “Ice Sheets: NASA Global Climate Change.” Climate Change: Vital Signs of the Planet. https://climate.nasa.gov/vital-signs/ice-sheets.
NASA. 2020b. “Key Indicators: Global Mean Sea Level.” NASA Sea Level Change Portal. https://sealevel.nasa.gov/understanding-sea-level/key-indicators/global-mean-sea-level.
NASA. 2020c. “NASA Earth Observatory: 2019 Was the Second Warmest Year on Record.” January 15. https://earthobservatory.nasa.gov/imag-es/146154/2019-was-the-second-warmest-year-on-record.
NASA. 2020d. “Antarctica Melts under Its Hottest Days on Record.” February 20. https://earthobservatory.nasa.gov/images/146322/antarc-tica-melts-under-its-hottest-days-on-record.
Natural Capital Partners. 2019. “Deeds Not Words: The Growth of Climate Action in the Corporate World.” https://assets.naturalcapital-partners.com/downloads/Deeds_Not_Words_-_The_Growth_Of_Cli-mate_Action_In_The_Corporate_World.pdf.
NCE (New Climate Economy). 2018. Unlocking the Inclusive Growth Story of the 21st Century. https://newclimateeconomy.report/2018/.
NDCP (Nationally Determined Contribution Partnership). Forthcoming. “NDC Partnership Country Requests on Adaptation (March 2020 Sup-port Unit Analysis Based on December 2019 Data).”
NewClimate Institute. 2019. “Global Climate Action from Cities, Regions and Businesses: 2019.” https://newclimate.org/2019/09/18/global-cli-mate-action-from-cities-regions-and-businesses-2019/.

WRI.org122
NOAA (National Oceanic and Atmospheric Administration). 2019. “Climate Change: Global Sea Level.” https://www.climate.gov/news-fea-tures/understanding-climate/climate-change-global-sea-level.
NSIDC (National Snow and Ice Data Center). 2020. “Greenland Ice Sheet Today.” http://nsidc.org/greenland-today/.
NYDF (New York Declaration on Forests) Assessment Partners. 2019. “Protecting and Restoring Forests: A Story of Large Commitments yet Limited Progress.” https://forestdeclaration.org/images/uploads/re-source/2019NYDFReport.pdf.
OECD (Organisation for Economic Co-operation and Development) and IEA. 2019. “Update on Recent Progress in Reform of Inefficient Fossil-Fuel Subsidies That Encourage Wasteful Consumption.” Second Energy Transitions Working Group Meeting, Toyama, Japan, April 18–19.
Oliveira, J., E.E. Campbell, R.A.C. Lamparelli, G.K.D.A. Figueiredo, J.R. Soares, D. Jaiswal, L.A. Monteiro, et al. 2020. “Choosing Pasture Maps: An Assessment of Pasture Land Classification Definitions and a Case Study of Brazil.” International Journal of Applied Earth Observation and Geoinformation 93 (December): 102205. doi:10.1016/j.jag.2020.102205.
Peters, G.P., G. Marland, C. Le Quéré, T. Boden, J.G. Canadell, and M.R. Raupach. 2012. “Rapid Growth in CO2 Emissions after the 2008–2009 Global Financial Crisis.” Nature Climate Change 2 (1): 2–4. doi:10.1038/nclimate1332.
Phillips, N. 2020. “Climate Change Made Australia’s Devastating Fire Season 30% More Likely.” Nature, March. doi:10.1038/d41586-020-00627-y.
Pinchot, A., and G. Christianson. 2019. “How Are Banks Doing on Sus-tainable Finance Commitments? Not Good Enough.” World Resources Institute, October 3. https://www.wri.org/blog/2019/10/how-are-banks-doing-sustainable-finance-commitments-not-good-enough.
Porter, J., L. Xie, A. Challinor, K. Cochrane, S.M. Howden, M.M. Iqbal, D.B. Lobell, et al. 2014. “Food Security and Food Production Systems.” In Climate Change 2014: Impacts, Adaptation, and Vulnerability. Part A, Global and Sectoral Aspects. Contribution of Working Group II to the Fifth Assessment Report of the Intergovernmental Panel on Climate Change, ed. C.B. Field, V.R. Barros, D.J. Dokken, K.J. Mach, M.D. Mastrandrea, T.E. Bilir, M. Chatterjee, et al., 485533. Cambridge: Cambridge University Press.
PPCA (Powering Past Coal Alliance). 2020. “Working towards the Global Phase-Out of Unabated Coal Power.” https://poweringpastcoal.org/about/members.
Quintana, H., and R. Gorman. 2019. “Global States and Regions Annual Disclosure.” https://www.theclimategroup.org/sites/default/files/global_states_and_regions_annual_disclosure_report_nov_19.pdf.
Ranganathan, J., D. Vennard, R. Waite, P. Dumas, B. Lipinski, and T. Searchinger. 2016. Shifting Diets for a Sustainable Food Future. World Resources Institute. https://www.wri.org/publication/shifting-diets.
REN21. 2019. Renewables 2019 Global Status Report. https://www.ren21.net/gsr-2019/.
REN21. 2020. Renewables 2020: Global Status Report. https://www.ren21.net/wp-content/uploads/2019/05/gsr_2020_full_report_en.pdf.
Roe, S., C. Streck, M. Obersteiner, S. Frank, B. Griscom, L. Drouet, O. Fricko, et al. 2019. “Contribution of the Land Sector to a 1.5°C World.” Nature Climate Change 9 (11): 817–28. doi:10.1038/s41558-019-0591-9.
Roelofsen, O., K. Somers, E. Speelman, and M. Witteveen. 2020. “Plugging In: What Electrification Can Do for Industry.” McKinsey & Company. May 28. https://www.mckinsey.com/industries/elec-tric-power-and-natural-gas/our-insights/plugging-in-what-electrifica-tion-can-do-for-industry.
Rogelj, J., D. Shindell, K. Jiang, S. Fifita, P. Forster, V. Ginzburg, C. Handa, et al. 2018. “Chapter 2: Mitigation Pathways Compatible with 1.5°C in the Context of Sustainable Development.” In Global Warming of 1.5°C: An IPCC Special Report on the Impacts of Global Warming of 1.5°C above Pre-industrial Levels and Related Global Greenhouse Gas Emission Pathways, in the Context of Strengthening the Global Response to the Threat of Climate Change. Geneva: Intergovernmental Panel on Climate Change. https://www.ipcc.ch/report/sr15/.
Rothrock, P., L. Weatherer, and S. Zwick. 2019. “Targeting Zero Deforestation: Company Progress on Commitments That Count, 2019.” Forest Trends. https://www.forest-trends.org/wp-content/uploads/2019/06/2019.06.05-Supply-Change-Targeting-Ze-ro-Deforestation-Report-Final.pdf.
Runhaar, H., B. Wilk, Å. Persson, C. Uittenbroek, and C. Wamsler. 2018. “Mainstreaming Climate Adaptation: Taking Stock about ‘What Works’ from Empirical Research Worldwide.” Regional Environmental Change 18 (4): 1201–10. doi:10.1007/s10113-017-1259-5.
SBTi (Science Based Targets initiative). 2020a. “Companies Taking Action.” https://sciencebasedtargets.org/companies-taking-action/.
SBTi. 2020b. “Financial Institutions.” https://sciencebasedtargets.org/financial-institutions-2/.
Schmitz, C., H. Van Meijl, P. Kyle, and G. Nelson. 2014. “Land‐Use Change Trajectories Up to 2050: Insights from a Global Agro‐economic Model Comparison.” Agricultural Economics 45 (1): 69–84. https://onlinelibrary.wiley.com/doi/abs/10.1111/agec.12090.
Searchinger, T., R. Waite, C. Hanson, and J. Ranganathan. 2019. Creating a Sustainable Food Future: A Menu of Solutions to Feed Nearly 10 Billion People by 2050. Final report. World Resources Report. Washington, DC: World Resources Institute. https://www.wri.org/publication/creat-ing-sustainable-food-future.
Seto, K.C., S.J. Davis, R.B. Mitchell, E.C. Stokes, G. Unruh, and D. Ürge-Vor-satz. 2016. “Carbon Lock-In: Types, Causes, and Policy Implications.” Annual Review of Environment and Resources 41 (1): 425–52. doi:10.1146/annurev-environ-110615-085934.
Springmann, M., H.C.J. Godfray, M. Rayner, and P. Scarborough. 2016. “Analysis and Valuation of the Health and Climate Change Cobenefits of Dietary Change.” Proceedings of the National Academy of Sciences 113 (15): 4146–51. doi:10.1073/pnas.1523119113.
TCFD (Task Force on Climate-Related Financial Disclosures). 2019. 2019 Status Report (June 2019). https://www.fsb-tcfd.org/publications/tcfd-2019-status-report/.
Tilman, D., and M. Clark. 2014. “Global Diets Link Environmental Sus-tainability and Human Health.” Nature 515 (7528): 518–22. doi:10.1038/nature13959.

123State of Climate Action: Assessing Progress toward 2030 and 2050
Tong, D., Q. Zhang, Y. Zheng, K. Caldeira, C. Shearer, C. Hong, Y. Qin, and S.J. Davis. 2019. “Committed Emissions from Existing Energy Infra-structure Jeopardize 1.5°C Climate Target.” Nature 572 (7769): 373–77. doi:10.1038/s41586-019-1364-3.
2050 Pathways Platform. 2016. “2050 Pathways Platform Launch Announcement.” November 17. https://www.2050pathways.org/2050-pathways-platform-launch-announcement/.
UN (United Nations). 2015. “Sustainable Consumption and Production.” United Nations Sustainable Development (blog). https://www.un.org/sustainabledevelopment/sustainable-consumption-production/.
UN. 2019. “World Urbanization Prospects.” UN Population Division. https://population.un.org/wup/.
UNDESA (UN Department of Economic and Social Affairs). 2019. “World Population Prospects 2019.” https://population.un.org/wpp/.
UNEP (UN Environment Programme). 2016. The Adaptation Finance Gap Report. https://unepdtu.org/wp-content/uploads/2018/10/unep-gap-report-2016-web-6-6-2016.pdf.
UNEP. 2019. Emissions Gap Report 2019. http://www.unenvironment.org/resources/emissions-gap-report-2019.
UNEP FI (Finance Initiative). 2019. “UN-Convened Net-Zero Asset Owner Alliance.” https://www.unepfi.org/net-zero-alliance/.
UNEP FI. 2020. “UN-Convened Net-Zero Asset Owner Alliance—United Nations Environment—Finance Initiative.” 2020. https://www.unepfi.org/net-zero-alliance/.
UNFCCC (UN Framework Convention on Climate Change). 2015. “Adoption of the Paris Agreement. Annex to Decision 1/CP.21, Document FCCC/CP/2015/10/Add.1, 29 January 2016.” http://unfccc.int/resource/docs/2015/cop21/eng/10a01.pdf#page=2.
UNFCCC. 2020. “NAZCA Global Climate Action.” 2020. https://climateac-tion.unfccc.int/.
Veliconga, I., Y. Mohajerani, A. Geruo, F. Landerer, and J. Mouginot. 2020. “Continuity of Ice Sheet Mass Loss in Greenland and Antarctica from the GRACE and GRACE Follow‐on Missions.” https://agupubs.onlineli-brary.wiley.com/doi/epdf/10.1029/2020GL087291.
Verhage, F., L. Cramer, P. Thornton, and B. Campbell. 2018. “Climate Risk Assessment and Agricultural Value Chain Prioritisation for Malawi and Zambia.” https://cgspace.cgiar.org/bitstream/handle/10568/96184/WP%20228.pdf.
Victor, D.G., F.W. Geels, and S. Sharpe. 2019. “Accelerating the Low Carbon Transition,” 140.
WBCSD (World Business Council for Sustainable Development). 2016. “Cement Industry Energy and CO2 Performance: Getting the Numbers Right.” Cement Sustainability Initiative. https://docs.wbcsd.org/2016/12/GNR.pdf.
Wei, J., and K. Cen. 2019. “Empirical Assessing Cement CO2 Emissions Based on China’s Economic and Social Development during 2001–2030.” Science of the Total Environment 653: 200–211. doi:https://doi.org/10.1016/j.scitotenv.2018.10.371.
Weisse, M., and E.D. Goldman. 2019. “The World Lost a Belgium-Sized Area of Primary Rainforests Last Year.” 2019. https://www.wri.org/blog/2019/04/world-lost-belgium-sized-area-primary-rainforests-last-year.
We Mean Business. 2016. “The Business End of Climate Change: How Bold Corporate Action Supported by Smart Policy Can Keep Tempera-ture Rise below 2°C.” https://static1.squarespace.com/static/575ecca7b654f9dd886dec23/t/576c39fdd2b857d28be73608/1466710526653/The+Business+End+of+Climate+Change.pdf.
Willett, W., J. Rockström, B. Loken, M. Springmann, T. Lang, S. Vermeulen, T. Garnett, et al. 2019. “Food in the Anthropocene: The EAT–Lancet Com-mission on Healthy Diets from Sustainable Food Systems.” The Lancet 393 (10170): 447–92. doi:10.1016/S0140-6736(18)31788-4.
Williams, D.J.H., B. Haley, D.F. Kahrl, J. Moore, D.A.D. Jones, D.H. McJeon, D.S. Borgeson, et al. 2014. Pathways to Deep Decarbonization in the United States. Deep Decarbonization Pathways Project of the Sustain-able Development Solutions Network and Institute for Sustainable Development and International Relations. https://usddpp.org/down-loads/2014-technical-report.pdf.
WMO (World Meteorological Organization). 2020. WMO Statement on the State of the Global Climate in 2019. https://library.wmo.int/doc_num.php?explnum_id=10211.
World Bank. 2019. “State and Trends of Carbon Pricing 2019.” https://openknowledge.worldbank.org/handle/10986/31755.
World Bank. 2020. “Carbon Pricing Dashboard.” https://carbonpricing-dashboard.worldbank.org/map_data.
World Economic Forum. 2019. “The Net-Zero Challenge: Global Climate Action at a Crossroads (Part 1).” https://www.weforum.org/reports/the-net-zero-challenge-global-climate-action-at-a-crossroads-part-1/.
World Steel Association. 2019. “Factsheet: Steel and Raw Materials.” 2019. https://www.worldsteel.org/en/dam/jcr:16ad9bcd-dbf5-449f-b42c-b220952767bf/fact_raw%2520materials_2019.pdf.
WRI (World Resources Institute). 2019. “Green Targets: A Tool to Compare Private Sector Banks’ Sustainable Finance Commitments.” September 17. https://www.wri.org/finance/banks-sustainable-fi-nance-commitments/.
Wright, C., and D. Nyberg. 2015. Climate Change, Capitalism, and Corpo-rations. Cambridge: Cambridge University Press.
Xu, M., and D. Stanway. 2020. “China to Make National Carbon Trading ‘Breakthrough’ by Year-End: Official.” Reuters, January 14. https://www.reuters.com/article/us-china-carbon-idUSKBN1ZD05N.

WRI.org124
PHOTO CREDITS Cover: NOAA/Unsplash; Inside cover: L-W/Unsplash; p.2 boudhayan bardhan/Unsplash; p.4 Ali Catteral/Flickr; p.15 Shayan Ghiasvand/Unsplash; p.16 Matt Howard; p. 18 Gryffyn M/Unsplash; p.20 Saikiran Kesari/Unsplash; p.23 Shaun Dakin/Unsplash; p.25 Gilles Desjardin/Unsplash; p.26 Alasdair Massie/Flickr; p.31 Ryoji Iwata/Unsplash; p.38 Matthew Henry/Unsplash; p.41 aiokr chen/Unsplash; p.42 science in hd/Unsplash; p.44 ricardo gomez angel/Unsplash; p.54 jason blackeye/Unsplash; p.56 ivan henao/Unsplash; p.59 ehud neuhaus/Unsplash; p.61 milo bunnik/Unsplash; p.63 matias santana/Unsplash; p.64 WRI; p.66 jan antonin kolar/Unsplash; p.68 ant rozetsky/Unsplash; p.82 jonathan lampel/Unsplash; p.84 etienne girardet/Unsplash; p.92 wilsan u/Unsplash; p.95 jo-anne mcarthur/Unsplash; p.97 filipe coimbra/Un-splash; p.98 francesco ungaro/Unsplash
ABOUT WORLD RESOURCES INSTITUTE World Resources Institute is a global research organization that turns big ideas into action at the nexus of environment, economic opportu-nity and human well-being.
Our ChallengeNatural resources are at the foundation of economic opportunity and human well-being. But today, we are depleting Earth’s resources at rates that are not sustainable, endangering economies and people’s lives. People depend on clean water, fertile land, healthy forests, and a stable climate. Livable cities and clean energy are essential for a sustainable planet. We must address these urgent, global challenges this decade.
Our VisionWe envision an equitable and prosperous planet driven by the wise management of natural resources. We aspire to create a world where the actions of government, business, and communities combine to eliminate poverty and sustain the natural environment for all people.
ABOUT CLIMATEWORKS FOUNDATIONClimateWorks Foundation is a global platform for philanthropy to innovate and accelerate climate solutions that scale. We deliver global programs and services that equip philanthropy with the knowledge, networks, and solutions to drive climate progress. Since 2008, Climate-Works has granted over $1 billion to more than 500 grantees in over 40 countries.
ABOUT CLIMATE ACTION TRACKERThe Climate Action Tracker is an independent scientific analysis that tracks government climate action and measures it against the globally agreed Paris Agreement aim of "holding warming well below 2°C, and pursuing efforts to limit warming to 1.5°C." A collaboration of two organ-isations, Climate Analytics and New Climate Institute, the CAT has been providing this independent analysis to policymakers since 2009.
CAT quantifies and evaluates climate change mitigation commitments, and assesses, whether countries are on track to meeting those. It then aggregates country action to the global level, determining likely temperature increase by the end of the century. CAT also develops sectoral analysis to illustrate required pathways for meeting the global temperature goals.

Copyright 2020 World Resources Institute. This work is licensed under the Creative Commons Attribution 4.0 International License. To view a copy of the license, visit http://creativecommons.org/licenses/by/4.0/
Each World Resources Institute report represents a timely, scholarly treatment of a subject of public concern. WRI takes responsibility for choosing the study topics and guaranteeing its authors and researchers freedom of inquiry. It also solicits and responds to the guidance of advisory panels and expert reviewers. Unless otherwise stated, however, all the interpretation and findings set forth in WRI publications are those of the authors.
Maps are for illustrative purposes and do not imply the expression of any opinion on the part of WRI, concerning the legal status of any country or territory or concerning the delimitation of frontiers or boundaries.

10 G STREET NE SUITE 800WASHINGTON, DC 20002, USA+1 (202) 729-7600WWW.WRI.ORG