state of georgia department of community health georgia ... · department of community health...
TRANSCRIPT

State of Georgia
Department of Community Health Georgia Families Program
WellCare of Georgia, Inc.
PERFORMANCE IMPROVEMENT
PROJECTS REPORT SFY 2013
December 2012

WellCare of Georgia, Inc. SFY 2013 PIP Validation Report WellCare_GASFY2013_CMO_PIP-Val_Report_F1_1212 State of Georgia Health Services Advisory Group, Inc.
Page i
TABLE OF CONTENTS 1. Background ....................................................................................................................... 1-1
CMO Overview ............................................................................................................................... 1-2 Study Rationale .............................................................................................................................. 1-2 Study Summary .............................................................................................................................. 1-3 Validation Overview ........................................................................................................................ 1-4 HSAG’s Validation Scoring Methodology ........................................................................................ 1-6
2. Findings ............................................................................................................................. 2-1 Aggregate Validation Findings ........................................................................................................ 2-1
Design ......................................................................................................................................... 2-3 Implementation ........................................................................................................................... 2-3 Outcomes ................................................................................................................................... 2-3
PIP-Specific Outcomes ................................................................................................................... 2-4 Analysis of Results ...................................................................................................................... 2-4 Adults’ Access to Care ................................................................................................................ 2-6 Annual Dental Visits .................................................................................................................... 2-7 Childhood Immunizations ............................................................................................................ 2-8 Childhood Obesity ....................................................................................................................... 2-9 Emergency Room Utilization ..................................................................................................... 2-10 Lead Screening in Children ....................................................................................................... 2-10 Well-Child Visits ........................................................................................................................ 2-11 Member and Provider Satisfaction ............................................................................................ 2-12 Member Satisfaction ................................................................................................................. 2-13 Provider Satisfaction ................................................................................................................. 2-13
3. Strengths ........................................................................................................................... 3-1 Individual PIP Strengths .................................................................................................................. 3-1 Global PIP Strengths ...................................................................................................................... 3-1
4. Opportunities for Improvement ........................................................................................ 4-1 Individual PIP Opportunities for Improvement ................................................................................. 4-1 Global PIP Opportunities for Improvement ...................................................................................... 4-1
Appendix A. PIP-Specific Validation Scores ...................................................................... A-1

WellCare of Georgia, Inc. SFY 2013 PIP Validation Report WellCare_GASFY2013_CMO_PIP-Val_Report_F1_1212 State of Georgia Health Services Advisory Group, Inc.
Page ii
ACKNOWLEDGMENTS AND COPYRIGHTS CAHPS® refers to the Consumer Assessment of Healthcare Providers and Systems and is a registered trademark of the Agency for Healthcare Research and Quality (AHRQ). HEDIS® refers to the Healthcare Effectiveness Data and Information Set and is a registered trademark of the National Committee for Quality Assurance (NCQA).

WellCare of Georgia, Inc. SFY 2013 PIP Validation Report WellCare_GASFY2013_CMO_PIP-Val_Report_F1_1212 State of Georgia Health Services Advisory Group, Inc.
Page 1-1
Performance Improvement Project Validation Report – WellCare of Georgia, Inc.
1. BACKGROUND
The Georgia Department of Community Health (DCH) is responsible for administering the Medicaid program and the Children’s Health Insurance Program (CHIP) for the State of Georgia and overseeing quality improvement activities. The State refers to its Medicaid managed care program as Georgia Families and to its CHIP program as PeachCare for Kids®. For the purposes of this report, “Georgia Families” refers to all Medicaid and CHIP members enrolled in managed care.
The Georgia Families® Managed Care Program serves the majority of Georgia’s Medicaid and CHIP populations. The DCH requires its Georgia Families® contracted Care Management Organizations (CMOs) to conduct performance improvement projects (PIPs) as set forth in 42 CFR §438.240 to assess and improve the quality of targeted areas of clinical or nonclinical care or service provided to members, and to report the status and results of each PIP annually. WellCare is one of the Georgia Families® CMOs.
The validation of PIPs is one of three federally-mandated activities for state Medicaid managed care programs. The other two required activities include the evaluation of CMO compliance with State and federal regulations and the validation of CMO performance measures.
These three mandatory activities work together to ensure that the CMOs assure appropriate access to high quality care for their members. While a CMO’s compliance with managed care regulations provides the organizational foundation for the delivery of quality health care, the calculation and reporting of performance measure rates provide a barometer of the quality and effectiveness of the care. When performance measures highlight areas of low performance, the DCH requires the CMOs to initiate PIPs to improve the quality of health care in targeted areas. PIPs are key tools in helping the DCH achieve goals and objectives outlined in its quality strategy; they provide the framework for monitoring, measuring and improving the delivery of health care.
The primary objective of PIP validation is to determine each CMO’s compliance with requirements set forth in 42 CFR §438.240(b)(1), including:
Measurement of performance using objective quality indicators Implementation of system interventions to achieve improvement in quality Evaluation of the effectiveness of the interventions Planning and initiation of activities to increase or sustain improvement
To meet the federal requirement for the validation of PIPs, the DCH contracted with Health Services Advisory Group, Inc. (HSAG), the State’s EQRO, to conduct the validation of WellCare’s PIPs. WellCare submitted PIPs to HSAG between June 29, 2012, and August 3,

BACKGROUND
WellCare of Georgia, Inc. SFY 2013 PIP Validation Report WellCare_GASFY2013_CMO_PIP-Val_Report_F1_1212 State of Georgia Health Services Advisory Group, Inc.
Page 1-2
2012, and HSAG validated the PIPs between July 2, 2012, and August 10, 2012. The validated data represents varying measurement time periods as described in Table 2-3 and Table 2-5.
HSAG reviewed each PIP using the Centers for Medicare & Medicaid Services (CMS) validation protocol1-1 and evaluated two key components of the quality improvement process, as follows:
1. HSAG evaluated the technical structure of the PIPs to ensure WellCare designed, conducted and reported PIPs using sound methodology consistent with the CMS protocol for conducting PIPs. HSAG’s review determined whether a PIP could reliably measure outcomes. Successful execution of this component ensures that reported PIP results are accurate and capable of measuring sustained improvement.
2. HSAG evaluated the outcomes of the PIPs. Once designed, a PIP’s effectiveness in improving outcomes depends on the systematic identification of barriers and the subsequent development of relevant interventions. Outcome evaluation determined whether WellCare improved its rates through implementation of effective processes (i.e., barrier analyses, intervention design and evaluation of results) and achieved statistically significant improvement over the baseline rate. A primary goal of HSAG’s PIP validation is to ensure that the DCH and key stakeholders can have confidence that any reported improvement in outcomes is related to a given PIP.
CMO Overview
The DCH contracted with WellCare beginning in 2006 to provide services to the Georgia Families program (Medicaid and PeachCare for Kids®) population. WellCare currently serves the eligible population in all geographic regions of Georgia—Atlanta, Central, East, North, Southeast, and Southwest.
Study Rationale
The purpose of a PIP is to achieve, through ongoing measurements and interventions, significant improvement sustained over time in clinical or nonclinical areas. Although HSAG has validated WellCare’s PIPs for five years, the number of PIPs, study topics and study methods has evolved over time.
WellCare submitted nine (9) PIPs for validation. The PIP topics include:
Adults’ Access to Care Annual Dental Visits Childhood Immunizations Childhood Obesity
1-1 U.S. Department of Health and Human Services, Centers for Medicare & Medicaid Services. EQR Managed Care
Organization Protocol. Validating Performance Improvement Projects: A Protocol for Use in Conducting Medicaid External Quality Review Activities, Final Protocol, Version 1.0, May 2002.

BACKGROUND
WellCare of Georgia, Inc. SFY 2013 PIP Validation Report WellCare_GASFY2013_CMO_PIP-Val_Report_F1_1212 State of Georgia Health Services Advisory Group, Inc.
Page 1-3
Emergency Room Utilization Lead Screening in Children Member Satisfaction Provider Satisfaction Well-Child Visits
The effectiveness of WellCare’s performance improvement efforts was measured using study indicators that aligned with HEDIS performance measures.
Study Summary
As noted in its Quality Strategic Plan Update (November 2011), the DCH identified the improvement and enhancement of the quality of patient care provided through ongoing, objective, and systematic measurement, analysis and improvement of performance as one of its four performance-driven goals. The goals are designed to demonstrate success or identify challenges in meeting intended outcomes related to providing quality, accessible, and timely services. The June 29, 2012, through August 3, 2012 PIP submission included seven clinical PIPs: Adults’ Access to Care , Annual Dental Visits, Childhood Immunizations, Childhood Obesity, Emergency Room Utilization, Lead Screening in Children and Well-Child Visits and two nonclinical PIPs: Member Satisfaction and Provider Satisfaction.
Five of the clinical PIP topics directly relate to performance measure outcomes that link to preventive health services delivery and management of disease. They include: Annual Dental Visits, Childhood Immunizations, Childhood Obesity, Lead Screening in Children and Well-Child Visits. Children’s primary health care is a vital part of the effort to prevent, recognize and treat health conditions that can result in significant developmental and health status consequences for children and adolescents. Timely screening and interventions can reduce future complications such as those related to obesity.
The other two clinical PIPs, Adults’ Access to Care and Emergency Room Utilization represent an essential component in developing a relationship with a health care provider and establishing a medical home, as well as ensuring that members have access to and receive care from the most appropriate care setting. These PIP topics represent a key area of focus for improvement.
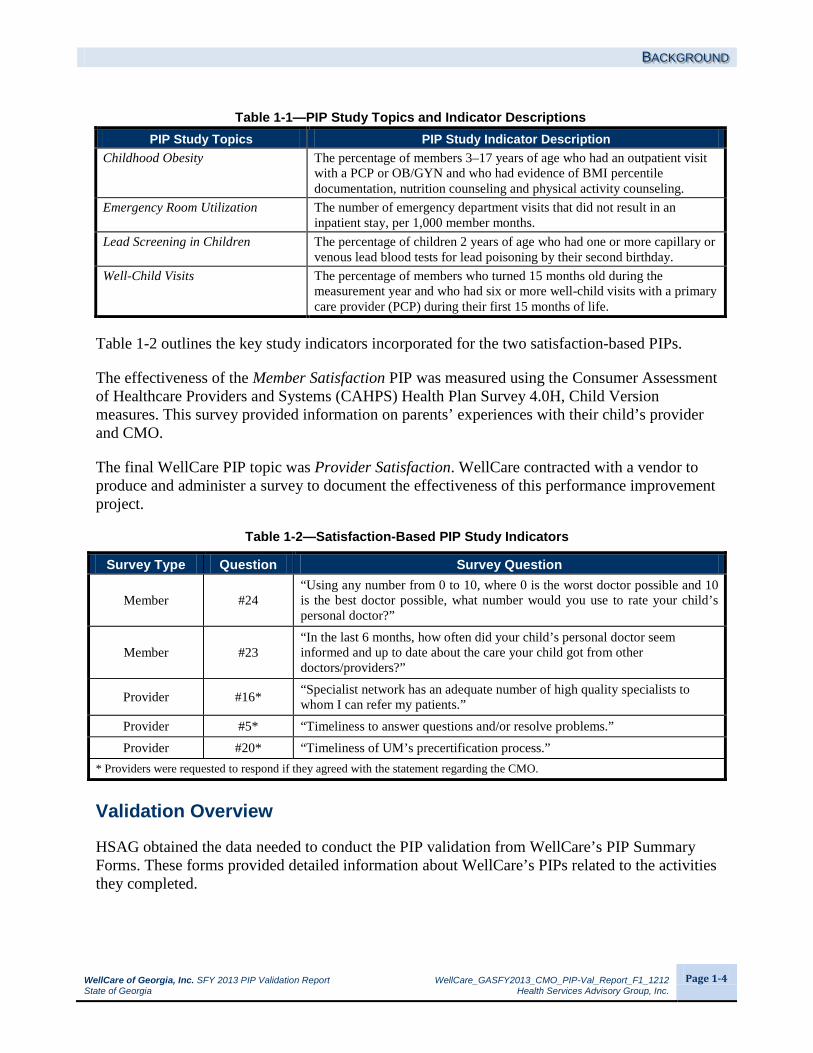
Table 1-1 outlines the key study indicators incorporated for the seven HEDIS-based PIPs.
Table 1-1—PIP Study Topics and Indicator Descriptions PIP Study Topics PIP Study Indicator Description
Adults’ Access to Care The percentage of members 20–44 years of age who had an ambulatory or preventive care visit.
Annual Dental Visits The percentage of members who had at least one dental visit: 2–3 years of age, and 2–21 years of age.
Childhood Immunizations The percentage of children 2 years of age who had the following vaccines by their second birthday: four diphtheria, tetanus and acellular pertussis (DTaP); three polio (IVP); one measles, mumps and rubella (MMR); two H influenza type B (Hib); three hepatitis B; and one chicken pox (VZN).
BACKGROUND
WellCare of Georgia, Inc. SFY 2013 PIP Validation Report WellCare_GASFY2013_CMO_PIP-Val_Report_F1_1212 State of Georgia Health Services Advisory Group, Inc.
Page 1-4
Table 1-1—PIP Study Topics and Indicator Descriptions PIP Study Topics PIP Study Indicator Description
Childhood Obesity The percentage of members 3–17 years of age who had an outpatient visit with a PCP or OB/GYN and who had evidence of BMI percentile documentation, nutrition counseling and physical activity counseling.
Emergency Room Utilization The number of emergency department visits that did not result in an inpatient stay, per 1,000 member months.
Lead Screening in Children The percentage of children 2 years of age who had one or more capillary or venous lead blood tests for lead poisoning by their second birthday.
Well-Child Visits The percentage of members who turned 15 months old during the measurement year and who had six or more well-child visits with a primary care provider (PCP) during their first 15 months of life.
Table 1-2 outlines the key study indicators incorporated for the two satisfaction-based PIPs.
The effectiveness of the Member Satisfaction PIP was measured using the Consumer Assessment of Healthcare Providers and Systems (CAHPS) Health Plan Survey 4.0H, Child Version measures. This survey provided information on parents’ experiences with their child’s provider and CMO.
The final WellCare PIP topic was Provider Satisfaction. WellCare contracted with a vendor to produce and administer a survey to document the effectiveness of this performance improvement project.
Table 1-2—Satisfaction-Based PIP Study Indicators
Survey Type Question Survey Question
Member #24 “Using any number from 0 to 10, where 0 is the worst doctor possible and 10 is the best doctor possible, what number would you use to rate your child’s personal doctor?”
Member #23 “In the last 6 months, how often did your child’s personal doctor seem informed and up to date about the care your child got from other doctors/providers?”
Provider #16* “Specialist network has an adequate number of high quality specialists to whom I can refer my patients.”
Provider #5* “Timeliness to answer questions and/or resolve problems.” Provider #20* “Timeliness of UM’s precertification process.”
* Providers were requested to respond if they agreed with the statement regarding the CMO.
Validation Overview
HSAG obtained the data needed to conduct the PIP validation from WellCare’s PIP Summary Forms. These forms provided detailed information about WellCare’s PIPs related to the activities they completed.

BACKGROUND
WellCare of Georgia, Inc. SFY 2013 PIP Validation Report WellCare_GASFY2013_CMO_PIP-Val_Report_F1_1212 State of Georgia Health Services Advisory Group, Inc.
Page 1-5
Each required activity was evaluated on one or more elements that form a valid PIP. The HSAG PIP Review Team scored each evaluation element within a given activity as Met, Partially Met, Not Met, Not Applicable or Not Assessed. HSAG designated some of the evaluation elements deemed pivotal to the PIP process as critical elements. For a PIP to produce valid and reliable results, all of the critical elements had to be Met. Given the importance of critical elements to the scoring methodology, any critical element that received a Not Met score resulted in an overall validation rating for the PIP of Not Met. A CMO would be given a Partially Met score if 60 percent to 79 percent of all evaluation elements were Met or one or more critical elements were Partially Met. HSAG provided a Point of Clarification when enhanced documentation would have demonstrated a stronger understanding and application of the PIP activities and evaluation elements.
In addition to the validation status (e.g., Met) HSAG gave each PIP an overall percentage score for all evaluation elements (including critical elements). HSAG calculated the overall percentage score by dividing the total number of elements scored as Met by the total number of elements scored as Met, Partially Met and Not Met. HSAG also calculated a critical element percentage score by dividing the total number of critical elements scored as Met by the sum of the critical elements scored as Met, Partially Met and Not Met.
Figure 1-1 illustrates the three study stages of the PIP process: Design, Implementation and Outcomes. Each sequential stage provides the foundation for the next stage. The Design stage establishes the methodological framework for the PIP. The activities in this section include development of the study topic, question, indicators and population. To implement successful improvement strategies, a strong study design is necessary.
Figure 1-1—PIP Study Stages
III. OUTCOMES
II. IMPLEMENTATION
I. DESIGN
BACKGROUND
WellCare of Georgia, Inc. SFY 2013 PIP Validation Report WellCare_GASFY2013_CMO_PIP-Val_Report_F1_1212 State of Georgia Health Services Advisory Group, Inc.
Page 1-6
Once the study design was established, the PIP process moved into the Implementation stage. This stage included data collection, sampling and interventions. During this stage, WellCare collected measurement data, evaluated and identified barriers to performance, and developed interventions targeted to improve outcomes. The implementation of effective improvement strategies is necessary to improve PIP outcomes. The final stage was Outcomes, which involved data analysis and the evaluation of real and sustained improvement based on reported results and statistical testing. Sustained improvement is achieved when outcomes exhibit statistical improvement over the baseline rate and sustain the improvement over time and multiple measurements. This stage is the culmination of the previous two stages. If the study outcomes did not improve, WellCare’s responsibility was to investigate the data it collected to ensure it had correctly identified the barriers and implemented targeted interventions to address the identified barriers. If it had not, WellCare would revise its interventions and collect additional data to remeasure and evaluate outcomes for improvement. This process becomes cyclical until sustained improvement is achieved.
HSAG’s Validation Scoring Methodology
During SFY 2012, HSAG worked with DCH to modify the existing PIP validation methodology. The modifications were designed to ensure WellCare achieves improvement in the study outcomes for all PIPs submitted for validation. Changes were made to the validation activities for Activity VIII (sufficient data analysis and interpretation).WellCare must now present study results that are accurate, clear and easily understood. Furthermore, sufficient data analysis and interpretation is now a critical element; therefore, if the study indicator results are not accurate, the PIP cannot receive an overall Met validation status. Changes were also made to the validation activities for Activity IX (real improvement achieved) and this activity is now a critical element for all PIPs that progress to this stage. Any PIP that does not achieve statistically significant improvement will not receive an overall Met validation status. WellCare’s study indicator outcomes must achieve statistically significant improvement over the baseline rate. Finally, changes were made to the validation activities for Activity X (sustained improvement achieved). HSAG assesses each study indicator for sustained improvement after the PIP indicator achieves statistically significant improvement. For PIPs with multiple indicators, all indicators must achieve statistically significant improvement and report a subsequent measurement period with documented sustained improvement. All study indicators must now achieve statistically significant improvement and sustain this improvement to receive a Met score for Activity X.

WellCare of Georgia, Inc. SFY 2013 PIP Validation Report WellCare_GASFY2013_CMO_PIP-Val_Report_F1_1212 State of Georgia Health Services Advisory Group, Inc.
Page 2-1
2. FINDINGS for WellCare of Georgia, Inc.
Aggregate Validation Findings
HSAG organized, aggregated, and analyzed WellCare’s PIP data to draw conclusions about the CMO’s quality improvement efforts. The PIP validation process evaluated both the technical methods of the PIP (i.e., the study design) and the outcomes associated with the implementation of interventions. Based on its review, HSAG determined the overall methodological validity of the PIPs, as well as the overall success in achieving improved study indicator outcomes. The results are presented in Table 2-1.
Table 2-1—Performance Improvement Project Validation Scores for WellCare of Georgia, Inc.
PIP Percentage Score of Evaluation Elements Met
Percentage Score of Critical Elements Met Validation Status
Adults’ Access to Care 100% 100% Met Annual Dental Visits 89% 75% Not Met Childhood Immunizations 100% 100% Met Childhood Obesity 86% 86% Partially Met Emergency Room Utilization 100% 100% Met Lead Screening in Children 100% 100% Met Member Satisfaction 85% 79% Partially Met Provider Satisfaction 89% 86% Partially Met Well-Child Visits 94% 86% Not Met
Not all PIPs received an overall Met validation status. Two PIPs—Childhood Obesity and Member Satisfaction—received a Partially Met validation status due to the CMO documenting inaccurate data and statistical testing values in the data table of Activity IX. Although the CMO documented inaccurate numerators and denominators in its PIP Summary Form, the CMO correctly reported its study indicator rates in the PIP. This was validated by HSAG through a comparison of WellCare’s PIP reported rates to its audited performance measure rates submitted to NCQA for the Childhood Obesity measures. For the Provider Satisfaction PIP, not all of the study indicators demonstrated statistically significant improvement.
Two of the nine PIPs received a Not Met validation status. WellCare did not define the study population correctly in its Annual Dental Visits PIP; therefore, the PIP received a Not Met status. An increase was noted for the Well-Child Visits PIP; however, this improvement was not statistically significant which resulted in the Not Met validation status.
Table 2-2 displays the combined validation results for all nine WellCare PIPs validated during FY 2013. This table illustrates the CMO’s application of the PIP process and its success in implementing the study. Each activity is composed of individual evaluation elements scored as Met, Partially Met or Not Met. Elements receiving a Met score have satisfied the necessary

FINDINGS
WellCare of Georgia, Inc. SFY 2013 PIP Validation Report WellCare_GASFY2013_CMO_PIP-Val_Report_F1_1212 State of Georgia Health Services Advisory Group, Inc.
Page 2-2
technical requirements for a specific element. The validation results presented in Table 2-2 show the percentage of applicable evaluation elements that received a Met score by activity. Additionally, HSAG calculated an overall score across all activities. Appendix A provides the detailed scores from the validation tool for each of the nine PIPs.
Table 2-2—Performance Improvement Project Validation Results for WellCare of Georgia, Inc. (N=9 PIPs)
Study Stage Activity Percentage of Applicable Elements Scored Met
Design
I. Appropriate Study Topic 98% (49/50)
II. Clearly Defined, Answerable Study Question(s) 100% (18/18)
III. Clearly Defined Study Indicator(s) 100% (54/54)
IV. Correctly Identified Study Population 93% (25/27)
Design Total 98% (146/149)
Implementation
V. Valid Sampling Techniques (if sampling was used) 100% (36/36)
VI. Accurate/Complete Data Collection 100% (72/72)
VII. Appropriate Improvement Strategies 85% (28/33)
Implementation Total 96% (136/141)
Outcomes
VIII. Sufficient Data Analysis and Interpretation 90% (70/78)
IX. Real Improvement Achieved 72% (26/36)
X. Sustained Improvement Achieved 100% (4/4)
Outcomes Total 85% (100/118)
Percentage Score of Applicable Evaluation Elements Met 94% (382/408)
Overall, 94 percent of the evaluation elements across all nine PIPs received a score of Met. The 94 percent score demonstrates an adequate application of the PIP process. While WellCare’s strong performance in the Design stage indicated that each PIP was designed appropriately to measure outcomes and improvement, WellCare was less successful in the Implementation and Outcomes stages. The following subsections highlight HSAG’s validation findings associated with each of the three PIP stages.

FINDINGS
WellCare of Georgia, Inc. SFY 2013 PIP Validation Report WellCare_GASFY2013_CMO_PIP-Val_Report_F1_1212 State of Georgia Health Services Advisory Group, Inc.
Page 2-3
Design
WellCare met 98 percent of the requirements across all nine PIPs within the Design stage, with two of the four activities scoring 100 percent. Overall, WellCare designed scientifically sound studies that were supported by the use of key research principles. The technical design of each PIP was sufficient to measure and monitor PIP outcomes associated with WellCare’s improvement strategies. The solid design of the PIPs allowed the successful progression to the next stage of the PIP process.
Implementation
WellCare met 96 percent of the requirements for the three activities within the Implementation stage but only 85 percent for appropriate improvement strategies. The CMO accurately documented and executed the application of the study design and documented conducting causal/barrier analysis; however, not all of the analysis conducted by the CMO was appropriate. WellCare did not successfully link interventions to the identified barriers, and the CMO lacked a consistent process to evaluate the efficacy of its interventions.
Outcomes
This year, four PIPs (Adults’ Access to Care, Annual Dental Visits, Emergency Room Utilization and Lead Screening in Children) were evaluated for sustained improvement, and all four PIPs achieved sustained improvement. Sustained improvement is defined as statistically significant improvement in performance over baseline that is maintained or increased for at least one subsequent measurement period. Additionally, the results of the most current measurement period must reflect improvement when compared to the baseline results.
FINDINGS
WellCare of Georgia, Inc. SFY 2013 PIP Validation Report WellCare_GASFY2013_CMO_PIP-Val_Report_F1_1212 State of Georgia Health Services Advisory Group, Inc.
Page 2-4
PIP-Specific Outcomes
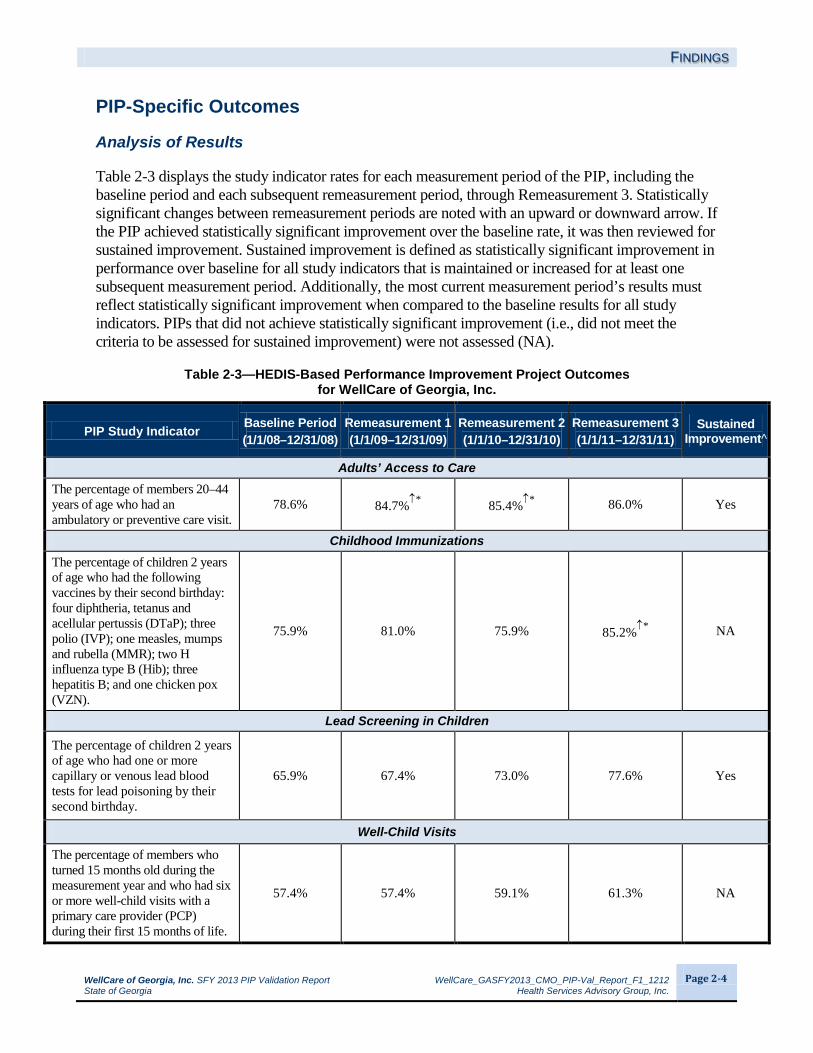
Analysis of Results
Table 2-3 displays the study indicator rates for each measurement period of the PIP, including the baseline period and each subsequent remeasurement period, through Remeasurement 3. Statistically significant changes between remeasurement periods are noted with an upward or downward arrow. If the PIP achieved statistically significant improvement over the baseline rate, it was then reviewed for sustained improvement. Sustained improvement is defined as statistically significant improvement in performance over baseline for all study indicators that is maintained or increased for at least one subsequent measurement period. Additionally, the most current measurement period’s results must reflect statistically significant improvement when compared to the baseline results for all study indicators. PIPs that did not achieve statistically significant improvement (i.e., did not meet the criteria to be assessed for sustained improvement) were not assessed (NA).
Table 2-3—HEDIS-Based Performance Improvement Project Outcomes for WellCare of Georgia, Inc.
PIP Study Indicator Baseline Period (1/1/08–12/31/08)
Remeasurement 1 (1/1/09–12/31/09)
Remeasurement 2 (1/1/10–12/31/10)
Remeasurement 3 (1/1/11–12/31/11)
Sustained Improvement^
Adults’ Access to Care The percentage of members 20–44 years of age who had an ambulatory or preventive care visit.
78.6% 84.7%↑* 85.4%↑* 86.0% Yes
Childhood Immunizations The percentage of children 2 years of age who had the following vaccines by their second birthday: four diphtheria, tetanus and acellular pertussis (DTaP); three polio (IVP); one measles, mumps and rubella (MMR); two H influenza type B (Hib); three hepatitis B; and one chicken pox (VZN).
75.9% 81.0% 75.9% 85.2%↑* NA
Lead Screening in Children
The percentage of children 2 years of age who had one or more capillary or venous lead blood tests for lead poisoning by their second birthday.
65.9% 67.4% 73.0% 77.6% Yes
Well-Child Visits
The percentage of members who turned 15 months old during the measurement year and who had six or more well-child visits with a primary care provider (PCP) during their first 15 months of life.
57.4% 57.4% 59.1% 61.3% NA

FINDINGS
WellCare of Georgia, Inc. SFY 2013 PIP Validation Report WellCare_GASFY2013_CMO_PIP-Val_Report_F1_1212 State of Georgia Health Services Advisory Group, Inc.
Page 2-5
Table 2-4 displays the study indicator rates for WellCare’s three PIPs that progressed to Remeasurement 2.
Table 2-4—HEDIS-Based Performance Improvement Project Outcomes for WellCare of Georgia, Inc.
PIP Study Indicator Baseline Period (1/1/09–12/31/09)
Remeasurement 1 (1/1/10–12/31/10)
Remeasurement 2 (1/1/11–12/31/11)
Sustained Improvement^
Annual Dental Visits Percentage of members 2–3 years of age who had at least one dental visit.
40.4% 45.5%↑* 50.0%↑* Yes
Percentage of members 2–21 years of age who had at least one dental visit.
65.2% 67.5%↑* 70.5%↑* Yes
PIP Study Indicator Baseline Period (1/1/09–12/31/09)
Remeasurement 1 (1/1/10–12/31/10)
Remeasurement 2 (1/1/11–12/31/11)
Sustained Improvement^
Childhood Obesity The percentage of members 3–17 years of age who had an outpatient visit with a PCP or OB/GYN and who had evidence of BMI percentile documentation.
36.5% 30.4% 56.9%↑* NA
The percentage of members 3–17 years of age who had an outpatient visit with a PCP or OB/GYN and who had evidence of counseling for nutrition.
42.3% 48.9% 50.4% NA
The percentage of members 3–17 years of age who had an outpatient visit with a PCP or OB/GYN and who had evidence of counseling for physical activity.
38.7% 30.9%↓* 37.0% NA
Emergency Room Utilization The number of emergency room visits that did not result in an inpatient stay per 1,000 member months
65.9 61.7↑* 59.3%↑* Yes
NA Statistically significant improvement over baseline and a subsequent measurement must occur for all study indicators before sustained improvement can be assessed.
↑* Designates statistically significant improvement over the prior measurement period (p value < 0.05). ↓* Designates statistically significant decline in performance over the prior measurement period (p value < 0.05). ^ Sustained improvement is defined as statistically significant improvement in performance over baseline for all study indicators that is
maintained or increased for at least one subsequent measurement period. Additionally, the most current measurement period’s results must reflect statistically significant improvement when compared to the baseline results for all study indicators.

FINDINGS
WellCare of Georgia, Inc. SFY 2013 PIP Validation Report WellCare_GASFY2013_CMO_PIP-Val_Report_F1_1212 State of Georgia Health Services Advisory Group, Inc.
Page 2-6
WellCare was not successful in achieving the desired outcomes for all study indicators. The CMO either did not demonstrate improvement or it could not be determined whether the improvement was due to the implementation of the CMO’s improvement strategy or due to chance.
The identification of barriers through barrier analysis and the subsequent selection of appropriate interventions to address those barriers are necessary steps to improve outcomes. WellCare’s choice of interventions, the combination of intervention types and the sequence of intervention implementation are all essential to its overall success. Deficiencies were identified during the validation process in each of these areas and will be explained in further detail below.
The following section discusses the improvement strategies the CMO implemented in conjunction with the PIPs’ study indicator results. Comparisons to HEDIS benchmarks were made using the Medicaid HEDIS 2010 Audit, Means, Percentiles and Ratios (reflecting the 2009 calendar year [CY]).
Adults’ Access to Care
The percentage of adult members who accessed ambulatory or preventive care during the measurement year increased to 86 percent, which was a non-statistically significant increase of 0.6 percentage points. Statistically significant improvement is the standard for assessing real improvement and supports the conclusion that the improvement was not due to chance. Although WellCare’s performance improved, it remained 2.5 percentage points below the CY 2011 DCH target (88.5 percent) and fell between the national HEDIS 2010 Medicaid 50th and 75th percentiles (82.9 percent and 86.7 percent, respectively). However, the Remeasurement 3 results demonstrated that WellCare was able to sustain the statistically significant improvement that was achieved at Remeasurement 1.
For the Adults’ Access to Care PIP, WellCare completed a Cause and Effect diagram. This diagram identified a number of barriers: member lack of knowledge on medical risks factors, provider lack of incentive, provider lack of free child care services in offices, emergency room access does not require a need to locate a provider, accessing the emergency room does not require a scheduled appointment, a culture in transit, and a culture that perceives that extra expenses will occur. WellCare focused on the following barriers: lack of providers’ understanding the need to perform services, lack of communication with the PCP medical home, lack of member understanding of the need to obtain services, and lack of member knowledge regarding transportation. WellCare implemented the following improvement strategies:
A pay-for-performance incentive program for providers to receive payments for one or more ambulatory or preventive care visits.
Distribution of adult preventive health care guidelines through the Web site, provider handbook and newsletter.
The CareConnects program, which allows customer service representatives to contact members with care gaps (missed opportunities of care).
FINDINGS
WellCare of Georgia, Inc. SFY 2013 PIP Validation Report WellCare_GASFY2013_CMO_PIP-Val_Report_F1_1212 State of Georgia Health Services Advisory Group, Inc.
Page 2-7
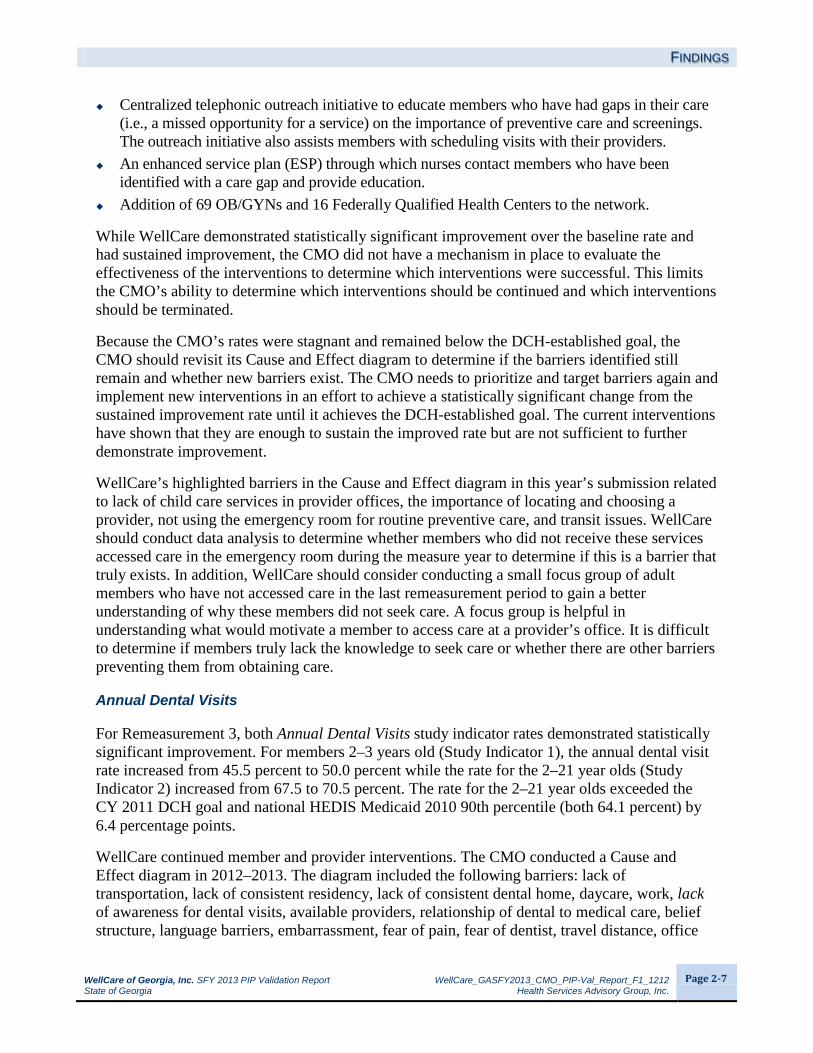
Centralized telephonic outreach initiative to educate members who have had gaps in their care (i.e., a missed opportunity for a service) on the importance of preventive care and screenings. The outreach initiative also assists members with scheduling visits with their providers.
An enhanced service plan (ESP) through which nurses contact members who have been identified with a care gap and provide education.
Addition of 69 OB/GYNs and 16 Federally Qualified Health Centers to the network.
While WellCare demonstrated statistically significant improvement over the baseline rate and had sustained improvement, the CMO did not have a mechanism in place to evaluate the effectiveness of the interventions to determine which interventions were successful. This limits the CMO’s ability to determine which interventions should be continued and which interventions should be terminated.
Because the CMO’s rates were stagnant and remained below the DCH-established goal, the CMO should revisit its Cause and Effect diagram to determine if the barriers identified still remain and whether new barriers exist. The CMO needs to prioritize and target barriers again and implement new interventions in an effort to achieve a statistically significant change from the sustained improvement rate until it achieves the DCH-established goal. The current interventions have shown that they are enough to sustain the improved rate but are not sufficient to further demonstrate improvement.
WellCare’s highlighted barriers in the Cause and Effect diagram in this year’s submission related to lack of child care services in provider offices, the importance of locating and choosing a provider, not using the emergency room for routine preventive care, and transit issues. WellCare should conduct data analysis to determine whether members who did not receive these services accessed care in the emergency room during the measure year to determine if this is a barrier that truly exists. In addition, WellCare should consider conducting a small focus group of adult members who have not accessed care in the last remeasurement period to gain a better understanding of why these members did not seek care. A focus group is helpful in understanding what would motivate a member to access care at a provider’s office. It is difficult to determine if members truly lack the knowledge to seek care or whether there are other barriers preventing them from obtaining care.
Annual Dental Visits
For Remeasurement 3, both Annual Dental Visits study indicator rates demonstrated statistically significant improvement. For members 2–3 years old (Study Indicator 1), the annual dental visit rate increased from 45.5 percent to 50.0 percent while the rate for the 2–21 year olds (Study Indicator 2) increased from 67.5 to 70.5 percent. The rate for the 2–21 year olds exceeded the CY 2011 DCH goal and national HEDIS Medicaid 2010 90th percentile (both 64.1 percent) by 6.4 percentage points.
WellCare continued member and provider interventions. The CMO conducted a Cause and Effect diagram in 2012–2013. The diagram included the following barriers: lack of transportation, lack of consistent residency, lack of consistent dental home, daycare, work, lack of awareness for dental visits, available providers, relationship of dental to medical care, belief structure, language barriers, embarrassment, fear of pain, fear of dentist, travel distance, office

FINDINGS
WellCare of Georgia, Inc. SFY 2013 PIP Validation Report WellCare_GASFY2013_CMO_PIP-Val_Report_F1_1212 State of Georgia Health Services Advisory Group, Inc.
Page 2-8
hours, and wait times. The 2012–2013 Cause and Effect diagram also included how to prevent dental caries as a barrier. Some of the interventions WellCare implemented are as follows:
Sent reminder postcards and information regarding recommended dental care provided to members through the member handbook.
Created and distributed missed dental appointment letters to members who had not had a dental service in the prior six months.
Collaborated with DentaQuest to create an article for the member newsletter. Distributed handbooks with the recommended schedule for dental visits and placed an article in
the provider newsletter with information about when to conduct an oral health risk assessment and when to complete a referral per the American Academy of Pediatric Dentistry (AAPD) periodicity schedule.
It appeared from the intervention table in Activity VII and the documentation in the PIP that the priority barriers chosen by WellCare were lack of provider knowledge and lack of member knowledge. Lack of provider knowledge was not one of the barriers identified in the Cause and Effect diagram. WellCare should document the processes and rationale for selecting the documented barriers.
Although both study indicators have achieved statistically significant improvement over the baseline rates, there were a number of barriers identified that WellCare has not addressed. For example, if the CMO were to address the lack of member transportation, lack of consistent dental home, available office hours, and provider locations, WellCare could see continued forward momentum in improving the dental visit rates for both study indicators.
Childhood Immunizations
For Remeasurement 3, the Childhood Immunizations rate increased by 9.3 percentage points from 75.9 percent to 85.2 percent. The increase was statistically significant and was slightly below the national HEDIS 2010 Medicaid 90th percentile (85.6 percent).
WellCare documented that its Utilization Management Medical Advisory Committee (UMAC) and Quality Improvement Committee (QIC) meet quarterly to address barriers. The CMO’s cross-functional HEDIS Steering Committee meets bi-monthly to identify and address barriers. These three committees develop interventions to address member, provider, and plan barriers that are identified through member and provider correspondence, data analysis, and process review. WellCare further stated that member outreach coordinators, provider relations, and the quality improvement department collaborate to identify barriers and implement interventions. However, the CMO did not document what, if any, interaction occurs between the three identified committees, and it was unclear if the committees are working independently or collaboratively.
WellCare submitted a Cause and Effect diagram for this PIP. The diagram identified the following barriers: lack of member knowledge, lack of member incentive, the need for direct interaction with the member, the need to further educate providers about HEDIS guidelines, and the need to collaborate with larger provider groups. WellCare implemented interventions to address proper coding; it compiled provider noncompliant lists and enlisted the member outreach

FINDINGS
WellCare of Georgia, Inc. SFY 2013 PIP Validation Report WellCare_GASFY2013_CMO_PIP-Val_Report_F1_1212 State of Georgia Health Services Advisory Group, Inc.
Page 2-9
team to contact these providers. The CMO distributed member newsletters, hosted member outreach events, provided member articles on the required immunization schedule, and implemented a provider Pay-for-Performance program. For this PIP, the barriers listed with the interventions closely resembled those identified in the Cause and Effect diagram.
WellCare should consistently monitor its interventions to determine which interventions are producing the desired outcomes. The plan should continue to revise its Cause and Effect diagram annually.
Childhood Obesity
This PIP achieved statistically significant improvement for one of the three study indicators. At Remeasurement 3, all three study indicator rates (BMI documentation [56.9 percent], counseling for nutrition [50.4 percent], and counseling for physical activity [37.0 percent]) demonstrated improvement, with one of the three indicators (BMI documentation [56.9 percent]) demonstrating statistically significant improvement. The Remeasurement 3 rates for evidence of counseling for nutrition and physical activity fell between the national HEDIS Medicaid 2010 50th and 75th percentiles. The BMI documentation Remeasurement 3 rate fell between the national HEDIS 2010 Medicaid 75th and 90th percentiles (45.2 and 63.0 percent, respectively). Only the BMI documentation study indicator rate exceeded the CY 2011 DCH goal of 45.2 percent.
For the Childhood Obesity PIP, WellCare performed a Cause and Effect diagram that showed the need to further educate members (regarding physical activity and proper nutrition) and providers (regarding performance documentation for obesity and nutritional counseling). The interventions appeared to be grouped according to the identified barriers: lack of provider knowledge/provider education regarding required documentation for obesity, and lack of member knowledge/member education. WellCare used reminder cards and handbooks to educate both members and providers. WellCare hosted member outreach events such as “WellCare Days” in high-volume provider offices to promote healthy living styles. The CMO also started a partnership with The Youth Becoming Healthy (YBH) Project, Inc., to help reduce childhood obesity. To educate its providers, WellCare provided information on proper documentation in Section 18 of its provider handbook and sent corrective action letters to providers who scored less than 80 percent on medical record review for BMI documentation.
Although WellCare has performed a causal/ barrier analysis and implemented multiple interventions, not all the interventions implemented will impact the study indicator rates. The interventions for this measure should primarily focus on providers. Members and their families can be educated on obesity, a healthy diet and lifestyle, and the importance of exercise; however, that education will not increase the rates for BMI percentile documentation and evidence of referrals for nutrition and physical activity by the provider. WellCare should implement more robust improvement strategies, directed toward its providers, that are focused on the three areas of this measure.

FINDINGS
WellCare of Georgia, Inc. SFY 2013 PIP Validation Report WellCare_GASFY2013_CMO_PIP-Val_Report_F1_1212 State of Georgia Health Services Advisory Group, Inc.
Page 2-10
Emergency Room Utilization
The focus of this PIP was to decrease the rate of ER visits that did not result in an inpatient stay per 1000 member months. The study indicator outcome demonstrated a statistically significant decrease in emergency room visits from 61.7 visits per 1000 member months to 59.3 visits per 1000 member months, which represented improvement (lower rates indicate better performance for this indicator). WellCare’s emergency room utilization was above the CY 2011 DCH target (58.5 percent) and between the national HEDIS 2010 Medicaid 25th percentile and 50th percentile (58.5 per 1000 member months and 67.7 per 1000 member months, respectively). For this measure, the HEDIS 2010 Medicaid 25th percentile is the top level of performance.
WellCare used a claims analysis to determine the need to implement its Emergency Room (ER) Outreach Initiative. This intervention provided education to specific members 5–12 and 18–34 years of age with the goal of changing behavior on ER utilization. These members, or their parents/guardians, were contacted within 24 to 48 hours of an ER visit and provided educational information by CMO staff. The education provided focused on promoting the PCP medical home, utilization of the personal health advisor line (24-hour nurse line), and other available benefits such as transportation and personal care items that the member could choose to order and have mailed to the home at no charge. WellCare reported that it will continue its educational campaign with the use of materials that not only reinforce the need for age-appropriate preventive health care, but also address the statistics that point to a parent’s lack of understanding of self-care alternatives resulting in inappropriate use of the emergency room for sick care.
WellCare’s Provider Relations associates also identified physicians who had large-volume membership and provided them with a detailed report that outlined the number of ER visits their members had made in a month, as well as the reason for the ER visit. The Provider Relations associates provided materials specifically designed to be distributed to members at the providers’ offices.
Lead Screening in Children
For Remeasurement 3, the Lead Screening in Children rate increased by 4.6 percentage points from 73.0 percent to 77.6 percent. The increase was not statistically significant, fell between the national HEDIS 2010 Medicaid 50th and 75th percentiles (71.6 and 81.0 percent, respectively), and was below the CY 2011 DCH target of 81.0 percent. However, the indicator has achieved statistically significant improvement over baseline and sustained the improvement.
In 2011, WellCare contracted with the lab vendor MedTox to simplify the process in obtaining blood lead testing and results. The lab provided network physicians with a filter paper lead screening method that is fast and non-invasive, and allows provider offices to easily perform lead screening tests. With this method, supplies are provided at no charge; and the provider can send samples via mail and receive the results within 72 hours. WellCare also continued its member telephone outreach and educational mailings regarding blood lead screening, as the newsletters and provider communications proved to be a cost-effective means of educating and communicating with providers and members. WellCare also implemented a provider pay-for-

FINDINGS
WellCare of Georgia, Inc. SFY 2013 PIP Validation Report WellCare_GASFY2013_CMO_PIP-Val_Report_F1_1212 State of Georgia Health Services Advisory Group, Inc.
Page 2-11
performance program to incentivize its providers for members who receive the required blood lead testing.
WellCare tracks and monitors its interventions monthly and/or quarterly, depending on the intervention. HSAG recommends that WellCare conduct further drill-down analysis to ensure that the barriers identified are still current and relevant and implement new interventions based on the outcomes of this analysis. Although the study indicator has achieved real improvement over the baseline, the rate remains below the DCH target of 81 percent.
Well-Child Visits
The study indicator rate for this PIP has achieved non-statistically significant improvement over the baseline rate. For Remeasurement 3, the Well-Child Visits rate demonstrated a non-statistically significant increase from 59.1 to 61.3 percent, remained below the CY 2011 DCH target of 69.7 percent, and was between the national HEDIS Medicaid 2010 50th and 75th percentiles (60.1 and 69.7 percent, respectively).
Although WellCare’s Well-Child Visits in the First 15 Months of Life rate did not achieve statistically significant improvement, WellCare has implemented improvement strategies that demonstrated a positive impact on outcomes. The CMO’s outreach call program was initiated in 2009 and included education on lead screening and immunizations. Due to the number of unsuccessful contacts, WellCare changed its vendor. The new vendor’s contract ended in March 2012, and WellCare hired its own fulltime staff member to continue outreach calls to educate members on the Early and Periodic Screening, Diagnostic and Treatment (EPSDT) Program, assist members with scheduling necessary well-care visits, and arrange transportation. This change increased the successful number of contacts from 2,822 to 35,225; and the number of unsuccessful contacts decreased by 26 percent. HSAG recognizes that this is a significant improvement in the number of successful contacts; however, WellCare should determine the effectiveness of this intervention The CMO should determine if the members who were successfully contacted sought a well-child visit as a result of this particular intervention.
There were barriers identified that WellCare has not addressed such as member transportation and member cultural issues. WellCare noted in the documentation that the member incentive program was discontinued; however, the CMO did not provide any information on how it is going to continue to address the member incentive barrier. WellCare should revisit its Cause and Effect diagram and conduct further drill-down analysis to ensure that it implements appropriate improvement strategies needed to demonstrate statistically significant improvement.

FINDINGS
WellCare of Georgia, Inc. SFY 2013 PIP Validation Report WellCare_GASFY2013_CMO_PIP-Val_Report_F1_1212 State of Georgia Health Services Advisory Group, Inc.
Page 2-12
Member and Provider Satisfaction
Table 2-5—Satisfaction-Based Performance Improvement Project Outcomes for WellCare of Georgia, Inc.
PIP Study Indicator Baseline Period (2/1/09–5/31/09)
Remeasurement 1 (2/1/10–5/31/10)
Remeasurement 2 (2/1/11–5/31/11)
Remeasurement 3 (2/1/11–5/31/11)
Sustained Improvement^
Member Satisfaction 1. The percentage of members
responding with either a “9” or “10” to Q24—“Using any number from 0 to 10, where 0 is the worst personal doctor possible and 10 is the best personal doctor possible, what number would you use to rate your child’s personal doctor?”
72.2% 71.2% 72.6% 87.8%↑* NA
2. The percentage of eligible members responding with either “Always” or “Usually” to Q23—“In the last 6 months, how often did your child’s personal doctor seem informed and up to date about the care your child got from other doctors/providers?”
77.1% 78.4% 74.6% 79.4% NA
PIP Study Indicator Baseline Period (10/1/06–9/30/07)
Remeasurement 1 (10/1/07–9/30/08)
Remeasurement 2 (10/1/08–9/30/09)
Remeasurement 3 (10/1/09-9/30/10)
Remeasurement 4 (10/1/10-9/30/11)
Sustained Improvement^
Provider Satisfaction 1. The percentage of
providers answering “Excellent” or “Very Good” to Q11—“Specialist network has an adequate number of high quality specialists to whom I can refer my patients.”
22.2% 19.7% 24.7% 24.1% 17.4%↓* NA
2. The percentage of providers answering “Excellent” or “Very Good” to Q5—“Timeliness to answer and/or resolve problems.”
22.2% 29.6%↑* 31.3% 33.6%↑* 36.3% NA
3. The percentage of providers answering “Excellent” or “Very Good” to Q15—“Timeliness of UM’s pre-certification process.”
22.5% 25.5% 29.3% 30.3% 27.9% NA
NA Statistically significant improvement over baseline and a subsequent measurement must occur for all study indicators before sustained improvement can be assessed. ↑* Designates statistically significant improvement over the prior measurement period (p value < 0.05). ↓* Designates statistically significant decline in performance over the prior measurement period (p value < 0.05). ^ Sustained improvement is defined as statistically significant improvement in performance over baseline for all study indicators that is maintained or increased
for at least one subsequent measurement period. Additionally, the most current measurement period’s results must reflect statistically significant improvement when compared to the baseline results for all study indicators.

FINDINGS
WellCare of Georgia, Inc. SFY 2013 PIP Validation Report WellCare_GASFY2013_CMO_PIP-Val_Report_F1_1212 State of Georgia Health Services Advisory Group, Inc.
Page 2-13
Member Satisfaction
The first study indicator outcome for the Member Satisfaction PIP (“…what number would you use to rate your child’s personal doctor?”) increased during the most recent measurement period as well as the second study indicator outcome (“…how often did your child’s personal doctor seem informed…?”). Only the improvement for Study Indicator 1 was statistically significant. Both study indicators need additional measurement periods to be assessed for sustained improvement. Study Indicator 2, however, will need to demonstrate statistically significant improvement above the baseline rate and report a subsequent measurement period to be assessed for sustained improvement.
For the Member Satisfaction PIP, WellCare created several workgroups to address the opportunities for improvement discovered during 2011, including a Utilization Management workgroup. As a result, several new case and disease management interventions were implemented to improve the overall care members receive and to improve the coordination of care efforts by working with providers. A common barrier identified was the lack of members understanding their benefits and the need for preventive care. To address this, one of the new interventions initiated was the HEDIS enhanced service plan (ESP). The purpose of the HEDIS ESP is to contact members identified by the CMO who have a care gap (i.e., a missed opportunity for a service according to the standards of care). An example of a care gap would be a member with diabetes who missed his or her semi-annual hemoglobin A1c (HbA1c) test. WellCare nurses contact these members and provide education regarding the care gap and disease process. In addition, WellCare recognized the need for additional specialists within its network. WellCare’s Network Development team transitioned to year-round recruiting using various sources for leads to recruit additional specialists. WellCare also worked with a vendor to pull provider directories from other payers to identify additional specialists with which to contract. WellCare is hopeful that these interventions, along with ongoing interventions, will have a significant impact on member satisfaction.
It was noted in the PIP documentation that WellCare listed a number of barriers on the fishbone diagram that were related to member satisfaction regarding interaction with the PCP; however, there appeared to be no interventions specific to member-provider interaction. This is an area that WellCare should address moving forward.
Provider Satisfaction
Rates for two of the three Provider Satisfaction PIP’s study indicators decreased from the third to the fourth remeasurement. For the first study indicator, the decrease was statistically significant. Study Indicators 2 and 3 have achieved statistically significant improvement above the baseline rate. However, a subsequent measurement period will be required for all three study indicators to be assessed for sustained improvement because Study Indicator 1 has not yet achieved statistically significant improvement above the baseline rate.
For the Provider Satisfaction PIP, WellCare continued almost all of its interventions that have been in place since 2007. However, based on its causal/barrier analysis results, the CMO implemented the following interventions:

FINDINGS
WellCare of Georgia, Inc. SFY 2013 PIP Validation Report WellCare_GASFY2013_CMO_PIP-Val_Report_F1_1212 State of Georgia Health Services Advisory Group, Inc.
Page 2-14
Initiated fax blasts to providers following each Pharmacy and Therapeutics meeting to promptly advise of any approved changes to the Preferred Drug List (PDL).
Implemented an internal process to expedite authorizations. Performed a Web site analysis with emphasis placed on online claims. The Network Development Team transitioned to year-round recruiting using various sources
for leads. The CMO also worked with a vendor to pull provider directories from other payers to identify additional specialists with which to contract.
Although two of the three indicators have demonstrated improvement, the rates for provider satisfaction remain an opportunity for improvement. WellCare should follow up on the provider recommendations that accompanied the 2011 provider satisfaction survey responses. The CMO broke the provider recommendations down into five categories: pharmacy, specialists, reimbursement, authorization/referrals, and public relations (PR) staff. While HSAG found evidence that summarized survey findings were presented during a Quality Improvement Committee meeting held on December 13, 2011, HSAG did not find evidence that WellCare developed interventions specifically to address the five categories of provider recommendations identified above. HSAG also noted that the fishbone diagram submitted with this PIP submission included only one barrier that was different from the previous two years’ submissions. For this recent submission, WellCare added “Perceived lack of change to WellCare formulary” to the fishbone diagram. Additionally, HSAG did not find any evidence that new interventions were implemented after November 2011. WellCare should address the five categories of provider recommendations per the CMO’s original statement of intent in Activity VIII of the PIP.

WellCare of Georgia, Inc. SFY 2013 PIP Validation Report WellCare_GASFY2013_CMO_PIP-Val_Report_F1_1212 State of Georgia Health Services Advisory Group, Inc.
Page 3-1
3. STRENGTHS for WellCare of Georgia, Inc.
Individual PIP Strengths
The Annual Dental Visits PIP demonstrated statistically significant improvement and sustained the improvement over baseline for both study indicators. WellCare completed a Cause and Effect diagram and implemented the following interventions that appeared to have a positive impact on both study indicators:
Sent reminder postcards and information regarding recommended dental care provided to members through the member handbook.
Created and distributed missed dental appointment letters to members who had not had a dental service in the prior six months.
Collaborated with DentaQuest to create an article for the member newsletter. Distributed handbooks with the recommended schedule for dental visits and placed an article in
the provider newsletter with information about when to conduct an oral health risk assessment and when to complete a referral per the American Academy of Pediatric Dentistry (AAPD) periodicity schedule.
WellCare was able to improve the rate for its Emergency Room Utilization PIP. The statistically significant improvement was achieved at Remeasurement 1, and the CMO was able to sustain this improvement at Remeasurement 2. WellCare was able to reduce the ER utilization rate by 2.4 visits per 1000 member months for its last remeasurement period. The CMO implemented its ER Outreach Initiative. This program provides education to specific members ages 5–12 and 18–34 with specific diagnoses that could have been treated in an alternate setting such as an urgent care or physician’s office. The goal of this intervention was to change behavior regarding emergency room use; thus members were contacted within 24 to 48 hours of the ER visit and provided education on the availability of primary care physicians for non-emergent care.
For the Lead Screening in Children PIP, the study indicator achieved statistically significant improvement from baseline to Remeasurement 3. The CMO implemented interventions such as contracting with MedTox to simplify the process in obtaining blood lead testing and results. WellCare is continuing its member telephone outreach and educational mailings regarding blood lead screening, as well as ongoing provider outreach and education through mailings and the portal. WellCare also implemented a provider pay-for-performance program to incentivize its providers for members who receive the required blood lead testing.
Global PIP Strengths
WellCare demonstrated a thorough application of the PIP Design stage (Activities I through VI). The sound study design creates the foundation for the CMO to progress to subsequent PIP stages—implementing improvement strategies and achieving real and sustained study indicator outcomes. WellCare appeared to appropriately select and conduct the sampling and data

STRENGTHS
WellCare of Georgia, Inc. SFY 2013 PIP Validation Report WellCare_GASFY2013_CMO_PIP-Val_Report_F1_1212 State of Georgia Health Services Advisory Group, Inc.
Page 3-2
collection activities of the Implementation stage. These activities ensured that the CMO properly defined and collected the necessary data to produce accurate study indicator rates. For many of its PIPs, WellCare implemented appropriate interventions that aligned with the identified barriers.
WellCare of Georgia, Inc. SFY 2013 PIP Validation Report WellCare_GASFY2013_CMO_PIP-Val_Report_F1_1212 State of Georgia Health Services Advisory Group, Inc.
Page 4-1
4. OPPORTUNITIES FOR IMPROVEMENT for WellCare of Georgia, Inc.
Individual PIP Opportunities for Improvement
WellCare has an opportunity to improve reporting and documentation of accurate data and statistical testing components for its Annual Dental Visits, Childhood Obesity, Member Satisfaction, Provider Satisfaction, and Well-Child Visits PIPs, as these PIPs did not receive a Met validation status. The CMO should ensure that the data, including numerators, denominators, rates, and statistical testing values are accurate and align with what has been reported in its Interactive Data Submission System (IDSS).
WellCare will also need to concentrate its efforts on the PIPs that received a Partially Met or Not Met validation status due to the lack of statistically significant improvement—Childhood Obesity, Well-Child Visits, Member Satisfaction, and Provider Satisfaction. The CMO should build upon its strengths and lessons learned from those PIPs that have achieved real and sustained improvement.
WellCare should revisit its Cause and Effect diagrams for all PIPs to ensure that barriers listed are still relevant and accurate, and still need to be addressed with improvement strategies.
Global PIP Opportunities for Improvement
The CMO should ensure that data reported in all PIPs are accurate and align with what has been reported in its IDSS.
WellCare should conduct an annual causal/barrier and drill-down analysis in addition to periodic analyses of its most recent data. The CMO should include the updated causal/barrier analysis outcomes in its PIPs.
The CMO should be cognizant of the timing of interventions. Interventions implemented in the last few months of the year will not have been in place long enough to have an impact on the results.
For any intervention implemented, WellCare should have a process in place to evaluate the efficacy of the intervention to determine if it is having the desired effect. This evaluation process should be detailed in the PIP documentation. If the interventions are not having the desired effect, the CMO should discuss how it will be addressing these deficiencies and what changes will be made to its improvement strategies.
The plan should ensure that the intervention implemented for a specific barrier is truly relevant to that barrier. For example, member-focused interventions will not impact a study indicator measuring the quality of service provided by a PCP.
For member and provider satisfaction study indicators that have not been assessed for sustained improvement, WellCare should consider hosting focus group discussions (i.e., one focused on

OPPORTUNITIES FOR IMPROVEMENT
WellCare of Georgia, Inc. SFY 2013 PIP Validation Report WellCare_GASFY2013_CMO_PIP-Val_Report_F1_1212 State of Georgia Health Services Advisory Group, Inc.
Page 4-2
provider satisfaction and one focused on member satisfaction). These focus groups would enable the CMO to interact with potential satisfaction survey participants and gain valuable input on the specific areas that cause dissatisfaction with services provided. Once areas of dissatisfaction are identified, the CMO and respective providers should implement system changes to combat those areas.

WellCare of Georgia, Inc. SFY 2013 PIP Validation Report WellCare_GASFY2013_CMO_PIP-Val_Report_F1_1212 State of Georgia Health Services Advisory Group, Inc.
Page A-1
. APPENDIX A PIP-SPECIFIC VALIDATION SCORES
for WellCare of Georgia, Inc.
Table A-1—WellCare of Georgia, Inc.’s SFY 2013 PIP Performance
Study Stage Activity
Percentage of Applicable Evaluation Elements Scored Met
Adults’ Access to
Care Annual
Dental Visits Childhood
Immunizations Childhood
Obesity ER
Utilization Lead
Screening in Children
Member Satisfaction
Provider Satisfaction
Well-Child Visits
Design
I. Appropriate Study Topic 100% 100% 100% 83% 100% 100% 100% 100% 100% II. Clearly Defined,
Answerable Study Question(s)
100% 100% 100% 100% 100% 100% 100% 100% 100%
III. Clearly Defined Study Indicator(s) 100% 100% 100% 100% 100% 100% 100% 100% 100%
IV. Correctly Identified Study Population 100% 33% 100% 100% 100% 100% 100% 100% 100%
Design Total 100% 88% 100% 94% 100% 100% 100% 100% 100%
Implementation
V. Valid Sampling Techniques (if sampling was used)
Not Applicable
Not Applicable 100% 100% Not
Applicable 100% 100% 100% 100%
VI. Accurate/Complete Data Collection 100% 100% 100% 100% 100% 100% 100% 100% 100%
VII. Appropriate Improvement Strategies 100% 100% 100% 75% 100% 100% 50% 67% 75%
Implementation Total 100% 100% 100% 95% 100% 100% 89% 94% 95%
Outcomes
VIII. Sufficient Data Analysis and Interpretation 100% 75% 100% 67% 100% 100% 78% 89% 100%
IX. Real Improvement Achieved 100% 100% 100% 50% 100% 100% 25% 75% 50%
X. Sustained Improvement Achieved 100% 100% Not Assessed Not
Assessed 100% 100% Not
Assessed Not
Assessed Not
Assessed Outcomes Total 100% 85% 100% 62% 100% 100% 62% 69% 85%
Validation Status Met Not Met Met Partially Met Met Met Partially Met Partially
Met Not Met