state of governance - a framework for · pdf filestate of governance - a framework for...
TRANSCRIPT


State of Governance - A Framework for Assessment
2
Contents
Chapter Title Page
Preface
1 Introduction 5
2. Governance ‐ Concepts and Approaches 7
3. Framework for assessing State of Governance 16
4. Indicator Framework 28
5. Conclusion 88
Annexure– Assessing Governance – International Discourse and Practice 89
Acknowledgments 98
Bibliography / References 100

State of Governance - A Framework for Assessment
3
State of Governance - A Framework for Assessment
4
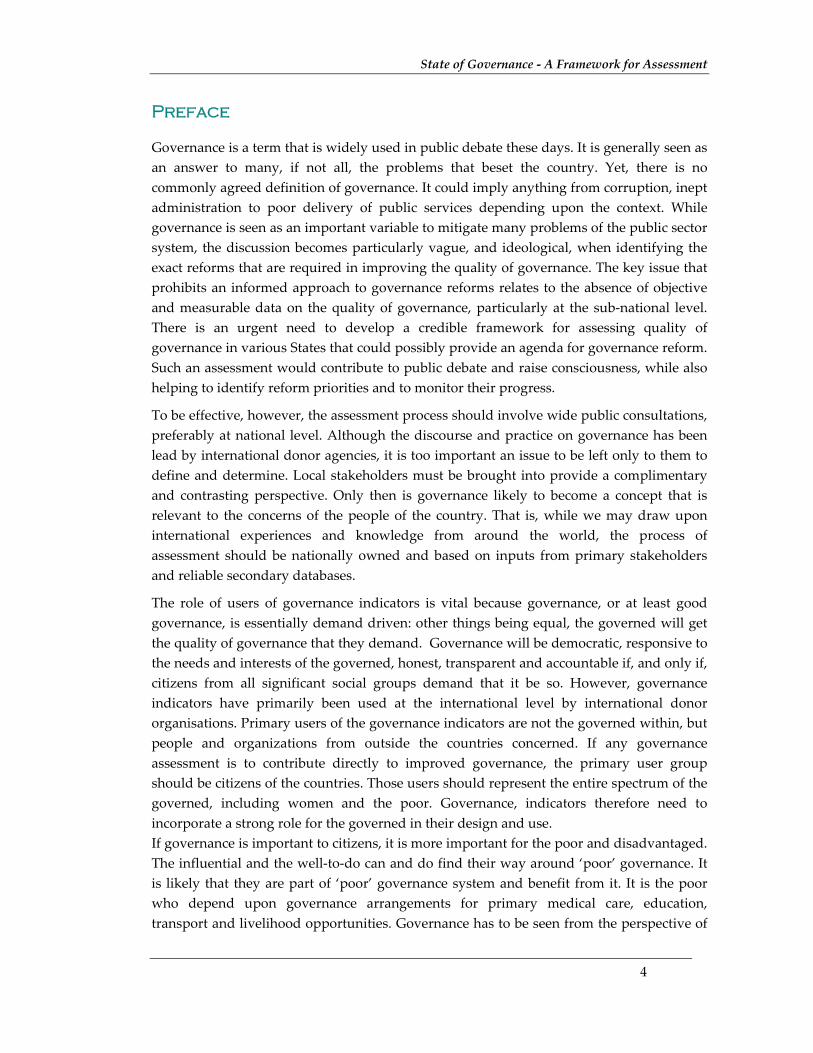
Preface
Governance is a term that is widely used in public debate these days. It is generally seen as
an answer to many, if not all, the problems that beset the country. Yet, there is no
commonly agreed definition of governance. It could imply anything from corruption, inept
administration to poor delivery of public services depending upon the context. While
governance is seen as an important variable to mitigate many problems of the public sector
system, the discussion becomes particularly vague, and ideological, when identifying the
exact reforms that are required in improving the quality of governance. The key issue that
prohibits an informed approach to governance reforms relates to the absence of objective
and measurable data on the quality of governance, particularly at the sub‐national level.
There is an urgent need to develop a credible framework for assessing quality of
governance in various States that could possibly provide an agenda for governance reform.
Such an assessment would contribute to public debate and raise consciousness, while also
helping to identify reform priorities and to monitor their progress.
To be effective, however, the assessment process should involve wide public consultations,
preferably at national level. Although the discourse and practice on governance has been
lead by international donor agencies, it is too important an issue to be left only to them to
define and determine. Local stakeholders must be brought into provide a complimentary
and contrasting perspective. Only then is governance likely to become a concept that is
relevant to the concerns of the people of the country. That is, while we may draw upon
international experiences and knowledge from around the world, the process of
assessment should be nationally owned and based on inputs from primary stakeholders
and reliable secondary databases.
The role of users of governance indicators is vital because governance, or at least good
governance, is essentially demand driven: other things being equal, the governed will get
the quality of governance that they demand. Governance will be democratic, responsive to
the needs and interests of the governed, honest, transparent and accountable if, and only if,
citizens from all significant social groups demand that it be so. However, governance
indicators have primarily been used at the international level by international donor
organisations. Primary users of the governance indicators are not the governed within, but
people and organizations from outside the countries concerned. If any governance
assessment is to contribute directly to improved governance, the primary user group
should be citizens of the countries. Those users should represent the entire spectrum of the
governed, including women and the poor. Governance, indicators therefore need to
incorporate a strong role for the governed in their design and use.
If governance is important to citizens, it is more important for the poor and disadvantaged.
The influential and the well‐to‐do can and do find their way around ‘poor’ governance. It
is likely that they are part of ‘poor’ governance system and benefit from it. It is the poor
who depend upon governance arrangements for primary medical care, education,
transport and livelihood opportunities. Governance has to be seen from the perspective of

State of Governance - A Framework for Assessment
5
the poor and weak, women and children and minorities. This will require changes in both
the nature of governance indicators, and in the capabilities of users. The objectives of good
governance can only be achieved if governance indicators are pro‐poor and gender‐
sensitive, as well as user‐friendly and designed to meet the needs and match the
capabilities of a diverse range of users among the governed.
The framework for assessing the state of governance presented in this volume is an
attempt at developing a home‐grown model that would find acceptance among the State
Governments as Human Development Report has in the recent past. Based on international
discourse and practice on governance measurement and in consultations with leading
experts from different fields, a comprehensive framework for assessing governance at the
State level has been suggested. The framework contains detailed set of governance
indicators that are based on primary as well as secondary data collection. This volume is
accompanied by a detailed State of Governance ‐ Toolkit intended to guide the process of
governance assessment at the State level. It is a kind of how‐to‐do manual which contains
detailed steps for data collection including the instruments for survey.
It is recognized that this is but the first step in the journey and the framework once
implemented would be subject to serious scrutiny and debate and over a period of time
become more robust and rooted. It is hoped that the framework, if applied and used in the
right letter and spirit, would eventually result in improved quality of governance.

State of Governance - A Framework for Assessment
6
Chapter 1 - Introduction
1.1 Background
The idea that quality of governance contributes to improved human well‐being and
sustained development has gained widespread recognition in the past decade and a half.
Whether or not there is a direct correlation between good governance and improved
human well being, experience shows that chronic poverty is generally associated with poor
governance. As a matter of fact, the concern for quality of governance arose in the 1990s in
the wake of persistent poverty which was seen to be a result of inefficient and poor use of
public funds, endemic corruption and poor service delivery in many third world countries.
The concept of governance received greater attention as multilateral agencies such as the
UNDP and the World Bank discovered that successful development required reforms in
political and administrative regimes. While the way governance is defined by different
institutions and countries differ, they all underline the critical importance of the quality of
institutions and public management in service delivery.
There are three key realizations implicit in the governance approach. Firstly, it signals a
conscious shift from technocratic and apolitical development paradigm to one which is
dynamic and inherently political. Secondly, it recognizes that good governance is more
than good government. It involves the articulation between the state (at all levels) and
other stakeholders within the broader society. Thirdly, governance goes beyond the
ʹmanagement’ doctrine by attempting to address institutional issues.
In India, the quality of governance is reflected in its many remarkable successes as in the
significant failures that it has had to contend with. The ability to forge unity despite its
diversity and build a functioning, vibrant and pluralistic democracy is, perhaps, the single
most important achievement of democratic governance in India. The functioning of
democratic institutions, a vibrant market economy, an active civil society and a fearless
and independent media are other notable achievements. Simultaneously, India continues
to make rapid strides in its fight against poverty; and access to basic services such as
healthcare, primary education and food security is today almost universal.
At the same time, there have been many shortcomings. Development outcomes have been
less than optimal and poverty eradication continues to be a core development issue with
nearly a quarter of the Indian population living below the poverty line. Employment
growth, particularly in the private organized sector, has been limited. Major fiscal
imbalances, regional disparities in development and poor law and order are very
important issues in many States. Delivery of public services remains inefficient and
vulnerable sections of society including women, children, schedule castes, schedule tribes
and minorities remain marginalized in many parts of the country. These aspects are all
manifestations of poor governance in political, economic or public administration domains.

State of Governance - A Framework for Assessment
7
The 10th Plan document has identified some manifestations attributable to poor
governance, which are:
Poor management of economy, persisting fiscal imbalances and regional disparities;
Denial of basic needs to a substantial proportion of the population;
Threat to life and personal security;
Marginalisation and exclusion of people on account of social, religious, caste or even
gender affiliation;
Lack of sensitivity, transparency and accountability in many facets of the working of
State machinery;
Delayed justice;
Existence of a significant number of voiceless poor with little opportunity for
participating in governance; and
Deterioration of physical environment, particularly in urban areas.
The subsequent sections of the report outline in detail the approach for undertaking
the project. Chapter 2 provides an overview of the governance concept and
approaches used for measuring it. Chapter 3 details the suggested framework for
assessing the quality of governance at the State level. Chapter 4 provides the detailed
list of governance indicators. Finally, conclusion and the way forward are given in
the end. The international discourse and practice is given in the annexe.
Acknowledgements
Centre for Good Governance, Hyderabad was involved in developing the strategic
approach and the indicator framework. The team from CGG along with AC Nielson ORG‐
MARG conducted the survey and statistical analysis. Our gratitude and special thanks are
due to everyone involved for their valuable inputs.

State of Governance - A Framework for Assessment
8
Chapter 2 – Governance: Concepts and Approaches
2.1 The Rise of `Governance’
Four sets of phenomena have combined to drive the explosive growth of interest in the
quality of governance – and with it the use of governance indicators – in recent years
(Christiane Arndt and Charles Oman, 2006).
a. The end of cold war brought about a change in attitude of developed countries and
multilateral aid agencies towards developing country governments which till then was
coloured by the latter’s position in bi‐polar world. The World Bank had also radically
reversed its policy in 1996 by placing the acute problem of corruption in many of the
borrowing countries at the centre of its lending policy. The notion of good governance
as a necessary condition or at the very least, as providing an enabling environment for
sustainable development and poverty reduction has gained widespread currency.
b. There has been a spectacular growth in international investment in developing
countries in the last 15 years. The quality of governance in these countries assumed
importance in proportion to the increase in assets exposed to risk. Competition among
these countries to attract foreign investment prompted a shift in policy orientation
towards improving governance.
c. The relative failure or inadequacy of policy reforms widely undertaken in 1980s and
1990s contributed to growing understanding and recognition that good governance
was needed for the success of the market reforms.
d. The New Institutional Economics spearheaded by Douglas North has demonstrated the
importance of a country’s system of governance – its formal and informal institutions
(the latter including its culture and unwritten values) and their interactions with the
behaviour of economic and political entrepreneurs and organizations – for the
country’s success in terms of long term economic growth, enhancement of human
welfare and societal development. Quality of governance was increasingly seen as the
outcome of the effectiveness of a society’s institutions. (Azmat Gani and Ron Duncan)
The increasing interest in governance shown by international investors, aid donors and
development analysts eventually led to efforts aimed at operationalisation and measuring
governance through quantitative indicators. By one estimate, there are now some 140 user‐
accessible sets of governance indicators comprising literally thousands of individual
indicators. Their proliferation has in turn led to production of several governance‐indicator
‘guides’ and ‘inventories’ that provide valuable ‘how to use;’ and ‘where to find’
information on many of these indicators. UNDP’s Governance Indicators: A Users Guide is
one such guide to help non‐specialist user on where to find and how to use sources of
governance indicators.

State of Governance - A Framework for Assessment
9
2.2 What is Governance?
Although governance has been defined variously by different people depending upon the
context and perspective, there is agreement over the broad elements of governance. While
Webster’s Dictionary defines governance simply as ʹthe act of governing or exercising
authorityʹ, other definitions are more elaborate. Some of the definitions are given below:
Governance relates to the management of all such processes that, in any society, define
the environment which permits and enables individuals to raise their capability levels, on
one hand, and provide opportunities to realise their potential and enlarge the set of available
choices, on the other.
Tenth Five Year Plan
Human Governance is governance dedicated to securing human development. It
must enable the State, civil society and the private sector to help build capacities,
which will meet the basic needs of all people, particularly women, children and the
poor. It requires effective participation of people in state, civil society and private sector
activities that are conducive to human development.
HDR
Based on the recent analytical research, we define Governance as the process and
institutions by which authority in a country is exercised. Specifically, governance is:
(i) the process by which governments are selected, held accountable, monitored, and
replaced; (ii) the capacity of governments to manage resources efficiently, and to
formulate, implement, and enforce sound policies and regulations; and (iii) the respect for
the institutions that govern economic and social interactions among them.
Kaufmann, Recanatini and Biletsky, World Bank
Governance is a system of values, policies and institutions by which a society manages its
economic, political and social affairs through interactions within and among the state, civil
society and private sector. It is the way society organizes itself to make and implement
decisions ‐ achieving mutual understanding, agreement and action. It comprises the
mechanisms and processes for citizens and groups to articulate their interests, mediate
their differences and exercise their legal rights and obligations. It is the rules, institutions
and practices that set the limits and provide incentives for individuals, organizations
and firms.
UNDP
Governance concerns the stateʹs ability to serve the citizens. It refers to rules, processes,
resources and behaviors by which interests are articulated, resources are managed, and
power is exercised in society. The way public functions are carried out, public
resources are managed and public regulatory powers are exercised is the major
issue to be addressed in this context.
European Commission
Communication on Governance and Development

State of Governance - A Framework for Assessment
10
Governance is the manner in which power is exercised in the management of a country’s
social and economic resources for development. Governance means the way those with
power use that power.
ADB
Governance refers to the handling of rules or norms that guide each stage or arena
in the political process. As such, governance is connected to rules‐in‐use i.e. formal
or informal rules that apply to how issues emerge in the public and are handled by
the political system. More specifically, governance is defined as the formation and
stewardship of the rules that regulate the public realm – the space where the state as
well as economic and social actors interact to make decisions.
World Governance Survey
United Nations University
Governance refers to the process whereby elements in society wield power and
authority, and influence and enact policies and decisions concerning public life, and
economic and social development.
The Governance Working Group
of the International Institute of Administrative Sciences 1996
Governance is the process whereby societies or organizations make important decisions,
determine whom they involve and how they render account.
Institute on Governance
…the view in the present report is of governance as the process by which the
institutions charged with achieving development do their jobs. This includes non‐
governmental organizations, civil society organizations, and private firms as well
as the public sector or state.
The State of Governance in Bangladesh 2006
Centre for Governance Studies , BRAC University and
BRAC Research and Evaluation Division
At one level, it (governance) concerns political and electoral reform. At another level,
it concerns interface between administration and citizens. At a narrower level, it means
the law and order and justice system. Governance is distinct from government, and is
the process through which various stakeholders articulate their interests, exercise their
rights, and mediate their differences.
From Agenda for Good Governance ed. Bibek Debroy

State of Governance - A Framework for Assessment
11
It may be seen from the above definitions of governance that there are some elements
that are common across all / most definitions and these can be broadly organized under
the following two categories:
a. Exercise of power and authority
process and institutions by which authority in a country is exercised, how
governments are selected, held accountable, monitored, and replaced;
a system of values, policies and institutions by which a society manages its
economic, political and social affairs through interactions within and among the state,
civil society and private sector
the space where the state as well as economic and social actors interact to make
decisions.
the process whereby elements in society wield power and authority, and influence
and enact policies and decisions concerning public life, and economic and social
development
b. Government’s ability and capacity to effectively fulfil its mandate
the stateʹs ability to serve the citizens
capacity of governments to manage resources efficiently and to formulate, implement,
and enforce sound policies and regulations;
government / stateʹs ability to serve the citizens by providing speedy justice, education,
health care and sanitation, social and physical infrastructure, law and order, and so on.
The first set deals with how power and authority are exercised by different sections within
the society. This dimension is inclusive in the sense that it is about governance in society at
large; it is the space various stakeholders viz. the state, citizens, civil society and the
private sector give each other in managing their affairs and interests. In this sense, all of
them not only have a stake in governance but they are also responsible for the state of
governance because governance is as much about enforcement and regulation as voluntary
compliance with law. This definition emphasizes on processes, rules and institutions that
guide different groups in the society in articulating and mediating their interests. When
one of the players exerts more authority at the expense of the others, it adversely affects the
governance. The cases of the executive exercising authoritarian power and consequential
effects on the governance are too well known to need elaboration. Similarly, the private
enterprises wielding undue influence over the government policies could be equally
damaging to the larger public interest.
The second aspect of governance emphasizes the government’s ability to deliver services
within its purview. It is about the capacity of the State and its various organs and

State of Governance - A Framework for Assessment
12
instrumentalities in managing financial, human and natural resources in order that they
provide effective services to the citizens.
Thus there are two basic aspects of governance that are clearly understood and
acknowledged by different definitions and models and this must be duly recognized while
developing the indicator framework. The efforts could, therefore, be directed towards
better understanding of institutional linkages between different actors on the one hand and
enhancing policy implementation on the other. Most governance models, particularly those
promoted by donor agencies, do not address the second issue adequately. The governance
framework proposed in this report seeks to redress this imbalance by according more
emphasis on the state’s ability to serve the citizens, particularly those who are
economically and socially disadvantaged.
2.3 Governance and Development
There is a general agreement that the quality of governance matters for development
outcomes. While few deny the significance of governance variable, it is not clear as to how
and when governance makes a difference to the country’s development.
What is the relationship between quality of governance and growth? According to
Kaufmann and Kraay, while better governance tends clearly to promote economic growth,
growth per se does not tend to promote better governance (Christine Arndt and Charles
Oman, 2006). There are some who argue that strong long term growth could be result of
powerful vested interest groups building up at the expense of governance. As a matter of
fact, countries with poor governance (rule of law, participation, etc.) such as China and
dictatorships of south‐east Asia had achieved spectacular economic growth in 1970s and
1980s. Based on the experiences such as above, some have argued that democratic
governance often inhibits growth as it diverts resources from investment to consumption.
There are others who cite examples of India and the US, both well‐functioning
democracies, to point out that democracy is more conducive to long term growth.
The connection between governance and poverty reduction is, however, somewhat
tenuous. On the one hand, there is empirical evidence to suggest that weak governance
reinforces poverty. On the other hand, the link between governance and poverty reduction
is accorded a priori status i.e. it is simply assumed to be true. In the absence of conclusive
studies, we might have to assume that the link exists sometimes and at times it does not. It
may turn out to be the case that good governance is sometimes correlated with, but is not
necessary condition for, poverty reduction. (Suchitra Punyaratabandhu, 2004)
It appears that positive developmental outcomes depend upon many factors one of which
is good governance, which also may not always be directly correlated. At the same time,
one must recognize that some aspects of governance impact development more than
others. For example, poor capacity of the government (in terms of number and competency
of personnel) can considerably slow down development as has been seen in some States.

State of Governance - A Framework for Assessment
13
Similarly, corruption is known to have enormous adverse impact on development. Besides
hampering growth, corruption has also been shown to increase income inequality and
poverty because it results in poor targeting of social programmes, unequal access to
education, reduced social spending, and higher investment risks for the poor. In a recent
study, Kaufmann et al (1999) show that corruption is associated with an increase in infant
mortality and a reduction in life expectancy and literacy. Similarly, the UNDP’s Human
Poverty Index (HPI) is negatively related to indices of governance and corruption, even
after controlling for GDP per capita. Li et al examine the effects of corruption on income
inequality, as measured by the Gini coefficient. An increase of one standard‐deviation in
corruption raises the Gini by roughly five points.
The problem seems to be that there are very few studies which have actually attempted to
explore the various channels through which governance impacts development outcomes.
While subjective indices demonstrate a causal link with development outcomes, the
knowledge of underlying mechanisms remains weak. For instance, indicators such as rule
of law, corruption, and political instability are correlated with health, nutritional and
educational outcomes but there is little insight on how such outcomes are generated. It is
very likely that such correlation between governance indicators and development
outcomes operates through higher per capita incomes. It appears that our current
knowledge has not gone much farther than simple associations and correlation. All we
know is that countries with better governance also happen to be those with better social
indicators. (Adeel Malik)
2.4 Governance and Democracy
There are several variables to measure socio‐political instability viz. political
assassinations, riots, revolutions, coups, demonstrations, etc. The studies using these
variables show that socio‐political instability is harmful for growth and investment. They
point out that democracy promotes long‐term economic growth and delivers better
distributional outcomes. Although the evidence suggests that democracy influences
growth through a variety of indirect channels, whether democracy promotes or hinders
economic growth seem to depend partly on the level of income.
Democracy is associated with broad development gains. It is a human right and an
essential ingredient for achieving better human development outcomes. Development is
freedom, as Amartya Sen proclaims and participatory political systems are an excellent
means to enlarging human choices. This is more or less a part of conventional development
wisdom now. Yet, we are still far away from producing enough supportive evidence to this
effect. Some are available, yet lot more evidence needs to be discovered, with clearly
defined linkages. Evidence from the 1,500 World Bank‐financed projects suggests that civil
liberties an important component of the democracy variable and citizen participation were
found as important factors for project success (Adeel Malik). Successful democratization


State of Governance - A Framework for Assessment
15
provide for just and humane conditions of work;
provide for free and compulsory education for children;
promote the educational and economic interests of the weaker sections;
improve public health; and
protect the environment.
The fundamental rights enshrined in the Constitution have a direct bearing on the roles
and responsibilities of the State. These include:
Right to Life – Article 21 (wide interpretation)
Principle of Equality (Articles 14, 15 and 16)
Gender equality (Air India v. Nargesh Meerza 1981)
Right against State Arbitrariness (Articles 14 and 22)
Right against Exploitation (Articles 17, 23 and 24; Visakha v State of Rajasthan,
1997)
Fundamental Freedom (Article 19)
Right to Education (Article 21A)
Right to corruption‐free governance (implied right guaranteed under Articles 14
and 21 )
Last but not the least, the 73rd and 74th Amendments to the Constitution mandate the
institutionalization of a third tier of government (both rural and urban) and specify the
modalities for decentralised governance.
Keeping with the trends the world over, there has been a renewed emphasis on improving
the quality of governance in the country. For the first time, the Government of India
outlined a governance approach to development in the National Human Development
Report 2001. Governance, in this approach, is viewed as involving a continuous interplay
of three elements, each representing a specific set of deliberate arrangements that include:
Institutions – adopted or created arrangements, both formal and informal, to bring
about predictability, stability and efficiency in managing the social, economic or
political transactions in any society;
The Delivery Mechanism – including the executive apparatus adopted or evolved
by the institutions for implementing the agenda and the objectives for which the
said institutions have been created; and
The Supportive and Subordinate Framework of Legislations, Rules, and Procedures
‐ formulated for delivering and meeting the stated responsibilities of the concerned
institutions.
The approach also acknowledges the role of civil society and the market in governance as
being critical for sustaining human development. While the State is responsible for creating
conducive political, legal and economic environment for building individual capabilities
and encouraging private initiative, the market is expected to create economic opportunities

State of Governance - A Framework for Assessment
16
for people and the civil society is expected to facilitate the mobilisation of public opinion
and peoples’ participation in economic, social and political activities.
A Model Code of Governance drafted by a Committee of Chief Secretaries provides the
principles of good governance and seeks to set benchmarks for the States to evaluate their
own status on various specific points such as:
Improving service delivery;
Developing programs for weaker sections and backward areas;
Technology and system improvement;
Financial management and budget sanctity;
Accountability and transparency;
Public service morale & anti‐corruption measures; and
Incentivising reforms.
The Government has also examined major proposals and recommendations on various
aspects of administrative reforms of four earlier Committees viz. Alagh Committee on
Recruitment and Selection Procedures (2001), Yugandhar Committee on In‐Service
Training (2003), Surinder Nath Committee on Performance Appraisal, Promotion,
Empanelment, and Placement for the All India Services (2003) and Hota Committee on
Civil Service Reforms (2004).
Simultaneously, the Government of India has undertaken a host of governance reform
initiatives cutting across different Ministries and Departments which include:
Simplification of procedures and processes;
e‐Governance and use of ICT tools;
Business climate related reforms;
Reforms in Police Administration;
Judicial Reforms aimed at streamlining court processes;
Initiatives for effective delivery of basic services and schemes; and
Anti‐corruption initiatives.
State of Governance - A Framework for Assessment
17
Chapter 3 - Framework for Assessing State of Governance
3.1 Fundamental Aspects underlying the Assessment Framework
While it is easy to understand governance at a conceptual level as either being the manner
in which the power is exercised and / or as the state’s ability to provide basic services, the
difficult part is to break it down into its elements that are measurable. Is governance a set
of values or principles? Or is it a sum of policies, processes and institutions? Or is it the
rules, laws, etc. that guide the society? Does it lie in the perception of the people or is it
some objectively verifiable phenomenon? Is a positive outcome necessarily an indication of
good governance? Is governance valued as an end in itself or is it a means to an end?
It is seen that the similarities in definitional aspects do not easily lend themselves to either
understanding what constitutes governance or its measurement. This is evident in the
different approaches adopted for deconstructing and measuring governance by various
agencies including multilateral organisations. The approaches adopted by various agencies
differ markedly from each other – while some are normative in nature, others are
positivistic. Further, measuring issues of governance poses challenges that are not
encountered in the economic and social development fields. Perhaps because it is a broad
and complicated concept, there exists no regular, systematic and cohesive data collection
effort centred on the concept of governance.1
Keeping the above in mind, it was necessary to evolve a framework that is firmly rooted in
the Indian context and subscribes to the basic tenets of the Indian Constitution.
Simultaneously, it would also draw upon the global discourse on governance and adapt
the lessons from it to suit the Indian context. The suggested framework attempts to draw
from the basic aspects of the governance discourse in the global arena as well as in India.
There are five fundamental aspects that underpin the suggested `governance assessment
framework’ and these pertain to the following:
1. Good Governance ‐ You can measure the former (good) if you understand the latter
(governance)
`Governance’ by itself is a neutral term while `Good Governance’ implies positive
attributes and values associated with the quality of governance. Most measurement
frameworks tend to measure how good the quality of governance is without actually
deconstructing governance into its various elements. Hence, most frameworks apply
generic principles in assessing quality of governance while the content of governance
remains largely unexamined.
1 Assessing Governance: Methodological Challenges ‐ World Governance Survey Discussion Paper 2 (August 2002) ‐
United Nations University

State of Governance - A Framework for Assessment
18
The fundamental limitation of such an approach is that it does not lead to actionable
diagnostics that can be identified and related to specific country institutions. For example,
how does `government effectiveness’ relate to the administrative, economic and social
spheres of governance? Or can observations on `regulatory quality’ be linked to legal,
economic and administrative institutions?
The suggested framework is different from the other approaches as it:
a. Deconstructs governance into its different elements and components
b. Applies generic governance principles to the various components
Hence, each principle (such as effectiveness, participation, accountability etc.) can therefore
be related to the functioning of the legislature, judiciary, bureaucracy or other institutions.
2. (Good/Ideal) Governance should be characterised by core principles
The quality of governance has been the focus of governments and multi‐lateral / donor
agencies across the world. This has led to many of them defining qualitative standards of
governance in the form of characteristics or principles that `governance’ ought to reflect for
it to be good or ideal. Some of the basic governance principles or attributes include the
following:
Accountability – both horizontal and vertical
Transparency
Equity
Performance (effectiveness and efficiency)
Participation / voice
Rule of Law
Strategic vision
Lack of arbitrariness
Ethics and integrity
Predictability
The suggested framework attempts to relate governance indicators to one or more of these
principles.
3. Governance involves many different stakeholders
The concept of governance has evolved to encompass many different stakeholders in its
fold. Typically, it has categorised stakeholders into three broad categories – State, Market
and Civil Society. While acknowledging this concept, it is also necessary to identify the
important stakeholders within each broad category.
i. The State includes the different organs of the government (Legislature, Judiciary
and Executive) and their instrumentalities, independent accountability mechanisms
etc. – and consists of different segments of actors (elected representatives, political
executive, bureaucracy/civil servants at different levels etc.)

State of Governance - A Framework for Assessment
19
ii. The Market includes the private sector – organised as well as unorganised – that
includes business firms ranging from large corporate houses to small scale
industries/ establishments.
iii. The Civil Society is the most diverse and typically includes all groups not included
in (a) or (b). It includes NGOs/CSOs, media organisations/ associations, trade
unions, religious groups, etc.
The suggested framework attempts to bring into its fold different stakeholders in the
governance process. At the same time, it also recognises that the State as the Constitutional
authority for exercising power on behalf of the citizens has a primary role to play in the
governance process. The framework also recognises that citizens ʹin their own rightʹ must
have a say in the governance process.
4. Governance is about processes rather than outcomes
Governance largely relates to the processes through which power is exercised – outcomes,
better or worse, are usually the result of how the processes are managed. In other words,
governance refers to the means through which either public policy is formulated and
implemented or through which different stakeholders articulate and mediate their
differences. However, in order to provide effective tools for policy formulation, and
programme monitoring and evaluation, as well as lobbying and advocacy, governance
indicators need to distinguish between inputs, processes, outputs, outcomes and impacts.
Process indicators refer to the quality of governance in terms of how the outcomes are
achieved. The challenge is how to measure governance processes cohesively and
systematically in terms of critical processes. (Julius Court, Goran Hyden and Ken Mease,
2002) The framework is, therefore, tuned towards capturing the initial parameters and
intermediate processes rather than development outcomes.
5. Governance measurement must be relevant to realities at sub‐national levels
The suggested framework is firmly rooted in the realities of governance across States
today. It recognises that while the macro concepts of the global discourse on governance
have intrinsic value, it is ultimately the inclusion of specific aspects of governance at the
sub‐national level in India that will lend strength and relevance (and perhaps ownership)
to the framework.
It is a fact that governance related reforms is not unknown to most States. The Government
of India has often sought to guide and assist the States to undertake key reforms. Similarly,
multi‐lateral and bilateral agencies working in different States have also promoted
governance reforms. Many States have initiated governance reform measures on their own.
The proposed framework seeks to not only enable assessment of the quality of governance
in a particular State, but it would also hopefully encourage States to initiate specific reform
measures that improve governance.

State of Governance - A Framework for Assessment
20
Social
Legal & Judicial
Political
Administrative
Economic
The nature of political contestation, conduct of political players & institutions, use & abuse of political authority
and citizen’s faith in the political system
Ability of the State to maintain law & order, safeguard human
rights, enable access & delivery of justice
Ability of the State to take care of the vulnerable sections of
the society; role & quality of the civil society & media &
environmental governance
Ability of the State to create a conducive
climate for business in all sectors and ensure
macro-economic stability
Ability of the State to manage its human,
financial and technological resources
and deliver basic services to public
3.2 Conceptual Construct of the Governance Framework
a. Governance has many facets. It is not a single event or an act. There are multiple players
and multitude of interactions among them which determine the quality of governance. In
order to assess governance, it has been first deconstructed into five broad dimensions.
b. Each dimension is further broken down into components which are basically a group of
interrelated aspects which together makeup the dimension.
c. Component is the basic unit of governance that is sought to be assessed or measured.
Accordingly, each component has related governance indicators that provide the measure.
Underlying every indicator is a key principle of governance.
3.3 Governance Dimensions
Governance has been broken down into five dimensions viz. political, legal and judicial,
administrative, economic and social & environmental dimensions, which are further
explained below.
Figure 3.1 – Governance Dimensions
3.4 Political Dimension of Governance and its key components
The political dimension is the most essential aspect of governance. Without this dimension,
other dimensions would be meaningless because it is the political process that brings in the

State of Governance - A Framework for Assessment
21
key governance values of participation, accountability and transparency. As the formal
political arrangements such as eligibility to vote, political parties, legislatures, etc. often
coexist with informal levers to control state power, it is important to go beyond these
arrangements; one way of doing this is to get a feel of the people’s trust in these processes
and institutions. This dimension accordingly looks at the quality of political contestation,
conduct of individuals and institutions representing the people, use and abuse of political
authority, decentralization of powers and citizen’s faith in the political system both from a
set of secondary data as also from the subjective perception of different sections of society.
This dimension has been broken down into four components:
a. Exercise of franchise: This is the doorway to democratic governance which establishes
legitimacy and accountability of the government by enabling participation by the
citizens. It provides opportunity to the people to voice their concerns and issues and
hold the rulers accountable. To be meaningful, this process should be widely
participative, transparent, fair and healthily competitive.
b. Profile and Conduct of Political Representatives, Political Parties and the Political
Executive: While the process of electoral democracy provides an enabling environment
to the practice of democratic governance, it is the quality (evident in terms of conduct,
attitudes and values) of the people’s representatives, which determines effectiveness of
accountability and participation in practice. As political representatives generally
belong to political parties, by extension the conduct of political parties in a competitive
democratic environment becomes an equally important aspect of the state of
governance. Another key aspect of political governance pertains to the quality of
functioning of the political executive that has the duty of steering the government. The
functioning of the Council of Ministers affects the nature of governance, both directly
and indirectly.
c. Functioning of Legislature: The role of the legislature is critical to the way governance
takes shape in any particular State. The time spent on discussing appropriation grants
and legislation is a clear indicator, for instance, of effectiveness of legislature.
d. Political Decentralisation: Last but not the least is the quality of decentralized
governance that has taken shape in the State. This not only reflects the willingness of
the State to comply with constitutional imperatives, but also is an important indicator
of empowerment at the grassroots level.
3.5 Legal & Judicial Dimension of Governance and its key components
The state is vested with coercive power to maintain law and order. It is one of its sovereign
functions. Yet, this power is limited by citizens’ rights and freedoms. Ideally, the State
should exercise its right to use force in an effective and judicious manner without
overriding the fundamental rights of the citizens. Another important responsibility of the
state is to ensure that everybody has access to speedy justice. Both of the above have a vital
implication for economic activity. When the general law and order is seen to be poor,

State of Governance - A Framework for Assessment
22
investors, businesses, etc. stay away from the State, thus affecting its ability to provide
employment opportunities to its people. Poor performance in ensuring security, protecting
rights and providing speedy justice would give raise to parallel power centres, which
undercut the government. This dimension seeks to measure whether the state’s exercise of
power is within its boundaries as also its ability to effectively maintain law and order,
safeguard human rights and enable access to & delivery of justice. This dimension has been
broken down into four basic components.
a. Law & Order and Internal Security: This pertains to the basic function of the state – its raison d’etre – to ensure that law and order prevails and citizens live in an environment
wherein their lives and property are generally safe and secure.
b. Safeguarding of basic rights: This aspect relates to the ability of the state to protect the basic rights of the citizen, particularly those of poor, women and weaker sections.
c. Police Administration and Citizen‐friendliness of the Police: The police force is an important instrumentality of the state. Its role is to protect the innocent and punish the
guilty. This is indeed the cutting edge of the governance as an inept or / and corrupt
police force would fail governance as nothing else does. Effective police functioning is
influenced by different internal factors. This component takes a closer look at those
factors that reflect the quality of police administration viz. size of police force, functions
assigned, training & skill development, efficiency in operations, etc.
d. Access to Justice and Judicial Accountability: Lastly, under this dimension, a
significant indicator of the quality of governance relates to the access to and delivery of
justice which is reflected in its capacity to provide timely justice, judicial efficiency,
judicial accountability and citizen perception.
3.6 Administrative Dimension of Governance and its key components
The citizens, particularly the poor and disadvantaged among them, depend on the
government for a host of services viz. primary healthcare, education, water and sanitation,
basic infrastructure, etc. The administrative dimension is a critical aspect of governance
because it determines the ability of government to deliver basic services to citizens by
efficiently managing the human and financial resources. The administrative dimension
also includes performance of the State on vigilance and anti‐corruption matters as well as
responsiveness and transparency in administration. This dimension has been broken down
into four components:
a. Citizen Interface and Engagement: This component indicates the citizen‐centricity of
government agencies in their day‐to‐day functioning viz. accessibility, responsiveness,
quality of grievance redressal /complaint handling, compliance with RTI Act
provisions, etc.
b. Managing Human, Financial and other resources: This aspect looks at how human
resources in government are managed with particular focus on the profile of the
staffing, recruitment process, transparency in transfers and postings, training and skill

State of Governance - A Framework for Assessment
23
building, motivation levels among employees, performance appraisal, etc. A key aspect
of governance is effective financial management. This aspect examines the quality of
financial management in terms of expenditure patterns, liabilities, outstanding loans
and compliance to basic financial accountability systems like audit etc. It also assesses
use of IT in governance.
c. Basic Service Delivery: The cutting edge of administrative governance is the timely
delivery and the quality of basic services such as primary healthcare services, primary
schooling, drinking water, sanitation facilities, public distribution system, electricity,
roads and transportation. For the majority of population, this reflects governance –
good or otherwise.
d. Corruption Perception, Vigilance & Enforcement: Lastly, this dimension also
examines corruption (in terms of citizen perception) and vigilance mechanisms and the
willingness of the State to punish the defaulters, particularly those at the higher
echelons of administration.
3.7 Economic Dimension of Governance and its key components
The economic dimension pertains to the ability of the state to ensure macro‐economic
stability and create conducive climate for economic activity to take place across different
sectors of the economy. Governance is also reflected in the state’s ability to provide
support to the primary sector (agriculture & allied activities). This dimension has been
broken down into three components:
a. Fiscal Governance: This aspect of economic governance relates to how the State has
managed its finances over the short to medium term. This is examined both in terms of
revenue mobilization indicators as well as indicators pertaining to expenditure
management.
b. Business Environment: This component pertains to those aspects of economic
governance which affect the way businesses operate within the State and includes
general investment climate, legal aspects, procedural issues, infrastructure and
manpower, regulatory systems, etc.
c. Support to the Primary Sector: As the primary sector is the backbone of the economy
with very high dependence on it among poorer sections of the population, the quality
of governance is also reflected in the State of the primary sector and how the State
provides various services to support this sector through extension, input supply and
marketing linkages.
3.8 Social Dimension of Governance and its key components
The social dimension pertains to the ability of the state to take care of the vulnerable
sections of the society. At the same time, given the importance of the civil society and
media in the governance process, this dimension also seeks to assess governance by

State of Governance - A Framework for Assessment
24
examining the role and quality of the civil society and media. Environmental management
as a separate component is also included due to its increasing importance in governance.
This dimension has been broken down into three basic components:
a. Welfare of the Poor and Vulnerable: The changing emphasis of governance (both in
expression and action) towards the welfare of the poor and the marginalized is well
recognized. The test of governance in that sense lies in the state of the poor and the
vulnerable segments such as the poor, women, children, minorities, etc.
b. Role of Civil Society and Media: It is not only important for the civil society to play a
watchdog role in governance, but also important for it to be a responsible actor. Hence
this facet of governance pertains to two basic aspects (a) the space and the role that civil
society gets to occupy in the governance process and (b) the quality and capacity of the
civil society organizations to take up the role that they are expected of them. The mass
media, both print and audio‐visual, wields a lot of influence in shaping public opinion.
More than civil society organizations, it is important for the media to be a responsible
actor in the governance process while enacting its traditional role as an instrument of
social change and empowerment. Like civil society, this part of governance also relates
to (a) the space and the role that the media occupies in the governance process and
(b) the quality and ability of the media to be the voice of the people and play the role of
an independent, unbiased agency.
c. Environmental Management: Lastly, this component seeks to examine governance
from the perspective of the state as the custodian of natural resources and its ability to
regulate and manage natural resources for sustainable development.

State of Governance - A Framework for Assessment
25
Table 3.1 ‐ Conceptual Construct of Framework – Dimensions and Components
Dimensions
Political Legal / Judicial Administrative Economic
Social/
Environmental
Components
1.Exercise of
Franchise
1. Law & Order
and Internal
Security
1.Citizen
Interface and
Engagement
1.Fiscal
Governance
1.Welfare of the Poor
& Vulnerable
sections
2.Profile &
Conduct of
Political
Representatives
Parties and
Political
Executive
2.Safeguarding of
Basic Rights
2. Managing
Human,
Financial and
other
Resources
2.Business
Environment
2.Role of Civil Society
and Media
3.Functioning of
the Legislature
3.Police
Administration
Citizen‐
friendliness of
the Police
3.Basic Service
Delivery
3.Support to the
Primary Sector
3.Environmental
Management
4.Political
Decentralisation
4.Access to Justice
& Judicial
Accountability
4.Corruption
Perception,
Vigilance &
Enforcement
3.9 Indicator Framework
A governance indicator is a measure that points out something about the state of
governance in a country. Governance indicators are usually narrowed down to measure
more specific areas of governance such as electoral systems, corruption, human rights,
public service delivery, civil society, and gender equality.
It is useful to remember that governance is essentially a qualitative phenomenon, the
quantification of which would always be subject to considerable empirical limitations.
Researches have so far attempted to use proxy indicators for measuring governance, a
concept that purports to capture several complex and multi‐faceted dimensions (Adeel
Malik).
There can be at least five different ways to judge the efficacy of governance indicators:
Relation with particular institutions: This concerns the manner in which indicators
implicate particular institutions. These indicators can help identify the institutional
channel through which government performance is affected.

State of Governance - A Framework for Assessment
26
Relation with outcomes: This refers to the degree of specificity with which indicators
relate to the outcomes of good governance (such as poverty reduction).
Replicability and transparency: This relates to the ease with which indicators can be
replicated and their methodology and implementation accessed.
Quality and accuracy of indicators: This corresponds to indicators that measure more
accurately the underlying concept and use high quality data.
Data coverage: this relates to coverage of the indicators over time and across
countries. (Source: Knack and Manning).
As explained in the earlier section, under each component indicators have been identified
that would provide a measure of governance. These indicators, while pertaining to some
aspect of governance, also underlie a basic principle of good governance.
3.10 Types of Indicators
The indicator framework consists of two types of indicators:
a. Qualitative indicators which provide a measure through peopleʹs opinions and
perceptions.
b. Quantitative indicators which are based on numerical or statistical facts that are
used to make sense of, monitor, or evaluate some phenomenon.
The data sources for the indicators are quite varied. They consist of the following:
Primary sources which include surveys among citizens, employees, business firms,
civil society and media.
Secondary sources such as official reports, government documents etc.
3.11 Factors determining choice of indicators
The primary factors that determined the choice of indicators under the different
governance components pertained to the following.
a. Impact, Outcome, Output, Process and Input variables: The framework seeks to
differentiate between the different types of variables. Governance is seen primarily as a
`process’ and `action’ rather than as an output or outcome. For example, governance in
(service delivery in) education or health relates to their accessibility to the poor, the
accountability of the teachers / doctors to the citizens/users and so on. Hence, the
choice of indicators primarily focuses on process variables and, to a limited extent, on
outputs.
b. Development versus Governance: Better quality of governance leads to better
development outcomes. However, better development outcomes cannot always be a
surrogate measure of good governance. This is because of two reasons –

State of Governance - A Framework for Assessment
27
(a) development outcomes are the result of a host of factors, one of which may pertain
to quality of governance and (b) development outcomes are usually long‐term results
and its linkages with governance may not be of immediate nature. For example, a
certain literacy rate or infant mortality rate is an outcome that is not only influenced by
factors outside the ambit of governance but it is also a result of accumulated actions of
the past; whereas, whether the teacher in the primary school is regularly available is an
indicator of quality of governance. Using development outcomes as surrogate
measures for quality of governance would, therefore, make it difficult to isolate the
governance factors that influence development and, in turn, affect the actionability of
the findings. However, in some cases, the framework has adopted development
outcomes as surrogate measures keeping in view their importance.
c. Result‐oriented Indicators: The choice of indicators is also influenced by how the findings
from each can lead to desirable action on behalf of particular stakeholders. In that
sense, the indicators are appropriately specific rather than being ambiguous or generic.
Each indicator is contextualized within a particular governance dimension &
component as well as relating to particular stakeholder(s).
d. Pertaining to Governance Principles: Each governance indicator characterizes one or more
basic governance principle mentioned earlier in the report (accountability,
transparency, equity etc.). However, as explained, instead of adopting generic
measures which other governance models often resort to (voice & accountability,
government effectiveness etc.), this framework locates the governance principles within
governance dimensions and components, thereby making it specific and actionable.
e. Judicious mix of subjective (primary data) and objective (secondary data) indicators: A survey
of governance assessments shows that the governance data is either based on some
objective source such as the records of some office or on subjective perceptions of some
persons. The perceptions could be gathered from a small number of country, sector and
regional experts to generate ratings (as done by Economist Intelligence Unit, Freedom
House, etc.) or public surveys of citizens and other stakeholders or survey involving
Well Informed Persons (as was done by UNU in World Governance Survey).
Ideally both objective and subjective indicators should complement each other. To bank
upon either one type of data would place severe constraints on examining all facets of
governance. For example, the number of police stations in the state may not reflect on
the law and order situation, which could be best captured by people’s perception. At
the same time, quality of public financial management can be aptly measured through
secondary sources rather than through people’s survey. A framework based entirely on
secondary data parameters without addressing the demand side factors affecting
governance would likely end up as a `numbers game’. On the other hand, an
assessment based entirely on subjective perceptions could have serious limitations
particularly on tackling supply side governance constraints. Thus, the indicator

State of Governance - A Framework for Assessment
28
framework recommends a combination of objective data from secondary sources and
subjective data from people’s survey.
At the same time, the framework does not suggest or advocate use of expert group
assessments for governance measurements (as used by the WGI) not only because they
have minimum statistical relevance, but they could also be highly biased. Subjective
perceptions of people have value when they are scientifically collated through robust
sampling methodologies.
3.12 Process of Indicator Framework Development
The indicator framework was developed through an elaborate process that included
secondary research, interactions with various stakeholders and field testing. The initial set
of indicators was developed in consultation with different stakeholders which included
subject experts, government officials, civil society representatives, etc. This set of indicators
was tested in two States. After subsequent modifications and changes based on the
findings from the two States, the revised indicator framework was again field tested in one
State. Based on the findings from the States and after discussions with various
stakeholders, the indicator framework was finalized. The final indicator framework is given in
Chapter 4.
Based on the findings from the field testing and based on feedback from various
stakeholders, the following action was taken on the indicator framework.
Table 3.2 ‐ Actions taken on the initial indicator framework
Governance dimension In the Initial Framework In the Final Framework
Components Indicators Components Indicators
Political 5 46 4 22
Legal/ Judicial 5 53 4 24
Administrative 5 88 4 42
Economic 3 39 3 18
Social & Environmental 4 45 3 17
Total 21 271 18 123
State of Governance - A Framework for Assessment
29
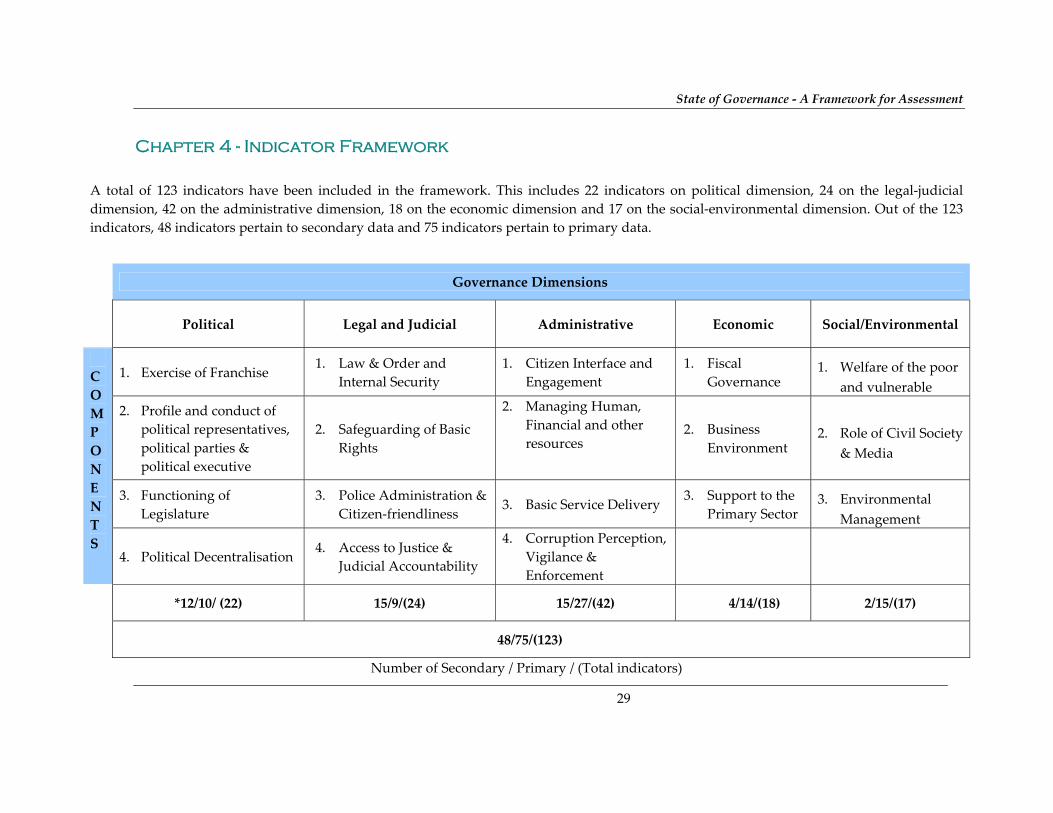
Chapter 4 - Indicator Framework
A total of 123 indicators have been included in the framework. This includes 22 indicators on political dimension, 24 on the legal‐judicial
dimension, 42 on the administrative dimension, 18 on the economic dimension and 17 on the social‐environmental dimension. Out of the 123
indicators, 48 indicators pertain to secondary data and 75 indicators pertain to primary data.
Governance Dimensions
Political Legal and Judicial Administrative Economic Social/Environmental
C
O
M
P
O
N
E
N
T
S
1. Exercise of Franchise 1. Law & Order and
Internal Security
1. Citizen Interface and
Engagement
1. Fiscal
Governance 1. Welfare of the poor
and vulnerable
2. Profile and conduct of
political representatives,
political parties &
political executive
2. Safeguarding of Basic
Rights
2. Managing Human,
Financial and other
resources 2. Business
Environment 2. Role of Civil Society
& Media
3. Functioning of
Legislature
3. Police Administration &
Citizen‐friendliness 3. Basic Service Delivery
3. Support to the
Primary Sector 3. Environmental
Management
4. Political Decentralisation 4. Access to Justice &
Judicial Accountability
4. Corruption Perception,
Vigilance &
Enforcement
*12/10/ (22) 15/9/(24) 15/27/(42) 4/14/(18) 2/15/(17)
48/75/(123)
Number of Secondary / Primary / (Total indicators)

State of Governance - A Framework for Assessment
30
Governance
Dimension Component
Types of Indicators
Primary Secondary Total
Political
1. Exercise of Franchise 3 2 5
2. Profile and conduct of political representatives,
political parties and political executive
4 3 7
3. Functioning of Legislature 1 3 4
4. Political Decentralisation 2 4 6
Total 10 12 22
State of Governance - A Framework for Assessment
31
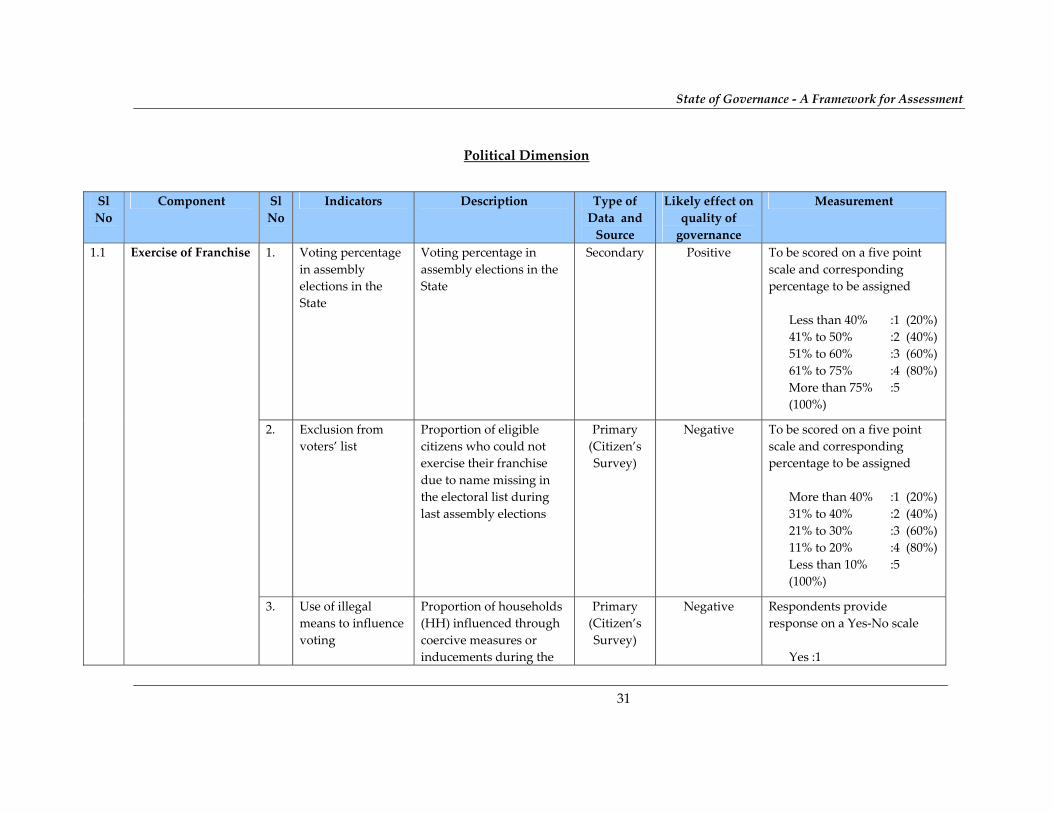
Political Dimension
Sl
No
Component Sl
No
Indicators Description Type of
Data and
Source
Likely effect on
quality of
governance
Measurement
1.1 Exercise of Franchise 1. Voting percentage
in assembly
elections in the
State
Voting percentage in
assembly elections in the
State
Secondary Positive To be scored on a five point
scale and corresponding
percentage to be assigned
Less than 40% :1 (20%)
41% to 50% :2 (40%)
51% to 60% :3 (60%)
61% to 75% :4 (80%)
More than 75% :5
(100%)
2. Exclusion from
voters’ list
Proportion of eligible
citizens who could not
exercise their franchise
due to name missing in
the electoral list during
last assembly elections
Primary
(Citizen’s
Survey)
Negative To be scored on a five point
scale and corresponding
percentage to be assigned
More than 40% :1 (20%)
31% to 40% :2 (40%)
21% to 30% :3 (60%)
11% to 20% :4 (80%)
Less than 10% :5
(100%)
3. Use of illegal
means to influence
voting
Proportion of households
(HH) influenced through
coercive measures or
inducements during the
Primary
(Citizen’s
Survey)
Negative Respondents provide
response on a Yes‐No scale
Yes :1

State of Governance - A Framework for Assessment
32
Sl
No
Component Sl
No
Indicators Description Type of
Data and
Source
Likely effect on
quality of
governance
Measurement
last assembly elections No :2
Proportion of respondents
who mention `Yes’ to be
scored on a five point scale
and corresponding percentage
to be assigned
More than 40% :1 (20%)
31% to 40% :2 (40%)
21% to 30% :3 (60%)
11% to 20% :4 (80%)
Less than 10% :5
(100%)
4. Extent of poll
related violence
Proportion of assembly
constituencies reporting
any poll related violence
during last assembly
elections
Secondary Negative To be scored on a five point
scale and corresponding
percentage to be assigned
More than 20% :1 (20%)
16% to 20% :2 (40%)
11% to 15% :3 (60%)
6% to 10% :4 (80%)
Less than 5% :5
(100%)
5. Faith in the
democratic process
Proportion of respondents
who believe that the way
they vote could improve
Primary
(Citizen’s
Survey)
Positive Respondents provide
response on a five point scale

State of Governance - A Framework for Assessment
33
Sl
No
Component Sl
No
Indicators Description Type of
Data and
Source
Likely effect on
quality of
governance
Measurement
their future welfare Strongly agree :5
Agree :4
Neither agree
nor disagree :3
Disagree :2
Strongly disagree :1
Final score to be used would
be the proportion of
respondents who rate `4’ or `5’
(agree or strongly agree)
1.2
Profile & Conduct of
Political
Representatives,
Political Parties &
Political Executive
6. Criminalization of
politics
% of elected
representatives (MLAs)
with serious criminal
charges (charges having
minimum conviction of
two years)
Secondary Negative To be scored on a five point
scale and corresponding
percentage to be assigned
More than 15% :1 (20%)
11% to 15% :2 (40%)
6% to 10% :3 (60%)
1% to 5% :4 (80%)
0% :5
(100%)
7. Women
Empowerment
% of women elected
representatives in the
State legislature
Secondary Positive To be scored on a five point
scale and corresponding
percentage to be assigned
15% or less :1 (20%)
16% to 20% :2 (40%)

State of Governance - A Framework for Assessment
34
Sl
No
Component Sl
No
Indicators Description Type of
Data and
Source
Likely effect on
quality of
governance
Measurement
21% to 25% :3 (60%)
26% to 33% :4 (80%)
More than 33% :5
(100%)
8. Accessibility of
elected
representatives
Proportion of respondents
who felt that their MLA is
easily accessible to the
general public
Primary
(Citizen’s
Survey)
Positive Respondents provide
response on a five point scale
Strongly agree :5
Agree :4
Neither agree
nor disagree :3
Disagree :2
Strongly disagree :1
Final score to be used would
be the proportion of
respondents who rate `4’ or `5’
(agree or strongly agree)
9. Perception about
corruption among
legislators
Proportion of respondents
who feel corruption
among legislators in the
State is high
Primary
(Citizen’s
Survey)
Negative Respondents provide
response on a five point scale
Extremely high :5
High :4
Neither high
nor low :3
Low :2

State of Governance - A Framework for Assessment
35
Sl
No
Component Sl
No
Indicators Description Type of
Data and
Source
Likely effect on
quality of
governance
Measurement
Extremely low :1
Final score to be used would
be the 100% minus proportion
of respondents who rate `4’ or
`5’ (high or extremely high)
10. Concern about
welfare of people
among political
parties
Proportion of respondents
who feel that political
parties in the State are
concerned about the
welfare of people,
especially the poor
Primary
(Citizen’s
Survey)
Positive Respondents provide
response on a five point scale
Strongly agree :5
Agree :4
Neither agree
nor disagree :3
Not agree :2
Strongly disagree :1
Final score to be used would
be the proportion of
respondents who rate `4’ or `5’
(Effective or Very Effective)
11. Political Stability Was there any mid‐term
election in the last five
years?
Secondary Negative
Yes :1 (0%)
No :2 (100%)
12. Quality of Top
Leadership and
Political Executive
Proportion of respondents
who feel that the
leadership provided by
Primary
(Citizen’s
Survey)
Positive Respondents provide
response on a five point scale

State of Governance - A Framework for Assessment
36
Sl
No
Component Sl
No
Indicators Description Type of
Data and
Source
Likely effect on
quality of
governance
Measurement
the Chief Minister and
the council of ministers is
effective
Strongly agree :5
Agree :4
Neither agree
nor disagree :3
Disagree :2
Strongly disagree :1
Final score to be used would
be the proportion of
respondents who rate `4’ or `5’
(agree or strongly agree)
1.3 Functioning of
Legislature
13. Functioning of the
State Assembly –
Time devoted to
legislative matters
% of time devoted to
Legislative matters by the
State Assembly
Secondary Negative To be scored on a five point
scale and corresponding
percentage to be assigned
30% or less :1 (20%)
31% to 40% :2 (40%)
41% to 50% :3 (60%)
51% to 60% :4 (80%)
More than 60% :5
(100%)
14. Proportion of bills
passed without
any discussion in
last 5 years
No. of bills passed
without any discussion
out of total no. of bills
passed in the last 5 years
Secondary Negative To be scored on a five point
scale and corresponding
percentage to be assigned
More than 40% :1 (20%)
31% to 40% :2 (40%)

State of Governance - A Framework for Assessment
37
Sl
No
Component Sl
No
Indicators Description Type of
Data and
Source
Likely effect on
quality of
governance
Measurement
21% to 30% :3 (60%)
11% to 20% :4 (80%)
10% or less :5
(100%)
15. Functioning of the
Legislature –
Citizen Perception
Proportion of respondents
who rate the functioning
of the State legislature as
good or very good
Primary
(Citizen’s
Survey)
Positive Respondents provide
response on a five point scale
Very Good :5
Good :4
Fair :3
Poor :2
Very Poor :1
Final score to be used would
be the proportion of
respondents who rate `4’ or
`5’ (agree or strongly agree)
16. Review of audit
reports by Public
Accounts
Committee
Out of the last 5 CAG
reports, how many have
been examined by the
Public Accounts
Committee?
Secondary Positive Score to be recorded on a five
point scale and
corresponding percentage to
be assigned
Only one report :1 (20%)
2 reports :2 (40%)
3 reports :3 (60%)
4 reports :4 (80%)
5 reports :5

State of Governance - A Framework for Assessment
38
Sl
No
Component Sl
No
Indicators Description Type of
Data and
Source
Likely effect on
quality of
governance
Measurement
(100%)
1.4 Political
Decentralisation
17. Voter turnout in
local elections
(Municipal &
Panchayat)
Voter turnout in the last
local elections (Municipal
& Panchayat)
Secondary Positive To be scored on a five point
scale and corresponding
percentage to be assigned
Less than 40% :1 (20%)
41% to 50% :2 (40%)
51% to 60% :3 (60%)
61% to 75% :4 (80%)
More than 75% :5
(100%)
18. Devolution of
Functions to PRIs
& ULBs
Proportion of functions
transferred out of the
mandated 29 functions to
PRIs and out of the
mandated 18 functions to
ULBs (along with activity
mapping)
Secondary Positive To be scored on a five point
scale and corresponding
percentage to be assigned
To PRIs
10 or less :1 (20%)
11 to 15 :2 (40%)
16 to 20 :3 (60%)
21 to 25 :4 (80%)
More than 25 :5
(100%)
To ULBs
Less than 4 :1 (20%)
5 to 8 :2 (40%)
9 to 12 :3 (60%)
13 to 15 :4 (80%)

State of Governance - A Framework for Assessment
39
Sl
No
Component Sl
No
Indicators Description Type of
Data and
Source
Likely effect on
quality of
governance
Measurement
More than 15 :5
(100%)
Take the simple average of
both (PRIs and ULBs) as the
resultant score
19. Devolution of
Finances to PRIs
Percentage of `untied’
funds devolved to PRIs
Secondary Positive To be scored on a five point
scale and corresponding
percentage to be assigned
Less than 20% :1 (20%)
21% to 40% :2 (40%)
41% to 60% :3 (60%)
61% to 80% :4 (80%)
More than 80% :5
(100%)
20. Financial strength
of ULBs
Own revenue (Tax+ non‐
tax) revenue as a
proportion of total
revenue for ULBs
Secondary Positive To be scored on a five point
scale and corresponding
percentage to be assigned
30% or less :1 (20%)
31% to 40% :2 (40%)
41% to 50% :3 (60%)
51% to 65% :4 (80%)
More than 65% :5
(100%)
21. Quality of Proportion of respondents Primary Positive Respondents provide

State of Governance - A Framework for Assessment
40
Sl
No
Component Sl
No
Indicators Description Type of
Data and
Source
Likely effect on
quality of
governance
Measurement
Functioning of
Gram Panchayat /
Block Panchayat /
ULBs
who say that the
functioning of Gram
Panchayat / Block
Panchayat is good or very
good (rural)
Proportion of respondents
who say that the
functioning of the
municipality is good or
very good (urban)
(Citizen’s
Survey)
response on a five point scale
Very Good :5
Good :4
Fair :3
Poor :2
Very Poor :1
Final score to be used would
be the proportion of
respondents who rate `4’ or
`5’ (agree or strongly agree)
22. Quality of
Functioning of
Gram Sabha
Proportion of respondents
(rural) who say that the
functioning of Gram
Sabha is good or very
good
Proportion of respondents
(urban) who say that the
functioning of Ward
Sabha is good or very
good
Primary
(Citizen’s
Survey)
Positive Respondents provide
response on a five point scale
Very Good :5
Good :4
Fair :3
Poor :2
Very Poor :1
Final score to be used would
be the proportion of
respondents who rate `4’ or
`5’ (agree or strongly agree)

State of Governance - A Framework for Assessment
41
Legal and Judicial Dimension of Governance
Mapping into Component, Sub Components and Indicators
Governance
Dimension Components
Types of Indicators
Primary Secondary Total
Legal & Judicial
1. Law & Order and Internal
Security
2 2 4
2. Safeguarding of Basic Rights 1 3 4
3. Police Administration and
Citizen‐friendliness of the Police
4 5 9
4. Access to Justice & Judicial
Accountability
2 5 7
Total 9 15 24

State of Governance - A Framework for Assessment
42
Legal & Judicial Dimension
Sl.
No. Component
Sl.
No. Indicators Description
Type of Data
Source
Likely effect
on quality of
governance
Measurement
1.1 Law & Order and
Internal Security 1. Serious crimes
committed in State
in last three years
Proportion of serious
crimes in State out of
total number of serious
crimes in country in last
year
(normalised by
population)
Secondary Negative Normalised scores (by
population) to be converted to a
score on a five point scale and
corresponding percentage to be
assigned
More than 1.25 :1 (20%)
1.06 to 1.25 :2 (40%)
0.95 to 1.05 :3 (60%)
0.8 to 0.94 :4 (80%)
Less than 0.8 :5 (100%)
2. Persons killed in
incidents of
organised violence
against the State
such as naxal
violence,
insurgency,
terrorism etc.
Proportion of persons
killed in incidents of
organised violence in
State out of total number
killed in country in the
previous year
(normalised by
population)
Secondary Negative Normalised scores (by
population) to be converted to a
score on a five point scale and
corresponding percentage to be
assigned
More than 1.25 :1 (20%)
1.06 to 1.25 :2 (40%)
0.95 to 1.05 :3 (60%)
0.8 to 0.94 :4 (80%)
Less than 0.8 :5 (100%)
3. Police
effectiveness in
Proportion of
respondents who believe
Primary
(Citizen’s
Positive Respondents provide response
on a five point scale

State of Governance - A Framework for Assessment
43
Sl.
No. Component
Sl.
No. Indicators Description
Type of Data
Source
Likely effect
on quality of
governance
Measurement
enforcing law &
order
the police is effective in
enforcing law & order
Survey)
Strongly agree :5
Agree :4
Neither agree
nor disagree :3
Disagree :2
Strongly disagree :1
Final score to be used would be
the proportion of respondents
who rate `4’ or `5’ (agree or
strongly agree)
4. Effectiveness of
the State in
handling grave
security threats
Proportion of
respondents who feel that
the State Government is
adequately prepared to
prevent / handle grave
security threats like
extremism / militancy /
naxalite violence.
Primary
(Citizen’s
Survey)
Positive Respondents provide response
on a five point scale
Strongly agree :5
Agree :4
Neither agree
nor disagree :3
Disagree :2
Strongly disagree :1
Final score to be used would be
the proportion of respondents
who rate `4’ or `5’ (agree or
strongly agree)

State of Governance - A Framework for Assessment
44
Sl.
No. Component
Sl.
No. Indicators Description
Type of Data
Source
Likely effect
on quality of
governance
Measurement
1.2 Safeguarding of
Basic Rights 5. Security of Life &
Property
% of respondents who
believe that their life and
property are generally
secure (across different
segments)
Primary
(Citizen’s
Survey)
Positive Respondents provide response
on a five point scale
Strongly agree :5
Agree :4
Neither agree
nor disagree :3
Disagree :2
Strongly disagree :1
Final score to be used would be
the proportion of respondents
who rate `4’ or `5’ (agree or
strongly agree)
6. Human rights
violations
including
custodial rapes
and deaths in last
three years
Proportion of human
rights violations in State
out of total number of
human rights violations
in country in last year
(normalised by
population)
Secondary Negative Normalised scores (by
population) to be converted to a
score on a five point scale and
corresponding percentage to be
assigned
More than 1.25 :1 (20%)
1.06 to 1.25 :2 (40%)
0.95 to 1.05 :3 (60%)
0.8 to 0.94 :4 (80%)
Less than 0.8 :5 (100%)
7. Atrocities (crimes)
against women
Proportion of crimes
against women &
Secondary Negative Normalised scores (by
population) to be converted to a

State of Governance - A Framework for Assessment
45
Sl.
No. Component
Sl.
No. Indicators Description
Type of Data
Source
Likely effect
on quality of
governance
Measurement
and children children in State out of
total number of crimes
against women &
children in country in last
year
(normalised by
population)
score on a five point scale and
corresponding percentage to be
assigned
More than 1.25 :1 (20%)
1.06 to 1.25 :2 (40%)
0.95 to 1.05 :3 (60%)
0.8 to 0.94 :4 (80%)
Less than 0.8 :5 (100%)
8. Atrocities (crimes)
against SC/STs
Proportion of crimes
against SCs/STs in State
out of total no. of crimes
against SCs/STs in
country in last year
(normalised by
population)
Secondary Negative Normalised scores (by
population) to be converted to a
score on a five point scale and
corresponding percentage to be
assigned
More than 1.25 :1 (20%)
1.06 to 1.25 :2 (40%)
0.95 to 1.05 :3 (60%)
0.8 to 0.94 :4 (80%)
Less than 0.8 :5 (100%)
1.3 Police
Administration &
citizen‐friendliness
9. Police personnel to
population ratio
No. of police personnel
per 1,00,000 population
(compared to prescribed
norms)
Secondary Positive Normalised scores (to
prescribed norms) to be
converted to a score on a five
point scale and corresponding
percentage to be assigned
Less than 0.60 :1 (20%)

State of Governance - A Framework for Assessment
46
Sl.
No. Component
Sl.
No. Indicators Description
Type of Data
Source
Likely effect
on quality of
governance
Measurement
0.60 to 0.79 :2 (40%)
0.80 to 0.89 :3 (60%)
0.90 to 0.99 :4 (80%)
1 or more :5 (100%)
10. Police deployment
in core functions
Proportion of time (man
days) spent by police
force on core functions
out of total available
(man days) in last one
month
Secondary Positive Based on a sample survey of
police stations and police
personnel (can also be collected
through duty roster)
Convert into percentage before
recording in scale below
Less than 0.50 :1 (20%)
0.51 to 0.60 :2 (40%)
0.61 to 0.70 :3 (60%)
0.71 to 0.80 :4 (80%)
More than 0.80 :5 (100%)
11. Transparency in
police transfers,
postings &
promotions
Police Establishment
Board (PEB) constituted
and functional
Secondary Positive PEB functional: 2 (100%)
PEB not functional: 1 (0%)
12. Political
interference in
police
administration
Proportion of police
personnel who feel that
there is a high/very high
degree of political
interference in police
administration
Primary
(Employees’
Survey)
Negative Respondents provide response
on a five point scale on degree
of political interference
Very High :5
High :4

State of Governance - A Framework for Assessment
47
Sl.
No. Component
Sl.
No. Indicators Description
Type of Data
Source
Likely effect
on quality of
governance
Measurement
Manageable :3
Low :2
Very low :1
Final score to be used would be
the 100% minus proportion of
respondents who rate `4’ or `5’
(high or very high)
13. Timely filing of
chargesheets
Proportion of
chargesheets filed after
stipulated time (90 days)
Secondary
(Sample
Survey of
police
stations in
case
information
not available)
Negative To be scored on a five point
scale and corresponding
percentage to be assigned
Less than 20% :1 (20%)
21% to 40% :2 (40%)
41% to 60% :3 (60%)
61% to 80% :4 (80%)
More than 80% :5 (100%)
14. Conviction rate for
serious crimes
Percentage of convictions
secured in cases
involving serious crimes
in last three years
Secondary Positive To be scored on a five point
scale and corresponding
percentage to be assigned
Less than 10% :1 (20%)
11% to 20% :2 (40%)
21% to 30% :3 (60%)
31% to 40% :4 (80%)
More than 40% :5 (100%)
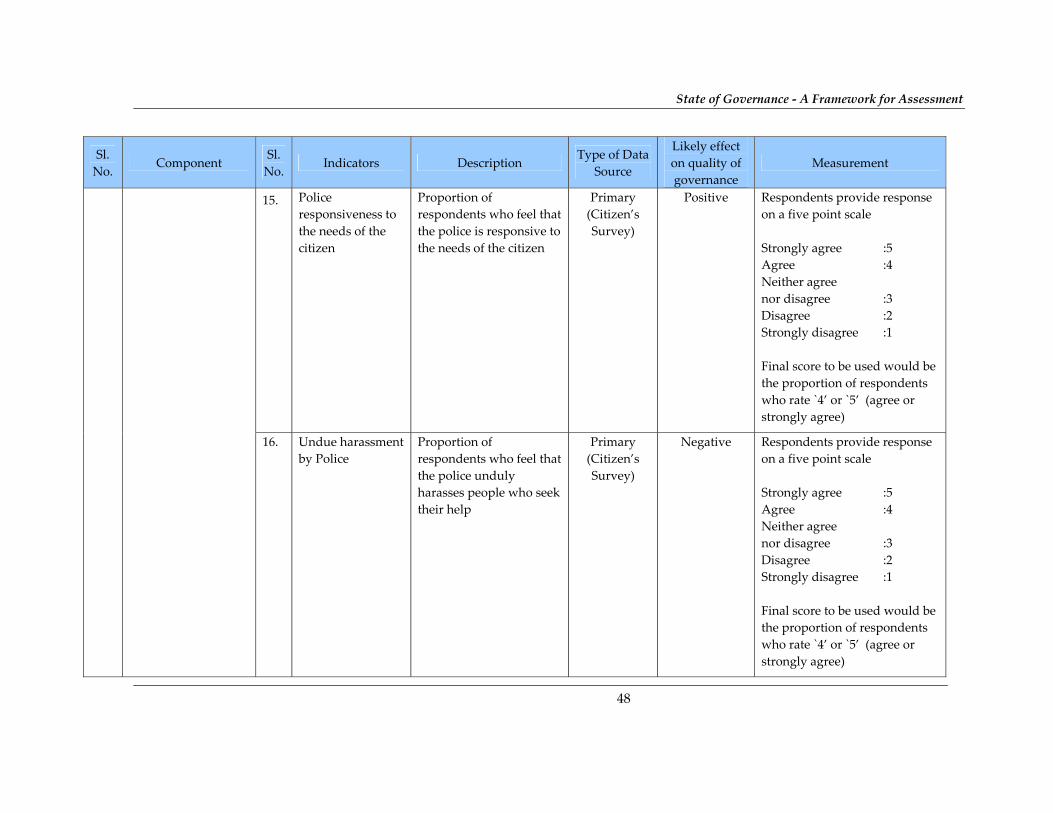
State of Governance - A Framework for Assessment
48
Sl.
No. Component
Sl.
No. Indicators Description
Type of Data
Source
Likely effect
on quality of
governance
Measurement
15. Police
responsiveness to
the needs of the
citizen
Proportion of
respondents who feel that
the police is responsive to
the needs of the citizen
Primary
(Citizen’s
Survey)
Positive Respondents provide response
on a five point scale
Strongly agree :5
Agree :4
Neither agree
nor disagree :3
Disagree :2
Strongly disagree :1
Final score to be used would be
the proportion of respondents
who rate `4’ or `5’ (agree or
strongly agree)
16. Undue harassment
by Police
Proportion of
respondents who feel that
the police unduly
harasses people who seek
their help
Primary
(Citizen’s
Survey)
Negative Respondents provide response
on a five point scale
Strongly agree :5
Agree :4
Neither agree
nor disagree :3
Disagree :2
Strongly disagree :1
Final score to be used would be
the proportion of respondents
who rate `4’ or `5’ (agree or
strongly agree)

State of Governance - A Framework for Assessment
49
Sl.
No. Component
Sl.
No. Indicators Description
Type of Data
Source
Likely effect
on quality of
governance
Measurement
17. Incidence of
bribery
Proportion of
respondents who
mention having paid
bribe to police personnel
in last one year
Primary
(Citizen’s
Survey)
Negative Respondents provide response
on a Yes‐No scale
Yes :1
No :2
Final score to be used would be
the proportion of respondents
who mention `Yes’
1.4 Access to Justice &
Judicial
Accountability
18. Average number
of cases disposed
per judge in
subordinate courts
Ratio of average number
of cases disposed per
judge annually in
subordinate courts and
prescribed norm
Secondary Positive Ratio to be scored on a five
point scale and corresponding
percentage to be assigned
Less than 0.6 :1 (20%)
0.6 to 0.74 :2 (40%)
0.75 to 0.89 :3 (60%)
0.90 to 0.99 :4 (80%)
1 or more :5 (100%)
19. Cases pending in
Subordinate
Courts
Proportion of cases
pending in subordinate
courts out of total cases
pending in subordinate
court in the country
(normalised by
population)
Secondary Negative Normalised scores (by
population) to be converted to a
score on a five point scale and
corresponding percentage to be
assigned
More than 1.25 :1 (20%)
1.06 to 1.25 :2 (40%)
0.95 to 1.05 :3 (60%)

State of Governance - A Framework for Assessment
50
Sl.
No. Component
Sl.
No. Indicators Description
Type of Data
Source
Likely effect
on quality of
governance
Measurement
0.8 to 0.94 :4 (80%)
Less than 0.8 :5 (100%)
20. Cases disposed
under Sec. 80 CPC
Proportion of cases
disposed at the level of
Government when Sec.
80 CPC notice are sent to
the Department before
filing a court case out of
total cases filed against
Government in last one
year
Secondary Positive To be scored on a five point
scale and corresponding
percentage to be assigned
Less than 5% :1 (20%)
6% to 10% :2 (40%)
11% to 20% :3 (60%)
21% to 30% :4 (80%)
More than 30% :5 (100%)
21. Confidence in the
judicial system
Proportion of
respondents who have
high / very high degree of
confidence in the judicial
system
Primary
(Citizen’s
Survey)
Positive Respondents provide response
on a five point scale
Very High :5
High :4
Average :3
Low :2
Very Low :1
Final score to be used would be
the proportion of respondents
who rate `4’ or `5’ (high or very
high)
22. Incidence of
bribery to
influence judicial
Proportion of
respondents who have
paid bribes in the last 3
Primary
(Citizen’s
Survey)
Negative Respondents provide response
on a Yes‐No scale

State of Governance - A Framework for Assessment
51
Sl.
No. Component
Sl.
No. Indicators Description
Type of Data
Source
Likely effect
on quality of
governance
Measurement
process years to influence judicial
process.
Yes :1
No :2
Final score to be used would be
the proportion of respondents
who mention `Yes’
23. Complaints
against
subordinate
judges
% of subordinate judges
against whom complaints
have been filed
Secondary Negative Average score to be recorded
on a five point scale and
corresponding percentage to be
assigned
More than 20% :1 (20%)
10% to 19% :2 (40%)
5% to 9% :3 (60%)
2% to 4% :4 (80%)
Less than 2% :5 (100%)
24. Transparency in
judiciary under
RTI
Whether proactive
disclosure under Section
4(1) b of the RTI Act, 2005
has been made by the
High Court
Secondary Positive To be answered on a Yes‐No
scale and corresponding
percentage to be assigned
Yes :1 (100%)
No :2 (0%)

State of Governance - A Framework for Assessment
52
Administrative Dimension of Governance
Mapping into Component, Sub Components and Indicators
Governance
Dimension Components
Types of Indicators
Primary Secondary Total
Administrative
1. Citizen Interface 4 1 5
2. Managing Human, Financial and
other resources
5 9 14
3. Basic Service Delivery 16 1 17
4. Corruption Perception, Vigilance &
Enforcement
2 4 6
Total 27 15 42

State of Governance - A Framework for Assessment
53
Administrative Dimension
Sl. No. Component Sl.
No.
Indicators Description Type of Data
Source
Likely
effect on
quality of
governance
Measurement
1.1 Citizen
Interface and
Engagement
1. Responsiveness to
the needs of the
citizens
Proportion of respondents who
say that the government
functionaries are responsive to
the needs of the citizens
Primary
(Citizen’s
Survey)
Positive Respondents provide response on
a five point scale
Strongly agree :5
Agree :4
Neither agree
nor disagree :3
Disagree :2
Strongly disagree :1
Final score to be used would be
the proportion of respondents
who rate `4’ or `5’ (agree or
strongly agree)
2. Quality of grievance
redressal /complaint
handling
Proportion of respondents who
say that the quality of
grievance redressal (complaint
handling) by government
agencies is good or very good
Primary
(Citizen’s
Survey)
Positive Respondents rate the quality of
grievance redressal on a five point
scale
Very Good :5
Good :4
Average :3
Poor :2
Very Poor :1

State of Governance - A Framework for Assessment
54
Sl. No. Component Sl.
No.
Indicators Description Type of Data
Source
Likely
effect on
quality of
governance
Measurement
Final score to be used would be
the proportion of respondents
who rate `4’ or `5’ (good or very
good)
3. Awareness of the
RTI Act
Proportion of the population
aware of the RTI Act
Primary
(Citizen’s
Survey)
Positive Respondents provide response on
a Yes‐No scale
Yes :1
No :2
Final score to be used would be
the proportion of respondents
who mention `Yes’
4. Disposal of requests
for information
under RTI Act
Proportion of RTI requests
where information was
provided as per provisions of
the Act
Secondary
(If
information
is not
available, a
sample
survey of
departments
may be done)
Positive Score to be recorded on a five
point scale and corresponding
percentage to be assigned
Less than 60% :1 (20%)
60% to 69% :2 (40%)
70% to 79% :3 (60%)
80% to 89% :4 (80%)
More than 90% :5 (100%)
5. Citizen engagement
in governance
Proportion of citizens who feel
they can influence policy or
programmes at the national,
State or local level
Primary
(Citizen’s
Survey)
Positive Respondents provide response on
a five point scale
Strongly agree :5

State of Governance - A Framework for Assessment
55
Sl. No. Component Sl.
No.
Indicators Description Type of Data
Source
Likely
effect on
quality of
governance
Measurement
Agree :4
Neither agree
nor disagree :3
Disagree :2
Strongly disagree :1
Final score to be used would be
the proportion of respondents
who rate `4’ or `5’ (agree or
strongly agree)
1.2 Managing
Human,
Financial and
other
resources
6. Managerial profile
of government
Proportion of Class I & II
employees out of total number
of government employees
Secondary Positive Score to be recorded on a five
point scale and corresponding
percentage to be assigned
Less than 10% :1 (20%)
10% to 19% :2 (40%)
20% to 29% :3 (60%)
30% to 39% :4 (80%)
40% or More :5 (100%)
7. Women in
Government Service
Proportion of women in
government service
Secondary Positive Score to be recorded on a five
point scale and corresponding
percentage to be assigned
Less than 10% :1 (20%)
10% to 19% :2 (40%)
20% to 25% :3 (60%)
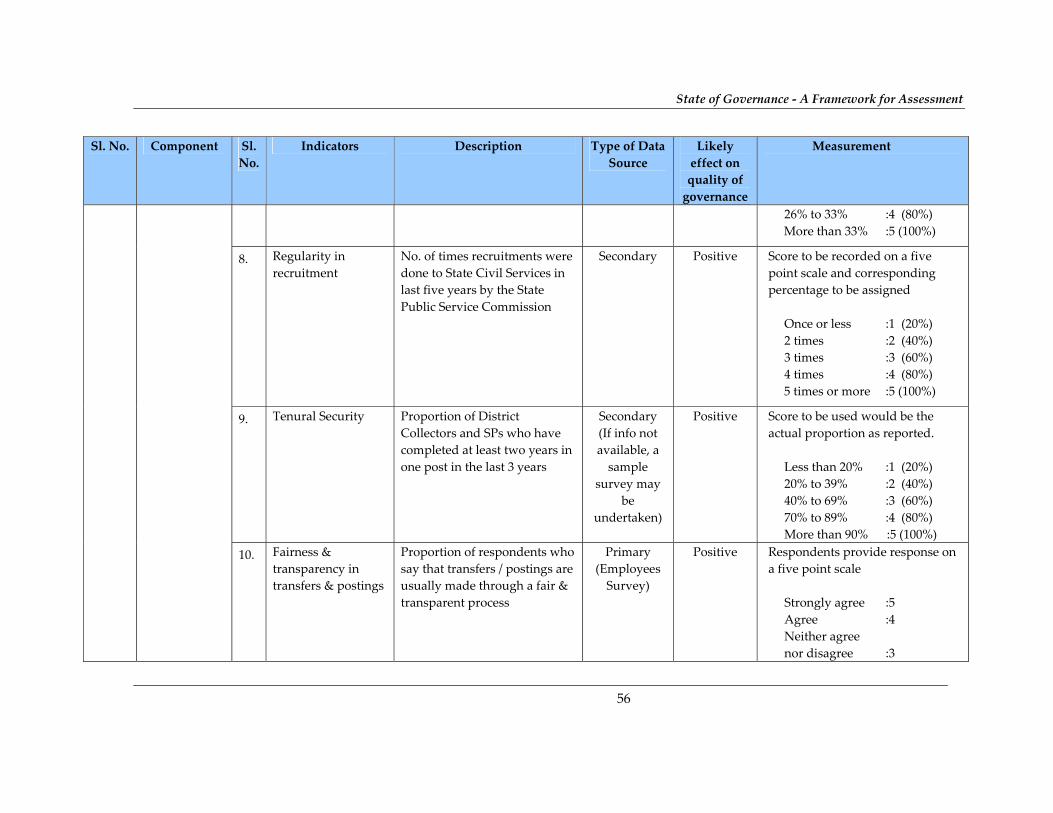
State of Governance - A Framework for Assessment
56
Sl. No. Component Sl.
No.
Indicators Description Type of Data
Source
Likely
effect on
quality of
governance
Measurement
26% to 33% :4 (80%)
More than 33% :5 (100%)
8. Regularity in
recruitment
No. of times recruitments were
done to State Civil Services in
last five years by the State
Public Service Commission
Secondary Positive Score to be recorded on a five
point scale and corresponding
percentage to be assigned
Once or less :1 (20%)
2 times :2 (40%)
3 times :3 (60%)
4 times :4 (80%)
5 times or more :5 (100%)
9. Tenural Security Proportion of District
Collectors and SPs who have
completed at least two years in
one post in the last 3 years
Secondary
(If info not
available, a
sample
survey may
be
undertaken)
Positive Score to be used would be the
actual proportion as reported.
Less than 20% :1 (20%)
20% to 39% :2 (40%)
40% to 69% :3 (60%)
70% to 89% :4 (80%)
More than 90% :5 (100%)
10. Fairness &
transparency in
transfers & postings
Proportion of respondents who
say that transfers / postings are
usually made through a fair &
transparent process
Primary
(Employees
Survey)
Positive Respondents provide response on
a five point scale
Strongly agree :5
Agree :4
Neither agree
nor disagree :3
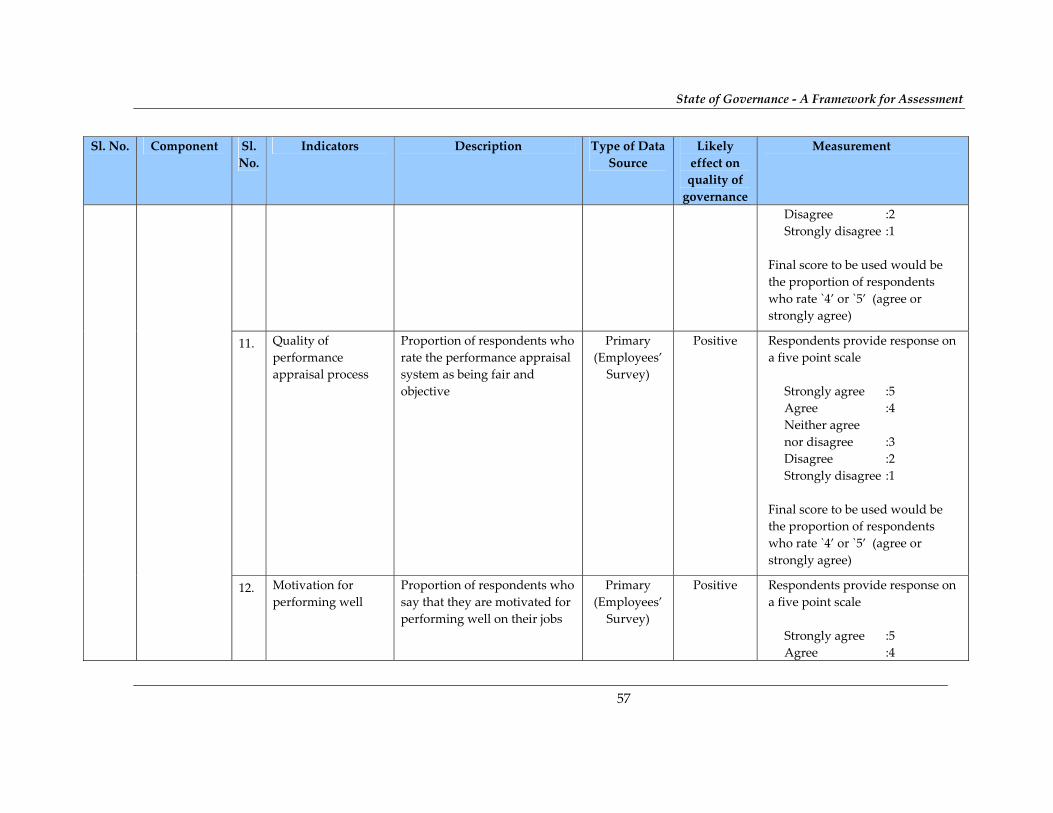
State of Governance - A Framework for Assessment
57
Sl. No. Component Sl.
No.
Indicators Description Type of Data
Source
Likely
effect on
quality of
governance
Measurement
Disagree :2
Strongly disagree :1
Final score to be used would be
the proportion of respondents
who rate `4’ or `5’ (agree or
strongly agree)
11. Quality of
performance
appraisal process
Proportion of respondents who
rate the performance appraisal
system as being fair and
objective
Primary
(Employees’
Survey)
Positive Respondents provide response on
a five point scale
Strongly agree :5
Agree :4
Neither agree
nor disagree :3
Disagree :2
Strongly disagree :1
Final score to be used would be
the proportion of respondents
who rate `4’ or `5’ (agree or
strongly agree)
12. Motivation for
performing well
Proportion of respondents who
say that they are motivated for
performing well on their jobs
Primary
(Employees’
Survey)
Positive Respondents provide response on
a five point scale
Strongly agree :5
Agree :4

State of Governance - A Framework for Assessment
58
Sl. No. Component Sl.
No.
Indicators Description Type of Data
Source
Likely
effect on
quality of
governance
Measurement
Neither agree
nor disagree :3
Disagree :2
Strongly disagree :1
Final score to be used would be
the proportion of respondents
who rate `4’ or `5’ (agree or
strongly agree)
13. Adequacy of
knowledge & skills
Proportion of employees who
say they are well equipped to
meet the requirements /
challenges of their job
Primary
(Employees’
Survey)
Positive Respondents provide response on
a five point scale
Strongly agree :5
Agree :4
Neither agree
nor disagree :3
Disagree :2
Strongly disagree :1
Final score to be used would be
the proportion of respondents
who rate `4’ or `5’ (agree or
strongly agree)
14. Budget utilisation
for social and
economic services
Unspent grant (Budget –
Actual) as proportion of total
budget on social & economic
Secondary Negative Score to be recorded on a five
point scale and corresponding
percentage to be assigned

State of Governance - A Framework for Assessment
59
Sl. No. Component Sl.
No.
Indicators Description Type of Data
Source
Likely
effect on
quality of
governance
Measurement
services
More than 10% :1 (20%)
8% to 10% :2 (40%)
5% to 7% :3 (60%)
3% to 4% :4 (80%)
2% or Less :5 (100%)
15. Extent of `March
Rush’
Percent of expenditure
incurred in last quarter (Jan to
March) to total expenditure
Secondary Negative Score to be recorded on a five
point scale and corresponding
percentage to be assigned
More than 60% :1 (20%)
51% to 60% :2 (40%)
41% to 50% :3 (60%)
31% to 40% :4 (80%)
30% or less :5 (100%)
16. Pendency of
Abstract Contingent
Bills
Percent value of Abstract
Contingent (AC) Bills pending
settlement for more than 3
years out of total pending AC
Bills
Secondary Negative Score to be recorded on a five
point scale and corresponding
percentage to be assigned
More than 20% :1 (20%)
16% to 19% :2 (40%)
11% to 15% :3 (60%)
6% to 10% :4 (80%)
5% or less :5 (100%)
17. Pendency of Audit
observations
Percent of CAGʹs audit
observations pending
Secondary Negative Score to be recorded on a five
point scale and corresponding

State of Governance - A Framework for Assessment
60
Sl. No. Component Sl.
No.
Indicators Description Type of Data
Source
Likely
effect on
quality of
governance
Measurement
compliance for more than 3
years
percentage to be assigned
More than 50% :1 (20%)
41% to 50% :2 (40%)
31% to 40% :3 (60%)
21% to 30% :4 (80%)
20% or less :5 (100%)
18. Quality of financial
management in
government
Proportion of respondents who
say that the quality of financial
management in government in
good
Primary
(Employees’
Survey ‐
Management)
Positive Respondents provide response on
a five point scale
Strongly agree :5
Agree :4
Neither agree
nor disagree :3
Disagree :2
Strongly disagree :1
Final score to be used would be
the proportion of respondents
who rate `4’ or `5’ (agree or
strongly agree)
19. Use of IT in
Governance
e‐Readiness Index (NCAER) Secondary Positive Rating to be done on the five point
scale on which states are classified
(given below) and corresponding
percentage to be assigned

State of Governance - A Framework for Assessment
61
Sl. No. Component Sl.
No.
Indicators Description Type of Data
Source
Likely
effect on
quality of
governance
Measurement
Leaders :5 (100%)
Aspiring Leaders :4 (80%)
Expectant :3 (60%)
Average :2 (40%)
Below Average :1 (20%)
1.3 Basic Service
Delivery 20. Accessibility of the
nearest
primary/community
health centre
% of users who say that the
primary/community health
centre is easily accessible
Primary
(Citizen’s
Survey)
Positive Respondents provide response on
a five point scale
Strongly agree :5
Agree :4
Neither agree
nor disagree :3
Disagree :2
Strongly disagree :1
Final score to be used would be
the proportion of respondents
who rate `4’ or `5’ (agree or
strongly agree)
21. Visit by community
health worker
(ANM)
% of users (women) reporting
at least one visit by community
health worker (ANM) to their
households during the last
three months
Primary
(Citizen’s
Survey)
Positive Respondents provide response on
a Yes‐No scale
Yes :1
No :2
Final score to be used would be

State of Governance - A Framework for Assessment
62
Sl. No. Component Sl.
No.
Indicators Description Type of Data
Source
Likely
effect on
quality of
governance
Measurement
the proportion of respondents
who mention `Yes’
22. Quality of
healthcare services
provided by the
primary/community
health centre
% of users who say they are
satisfied or very satisfied with
the health care services
provided by the primary/
community health centre
Primary
(Citizen’s
Survey)
Positive Respondents provide response on
a five point scale
Very Satisfied :5
Satisfied :4
Neither satisfied
nor dissatisfied :3
Dissatisfied :2
Strongly Dissatisfied :1
Final score to be used would be
the proportion of respondents
who rate `4’ or `5’ (agree or
strongly agree)
23. Accessibility of
nearby government
primary school
% of users (parents) who say
that the primary school is
easily accessible
Primary
(Citizen’s
Survey)
Positive Respondents provide response on
a five point scale
Strongly agree :5
Agree :4
Neither agree
nor disagree :3
Disagree :2
Strongly disagree :1

State of Governance - A Framework for Assessment
63
Sl. No. Component Sl.
No.
Indicators Description Type of Data
Source
Likely
effect on
quality of
governance
Measurement
Final score to be used would be
the proportion of respondents
who rate `4’ or `5’ (agree or
strongly agree)
24. Availability of
teacher at the
government
primary school
% of users (parents) who say
that the teacher at the primary
school is usually available
Primary
(Citizen’s
Survey)
Positive Respondents provide response on
a five point scale
Strongly agree :5
Agree :4
Neither agree nor disagree :3
Disagree :2
Strongly disagree :1
Final score to be used would be
the proportion of respondents
who rate `4’ or `5’ (agree or
strongly agree)
25. Quality of mid‐day
meals at the
government
primary school
% of users (parents) who
mention they are satisfied or
very satisfied with the quality
of mid‐day meals provided in
primary schools
Primary
(Citizen’s
Survey)
Positive Respondents provide response on
a five point scale
Very Satisfied :5
Satisfied :4
Neither satisfied nor dissatisfied :3
Dissatisfied :2
Strongly Dissatisfied :1

State of Governance - A Framework for Assessment
64
Sl. No. Component Sl.
No.
Indicators Description Type of Data
Source
Likely
effect on
quality of
governance
Measurement
Final score to be used would be
the proportion of respondents
who rate `4’ or `5’ (agree or
strongly agree)
26. Quality of teaching
provided at the
government
primary school
% of users (parents) who
mention they are satisfied or
very satisfied with the quality
of teaching provided at the
primary school
Primary
(Citizen’s
Survey)
Positive Respondents provide response on
a five point scale
Very Satisfied :5
Satisfied :4
Neither satisfied nor dissatisfied :3
Dissatisfied :2
Strongly Dissatisfied :1
Final score to be used would be
the proportion of respondents
who rate `4’ or `5’ (agree or
strongly agree)
27. Overall
performance in
education
Education Development Index
compiled by MHRD through
NUEPA
Secondary Positive Rating to be done on the five point
scale based on ranking of the State
and by assigning corresponding
percentage
Rank among all States
Top 20 percentile :5 (100%)
21‐ 40 percentile :4 (80%)
41‐60 percentile :3 (60%)

State of Governance - A Framework for Assessment
65
Sl. No. Component Sl.
No.
Indicators Description Type of Data
Source
Likely
effect on
quality of
governance
Measurement
61 ‐ 90 percentile :2 (40%)
91% and above :1 (20%)
28. Access to piped
drinking water
% of HH having access to
piped drinking water
Primary
(Citizen’s
Survey)
Positive Respondents provide response on
a Yes‐No scale
Yes :1
No :2
Final score to be used would be
the proportion of respondents
who mention `Yes’
29. Access to basic
sanitation facilities
% of HH having access to
public/individual sanitation
facilities
Primary
(Citizen’s
Survey)
Positive Respondents provide response on
a Yes‐No scale
Yes :1
No :2
Final score to be used would be
the proportion of respondents
who mention `Yes’
30. Disposal of garbage
(Urban)
% of HH mentioning that there
is an effective garbage disposal
system in their locality
Primary
(Citizen’s
Survey)
Positive Respondents provide response on
a Yes‐No scale
Yes :1
No :2

State of Governance - A Framework for Assessment
66
Sl. No. Component Sl.
No.
Indicators Description Type of Data
Source
Likely
effect on
quality of
governance
Measurement
Final score to be used would be
the proportion of respondents
who mention `Yes’
31. Existence of
drainage facility
(Urban)
% of HH mentioning that there
is an effective drainage system
in their locality
Primary
(Citizen’s
Survey)
Positive Respondents provide response on
a Yes‐No scale
Yes :1
No :2
Final score to be used would be
the proportion of respondents
who mention `Yes’
32. Getting monthly
entitlements of food
grains through the
public distribution
system (PDS)
% of users mentioning that
they usually or always get their
monthly entitlement of food
grains at ration shops/fair price
shops
Primary
(Citizen’s
Survey)
Positive Respondents provide response on
a five point scale
Always :5
Usually :4
Sometimes :3
Rarely :2
Never :1
Final score to be used would be
the proportion of respondents
who rate `4’ or `5’ (usually or
always)

State of Governance - A Framework for Assessment
67
Sl. No. Component Sl.
No.
Indicators Description Type of Data
Source
Likely
effect on
quality of
governance
Measurement
33. Access to Electricity % of households having
electricity connection
Primary
(Citizen’s
Survey)
Positive Respondents provide response on
a Yes‐No scale
Yes :1
No :2
Final score to be used would be
the proportion of respondents
who mention `Yes’
34. Regularity of
electric supply
% of households reporting
satisfaction on the regularity of
electric supply
Primary
(Citizen’s
Survey)
Positive Respondents provide response on
a five point scale
Very Satisfied :5
Satisfied :4
Neither satisfied nor dissatisfied :3
Dissatisfied :2
Strongly Dissatisfied :1
Final score to be used would be
the proportion of respondents
who rate `4’ or `5’ (agree or
strongly agree)
35. Availability of roads
a. connectivity
(rural areas)
b. Condition of
% of people (urban)
reporting satisfaction on the
quality of roads in their town
Primary
(Citizen’s
Survey)
Positive Respondents provide response on
a five point scale
Very Satisfied :5

State of Governance - A Framework for Assessment
68
Sl. No. Component Sl.
No.
Indicators Description Type of Data
Source
Likely
effect on
quality of
governance
Measurement
roads (urban
areas)
% of people (rural) reporting
satisfaction on the quality of
roads connecting their village
to nearest town
Satisfied :4
Neither satisfied nor dissatisfied :3
Dissatisfied :2
Strongly Dissatisfied :1
Final score to be used would be
the proportion of respondents
who rate `4’ or `5’ (agree or
strongly agree)
36. Availability of
transport facilities
a. % of people reporting
satisfaction on the
availability of
transportation facilities for
local travel (urban)
b. % of people reporting
satisfaction on the
availability of
transportation facilities for
travel out of village (rural)
Primary
(Citizen’s
Survey)
Positive Respondents provide response on
a five point scale
Very Satisfied :5
Satisfied :4
Neither satisfied
nor dissatisfied :3
Dissatisfied :2
Strongly Dissatisfied :1
Final score to be used would be
the proportion of respondents
who rate `4’ or `5’ (agree or
strongly agree)
1.4 Corruption Perception,
Vigilance &
37. Incidence of bribery
involving
government officials
Proportion of respondents who
mention they have paid bribe
to government officials for any
Primary
(Citizen’s
Survey)
Negative Respondents provide response on a
Yes‐No scale

State of Governance - A Framework for Assessment
69
Sl. No. Component Sl.
No.
Indicators Description Type of Data
Source
Likely
effect on
quality of
governance
Measurement
Enforcement service received in the last one
year
Yes :1
No :2
Final score to be used would be the
100% minus proportion of
respondents who mention `Yes’
38. Corruption trends Proportion of respondents who
mention that over the last three
years corruption has reduced
Primary
(Citizen’s
Survey)
Positive Respondents provide response on a
Yes‐No scale
Yes :1
No :2
Final score to be used would be the
proportion of respondents who
mention `Yes’
39. Efficacy of the State
Vigilance
Commission
Proportion of cases where State
Government did not accept
recommendations of the State
Vigilance Commission
Secondary Negative Score to be used would be the 100%
minus actual proportion as
reported
40. Conviction rate of
Anti‐Corruption
Bureau
Proportion of cases in which
conviction was secured by
Anti‐Corruption Bureau
Secondary Positive Score to be recorded on a five
point scale and corresponding
percentage to be assigned
Less than 10% :1 (20%)
10% to 19% :2 (40%)
20% to 29% :3 (60%)

State of Governance - A Framework for Assessment
70
Sl. No. Component Sl.
No.
Indicators Description Type of Data
Source
Likely
effect on
quality of
governance
Measurement
30% to 39% :4 (80%)
40% or more :5 (100%)
41. Profile of
prosecutions by
Anti‐Corruption
Bureau
Proportion of prosecutions
pertaining to All India Service
Officers & Heads of
Departments (HoDs) out of
total number of prosecutions
during last 3 years
Secondary Positive Score to be recorded on a five
point scale and corresponding
percentage to be assigned
Less than 10% :1 (20%)
10% to 19% :2 (40%)
20% to 29% :3 (60%)
30% to 39% :4 (80%)
40% or more :5 (100%)
42. Disposal rate of
departmental
enquiries on
corruption
Average disposal rate (%) of
departmental enquiries on
corruption pertaining to Class I
officers during the last three
years (Total cases initiated in
last three years minus total
cases disposed)
Secondary
(If
information
is not
available, a
sample
survey of
departments
may be done)
Positive Score to be recorded on a five
point scale and corresponding
percentage to be assigned
Less than 20% :1 (20%)
20% to 39% :2 (40%)
40% to 59% :3 (60%)
60% to 79% :4 (80%)
80% or more :5 (100%)

State of Governance - A Framework for Assessment
71
Economic Dimension of Governance
Mapping into Component, Sub Components and Indicators
Governance
Dimensions Component
Types of indicators
Primary Secondary Total
Economic
Fiscal Governance 1 4 5
Business Environment
8 0 8
Support to the Primary Sector 5 0 5
Total 14 4 18

State of Governance - A Framework for Assessment
72
Economic Dimension
Sl.
No
.
Component Sl.
No
.
Indicators Description Type of Data
Source
Likely effect
on quality of
governance
Measurement
1.1 Fiscal
Governance 1. Fiscal Dependency Own tax revenue as a
proportion of GSDP
Secondary Positive Score to be recorded on a five point
scale and corresponding percentage
to be assigned
Less than 5% :1 (20%)
5% to 7.5% :2 (40%)
7.6% to 10% :3 (60%)
10% to 12.5% :4 (80%)
More than 12.5% :5 (100%)
2. Development
Expenditure
Development expenditure as
proportion of GSDP
Secondary Positive Score to be recorded on a five point
scale and corresponding percentage
to be assigned
Less than 10% :1 (20%)
10% to 12.5% :2 (40%)
12.6% to 15% :3 (60%)
15% to 17.5% :4 (80%)
More than 17.5% :5 (100%)
3. Expenditure on
Wages and Salaries
Wages & salaries as a
proportion of total revenue
expenditure
Secondary Negative Score to be recorded on a five point
scale and corresponding percentage
to be assigned
More than 46% :1 (20%)
36% to 45% :2 (40%)

State of Governance - A Framework for Assessment
73
Sl.
No
.
Component Sl.
No
.
Indicators Description Type of Data
Source
Likely effect
on quality of
governance
Measurement
26% to 35% :3 (60%)
16% to 25% :4 (80%)
Less than 15% :5 (100%)
4. Debt Liability Debt as a proportion of GSDP Secondary Negative Score to be recorded on a five point
scale and corresponding percentage
to be assigned
More than 50% :1 (20%)
41% to 50% :2 (40%)
31% to 40% :3 (60%)
21% to 30% :4 (80%)
Less than 20% :5 (100%)
5. Quality of fiscal
governance
Proportion of respondents
who believe that the
government has managed the
finances of the State in a
proper manner
Primary
(Citizen’s
Survey)
Positive Respondents provide response on a
five point scale
Strongly agree :5
Agree :4
Neither agree
nor disagree :3
Disagree :2
Strongly disagree :1
Final score to be used would be the
proportion of respondents who rate
`4’ or `5’ (agree or strongly agree)
1.2 Business
Environment 6. Investment climate Proportion of respondents
who rate the investment
Primary
(Business
Positive Respondents rate the investment
climate on a five point scale

State of Governance - A Framework for Assessment
74
Sl.
No
.
Component Sl.
No
.
Indicators Description Type of Data
Source
Likely effect
on quality of
governance
Measurement
climate in the State as good or
excellent
Survey)
Excellent :5
Good :4
Fair :3
Poor :2
Very Poor :1
Final score to be used would be the
proportion of respondents who rate
`4’ or `5’ (agree or strongly agree)
7. Single‐window
facility for investors
Proportion of respondents
who rate the quality of
functioning of the single‐
window facility as good or
very good
Primary
(Business
Survey)
Positive Respondents rate the single‐window
facility on a five point scale
Very Good :5
Good :4
Fair :3
Poor :2
Very Poor :1
Final score to be used would be the
proportion of respondents who rate
`4’ or `5’ (agree or strongly agree)
State not having single window
facility get zero (no marks)
8. Ease of registering a
business
Proportion of respondents
who say it is easy to register a
business in the State
Primary
(Business
Survey)
Positive Respondents provide response on a
five point scale

State of Governance - A Framework for Assessment
75
Sl.
No
.
Component Sl.
No
.
Indicators Description Type of Data
Source
Likely effect
on quality of
governance
Measurement
Strongly agree :5
Agree :4
Neither agree
nor disagree :3
Disagree :2
Strongly disagree :1
Final score to be used would be the
proportion of respondents who rate
`4’ or `5’ (agree or strongly agree)
9. Availability of
skilled labour
Proportion of respondents
who say there is adequate
availability of skilled labour
Primary
(Business
Survey)
Positive Respondents provide response on a
five point scale
Strongly agree :5
Agree :4
Neither agree
nor disagree :3
Disagree :2
Strongly disagree :1
Final score to be used would be the
proportion of respondents who rate
`4’ or `5’ (agree or strongly agree)
10. Access to credit Proportion of respondents
who say it is easy to access
credit in the State
Primary
(Business
Survey)
Positive Respondents provide response on a
five point scale
Strongly agree :5

State of Governance - A Framework for Assessment
76
Sl.
No
.
Component Sl.
No
.
Indicators Description Type of Data
Source
Likely effect
on quality of
governance
Measurement
Agree :4
Neither agree
nor disagree :3
Disagree :2
Strongly disagree :1
Final score to be used would be the
proportion of respondents who rate
`4’ or `5’ (agree or strongly agree)
11. Quality of physical infrastructure
Proportion of respondents
who say the quality of
physical infrastructure
provided (such as electricity,
water, transport,
communication etc.) is good
Primary
(Business
Survey)
Positive Respondents provide response on a
five point scale
Strongly agree :5
Agree :4
Neither agree
nor disagree :3
Disagree :2
Strongly disagree :1
Final score to be used would be the
proportion of respondents who rate
`4’ or `5’ (agree or strongly agree)
12. Quality of Procurement process
for business
contracts
Proportion of respondents
who say the process of
procurement for business
contracts is fair and
transparent
Primary
(Business
Survey)
Positive Respondents provide response on a
five point scale
Strongly agree :5
Agree :4

State of Governance - A Framework for Assessment
77
Sl.
No
.
Component Sl.
No
.
Indicators Description Type of Data
Source
Likely effect
on quality of
governance
Measurement
Neither agree
nor disagree :3
Disagree :2
Strongly disagree :1
Final score to be used would be the
proportion of respondents who rate
`4’ or `5’ (agree or strongly agree)
13. Incidence of bribery for business
purposes
Proportion of respondents
who say they had to pay
bribes to government officials
for business purposes in the
last one year
Primary
(Business
Survey)
Negative Respondents provide response on a
Yes‐No scale
Yes :1
No :2
Final score to be used would be the
100% minus proportion of
respondents who mention `Yes’
1.3 Support to the
Primary sector 14. Rural indebtedness Proportion of small &
marginal farmer households
(owning up to 2 hectares)
who are indebted
Primary
(Citizen’s
Survey ‐
Farmers)
Negative Score to be recorded on a five point
scale and corresponding percentage
to be assigned
More than 60% :1 (20%)
51% to 60% :2 (40%)
41% to 50% :3 (60%)
31% to 40% :4 (80%)
Less than 30% :5 (100%)
15. Quality of extension Proportion of respondents Primary Positive Respondents rate the quality of

State of Governance - A Framework for Assessment
78
Sl.
No
.
Component Sl.
No
.
Indicators Description Type of Data
Source
Likely effect
on quality of
governance
Measurement
and marketing
services
who say the quality of
marketing & extension
services provided by
government is good or very
good
(Citizen’s
Survey ‐
Farmers)
extension services on a five point
scale
Very Good :5
Good :4
Fair :3
Poor :2
Very Poor :1
Final score to be used would be the
proportion of respondents who rate
`4’ or `5’ (good or very good)
16. Quality of agricultural inputs
Proportion of respondents
who say the quality of
agricultural inputs provided
by the government is good or
very good
Primary
(Citizen’s
Survey ‐
Farmers)
Positive Respondents rate the quality of
agricultural inputs on a five point
scale
Very Good :5
Good :4
Fair :3
Poor :2
Very Poor :1
Final score to be used would be the
proportion of respondents who rate
`4’ or `5’ (good or very good)
17. Quality of irrigation facilities / water
Proportion of respondents
who say the quality of
Primary
(Citizen’s
Positive Respondents rate the quality of
irrigation facilities on a five point

State of Governance - A Framework for Assessment
79
Sl.
No
.
Component Sl.
No
.
Indicators Description Type of Data
Source
Likely effect
on quality of
governance
Measurement
availability for
farming
irrigation facilities provided
by the government is good or
very good
Survey ‐
Farmers)
scale
Very Good :5
Good :4
Fair :3
Poor :2
Very Poor :1
Final score to be used would be the
proportion of respondents who rate
`4’ or `5’ (good or very good)
18. Quality of credit facility
Proportion of respondents
who say the quality of credit
facility extended by the
government institutions and
banks is good or very good
Primary
(Citizen’s
Survey ‐
Farmers)
Positive Respondents rate the quality of
credit facility on a five point scale
Very Good :5
Good :4
Fair :3
Poor :2
Very Poor :1
Final score to be used would be the
proportion of respondents who rate
`4’ or `5’ (good or very good)

State of Governance - A Framework for Assessment
80
Social Dimension of Governance
Mapping into Component, Sub Components and Indicators
Governance
Dimension Components
Types of Indicators
Primary Secondary Total
Social
1. Welfare of the Poor & Vulnerable 6 1 7
2. Role of Civil Society and Media 8 0 8
3. Environmental Management 1 1 2
Total 15 2 17

State of Governance - A Framework for Assessment
81
Social Dimension
Sl.
No.
Component Sl.
No.
Indicators Description Type of
Data Source
Likely effect
on quality of
governance
Measurement
1.1 Welfare of the
Poor &
Vulnerable
sections
1. Addressing the
needs of the poor
Proportion of respondents
(BPL) who felt that the
government has adequately
addressed the needs of the
poor
Primary
(Citizen’s
Survey –
BPL)
Positive Respondents provide response on a
five point scale
Strongly agree :5
Agree :4
Neither agree
nor disagree :3
Disagree :2
Strongly disagree :1
Final score to be used would be the
proportion of respondents who rate
`4’ or `5’ (agree or strongly agree)
2. Nutrition Status Underweight rates among
0‐3 year old children
Secondary Negative Score to be recorded on a five point
scale and corresponding percentage
to be assigned
More than 40%% :1 (20%)
31% to 40% :2 (40%)
21% to 30% :3 (60%)
11% to 20% :4 (80%)
10% or less :5 (100%)
3. BPL households
owning BPL cards
Proportion of respondents
(BPL) who own BPL cards
Primary
(Citizen’s
Positive Respondents provide response on a
Yes‐No scale (To be verified

State of Governance - A Framework for Assessment
82
Sl.
No.
Component Sl.
No.
Indicators Description Type of
Data Source
Likely effect
on quality of
governance
Measurement
for PDS
entitlements
for subsidised food grains
through ration shops
Survey –
BPL)
physically)
Yes :1
No :2
Final score to be used would be the
proportion of respondents who
mention `Yes’
4. Old age & widow
pensions benefits
% of target BPL beneficiaries
getting old age & widow
pensions benefits
Primary
(Citizen’s
Survey –
BPL)
Positive Respondents provide response on a
Yes‐No scale (To be verified
physically)
Yes :1
No :2
Final score to be used would be the
proportion of respondents who
mention `Yes’
5. Addressing the
welfare needs of
women & children
Proportion of respondents
who felt that the government
has adequately addressed the
welfare needs of women &
children
Primary
(Citizen’s
Survey –
Women)
Positive Respondents provide response on a
five point scale
Strongly agree :5
Agree :4
Neither agree
nor disagree :3
Disagree :2
Strongly disagree :1

State of Governance - A Framework for Assessment
83
Sl.
No.
Component Sl.
No.
Indicators Description Type of
Data Source
Likely effect
on quality of
governance
Measurement
Final score to be used would be the
proportion of respondents who rate
`4’ or `5’ (agree or strongly agree)
6. Freedom to practice
one’s religion
Proportion of respondents
who say they have the
freedom to practice their
religion
Primary
(Citizen’s
Survey)
Positive Respondents provide response on a
five point scale
Strongly agree :5
Agree :4
Neither agree
nor disagree :3
Disagree :2
Strongly disagree :1
Final score to be used would be the
proportion of respondents who rate
`4’ or `5’ (agree or strongly agree)
7. Absence of Social
Discrimination
Proportion of respondents
who say they do not face
discrimination in social life
due to their religious, social
or cultural identity
Primary
(Citizen’s
Survey)
Positive Respondents provide response on a
five point scale
Strongly agree :5
Agree :4
Neither agree
nor disagree :3
Disagree :2
Strongly disagree :1

State of Governance - A Framework for Assessment
84
Sl.
No.
Component Sl.
No.
Indicators Description Type of
Data Source
Likely effect
on quality of
governance
Measurement
Final score to be used would be the
proportion of respondents who rate
`4’ or `5’ (agree or strongly agree)
1.2 Role of Civil
Society &
Media
8. Civil Society
involvement in
policy formulation
% of CSOs/NGOs who report
that the government makes
consistent effort to involve
NGOs in policy formulation
Primary
(NGO
Survey)
Positive Respondents provide response on a
five point scale
Strongly agree :5
Agree :4
Neither agree
nor disagree :3
Disagree :2
Strongly disagree :1
Final score to be used would be the
proportion of respondents who rate
`4’ or `5’ (agree or strongly agree)
9. CSOs/NGOs
involvement in
programme
implementation or
monitoring &
evaluation of
programmes
% of CSOs/NGOs who report
that the government makes
consistent effort to involve
NGOs in programme
implementation or
monitoring & evaluation of
programmes
Primary
(NGO
Survey)
Positive Respondents provide response on a
five point scale
Strongly agree :5
Agree :4
Neither agree
nor disagree :3
Disagree :2
Strongly disagree :1
Final score to be used would be the

State of Governance - A Framework for Assessment
85
Sl.
No.
Component Sl.
No.
Indicators Description Type of
Data Source
Likely effect
on quality of
governance
Measurement
proportion of respondents who rate
`4’ or `5’ (agree or strongly agree)
10. Political /
Bureaucratic
interference in the
functioning of
CSOs/NGOs by
elected
representatives
Proportion of CSOs/NGOs
who feel there is less or very
less political / bureaucratic
interference in the
functioning of NGOs
Primary
(NGO
Survey)
Negative Respondents provide response on a
five point scale
Very High :5
High :4
Average :3
Less :2
Very Less :1
Final score to be used would be the
proportion of respondents who rate
`1’ or `2’ (low or very low)
11. Incidence of bribes paid by
CSOs/NGOs
% of CSOs/NGOs reported
giving bribes to politicians /
administrators in last one
year
Primary
(NGO
Survey)
Negative Respondents provide response on a
Yes‐No scale
Yes :1
No :2
Final score to be used would be the
100% minus proportion of
respondents who mention `Yes’
12. Independent
functioning of
media
Proportion of respondents
who feel that the government
allows the media to function
independently
Primary
(Media
Survey)
Positive Respondents provide response on a
five point scale
Strongly agree :5

State of Governance - A Framework for Assessment
86
Sl.
No.
Component Sl.
No.
Indicators Description Type of
Data Source
Likely effect
on quality of
governance
Measurement
Agree :4
Neither agree nor disagree :3
Disagree :2
Strongly disagree :1
Final score to be used would be the
proportion of respondents who rate
`4’ or `5’ (agree or strongly agree)
13. Political /
bureaucratic
interference in the
functioning of the
media
Proportion of respondents
who feel there is less or very
less political / bureaucratic
interference in the
functioning of the media
Primary
(Media
Survey)
Negative Respondents provide response on a
five point scale
Very High :5
High :4
Average :3
Less :2
Very Less :1
Final score to be used would be the
proportion of respondents who rate
`1’ or `2’ (low or very low)
14. Extent of freedom
from business
interests
Proportion of media
respondents who feel that the
influence of business
interests on the media is less
or very less
Primary
(Media
Survey)
Positive Respondents provide response on a
five point scale
Very High :5
High :4
Average :3
Less :2
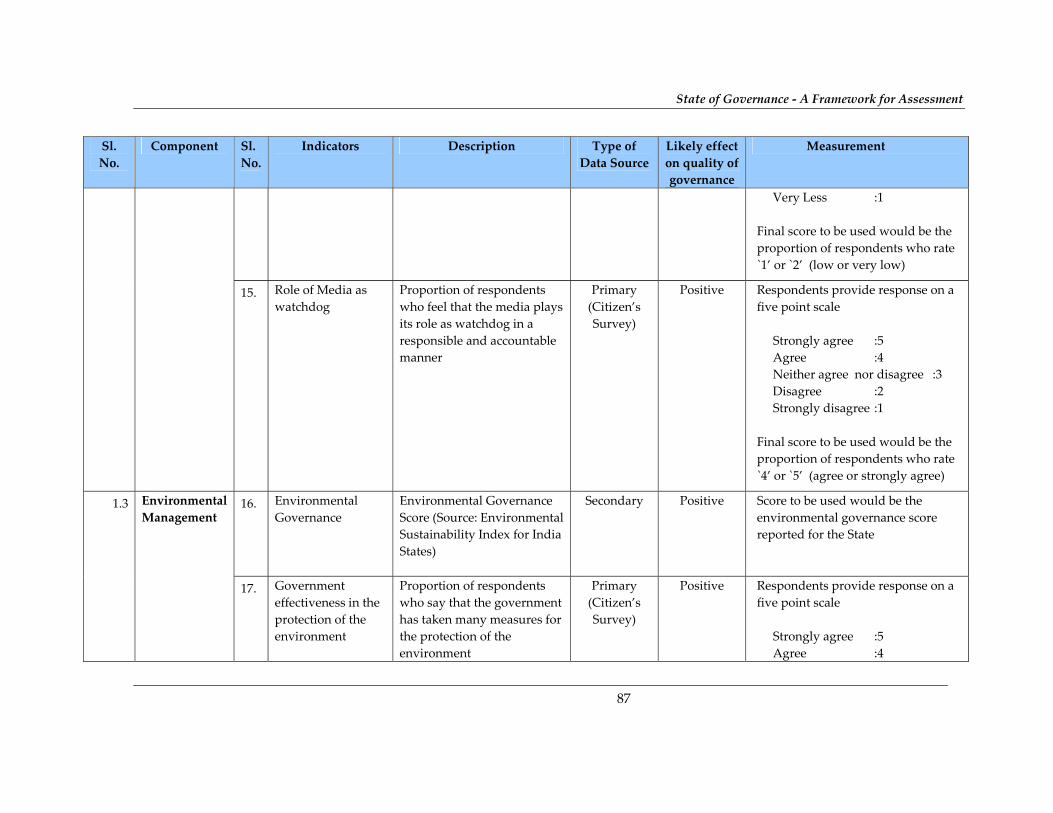
State of Governance - A Framework for Assessment
87
Sl.
No.
Component Sl.
No.
Indicators Description Type of
Data Source
Likely effect
on quality of
governance
Measurement
Very Less :1
Final score to be used would be the
proportion of respondents who rate
`1’ or `2’ (low or very low)
15. Role of Media as
watchdog
Proportion of respondents
who feel that the media plays
its role as watchdog in a
responsible and accountable
manner
Primary
(Citizen’s
Survey)
Positive Respondents provide response on a
five point scale
Strongly agree :5
Agree :4
Neither agree nor disagree :3
Disagree :2
Strongly disagree :1
Final score to be used would be the
proportion of respondents who rate
`4’ or `5’ (agree or strongly agree)
1.3 Environmental
Management 16. Environmental
Governance
Environmental Governance
Score (Source: Environmental
Sustainability Index for India
States)
Secondary Positive Score to be used would be the
environmental governance score
reported for the State
17. Government
effectiveness in the
protection of the
environment
Proportion of respondents
who say that the government
has taken many measures for
the protection of the
environment
Primary
(Citizen’s
Survey)
Positive Respondents provide response on a
five point scale
Strongly agree :5
Agree :4

State of Governance - A Framework for Assessment
88
Sl.
No.
Component Sl.
No.
Indicators Description Type of
Data Source
Likely effect
on quality of
governance
Measurement
Neither agree nor disagree :3
Disagree :2
Strongly disagree :1
Final score to be used would be the
proportion of respondents who rate
`4’ or `5’ (agree or strongly agree)

State of Governance - A Framework for Assessment
89
Conclusion
Economic growth is about increasing the size of the pie, while equity ensures that
everybody has a piece of it. The quality of governance can affect both these outcomes,
positively or adversely. For governance to result in positive development outcomes, it is
necessary to understand how it works in different spheres – political, legal‐judicial,
administrative, economic and social‐environmental. Hence the need to measure it.
There has been an explosive growth in governance assessments. A host of organizations
routinely rank countries on various governance parameters based on a given set of
indicators. The methodology followed for assessing governance varies from subjective
perceptions of experts on the one extreme to hard data on the other. The limitations of not
only the indicators themselves but also the methodologies are well recognized.
It is a challenge to come up with a new framework for assessing governance given the
complexity and controversy involving the subject. The framework suggested in this report
tries to provide a sound conceptual basis for deconstructing governance and the indicators
to measure it based on international and our own experience. It adopts a rights based
approach enshrined in India’s Constitution and is avowedly from the perspective of poor
and weaker sections of society.
Due to limitations of the project design, sample size had to be small. However, when this is
undertaken by a State, the sample sizes can be sufficiently large to provide a more granular
picture of governance as seen by poor, weaker sections or minorities. There are problems
in gathering secondary data, especially those that are considered sensitive. It must be
recognized that there will initially be problems with data as there may be no system of
recording some data presently. However, with time State organizations would find
incentives or be forced to keep such data. If the assessment highlights the absence of data
in some critical areas, that itself would one of its significant outcomes.
It is hoped that State Governments come forward to adopt and use the framework, not
with a view to make political capital of it but to understand weaknesses and constraints
that undermine the quality of governance in a particular sphere. While doing so, the State
Government must accord highest importance to transparency and fairness in the design of
the study, in data collection & analysis and in reporting. The use of competent,
independent and well‐reputed agencies is suggested. Ultimately, the use of this framework
will be the first test of quality of governance in the State.

State of Governance - A Framework for Assessment
90
Annexure: Assessing governance – International Discourse and Practice
Governance assessment involves in a majority of cases measuring a given concept (slice) of
governance. For example, International Country Risk Guide (ICRG) measures corruption,
law and order and bureaucratic quality; Business Environmental Risk Intelligence (BERI)
measures bureaucratic delays, contract enforceability and policy stability; Heritage
Foundation assesses property rights, black market and regulation; World Development
Report evaluates policy unpredictability, quality of government services, corruption and
red tape; Freedom House measures political freedoms and civil liberties. There are very
few cases which measure governance along all its dimensions. The most famous among the
governance assessment at aggregate level is the World Bank Institute’s Kaufmann, Kraay
and Zoido‐Lobaton (popularly referred to as KKZ) which uses the individual governance
indicator scores generated by different organizations and statistically aggregates them.
There are other attempts at measuring governance comprehensively which are discussed
below.
International Country Risk Guide:
Started in 1980, it is one of the most important governance indicators for international investors. ICRG
ranking is ‘designed to assess financial, economic and political risks in countries, and to compare them between
countries [in order to] to meet the needs of clients for an analysis of the potential risks to international
business operations.’ While financial and economic risk indicators are based entirely on objective
measurement (e.g. ratios of foreign debt to GDP, current account balance to exports), the political risks are
based in experts’ subjective interpretation of pre‐specified risk ‘components’ such as government’s apparent
ability to stay in office, political violence and conflict, etc. It provides ratings for 140 countries on a monthly
basis and offers one‐year and five‐year assessments with projections framed in ‘best case’ and ‘worst case’
scenarios.
Freedom House
Freedom House provides annual ratings of political rights and civil liberties in 192 countries which are
widely used by journalists, academics and analysts. The ratings are based on experts’ answers to a set of
questions. The political rights checklist comprises ten questions divided into three categories: the electoral
process; political pluralism; and participation. The checklist on civil liberties comprises 15 questions in four
categories: the freedom of expression and belief; peoples’ rights to associate and organize; the rule of law; and personal
autonomy and individual rights.
Transparency International
The best known governance indicator of all, TI’s Corruption Perception Indicator (CPI) available since 1995
is used by investors, donors, analysts and academics. The CPI is based on surveys of perception of residents,
non‐resident business people and expert assessments. The 2005 CPI ranked 159 countries based on the
results if 16 surveys and expert assessments undertaken by 10 different organizations between 2003 and
2005.

State of Governance - A Framework for Assessment
91
The World Bank
The World Bank produces Country Policy and Institutions Assessments (CPIAs). The CPIAs comprise 16
criteria a divided into four clusters:
Cluster Criteria
Economic Management: 1 Macro‐economic management
2 Fiscal policy
3 Debt policy
Structural Policies: 4 Trade policies,
5 Financial sector policies
6 Business regulatory environment
Social inclusion and equity: 7 Gender equality
8 Equity of public resource use
9 Building human resource
10 Social protection and labour
11 Policies and institutions for environmental sustainability
Public sector management 12 Property rights and rule‐based governance,
and Institutions: 13 Quality of budgetary and financial management
14 Efficiency of revenue mobilization,
15 Quality of public administration
16 Transparency‐accountability‐corruption in the public sector
The ratings are given by the World Bank’s country team on scale of 1 to 6 on each of the criteria with each
cluster having same weight (though the criteria have different weights).
World Governance Indicators (WGI) World Bank Institute
The most well known initiative is by the World Bank Institute which measures governance by aggregating
data from diverse secondary sources from more than 160 countries around six aspects of governance:
1. Voice and accountability, the extent to which a country’s citizens are able to participate in selecting their
government, as well as freedom of expression, freedom of association, and a free media
2. Political stability and absence of violence, perceptions of the likelihood that the government will be
destabilized or overthrown by unconstitutional or violent means, including domestic violence and
terrorism
3. Government effectiveness, the quality of public services, the quality of the civil service and the degree of its
independence from political pressures, the quality of policy formulation and implementation, and the
credibility of the government’s commitment to such policies
4. Regulatory quality, the ability of the government to formulate and implement sound policies and
regulations that permit and promote private sector development
5. Rule of law, the extent to which agents have confidence in and abide by the rules of society, and in
particular the quality of contract enforcement, the police, and the courts, as well as the likelihood of
crime and violence
6. Control of corruption, the extent to which public power is exercised for private gain, including both petty
and grand forms of corruption, as well as “capture” of the state by elites and private interests

State of Governance - A Framework for Assessment
92
The model also uses a different set of attributes (ʹhypothetical determinants of governanceʹ) for aggregation
ʹusing the methodology of unobserved componentsʹ such as transparency, quality of rules, enforcement,
meritocracy, politicization, wage satisfaction, voice, mission, service performance, service access, resources
and audit. The WGI indicators are composite indicators in the sense that they are constructed from
hundreds of existing perception indicators derived from 37 different data sources produced by 31 different
organizations.
United Nations University ‐ World Governance Survey
Most governance assessments are based on subjective (perceptions) impressions of governance by a small
number of country, sector, and regional experts (e.g. Freedom House, Economist Intelligence Unit, etc.)
Some others undertake cross‐country surveys of citizens (Gallup International and World Economic Forum).
While expert opinions are prone to be biased by ideological agenda of the rating organization, public
surveys of citizens have the disadvantage of a) being highly context specific which make cross country
comparisons difficult and b) citizens in general may not be able to give credible answers for lack of in depth
knowledge or understanding of specific governance issues. The WGS uses a cross section of local experts or
Well Informed Persons (WIPs) in the country.
WGS disaggregates the political process (governance) into the following six stages or arenas:
Civil Society, where citizens become aware of and may raise issues for the attention of political authorities;
Political Society, where issues are aggregated by political parties and legislatures;
Government, where stewardship of the system as a whole tends to lie;
Bureaucracy, where policies are prepared and implemented;
Economic Society, where relations between state and the market are determined;
Judiciary, where disputes are settled.
These are treated as functional categories that can be found in any political system. Drawing on the
governance literature and Universal Declaration of Human Rights, the following six principles that are
closest to ‘universal’ values have been identified:
Participation
Fairness
Decency
Accountability
Transparency
Efficiency
The last three principles refer specifically to how the officials behave in public office and the first three
principles to the way they interact with citizens.
International Institute of Democracy and Electoral Assistance (IDEA) Framework
The IDEA state of Democracy framework is founded on two fundamental democratic principles viz.
a) popular control over public decision making and decision makers,
b) equality of respect and voice between citizens in the exercise of that control
These two principles are then expressed through the following seven mediating values:
i) participation;

State of Governance - A Framework for Assessment
93
ii) authorisation;
iii) representation;
iv) accountability;
v) transparency;
vi) responsiveness;
vii) solidarity
The achievement of these mediating values in turn relies on a series of requirements and institutional means
with which to realise them. The combination of principles and values yields four main pillars of assessment
each with additional subcategories of analysis, which are used to orient the entire assessment project.
Main Pillars of Democracy Assessment
Main Pillars Sub‐Categories
Citizenship, Law, and Rights
Nationhood and citizenship
The rule of law and access to justice
Civil and political rights
Economic and social rights
Representative and
Accountable Government
Free and fair elections
Democratic role of political parties
Government effectiveness and accountability
Civilian control of the military and police
Minimizing corruption
Civil Society and Popular Participation
Media in a democratic society
Political participation
Government responsiveness
Decentralization
Democracy Beyond the State International dimensions of democracy
Fiji’s Governance Index
The appropriateness and effectiveness of a country’s institutions and its governance outcomes can be argued
to be reflected in various ways including political participation, voter awareness, transparency in
government accounts, media attention, and corruption. Given that governance outcomes are wide and
varied, such governance dimensions have been chosen that largely reflect the definitions of governance as
proposed by Kaufmann et al (2003), Kaufmann et al (1999), Neumayer (2002) and Polidano (2000). Using
these definitions as a guide, four core governance dimensions were formulated: the rule of law, government
effectiveness, regulatory quality, and social development. The dimensions of governance were expanded to
include aspects of societal welfare—a dimension that has not been captured by previous studies developing
measures of governance. Each of the four dimensions of governance has sub‐dimensions; and indicator
variables that are believed to directly or indirectly capture or reflect these sub‐dimensions of governance are
used in their measurement. The governance index developed is mostly based on hard data and so the choice
of core dimensions, sub‐dimensions and variables is dictated largely by the regular availability of data. It
was felt that while arguments may be made for other indicators of governance, they would be of no use if
appropriate data were unavailable.

State of Governance - A Framework for Assessment
94
Four core dimensions were chosen but this set is arbitrary. As previously mentioned, the choice of
dimensions was largely dictated by the availability of hard data. (Azmat Gani and Ron Duncan, Fiji’s
Governance Index)
Democratic Governance Indicators – Experience of Mongolia
A similar exercise in Mongolia (2006) done with the assistance of UNDP and International IDEA measured
governance through qualitative and qualitative approaches included the following aspects:
Perception and Evaluation of Democracy
Citizenship, Law, and Rights
Representative and Accountable Government
Civil Society and Popular Participation
Democracy beyond the State
Social‐Economic Background Variables
USAID (1998) seeks to measure governance along the following dimensions:
Rule of law;
Elections and Political Processes;
Civil Society; and
Transparency & Accountability
(Source: Dimensions of Governance Covered by UNDP Governance Indicators Users’ Guide)
Brief critique of existing models of governance assessment
From the various frameworks used for measuring governance detailed above, it is
observed that
a. all the frameworks deconstruct the governance concept into smaller elements which are
called by different names viz. clusters, aspects, arenas, stages, pillars, dimensions, etc.
b. The number of the broken down elements vary from four to seven.
c. Broadly, the dimensions of governance are seen to be:
Government effectiveness ‐ public sector management and institutions, public
administration, bureaucracy, control of corruption, etc.
Political governance – Voice and accountability, political stability, representative
and accountable government, elections and political processes, etc.
Social governance – social inclusion, civil society and popular participation, social
development, social protection, etc.
Legal and Judicial governance – Rule of law, regulatory quality, justice or
judiciary, etc.
Economic governance – Economic management
d. The method of assessment varies from case to case, but is largely based on subjective
assessment. If it is done by country team in case of World Bank, it is done through a

State of Governance - A Framework for Assessment
95
cross section of experts and well informed persons in case of WGS. On one extreme
Bangladesh governance assessment is based on studies by research scholars and on the
extreme the complete assessment is based on hard data in case of Fiji’s index.
Framework Governance
Elements are
referred as
Their
Number
Particulars Assessment
World Bank
Country Policy
and
Institutional
Assessment
(CPIA)
Clusters Four a. Economic Management
b. Structural Policies
c. Social inclusion and
equity
d. Public sector
management and
institutions
By WB country team on a
scale of 1‐6
World Bank
Institute
(WGI)
Aspects Six a. Voice and
Accountability
b. Political Stability and
absence of violence
c. Government
effectiveness
d. Regulatory quality
e. Rule of law
f. Control of corruption
Constructed from existing
perception indicators
derived from 37 different
data sources produced by
31 different organizations
United Nations
University
World
Government
Survey
Stages or
Arenas
Six a. Civil Society
b. Political Society
c. Government
d. Bureaucracy
e. Economic Society
f. Judiciary
By a cross section of local
experts or well informed
persons (WIPs)
International
IDEA
Framework
Pillars Four a. Citizenship, law and
rights
b. Representative and
accountable
government
c. Civil Society and
Popular Participation
d. Democracy Beyond the
state
Fiji’s
Governance
Index
Dimensions Four a. Rule of Law
b. Government
effectiveness
c. Regulatory quality
d. Social development
Secondary Data
USAID Dimension Four a. Rule of Law
b. Elections and Political
Processes
c. Civil Society
d. Transparency and
Accountability

State of Governance - A Framework for Assessment
96
Framework Governance
Elements are
referred as
Their
Number
Particulars Assessment
State of
Governance in
Bangladesh
2006
Dimension Seven a. Political Governance
b. Macroeconomic
Governance
c. Public Administration
d. Justice
e. Local governance
f. Civil Society
g. Social Protection
By Research Scholars
Although the governance assessment models discussed above provide a reasonably good
framework, they have certain limitations.
i. Most governance models do not provide a clear differentiation between governance
dimensions and governance characteristics / principles – i.e. they fail to differentiate
between what governance is composed of and what it should be characterized by. In
other words, no distinction is made between performance indictors that refer to quality
of governance in terms of a normative outcome (e.g. level of literacy) and process
indicators that refer to quality of governance in terms of how the outcomes are
achieved (e.g. whether the process of recruitment ensured equity and transparency).
Moreover, some of them (e.g. USAID) includes what are governance principles
(transparency and accountability) as a dimension of governance.
To illustrate, `conduct of elections’ is a critical component of political governance but it
should be characterised by `fairness’, `participation’ and `rule of law’. In other words,
the mere conduct of elections does not necessarily indicate good governance if they
have been conducted without fairness and transparency. As observed by Eva Poluha
and Mona Rosendahl ‘(This) western ‘promotion of democracy has been rather
uniform and ethnocentric, almost exclusively emphasizing multi‐party elections. Too
often, however, the western concern has ended once the elections have been carried
through. Thus election results, without any competition between individuals and with
opposition groups being prevented from participation, have been accepted without
comment.’
This report suggests an approach that differentiates between the two and also
integrates them into a holistic framework. The advantages that ensue are two‐fold:
Firstly, it helps provide specific and actionable inputs by helping identify basic
governance areas which require focussed attention; and
Secondly, it can be easily related to institutional nodes and governance agencies
responsible for specific functions
ii. Most approaches reflect a gap in linking the measurement dimensions to specific institutional
nodes. The WGS approach scores over other approaches in this regard.

State of Governance - A Framework for Assessment
97
iii. Most approaches provide cross‐country assessments and hence there are inherent limitations in
applying the same at a sub‐national level.
Cross‐country assessments do provide a wide umbrella of parameters, but are usually
hampered by the depth (specificities) of information required. Even in‐country
assessments, particularly in an Indian context, are likely to differ markedly at the
federal and state levels. Governance assessments at the state level must allow for
greater localised content which, apart from enabling comparative analysis, would
provide greater diagnostic value.
iv. Approaches to evolve a construct of governance by various multi‐lateral organisations
are to a certain extent influenced by their respective organisational mandates. Not only
are they dictated by the concerns of these organizations, their methodological
approaches are not always rigorous enough. While most of them are based on good
and reasonable time series data and are updated annually, some of them lack
transparency in coding, and have ideological biases. Transparency International and
Political Risk Services data are based on an unrepresentative sample of opinion. Some
like the World Bank Country Policy and Institutional Assessment (CPIA) that
measures policy quality is based on assessments by the Bank staff; they are hardly
impartial, external observers.2
v. As can be seen there are differences in definitions as well choice of indicators. They
reflect, among other things, the different interests and mandates of the agencies. The
UN, USAID, DFID and the EC emphasize the social and political aspects of
governance, highlighting the processes of participation and responsiveness (to the
needs of the people), democracy and human rights concerns. The banks and financial
institutions focus more on economic governance, prioritizing transparency,
accountability and (public sector) efficiency and effectiveness. Although transparency
and accountability are common concerns for all, corruption, public sector management
and the rule of law tend to feature more strongly in the governance programmes of the
financial institutions.
The UNDP Governance Indicators Users’ Guide 2004 presents an overview of currently
available governance indicators and data sources. More than half of the sources
provided at least some political indicators, ten provided some social indicators, ten
provided some economic indicators, most related explicitly to the interests of the
private sector and several focused primarily on corruption, four provided some
judicial indicators and six, including four specialist sources, provided media
indicators. Only five sources provide indicators related to gender.
2 Commitment to Good Governance, Development, and Poverty Reduction: Methodological Issues in the
evaluation of progress at national and local levels – A paper by Suchitra Punyaratabandhu, 2004

State of Governance - A Framework for Assessment
98
In order to develop indicators that reflect the different situation and experience of poor
people, data and indicators need to be disaggregated in terms of other socio‐economic
variables that reflect or define poverty or vulnerability. Poverty reduction is a principle
objective of development policy and good governance. Pro‐poor indicators will
provide valuable input to policy formulation and programme management,
monitoring and evaluation, as well as facilitating the participation of the poor in the
processes of governance. (Lorraine Corner)
Dimension
Description
Number of sources
providing indicators
Political
Political rights, development commitment, EU issues,
democracy, voice and accountability, government
effectiveness, political terror, state failure, parliament
19/34
Social
Gender discrimination/ women’s participation, workers
rights, human rights, security, role of civil society, NGOs,
socio‐cultural
10/34
Economic
– Business
corruption, business and finance, economic growth,
competitiveness, regulatory quality 10/34
Judicial Justice, rule of law 4/34
Media
freedom of the media, journalists killed, media staff killed
or imprisoned
6/34

State of Governance - A Framework for Assessment
99
Acknowledgments
Governance and its measurement is as complex a subject as it is contentious. Although
`governance’ as a subject in development discourse is of a relatively new origin, there is a
vast amount of literature available internationally on this subject, both at conceptual (as to
what it signifies) and practical (as to how to measure it) levels. The core study team
comprised Mr. A Srinivas Kumar, Team Leader and Mr. Vivek Misra, Programme
Coordinator from Centre for Good Governance (CGG), Hyderabad and Dr. CVS Prasad,
Mr. Tathagata Dasgupta and Ms. Pallavi Karnik from AC Nielsen‐ORGMARG. While the
team from CGG was involved in developing the strategic approach, the indicator
framework and its theoretical underpinnings, ACNielsen‐ORGMARG conducted the
survey and statistical analysis. The Team worked under the overall guidance of Dr. Rajiv
Sharma, IAS, Director General, Centre for Good Governance.
Shri Prithviraj Chavan, Minister of State for Prime Minister’s Office, Personnel, Public
Grievances and pensions provided overall guidance and encouragement for the study.
Our sincere thanks are due to Mrs. Rajni Rajdan, IAS, former Secretary to Government of
India, Mr. Ramesh. C. Misra, Secretary to Government of India, Mr D V Singh, Special
Secretary and Mr P K Jha, Joint Secretary, Department of Administrative Reforms & Public
Grievances (DAR&PG) for providing the direction and focus to the project. We would like
to acknowledge with gratitude the inputs of Mrs. Mamta Saxena, Director, Ministry of
Statistics and Programme Implementation, for fine tuning the methodology and statistical
analysis. We are also extremely thankful to Mr. C. R. Kamalanathan, IAS (Retd.) and ex‐
Secretary to Government of India for his inputs on the indicator framework.
We are grateful to Mr. J M Lyngdoh, Former Chief Election Commissioner, Mr. V. N. Kaul,
Comptroller and Auditor General of India and Mr. Jayaprakash Narayan, Member,
National Advisory Committee, GoI for sharing their views. We are also grateful to Prof. M.
Sridhar and his colleagues from NALSAR University of Law, Hyderabad for providing key
inputs on legal and judicial dimension of governance.
The draft indicator framework and proposed methodology was discussed in a workshop
which was attended by eminent persons and representatives from government
organisations, academia and civil society. We are grateful to following participants of the
workshop for their valuable inputs: Mr K Y Narasimhan, Consultant, DAR&PG, Mr. P. K.
Gera, Commissioner of Training, & Director General, SPIPA, General Administration
Department, Government of Gujarat, Mr. R. J. Shah, Joint Director, Monitoring
Commissionerate of Rural Development, Government of Gujarat, Dr. V. Vijayakumar,
Registrar & Professor of Law, National Law School University (NLSU), Bangalore, Prof.
Trilochan Sastry, Indian Institute of Management, Bangalore, Prof. Debi Misra, IRMA,
Anand, Mr. Durga Prasad, Consultant, Adam Smith International, Mr Gautam Pingle and
Mr Mohammed A. Abid, Head & Asst. Professor respectively at Centre for Public Policy
and Governance, Administrative Staff College of India, Hyderabad, Mr Satyanarayana

State of Governance - A Framework for Assessment
100
and Mr Prasanth V. Regy from BASIX and Mr Avinash Samal from Byrraju Foundation,
Hyderabad.
The final State of Governance framework was discussed in a national workshop which was
moderated by Prof Bibek Debroy, who has done extensive work in this area. The workshop
was attended by senior officers from Government of India, eminent persons from Civil
Society Organizations and multilateral donor agencies. We are grateful to Prof Debroy and
the following participants of the workshop who provided fresh insights and perspectives
on governance and the proposed framework: Mr. Rajesh Tandon, PRIA; Mrs.
Ramachandran, IAS, Additional Secretary, Department of Expenditure, GoI; Dr Nagesh
Singh, Adviser, Planning Commission; Sri B B Pandit, Director General, Office of
Comptroller and Auditor General of India, Smt Ranjini Sreekumar, IAS Principal Secretary,
Administrative Reforms, Government of Karnataka; Sri Mukesh Sharma; Ms Vibha Puri
Dass; Sri R V Suthar; Sri Anil Chaplot; Sri S K Bansal; Mr Peter Evans, Senior Governance
Advisor and Mr Pankaj Jain from DFID; Sri CK Koshy IAS (Retd.), Consultant, Adam
Smith International.

State of Governance - A Framework for Assessment
101
Bibliography/ References
1. Adeel Malik. State of Art in Governance Indicators (Background Paper for HDR 2002) –Human Development Report Office, UNDP
2. Amitabh Behar, et al ed. Social Watch India, Citizens report on Governance and Development, 2006.
3. Azmat Gani and Ron Duncan, Fiji’s Governance Index, University of South Pacific, Suva, Fiji Islands
4. Bibek Debroy Ed. Agenda for Improving Governance,, 2004, Academic Foundation.
5. Centre for Governance Studies, BRAC University and BRAC Research and Evaluation Division. The State of Governance in Bangladesh, 2006.
6. Christine Arndt and Charles Oman, Uses and Abuses of Governance Indicators, OECD, 2006
7. Department of Administrative Reforms & Public Grievances, Government of India, Model Code for Governance, 2005.
8. Dirk Berg‐Schlosser. Indicators of Democracy and Good Governance as Measures of the quality of democracy in Africa: A critical appraisal, Acta Politica, 2004
9. Eva Poluha and Mona Rosendahl ed. Contesting ‘Good’ Governance – Cross‐cultural perspectives on representation, accountability and public space
10. Governance Indicators: A Users’ Guide, UNDP
11. Handbook on Democratic Governance Indicators: Method, process and lessons learned from Mongolia, UNDP
12. Hyden G., Court J. and Kenneth Mease. Making Sense of Governance: The Need for Involving Local Stakeholders, 2004
13. Julius Court, Goran Hyden and Ken Mease. Assessing Governance: Methodological Challenges World Governance Survey Discussion Paper 2 (August 2002) ‐ United Nations University
14. Kaufmann D., Aart Kray and Pablo Zoido‐Lobaton. Aggregating Governance Indicators,, World Bank Institute, October 1999.
15. Kaufmann D., Kraay A. and Mastruzzi M. Governance Matters V: Governance Indicators for 1996‐2005 , World Bank Institute, 2006.
16. Kaufmann D., Recenatini F. and Biletsky S. Assessing Governance: Diagnostic Tools and Applied Methods for Capacity Building and Action Learning; World Bank Institute, 2002.
17. Lorraine Corner. Gender‐sensitive and pro‐poor indicators for good governance, UNDP
18. Nirvikar Singh, Department of Economics, University of California, USA. On Federalism and Reform in India.
19. Planning Commission, GoI. Eleventh Five Year Plan Document ( Volume 1, Chapter 10) ‐ Governanc’.

State of Governance - A Framework for Assessment
102
20. Planning Commission, GoI. Tenth Five Year Plan Document (Volume 1, Chapter 6) ‐ Governance & Implementation.
21. Rajesh Tandon and Ranjita Mohanty ed. Does Civil Society Matter? Governance in Contemporary India.
22. Steven Van De Walle. Measuring Bureaucratic quality in Governance indicators
23. Suchitra Punyaratabandhu. Commitment to Good Governance, Development, and Poverty reduction: Methodological Issues in the evaluation of progress at National and Local levels –
2004.
24. World Development Report. The State in a Changing World, 1997.
25. World Governance Survey Discussion Paper 10. Governance in 16 Developing Countries. Overseas Development Institute, 2003.