state of happiness in hong kong 2006 an ihss study lok sang ho centre for public policy studies...
TRANSCRIPT

State of Happiness in State of Happiness in Hong KongHong Kong 2006 2006
An IHSS StudyAn IHSS StudyLok Sang HoLok Sang Ho
Centre for Public Policy StudiesCentre for Public Policy StudiesLingnan UniversityLingnan University

How happy are HK people?How happy are HK people?
Question: Question:
Overall, How happy are you? Overall, How happy are you?
0 indicates very unhappy 0 indicates very unhappy
10 indicates very happy10 indicates very happy
The score is then multiplied by100The score is then multiplied by100

Are you happier over the last 10 years?Are you happier over the last 10 years?
Question: Question:
Are you happier over the last 10 years? Are you happier over the last 10 years?
0 ------------------------ 5 -----------------0 ------------------------ 5 ----------------- 10 10 (Happiness Decreased (Happiness Decreased
a lot) (No change) (Increased a lot)a lot) (No change) (Increased a lot)
The score is then multiplied by 100The score is then multiplied by 100

Happiness Index & Are HK people happier Happiness Index & Are HK people happier over the last 10years, 2005 & 06over the last 10years, 2005 & 06
Happiness Index andAre HK people happiner over the last 10 years, 2005 and 2006
0
10
20
30
40
50
60
70
80
90
100
Happiness Index Happier over the last 10 years
Inde
x
2005
2006 58.91n=816
61.28n=704
70.58n = 815
71.38n = 706

Happiness Index by Age GroupsHappiness Index by Age Groups 20062006
69.86n=153
71.12n=372
70.58n=257
50
55
60
65
70
75
80
21-29 30-49 50 or above
Happiness Index by Age

Main Findings in 2006 SurveyMain Findings in 2006 Survey
Overall reading is 70.Overall reading is 70.5858, still a very , still a very good result by international good result by international standardsstandards. Working population happ. Working population happier than last year; non-working populier than last year; non-working population less happy than last year.ation less happy than last year.
Young people in their 20s clearly Young people in their 20s clearly happier than last year, at 69.86, as happier than last year, at 69.86, as compared to 67.compared to 67.3939..

Happiness Index by Age Groups Happiness Index by Age Groups (Working Population only) 2005 and 06(Working Population only) 2005 and 06
Happiness Index by Age 2005 amd 2006 (Working Population)
70.66n=121
71.05n=277
73.21n=106
60
62
64
66
68
70
72
74
76
21-29 30-49 50 or above
Age Group
Inde
x 2005
2006
67.32n=123
70.86n= 266
72.99n= 67

Inequality-adjusted happiness Inequality-adjusted happiness indexindex
Adjusted with reference to the Adjusted with reference to the dispersion of happiness indices dispersion of happiness indices across groupsacross groups
We have not done the We have not done the adjustment; but disparity has adjustment; but disparity has narrowed across age groups in narrowed across age groups in 20062006


Personal Income by Age Groups 2005Personal Income by Age Groups 2005

Personal Income by Age Groups 2006Personal Income by Age Groups 2006

Happiness Index by OccupationHappiness Index by Occupation 2005 & 062005 & 06
Happiness Index by Occupation 2005 & 06
50.00
55.00
60.00
65.00
70.00
75.00
80.00
85.00
Clerks Managers &
Administrators
Retired Professionals Housewife Elementry
Occupation
Ser & Shop
Sales Workers
Unemployed
Index
2005
2006

OccupationOccupation 20052005 20062006
MeanMean SampleSample MeanMean SampleSample
ClerksClerks 69.569.5 101101 72.572.5 100100
Managers & Managers & AdministratorAdministrator
71.0971.09 9292 71.671.6 143143
RetiredRetired 78.1778.17 6060 71.571.5 100100
ProfessionalsProfessionals 72.4672.46 6161 71.471.4 7474
HousewifeHousewife 75.2575.25 118118 71.271.2 110110
Elementary Elementary OccupationOccupation
63.4563.45 2929 69.869.8 4141
Services & Shop Services & Shop Sales WorkersSales Workers
71.1871.18 6868 69.569.5 6565
UnemployedUnemployed 61.8461.84 3838 61.961.9 2727
Happiness Index by OccupationHappiness Index by Occupation 2005 & 062005 & 06

Sources of Sources of ChangesChanges??
Improving job market for yImproving job market for young peopleoung people (Compa (Compared with last year, more young people move to hred with last year, more young people move to higher income category)igher income category)
Happiness index for clerical staff and elementarHappiness index for clerical staff and elementary occupation also increased significantly this yey occupation also increased significantly this year. This reflects the labour market in 2006 is muar. This reflects the labour market in 2006 is much better. ch better.
Possible factors that trouble the elderly people Possible factors that trouble the elderly people aa
nd housewife :nd housewife :
less company with family members busy with less company with family members busy with their work?their work?

Happiness by SexHappiness by Sex
69.61n=362
71.35n=453
50
55
60
65
70
75
80
(Male)男 (Female)女
Happiness Index by Sex

Happiness Index by Marital StatusHappiness Index by Marital Status
68.9n=218
71.9N=(522)
59.72n=36
50
55
60
65
70
75
80
(Single)未婚 (Married)已婚 /離婚分居(Divorce)
Happiness Index by Marital Status

Happiness Index by Spiritual Practice Happiness Index by Spiritual Practice vs No Spiritual Practicevs No Spiritual Practice
73.69n=206 69.51
n=607
50
55
60
65
70
75
80
有 沒有
Happiness Index by Spiritual Practice vs NoSpiritual Practice

Happiness Index by Education 2006Happiness Index by Education 2006
68.6n=140
70.6n=347
71.4n=314
50
55
60
65
70
75
80
primary or lower secondary post secondary orabove
Happiness Index by Education

Happiness Index by Education and Happiness Index by Education and IncomeIncome
Low Personal Low Personal IncomeIncome
High Personal High Personal IncomeIncome
Primary or belowPrimary or below 67.9667.96 70.3870.38
SecondarySecondary 68.7868.78 71.7771.77
Post-secondaryPost-secondary 70.0070.00 71.5971.59
Low personal income = <$6999
High personal income = >$7000

Happiness by Industry in 2006Happiness by Industry in 2006
76.6n=47 74.3
n=2871.0n=42
70.9n=53
70.6n=327
67.1n=14
50
55
60
65
70
75
80
Government &
Public Sectors
Education Manufacturing Construction Business Sector Health
Happiness Index by Industry

Life GoalsLife Goals
人生目標
0
50
100
150
200
250
300
0 1 2 3 4 5 6 7 8 9 10
賺錢
事業上的滿足
心靈上的平安
享受天倫之樂
6.49
6.26
7.39
人數
8.01
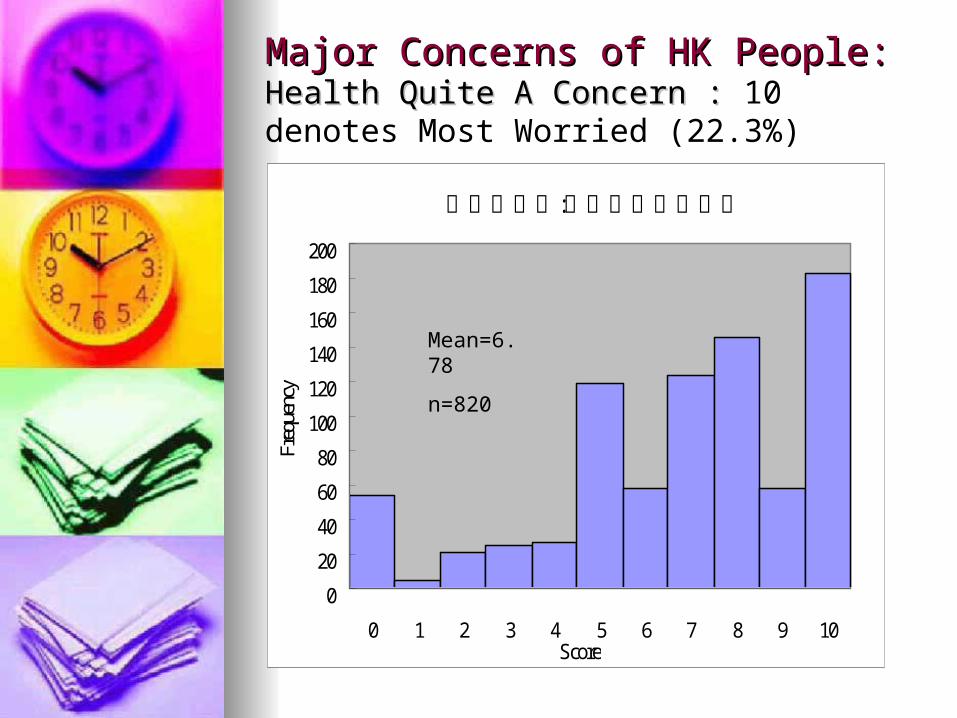
Major Concerns of HK People:Major Concerns of HK People: Health Quite A Concern : Health Quite A Concern : 10 denotes Most Worried (22.3%)
:擔心的事情自己或家人的健康
0
20
40
60
80
100
120
140
160
180
200
0 1 2 3 4 5 6 7 8 9 10Score
Freq
uenc
y
Mean=6.78
n=820

: 擔心的事情 醫療費
0
20
40
60
80
100
120
140
160
180
0 1 2 3 4 5 6 7 8 9 10Score
Freq
uenc
yMean=5.73
n=816
Health Care Expenses: Quite a Concern:Health Care Expenses: Quite a Concern:10 denotes Most Worried (16.3%)10 denotes Most Worried (16.3%)

: 擔心的事情 現在的生活費
0
50
100
150
200
250
0 1 2 3 4 5 6 7 8 9 10Score
Freq
uenc
yMean=4.97
n=822
Income Not Meeting Needs : Some 7.9% are most worried

: 擔心的事情 退休後的生活費
0
20
40
60
80
100
120
140
160
180
200
0 1 2 3 4 5 6 7 8 9 10Score
Freq
uenc
yMean=5.58
n=811
Worries over Post Retirement Expenses: 13.3% Most Worried

: - 擔心的事情 子女教育費 有子女
0
20
40
60
80
100
120
140
160
0 1 2 3 4 5 6 7 8 9 10Score
Freq
uenc
yMean=4.54
n=500
Education Cost: A Major Concern for 8.5% of Families with Children
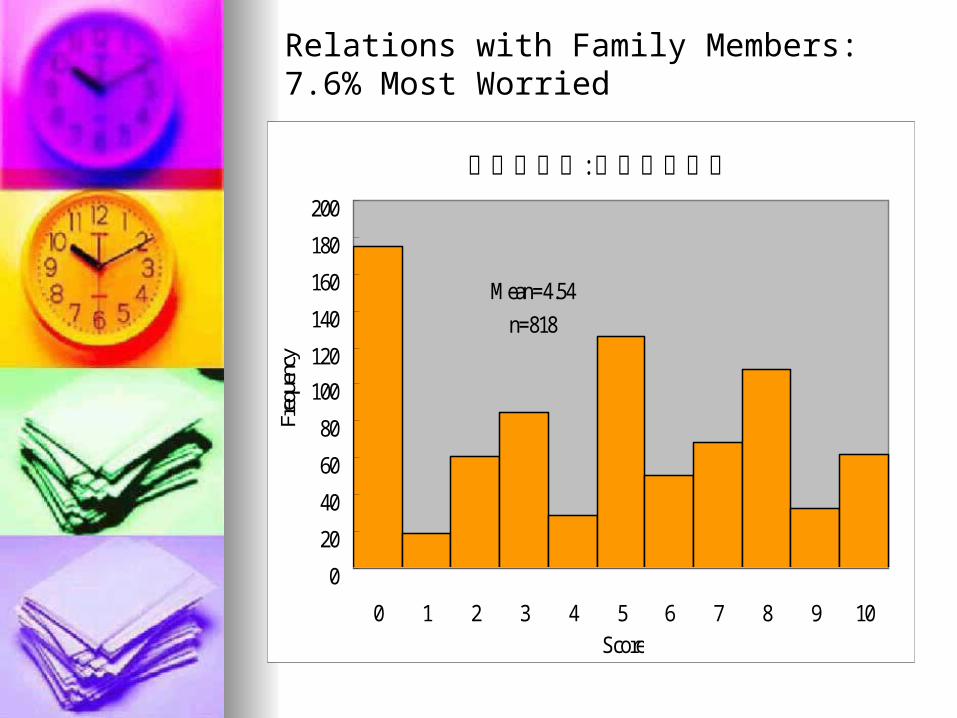
: 擔心的事情 與家人的關係
0
20
40
60
80
100
120
140
160
180
200
0 1 2 3 4 5 6 7 8 9 10Score
Freq
uenc
yMean=4.54
n=818
Relations with Family Members: 7.6% Most Worried

: 擔心的事情 與同事的關係
0
50
100
150
200
250
0 1 2 3 4 5 6 7 8 9 10Score
Freq
uenc
yMean=3.88
n =749
Relations with Colleagues: Usually not a concern
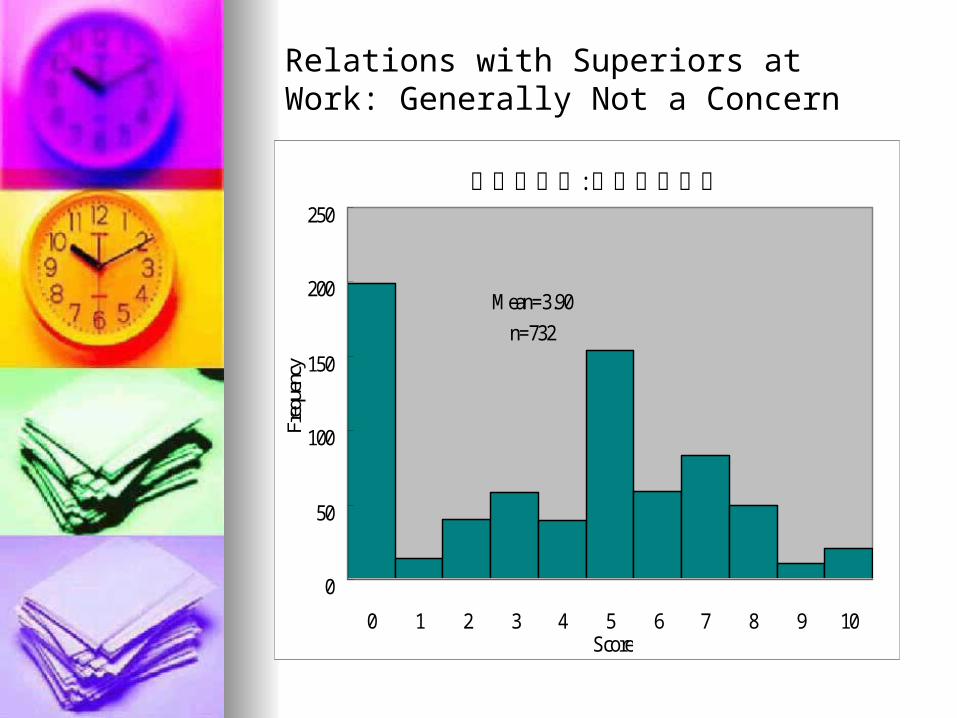
: 擔心的事情 與上司的關係
0
50
100
150
200
250
0 1 2 3 4 5 6 7 8 9 10Score
Freq
uenc
yMean=3.90
n=732
Relations with Superiors at Work: Generally Not a Concern

:擔心的事情香港未夠民主
0
20
40
60
80
100
120
140
160
180
200
0 1 2 3 4 5 6 7 8 9 10
Score
Freq
uenc
yMean=4.64
n=785
Worried about inadequate democracy: a significant minority- some 6.6 % most worried

:擔心的事情香港的法治可能遭到破壞
0
20
40
60
80
100
120
140
160
180
200
0 1 2 3 4 5 6 7 8 9 10Score
Freq
uenc
yMean=4.98
n=781
Judicial Independence and Lawfulness: 11.2 % Most Worried
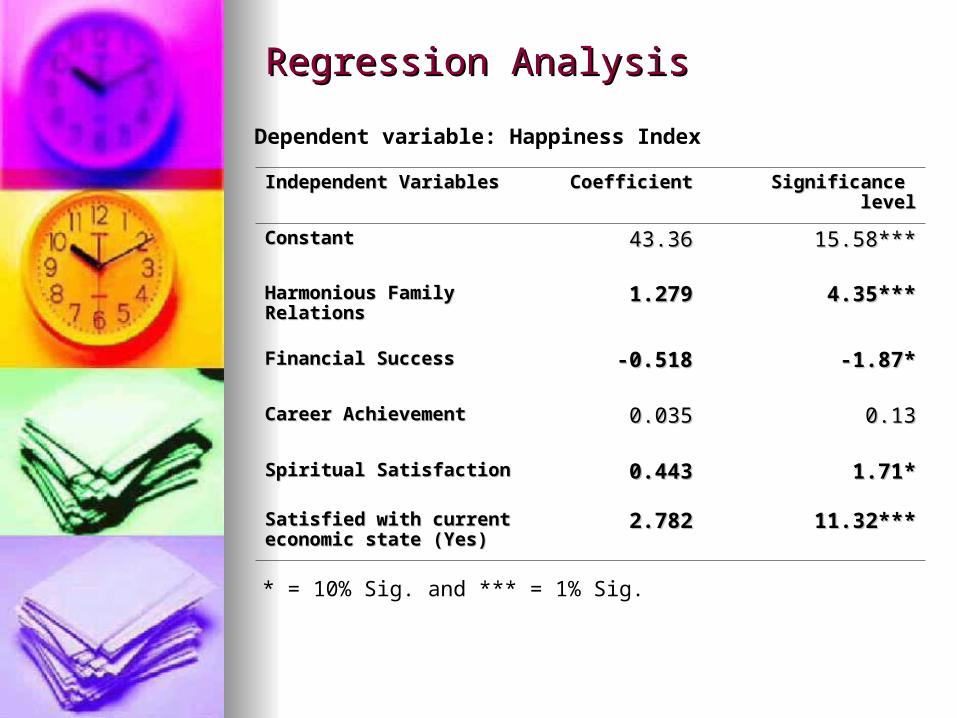
Regression AnalysisRegression Analysis
Independent VariablesIndependent Variables CoefficientCoefficient Significance levelSignificance level
ConstantConstant 43.3643.36 15.58***15.58***
Harmonious Family Harmonious Family RelationsRelations
1.2791.279 4.35***4.35***
Financial SuccessFinancial Success -0.518-0.518 -1.87*-1.87*
Career AchievementCareer Achievement 0.0350.035 0.130.13
Spiritual SatisfactionSpiritual Satisfaction 0.4430.443 1.71*1.71*
Satisfied with current Satisfied with current economic state (Yes)economic state (Yes)
2.7822.782 11.32***11.32***
Dependent variable: Happiness Index
* = 10% Sig. and *** = 1% Sig.

Importance of Open Election of HKSAR Chief Importance of Open Election of HKSAR Chief Executive vs. Civic Liberties on HappinessExecutive vs. Civic Liberties on Happiness
Importance of Open Election of HKSAR Chief Executivevs. Civic Liberties on Happiness
0
5
10
18. 你認為「現代社會自由」你的快樂有多重要?
19. 在香港實行全面普選對你的快樂有多重要?
2005 2006
67.6n=784
73.6n=691
56.1n=743
59.1n=677

ConclusionsConclusions
Hong Kong people are generally happyHong Kong people are generally happy Young people much happier over last yearYoung people much happier over last year Loving, caring people are the happiest;Loving, caring people are the happiest; Love starts from the family;Love starts from the family; Spiritually inclined people happier than Spiritually inclined people happier than
those after material gains;those after material gains; Unemployment, medical spending, Unemployment, medical spending, retiremeretireme
nt concerns, nt concerns, relations with family members relations with family members are key sources of unhappiness in HKare key sources of unhappiness in HK: Poli: Policy relieving these worries will promote hapcy relieving these worries will promote happinesspiness
EducatEducated people usually happier, but effect ed people usually happier, but effect is mainly is mainly through through the the effects effects of education aof education attainment ttainment on incomeon income

ConclusionsConclusions
Public policy should make a serious Public policy should make a serious attempt to alleviate attempt to alleviate thesethese worries; worries;
Schools should teach students how to cope Schools should teach students how to cope with life’s challenges;with life’s challenges; they do not seem to they do not seem to have done a good job in this regard;have done a good job in this regard;
Young people are much happier in 2006, Young people are much happier in 2006, benefiting from the brighter economic benefiting from the brighter economic prospectsprospects;;
Long work-hours probably are making non-Long work-hours probably are making non-working members of the family unhappy;working members of the family unhappy;
Hong Kong still a very attractive place to Hong Kong still a very attractive place to live in.live in.