state of hawaii homeless point-in-time count 2015 · the city & county of honolulu, dhs...
TRANSCRIPT

State of Hawaii
Homeless Point-in-Time Count 2015
State of Hawaii
Department of Human Services
Homeless Programs Office
April 2015

C. Peraro Consulting, LLC, 2015 Statewide Point-In-Time (PIT) Count, April 2015 2
Table of Contents
Acknowledgements ....................................................................................................................................... 3
Overview ....................................................................................................................................................... 5
PIT Teams ..................................................................................................................................................... 6
Statewide Summary ...................................................................................................................................... 7
Oahu Summary ............................................................................................................................................. 8
Hawaii Island Summary .............................................................................................................................. 11
Maui County Summary ............................................................................................................................... 14
Kauai County Summary .............................................................................................................................. 18
Statewide Homeless Subpopulations .......................................................................................................... 20
Statewide Unsheltered Results .................................................................................................................... 22
Recommendations ....................................................................................................................................... 24
Appendix 1: Sheltered Program Utilization on the Night of 1/25/15 ......................................................... 26
Appendix 2: Oahu HUD Homelessness Data Exchange (HDX) Tables ..................................................... 29
Appendix 3: Rural Counties HUD Homelessness Data Exchange (HDX) Tables ..................................... 38
Appendix 4: 2015 PIT Count Household Survey ....................................................................................... 47
Appendix 5: 2015 PIT Count Single Survey .............................................................................................. 50
Appendix 6: 2015 Non-HMIS Sheltered PIT Survey ................................................................................. 52
Appendix 7: 2015 Overview ....................................................................................................................... 59
Appendix 8: 2015 Contact and Confidentiality Form ................................................................................. 61
Appendix 9: PIT Agency Instructions ........................................................................................................ 62
Appendix 10: Additional 2015 PIT Count Instructions .............................................................................. 63
Appendix 11: Preparation for the 2015 PIT Count ..................................................................................... 66
C. Peraro Consulting, LLC, 2015 Statewide Point-In-Time (PIT) Count, April 2015 3
Acknowledgements
Mahalo to the agencies and individuals who contributed time, expertise, and other resources to
conduct the 2015 Point-in-Time (PIT) Count. The City & County of Honolulu and Partners in
Care1 (PIC) recognize the following organizations for their help in coordinating this year’s PIT.
Aloha United Way Housing Solutions Inc.
Alternative Structures International Hybrid International, LLC
C. Peraro Consulting, LLC The Institute for Human Services (IHS)
Catholic Charities Hawaii Kalihi Palama Health Center
CHOW Project Kealahou West Oahu
Department of Veterans Affairs (VA) Mental Health Kokua
Department of Housing and Urban
Development (HUD)
Pacific Islander Ministry
Family Promise Hawaii Project Date
Hale Kipa River of Life
Honolulu Community Action Program Salvation Army
Hawaii Community Foundation Steadfast Housing Development
Corporation
Hawaii DHS, Homeless Programs Office University of Hawaii
Hawaii Interagency Council on
Homelessness
USVETS, Inc.
Hawaii Job Corps Waianae Coast Comprehensive Health
Center
Helping Hands Hawaii Waikiki Health Center
Holomua Na Ohana Waimanalo Health Center
Hoomau Ke Ola Windward Homeless Coalition
HOPE Inc. Women in Need
A special mahalo to Aloha United Way, Catholic Charities Hawaii, and USVETS Waianae for
providing Oahu training venues.
1 Partners in Care (PIC) is an Oahu based membership organization of homeless service providers, businesses, units
of local, state, and federal government, service consumers, and other community representatives. PIC is heavily
involved in planning, coordinating, and advocating for programs and services to help the homeless.

C. Peraro Consulting, LLC, 2015 Statewide Point-In-Time (PIT) Count, April 2015 4
The state of Hawaii Department of Human Services Homeless Programs Office (HPO) and
Bridging the Gap (BTG), the Continuum of Care (CoC) for the neighbor islands of Kauai,
Hawaii, and Maui, also thank the following partners for their participation and assistance during
the 2015 PIT:
Hawaii County Agencies: Maui County Agencies: Kauai County Agencies:
Catholic Charities Hawaii Catholic Charities Hawaii Catholic Charities Hawaii
Child and Family Services County of Maui Kauai County Housing
Agency
County of Hawaii -
Prosecutor's Office
Family Life Center Kauai Economic
Opportunity, Incorporated
Dorian Carter, Community
Member (Pahoa)
Feed My Sheep Leyla Ramazan
Hastings and Pleadwell Hale Kau Kau Mental Health Kokua
Hawaii Island Aids
Foundation (HIAF)
Ka Hale A Ke Ola Steadfast Housing
Development Corp.
Hawaii Island Home for
Recovery
Maui Economic
Opportunity
Veterans Administration
Hope Services Hawaii, Inc Mental Health Kokua Women In Need
Main Street Pahoa Salvation Army YWCA
Property Professionals Steadfast Housing
Development Corp.
Ho`omoana Foundation
Students of Hawaii
Community College
Students of the University
of Hawaii at Hilo
West Hawaii Community
Health Center

C. Peraro Consulting, LLC, 2015 Statewide Point-In-Time (PIT) Count, April 2015 5
Overview
The U.S. Department of Housing and Urban Development (HUD) annual grant application for
Continuum of Care (CoC) homeless assistance programs funding requires the State of Hawaii to
produce an unduplicated count of homeless in sheltered and unsheltered locations on a one-day
point in time during the last ten days of January. The count is a cross section of homelessness
and does not reflect the number of homeless individuals served over any specific duration of
time. This year’s count was conducted on Jan. 25, 2015 and spanned the entire state of Hawaii.
The City & County of Honolulu, DHS Homeless Programs Office (HPO), Bridging the Gap
(BTG), and Partners in Care (PIC) collaborated to refine the count methodology and worked
diligently with service providers to assemble the necessary tools to capture the information
needed to produce this report.
The primary objective of the 2015 PIT Count was to obtain an estimate of sheltered and
unsheltered homeless individuals and families throughout Hawaii. The count allows both CoCs
to 1) accurately assess current levels of homelessness for various household types, 2) estimate
the number of chronically homeless individuals and families, and 3) evaluate the extent of
homelessness for veterans and youth. PIT data collection reflects the momentum of HUD in
terms of national policy and resource allocations. As the PIT methodology is refined and
execution improves, the reporting reliability also improves and reflects a more accurate picture
of homelessness from year to year. The PIT Count also is an opportunity to engage the general
public, community leaders, and private businesses in statewide efforts
Hawaii’s Homeless Management Information System (HMIS) was utilized to extract the
sheltered data needed for the PIT Count reporting and as the repository for surveys collected
during the unsheltered canvassing. The HMIS is a centralized web-based database used to
record services rendered to homeless individuals throughout the State of Hawaii. All service
providers who receive federal, state, or county funding to serve their clients are required to
participate in the HMIS. Some privately funded agencies voluntarily use the HMIS because of
its capacity to archive longitudinal service records for clients served by their programs.
To ensure that necessary subpopulation data was as reliable as possible, PIT organizers contacted
emergency shelters and transitional housing program operators in November 2014 and asked
them to confirm that all clients sleeping in their facilities on the night of the count had active
intake records As requested, agencies reviewed and updated client data. Follow-up with service
providers also was conducted to verify that HMIS listings matched the census for the night of
Jan. 15, 2015. Shelters not participating in the HMIS (e.g. Domestic Violence shelters) were
contacted individually and asked to provide the number of homeless individuals and families
residing in their programs on the night of the count, in addition to providing specific
subpopulation data.
For the unsheltered count, the state received HUD permission to conduct a five day physical
count between Monday, January 26, 2015 and Friday, January 30, 2015 Field staff and
volunteers asked all encountered unsheltered homeless individuals, “Where did you sleep this
past Sunday, January 25th?” as well as other necessary survey questions.

C. Peraro Consulting, LLC, 2015 Statewide Point-In-Time (PIT) Count, April 2015 6
The unsheltered survey is based on HUD-defined criteria and provider feedback. All surveys
were entered into the PIT module of the HMIS, aggregated, unduplicated, and analyzed to obtain
the statistics displayed throughout this report. The unsheltered survey instruments are described
in in Appendices 3 and Appendices 4. Note: the following unsheltered surveys were not
included in the final numbers.
Clients who reported living in a sheltered situation on the night of 1/25/15
Clients with duplicate surveys
Surveyed clients that appeared in the sheltered emergency or transitional data when
unduplicated
Stakeholders, regional leaders, homeless service providers, and volunteers attended several
planning meetings prior to Jan. 25, 2015. The purpose of these meetings was to convey the
count’s methodology to all parties involved, to provide explicit instructions detailing PIT
objectives, and to obtain feedback on the surveys used during the unsheltered count.
Multiple trainings also preceded the 2015 PIT Count. Canvassers received an overview of the
count and its methodology, safety tips, data quality topics, and based on previous count results,
key points to consider during the survey.
Regional leaders provided ad hoc field training before and during the count to ensure that
volunteers understood how to administer the survey. All documents provided before and during
the trainings are provided in Appendices 3 through 10.
PIT Teams The 2015 PIT field staff was composed of workers from service agencies that regularly perform
outreach to the unsheltered homeless. The survey teams were assigned to regions familiar to
them so they could ensure that all of the areas frequented by unsheltered homeless were
surveyed. Outreach workers that establish a rapport with individuals they encounter are more
successful getting clients to participate in the surveys and to provide accurate information.
Service-based locations, such as food pantries, were covered extensively during the count to
reach additional unsheltered homeless. PIT organizers mapped out the locations in each county
where unsheltered homeless reported sleeping on the night of the count.
Oahu Maui Hawaii Kauai
1: Downtown Honolulu 1: Central Maui 1: Kohala 1: West
2: East Honolulu 2: Lower Waiehu 2: Honokaa 2: South
3: Ewa 3: Up Country 3: Laupahoehoe 3: South Central
4: Kaneohe to Waimanalo 4: Lahaina 4: Hilo 4: East
5: Wahiawa to North Shore 5: Kihei 5: Waiakea 5: North
6: Upper Windward 6: Hana 6: Keaau
7: Waianae Coast 7: Pahoa
8: Kau
9: Konawaena
10: Kealakehe

C. Peraro Consulting, LLC, 2015 Statewide Point-In-Time (PIT) Count, April 2015 7
The unsheltered count spanned Jan. 26 – 30, 2015. The first day of the unsheltered count was
conducted with full participation from all organizations involved, and focused on reaching as
many unsheltered homeless individuals as possible. As the week progressed, each agency
independently scheduled dates and times for field staff to visit known sites. This balance
between safety and timing was an effort to enhance the execution of the count.
Statewide Summary
The CoC conducted a one-night statewide count of sheltered homeless on the night of Jan. 25,
2015, which preceded a five day count of unsheltered homeless individuals. Combined, these
counts estimate the total number of homeless individuals statewide is 7,620.
Table 1 summarizes the sheltered, unsheltered, and statewide totals over the last five years. Each
of those annual counts has been executed using the same methodology. Table 2 summarizes the
number of homeless individuals statewide.
Table 1: Statewide PIT Summary 2011-2015
Sheltered Unsheltered State Total
# % # % #
2015 3,777 50% 3,843 50% 7,620
2014 3,813 55% 3,105 45% 6,918
2013 3,745 59% 2,590 41% 6,335
2012 3,726 60% 2,520 40% 6,246
2011 3,632 59% 2,556 41% 6,188
Table 2: 2015 Statewide Households Summary
Sheltered Unsheltered State Total
# % # % #
Singles 1,243 29% 3,064 71% 4,307
Family
Individuals 2,534 76% 779 24% 3,313
All Individuals 3,777 50% 3,843 50% 7,620
Family
Households 613 77% 185 23% 798
Figure 1 is a graphic representation of Table 1 information.

C. Peraro Consulting, LLC, 2015 Statewide Point-In-Time (PIT) Count, April 2015 8
Oahu Summary
Table 3: Oahu Summary 2011-2015
Sheltered Unsheltered Oahu Total
# % # % #
2015 2,964 60% 1,939 40% 4,903
2014 3,079 65% 1,633 35% 4,712
2013 3,091 68% 1,465 32% 4,556
2012 3,035 70% 1,318 30% 4,353
2011 2,912 69% 1,322 31% 4,234
Figure 2 shows the five year trend in sheltered, unsheltered, and total homeless activity on Oahu.
The figure portrays a steady increase in the total number of homeless individuals over the course
of those five years, with increases in the total number of unsheltered over the last four years.
Much of the increase in the unsheltered homeless is presumed due to improved execution of the
count; however, until the count is executed more rigorously it remains difficult to assess whether
the increase is actually from an increase in homelessness. Analysis presented by Ullman and
Peraro attempts to highlight areas that can be improved from year to year. The sheltered total
has remained relatively constant over the last five years and declined 4% when compared to
2014.
2,556 2,520 2,590 3,105
3,843 3,632 3,726 3,745 3,813 3,777
6,188 6,246 6,335 6,918
7,620
0
1,000
2,000
3,000
4,000
5,000
6,000
7,000
8,000
9,000
2011 2012 2013 2014 2015
Figure 1 - Statewide PIT Summary, 2011-2015
Unsheltered Sheltered State Total

C. Peraro Consulting, LLC, 2015 Statewide Point-In-Time (PIT) Count, April 2015 9
Table 4 shows that 60% of all homeless individuals and 87% of homeless families were
sheltered. Of the 485 sheltered families, 340 (70%) resided in transitional housing facilities,
while the remaining 30% resided in emergency shelters. Among the 1,939 unsheltered homeless,
1,654 (85%) were single individuals, two percentage points less than in 2014. In 2015, 52% of
the homeless were singles, while 48% were family individuals, a slight increase over 2014, when
the proportions were equal. The majority (88%) of all homeless family individuals were
sheltered in either emergency or transitional facilities.
For the purposes of this report, a single individual is defined as an unaccompanied person, or a
person in a multi-adult household (e.g. couples). Within the “singles” cohort, the data are
overwhelmingly unaccompanied. Family individuals are defined as members of family
households with at least one adult and one child younger than 18 years of age.
Table 4: 2015 Oahu Households Summary
Sheltered Unsheltered Oahu Total
# % # % #
Singles 909 35% 1,654 65% 2,563
Family
Individuals 2,055 88% 285 12% 2,340
All Individuals 2,964 60% 1,939 40% 4,903
Family
Households 485 87% 71 13% 556
Figure 3 is a graphic representation of Table 4.
1,322 1,318 1,465 1,633 1,939
2,912 3,035 3,091 3,079 2,964
4,234 4,353 4,556 4,712 4,903
0
1,000
2,000
3,000
4,000
5,000
6,000
2011 2012 2013 2014 2015
Figure 2 - Oahu Summary, 2011-2015
Unsheltered Sheltered Oahu Total

C. Peraro Consulting, LLC, 2015 Statewide Point-In-Time (PIT) Count, April 2015 10
Tables 5 through 7 summarize the count results over the last five years. There was a 4% drop in
the proportion of sheltered singles and family individuals relative to the 2014 totals for both
categories. There was a 4% increase in the proportion of unsheltered singles and family
individuals when compared to 2014. Overall, there were significant increases to each
unsheltered category presented below. Singles, family individuals, and family households
increased by 14%, 52%, and 37%, respectively. Appendix 1 details the actual occupancy for
each emergency and transitional program on Oahu on Jan. 25, 2015, the night of the 2015 PIT
Count.
Table 5: Summary of Oahu Singles, 2011-2015
Sheltered Unsheltered Oahu Total
# % # % #
2015 909 35% 1,654 65% 2,563
2014 911 39% 1,445 61% 2,356
2013 901 41% 1,295 59% 2,196
2012 865 43% 1,144 57% 2,009
2011 854 43% 1,145 57% 1,999
Table 6: Summary of Oahu Family Individuals, 2011-2015
Sheltered Unsheltered Oahu Total
# % # % #
2015 2,055 88% 285 12% 2,340
2014 2,168 92% 188 8% 2,356
2013 2,190 93% 170 7% 2,360
2012 2,170 93% 174 7% 2,344
2011 2,058 92% 177 8% 2,235
35%
88%
60%
87%
65%
12%
40%
13%
0%
20%
40%
60%
80%
100%
Singles Family Individuals All Individuals Family Households
Figure 3 - 2015 Oahu Households Summary
Sheltered Unsheltered

C. Peraro Consulting, LLC, 2015 Statewide Point-In-Time (PIT) Count, April 2015 11
Table 7: Summary of Oahu Family Households, 2011-2015
Sheltered Unsheltered Oahu Total
# % # % #
2015 485 87% 71 13% 556
2014 526 91% 52 9% 578
2013 525 92% 43 8% 568
2012 534 93% 41 7% 575
2011 514 92% 44 8% 558

C. Peraro Consulting, LLC, 2015 Statewide Point-In-Time (PIT) Count, April 2015 12
Hawaii Island Summary
Table 8: Hawaii Island Summary 2011-2015
Sheltered Unsheltered Hawaii Total
# % # % #
2015 220 18% 1,021 82% 1,241
2014 211 24% 658 76% 869
2013 160 29% 397 71% 557
2012 170 28% 447 72% 617
2011 229 40% 337 60% 566
Figure 4 shows the five-year trends in sheltered, unsheltered, and total homeless circumstances
on the island of Hawaii. The figure denotes an increase in the total number of homeless
individuals over the last three years, with increases in both sheltered and unsheltered
populations. The sheltered total increased 4% compared to 2014.
Table 8 depicts a steady rise in the proportion of unsheltered homelessness on the island of
Hawaii over the last several years, and when compared to 2014, a very large (55%) increase in
the number of unsheltered homeless individuals and families.
Table 9 shows that 18% of all homeless individuals and 30% of homeless families were
sheltered. Of the 33 sheltered families, 15 (45%) resided in transitional housing facilities, while
the remaining 55% resided in emergency shelters. Among the 1,021 unsheltered homeless
individuals, 676 (66%) were singles. In 2015, 62% of all homeless individuals on Hawaii Island
337
447 397
658
1,021
229 170 160
211 220
566 617
557
869
1,241
0
200
400
600
800
1,000
1,200
1,400
2011 2012 2013 2014 2015
Figure 4 - Hawaii Island PIT Summary, 2011-2015
Unsheltered Sheltered Hawaii Total

C. Peraro Consulting, LLC, 2015 Statewide Point-In-Time (PIT) Count, April 2015 13
were singles, while 38% were family individuals, up slightly since 2014. Twenty seven percent
(27%) of all homeless family individuals were sheltered in either emergency or transitional
facilities, 61% less than on Oahu.
Table 9: 2015 Hawaii Households Summary
Sheltered Unsheltered Hawaii Total
# % # % #
Singles 94 12% 676 88% 770
Family
Individuals 126 27% 345 73% 471
All Individuals 220 18% 1,021 82% 1,241
Family
Households 33 30% 77 70% 110
Figure 5 presents the information from Table 9 graphically.
Tables 10 through 12 summarize the count results on Hawaii Island over the last five years.
Relative to 2014, there were significant increases in all three cohorts, accompanied by increases
in the proportions of unsheltered homeless. The number of unsheltered homeless on Hawaii
Island is nearly five times that of sheltered on the island.
12% 27%
18% 30%
88% 73%
82% 70%
0%
20%
40%
60%
80%
100%
Singles Family Individuals All Individuals Family Households
Figure 5 - 2015 Hawaii Households Summary
Sheltered Unsheltered

C. Peraro Consulting, LLC, 2015 Statewide Point-In-Time (PIT) Count, April 2015 14
Table 10: Summary of Hawaii Island Singles, 2011-2015
Sheltered Unsheltered Hawaii Total
# % # % #
2015 94 12% 676 88% 770
2014 89 17% 438 83% 527
2013 66 17% 318 83% 384
2012 62 17% 306 83% 368
2011 77 22% 268 78% 345
Table 11: Summary of Hawaii Island Family Individuals, 2011-2015
Sheltered Unsheltered Hawaii Total
# % # % #
2015 126 27% 345 73% 471
2014 122 36% 220 64% 342
2013 94 54% 79 46% 173
2012 108 43% 141 57% 249
2011 152 69% 69 31% 221
Table 12: Summary of Hawaii Island Family Households, 2011-2015
Sheltered Unsheltered Hawaii Total
# % # % #
2015 33 30% 77 70% 110
2014 35 44% 45 56% 80
2013 27 63% 16 37% 43
2012 35 56% 28 44% 63
2011 37 66% 19 34% 56

C. Peraro Consulting, LLC, 2015 Statewide Point-In-Time (PIT) Count, April 2015 15
Maui County Summary
Table 13: Maui County Summary 2011-2015
Sheltered Unsheltered Maui Total
# % # % #
2015 505 44% 632 56% 1,137
2014 445 46% 514 54% 959
2013 421 48% 455 52% 876
2012 420 48% 454 52% 874
2011 394 37% 658 63% 1,052
Figure 6 shows the five-year trends in sheltered, unsheltered, and total homelessness on Maui.
The figure portrays an increase in both sheltered and unsheltered homelessness over the last four
years. The sheltered total increased an average of 21 people per year over the four year period,
while the unsheltered averaged nearly 45 individuals.
Table 14 shows that 44% of all homeless individuals and 78% of homeless families were
sheltered. Of the 78 sheltered families, 67 (86%) resided in transitional housing facilities, while
the remaining 14% resided in emergency shelters. Among the 632 unsheltered homeless
individuals, 530 (84%) were singles. In 2015, 65% of all homeless individuals were singles,
while 35% were family individuals a slight increase over 2014, when only 63% were singles.
74% of all homeless family individuals were sheltered in either emergency or transitional
facilities.
658
454 455 514
632
394 420 421 445 505
1,052
874 876
959
1,137
0
200
400
600
800
1,000
1,200
2011 2012 2013 2014 2015
Figure 6 - Maui County PIT Summary, 2011-2015
Unsheltered Sheltered Maui Total

C. Peraro Consulting, LLC, 2015 Statewide Point-In-Time (PIT) Count, April 2015 16
Table 14: 2015 Maui County Households Summary
Sheltered Unsheltered Maui Total
# % # % #
Singles 212 29% 530 71% 742
Family
Individuals 293 74% 102 26% 395
All Individuals 505 44% 632 56% 1,137
Family
Households 78 76% 25 24% 103
Figure 7 is a graphic representation of Table 14.
Tables 15 through 17 summarize the count results over the last five years. Data in Table 15
shows a favorable trend towards sheltered homelessness. Although the number of unsheltered
individuals rose, this was more than offset by the increase in the number of sheltered singles over
the last year.
Table 15: Summary of Maui County Singles, 2011-2015
Sheltered Unsheltered Maui Total
# % # % #
2015 212 29% 530 71% 742
2014 144 24% 463 76% 607
2013 150 27% 405 73% 555
2012 131 25% 393 75% 524
2011 127 20% 513 80% 640
Tables 16 and 17 show increases in the proportion of homeless family individuals and
households.
29%
74%
44%
76%
71%
26%
56%
24%
0%
20%
40%
60%
80%
100%
Singles Family Individuals All Individuals Family Households
Figure 7 - 2015 Maui County Households Summary
Sheltered Unsheltered

C. Peraro Consulting, LLC, 2015 Statewide Point-In-Time (PIT) Count, April 2015 17
Table 16: Summary of Maui County Family Individuals, 2011-2015
Sheltered Unsheltered Maui Total
# % # % #
2015 293 74% 102 26% 395
2014 301 86% 51 14% 352
2013 271 84% 50 16% 321
2012 289 83% 61 17% 350
2011 267 65% 145 35% 412
Table 17: Summary of Maui County Family Households, 2011-2015
Sheltered Unsheltered Maui Total
# % # % #
2015 78 76% 25 24% 103
2014 87 87% 13 13% 100
2013 77 84% 15 16% 92
2012 88 83% 18 17% 106
2011 77 64% 43 36% 120

C. Peraro Consulting, LLC, 2015 Statewide Point-In-Time (PIT) Count, April 2015 18
Kauai County Summary
Table 18: Kauai County Summary 2011-2015
Sheltered Unsheltered Kauai Total
# % # % #
2015 88 26% 251 74% 339
2014 78 21% 300 79% 378
2013 73 21% 273 79% 346
2012 101 25% 301 75% 402
2011 97 29% 239 71% 336
Figure 8 shows the five-year trends in sheltered, unsheltered, and total homelessness on Kauai.
The figure indicates a decline in total homelessness over a one year period. The variation over
the five year period also appears to be much less relative to the other three counties.
NOTE: To more rigorously evaluate the extent of the canvassing during the PIT week, survey
data from all counties should be compared to HMIS outreach listings.
Table 19 shows that 26% of all homeless individuals and 59% of homeless families were
sheltered. Of the 17 sheltered families, 12 (71%) resided in transitional housing facilities,
while the remaining 29% resided in emergency shelters. Among the 251 unsheltered homeless
individuals, 204 (81%) were singles. In 2015, 68% of all homeless were singles, a slight
decrease from 2014; 32% of homeless were family individuals. More than half (56%) of all
homeless family individuals were sheltered in either emergency or transitional facilities.
239
301
273
300
251
97 101
73 78 88
336
402
346
378
339
0
50
100
150
200
250
300
350
400
450
2011 2012 2013 2014 2015
Figure 8 - Kauai County PIT Summary, 2011-2015
Unsheltered Sheltered Kauai Total

C. Peraro Consulting, LLC, 2015 Statewide Point-In-Time (PIT) Count, April 2015 19
Table 19: 2015 Kauai County Households Summary
Sheltered Unsheltered Kauai Total
# % # % #
Singles 28 12% 204 88% 232
Family
Individuals 60 56% 47 44% 107
All Individuals 88 26% 251 74% 339
Family
Households 17 59% 12 41% 29
Figure 9 is a graphic representation of Table 19.
Tables 20-22 summarize the count results over the last five years. For each of the cohorts, the
unsheltered proportion has declined relative to 2014. Appendix 1 details the actual occupancy
for each emergency and transitional program for the night of the count.
Table 20: Summary of Kauai County Singles, 2011-2015
Sheltered Unsheltered Kauai Total
# % # % #
2015 28 12% 204 88% 232
2014 20 8% 240 92% 260
2013 25 11% 195 89% 220
2012 17 7% 212 93% 229
2011 19 10% 172 90% 191
12%
56%
26%
59%
88%
44%
74%
41%
0%
20%
40%
60%
80%
100%
Singles Family Individuals All Individuals Family Households
Figure 9 - 2015 Kauai County Households Summary
Sheltered Unsheltered

C. Peraro Consulting, LLC, 2015 Statewide Point-In-Time (PIT) Count, April 2015 20
Table 21: Summary of Kauai County Family Individuals, 2011-2015
Sheltered Unsheltered Kauai Total
# % # % #
2015 60 56% 47 44% 107
2014 58 49% 60 51% 118
2013 48 38% 78 62% 126
2012 84 49% 89 51% 173
2011 78 54% 67 46% 145
Table 22: Summary of Kauai County Family Households, 2011-2015
Sheltered Unsheltered Kauai Total
# % # % #
2015 17 59% 12 41% 29
2014 15 47% 17 53% 32
2013 14 42% 19 58% 33
2012 24 50% 24 50% 48
2011 22 54% 19 46% 41
Statewide Homeless Subpopulations
In 2015, the CoC was required to collect information on different subpopulations. Those
subpopulations are outlined in Tables 23 through 28.
Table 23: Oahu County Chronically Homeless Subpopulations
Sheltered Unsheltered Total
Emergency Safe Haven
Chronically Homeless Individuals 115 20 644 779
Chronically Homeless Families 7 n/a 18 25
Persons in Chronically Homeless Families 25 n/a 64 89
Table 24: Rural Counties Chronically Homeless Subpopulations
Sheltered Unsheltered Total
Emergency Safe Haven
Chronically Homeless Individuals 18 n/a 575 593
Chronically Homeless Families 1 n/a 17 18
Persons in Chronically Homeless Families 2 n/a 71 73
The subpopulation data are always subsets of specific homeless cohorts. The data collection
presented in these tables follow HMIS programming specifications and guidance outlined in
HUD Notice: CPD-14-014 relating to PIT data collection. Specifically, the Notice informed
CoCs of the information that must be collected in order to successfully complete the reporting
requirements for the 2015 PIT.

C. Peraro Consulting, LLC, 2015 Statewide Point-In-Time (PIT) Count, April 2015 21
Table 23 and Table 24 present chronically homeless information for both CoCs. Chronically
homeless individuals are defined as unaccompanied adults with a disabling health or mental
health condition and who have been homeless continuously for a year or more, or have had at
least four episodes of homelessness in the last three years. Transitional housing programs are not
included in the definition. On Oahu, the rates of chronic homelessness for individuals in
emergency, safe haven, and unsheltered situations were 32%, 77%, and 46%, respectively. In
the rural counties, the rate of chronic homelessness for individuals in emergency shelters or
unsheltered situations was 13% and 46%, respectively.
A chronically homeless family is defined as having a head of the household who is chronically
homeless. On Oahu, the rate of chronic family homelessness in emergency shelters was 5%,
while the rate for unsheltered families was 25%. In the rural counties, the rate of chronic family
homelessness in emergency shelters was 3%, while the rate for unsheltered families was 15%.
Unsheltered information was self-reported; however, in many cases, outreach personnel familiar
with the clientele are better able to gauge the client’s disability status.
Table 25: Oahu Homeless Veteran Populations
Sheltered Unsheltered Total
Emergency Transitional Safe
Haven
Homeless Veterans 74 164 2 227 467
Chronically Homeless
Veteran Individuals
26 n/a 2 105 133
Homeless Vet Families 5 12 0 7 24
Chronically Homeless
Veteran Families
1 n/a n/a 4 5
Persons in Chronically
Homeless Veteran Families
5 n/a n/a 18 23
Table 26: Rural Counties Homeless Veteran Populations
Sheltered Unsheltered Total
Emergency Transitional Safe
Haven
Homeless Veterans 13 21 n/a 190 224
Chronically Homeless
Veteran Individuals
3 n/a n/a 85 88
Homeless Vet Families 0 1 n/a 7 8
Chronically Homeless
Veteran Families
0 n/a n/a 1 1
Persons in Chronically
Homeless Veteran Families
0 n/a n/a 4 4
Table 25 and Table 26 present veteran subpopulation reporting requirements. There were an
estimated 467 homeless veterans on Oahu and 224 on the rural counties, for a total of 691
statewide. Chronic definitions parallel the aforementioned and rates can be derived based on the

C. Peraro Consulting, LLC, 2015 Statewide Point-In-Time (PIT) Count, April 2015 22
totals presented in the tables. A vet family is defined as having at least one adult family member
who is a veteran.
Table 27: Oahu Other Homeless Subpopulations
Sheltered Unsheltered Total
Persons in emergency
shelters, transitional
housing and safe havens
Adults with a Serious Mental Illness 394 599 993
Adults with a Substance Use Disorder 257 514 771
Adults with HIV/AIDS 26 22 48
Victims of Domestic Violence (optional,
adults only)
249 n/a 249
Table 28: Rural Counties Other Homeless Subpopulations
Sheltered Unsheltered Total
Persons in emergency
shelters, transitional
housing and safe havens
Adults with a Serious Mental Illness 110 587 697
Adults with a Substance Use Disorder 119 506 625
Adults with HIV/AIDS 3 27 30
Victims of Domestic Violence (optional,
adults only)
151 n/a 151
Table 27 and Table 28 display homeless adult subpopulations only. The denominators used as
the basis for the sheltered and unsheltered numbers on Oahu were 1,790 and 1,775, respectively.
The denominators for rural counties were 553 and 1,615.

C. Peraro Consulting, LLC, 2015 Statewide Point-In-Time (PIT) Count, April 2015 23
Statewide Unsheltered Results
The total number of unsheltered homeless individuals statewide was estimated to be 3,843.
Tables 29 through 32 present 2015 data by cohort and region for each of the four counties. All
percentages in the tables use the cohort total as the denominator. The four tables below can be
used to assess rates of homelessness for the different household configuration types. The tables
can also be used to supplement information provided in the tables above.
Table 29: Summary of Oahu Regional Unsheltered Homeless, 2015
Singles Family
Individuals
All
Individuals
Family
Households
Region # % # % # % # %
1: Downtown Honolulu 629 38% 114 40% 743 38% 31 44%
2: East Honolulu 352 21% 15 5% 367 19% 3 4%
3: Ewa 92 6% 10 4% 102 5% 3 4%
4: Kaneohe to Waimanalo 121 7% 24 8% 145 7% 6 8%
5: Wahiawa to North
Shore 165 10% 23 8% 188 10% 6 8%
6: Upper Windward 25 2% 0 0% 25 1% 0 0%
7: Waianae Coast 270 16% 99 35% 369 19% 22 31%
TOTAL 1,654 100% 285 100% 1,939 100% 71 100%
Table 30: Summary of Hawaii Island Regional Unsheltered Homeless, 2015
Singles Family
Individuals
All
Individuals
Family
Households
Region # % # % # % # %
1: Kohala 1 0% 0 0% 1 0% 0 0%
2: Honokaa 25 4% 39 11% 64 6% 9 12%
3: Laupahoehoe 2 0% 0 0% 2 0% 0 0%
4: Hilo 177 26% 26 8% 203 20% 7 9%
5: Waiakea 0 0% 0 0% 0 0% 0 0%
6: Keaau 56 8% 47 14% 103 10% 9 12%
7: Pahoa 153 23% 34 10% 187 18% 11 14%
8: Kau 62 9% 158 46% 220 22% 32 42%
9: Konawaena 5 1% 0 0% 5 0% 0 0%
10: Kealakehe 195 29% 41 12% 236 23% 9 12%
TOTAL 676 100% 345 100% 1,021 100% 77 100%

C. Peraro Consulting, LLC, 2015 Statewide Point-In-Time (PIT) Count, April 2015 24
Table 31: Summary of Maui County Regional Unsheltered Homeless, 2015
Singles Family
Individuals
All
Individuals
Family
Households
Region # % # % # % # %
1: Central Maui 208 39% 79 77% 287 45% 18 72%
2: Lower Waiehu 3 1% 0 0% 3 0% 0 0%
3: Up Country 60 11% 5 5% 65 10% 2 8%
4: Lahaina 121 23% 18 18% 139 22% 5 20%
5: Kihei 133 25% 0 0% 133 21% 0 0%
6: Hana 5 1% 0 0% 5 1% 0 0%
TOTAL 530 100% 102 100% 632 100% 25 100%
Table 32: Summary of Kauai County Regional Unsheltered Homeless, 2015
Singles Family
Individuals
All
Individuals
Family
Households
Region # % # % # % # %
1: West 47 23% 10 21% 57 23% 3 25%
2: South 1 0% 0 0% 1 0% 0 0%
3: South Central 66 32% 26 55% 92 37% 6 50%
4: East 39 19% 4 9% 43 17% 1 8%
5: North 51 25% 7 15% 58 23% 2 17%
TOTAL 204 100% 47 100% 251 100% 12 100%
Demographic characteristics for unsheltered populations by CoC are detailed in Appendix 2,
Tables 1 through7. The HUD Homelessness Data Exchange (HDX) tables also present
subpopulation information for unsheltered homeless individuals as well as summaries of youth
and veteran homelessness. Youth and veteran homelessness characteristics are subsets of the
data presented in Tables 1 through 3 of Appendix 2.
Recommendations
PIT coordinators continue to improve the count coverage and many of the fields included in this
report. The coordinated entry system and utilization of a common assessment tool has helped to
engage and identify additional homeless individuals and prioritize those with the highest needs.
The new HMIS solution may also play a significant role in producing more accurate PIT Count
results. As execution improves, so will the count results and confidence in the reporting. The
many organizations, staff, and volunteers that take the time to contribute to making the count a
priority get the credit for yearly improvements. Mahalo to everyone who worked diligently to
make this year’s count successful.
The count is a single day estimate of the level of homelessness across the state of Hawaii. The
results inform and supplement improvements in HMIS data quality. They also contribute to the
analysis of system outcomes and trends over specific intervals, and higher accountability
standards for organizations utilizing the HMIS and receiving homeless services funding. HMIS
data also can be analyzed to assess the level of PIT canvassing and to estimate the true level of

C. Peraro Consulting, LLC, 2015 Statewide Point-In-Time (PIT) Count, April 2015 25
unsheltered homelessness. Several recommendations follow from the data presented herein and
from discussion with various organizations and stakeholders.
Refer to the recommendations and instructions included in the appendices of this report and in
the PIT Count Methodology Guide. HUD updates the materials annually. Formulate a PIT ad
hoc subcommittee within both CoCs that annually assist the CoC with organization of the count,
training, data quality standards, and overall coordination of volunteers. To galvanize support and
coordinate team leadership with partners, the committee can be formed and begin facilitating and
planning the PIT Count months in advance. Schedule the entire work week for the unsheltered
count and develop written data quality standards for active HMIS outreach listings compared to
PIT survey responses.
Designate one lead coordinator per region and delineate clear responsibilities. This approach
works especially well in larger regions. Work with regional coordinators to develop timelines for
the week, with responsibilities clearly outlined for each of the region’s subareas. Allocate
additional funding for skilled data entry personnel to enter all unsheltered survey data from the
count. There continue to be many errors in the unsheltered HMIS extract, which prolongs the
time it takes to produce the report and degrades the validity of the reporting.
Recommendations also include identifying harder to reach areas after the count, working to
develop more of a presence in those areas, and requesting that law enforcement postpone sweeps
until after the count. Improving coordination with HPD and DLNR to strengthen security and
improve accessibility into harder to reach areas also is recommended. Use stakeholders and
community leaders to help publicize the event and garner more support and visibility for
homeless services.

C. Peraro Consulting, LLC, 2015 Statewide Point-In-Time (PIT) Count, April 2015 26
Appendix 1: Sheltered Program Utilization on the Night of 1/25/15
Honolulu CoC Shelter Utilization (HI-501) Type Program Name Family
Individuals
Family
Units
Singles TOTAL
ES CFS Honolulu 15 7 5 20
ES CFS Leeward 11 4 3 14
ES FPH - Honolulu Family Center 14 4 0 14
ES FPH - Windward Family Center 13 3 0 13
ES HK - Boys 0 0 5 5
ES HK - Girls 0 0 3 3
ES IHS - Kaa'ahi Women and Families ES 86 23 69 155
ES IHS - Sumner Men's ES 0 0 147 147
ES KWO - Onelau`ena 207 43 20 227
ES PACT - Ohia 0 0 1 1
ES ROL - Light House Emergency Shelter 38 11 12 50
ES SOW - Great Joy 1 0 0 6 6
ES SOW - Great Joy 2 0 0 7 7
ES SOW - Great Joy 3 0 0 12 12
ES SOW - Streams of Joy 1 0 0 6 6
ES SOW - Streams of Joy 2 0 0 8 8
ES USVETS - BP HOPTEL 0 0 3 3
ES USVETS - Respite Beds 0 0 6 6
ES USVETS - WCC Emergency 196 46 38 234
ES USVETS - WCC HOPTEL 0 0 5 5
ES WHC - Next Step Emergency Shelter 14 3 38 52
ES WSAS - Hale Ola 5 1 2 7
SH MHK - Safe Haven Transitional
Housing
0 0 26 26
TH ASI - Ohana Ola O Kahumana 228 46 0 228
TH ASI - Ulu Ke Kukui (Villages of Maili) 317 72 0 317
TH CCH - Ma'ili Land Transitional Housing 163 38 0 163
TH CFS Trans 16 5 0 16
TH GHP - Community Residential Program 0 0 11 11
TH GHP - Gregory House 0 0 7 7
TH HCAP - Kumuhonua 0 0 86 86
TH HKIPA - Apaa Women's Shelter 0 0 4 4
TH HKIPA - Keeaumoku/Aawa 0 0 4 4
TH HKIPA - Maka`aloa TLP 0 0 3 3
TH HKO - Lahilahi 0 0 3 3
TH HNO - Onemalu Transitional 194 42 0 194
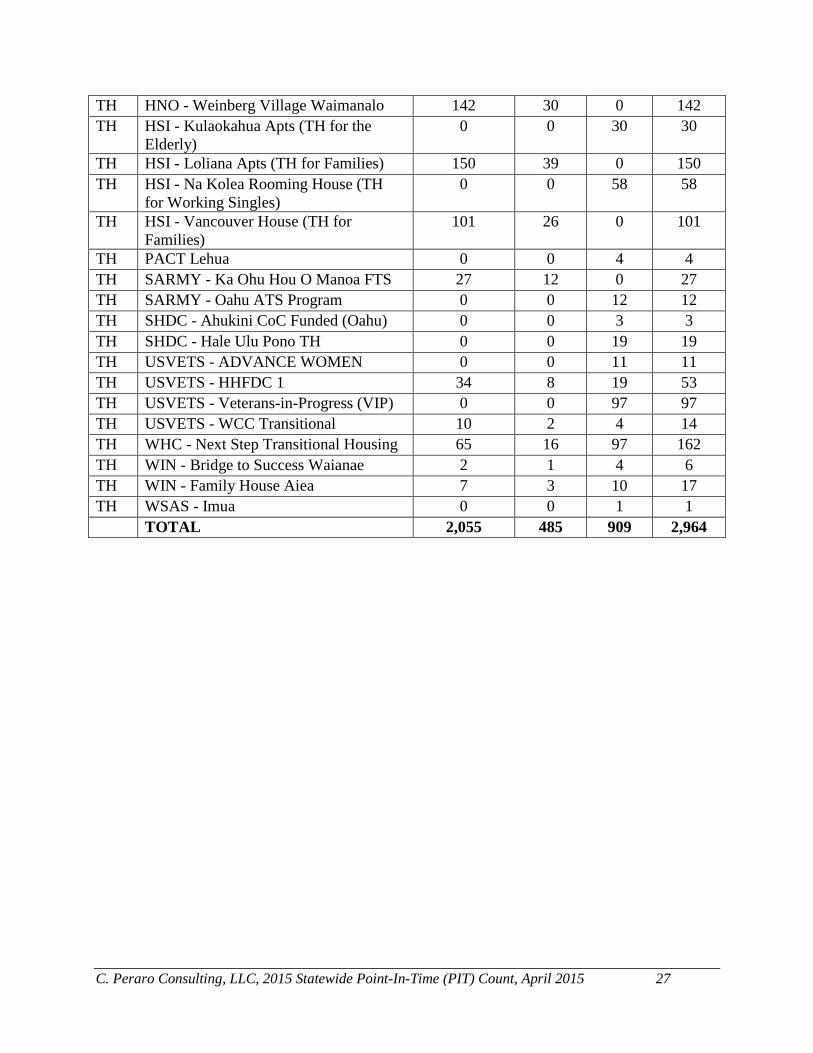
C. Peraro Consulting, LLC, 2015 Statewide Point-In-Time (PIT) Count, April 2015 27
TH HNO - Weinberg Village Waimanalo 142 30 0 142
TH HSI - Kulaokahua Apts (TH for the
Elderly)
0 0 30 30
TH HSI - Loliana Apts (TH for Families) 150 39 0 150
TH HSI - Na Kolea Rooming House (TH
for Working Singles)
0 0 58 58
TH HSI - Vancouver House (TH for
Families)
101 26 0 101
TH PACT Lehua 0 0 4 4
TH SARMY - Ka Ohu Hou O Manoa FTS 27 12 0 27
TH SARMY - Oahu ATS Program 0 0 12 12
TH SHDC - Ahukini CoC Funded (Oahu) 0 0 3 3
TH SHDC - Hale Ulu Pono TH 0 0 19 19
TH USVETS - ADVANCE WOMEN 0 0 11 11
TH USVETS - HHFDC 1 34 8 19 53
TH USVETS - Veterans-in-Progress (VIP) 0 0 97 97
TH USVETS - WCC Transitional 10 2 4 14
TH WHC - Next Step Transitional Housing 65 16 97 162
TH WIN - Bridge to Success Waianae 2 1 4 6
TH WIN - Family House Aiea 7 3 10 17
TH WSAS - Imua 0 0 1 1
TOTAL 2,055 485 909 2,964

C. Peraro Consulting, LLC, 2015 Statewide Point-In-Time (PIT) Count, April 2015 28
Hawaii Balance of State CoC Shelter Utilization (HI-500) Type Program Name Family
Individuals
Family
Units
Singles TOTAL
ES CFS - Hale Ohana 13 5 4 17
ES CFS - West Hawaii DAS 4 2 2 6
ES FLC - Ho'olanani 14 6 26 40
ES HOPE - Kiheipua 51 11 21 72
ES
HOPE - West Hawaii Emergency
Housing Program 0 0 30 30
ES KEO - Mana'olana Emergency 11 3 8 19
ES KHAKO - Central ES 5 1 17 22
ES KHAKO - Westside ES 6 1 29 35
ES WHW - Hale Lokomaikai 9 3 6 15
ES YWCA - Family Violence Shelter 4 2 2 6
TH CFS - Hale Kahua Paa 6 2 2 8
TH HIHR - Transitional Housing 0 0 19 19
TH HOPE - Beyond Shelter 3 1 0 3
TH HOPE - HOPE Resource Center 0 0 16 16
TH HOPE - Kaloko Transitional Housing 40 9 0 40
TH HOPE - Kuleana House 4 1 0 4
TH HOPE - Wilder House 5 2 0 5
TH KEO - Komohana Group Home TH 0 0 4 4
TH
KEO - Lihue Court Transitional
Housing 26 5 0 26
TH KEO - Mana'olana Transitional Housing 12 4 8 20
TH KHAKO - Central TH 150 39 78 228
TH KHAKO - Westside TH 109 28 56 165
TH WIN - Bridge to Success Kauai 7 3 6 13
TOTAL 479 128 334 813

C. Peraro Consulting, LLC, 2015 Statewide Point-In-Time (PIT) Count, April 2015 29
Appendix 2: Oahu HUD Homelessness Data Exchange (HDX) Tables
HUD HDX Table 1 - Oahu HI-501 Homeless Populations
Households with at least one Adult & one Child
Persons in Households with at least one Adult and one Child
Sheltered Unsheltered Total
Emergency Transitional
Total # of households 145 340 71 556
Total # of Persons (Adults & Children) 599 1,456 285 2,340
# of Persons (under age 18) 347 819 153 1,319
# of Persons (18-24) 47 105 21 173
# of Persons (over age 24) 205 532 111 848
Gender (adults and children)
Sheltered Unsheltered Total
Emergency Transitional
Female 327 787 183 1,297
Male 272 669 102 1,043
Transgender (male to female) 0 0 0 0
Transgender (female to male) 0 0 0 0
Ethnicity (adults and children)
Sheltered Unsheltered Total
Emergency Transitional
Non-Hispanic/Non-Latino 552 1,223 250 2,025
Hispanic/Latino 47 233 35 315
Race (adults and children)
Sheltered Unsheltered Total
Emergency Transitional
White 18 58 6 82
Black or African-American 19 16 8 43
Asian 19 42 13 74
American Indian or Alaska Native 2 11 1 14
Native Hawaiian or Other Pacific Islander 386 722 218 1,326
Multiple Races 155 607 39 801

C. Peraro Consulting, LLC, 2015 Statewide Point-In-Time (PIT) Count, April 2015 30
HUD HDX Table 2 - Oahu HI-501 Homeless Populations
Households with only Children
Persons in Households with only Children
Sheltered Unsheltered Total
Emergency Transitional
Total # of households 8 0 9 17
Total # of children (under age 18) 8 0 11 19
Gender
Sheltered Unsheltered Total
Emergency Transitional
Female 3 0 4 7
Male 5 0 7 12
Transgender (male to female) 0 0 0 0
Transgender (female to male) 0 0 0 0
Ethnicity
Sheltered Unsheltered Total
Emergency Transitional
Non-Hispanic/Non-Latino 7 0 10 17
Hispanic/Latino 1 0 1 2
Race
Sheltered Unsheltered Total
Emergency Transitional
White 1 0 1 2
Black or African-American 0 0 0 0
Asian 1 0 0 1
American Indian or Alaska Native 0 0 1 1
Native Hawaiian or Other Pacific Islander 6 0 7 13
Multiple Races 0 0 2 2

C. Peraro Consulting, LLC, 2015 Statewide Point-In-Time (PIT) Count, April 2015 31
HUD HDX Table 3 - Oahu HI-501 Homeless Populations
Households without Children
Persons in Households without Children
Sheltered Unsheltered Total
Emergency Transitional Safe Haven
Total # of households 381 462 26 1,514 2,383
Total # of Persons (Adults) 388 487 26 1,643 2,544
# of Persons (age 18-24) 18 25 0 104 147
# of Persons (over age 24) 370 462 26 1,539 2,397
Gender
Sheltered Unsheltered Total
Emergency Transitional Safe Haven
Female 118 154 14 512 798
Male 268 331 12 1,119 1,730
Transgender (male to female) 1 2 0 12 15
Transgender (female to male) 1 0 0 0 1
Ethnicity
Sheltered Unsheltered Total
Emergency Transitional Safe Haven
Non-Hispanic/Non-Latino 340 437 25 1,423 2,225
Hispanic/Latino 48 50 1 220 319
Race
Sheltered Unsheltered Total
Emergency Transitional Safe
Haven
White 137 169 7 430 743
Black or African-American 29 40 3 78 150
Asian 51 74 3 185 313
American Indian or Alaska Native 2 11 0 20 33
Native Hawaiian or Other Pacific
Islander
62 71 2 663 798
Multiple Races 107 122 11 267 507

C. Peraro Consulting, LLC, 2015 Statewide Point-In-Time (PIT) Count, April 2015 32
HUD HDX Table 4 - Oahu HI-501 Homeless Subpopulations
Chronically Homeless Subpopulations
Sheltered Unsheltered Total
Emergency Safe Haven
Chronically Homeless Individuals 115 20 644 779
Chronically Homeless Families 7 0 18 25
Persons in Chronically Homeless Families 25 0 64 89
(Chronically homeless subpopulation data is required for sheltered persons and for unsheltered
persons.)
Chronically Homeless Veterans
Sheltered Unsheltered Total
Emergency Safe Haven
Chronically Homeless Veteran
Individuals
26 2 105 133
Chronically Homeless Veteran
Families
1 0 4 5
Persons in Chronically Homeless
Veteran Families
5 0 18 23
(Chronically homeless veteran data is a subset of the All Chronically Homeless Individuals and
Families)
Other Homeless Subpopulations
Sheltered Unsheltered Total
Persons in emergency
shelters, transitional
housing and safe havens
Adults with a Serious Mental Illness 394 599 993
Adults with a Substance Use Disorder 257 514 771
Adults with HIV/AIDS 26 22 48
Victims of Domestic Violence (optional) 249 n/a 249
(Other homeless subpopulation data is required for sheltered persons and for unsheltered
persons)
Notes for the above subpopulation information:
1. Persons residing in transitional housing programs were not counted as chronically
homeless.
The below terms do not directly correspond to the program requirements of HUD funding
streams and must only be used for the purposes of the HIC and PIT.
2. Chronically Homeless Individual - An individual who:
C. Peraro Consulting, LLC, 2015 Statewide Point-In-Time (PIT) Count, April 2015 33
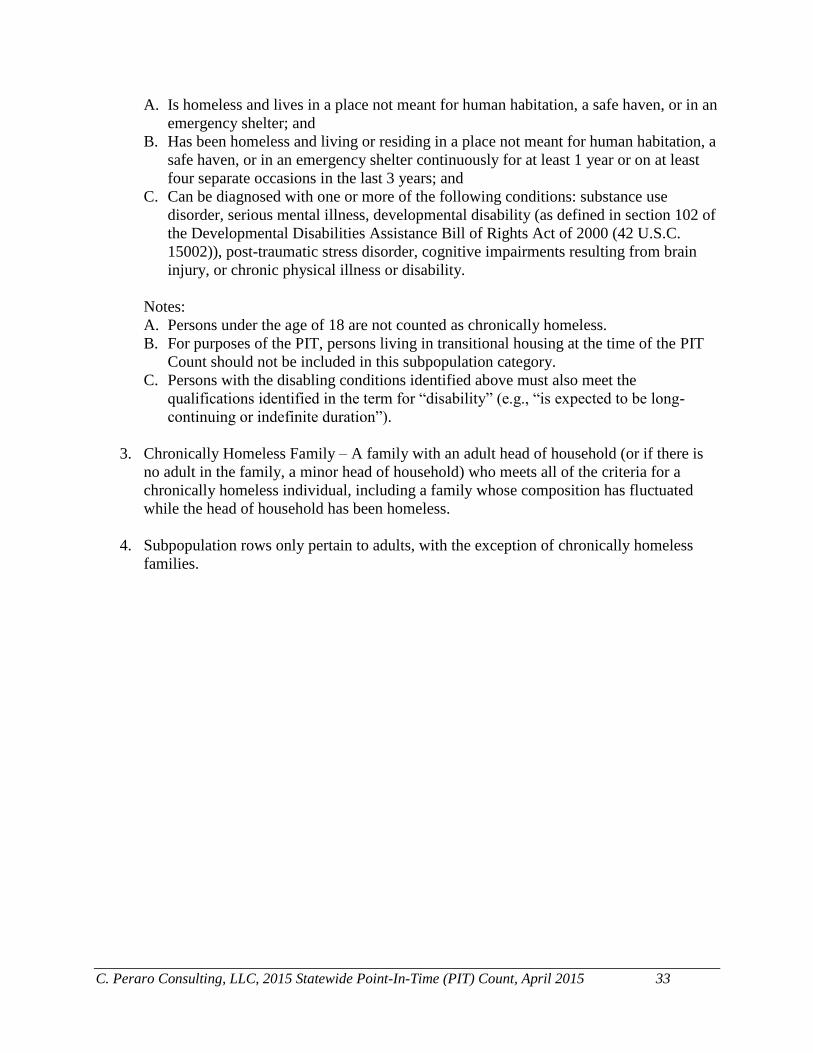
A. Is homeless and lives in a place not meant for human habitation, a safe haven, or in an
emergency shelter; and
B. Has been homeless and living or residing in a place not meant for human habitation, a
safe haven, or in an emergency shelter continuously for at least 1 year or on at least
four separate occasions in the last 3 years; and
C. Can be diagnosed with one or more of the following conditions: substance use
disorder, serious mental illness, developmental disability (as defined in section 102 of
the Developmental Disabilities Assistance Bill of Rights Act of 2000 (42 U.S.C.
15002)), post-traumatic stress disorder, cognitive impairments resulting from brain
injury, or chronic physical illness or disability.
Notes:
A. Persons under the age of 18 are not counted as chronically homeless.
B. For purposes of the PIT, persons living in transitional housing at the time of the PIT
Count should not be included in this subpopulation category.
C. Persons with the disabling conditions identified above must also meet the
qualifications identified in the term for “disability” (e.g., “is expected to be long-
continuing or indefinite duration”).
3. Chronically Homeless Family – A family with an adult head of household (or if there is
no adult in the family, a minor head of household) who meets all of the criteria for a
chronically homeless individual, including a family whose composition has fluctuated
while the head of household has been homeless.
4. Subpopulation rows only pertain to adults, with the exception of chronically homeless
families.

C. Peraro Consulting, LLC, 2015 Statewide Point-In-Time (PIT) Count, April 2015 34
HUD HDX Table 5 - Oahu HI-501 Youth Populations
Youth Households
Sheltered Unsheltered Total
Emergency Transitional Safe
Haven
Total # of households 41 44 0 100 185
# of parenting youth households 15 20 0 6 41
# of unaccompanied youth
households
26 24 0 94 144
Total # of Persons 76 89 0 127 292
Total # of persons in parenting
youth households
50 65 0 21 136
# of parenting youth (youth
parents only)
26 34 0 12 72
# of parenting youth (under
age 18)
0 0 0 1 1
# of parenting youth (age 18 to
24)
26 34 0 11 71
# of children with parenting
youth (children under age 18
with parents under age 25
24 31 0 9 64
Total # of unaccompanied youth 26 24 0 106 156
# of unaccompanied children
(youth under age 18)
8 0 0 13 21
# of unaccompanied youth
between ages 18 and 24
18 24 0 93 135
Gender (parenting & unaccompanied youth)
Sheltered Unsheltered Total
Emergency Transitional Safe Haven
Female 27 25 0 49 101
Male 25 33 0 69 127
Transgender (male to female) 0 0 0 0 0
Transgender (female to male) 0 0 0 0 0
Ethnicity (parenting & unaccompanied youth)
Sheltered Unsheltered Total
Emergency Transitional Safe Haven
Non-Hispanic/Non-Latino 38 51 0 96 185
Hispanic/Latino 14 7 0 22 43

C. Peraro Consulting, LLC, 2015 Statewide Point-In-Time (PIT) Count, April 2015 35
Race (parenting & unaccompanied youth)
Sheltered Unsheltered Total
Emergency Transitional Safe
Haven
White 6 4 0 21 31
Black or African-American 1 2 0 3 6
Asian 3 1 0 5 9
American Indian or Alaska Native 0 1 0 1 2
Native Hawaiian or Other Pacific
Islander
31 19 0 62 112
Multiple Races 11 31 0 26 68
Notes for the above youth population information:
Parenting youth are youth who identify as the parents or legal guardians of one or more children
sleeping in the same place as that youth parent, where there is no person over age 24 in the
household.
Unaccompanied youth are persons under age 25 who are not presenting or sleeping in the same
place as their parent or legal guardian, including:
single youth;
youth couples; and
groups of youth presenting as a household.
Parenting youth are distinct from unaccompanied youth.
Data on Youth Households is a subset of the All Households category. Youth included in the
Youth Households table, and related demographic data, also are included in the All Households
data.
a) If individuals are housed in Safe Havens on the night of the count, they are recorded in the
"Safe Haven" column, NOT in the emergency shelter column.

C. Peraro Consulting, LLC, 2015 Statewide Point-In-Time (PIT) Count, April 2015 36
HUD HDX Table 6 - Oahu HI-501 Veteran Populations
Veteran Households with at least one Adult & one Child
Persons in Households with at least one Adult & one Child
Sheltered Unsheltered Total
Emergency Transitional
Total # of Households 5 12 7 24
Total # of Persons 19 66 30 115
Total # of Veterans 5 12 7 24
Gender (veterans only)
Sheltered Unsheltered Total
Emergency Transitional
Female 2 2 2 6
Male 3 10 5 18
Transgender (male to female) 0 0 0 0
Transgender (female to male) 0 0 0 0
Ethnicity (veterans only)
Sheltered Unsheltered Total
Emergency Transitional
Non-Hispanic/Non-Latino 5 9 6 20
Hispanic/Latino 0 3 1 4
Race (veterans only)
Sheltered Unsheltered Total
Emergency Transitional
White 2 4 1 7
Black or African-American 1 2 1 4
Asian 0 0 0 0
American Indian or Alaska Native 1 0 0 1
Native Hawaiian or Other Pacific Islander 0 1 3 4
Multiple Races 1 5 2 8

C. Peraro Consulting, LLC, 2015 Statewide Point-In-Time (PIT) Count, April 2015 37
HUD HDX Table 7 - Oahu HI-501 Veteran Populations
Veteran Households without Children
Persons in Households without Children
Sheltered Unsheltered Total
Emergency Transitional Safe Haven
Total # of Households 69 152 2 219 442
Total # of Persons 71 153 2 249 475
Total # of Veterans 69 152 2 220 443
Gender (veterans only)
Sheltered Unsheltered Total
Emergency Transitional Safe Haven
Female 4 25 2 20 51
Male 65 127 0 199 391
Transgender (male to female) 0 0 0 1 1
Transgender (female to male) 0 0 0 0 0
Ethnicity (veterans only)
Sheltered Unsheltered Total
Emergency Transitional Safe Haven
Non-Hispanic/Non-Latino 61 138 2 194 395
Hispanic/Latino 8 14 0 26 48
Race (veterans only)
Sheltered Unsheltered Total
Emergency Transitional Safe
Haven
White 30 75 2 69 176
Black or African-American 9 16 0 23 48
Asian 10 18 0 24 52
American Indian or Alaska Native 0 6 0 5 11
Native Hawaiian or Other Pacific
Islander
5 17 0 63 85
Multiple Races 15 20 0 36 71

C. Peraro Consulting, LLC, 2015 Statewide Point-In-Time (PIT) Count, April 2015 38
Appendix 3: Rural Counties HUD Homelessness Data Exchange (HDX)
Tables
HUD HDX Table 1 – Rural Counties HI-500 Homeless Populations
Households with at least one Adult & one Child
Persons in Households with at least one Adult and one Child
Sheltered Unsheltered Total
Emergency Transitional
Total # of households 34 94 114 242
Total # of Persons (Adults & Children) 117 362 494 973
# of Persons (under age 18) 71 220 286 577
# of Persons (18-24) 4 15 36 55
# of Persons (over age 24) 42 127 172 341
Gender (adults and children)
Sheltered Unsheltered Total
Emergency Transitional
Female 65 218 249 532
Male 52 144 245 441
Transgender (male to female) 0 0 0 0
Transgender (female to male) 0 0 0 0
Ethnicity (adults and children)
Sheltered Unsheltered Total
Emergency Transitional
Non-Hispanic/Non-Latino 100 305 454 859
Hispanic/Latino 17 57 40 114
Race (adults and children)
Sheltered Unsheltered Total
Emergency Transitional
White 17 58 60 135
Black or African-American 2 5 5 12
Asian 2 9 16 27
American Indian or Alaska Native 0 2 5 7
Native Hawaiian or Other Pacific Islander 46 120 358 524
Multiple Races 50 168 50 268

C. Peraro Consulting, LLC, 2015 Statewide Point-In-Time (PIT) Count, April 2015 39
HUD HDX Table 2 - Rural Counties HI-500 Homeless Populations
Households with only Children
Persons in Households with only Children
Sheltered Unsheltered Total
Emergency Transitional
Total # of households 0 0 3 3
Total # of children (under age 18) 0 0 3 3
Gender
Sheltered Unsheltered Total
Emergency Transitional
Female 0 0 2 2
Male 0 0 1 1
Transgender (male to female) 0 0 0 0
Transgender (female to male) 0 0 0 0
Ethnicity
Sheltered Unsheltered Total
Emergency Transitional
Non-Hispanic/Non-Latino 0 0 1 1
Hispanic/Latino 0 0 2 2
Race
Sheltered Unsheltered Total
Emergency Transitional
White 0 0 1 1
Black or African-American 0 0 0 0
Asian 0 0 0 0
American Indian or Alaska Native 0 0 0 0
Native Hawaiian or Other Pacific Islander 0 0 1 1
Multiple Races 0 0 1 1

C. Peraro Consulting, LLC, 2015 Statewide Point-In-Time (PIT) Count, April 2015 40
HUD HDX Table 3 - Rural Counties HI-500 Homeless Populations
Households without Children
Persons in Households without Children
Sheltered Unsheltered Total
Emergency Transitional Safe Haven
Total # of households 141 184 n/a 1,327 1,652
Total # of Persons (Adults) 145 189 n/a 1,407 1,741
# of Persons (age 18-24) 13 14 n/a 129 156
# of Persons (over age 24) 132 175 n/a 1,278 1,585
Gender
Sheltered Unsheltered Total
Emergency Transitional Safe Haven
Female 70 63 n/a 405 538
Male 75 126 n/a 998 1,199
Transgender (male to female) 0 0 n/a 4 4
Transgender (female to male) 0 0 n/a 0 0
Ethnicity
Sheltered Unsheltered Total
Emergency Transitional Safe Haven
Non-Hispanic/Non-Latino 130 168 n/a 1,254 1,552
Hispanic/Latino 15 21 n/a 153 189
Race
Sheltered Unsheltered Total
Emergency Transitional Safe
Haven
White 61 104 n/a 724 889
Black or African-American 9 8 n/a 41 58
Asian 8 7 n/a 47 62
American Indian or Alaska Native 1 2 n/a 37 40
Native Hawaiian or Other Pacific
Islander
14 10 n/a 292 316
Multiple Races 52 58 n/a 266 376

C. Peraro Consulting, LLC, 2015 Statewide Point-In-Time (PIT) Count, April 2015 41
HUD HDX Table 4 - Rural Counties HI-500 Homeless Subpopulations
Chronically Homeless Subpopulations
Sheltered Unsheltered Total
Emergency Safe Haven
Chronically Homeless Individuals 18 n/a 575 593
Chronically Homeless Families 1 n/a 17 18
Persons in Chronically Homeless Families 2 n/a 71 73
(Chronically homeless subpopulation data is required for sheltered persons and for unsheltered
persons.)
Chronically Homeless Veterans
Sheltered Unsheltered Total
Emergency Safe Haven
Chronically Homeless Veteran
Individuals
3 n/a 85 88
Chronically Homeless Veteran
Families
0 n/a 1 1
Persons in Chronically Homeless
Veteran Families
0 n/a 4 4
(Chronically homeless veteran data is a subset of the All Chronically Homeless Individuals and
Families)
Other Homeless Subpopulations
Sheltered Unsheltered Total
Persons in emergency
shelters, transitional
housing and safe havens
Adults with a Serious Mental Illness 110 587 697
Adults with a Substance Use Disorder 119 506 625
Adults with HIV/AIDS 3 27 30
Victims of Domestic Violence (optional) 151 n/a 151
(Other homeless subpopulation data is required for sheltered persons and for unsheltered
persons)
Notes for the above subpopulation information:
3. Persons residing in transitional housing programs were not counted as chronically
homeless.
The below terms do not directly correspond to the program requirements of HUD funding
streams and must only be used for the purposes of the HIC and PIT.
4. Chronically Homeless Individual - An individual who:

C. Peraro Consulting, LLC, 2015 Statewide Point-In-Time (PIT) Count, April 2015 42
D. Is homeless and lives in a place not meant for human habitation, a safe haven, or in an
emergency shelter; and
E. Has been homeless and living or residing in a place not meant for human habitation, a
safe haven, or in an emergency shelter continuously for at least 1 year or on at least
four separate occasions in the last 3 years; and
F. Can be diagnosed with one or more of the following conditions: substance use
disorder, serious mental illness, developmental disability (as defined in section 102 of
the Developmental Disabilities Assistance Bill of Rights Act of 2000 (42 U.S.C.
15002)), post-traumatic stress disorder, cognitive impairments resulting from brain
injury, or chronic physical illness or disability.
Notes:
D. Persons under the age of 18 are not counted as chronically homeless.
E. For purposes of the PIT, persons living in transitional housing at the time of the PIT
Count should not be included in this subpopulation category.
F. Persons with the disabling conditions identified above must also meet the
qualifications identified in the term for “disability” (e.g., “is expected to be long-
continuing or indefinite duration”).
3. Chronically Homeless Family – A family with an adult head of household (or if there is
no adult in the family, a minor head of household) who meets all of the criteria for a
chronically homeless individual, including a family whose composition has fluctuated
while the head of household has been homeless.
4. Subpopulation rows only pertain to adults, with the exception of chronically homeless
families.

C. Peraro Consulting, LLC, 2015 Statewide Point-In-Time (PIT) Count, April 2015 43
HUD HDX Table 5 - Rural Counties HI-500 Youth Populations
Youth Households
Sheltered Unsheltered Total
Emergency Transitional Safe
Haven
Total # of households 15 19 n/a 124 158
# of parenting youth households 2 7 n/a 8 17
# of unaccompanied youth
households
13 12 n/a 116 141
Total # of Persons 18 34 n/a 147 199
Total # of persons in parenting
youth households
5 21 n/a 26 52
# of parenting youth (youth
parents only)
2 8 n/a 13 23
# of parenting youth (under
age 18)
0 0 n/a 0 0
# of parenting youth (age 18
to 24)
2 8 n/a 13 23
# of children with parenting
youth (children under age 18
with parents under age 25
3 13 n/a 13 29
Total # of unaccompanied youth 13 13 n/a 121 147
# of unaccompanied children
(youth under age 18)
0 0 n/a 3 3
# of unaccompanied youth
between ages 18 and 24
13 13 n/a 118 144
Gender (parenting & unaccompanied youth)
Sheltered Unsheltered Total
Emergency Transitional Safe Haven
Female 10 10 n/a 61 81
Male 5 11 n/a 73 89
Transgender (male to female) 0 0 n/a 0 0
Transgender (female to male) 0 0 n/a 0 0
Ethnicity (parenting & unaccompanied youth)
Sheltered Unsheltered Total
Emergency Transitional Safe Haven
Non-Hispanic/Non-Latino 14 17 n/a 117 148
Hispanic/Latino 1 4 n/a 17 22

C. Peraro Consulting, LLC, 2015 Statewide Point-In-Time (PIT) Count, April 2015 44
Race (parenting & unaccompanied youth)
Sheltered Unsheltered Total
Emergency Transitional Safe
Haven
White 3 7 n/a 58 68
Black or African-American 2 1 n/a 5 8
Asian 0 0 n/a 4 4
American Indian or Alaska Native 0 1 n/a 4 5
Native Hawaiian or Other Pacific
Islander
2 0 n/a 30 32
Multiple Races 8 12 n/a 33 53
Notes for the above youth population information:
Parenting youth are youth who identify as the parents or legal guardians of one or more children
sleeping in the same place as that youth parent, where there is no person over age 24 in the
household.
Unaccompanied youth are persons under age 25 who are not presenting or sleeping in the same
place as their parent or legal guardian, including:
single youth;
youth couples; and
groups of youth presenting as a household
Parenting youth are distinct from unaccompanied youth.
Data on Youth Households is a subset of the All Households category. Youth included in the
Youth Households table, and related demographic data, also are included in the All Households
data.
a) If individuals are housed in Safe Havens on the night of the count, they are recorded in the
"Safe Haven" column, NOT in the emergency shelter column.

C. Peraro Consulting, LLC, 2015 Statewide Point-In-Time (PIT) Count, April 2015 45
HUD HDX Table 6 - Rural Counties HI-500 Veteran Populations
Veteran Households with at least one Adult & one Child
Persons in Households with at least one Adult & one Child
Sheltered Unsheltered Total
Emergency Transitional
Total # of Households 0 1 7 8
Total # of Persons 0 3 28 31
Total # of Veterans 0 1 7 8
Gender (veterans only)
Sheltered Unsheltered Total
Emergency Transitional
Female 0 0 4 4
Male 0 1 3 4
Transgender (male to female) 0 0 0 0
Transgender (female to male) 0 0 0 0
Ethnicity (veterans only)
Sheltered Unsheltered Total
Emergency Transitional
Non-Hispanic/Non-Latino 0 1 5 6
Hispanic/Latino 0 0 2 2
Race (veterans only)
Sheltered Unsheltered Total
Emergency Transitional
White 0 0 2 2
Black or African-American 0 1 0 1
Asian 0 0 1 1
American Indian or Alaska Native 0 0 0 0
Native Hawaiian or Other Pacific Islander 0 0 2 2
Multiple Races 0 0 2 2

C. Peraro Consulting, LLC, 2015 Statewide Point-In-Time (PIT) Count, April 2015 46
HUD HDX Table 7 - Rural Counties HI-500 Veteran Populations
Veteran Households without Children
Persons in Households without Children
Sheltered Unsheltered Total
Emergency Transitional Safe Haven
Total # of Households 14 20 n/a 182 216
Total # of Persons 16 20 n/a 191 227
Total # of Veterans 14 20 n/a 183 217
Gender (veterans only)
Sheltered Unsheltered Total
Emergency Transitional Safe Haven
Female 0 0 n/a 13 13
Male 14 20 n/a 170 204
Transgender (male to female) 0 0 n/a 0 0
Transgender (female to male) 0 0 n/a 0 0
Ethnicity (veterans only)
Sheltered Unsheltered Total
Emergency Transitional Safe Haven
Non-Hispanic/Non-Latino 14 18 n/a 168 200
Hispanic/Latino 0 2 n/a 15 17
Race (veterans only)
Sheltered Unsheltered Total
Emergency Transitional Safe
Haven
White 6 13 n/a 96 115
Black or African-American 1 0 n/a 10 11
Asian 1 1 n/a 8 10
American Indian or Alaska Native 0 1 n/a 7 8
Native Hawaiian or Other Pacific
Islander
0 1 n/a 32 33
Multiple Races 6 4 n/a 30 40

C. Peraro Consulting, LLC, 2015 Statewide Point-In-Time (PIT) Count, April 2015 47
Appendix 4: 2015 PIT Count Household Survey
USE THIS FORM IF THE CLIENT IS IN A HOUSEHOLD (Accompanied) 2015 State of Hawaii Homeless Point-in-Time Count Survey Interviewer’s Name: ______________________________Agency/Group: ______________________ Site of Interview (Actual Location): ______________________________ Date: _________________
“Are you living alone or with others?” (If living alone use SINGLE form)
“Where did you sleep this past Sunday, JANUARY 25
th?” ___________________________
SPECIFIC LOCATION - If answer is a sheltered location (e.g. house, shelter, hospital, jail), END SURVEY.
“What area of the island did you sleep?” ______________________________
Enter Region # (1–10) [Map on back] HEAD OF HOUSEHOLD: 1. How many ADULTS are in your household? _____ How many CHILDREN UNDER 18? _____ 2. First Name: ___________________________Last Name: ____________________________ 3. Date of Birth: ________/_________/_________ OR if DOB refused, Age: _____ 4. Gender: Male Transgender: male to female Unknown/Refused Female Transgender: female to male 5. Do you identify as Hispanic (Ethnicity)? Yes No Unknown Refused 6. What Race do you most identify with? (SELECT ONLY ONE)
White Black/African-American Asian American Indian/Alaska Native Native Hawaiian Other Pacific Islander Multiple Races Unknown
7. Have you served in the U.S. Armed Forces? Yes No Unknown Refused IF NO, SKIP to Q9 8. Were you activated, into active duty, as a National Guard member or Reservist?
Yes No Unknown Refused 9. How long have you been continuously homeless this time?
Less than 1 year 1 year or longer Unknown Refused 10. How many times have you been homeless in the past 3 years?
1–3 times 4 or more times Unknown Refused 11. Were you on the street, beach, park, or in an emergency shelter each time?
Yes No Unknown Refused 12. Do you have a mental health disability that limits your ability to work or perform activities of daily living? Yes No Unknown Refused

C. Peraro Consulting, LLC, 2015 Statewide Point-In-Time (PIT) Count, April 2015 48
13. Do you have an alcohol or drug problem that limits your ability to work or perform activities of daily living? Yes No Unknown Refused 14. Are you currently living with HIV/AIDS? Yes No Unknown Refused 15. Do you have a physical, developmental, or other disability that limits your ability to work or perform activities of daily living? Yes No Unknown Refused Children’s Demographic Information: 16. Gender of Children (Sum should equal the total number of children) Male: Transgender: male to female: Unknown/Refused: Female: Transgender: female to male: 17. Ethnicity of Children (Sum should equal the total number of children) Non-Hispanic/Non-Latino: Hispanic/Latino: 18. Race of Children: ONLY ONE PER CHILD (Sum should equal the total number of children) White: American Indian/Alaska Native: Black/African-American: Other Pacific Islander: Asian: Multiple Races: Native Hawaiian: Unknown: Description of Head of Household if Refused Survey:
CHECK WHEN ALL HOUSEHOLD SURVEYS HAVE BEEN ENTERED INTO THE HMIS

C. Peraro Consulting, LLC, 2015 Statewide Point-In-Time (PIT) Count, April 2015 49
OTHER ADULT IN HOUSEHOLD: 1. First Name: ___________________________Last Name: ____________________________ 2. Date of Birth: ________/_________/_________ OR if DOB refused, Age: _____ 3. Gender: Male Transgender: male to female Unknown/Refused Female Transgender: female to male 4. Do you identify as Hispanic (Ethnicity)? Yes No Unknown Refused 5. What Race do you most identify with? (SELECT ONLY ONE)
White Black/African-American Asian American Indian/Alaska Native Native Hawaiian Other Pacific Islander Multiple Races Unknown
6. Have you served in the U.S. Armed Forces? Yes No Unknown Refused IF NO, SKIP to Q8 7. Were you activated, into active duty, as a National Guard member or Reservist?
Yes No Unknown Refused 8. How long have you been continuously homeless this time?
Less than 1 year 1 year or longer Unknown Refused 9. How many times have you been homeless in the past 3 years?
1–3 times 4 or more times Unknown Refused 10. Were you on the street, beach, park, or in an emergency shelter each time?
Yes No Unknown Refused 11. Do you have a mental health disability that limits your ability to work or perform activities of daily living? Yes No Unknown Refused 12. Do you have an alcohol or drug problem that limits your ability to work or perform activities of daily living? Yes No Unknown Refused 13. Are you currently living with HIV/AIDS? Yes No Unknown Refused 14. Do you have a physical, developmental, or other disability that limits your ability to work or perform activities of daily living? Yes No Unknown Refused Description of other adult if Refused Survey:

C. Peraro Consulting, LLC, 2015 Statewide Point-In-Time (PIT) Count, April 2015 50
Appendix 5: 2015 PIT Count Single Survey
USE THIS FORM IF THE CLIENT IS SINGLE (Unaccompanied) 2015 State of Hawaii Homeless Point-in-Time Count Survey Interviewer’s Name: ______________________________Agency/Group: ______________________ Site of Interview (Actual Location): ______________________________ Date: _________________
“Are you living alone or with others?” (If living unsheltered with others, including a child under 18, use HOUSEHOLD form)
“Where did you sleep this past Sunday, JANUARY 25
th?” ___________________________
SPECIFIC LOCATION - If answer is a sheltered location (e.g. house, shelter, hospital, jail), END SURVEY.
“What area of the island did you sleep?” ______________________________
Enter Region # (1–10) [Map on back] 1. First Name: ___________________________Last Name: ____________________________ 2. Date of Birth: ________/_________/_________ OR if DOB refused, Age: _____ 3. Gender: Male Transgender: male to female Unknown/Refused Female Transgender: female to male 4. Do you identify as Hispanic (ethnicity)? Yes No Unknown Refused 5. What Race do you most identify with? (SELECT ONLY ONE)
White Black/African-American Asian American Indian/Alaska Native Native Hawaiian Other Pacific Islander Multiple Races Unknown
6. Have you served in the U.S. Armed Forces? Yes No Unknown Refused IF NO, SKIP to Q8 7. Were you activated, into active duty, as a National Guard member or Reservist?
Yes No Unknown Refused 8. How long have you been continuously homeless this time?
Less than 1 year 1 year or longer Unknown Refused 9. How many times have you been homeless in the past 3 years?
1–3 times 4 or more times Unknown Refused 10. Were you on the street, beach, park, or in an emergency shelter each time?
Yes No Unknown Refused 11. Do you have a mental health disability that limits your ability to work or perform activities of daily living? Yes No Unknown Refused 12. Do you have an alcohol or drug problem that limits your ability to work or perform activities of daily living? Yes No Unknown Refused

C. Peraro Consulting, LLC, 2015 Statewide Point-In-Time (PIT) Count, April 2015 51
13. Are you currently living with HIV/AIDS? Yes No Unknown Refused 14. Do you have a physical, developmental, or other disability that limits your ability to work or perform activities of daily living? Yes No Unknown Refused Description of Person if Refused Survey:
CHECK THIS BOX WHEN THE SURVEY HAS BEEN ENTERED INTO THE HMIS

C. Peraro Consulting, LLC, 2015 Statewide Point-In-Time (PIT) Count, April 2015 52
Appendix 6: 2015 Non-HMIS Sheltered PIT Survey
Brief Instructions for this Non-HMIS Survey Form
The information in this document is intended for shelters not entering data into the HMIS for the PIT Count
night of 1/25/15. The below instructions should be read prior to filling out the tables.
Please complete this form for the night of Sunday, January 25, 2015.
For providers with more than one shelter, please use a separate form for each shelter.
Email completed forms to [email protected]. Questions may also be directed to this address.
For 2015, HUD has requested a higher level of detail in terms of data collection. This has led to revisions to the
2014 Non-HMIS survey.
Tables 1, 2, and 3 of Section 1 below are meant to be mutually exclusive, with each person sleeping in your
program included in only one of the tables.
Table 1 totals demographic info for households with one adult and at least one child under age 18.
Table 2 totals demographic info for single adults, adult couples with no children, and groups of adults.
Table 3 totals demographic info for persons under age 18, including children in one-child households,
adolescent parents and their children, adolescent siblings, or other household configurations composed only of
children.
Table 4 is required and captures subpopulation information for the persons counted in Tables 1-3.
Subpopulation data should be limited to adults, with the exception of persons in chronically homeless families,
and victims of domestic violence.
HUD is requesting that any veterans counted in Tables 1-3, also be broken out in Section 2, Tables 5 and 6.
These tables follow the same reasoning as above, but are strictly for veteran households, where at least one of
the adults is a veteran.
In 2015, HUD is requesting that any youth counted in Tables 1-3, also be broken out in Section 3, Table 7.
These tables follow the same reasoning as above, but are strictly for youth households less than 25 years of age.
Parenting youth and unaccompanied youth definitions are presented below Table 7 for reference.
Key Chronic Homeless terms for Table 4 are outlined in Appendix A.
Please fill out the next page for identification purposes.

C. Peraro Consulting, LLC, 2015 Statewide Point-In-Time (PIT) Count, April 2015 53
Please fill out the below Shelter and Contact Identification:
Organization Name:
Program Name:
Program Type (e.g. emergency, transitional):
Name of Person Completing Survey:
Email:
Phone #:

C. Peraro Consulting, LLC, 2015 Statewide Point-In-Time (PIT) Count, April 2015 54
Section 1: Population & Subpopulation Requirements for All Households
Table 1: Households with at Least One Adult and One Child TOTAL
1. Total number of households
2. Total number of persons in the above households
Number of children (under age 18)
Number of young adults (age 18-24)
Number of adults (over age 24)
3. Gender (adults and children)
Female
Male
Transgender: male to female
Transgender: female to male
4. Ethnicity (adults and children)
Non-Hispanic/Non-Latino
Hispanic/Latino
5. Race (adults and children) – Please identify only one per person
White
Black or African-American
Asian
American Indian or Alaska Native
Native Hawaiian or Other Pacific Islander
Multiple Races (at least two of the above races)
Table 2: Households without Children TOTAL
1. Total number of households
2. Total number of persons in the above households
Number of young adults (age 18-24)
Number of adults (over age 24)
3. Gender of adults
Female
Male
Transgender: male to female
Transgender: female to male
4. Ethnicity of adults
Non-Hispanic/Non-Latino
Hispanic/Latino
5. Race of adults – Please identify only one per adult
White
Black or African-American
Asian
American Indian or Alaska Native
Native Hawaiian or Other Pacific Islander
Multiple Races (at least two of the above races)
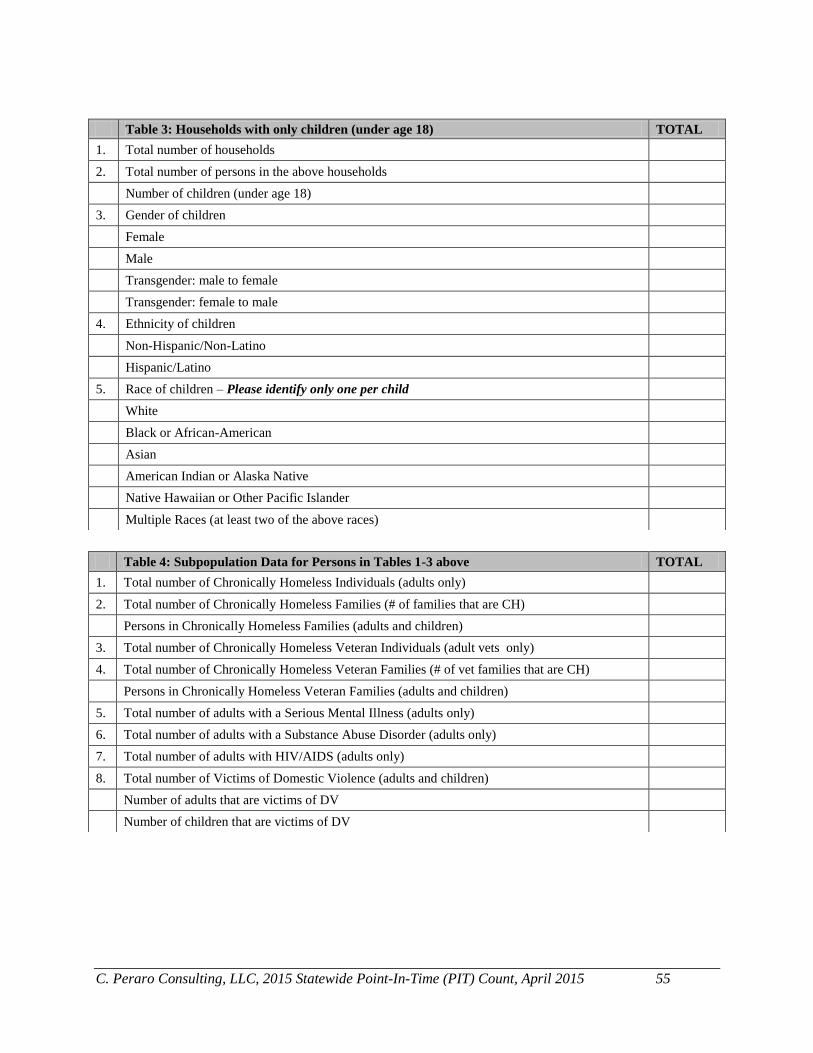
C. Peraro Consulting, LLC, 2015 Statewide Point-In-Time (PIT) Count, April 2015 55
Table 3: Households with only children (under age 18) TOTAL
1. Total number of households
2. Total number of persons in the above households
Number of children (under age 18)
3. Gender of children
Female
Male
Transgender: male to female
Transgender: female to male
4. Ethnicity of children
Non-Hispanic/Non-Latino
Hispanic/Latino
5. Race of children – Please identify only one per child
White
Black or African-American
Asian
American Indian or Alaska Native
Native Hawaiian or Other Pacific Islander
Multiple Races (at least two of the above races)
Table 4: Subpopulation Data for Persons in Tables 1-3 above TOTAL
1. Total number of Chronically Homeless Individuals (adults only)
2. Total number of Chronically Homeless Families (# of families that are CH)
Persons in Chronically Homeless Families (adults and children)
3. Total number of Chronically Homeless Veteran Individuals (adult vets only)
4. Total number of Chronically Homeless Veteran Families (# of vet families that are CH)
Persons in Chronically Homeless Veteran Families (adults and children)
5. Total number of adults with a Serious Mental Illness (adults only)
6. Total number of adults with a Substance Abuse Disorder (adults only)
7. Total number of adults with HIV/AIDS (adults only)
8. Total number of Victims of Domestic Violence (adults and children)
Number of adults that are victims of DV
Number of children that are victims of DV

C. Peraro Consulting, LLC, 2015 Statewide Point-In-Time (PIT) Count, April 2015 56
Section 2: Population Requirements for Veteran Households Only
Table 5: Vet Households with at Least One Adult and One Child TOTAL
1. Total number of households
2. Total number of persons in the above households
Number of children (under age 18)
Number of young adults (age 18-24)
Number of adults (over age 24)
3. Total number of veterans
4. Gender (veterans only)
Female
Male
Transgender: male to female
Transgender: female to male
5. Ethnicity (veterans only)
Non-Hispanic/Non-Latino
Hispanic/Latino
6. Race (veterans only) – Please identify only one per veteran
White
Black or African-American
Asian
American Indian or Alaska Native
Native Hawaiian or Other Pacific Islander
Multiple Races (at least two of the above races)
Table 6: Vet Households without Children TOTAL
1. Total number of households
2. Total number of persons in the above households
Number of persons (age 18-24)
Number of persons (over age 24)
3. Total number of veterans
4. Gender (veterans only)
Female
Male
Transgender: male to female
Transgender: female to male
5. Ethnicity (veterans only)
Non-Hispanic/Non-Latino
Hispanic/Latino
6. Race (veterans only) – Please identify only one per veteran
White
Black or African-American
Asian
American Indian or Alaska Native

C. Peraro Consulting, LLC, 2015 Statewide Point-In-Time (PIT) Count, April 2015 57
Section 3: Population Requirements for Youth Households Only (< 25 yrs old)
*Parenting youth are youth who identify as the parent or legal guardian of one or more children who are present
with or sleeping in the same place as that youth parent, where there is no person over age 24 in the household
**Unaccompanied youth are persons under age 25 who are not presenting or sleeping in the same place as their
parent or legal guardian, including:
A. single youth;
B. youth couples; and
C. groups of youth presenting as a household.
Native Hawaiian or Other Pacific Islander
Multiple Races (at least two of the above races)
Table 7: Youth Households TOTAL
1. Total number of households
Number of parenting youth households*
Number of unaccompanied youth households**
2. Total number of persons in the above households
Total number of persons in parenting youth households
Number of parenting youth (youth parents only)
Number of parenting youth (under age 18)
Number of parenting youth (age 18 to 24)
Number of children with parenting youth (children under 18 w/ parents under 25)
3. Total number of unaccompanied youth
Number of unaccompanied children under age 18
Number of unaccompanied young adults (age 18 to 24)
4. Gender (youth parents and unaccompanied youth only)
Female
Male
Transgender: male to female
Transgender: female to male
5. Ethnicity (youth parents and unaccompanied youth only)
Non-Hispanic/Non-Latino
Hispanic/Latino
6. Race (youth parents and unaccompanied youth only) – Please identify only one per youth
White
Black or African-American
Asian
American Indian or Alaska Native
Native Hawaiian or Other Pacific Islander
Multiple Races (at least two of the above races)

C. Peraro Consulting, LLC, 2015 Statewide Point-In-Time (PIT) Count, April 2015 58
Appendix A: Key Chronic Homeless Terms
These terms do not directly correspond to the program requirements of HUD funding streams and must only be used
for the purposes of the PIT.
Chronically Homeless Individual - An individual who:
A. Is homeless and lives in a place not meant for human habitation, a safe haven, or in an emergency shelter;
and,
B. Has been homeless and living or residing in a place not meant for human habitation, a safe haven, or in an
emergency shelter continuously for at least 1 year or on at least four separate occasions in the last 3 years; and,
C. Can be diagnosed with one or more of the following conditions: substance use disorder, serious mental
illness, developmental disability (as defined in section 102 of the Developmental Disabilities Assistance Bill of
Rights Act of 2000 (42 U.S.C. 15002), post-traumatic stress disorder, cognitive impairments resulting from
brain injury, or chronic physical illness or disability.
Notes: (1) Persons under the age of 18 are not counted as chronically homeless.
(2) For purposes of the PIT, persons living in transitional housing at the time of the PIT Count should not be
included in this subpopulation category.
(3) Persons with the disabling conditions identified above must also meet the qualifications identified in the
term for “disability” (e.g., “is expected to be long-continuing or indefinite duration”).
Chronically Homeless Family – A family with an adult head of household (or if there is no adult in the family, a
minor head of household) who meets all of the criteria for a chronically homeless individual, including a family
whose composition has fluctuated while the head of household has been homeless.
Disability – An individual with one or more of the following conditions:
A. A physical, mental, or emotional impairment, including an impairment caused by alcohol or drug abuse, post-
traumatic stress disorder, or brain injury that:
(1) Is expected to be long-continuing or of indefinite duration;
(2) Substantially impedes the individual's ability to live independently; and
(3) Could be improved by the provision of more suitable housing conditions.
B. A developmental disability, as defined in section 102 of the Developmental Disabilities Assistance and Bill of
Rights Act of 2000 (42 U.S.C. 15002); or
C. HIV/AIDS

C. Peraro Consulting, LLC, 2015 Statewide Point-In-Time (PIT) Count, April 2015 59
Appendix 7: 2015 Overview
Point-In-Time Count (PIT) January 2015 Overview 2015 Key PIT Dates:
Sheltered date for the count is Sunday, January 25, 2015. Individuals and families staying in a shelter on this night will be counted. All sheltered intakes for clients residing in ES, TH, or Safe Haven (SH) programs should be entered into the HMIS by Friday, February 13, 2015. All Non-HMIS summary surveys for providers not participating in the HMIS (e.g. DV shelters) should be completed for clients residing on the night of 1/25/15 and submitted to [email protected] by Friday, February 6, 2015. The non-HMIS survey was sent to providers on 1/5/15.
Unsheltered dates for the 2015 count are Monday, January 26, 2015 to Friday January 30, 2015. ONLY people who responded that they DID NOT stay indoors on Sunday, January 25, 2015 should be surveyed. If a person responds by stating that they were sheltered or stayed indoors on the 25th, discontinue the survey and do not enter it into the PIT module of the HMIS. Ideally, surveying should be done at a variety of times including very early in the morning and late at night. Technically surveying can begin late Sunday night once shelters have closed, however, this is not recommended due to some of the danger it poses to staff or volunteers. Outreach staff may want to consider surveying late Sunday night and into early Monday morning if they are accustomed to this workflow. Service-based counts should also be utilized for surveying. Service-based locations can include soup kitchens, day shelters, libraries, and other community locations. All unsheltered surveys collected during the date range above should be entered into the HMIS by Friday, February 23, 2015.
Kickoff is Monday, January 26th for a concentrated outreach effort in each of the regions, which will continue until Friday, January 30th. Coordinators leading each of the regions will be responsible for determining where and when to start each day. Lead coordinators should be contacted to determine starting times and locations during the unsheltered dates above. It is the hope that outreach staff and volunteers can be utilized as much as possible during the work-week.
Volunteers: Any assistance by students or volunteers during the week of the count is welcomed. All volunteers must register prior to the count with their affiliated organization for their particular region. We are working to establish each of the organizations for Regions 1-7 as soon as possible (along w/ contact information for volunteers) so that volunteers wishing to canvass particular regions or areas can be directed accordingly. Volunteers can be assigned to lead coordinators as needed; however, organizations are also encouraged to recruit volunteers to assist with their efforts. Regional lead coordinators and partnering organizations must make sure that all volunteers working in their areas are adequately trained, documented via the Volunteer Sign-Up Form, and have signed the Contact and Confidentiality form. The training schedule is outlined below. Regional coordinators are urged to conduct volunteer trainings separate from the below training schedule and during the week prior to the count.

C. Peraro Consulting, LLC, 2015 Statewide Point-In-Time (PIT) Count, April 2015 60
Survey Instruments: The survey instruments for 2015 have been slightly modified to accommodate HUD changes and to capture information that will be helpful to the CoC. A copy of the household (accompanied) and single (unaccompanied) surveys will be provided in the next week. It is recommended that the survey form for single clients be printed on white paper due to the vast majority of clients surveyed being unaccompanied, and the survey instrument for households be printed on colored paper. The household form contains one survey page for the head of household and one survey form that should be used for all other adults within the household. Each adult in the household should complete their own survey. The training dates below will review the survey instruments and aspects of data quality in much further detail.
Survey Data Entry: Please ensure that proper channels are established so that all surveys
completed by volunteers and agency staff are routed to regional coordinators responsible for the survey data entry. Before entering survey data, regional coordinators should follow data quality protocols established prior to the count. The trainings above and power points will outline key data quality fundamentals. Surveys must be cleaned before being entered into the HMIS. Volunteers can assist with the cleaning and data entry, however, it is imperative that skilled HMIS staff are involved and overseeing these processes. Data quality is an extremely important aspect of the PIT. Steps for updating client records, and cleaning and entering survey data into the HMIS will be provided before the PIT takes place.

C. Peraro Consulting, LLC, 2015 Statewide Point-In-Time (PIT) Count, April 2015 61
Appendix 8: 2015 Contact and Confidentiality Form Name: Phone #: Position: Agency: E-mail: Emergency Name and Contact #: Preferred Geographic Region:
2015 Point-In-Time Count Statement of Confidentiality MUST BE SIGNED BY ALL SURVEYORS
All agency/outreach staff and volunteers associated with the collection of homeless population data during the 2015 Unsheltered Point in Time Count are subject to certain confidentiality guidelines. These guidelines apply to all data collected during the five day period from January 26th to January 30th and to any data that may subsequently be entered into the HMIS from this period. The State of Hawaii’s HMIS contains an appreciable amount of client information that must be confidentially maintained. There are several guidelines that the State of Hawaii would like to address regarding the collection and entry of client data into the HMIS for agency staff or volunteers.
All client information gathered during the PIT will be held strictly confidential.
All completed surveys will be kept out of public view.
Personal HMIS user identifications and passwords will be kept secure and will not be shared.
Client information viewed from within the HMIS is to remain confidential, regardless of whether an employee’s job is terminated or concludes for any reason.
Falsifying information about any client is strictly prohibited. Your signature below indicates your agreement to comply with this statement of confidentiality. Agency, if Applicable:____________________________________________ Print Name:_________________________________ Signature:__________________________________Date____________________ **Please email or hand-in all completed forms to the lead coordinator or partner agency. The lead coordinator/partner agency will be responsible for collecting all consent forms and submitting them to the State of Hawaii.

C. Peraro Consulting, LLC, 2015 Statewide Point-In-Time (PIT) Count, April 2015 62
Appendix 9: PIT Agency Instructions
AGENCY INSTRUCTIONS UNSHELTERED HOMELESS SURVEYOR INSTRUCTIONS JANUARY 26
th to 30
th, 2015 - HOMELESS POINT-IN-TIME COUNT
Unsheltered canvassing begins Monday, January 26th and ends Friday, January 30
th. The night
of the count is Sunday, January 25th.
Please survey all unsheltered individuals and households that are normally outreached as well as individuals that are randomly encountered during the PIT Count week.
If you have staff and volunteers assisting in the Monday Kickoff or doing outreach during the week, please make sure that it is coordinated with the agency or person who is the lead coordinator for that area. Volunteers should be under the oversight of trained outreach personnel and trained prior to the canvassing week.
Confirm that staff and volunteers helping with the surveying have filled out and signed the Contact and Confidentiality form.
Ensure that proper channels are established so that all surveys completed by volunteers and agency staff are routed to regional coordinators. Before entering survey data, regional coordinators should follow data quality protocols established prior to the count.
Surveys must be cleaned before being entered into the HMIS. Volunteers can assist with the cleaning and data entry, however, it is imperative that skilled HMIS staff are involved and overseeing these processes. Data quality is an extremely important aspect of the PIT; steps for updating client records, and cleaning and entering survey data into the HMIS will be provided before the PIT takes place.
Ensure that staff and volunteers have been properly trained by someone that has attended the PIT training and has reviewed the surveyor instructions handout. Training materials and power points will be delivered several weeks prior to the count’s execution.
Safety Tips for Surveyors
Never survey alone – work in pairs and always stay within eyesight of others.
Never survey in an isolated area unless the area and the clients are known to you.
If there is an area that you do not feel comfortable surveying, do not survey and let the coordinator know that the area was not surveyed.
It is recommended that surveyors wear white or brighter colors to be easily visible. Wear comfortable clothes and shoes. Limit the amount of accessories worn, e.g. earrings, watches, chains, etc.
Look for any suspicious or dangerous activities when arriving at a site and avoid these areas.
Be observant of people around you and look up often while administering the survey.
Stay out of enclosed or tight spaces.
Do not pressure anyone to participate in the survey.
In case of an emergency, call or have another person call 911.

C. Peraro Consulting, LLC, 2015 Statewide Point-In-Time (PIT) Count, April 2015 63
Appendix 10: Additional 2015 PIT Count Instructions
Surveyors and volunteers should review the below information PRIOR to the unsheltered count
week.
Single Survey Key Points
Pre-fill date – Agencies can prepopulate the forms prior to the PIT Count week. This can
save time and improve efficiency during the PIT week. This can be beneficial for clients that
are known to reside in the same general location or frequent specific areas at specific times.
If prefilling forms, clients must still be located and verified as unsheltered during the
canvassing week.
Interviewer’s name, Agency/Group, Site of Interview, and Date fields – These fields should
all have 0% missing data rates. Coordinating agencies responsible for the collection of
surveys should review survey forms daily to ensure that this information has been filled in
correctly. Staff or volunteers responsible for data entry should ensure that these fields have
been filled in on the hardcopy forms prior to entry into the PIT HMIS module
Date field – As a data quality check, all dates should be in the range 1/26/15 to 1/30/15
Site of Interview (Actual Location) - If this is an office location please denote as such
Example: U.S.VETS (Office), CAV (Office). This will allow distinction between interviews
completed “on the streets” versus office settings.
Clients indicating that they were sheltered on the night of 1/25/15 should not be surveyed. If
clients indicate that they were sheltered, STOP, and don’t continue the survey.
Prior to entry into the PIT HMIS module, survey records should be reviewed and checked
against shelter census counts and sheltered locations to ensure that these records are
not entered into the HMIS. Each year there are hundreds of inaccurately entered surveys
that are ultimately weeded out of the dataset. A quick review can save time administratively.
First/Last Name fields (1) – VERY IMPORTANT TO COMPLETE. These fields
are incredibly important to link PIT to HMIS data. The rate of missing information can
be improved as skilled outreach personnel interact with clients that they serve regularly. This
is also why 1) volunteers should be paired with skilled outreach staff, 2) outreach staff are
asked as much as possible to use the whole PIT week, and 3) volunteers should let outreach
personnel know if clients refuse to be surveyed so that they are not missed.
When entering surveys into the PIT module of the HMIS after they have been cleaned,
searching effectively per the guidance outlined on pp. 7-8 of Hawaii’s DQP can increase the
rate of clients with a Client ID existing in the HMIS. The ID acts as a bridge between
datasets for more expansive analysis.
Surveys should be cleaned prior to entry by volunteers or agency staff to ensure that
duplicate surveys are weeded out. After identifying duplicates, one survey should be entered
based on a collection of the information on the duplicate surveys.
DOB field (2) – If client refuses to answer, estimate based on perception – this is better than
unknown/missing data. DQ missing/unknown rates should be very low ~ 0%
Gender (3) - If client refuses to answer, estimate based on perception – this is better than
unknown/missing data. DQ missing/unknown rates should be very low ~ 0%
Race (5) - Filipino should be categorized with “Asian”- to correspond to the most recent
HUD data standard classification

C. Peraro Consulting, LLC, 2015 Statewide Point-In-Time (PIT) Count, April 2015 64
Household (HH) Survey Key Points
In addition to the above bullets, the following salient points will aid in the improvement of
household data collection during the PIT Count week and improve the accuracy of the PIT
reporting.
Number of adults in HH (1) – This number should equal the number of hardcopy HoH and
Other Adult surveys collected for the particular HH. Examples of HHs include families,
couples, and groups of adults. Data quality checks should ensure that these equate prior to
entry into the PIT HMIS module.
Recommended that household forms are printed on colored paper for easy identification and
so that HH surveys are not accidentally entered as singles.
Number of children under 18 (1) – this number should be corroborated by actual children
accounted for during the survey and the number entered should equal the number entered for
questions 16, 17, and 18 on page 2 (back of HoH form).
Children’s demographic information (16-18) – new HUD data collection mandate, the total
number of children when summed for each should equal the result in (1)
Analysis of Oahu and Rural Counties PIT 2014 Names Collection Rates
Table 1: Prevalence of Full Name Collection in the 2014 Oahu PIT Count
Area Total Count # Full Names Collected # Missing Names % With Full Name
1 560 507 53 91%
2 317 298 19 94%
3 102 89 13 87%
4 104 84 20 81%
5 153 128 25 84%
6 5 3 2 60%
7 286 283 3 99%
Total 1,527 1,392 135 91%
GOAL for Oahu PIT 2015: 95%
Table 2: Prevalence of Full Name Collection in the 2014 Rural PIT Count
Island Total Count # Full Names Collected # Missing Names % With Full Name
Maui 486 465 21 96%
Kauai 267 252 15 94%
Hawaii 521 506 15 97%
Total 1,274 1,223 51 96%
GOAL for Rural Counties PIT 2015: 98%

C. Peraro Consulting, LLC, 2015 Statewide Point-In-Time (PIT) Count, April 2015 65
Table 3: Unduplicated HMIS Listing of Active Clients by Program as of
1/13/15
Agency/Program
Total
Persons
Total
Veterans
%
Veterans
Family Life Center - FLC - Homeless Outreach Program 584 44 8%
HOPE Services Hawaii, Inc. - HOPE - Homeless Outreach
Program 1,211 91 8%
Institute for Human Services - IHS - North Shore Homeless
Outreach Program 122 9 7%
Institute for Human Services - IHS - Urban Honolulu
Homeless Outreach Program 48 7 15%
Institute for Human Services - IHS - Waikiki Homeless
Outreach Program 3 0 0%
Kalihi Palama Health Center - KPHC - CBCM SSO
Program 2 0 0%
Kalihi Palama Health Center - KPHC - DHS Homeless
Outreach Program 159 3 2%
Kalihi Palama Health Center - KPHC - PATH Homeless
Outreach Program 169 5 3%
Kauai Economic Opportunity - KEO Homeless Outreach
Program 199 16 8%
Kealahou West Oahu - KWO - Homeless Outreach/Drop-In
Services 598 10 2%
KHAKO, Inc - KHAKO - Homeless Outreach Program 26 0 0%
Legal Aid Society of Hawaii - LASH - Oahu SSO Program 295 43 15%
Mental Health Kokua - MHK - Oahu Activity Center
Homeless Outreach Program 102 6 6%
Project D.A.T.E. - DATE - Homeless Outreach/Drop-In
Services 8 0 0%
Salvation Army - SARMY - Maui Homeless Outreach
Program 325 31 10%
US VETS - USVETS - Islandwide Homeless Outreach
Program 4 4 100%
Waianae Coast Comprehensive Health Center - WCCHC -
Homeless Outreach Program 316 8 3%
Waikiki Health Center - WHC - Homeless Outreach
Program 1,274 92 7%
Subtotal - Rural Counties 2,345 182 8%
TOTAL 5,445 369 7%

C. Peraro Consulting, LLC, 2015 Statewide Point-In-Time (PIT) Count, April 2015 66
Appendix 11: Preparation for the 2015 PIT Count
PIC and BTG Preparation for the 2015 PIT Count Background:
Analysis of the 2013 and 2014 PIT Counts revealed significant discrepancies between
individuals active in the HMIS and the actual canvassing efforts. In an effort to produce a more
accurate count, PIC and BTG asked agencies, especially outreach agencies, to utilize the steps
outlined in this document to help prepare for the 2015 PIT Count.
A key strategy for the 2015 PIT Count was for outreach agencies to use their HMIS active lists
as the basis for clients they should be finding and enumerating during the canvassing period. For
the PIT Count to improve each year, outreach agencies must set higher standards for locating the
clients they serve, as indicated by active HMIS records. All PIC and BTG agencies support
outreach agency efforts during the canvassing period. The steps below will help prepare
agencies for the task.
Key Preparation Steps:
1. Outreach agencies should first print out their active lists from the HMIS. The “Veterans
Total Report” under REPORTS menu is the best reporting function to produce a list that
gives the name, intake date, and last encounter. Select the report and select “client names” in
the checkbox. This report can list all names with the veterans being designated by an
asterisk.
Select the date range. It is recommended to use a one-day date range, e.g. 12/1/2014 thru
12/1/2014. Copy and paste the listing into an excel sheet and sort by last name ascending
and, on separate tabs, sort by intake date, and by encounter date.
2. The produced report should be used to begin “cleaning” your HMIS active listing. In the
months leading up to the count (December and January) canvassers should clean their active
listings, and exit inactive cases or cases that have not had encounters within three months.
Agencies are asked to print a final list on Monday, January 5, 2015, using the above
techniques.
3. It is recommended to edit or close out client records for the following reasons:
a) No encounter in the past 90 days. This list can be obtained by sorting on last encounter
date as described above. Exit information should be as accurate as possible, but lack
thereof should not preclude closeout. Please use the date of the last encounter as the exit
date if exit information is unknown.
b) Currently housed. Some agencies engage housed individuals. If clients are still
receiving services and are permanently housed, these clients should be entered into a
separate SSO HMIS program for your agency that is not assumed to be unsheltered (i.e.
Homeless Outreach). The same closeout procedures apply if housed clients are no longer
receiving services. If you need help or guidance with any of the above, please contact
Carlos Peraro: [email protected].

C. Peraro Consulting, LLC, 2015 Statewide Point-In-Time (PIT) Count, April 2015 67
c) Duplication. Please merge any unique clients (i.e. different Client IDs) that you know to
be duplicates in your programs. If the system will not allow you to merge, please send
the information to Carlos Peraro to merge the individual’s intake records into one client
record. Agency generated duplicates (i.e. same Client ID) should be voided. . Review
Dup/Undup reports under the HMIS Reports menu to help identify these clients.
d) Reducing Aliases. Efforts should be made to obtain consent from active clients with
aliases, and if gained, the alias should be edited to the actual name, then the above
procedures should be followed to avoid duplication.
NOTE: All individuals active in HMIS homeless outreach programs should be confirmed as
literally homeless. Clients with a housing status of “stably housed” or housed through the Hale
O Malama initiative should not be active in Homeless Outreach programs.
Next Steps – General Overview of the 2015 PIT Effort
1. The revised listing as of January 5, 2015 will be considered the agencies’ ACTIVE list of
unsheltered homeless persons for the 2015 PIT Count.
2. Canvassing efforts leading up to the PIT Count should focus on finding ALL THE PEOPLE
ON YOUR ACTIVE LIST and documenting their current homeless status and location of
unsheltered encampment. This should aid in more effectively targeting unsheltered homeless
during the 2015 PIT Count. These efforts can also include prefilling the PIT survey
instruments for clients that agencies know will be unsheltered and have a high probability of
residing in known locations during the count. These clients should still be corroborated
during the unsheltered count week (Jan 26 - 30. However, prefilling can save time and
ultimately improve the 2015 count.
3. Beginning in December 2014, agencies should update active client information in the HMIS
as the clients are encountered in normal outreach duties. Please begin updating actual
location information through encounters so that ALL ACTIVE CLIENTS CAN BE FOUND
(or have a high probability of being found) during the PIT Count period. Strategies to
accomplish this will be discussed in planning meetings. Communication with clients
regarding the upcoming PIT Count should be disseminated as soon as possible.
Thank you for your participation in the upcoming Oahu and Rural Counties PIT Count.
Greg Payton, PIC Chair & Maude Cumming, BTG Chair