state of illinois€¦ · new issue – book‑entry only ratings: see “ratings” herein...
TRANSCRIPT

New Issue – Book‑eNtry oNly ratINgs: see “ratINgs” HereIN
Interest on the Series 2019A Bonds is includible in gross income of the owners thereof for federal income tax purposes. Subject to compliance by the State with certain covenants, in the separate opinions of Chapman and Cutler LLP, Chicago, Illinois, and Charity & Associates, P.C. (“Co‑Bond Counsel”), under present law, interest on the Series 2019B Bonds is excludable from gross income of the owners thereof for federal income tax purposes and is not included as an item of tax preference in computing the federal alternative minimum tax for individuals. Interest on the Bonds is not exempt from present State of Illinois income taxes. See “TAX MATTERS” herein for a more complete discussion.
$440,280,000STATE OF ILLINOIS
General Obligation Bonds,Series of April 2019
$300,000,000 Taxable Series of April 2019A$140,280,000 Tax-Exempt Refunding Series of April 2019B
Dated: Date of Delivery Due: As shown on the inside cover
This Official Statement contains information relating to the State of Illinois (the “State”) and the State’s general obligation bonds, to be issued as General Obligation Bonds, Series of April 2019, in two separate series: General Obligation Bonds, Taxable Series of April 2019A (the “Series 2019A Bonds”) and General Obligation Bonds, Tax-Exempt Refunding Series of April 2019B (the “Series 2019B Bonds” and, together with the Series 2019A Bonds, the “Bonds”). The Bonds will be issued only as fully registered book-entry bonds in denominations of $5,000 or any integral multiple of that amount. The Bonds, when issued, will be registered in the name of Cede & Co., as nominee of The Depository Trust Company (“DTC”), New York, New York, and held under DTC’s global book-entry system. The Bonds will mature on the dates, in the principal amounts, bear interest at the rates per annum and have the prices, yields and CUSIP numbers as shown on the inside cover of this Official Statement. Interest on the (i) Series 2019A Bonds will be payable on April 1 and October 1 of each year, commencing October 1, 2019, and (ii) Series 2019B Bonds will be payable on March 1 and September 1 of each year, commencing September 1, 2019.
The Series 2019A Bonds are subject to redemption prior to maturity as set forth herein.
The Bonds are direct, general obligations of the State, secured by a pledge of its full faith and credit. The Bonds are issued under the General Obligation Bond Act of the State of Illinois, as amended. The Bonds are issued to (i) fund accelerated pension benefit payments, (ii) refund certain general obligation bonds of the State, and (iii) pay costs associated with the issuance of the Bonds.
The Bonds are offered when, as and if issued by the State and received by the Purchasers, subject to prior sale, withdrawal or modification of the offer without notice, and to the approval of legality by Chapman and Cutler LLP, Chicago, Illinois, and Charity & Associates, P.C., Chicago, Illinois Co‑Bond Counsel, and certain other conditions. Chapman and Cutler LLP, Chicago, Illinois, is also acting as Disclosure Counsel to the State. It is expected that beneficial interests in the Bonds will be available for delivery through the facilities of DTC on or about April 9, 2019.
Certain information in the Preliminary Official Statement has been updated in this Official Statement. See “InformatIon Updated from the prelImInary offIcIal Statement” on the inside front cover hereof.
Bofa MerrIll lyNcHSenior Manager
Ifs securItIesCo-Manager
Dated: March 26, 2019
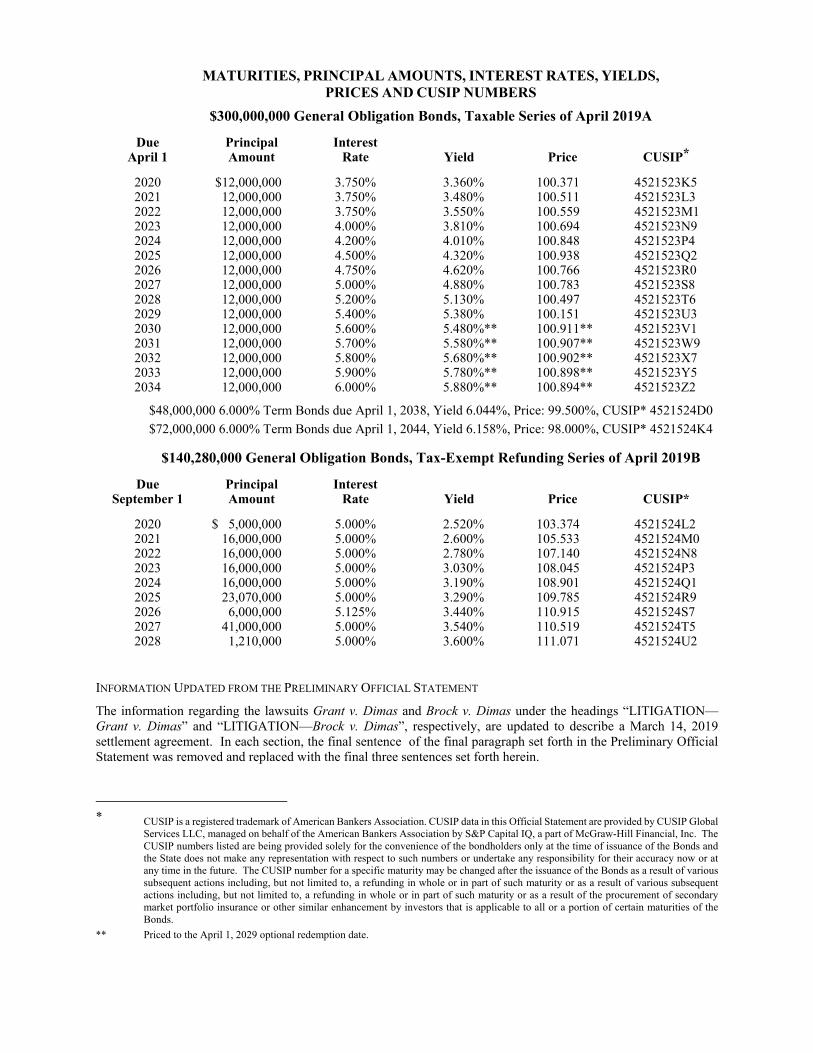
MATURITIES, PRINCIPAL AMOUNTS, INTEREST RATES, YIELDS, PRICES AND CUSIP NUMBERS
$300,000,000 General Obligation Bonds, Taxable Series of April 2019A
Due April 1
Principal Amount
Interest Rate
Yield
Price
CUSIP*
2020 $12,000,000 3.750% 3.360% 100.371 4521523K52021 12,000,000 3.750% 3.480% 100.511 4521523L32022 12,000,000 3.750% 3.550% 100.559 4521523M12023 12,000,000 4.000% 3.810% 100.694 4521523N92024 12,000,000 4.200% 4.010% 100.848 4521523P42025 12,000,000 4.500% 4.320% 100.938 4521523Q22026 12,000,000 4.750% 4.620% 100.766 4521523R02027 12,000,000 5.000% 4.880% 100.783 4521523S82028 12,000,000 5.200% 5.130% 100.497 4521523T62029 12,000,000 5.400% 5.380% 100.151 4521523U32030 12,000,000 5.600% 5.480%** 100.911** 4521523V12031 12,000,000 5.700% 5.580%** 100.907** 4521523W92032 12,000,000 5.800% 5.680%** 100.902** 4521523X72033 12,000,000 5.900% 5.780%** 100.898** 4521523Y52034 12,000,000 6.000% 5.880%** 100.894** 4521523Z2
$48,000,000 6.000% Term Bonds due April 1, 2038, Yield 6.044%, Price: 99.500%, CUSIP* 4521524D0 $72,000,000 6.000% Term Bonds due April 1, 2044, Yield 6.158%, Price: 98.000%, CUSIP* 4521524K4
$140,280,000 General Obligation Bonds, Tax-Exempt Refunding Series of April 2019B
Due September 1
Principal Amount
Interest Rate
Yield
Price
CUSIP*
2020 $ 5,000,000 5.000% 2.520% 103.374 4521524L22021 16,000,000 5.000% 2.600% 105.533 4521524M02022 16,000,000 5.000% 2.780% 107.140 4521524N82023 16,000,000 5.000% 3.030% 108.045 4521524P32024 16,000,000 5.000% 3.190% 108.901 4521524Q12025 23,070,000 5.000% 3.290% 109.785 4521524R92026 6,000,000 5.125% 3.440% 110.915 4521524S72027 41,000,000 5.000% 3.540% 110.519 4521524T52028 1,210,000 5.000% 3.600% 111.071 4521524U2
INFORMATION UPDATED FROM THE PRELIMINARY OFFICIAL STATEMENT
The information regarding the lawsuits Grant v. Dimas and Brock v. Dimas under the headings “LITIGATION—Grant v. Dimas” and “LITIGATION—Brock v. Dimas”, respectively, are updated to describe a March 14, 2019 settlement agreement. In each section, the final sentence of the final paragraph set forth in the Preliminary Official Statement was removed and replaced with the final three sentences set forth herein.
* CUSIP is a registered trademark of American Bankers Association. CUSIP data in this Official Statement are provided by CUSIP Global
Services LLC, managed on behalf of the American Bankers Association by S&P Capital IQ, a part of McGraw-Hill Financial, Inc. The CUSIP numbers listed are being provided solely for the convenience of the bondholders only at the time of issuance of the Bonds and the State does not make any representation with respect to such numbers or undertake any responsibility for their accuracy now or at any time in the future. The CUSIP number for a specific maturity may be changed after the issuance of the Bonds as a result of various subsequent actions including, but not limited to, a refunding in whole or in part of such maturity or as a result of various subsequent actions including, but not limited to, a refunding in whole or in part of such maturity or as a result of the procurement of secondary market portfolio insurance or other similar enhancement by investors that is applicable to all or a portion of certain maturities of the Bonds.
** Priced to the April 1, 2029 optional redemption date.

STATE OF ILLINOIS
$440,280,000 State of Illinois
General Obligation Bonds, Series of April 2019
$300,000,000 Taxable Series of April 2019A $140,280,000 Tax-Exempt Refunding Series of April 2019B
JB Pritzker
Governor
Alexis Sturm Director of the Governor’s Office of Management and Budget
Kelly Hutchinson
Director of Capital Markets

[THIS PAGE INTENTIONALLY LEFT BLANK]

PREFACE No dealer, broker, salesperson, or other person has been authorized by the State of Illinois or the Purchasers to give any information or to make any representations other than those contained in this Official Statement and, if given or made, such other information or representations must not be relied upon as having been authorized by the State. This Official Statement does not constitute an offer to sell or the solicitation of an offer to buy, nor shall there be any sale of the Bonds by any person in any jurisdiction in which it is unlawful for such person to make such offer, solicitation or sale. The information and expressions of opinion set forth herein have been furnished by the State and include information from other sources which the State believes to be reliable. Such information and expressions of opinion are subject to change without notice, and neither the delivery of this Official Statement nor any sale made hereunder shall under any circumstances create any implication that there has been no change since the date thereof.
In connection with the offering of the Bonds, the Purchasers may over-allot or effect transactions which stabilize or maintain the market prices of the Bonds at levels above those which might otherwise prevail in the open market. Such stabilizing, if commenced, may be discontinued at any time. The Purchasers may offer and sell the Bonds to certain dealers and dealer banks and banks acting as agents at prices lower than the public offering prices stated on the inside cover page hereof and such public offering prices may be changed from time to time by the Purchasers.
In making an investment decision, investors must rely on their own examination of the terms of the offering, including the merits and risks involved. These securities have not been recommended by any federal or state securities commission or regulatory authority. Furthermore, the foregoing authorities have not confirmed the accuracy or determined the adequacy of this document. Any representation to the contrary is a criminal offense.
References in this Official Statement to statutes, laws, rules, regulations, resolutions, agreements, reports and documents do not purport to be comprehensive or definitive, and all such references are qualified in their entirety by reference to the particular document, the full text of which may contain qualifications of and exceptions to statements made herein. This Official Statement is submitted in connection with the sale of the Bonds referred to herein and may not be reproduced or used, in whole or in part, for any other purposes.
FORWARD-LOOKING STATEMENTS
This Official Statement contains disclosures which contain “forward-looking statements.” Forward-looking statements include all statements that do not relate solely to historical or current fact, and can be identified by use of words like “may,” “believe,” “will,” “expect,” “project,” “estimate,” “anticipate,” “plan,” or “continue.” These forward-looking statements are based on the current plans and expectations of the State and are subject to a number of known and unknown uncertainties and risks, many of which are beyond its control, that could significantly affect current plans and expectations and the State’s future financial position including but not limited to changes in general economic conditions, demographic trends and federal programs which may affect the transfer of funds from the federal government to the State. As a consequence, current plans, anticipated actions and future financial positions may differ from those expressed in any forward-looking statements made by the State herein. Investors are cautioned not to unduly rely on such forward-looking statements when evaluating the information presented in this Official Statement.
WEBSITE INDEX
APPENDIX F—WEBSITE INDEX contains a list of the websites referenced in this Official Statement. Except as otherwise provided herein, none of the information on these websites is being incorporated by reference into this Official Statement and the links to such websites are being provided only for the convenience of those reading this Official Statement. The State takes no responsibility for any information contained on such websites unrelated to the statements made in this Official Statement or for revisions to information on such websites occurring after the date of this Official Statement. State employees or officers may from time to time make statements or post information to such websites that are constitutionally protected political speech. Such statements are not intended to constitute communication to the investor community concerning the securities or the financial condition of the State. The State disseminates and discloses certain information, including material updates to the State’s bond disclosures, through EMMA (as defined herein). None of the websites listed in APPENDIX F—WEBSITE INDEX is intended to act as a substitute for the disclosure of the information regarding the State posted on EMMA, nor do these websites necessarily include all of the information regarding the State currently disclosed on EMMA. Please review the State’s filings on EMMA for current information on the State’s disclosures.

[THIS PAGE INTENTIONALLY LEFT BLANK]
-i-
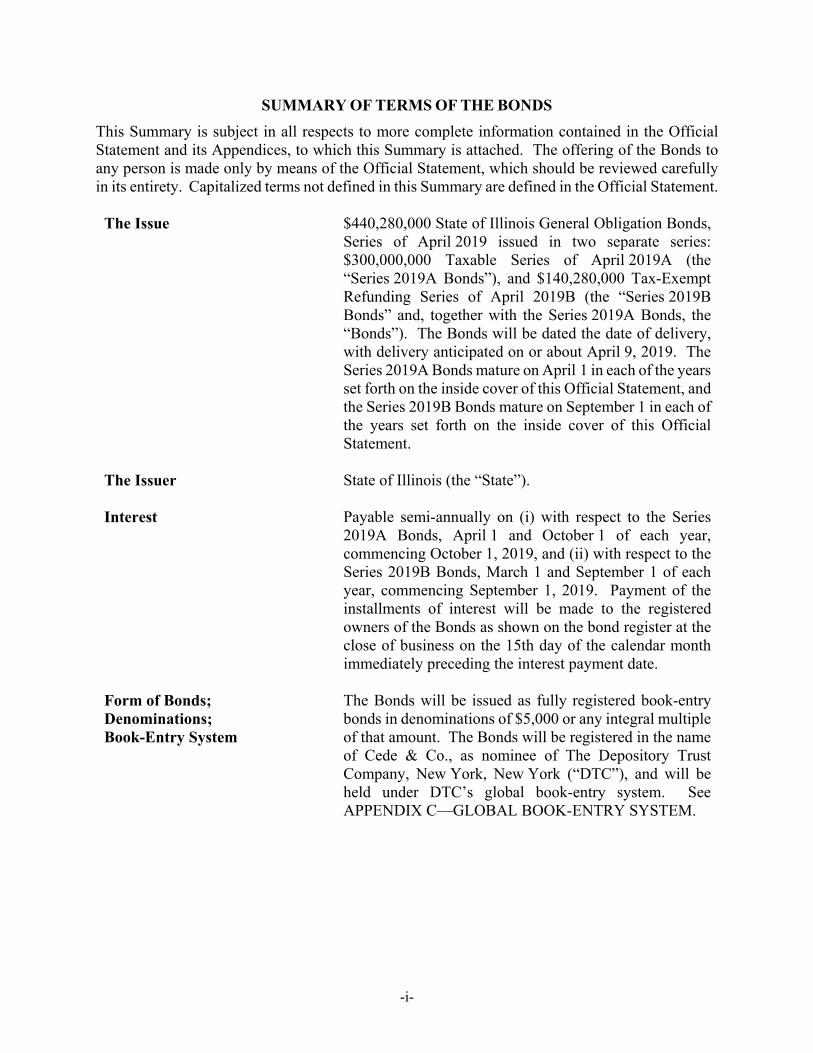
SUMMARY OF TERMS OF THE BONDS This Summary is subject in all respects to more complete information contained in the Official Statement and its Appendices, to which this Summary is attached. The offering of the Bonds to any person is made only by means of the Official Statement, which should be reviewed carefully in its entirety. Capitalized terms not defined in this Summary are defined in the Official Statement.
The Issue $440,280,000 State of Illinois General Obligation Bonds, Series of April 2019 issued in two separate series: $300,000,000 Taxable Series of April 2019A (the “Series 2019A Bonds”), and $140,280,000 Tax-Exempt Refunding Series of April 2019B (the “Series 2019B Bonds” and, together with the Series 2019A Bonds, the “Bonds”). The Bonds will be dated the date of delivery, with delivery anticipated on or about April 9, 2019. The Series 2019A Bonds mature on April 1 in each of the years set forth on the inside cover of this Official Statement, and the Series 2019B Bonds mature on September 1 in each of the years set forth on the inside cover of this Official Statement.
The Issuer State of Illinois (the “State”).
Interest Payable semi-annually on (i) with respect to the Series 2019A Bonds, April 1 and October 1 of each year, commencing October 1, 2019, and (ii) with respect to the Series 2019B Bonds, March 1 and September 1 of each year, commencing September 1, 2019. Payment of the installments of interest will be made to the registered owners of the Bonds as shown on the bond register at the close of business on the 15th day of the calendar month immediately preceding the interest payment date.
Form of Bonds; Denominations; Book-Entry System
The Bonds will be issued as fully registered book-entry bonds in denominations of $5,000 or any integral multiple of that amount. The Bonds will be registered in the name of Cede & Co., as nominee of The Depository Trust Company, New York, New York (“DTC”), and will be held under DTC’s global book-entry system. See APPENDIX C—GLOBAL BOOK-ENTRY SYSTEM.

-ii-
Use of Proceeds The Series 2019A Bonds are being issued to fund accelerated pension benefit payments pursuant to Section 7.7 of the Bond Act (as hereinafter defined) and pay costs associated with the issuance of the Series 2019A Bonds. The Series 2019B Bonds are being issued to refund certain general obligation bonds of the State and pay costs associated with the issuance of the Series 2019B Bonds. See “THE OFFERING—FINANCING PLAN.”
Optional Redemption The Series 2019B Bonds are not subject to optional redemption prior to maturity. The Series 2019A Bonds maturing on or after April 1, 2030, are subject to redemption prior to maturity, at the option of the State on any date on or after April 1, 2029, in whole, or in part in integral multiples of $5,000, and if in part from such maturities as shall be selected by the State, less than all of the Series 2019A Bonds of a single maturity to be selected as described under “THE OFFERING—REDEMPTION–Redemption Procedure,” at a redemption price equal to 100% of the principal amount of the Series 2019A Bonds to be redeemed, plus accrued interest to the date of redemption. See “THE OFFERING—REDEMPTION –Optional Redemption.”
Mandatory Sinking Fund Redemption
The Series 2019A Bonds maturing on April 1, 2038, and April 1, 2044 are subject to mandatory sinking fund redemption prior to maturity, at a redemption price equal to the principal amount to be redeemed plus accrued interest to the date of redemption, as provided in this Official Statement. See “THE OFFERING—REDEMPTION –Mandatory Redemption.”

-iii-
Security for the Bonds; Provisions for Payment Are Irrepealable
The Bonds are direct, general obligations of the State and, pursuant to Section 9(a) of Article IX of the Illinois Constitution and the General Obligation Bond Act of the State of Illinois, as amended (the “Bond Act”), the full faith and credit of the State is pledged for the punctual payment of interest on all bonds issued under the Bond Act, including the Bonds, as it comes due and for the punctual payment of the principal of all bonds issued under the Bond Act, including the Bonds, at maturity, or on any earlier redemption date, and redemption premium, if any. These provisions are irrepealable until all bonds issued under the Bond Act, including the Bonds, are paid in full as to both principal and interest. See “SECURITY.”
The Bond Act creates a separate fund in the State Treasury called the “General Obligation Bond Retirement and Interest Fund” (the “GOBRI Fund”) to be used for repayment of all bonds issued under the Bond Act. On or before the last day of each month, the Bond Act requires the Illinois State Treasurer (the “Treasurer”) and the Illinois State Comptroller (the “Comptroller”) to transfer from the General Revenue Fund to the GOBRI Fund an amount sufficient to pay the aggregate amount of principal of, interest on and redemption premium, if any, on all bonds issued under the Bond Act payable on the next payment date, divided by the number of full calendar months between the date of such bonds and the first such payment date, and thereafter, divided by the number of months between each succeeding payment date after the first payment date. With respect to bonds issued under Section 4(a) of the Bond Act or bonds issued under the authorization of Public Act 98-781 (or bonds issued to refund such bonds), the Treasurer and the Comptroller are required to make such transfers from the Road Fund. Historical fund transfers to the GOBRI Fund are further detailed under “SECURITY—STATE FUNDING PAYMENTS.”
See “GENERAL OBLIGATION INDEBTEDNESS — OUTSTANDING GENERAL OBLIGATION BONDS” for a description of the general obligation bonds authorized, previously issued and outstanding under the Bond Act and prior bond acts.

-iv-
Irrevocable and Continuing Appropriation
The Bond Act requires the Governor of the State (the “Governor”) to include in each annual State Budget an appropriation of moneys in an amount as will be necessary and sufficient, for the period covered by such Budget, to pay the interest, as it becomes payable, on all outstanding bonds issued under the Bond Act and to pay and discharge the principal and redemption premium, if any, of bonds falling due during such period. The Bond Act requires the Illinois General Assembly to make appropriations annually to pay the principal of, interest on and redemption premium, if any, on outstanding bonds issued under the Bond Act from the GOBRI Fund.
The Bond Act itself constitutes an irrevocable and continuing appropriation of all amounts necessary to pay the principal of, interest on and redemption premium, if any, on outstanding bonds issued under the Bond Act, and the irrevocable and continuing authority for and direction to the Treasurer and the Comptroller to make the necessary transfers, as directed by the Governor, out of and disbursements from the revenues and funds of the State. See “SECURITY.”
Tax Treatment of Interest In the separate opinions of Chapman and Cutler LLP, Chicago, Illinois, and Charity & Associates, P.C., Chicago, Illinois, Co-Bond Counsel, to be delivered upon the issuance of the Bonds, under present law, (i) interest on the Series 2019A Bonds is includible in gross income of the owners thereof for federal income tax purposes and (ii) interest on the Series 2019B Bonds is excludable from gross income of the owners thereof for federal income tax purposes and is not included as an item of tax preference in computing the federal alternative minimum tax for individuals. Interest on the Bonds is not exempt from present State of Illinois income taxes. See “TAX MATTERS” for a more complete discussion.
Ratings Moody’s Investors Service, Inc. has assigned a rating of “Baa3” (Stable Outlook) to the Bonds, S&P Global Ratings has assigned a rating of “BBB-” (Stable Outlook) to the Bonds and Fitch Ratings Inc. has assigned a rating of “BBB” (Negative Outlook) to the Bonds. See “RATINGS.”

-v-
Miscellaneous Additional information regarding the Bonds and this Official Statement is available by contacting the Governor’s Office of Management and Budget, 100 West Randolph Street, Suite 15-100, Chicago, Illinois 60601; telephone: (312) 814-0023.

-vi-
TABLE OF CONTENTS
INTRODUCTION ...........................................................................................................................1 Security ...................................................................................................................................2 Tax Treatment of Interest ........................................................................................................2 Website Index .........................................................................................................................2 Authority for Issuance .............................................................................................................2
THE OFFERING .............................................................................................................................3 Description of Bonds ..............................................................................................................3 Redemption .............................................................................................................................3 Financing Plan ........................................................................................................................5 Application of Bond Proceeds ................................................................................................7
SECURITY ......................................................................................................................................7 Direct, General Obligations ....................................................................................................7 State Funding Payments ..........................................................................................................8
CERTAIN INVESTMENT CONSIDERATIONS ........................................................................10 Investment Considerations Relating to the Financial Condition of the State .......................10
STATE OF ILLINOIS ...................................................................................................................13 Organization ..........................................................................................................................13 Constitutional Provisions ......................................................................................................14 Governor’s Office of Management and Budget ....................................................................15
STATE FINANCIAL INFORMATION ........................................................................................15 Sources ..................................................................................................................................15 Measurement Bases ..............................................................................................................16 Financial Reports ..................................................................................................................16 Net Position of Governmental Activities ..............................................................................17 Financial Results: FY2014-FY2018 ....................................................................................17 Accounts Payable ..................................................................................................................21 Authorization for Expenditures in the Absence of a Budget – Fiscal Years 2016 and 2017 .......................................................................................................................21 Review of Fiscal Year 2016 ..................................................................................................22 Review of Fiscal Year 2017 ..................................................................................................23 Review of Fiscal Year 2018 ..................................................................................................25 Fiscal Year 2019 Budget .......................................................................................................29 Fiscal Year 2020 Budget Proposal ........................................................................................30 Collective Bargaining ...........................................................................................................33 Economic and Fiscal Policy Report: FY 2019–FY 2024......................................................34

-vii-
GENERAL OBLIGATION INDEBTEDNESS .............................................................................34 Outstanding General Obligation Bonds ................................................................................34 Short-Term Debt ...................................................................................................................38 Investment of Funds ..............................................................................................................38 Future Financings..................................................................................................................38
REVENUE OBLIGATIONS .........................................................................................................39 State Revenue Bonds ............................................................................................................39 Build Illinois .........................................................................................................................39 Metropolitan Exposition and Auditorium Authorities—Civic Center Program ...................39 State Authority Revenue Bonds ............................................................................................42 Metropolitan Pier and Exposition Authority—Expansion Project Bonds ............................42 Illinois Sports Facilities Authority ........................................................................................42 Railsplitter Tobacco Settlement Authority ...........................................................................42 Moral Obligation Bonds and Other Moral Obligation Commitments ..................................45 Agricultural Loan Guarantee Program ..................................................................................46
PENSION AND OTHER POST EMPLOYMENT BENEFITS ....................................................46
LITIGATION .................................................................................................................................46 Beeks v. Bradley and Memisovski v. Maram .........................................................................46 Illinois (Dep’t of Central Mgmt. Servs.) v. ILRB ..................................................................47 N.B. v. Norwood ....................................................................................................................47 Ligas v. Norwood ..................................................................................................................47 Rasho v. Walker ....................................................................................................................48 Grant v. Dimas ......................................................................................................................49 Brock v. Dimas ......................................................................................................................49 Cahokia Unit School District No. 187 v. Gov. Rauner and the State of Illinois ...................50 Koss v. Norwood and Dimas .................................................................................................50
RATINGS ......................................................................................................................................50
PURCHASE ...................................................................................................................................51
TAX MATTERS ............................................................................................................................51 The Series 2019A Bonds ......................................................................................................51 The Series 2019B Bonds .......................................................................................................51 State Tax Treatment ..............................................................................................................54
CONTINUING DISCLOSURE .....................................................................................................54
CERTAIN LEGAL MATTERS .....................................................................................................55
AUDITED FINANCIAL STATEMENTS .....................................................................................55

-viii-
MUNICIPAL ADVISOR ...............................................................................................................55
ADDITIONAL INFORMATION ..................................................................................................56
MISCELLANEOUS ......................................................................................................................57
APPENDIX A—CERTAIN INFORMATION REGARDING THE STATE OF ILLINOIS .................................................................................................................................... A-1
Part I: Measures of Debt Burden ....................................................................................... A-1 Part II: Historical State Receipts, Appropriations and Disbursements .............................. A-3 Part III: Economic Data .................................................................................................... A-6 Part IV: Tax Review ........................................................................................................ A-12
APPENDIX B—FORM OF APPROVING OPINION OF CO-BOND COUNSEL ....................B-1
APPENDIX C—GLOBAL BOOK-ENTRY SYSTEM ...............................................................C-1
APPENDIX D—FORM OF CONTINUING DISCLOSURE UNDERTAKING ....................... D-1
APPENDIX E—PENSION AND OTHER POST EMPLOYMENT BENEFITS ....................... E-1
APPENDIX F—WEBSITE INDEX ............................................................................................ F-1
APPENDIX G—ACCOUNTING PRACTICES USED IN STATE FINANCIAL INFORMATION......................................................................................................................... G-1
APPENDIX H— GENERAL OBLIGATION BONDS REFUNDED BY THE BONDS ....................................................................................................................................... H-1

-ix-
INDEX TO TABLES Table Number Title Page
1 Cash Balances by Fund Category as of End of Fiscal Years 2014–2018 ............................8 2 General Obligation Bonds Transfers to the GOBRI Fund for Payment of
Debt Service Fiscal Years 2014-2018 ................................................................................10 3 General Funds Analysis of Revenues ................................................................................19 4 General Funds Analysis of Expenditures ...........................................................................20 5 Accounts Payable as of the End of Each Fiscal Year 2013-2018 ......................................21 6 General Obligation Bond Authorization ............................................................................35 7 Maturity Schedule – General Obligation Bonds ................................................................36 8 Outstanding General Obligation Bonds .............................................................................37 9 Maturity Schedule – State Revenue Bonds ........................................................................41 10 Maturity Schedule – State Authority Revenue Bonds .......................................................44 A-1 Ratio of General Obligation Debt Service to Total General and Road Fund
Appropriations Fiscal Years 2014-2018 ......................................................................... A-1 A-2 Ratio of General Obligation Debt Outstanding to Illinois Personal Income
Fiscal Years 2014-2018 .................................................................................................. A-1 A-3 General Obligation Debt Per Capita – Illinois Fiscal Years 2014-2018 ......................... A-2 A-4 10 Year History of Receipts, Appropriations and Warrants ........................................... A-3 A-5 Cash Receipts and Disbursement – General Funds Fiscal Years 2014-2018 ................. A-4 A-6 Cash Receipts and Disbursements – Road Fund Fiscal Years 2014-2018 ..................... A-5 A-7 Per Capita Real GDP (Chained 2012 Dollars) Calendar Years 2013-2017 .................... A-6 A-8 Non-Agricultural Payroll Jobs by Industry Calendar Year 2018 .................................... A-6 A-9 Agricultural Exports Calendar Year 2017 ...................................................................... A-7 A-10 Per Capita Personal Income Calendar Years 2013-2017 ................................................ A-8 A-11 Unemployment Rate Calendar Years 2014-2018 ........................................................... A-9 A-12 Population Illinois and Selected Metropolitan Statistical Areas by Census
Years ............................................................................................................................. A-10 A-13 Illinois Population by Age Group by Calendar Year .................................................... A-10 A-14 Illinois-Based Companies Included in the Fortune 500 ................................................ A-11 G-1 General Funds Summary of Transactions Fiscal Year Ended June 30, 2018 ................. G-1 G-2 State of Illinois General Funds Reconciliation – Fiscal Year 2017 ................................ G-2 H General Obligation Bonds Refunded by the Series 2019B Bonds ................................. H-1

[THIS PAGE INTENTIONALLY LEFT BLANK]

$440,280,000 State of Illinois
General Obligation Bonds Series of April 2019
$300,000,000 Taxable Series of April 2019A $140,280,000 Tax-Exempt Refunding Series of April 2019B
INTRODUCTION This Introduction contains only a brief summary of certain terms of the Bonds being offered and a brief description of this Official Statement. All statements contained in this Introduction are qualified in their entirety by reference to the entire Official Statement. References to, and summaries of, provisions of the Illinois Constitution and laws of the State of Illinois and any documents referred to herein do not purport to be complete and such references are qualified in their entirety by reference to the complete provisions thereof. The purpose of this Official Statement (which includes the cover page and the Appendices) is to set forth certain information concerning the State of Illinois (the “State”) and the State’s $440,280,000 General Obligation Bonds, Series of April 2019 issued in two separate series: $300,000,000 General Obligation Bonds, Taxable Series of April 2019A (the “Series 2019A Bonds”), and $140,280,000 General Obligation Bonds, Tax-Exempt Refunding Series of April 2019B (the “Series 2019B Bonds”, and, together with the Series 2019A Bonds, the “Bonds”). The Series 2019A Bonds are being issued to fund accelerated pension benefit payments pursuant to Section 7.7 of the General Obligation Bond Act of the State of Illinois (30 ILCS 330/1 et seq.), as amended (the “Bond Act”), and to pay costs associated with the issuance of the Series 2019A Bonds. The Series 2019B Bonds are being issued to refund certain general obligation bonds of the State pursuant to Section 16 of the Bond Act and to pay costs associated with the issuance of the Series 2019B Bonds. The use of the proceeds of the Bonds is more completely described under “THE OFFERING—FINANCING PLAN.” Illinois is a sovereign state of the United States and is an issuer of debt securities. The State’s powers and functions are subject to the Illinois Constitution of 1970 (the “Illinois Constitution”) and to laws adopted by the Illinois General Assembly (the “General Assembly”), limited only by federal law and the State’s jurisdiction. See “STATE OF ILLINOIS.” Illinois is a state of diversified economic strengths. The State has a population of over 12 million, with per capita personal income that exceeds that of the United States and the Great Lakes region. The State has a broad employment base and diverse workforce composition that mirrors the United States as a whole. The State is home to 37 Fortune 500 companies, many of which are located in Chicago, the State’s largest city and the largest city in the Midwest. The State is a major transportation hub, with five major trucking routes intersecting in the State, and is the only state where all seven Class 1 transcontinental railroads operate. O’Hare International Airport is the nation’s second busiest airport, maintaining direct flights to national and worldwide destinations, making it a key passenger and freight handling facility. In addition, Chicago Midway International Airport is the nation’s 25th busiest airport. See “STATE OF ILLINOIS,” “STATE FINANCIAL INFORMATION” and APPENDIX A—CERTAIN INFORMATION REGARDING THE STATE OF ILLINOIS for sources and information regarding the State.

-2-
SECURITY The Bonds are direct, general obligations of the State (“GO Bonds”), and, pursuant to the Bond Act, the full faith and credit of the State is pledged for the punctual payment of interest on all GO Bonds issued under the Bond Act, including the Bonds, as it comes due and for the punctual payment of the principal thereof at maturity, or any earlier redemption date, and premium, if any. These provisions of the Bond Act are irrepealable until all GO Bonds issued under the Bond Act are paid in full as to both principal and interest. See “SECURITY—STATE FUNDING PAYMENTS.” TAX TREATMENT OF INTEREST In the separate opinions of Chapman and Cutler LLP, Chicago, Illinois, and Charity & Associates, P.C., Chicago, Illinois (collectively, both firms are referred to herein as “Co-Bond Counsel”) to be delivered upon the issuance of the Bonds, under present law, (i) interest on the Series 2019A Bonds is includible in gross income of the owners thereof for federal income tax purposes and (ii) interest on the Series 2019B Bonds is excludable from gross income of the owners thereof for federal income tax purposes and is not included as an item of tax preference in computing the federal alternative minimum tax for individuals. Interest on the Bonds is not exempt from present State of Illinois income taxes. See “TAX MATTERS” for a more complete discussion. WEBSITE INDEX APPENDIX F—WEBSITE INDEX contains a list of the websites referenced in this Official Statement. Except as otherwise provided herein, none of the information on these websites is being incorporated by reference into this Official Statement and the links to such websites are being provided only for the convenience of those reading this Official Statement. AUTHORITY FOR ISSUANCE GO Bonds of the State may be authorized by a vote of three-fifths of the members of each house of the General Assembly or by a majority of the voters at a general election. See “STATE OF ILLINOIS—CONSTITUTIONAL PROVISIONS–Constitutional Provisions Relating to Long-Term Borrowing.” The Bond Act, which has been approved by the requisite three-fifths vote of each house of the General Assembly, authorizes the issuance of multiple capital and special purpose GO Bonds in the aggregate amount of $57,717,925,743, excluding GO refunding bonds. The Series 2019B Bonds constitute refunding bonds under the Bond Act. The Bond Act further authorizes the issuance of GO Bonds in the amount of up to $4,839,025,000, at any time and from time to time outstanding, for the purpose of refunding any outstanding GO Bonds. Public Act 100-23 amended the Bond Act to add Section 7.6, which authorized the additional issuance of GO Bonds in the amount of up to $6,000,000,000 (collectively, the “Section 7.6 Bonds”), the proceeds of which were to be used for the purpose of paying vouchers incurred by the State prior to July 1, 2017. The Section 7.6 Bonds in the aggregate principal amount of $6,000,000,000 were issued on November 8, 2017 and the proceeds were spent to pay vouchers as described under “STATE FINANCIAL INFORMATION—FISCAL YEAR 2018 BUDGET” herein. Public Act 100-587 amended the Bond Act to add Section 7.7, which authorized the additional issuance of GO Bonds in the amount of $1,000,000,000 (the “Section 7.7 Bonds”), the proceeds of which are to be used to make accelerated pension benefit payments with respect to certain of the State’s retirement systems. The Series 2019A Bonds described hereunder will use a portion

-3-
of the State’s authorization to issue Section 7.7 Bonds. See APPENDIX E—PENSION AND OTHER POST EMPLOYMENT BENEFITS” for additional information. The respective amounts of GO Bonds outstanding and GO refunding bonds outstanding are set forth in Table 6. See “GENERAL OBLIGATION INDEBTEDNESS—OUTSTANDING GENERAL OBLIGATION BONDS–Table 6–General Obligation Bond Authorization.” The Bond Act places certain restrictions on the issuance of GO Bonds, including a requirement (the “7% Requirement”) that GO Bonds may not be issued if, in the next State fiscal year after the issuance of such GO Bonds, the amount of debt service on all then-outstanding GO Bonds (other than GO Bonds issued to pay pension obligations in 2010 and 2011 and Section 7.6 Bonds) exceeds 7% of the general funds (consisting, under the Bond Act, of the General Revenue Fund, the Common School Fund, the General Revenue–Common School Special Account Fund and the Education Assistance Fund) and Road Fund appropriations for the fiscal year immediately prior to the fiscal year of the issuance. Debt service payments on all outstanding GO Bonds and on short-term certificates (issued as described under “STATE OF ILLINOIS—CONSTITUTIONAL PROVISIONS–Constitutional Provisions Relating to Short-Term Borrowing,” and “GENERAL OBLIGATION INDEBTEDNESS—SHORT TERM DEBT”), are made from a separate fund in the State Treasury called the “General Obligation Bond Retirement and Interest Fund” (the “GOBRI Fund”). For additional information, see “SECURITY–STATE FUNDING PAYMENTS.”
THE OFFERING DESCRIPTION OF BONDS The Bonds will bear interest from their issue date and will mature as shown on the inside cover of this Official Statement. Interest on the Series 2019A Bonds is payable semiannually on April 1 and October 1 of each year, beginning on October 1, 2019, at the rates per annum specified on the inside cover of this Official Statement. Interest on the Series 2019B Bonds is payable semiannually on March 1 and September 1 of each year, beginning on September 1, 2019, at the rates per annum specified on the inside cover of this Official Statement. Payment of the installments of interest will be made to the registered owners of the Bonds as shown on the bond register at the close of business on the record date, which is the 15th day of the calendar month immediately preceding the interest payment date. Purchases of the Bonds will be made in denominations of $5,000 principal amount or any integral multiple thereof, and will be registered in the name of Cede & Co., as nominee of The Depository Trust Company, New York, New York (“DTC”). DTC will act as securities depository of the Bonds. Principal of, premium, if any, and interest on the Bonds will be paid by the Treasurer, as bond registrar and paying agent (the “Bond Registrar”), to DTC or its nominee, which will in turn remit such payment to its participants for subsequent disbursement to the beneficial owners of the Bonds. See APPENDIX C—GLOBAL BOOK-ENTRY SYSTEM. REDEMPTION Optional Redemption The Series 2019A Bonds maturing on or after April 1, 2030 are subject to redemption prior to maturity at the option of the State on any date on or after April 1, 2029, in whole or in part, and if

-4-
in part, from such maturities as shall be selected by the State, less than all of the Series 2019A Bonds of a single maturity to be selected as described under “–Redemption Procedure” below, in integral multiples of $5,000, at a redemption price equal to 100% of the principal amount of the Series 2019A Bonds to be redeemed, plus accrued and unpaid interest on the Series 2019A Bonds to be redeemed to the redemption date. The Series 2019B Bonds are not subject to optional redemption prior to maturity. Mandatory Sinking Fund Redemption The Series 2019A Bonds maturing on April 1, 2038 and April 1, 2044 (collectively, the “Series 2019A Term Bonds”) are subject to mandatory sinking fund redemption in part and selected as described under “Redemption Procedure” below, on April 1 of the years and at a redemption price of par plus accrued interest to the date of redemption in the respective principal amounts shown for such years in the tables below.
SERIES 2019A TERM BOND DUE APRIL 1, 2038
YEAR
PRINCIPAL AMOUNT TO BE REDEEMED
2035 $12,000,000 2036 12,000,000 2037 12,000,000 2038 (maturity) 12,000,000
SERIES 2019A TERM BOND DUE APRIL 1, 2044
YEAR
PRINCIPAL AMOUNT TO BE REDEEMED
2039 $12,000,000 2040 12,000,000 2041 12,000,000 2042 12,000,000 2043 12,000,000 2044 (maturity) 12,000,000
The mandatory sinking fund payments are required to be made in each designated year prior to maturity of the Series 2019A Term Bonds in amounts sufficient to redeem the principal amount of such Series 2019A Bonds shown for such years in the above table. The State may provide for the purchase of all or a portion of the Series 2019A Term Bonds that are subject to mandatory redemption, from its lawfully available funds, on or prior to the 60th day preceding any date of mandatory redemption, at a price not in excess of the principal amount of the Series 2019A Term Bonds to be so purchased on such mandatory redemption date. Any Series 2019A Term Bond so purchased will be cancelled and credited against the mandatory sinking fund payments due on such mandatory redemption date. Whenever any Series 2019A Term Bond is redeemed prior to maturity, the principal amount of such Series 2019A Term Bond so redeemed or cancelled shall be credited against the unsatisfied

-5-
balance of future sinking fund installments and final maturity amount established with respect to such Series 2019A Term Bond in such order as shall be directed by the Governor of the State or by the Director (as defined herein). Redemption Procedure The Series 2019A Bonds will be redeemed only in the principal amount of $5,000 and integral multiples thereof. While the Series 2019A Bonds are registered in the Book-Entry Only System and so long as DTC or a successor securities depository is the sole registered owner of the Series 2019A Bonds, if less than all of the Series 2019A Bonds of a series and maturity are to be redeemed prior to maturity, the selection for redemption of such series and maturity of Series 2019A Bonds will be made pro rata among the holders in accordance with the operational arrangements of DTC or such successor securities depository then in effect. See APPENDIX C—GLOBAL BOOK-ENTRY SYSTEM. Notice of any redemption of Series 2019A Bonds will be sent by certified or first-class mail not less than 30 nor more than 60 days prior to the date fixed for redemption to the registered owner of each Series 2019A Bond (or portion thereof) to be redeemed at the address shown on the registration books of the State maintained by the Bond Registrar, or at such other address as is furnished in writing by such registered owner to the Bond Registrar. Failure to give the notice of redemption required above as to any Series 2019A Bond, or any defect therein as to any Series 2019A Bond, will not affect the validity of the proceedings for the redemption of any other Series 2019A Bond. Any notice given as described above shall be conclusively presumed to have been given whether or not actually received by the appropriate addressee. With respect to an optional redemption of any Series 2019A Bonds, such notice may, at the option of the State, provide that said redemption is conditioned upon the receipt by the Series 2019A Bond Registrar on or prior to the date fixed for redemption of moneys sufficient to pay the applicable redemption price. If such moneys are not so received by the redemption date, such redemption notice will be of no force and effect, the State will not redeem such Series 2019A Bonds, the applicable redemption price will not be due and payable, and the Bond Registrar will give notice, in the same manner in which the notice of redemption was given, that such moneys were not so received and that such Series 2019A Bonds will not be redeemed. Unless the notice of redemption is made conditional as described above, on or prior to any redemption date, the Treasurer shall provide for deposit with the Bond Registrar of an amount of money sufficient to pay the redemption price of all the Series 2019A Bonds or portions of Series 2019A Bonds which are to be redeemed on that date. When notice of redemption has been given and the redemption price has been deposited with the Bond Registrar as hereinabove provided, the Series 2019A Bonds or portions of Series 2019A Bonds so to be redeemed shall on the date fixed for redemption become due and payable at the redemption price therein specified, and from and after such date, provided that funds are on deposit therefor, such Series 2019A Bonds or portions of Series 2019A Bonds shall cease to bear interest. FINANCING PLAN The proceeds of the Series 2019A Bonds will be used to (i) fund the advanced payment of pension benefits for certain of the State’s retirement systems in accordance with the provisions of the Illinois Pension Code, as amended (the “Pension Code”), and (ii) pay the costs of issuance of the Series 2019A Bonds. The proceeds of the Series 2019A Bonds will be deposited directly into the

-6-
State Pension Obligation Acceleration Bond Fund of the State, and the Comptroller and Treasurer will use the amounts so deposited to make the accelerated pension benefit payments in accordance with the Pension Code. See “APPENDIX E—PENSION AND OTHER POST-EMPLOYMENT BENEFITS” for additional information. The proceeds of the Series 2019B Bonds will be used to (i) refund certain outstanding maturities of the State’s outstanding general obligation bonds, as described in APPENDIX H hereto (collectively, the “Refunded Bonds”), and (ii) pay the costs of issuance of the Series 2019B Bonds. Table H-1 in APPENDIX H sets forth the additional information with respect to the Refunded Bonds, including the maturity date, interest rate and principal amount and CUSIP number for each maturity of the Refunded Bonds. All of the Refunded Bonds will be redeemed on May 9, 2019 (the “Redemption Date”) at a redemption price of par plus accrued interest to the Redemption Date by deposit of the portion of the proceeds of the Series 2019B Bonds with the hereinafter defined Escrow Agent. Refunding Escrow. In order to provide for the refunding of the Refunded Bonds, certain proceeds of the Series 2019B Bonds will be deposited into an escrow account (the “Escrow Account”) created pursuant to an Escrow Agreement (the “Escrow Agreement”), between the State and Zions Bancorporation, National Association (the “Escrow Agent”). The Escrow Account will be used to pay the Refunded Bonds on the Redemption Date. The remaining amounts in the Escrow Account will be used to purchase United States Treasury Obligations (the “Government Securities”), the principal of which together with the interest to be earned thereon and a beginning cash deposit will be sufficient (i) to pay when due the interest on the Refunded Bonds to their Redemption Date, and (ii) to redeem the Refunded Bonds on the Redemption Date at the Redemption Price. All moneys and Government Securities deposited for the payment of the Refunded Bonds, including interest thereon, are required to be applied solely and irrevocably to the payment of the Refunded Bonds. Neither the maturing principal of the Government Securities nor the interest to be earned thereon will serve as security or be available for the payment of the principal of, premium, if any, and interest on the Series 2019B Bonds. The Escrow Agent will have no claim against or lien on such moneys and Government Securities for any fees or expenses incurred by the Escrow Agent under the Escrow Agreement. As provided in the Bond Act, following the deposit of the Government Securities into the Escrow Account, the liability of the State upon the Refunded Bonds will continue, but the holders of the Refunded Bonds are entitled to payment only out of the moneys on deposit in the Escrow Account.

-7-
APPLICATION OF BOND PROCEEDS The State estimates that the proceeds of the Bonds will be applied approximately as set forth below.
SERIES 2019A BONDS:
SOURCES: AMOUNTS Principal Amount Issued $300,000,000.00 Net Original Issue Discount (404,400.00) TOTAL SOURCES $299,595,600.00 USES: Payment of Pension Acceleration Benefits $298,500,000.00 Purchasers’ Discount 725,600.00 Costs of Issuance 370,000.00 TOTAL USES $299,595,600.00
SERIES 2019B BONDS:
SOURCES: AMOUNTS Principal Amount Issued $140,280,000.00 Original Issue Premium 12,266,788.60 TOTAL SOURCES 152,546,788.60 USES: Deposit to Escrow Account to Pay Refunded Bonds $152,163,704.70 Purchasers’ Discount 152,905.20 Costs of Issuance 230,178.70 TOTAL USES $152,546,788.60
SECURITY DIRECT, GENERAL OBLIGATIONS The Bonds, together with all other GO Bonds, are direct, general obligations of the State, and by law the full faith and credit of the State is pledged for the punctual payment of interest on the Bonds as the interest becomes due and for the punctual payment of the principal thereof at maturity, or any earlier redemption date, and premium, if any. The Bond Act provides that the section of the Bond Act making such pledge is irrepealable until all GO Bonds issued under the Bond Act, including the Bonds, have been paid in full. Table 1 reflects the cash available (subject to certain restrictions as to use) from time to time in various State funds to support debt service on GO Bonds. See Table 7 under “GENERAL

-8-
OBLIGATION INDEBTEDNESS—Outstanding General Obligation Bonds” for debt service on the outstanding GO Bonds.
TABLE 1 CASH BALANCES BY FUND CATEGORY AS OF END OF FISCAL YEARS 2014–20181
($ in millions)
FUND CATEGORY1 FY2014 FY2015 FY20164 FY2017 FY2018 General Funds5 $ 74 $ 621 $ 246 $ 1,077 $ 125 Highway Funds2 1,345 1,423 1,684 1,796 1,391 Special State Funds 3,341 2,845 4,068 3,257 3,530 Bond Financed Funds 2,676 552 799 541 1,372 Debt Service Funds3 1,638 1,232 1,346 1,411 1,752 Revolving Funds 78 94 175 224 103 State Trust Funds 2,373 2,316 3,037 3,261 3,525 June 30th amounts (End of Fiscal Year) $11,524 $9,084 $11,355 $11,567 $11,797
Source: Illinois Office of the Comptroller and the Governor’s Office of Management and Budget. Note: Totals may not add due to rounding. 1 Does not include Federal Trust Funds. 2 Highway Funds are limited by the Illinois Constitution and State statute to support construction and maintenance of transportation and the debt
service on certain GO Bonds issued for transportation projects. 3 Includes the General Obligation Bond Retirement and Interest Fund. 4 June 30, 2016 cash balances show an increase from the end of Fiscal Year 2015 due in part to the late enactment of Fiscal Year 2016
appropriations for many State funds. Cash balances in these categories totaled $9,849 million as of August 31, 2016. 5 June 30, 2017 cash balances show a significant increase in General Funds at the beginning of Fiscal Year 2017 due to the late enactment of
Fiscal Year 2018 Higher Education appropriations for the Education Assistance Fund. In June 2017, there was in excess of $562 million in the Education Assistance Fund, significantly higher than the $24 million held in the account in June 2016.
The State imposes various taxes and fees to pay its General Funds obligations, including without limitation, principal and interest on its GO Bonds. See APPENDIX A—CERTAIN INFORMATION REGARDING THE STATE OF ILLINOIS—“PART IV–Tax Review.” STATE FUNDING PAYMENTS The provisions of the Bond Act described below are irrepealable until all GO Bonds issued under the Bond Act are paid in full as to both principal and interest. To provide for the manner of repayment of the Bonds, the Bond Act requires the Governor to include an appropriation in each annual State Budget of moneys in such amount as will be necessary and sufficient, for the period covered by such Budget, to pay the interest, as it becomes payable, on all outstanding GO Bonds issued under the Bond Act and to pay and discharge the principal and premium, if any, of GO Bonds falling due during such period. The Bond Act also creates the GOBRI Fund, which is a separate fund in the State Treasury to be used for such repayment. The Bond Act requires the General Assembly to make appropriations annually to pay the principal of, interest on and premium, if any, on outstanding GO Bonds issued under the Bond Act from the GOBRI Fund. If for any reason the General Assembly fails to make appropriations sufficient to pay the principal of, interest on and premium, if any, on the GO Bonds when due, or if for any reason there are insufficient funds in the General Revenue Fund, or with respect to GO Bonds issued under Section 4(a) of the Bond Act or bonds issued under the authorization of Public Act 98-781 for highway and surface transportation purposes (or GO Bonds issued to refund GO Bonds

-9-
issued for such purposes) in the Road Fund, to make transfers to the GOBRI Fund as required by the Bond Act, the Bond Act constitutes an irrevocable and continuing appropriation of all amounts necessary for that purpose, and the irrevocable and continuing authority for and direction to the Treasurer and the Comptroller to make the necessary transfers, as directed by the Governor, out of and disbursements from the revenues and funds of the State. The State has never failed to pay any debt service payment on its GO Bonds when due. As described in “STATE FINANCIAL INFORMATION,” the State did not enact a full General Funds Budget for Fiscal Years 2016 and 2017; nevertheless, the Treasurer continued to pay all GO Bond debt service payments required by the Bond Act. Upon delivery of the Bonds, the Bond Act requires the Comptroller to compute and certify to the Treasurer the total amount of principal of, interest on and premium, if any, on the Bonds that will be payable in order to retire such Bonds and the amount of principal of, interest on and premium, if any, on the Bonds that will be payable on each payment date during the then current and each succeeding fiscal year. On or before the last day of each month, the Bond Act requires the Treasurer and Comptroller to transfer from the General Revenue Fund to the GOBRI Fund an amount sufficient to pay the aggregate of the principal of, interest on and premium, if any, on GO Bonds issued under the Bond Act payable by their terms on the next payment date, divided by the number of full calendar months between the date of such GO Bonds and the first such payment date, and thereafter, divided by the number of months between each succeeding payment date after the first payment date. The following statutory transfers to the GOBRI Fund will also be made in amounts determined using the same formula, as follows: (i) pursuant to the Bond Act, transfers from the Road Fund to the GOBRI Fund for GO Bonds issued under Section 4(a) of the Bond Act or bonds issued under the authorization of Public Act 98-781 (or GO Bonds issued to refund such GO Bonds); (ii) pursuant to the State Finance Act and the Bond Act, transfers from the School Infrastructure Fund and the General Revenue Fund to the GOBRI Fund for GO Bonds issued for the construction of school improvements under the School Construction Law of the State as authorized by Section 5(e) of the Bond Act for school improvement projects (or GO Bonds issued to refund such GO Bonds); and (iii) pursuant to the State Finance Act and the Bond Act, transfers from the Capital Projects Fund and the General Revenue Fund to the GOBRI Fund for GO Bonds issued pursuant to the bonding authorization under the 2009 capital program (or GO Bonds issued to refund such GO Bonds) (the “2009 Capital Program”). These transfers of moneys are not required if the amount in the GOBRI Fund is already sufficient as described above, and if the Governor or his authorized representative notifies the Treasurer and Comptroller of such fact in writing. Moneys deposited into the GOBRI Fund to provide for the payment of Short-Term Debt are excluded from any calculation used in determining the ability of the State to suspend transfers to the GOBRI Fund for the payment of the GO Bonds. The Bond Act provides that if the State fails to pay the principal of, interest on, or premium, if any, on any of the GO Bonds as the same become due, the holder of the GO Bonds on which such a payment default exists may institute a civil action to compel payment in the Supreme Court of Illinois as a court of original jurisdiction. The cash balance in the GOBRI Fund was approximately $1.010 billion on March 1, 2019.

-10-
The following Table 2 shows a history of debt service transfers to the GOBRI Fund from the various funds described above during Fiscal Year 2014 through Fiscal Year 2018.
TABLE 2 GENERAL OBLIGATION BONDS
TRANSFERS TO THE GOBRI FUND FOR PAYMENT OF DEBT SERVICE FISCAL YEARS 2014-2018
($ in millions) FY2014 FY2015 FY2016 FY2017 FY2018
General Revenue Fund Capital Bonds $ 602.9 $ 591.7 $ 556.5 $ 626.4 $ 796.8 Pension Bonds 1,655.4 1,502.2 1,422.6 1,608.7 1,575.6 Section 7.6 Bonds 526.9
Road Fund 358.7 346.7 333.7 305.2 349.0School Infrastructure Fund 208.8 192.8 211.8 115.2 172.4Capital Projects Fund 344.2 388.0 532.5 477.0 285.5TOTAL $3,170 $3,021 $3,057 $3,132 $ 3,706
Source: Governor’s Office of Management and Budget. Office of the Comptroller. Note: This table replaces the General Obligation Debt Service Payment table in previous Disclosures and provides more detailed
information on actual transfers from various Funds into the General Obligation Bond Retirement and Interest Fund for the payment of debt service.
CERTAIN INVESTMENT CONSIDERATIONS Purchase and ownership of the Bonds is subject to a variety of risks. Each prospective investor in the Bonds is encouraged to read this Official Statement in its entirety. Particular attention should be given to the investment considerations described below which, among other things, could affect the financial condition of the State and therefore result in a repayment risk for investors, and could also affect the liquidity and/or market value of the Bonds after they are issued. The considerations described below are not all of the investment considerations associated with the purchase and ownership of the Bonds. The inclusion or omission of considerations from this section, and the order in which they are presented, do not necessarily reflect the relative importance of the various investment considerations. INVESTMENT CONSIDERATIONS RELATING TO THE FINANCIAL CONDITION OF THE STATE Budget Deficit The Fiscal Year 2019 General Funds budget has an estimated deficit of approximately $1.2 billion. Prior to any revenue enhancements or expenditure reductions, the Fiscal Year 2020 General Funds budget has an estimated underlying deficit of approximately $3.2 billion. See “STATE FINANCIAL INFORMATION—FISCAL YEAR 2019 BUDGET and FISCAL YEAR 2020 BUDGET.” To avoid future structural deficits, the Governor and the General Assembly would, among other potential solutions, need to reduce expenditures, adjust revenue collections or approve a combination of revenue adjustments and reductions in expenditures. The State provides no assurances as to how, when or in what form this structural deficit might be addressed. Bill Payment Delays The absence of fully enacted General Funds Budgets for Fiscal Year 2016 and Fiscal Year 2017 contributed to a significant backlog of unpaid bills. The Comptroller’s estimate of the amount of

-11-
unpaid bills as of March 1, 2019 was approximately $7.9 billion. A current estimate of unpaid bills is available on the GOMB website. See APPENDIX F—WEBSITE INDEX. The backlog of bills held by the Comptroller and the State agencies may increase unless balanced budgets are enacted in the future or other measures are taken to pay down the backlog. Potential Issuance of Bonds Payable from General Funds Revenues The State is considering developing a structure for the issuance of revenue bonds (the “New Credit Bonds”) payable from one or more of the State’s current General Funds revenues. Specifically, in the Governor’s Fiscal Year 2020 Budget proposal, the Governor outlined the possibility of selling New Credit Bonds payable from the State’s income tax receipts. Any such structure would require legislative approval by the General Assembly. Though no specific legislation has been introduced at this time, the structure of such a transaction would likely involve the deposit of the revenue stream with a trustee, with the residual revenues not necessary for the payment of the New Credit Bonds being returned to the State for its general purposes, including the payment of GO Bonds. As such, State revenues that would otherwise be available for deposit into the GOBRI Fund for payment of GO Bonds, including the Bonds, could be diverted first for the payment of any New Credit Bonds. As a result, to the extent such revenues are applied to the payment of the New Credit Bonds, amounts available for deposit into the GOBRI Fund to pay the Bonds and the State’s other outstanding GO Bonds would be reduced by such amounts. The State can give no assurances as to whether or when the issuance of New Credit Bonds will be authorized, the revenue streams from which such New Credit Bonds will be payable, the structure of any such transactions or the amount or timing of issuance of such transactions. Severe Underfunding of the State’s Retirement Systems The State’s retirement systems are severely underfunded. Over the past ten years, the funding levels for the State’s retirement systems have deteriorated dramatically and are among the lowest in the nation with respect to state pension plans. The State’s contributions to the retirement systems, while in conformity with State law, have been less than the contributions necessary to fully fund the retirement systems as calculated by the actuaries for the retirement systems. The unfunded actuarial accrued liability of the State’s retirement systems (the amount by which the aggregate actuarial accrued liability exceeds the aggregate value of its assets) at the end of Fiscal Year 2018 totaled approximately $133 billion on a fair value basis and approximately $134 billion on an actuarial basis, resulting in respective funded ratios (the ratio of the value of assets to the actuarial accrued liability, expressed as a percentage) that equaled 40.2% and 40.1%. The State is required to make contributions to the retirement systems pursuant to the Illinois Pension Code, as amended, at the level percentage of payroll necessary to reach a Funded Rate of 90% by the end of Fiscal Year 2045. As such, the State’s contribution to the retirement systems is projected to increase substantially in future years. Such increased pension contributions may require the State to reduce other expenditures, adjust revenue collections or approve a combination of revenue adjustments and reductions in other expenditures. See APPENDIX E—PENSION AND OTHER POST EMPLOYMENT BENEFITS—“SOURCE INFORMATION,” “ACTUARIAL ASSUMPTIONS,” “HISTORY OF CONTRIBUTIONS TO THE RETIREMENT SYSTEMS,” “FUNDED STATUS” and “PROJECTION OF CONTRIBUTIONS AND FUNDED STATUS.”

-12-
Impact of Current and Future Health Care Reform Efforts Unpredictable; Future of Affordable Care Act Uncertain
The Patient Protection and Affordable Care Act, as amended by the Health Care and Education Reconciliation Act of 2010 (the “ACA”), provides for federal funding to states that choose to expand Medicaid. Under the ACA, the federal government paid 95% of the costs of such Medicaid expansion for calendar year 2017, 94% for calendar year 2018 and will pay 93% for calendar year 2019 and 90% for calendar year 2020 and subsequent years. The State participates in expanded Medicaid under the ACA pursuant to legislation enacted by the General Assembly in 2013 (the “Medicaid Expansion Legislation”). With respect to liability for the Fiscal Year ended June 30, 2018, the State received approximately $2.8 billion from the federal government and, with respect to the liability for the Fiscal Year ended June 30, 2019, expects to receive approximately $2.8 billion from the federal government for the base costs of its Medicaid expansion. The ACA and its implementation have been, and remain, controversial. Accordingly, the ACA has continually faced legal and legislative challenges, including repeated repeal efforts, since its enactment. To date, no repeal bills have passed both chambers of Congress. If the provisions of the ACA providing for federal funding of Medicaid expansion are repealed, the State would either need to provide additional funds to cover the costs of the Medicaid expansion previously funded by the federal government or discontinue the provision of the expanded Medicaid benefits. Further, under the Medicaid Expansion Legislation, if the amount of funds provided by the federal government with respect to the Medicaid expansion declines below 90% of the cost of the Medicaid expansion, the State would no longer participate in the Medicaid expansion under existing statutes. The State makes no prediction as to the likelihood of the passage of any repeal bills or other health care reform bills, or the contents thereof. Ratings The Bonds have been rated by Moody’s Investors Service, Inc. (“Moody’s”), S&P Global Ratings (“S&P”) and Fitch Ratings Inc. (“Fitch”). There is no assurance that such ratings will be maintained for any given period of time or that any rating will not be lowered or withdrawn entirely. Any revision or withdrawal of any such ratings could have a material adverse effect on the availability of a market for the Bonds or the prices at which the Bonds may be resold. See “RATINGS.” Delays in Exercising Remedies The rights and remedies of the Bondholders may be limited by and are subject to equitable principles that may affect the enforcement of creditors’ rights and liens securing such rights, the police powers of the State and its political subdivisions, the exercise of judicial discretion in appropriate cases and limitations on legal remedies against the State. The opinions of Co-Bond Counsel to be delivered with respect to the Bonds will be similarly qualified. Because of delays inherent in obtaining judicial remedies, it should not be assumed that these remedies could be accomplished rapidly. Any delays in the ability of the Bondholders to pursue remedies may result in delays in payment of the Bonds. The State is not authorized to file for bankruptcy protection under current federal bankruptcy law. Furthermore, there are federal Constitutional issues which raise doubt about the legality of any legislation of the United States Congress that would purport to permit the State to adjust its debts in a proceeding under federal bankruptcy law.

-13-
Changes in Economic and Demographic Conditions The Fiscal Year 2019 General Funds Budget is based on expectations and assumptions of the State that are subject to a number of known and unknown risks and uncertainties, many of which are beyond the State’s control. These include, among others, general economic conditions, demographic trends, natural disasters, terrorism, U.S. trade policy and reductions in or elimination of federal programs which may adversely affect the transfer of funds from the federal government to the State. In addition, U.S. trade policy may have an effect on the manufacturing segments of the State’s economy. See APPENDIX A—“PART III: ECONOMIC DATA” herein. Accordingly, the expectations and assumptions of the State upon which the Fiscal Year 2019 General Funds Budget are based may not be realized and the State’s financial condition could be further materially adversely affected. See “STATE FINANCIAL INFORMATION—FISCAL YEAR 2019 BUDGET.” Forward-Looking Statements This Official Statement contains disclosures which contain “forward-looking statements.” Forward-looking statements include all statements that do not relate solely to historical or current fact, and can be identified by use of words like “may,” “believe,” “will,” “expect,” “project,” “estimate,” “anticipate,” “plan,” or “continue.” These forward-looking statements are based on the current plans and expectations of the State and are subject to a number of known and unknown uncertainties and risks, many of which are beyond its control, that could significantly affect current plans and expectations and the State’s future financial position including but not limited to changes in general economic conditions, demographic trends and federal programs which may affect the transfer of funds from the federal government to the State. As a consequence, current plans, anticipated actions and future financial positions may differ from those expressed in any forward-looking statements made by the State herein. Investors are cautioned not to unduly rely on such forward-looking statements when evaluating the information presented in this Official Statement. No Secondary Market There can be no assurances that a secondary market for the Bonds will be established, maintained or functioning. Accordingly, each purchaser should expect to bear the risk of the investment represented by the Bonds to maturity.
STATE OF ILLINOIS ORGANIZATION The State is formally organized according to executive, legislative and judicial functions. The Governor is the chief executive of the State and is generally responsible for the administration of the Executive Branch of the State other than the offices of other constitutionally-elected officials. The other constitutionally-elected officials of the Executive Branch include the Lieutenant Governor, the Attorney General, the Secretary of State, the Illinois State Comptroller (the “Comptroller”) and the Illinois State Treasurer (the “Treasurer”). The Auditor General, Frank J. Mautino, is a constitutional officer appointed for a term of 10 years, effective January 1, 2016, and was confirmed by a three-fifths vote of both houses of the General Assembly. The Illinois Constitution provides that all elected officials of the Executive Branch hold office for four-year terms. The State’s current elected constitutional officials are Governor JB Pritzker, Lieutenant Governor Juliana Stratton, Attorney General Kwame Raoul, Secretary of State Jesse

-14-
White, Comptroller Susana Mendoza and Treasurer Michael W. Frerichs. An election for these offices was held on November 6, 2018. The Comptroller is responsible for the maintenance of the State’s fiscal accounting records. The Comptroller provides accounting control over the cash on hand in a specific fund or funds for which the Treasurer is accountable, control over the issuance of warrants for payments of agencies’ expenditures and control to ensure that State payments do not exceed legal appropriations and available fund balances. The Treasurer is also responsible for ensuring that investment of State funds complies with the Deposit of State Moneys Act (15 ILCS 520) and the Public Funds Investment Act (30 ILCS 235). The legislative power of the State is vested in the General Assembly, which is composed of 59 Senators and 118 members of the House of Representatives. Both the Senate and the House of Representatives meet in annual sessions to enact, amend or repeal laws and to adopt appropriation bills. Pursuant to Illinois law, the election of two-thirds of the members of the Senate and all members of the House of Representatives was held on November 6, 2018. Members of the House of Representatives were elected to serve two-year terms, while members of the Senate were elected to serve two-year or four-year terms as set forth in the Illinois Constitution. The Judicial Branch is composed of the Supreme Court, the Appellate Courts and the Circuit Courts. Pursuant to Illinois law, judicial elections were held on November 6, 2018. CONSTITUTIONAL PROVISIONS Constitutional Provisions Relating to Revenues and Expenditures Article VIII, Section 2 of the Illinois Constitution requires the Governor to prepare and submit to the General Assembly, at a time prescribed by law (generally, the third Wednesday in February), a State budget for the ensuing fiscal year. Proposed expenditures may not exceed funds estimated to be available for the fiscal year as shown in the budget. Article VIII, Section 2 also requires the General Assembly to make appropriations for all expenditures of public funds by the State, which appropriations for a fiscal year may not exceed funds estimated by the General Assembly to be available during that fiscal year. Article IV, Section 9 of the Illinois Constitution provides that the Governor may reduce or veto any item of appropriations in a bill passed and presented to him by the General Assembly. Portions of a bill not reduced or vetoed become law. An item vetoed is returned to the house in which it originated and may become law upon approval of three-fifths of the members of each house. An item reduced in amount may be restored to the original amount upon approval of a majority of the members elected to each house. Constitutional Provisions Relating to Long-Term Borrowing Article IX, Section 9(a) of the Illinois Constitution defines the term “State debt” as “bonds or other evidences of indebtedness which are secured by the full faith and credit of the State or are required to be repaid, directly or indirectly, from tax revenue and which are incurred by the State, any department, authority, public corporation or quasi-public corporation of the State, any State college or university, or any other public agency created by the State, but not by units of local government, or school districts”. The Bond Act was enacted pursuant to Article IX, Section 9(b) of the Illinois Constitution, which provides that State debt for specific purposes may be incurred, or the payment of State or other

-15-
debt guaranteed, in such amounts as may be provided either in a law passed by the vote of three-fifths of the members elected to each house of the General Assembly or in a law approved by a majority of the electors voting on the question at the next general election following passage. Constitutional Provisions Relating to Short-Term Borrowing Article IX, Sections 9(c) and 9(d) of the Illinois Constitution, pursuant to which the Short Term Borrowing Act, as amended (30 ILCS 340/1 et seq.) (the “Short Term Borrowing Act”), was enacted, permit State debt to be incurred in anticipation of revenues to be collected in a fiscal year in an amount not exceeding 5% of the State’s appropriations for that fiscal year. Such debt shall be retired from the revenues realized in that fiscal year. Additionally, State debt may be incurred in an amount not exceeding 15% of the State’s appropriations for a fiscal year to meet deficits caused by emergencies or failures of revenue. Such debt must be repaid within one year of the date it is incurred. Constitutional Provision Relating to Refundings Article IX, Section 9(e) of the Illinois Constitution provides the constitutional authority to refund State debt by providing that State debt may be incurred by law to refund outstanding State debt if the refunding debt matures within the term of the outstanding State debt. Constitutional Provision Relating to Impairment of Contracts Article I, Section 16 of the Illinois Constitution provides that no law impairing the obligation of contracts shall be passed by the General Assembly. This “non-impairment” clause would prohibit action by the General Assembly that would, under contract law, impair the obligations of a contract between the State and its bondholders. GOVERNOR’S OFFICE OF MANAGEMENT AND BUDGET The Governor’s Office of Management and Budget (“GOMB”) is organized under the Governor’s Office of Management and Budget Act (20 ILCS 3005/1 et seq.). GOMB is headed by a Director (the “Director”) appointed by the Governor. GOMB assists the Governor in developing the State’s annual operating and capital budgets, as called for in statute (20 ILCS 3005/2.1 and 20 ILCS 3005/2.5). Pursuant to Article VIII, Section 2(b) of the Illinois Constitution, these budgets are introduced by the Governor for each fiscal year and must contain estimated revenues and recommended appropriations for the upcoming fiscal year that are balanced. In addition to assisting the Governor in developing and managing the State’s annual operating and capital budgets, GOMB provides financial and other information regarding the State to securities investors, the Municipal Securities Rulemaking Board (“MSRB”) under its Electronic Municipal Market Access (“EMMA”) system and other securities information repositories or state information depositories as required by federal securities rules. See “CONTINUING DISCLOSURE” and APPENDIX D—FORM OF CONTINUING DISCLOSURE UNDERTAKING.
STATE FINANCIAL INFORMATION SOURCES The tables in this section, “STATE FINANCIAL INFORMATION,” present pertinent financial information about the State. Data is for the State’s fiscal years, unless otherwise noted, each of

-16-
which runs from July 1 through June 30 (each a “Fiscal Year”). Financial information contained in this section is drawn from the records and reports of the Comptroller and documents prepared by GOMB. MEASUREMENT BASES Financial information reported by the State is prepared and reported under one of three measurement bases: (i) the cash basis of accounting; (ii) the budget basis of accounting; and (iii) the GAAP (Generally Accepted Accounting Principles as promulgated by the Government Accounting Standards Board) basis of accounting. The basis used in preparing financial information impacts the manner in which revenues and expenditures are recognized in preparing these financial reports. The bases used by the State are described in APPENDIX G—ACCOUNTING PRACTICES USED IN STATE FINANCIAL INFORMATION. FINANCIAL REPORTS The Comptroller annually prepares two separate financial reports that are audited by the Illinois Auditor General, who also opines on the financial statements contained in those reports. As the fiscal control officer of the State, the Comptroller issues a Comprehensive Annual Financial Report (“CAFR”), which includes financial statements detailing receipts and expenditures for each year. The CAFR is prepared according to GAAP and contains statements of budgetary fund balances and changes in budgetary fund balances for all fund groups. Under Section 19.5 of the State Comptroller Act, the Comptroller must publish the CAFR for each fiscal year by December 31 of each year or may publish unaudited financial statements and a written explanation to State leadership explaining the reasons for the delay beginning with the CAFR for Fiscal Year 2012. However, pursuant to 2012 amendments to Section 25 of the State Finance Act, the lapse period for certain expenses, which is the time period at the beginning of a fiscal year during which the State is allowed, by statute, to pay outstanding bills from a recently ended fiscal year, was permanently extended for certain medical assistance payments past the 60-day lapse period granted to most appropriations. This extension makes the publication of unaudited financial statements by December 31 problematic in years in which bills are paid during the end of such lapse period. The State has covenanted in its continuing disclosure undertakings to file the CAFR within 30 days after its availability to GOMB. See “CONTINUING DISCLOSURE” and APPENDIX D—FORM OF CONTINUING DISCLOSURE UNDERTAKING. A final copy of the Fiscal Year 2017 CAFR was available to GOMB, and was uploaded to EMMA, on March 22, 2018. The State does not expect that the CAFR for the fiscal year ended June 30, 2018, will be released before the end of March 2019. The CAFR for such fiscal year will be uploaded to EMMA after it is available to GOMB. The Comptroller also annually prepares and issues the Traditional Budgetary Financial Report (“TBFR”) using accounting practices prescribed or permitted by the State Comptroller Act (15 ILCS 405) that represent the budget basis of accounting. Presentation practices in the TBFR are materially different from the GAAP presentation practices used in the CAFR. A final copy of the Fiscal Year 2018 TBFR can be found on the Comptroller’s website. Under Section 20 of the State Comptroller Act, the TBFR for each fiscal year is to be released by December 31 of each year. See APPENDIX F—WEBSITE INDEX.

-17-
Key differences between the accounting practices used in the TBFR and GAAP utilized in preparing the Fiscal Year CAFR are described in APPENDIX G—ACCOUNTING PRACTICES USED IN STATE FINANCIAL INFORMATION. NET POSITION OF GOVERNMENTAL ACTIVITIES The State’s CAFR provides that, as of June 30, 2017, the State has a deficit net position of governmental activities (the “Net Position”) of approximately $141.7 billion, an increase of approximately $10.1 billion from the Net Position as of June 30, 2016. The deficit Net Position, which is presented on an accrual basis of accounting, equals the excess of the State’s total liabilities and deferred inflows of resources (approximately $214.4 billion as of June 30, 2017) over the State’s total assets and deferred outflows of resources (approximately $72.8 billion as of June 30, 2017). The State’s total revenues from governmental activities increased by approximately $2.4 billion during Fiscal Year 2017, while the State’s governmental activities expenses increased approximately $6.3 billion during Fiscal Year 2017. See the CAFR for additional information. FINANCIAL RESULTS: FY2014-FY2018 Prior to Fiscal Year 2018, the State’s “General Funds” included four funds – the General Revenue Fund, the Education Assistance Fund, the Common School Fund, and General Revenue-Common School Special Account Fund. Public Act 100-23 amended the State Budget Law (15 ILCS 20/50-40) to add the Fund for the Advancement of Education and the Commitment to Human Services Fund (both of which receive a portion of State income tax receipts) and the Budget Stabilization Fund to the State definition of General Funds. Tables and budget discussion in this Official Statement for Fiscal Year 2017 and earlier reflect the original definition of General Funds, except where noted. Amounts under the headings “REVIEW OF FISCAL YEAR 2016” and “REVIEW OF FISCAL YEAR 2017” in this section, where applicable, have been restated to reflect the new definition of General Funds. As such, the amounts reflected under such headings differ from the amounts reflected in the TBFR. Tables 3 and 4, which are presented on the following pages, describe the General Funds revenues and expenditures of the State for the past five fiscal years prepared on a cash or budget basis and are drawn from the Fiscal Year 2018 TBFR. The budget basis reflects the statutory provisions and associated policies for recognition of revenues, expenditures, transfers and outstanding liabilities associated with the passage and adoption of the General Funds budget for each fiscal year. As discussed in APPENDIX G—ACCOUNTING PRACTICES USED IN STATE FINANCIAL INFORMATION, budget basis statements differ materially from those prepared on the basis of GAAP. Table 3 lists cash basis revenues which include cash receipts from State sources, statutory transfers in, and federal sources, both receipts and transfers in. Table 3 also segregates Base Revenues from Total Revenues where the differences include one-time receipts in the form of short term borrowings as well as cash management transfers for cash flow purposes that are repaid either within the same or subsequent fiscal years and reported as expenditures in Table 4. Table 4 lists budget basis expenditures based upon warrants issued by the Comptroller during the fiscal year. The expenditures by warrant for each fiscal year are reported using three different approaches: (1) by agency that incurred the expenditure, (2) by categorical form of the expenditure, and (3) by functional category of the expenditure, and Table 4 also reports transfers out. Table 4 also segregates Base Expenditures from Total Expenditures, reflecting repayment of
-18-
short term borrowings and cash management transfers that were receipts in either the same or prior fiscal years, as reported in Table 3. For an operating statement explaining the changes during Fiscal Year 2018 in both cash balance as well as fund balance, reflecting the cash basis and budget basis, respectively, see Table G-1 in APPENDIX G—ACCOUNTING PRACTICES USED IN STATE FINANCIAL INFORMATION.

-19-
TABLE 3 (Cash Basis)
GENERAL FUNDS ANALYSIS OF REVENUES ($ in Millions)
June 30 Fiscal Year End
FY2018
INCREASE OR DECREASE
FY2018WHERE THE
DOLLAR FY2014 FY2015 FY2016 FY2017 FY2018 AMOUNT PERCENT CAME FROMSTATE SOURCES:
CASH RECEIPTS:
Income Taxes
Individual............................ $16,642 $15,433 $12,890 $12,737 $17,725 $4,988 (39.2)% Corporate............................. 3,164 2,686 1,972 1,328 2,017 689 (51.9) Total, Income Taxes..................... 19,806 18,119 14,862 14,065 19,742 5,677 (40.4) 47.6%
Sales Taxes............................. 7,676 8,030 8,063 8,043 $ 7,810 $ (233) (2.9) 18.9
Other Sources Public Utility Taxes.................. 1,013 1,006 926 884 896 12 Insurance Tax & Fees.................. 333 353 398 391 432 41 Cigarette Taxes....................... 353 353 353 353 358 97 Inheritance Tax (gross)............... 276 333 306 261 344 (9) Cook County Intergovernmental Transfer 244 244 244 244 244 0 Corporate Franchise Tax & Fees........ 203 211 207 207 207 0 Liquor Gallonage Taxes................ 165 167 170 171 172 1 Investment Income..................... 20 25 24 36 79 43 Other Taxes, Licenses, Fees & Earnings 624 735 574 725 719 (6) Total, Other Sources.................... 3,231 3,427 3,202 3,272 3,451 179 5.5 8.3
TOTAL, CASH RECEIPTS...................... $30,713 $29,576 $26,127 $25,380 $31,003 $5,623 (22.2)% 74.8%
TRANSFERS IN FROM OTHER STATE FUNDS: Income Tax Bond Fund..................... 0 0 0 0 2,500 2,500 Lottery Fund............................ 668 678 677 720 719 (1) Interfund Borrowing..................... 0 454 0 0 533 533 Capital Projects Fund................... 280 185 60 35 440 405 Build Illinois Fund..................... 265 337 316 320 328 8 State Gaming Fund....................... 321 292 277 270 272 2 Budget Implementation Acts.............. 0 12842 0 0 269 269 Hospital Provider Fund.................. 80 80 80 80 80 0 Metropolitan Exposition Auditorium & Office Building Fund................... 13 14 17 13 12 (1) State Whistleblower Reward and Protection Fund.................... 38 6 9 10 10 0 Warrant Escheat Fund.................... 15 11 10 9 9 0 McCormick Place Expansion Project Fund.. 0 0 25 14 7 (7) Illinois Sports Facilities.............. 0 0 9 48 6 (42) Protest Fund............................ 13 18 11 3 2 (1) Income Tax Refund Fund.................. 397 63 77 4 1 (3) Budget Stabilization Fund............... 275 275 125 0 0 0 FY13/FY14 Backlog Payment Fund.......... 50 0 0 0 0 0 All Other Funds......................... 12 13 13 16 22 6
TOTAL, TRANSFERS IN .............................. $2,427 $3,710 $1,706 $1,542 $5,210 $3,668 237.9% 12.6% TOTAL, STATE SOURCES .......................... $33,140 $33,286 $27,833 $26,922 $36,213 $9,291 34.5% 87.4%
FEDERAL SOURCES: CASH RECEIPTS: Department of Healthcare and Family Services ..................................... 3,761 3,180 2,512 2,288 4,985 2,697 Department of Human Services .................... 98 109 110 156 246 90 All Other Agencies ........................................ 8 7 3 7 6 (1)
TOTAL, CASH RECEIPTS ............................ $3,867 $3,296 $2,625 $2,451 $5,237 $2,786
TRANSFERS IN:
Federal Trust Funds ....................................... $36 $35 $40 $32 $1 $(31)
TOTAL, FEDERAL SOURCES .................... $3,903 $3,331 $2,665 $2,483 $5,238 $2,755 111.0% 12.6%
TOTAL, REVENUES ..................................... $37,043 $36,617 $30,498 $29,405 $41,451 $12,046 41.0% 100.0%
Transfer from Budget Stabilization Fund ........ 275 275 125 0 0 0 Interfund Borrowing ........................................
0 454 0 0 533 533
TOTAL, BASE REVENUES(1) ....................... $36,768 $35,888 $30,373 $29,405 $40,918 $11,513 39.2% Source: Page 5 of the Traditional Budgetary Financial Report FY2018 (1) Base Revenues equal Total Revenues less the adjustment items listed below “Total, Revenues” above.

-20-
TABLE 4 (Budget Basis)
GENERAL FUNDS ANALYSIS OF EXPENDITURES ($ in Millions)
June 30 Fiscal Year End
FY2018 INCREASE OR DECREASE
FY2018 WHERE THE
DOLLAR WARRANTS ISSUED: FY 2014 FY 2015 FY 2016 FY 2017 FY 2018 AMOUNT PERCENT WAS SPENT BY AGENCY: State Board of Education .............................................. $6,681 $6,545 $6,507 $7,211 8,201 990 13.7 21.0% Healthcare and Family Services ................................... 7,292 6,525 6,090 5,972 7,601 1,629 27.3 19.5 Teachers Retirement System ........................................ 3,529 3,479 3,851 4,096 4,210 114 2.8 10.8 Human Services ............................................................ 3,217 3,363 3,153 3,283 3,640 357 10.9 9.3 Higher Education Agencies: Universities Retirement System ................................. 1,316 1,352 1,416 1,506 1,418 (88) (5.8) University of Illinois .................................................. 663 644 180 651 583 (68) (10.4) Student Assistance Commission ................................ 382 375 176 365 407 42 11.5 Community College Board ......................................... 342 338 76 239 204 (35) (14.6) Southern Illinois University ....................................... 205 200 57 200 181 (19) (9.5) All Other ..................................................................... 395 382 134 398 348 (50) (12.6) Total, Higher Education Agencies ............................... 3,303 3,291 2,039 3,359 3,141 (218) (6.5) 8.1
All Other Agencies:
Central Management Services.......... 1,513 1,608 28 182 1,960 1,778 976.9
Corrections.......................... 1,276 1,310 888 1,076 1,890 814 75.7
State Employees Retirement System.... 1,097 1,149 1,367 1,309 1,319 10 0.8
Aging................................ 935 880 646 590 893 303 51.4
Children and Family Services......... 684 672 619 684 746 62 9.1
Judicial Agencies.................... 458 497 502 502 511 9 1.8
State Police......................... 286 254 223 219 258 39 17.8
Secretary of State................... 258 292 196 231 249 18 7.8
Other Agencies....................... 1,010 909 653 710 790 80 11.3
Total, All Other Agencies 7,517 7,571 5,122 5,503 8,616 3,113 56.6 22.1
Prior Year Adjustments ................................................ (60) (11) (12) (3) (28) (25) N/A (0.1)
BY CATEGORY: Awards and Grants ....................................................... 21,141 20,828 19,859 21,014 23,341 2,327 11.1 59.9 Operations .................................................................... 10,387 9,938 6,899 8,402 12,059 3,657 43.5 30.9 Refunds ......................................................................... 5 0 0 0 5 5 N/A Permanent Improvements and Highway Construction ................................................. 6 8 4 8 4 (4) (50.0) 0.0 Prior Year Adjustments ................................................ (60) (11) (12) (3) (28) (25) N/A (0.1)
BY FUNCTION: Education ...................................................................... 13,525 13,377 12,409 14,679 15,564 885 6.0 39.9 Health and Social Services ........................................... 12,333 11,627 10,643 10,676 13,042 2,366 22.2 33.4 General Government .................................................... 3,297 3,397 1,879 2,058 3,817 1,759 85.5 9.8 Public Protection and Justice ........................................ 2,186 2,210 1,749 1,921 2,807 886 46.1 7.2 Environment and Business Regulation ........................ 70 85 52 53 66 13 24.5 0.3 Employment and Economic Development ..................... 101 73 30 37 104 67 181.1 0.2 Transportation 22 5 0 0 4 4 N/A 0.0 Refunds ......................................................................... 5 0 0 0 5 5 N/A 0.0 Prior Year Adjustments ................................................ (60) (11) (12) (3) (28) (25) N/A (0.1)
TOTAL, WARRANTS ISSUED ................................... 31,479 30,763 26,750 29,421 35,381 5,960 20.3 90.7
TRANSFERS OUT ........................................................ 5,497 4,858 4,576 4,636 3,610 (1,026) (22.1) 9.3
TOTAL, EXPENDITURES ......................................... $36,976 $35,621 $31,326 $34,057 $38,991 $4,934 14.5% 100.0%
Repayment of Interfund Borrowing ............................... 0 0 0 15 128 113 Transfer to Budget Stabilization Fund ........................... 275 275 125 0 0 0
TOTAL, BASE EXPENDITURES(1) .......................... $36,701 $35,346 $31,201 $34,042 $38,863 $4,821 14.2% Source: Page 9 of the Traditional Budgetary Financial Report FY2018 (1) Base Expenditures equal Total Expenditures less the adjustment items listed below "Total, Expenditures" above.

-21-
ACCOUNTS PAYABLE
As described below, Table 5 includes General Funds lapse period transactions at the end of a fiscal year as reported in the TBFR, which represent budget basis accounts payable. On a GAAP basis, and as reported in the CAFR, the General Funds of the State also carry other liabilities not detailed in Tables 3, 4 and 5. The lapse period transaction amounts (i.e., budget basis accounts payable) do not include Section 25 liabilities that represent incurred legal liabilities primarily for Medicaid and group health insurance that are paid from the appropriations of subsequent fiscal years because appropriation authority for those expenditures in the current year has been exhausted, nor does it include amounts for which sufficient current year appropriations were not provided. Table 5 includes Budget Basis Accounts Payable, General Funds Section 25 Liabilities that have accrued during the current and prior fiscal years, but that will be paid from future fiscal years’ appropriations, payable from the General Funds, and Section 25 Liabilities attributed to funds outside of the General Funds.
TABLE 5 (Budget Basis)
ACCOUNTS PAYABLE AS OF THE END OF EACH FISCAL YEAR 2013-2018
($ in millions)
END OF FISCAL YEAR JUNE 30
FY2013 FY2014 FY2015 FY2016 FY2017 FY20183
General Funds Budget Basis Accounts Payable1 $4,142 $4,005 $3,521 $3,789 $ 9,061 $5,823
General Funds Section 25 Liabilities2 1,864 1,622 1,598 3,307 5,932 2,000 Total General Funds Accounts Payables $6,006 $5,627 $5,119 $7,096 $14,993
$7,823
Section 25 Liabilities - Other State Funds $ 489 $ 429 $ 316 $ 956 $ 162 $ 200
Source: Illinois Office of the Comptroller. Section 25 Liabilities are released with the CAFR. Budget Basis Accounts Payable as reported on page 11 of the TBFR.
1 This amount includes General Funds Lapse Period Transactions as reported in the TBFR. 2 Section 25 Liabilities are incurred in one fiscal year and payable from future fiscal year appropriations. This amount is the
General Funds portion of Section 25 liabilities. 3 Fiscal Year 2018 Section 25 preliminary estimates, subject to change. Final numbers will be released with the State’s Fiscal
Year 2018 CAFR.
Tables 3, 4, 5, G-1 and the State’s CAFR, as well as accompanying footnotes, taken together, should be referenced for a more complete understanding of the financial statements. The following subsections describe the recent financial history of the State, the Fiscal Year 2019 General Funds enacted budget and the proposed Fiscal Year 2020 General Funds budget. All amounts set forth in these sections were prepared on the budgetary basis of accounting. AUTHORIZATION FOR EXPENDITURES IN THE ABSENCE OF A BUDGET – FISCAL YEARS 2016 AND 2017 The State did not enact a full General Funds budget for Fiscal Year 2016 or for Fiscal Year 2017, but certain spending continued to occur in the absence of a budget. In Fiscal Year 2016 and in

-22-
Fiscal Year 2017, certain appropriations were enacted and certain spending occurred through statutory transfers, statutory continuing appropriations, court orders and consent decrees. All debt service payments on GO Bonds in Fiscal Year 2016 and Fiscal Year 2017 were paid by the Treasurer through statutory continuing appropriations or enacted State appropriations from the GOBRI Fund. Statutory transfers to the GOBRI Fund from the various funds in the State Treasury occurred as required by statute. The following descriptions outline generally the ways that State spending occurred during this timeframe.
• Appropriations signed into law – Appropriations bills that are enacted into law authorize State agencies to spend from these appropriations as permitted by law.
• Continuing appropriations authorized by statute – Certain State spending obligations are covered by statutory continuing appropriations; i.e., in situations where annual line-item appropriations are not enacted, an appropriation is established by the Comptroller equal to the amount required to be spent by statute in lieu of an annual appropriation. Public Acts can create funding formulas and continuing appropriations as well as line-item appropriations. For example, the State’s contributions to the five State funded retirement systems are covered by continuing appropriation language (as more fully described in APPENDIX E—PENSION AND OTHER POST EMPLOYMENT BENEFITS). Additionally, as described above, debt service payments on GO Bonds from the GOBRI Fund are covered by statutory continuing appropriations to make payments to bondholders.
• Statutory transfers to other State funds – Certain transfers must be made from one fund into another fund in the State Treasury based on existing statutes. Transfers from the General Funds and Road Fund into the GOBRI Fund occur through statutory transfers.
• Court Orders/Consent Decrees – In Fiscal Year 2016 and Fiscal Year 2017, certain spending from the General Funds occurred without passage of a full State budget when the State was ordered to make such payments by court order or consent decree. Various court actions taken since July 2015 and prior consent decrees directed the State, through the Office of the Comptroller, to continue to make payments in the absence of appropriations for items such as State employee salaries, payments to Medicaid providers, the operations of the Department of Children and Family Services and the Department of Juvenile Justice, and certain social service programs. The social service spending consent decrees came from federal court action. Much of the spending on these programs continued at Fiscal Year 2015 levels as directed by the courts.
REVIEW OF FISCAL YEAR 2016 The Fiscal Year 2016 General Funds Budget was never fully enacted. In February 2015, the Governor proposed a Fiscal Year 2016 Budget (described below and available on GOMB’s website (see APPENDIX F—WEBSITE INDEX)) that recognized a significant deficit between revenues and expenditures if spending were allowed to continue on an “auto pilot” or maintenance basis (i.e., with no increase in revenues, no changes to State statutes or other spending controls). This forecast reflected the statutory tax rates in effect at the time of his proposal, including the impact of the decrease in the individual and corporate state income tax rates on January 1, 2015. The Governor recommended, among other things in his proposal, reductions in General Funds

-23-
spending, reductions in statutory transfer levels, and pension reforms to reduce the cost of State pensions. In May 2015, the General Assembly passed several appropriation bills and presented them to the Governor for his approval. In June 2015, the Governor signed certain appropriations into law, including full-year funding for elementary and secondary education, State payments to the Teachers’ Retirement System and capital appropriations for the Illinois Department of Transportation. However, during the summer, the Governor vetoed the majority of appropriation bills passed by the General Assembly, including bills funding the majority of the State’s General Funds budget, noting that projected spending from those proposals exceeded forecasts of available revenue by over $4 billion. During Fiscal Year 2016, other appropriations were enacted for certain Fiscal Year 2016 costs, including some higher education costs, spending of certain federal revenues, and most appropriations from State funds outside of the General Funds. After adjusting for transfers due to the General Funds, as reported by the Comptroller, Fiscal Year 2016 results reflect a $172 million decrease in the General Funds budgetary balance (i.e., the June 30 cash balance less the General Funds obligations paid in the State’s lapse period) from a deficit of $2.9 billion in Fiscal Year 2015 to a deficit of $2.8 billion in Fiscal Year 2016. However, this only reflects the amounts processed through the Office of the Comptroller for Fiscal Year 2016 and does not reflect approximately $3.0 billion for which costs were incurred but the State was unable to pay due to the lack of sufficient appropriations. REVIEW OF FISCAL YEAR 2017 A full Fiscal Year 2017 General Funds Budget was never enacted. As of May 31, 2016, no appropriation bills for Fiscal Year 2017 spending had passed both chambers of the General Assembly. On June 30, 2016, Public Act 99-523 and Public Act 99-524 were signed into law by the Governor, authorizing an agreed upon stop gap or “bridge” funding plan to keep government functioning until the General Assembly and the Governor could come to agreement on a full Fiscal Year 2017 budget. The “bridge” plan as enacted included a full year of Fiscal Year 2017 funding for elementary and secondary education, full-year authority to spend all federal and other state funds outside of the General Funds for Fiscal Year 2017, capital appropriations for the state’s road program and some of the state’s other construction projects and limited Fiscal Year 2017 General Funds appropriations for costs of critical state government operations incurred through December 31, 2016. The enacted legislation permanently forgave repayment of the 2015 interfund borrowing that would have been due in Fiscal Year 2017. It authorized the spending of $275 million from the Budget Stabilization Fund, $97 million in funding for community colleges from the Personal Property Tax Replacement Fund, $701 million from the Commitment to Human Services Fund and $453 million from the Fund for the Advancement of Education for purposes traditionally supported by the general funds. In addition, the “bridge” funding plan included a new hospital assessment to capture additional federal match associated with higher than anticipated Medicaid enrollment of newly eligible individuals under the ACA. The new assessment alleviated $150 million in state revenue pressure. Public Act 99-523 also altered some of the requirements for Fiscal Year 2017 issuances of GO Bonds for refunding purposes and Build Illinois refunding bonds in order to allow the state to save on debt service costs. Refunding GO Bonds were issued in the fall of 2016 which resulted in debt service savings of $229.0 million over the life of such GO Bonds, including savings of $30.5 million in Fiscal Year 2017.

-24-
As part of the Fiscal Year 2018 budget legislation, additional supplemental appropriations for Fiscal Year 2017 were included in PA 100-21, effective July 6, 2017. This act included $1.9 billion in additional Fiscal Year 2017 General Funds appropriations for higher education, elementary and secondary education and other purposes. After adjusting for transfers due to the General Funds as reported by the Comptroller, Fiscal Year 2017 results reflect a $5.1 billion decrease in the General Funds budgetary balance (the June 30 cash balance less the General Funds obligations paid in the State’s lapse period). The deficit rose from $2.8 billion in Fiscal Year 2016 to a deficit of $8.0 billion in Fiscal Year 2017. Fiscal Year 2017 Spending in Absence of a Budget The State began Fiscal Year 2017 on July 1, 2016 without a fully enacted budget in place. As described above, certain State spending continued to occur in the absence of a full budget as it did in Fiscal Year 2016.
• Appropriations signed into law – PA 99-524 and PA 100-21 included General Funds spending totaling approximately $7.5 billion on elementary and secondary education, $2.1 billion on higher education, $1.4 billion for human service programs and approximately $800 million on State agency operations.
• Continuing appropriations authorized by statute – Approximately $6.9 billion in General Funds appropriations were established for payments to the State’s retirement systems in the absence of enacted appropriations. Additionally, certain expenditures were made related to some retired teacher health care costs and operations of the legislative and judicial branches pursuant to continuing appropriations. In total, approximately $7.5 billion in spending occurred in Fiscal Year 2017 through continuing appropriations.
• Debt service and other statutory transfers to other State funds – Approximately $2.2 billion in estimated General Funds transfers to the GOBRI Fund for debt service on GO Bonds and approximately $2.4 billion in transfers to other State funds for other purposes, primarily the Local Government Distributive Fund and mass transit funding for the Regional Transportation Authority and for downstate transit systems, occurred from the General Funds in Fiscal Year 2017 under State statutes.
• Court Orders/Consent Decrees – Court orders and consent decrees required the State to continue to make payments in the absence of appropriations in Fiscal Year 2017 for costs such as State employee salaries, payments to Medicaid providers, and certain social service programs. In total, approximately $14.2 billion in spending from the General Funds occurred in Fiscal Year 2017 through these court orders and consent decrees, including approximately $6.4 billion on Medicaid-related costs.
Fiscal Year 2017 Revenues Base General Funds revenues for Fiscal Year 2017 totaled $30.3 billion, a decrease from Fiscal Year 2016 revenues of $957 million (3.1 percent). The State’s three largest revenue sources, individual income tax, corporate income tax and State sales tax, totaled $23.0 billion, a net decrease of $806 million or 3.4 percent when compared to such revenues for Fiscal Year 2016. Individual income taxes totaled $13.7 billion, a $145 million (1.1 percent) decrease from Fiscal Year 2016. Corporate income taxes totaled $1.3 billion, a decrease of $641 million (32.5 percent) from Fiscal Year 2016.

-25-
Sales taxes totaled $8.0 billion, a $20 million, or 0.2 percent, decrease from Fiscal Year 2016. Other State source revenues totaled $3.3 billion and transfers in from other State funds totaled $1.5 billion. Federal revenues totaled $2.5 billion, a decrease of $182 million from Fiscal Year 2016. This amount was lower than forecasted due to delays in releasing Medicaid payments that qualified for federal reimbursement. As revenues are recognized on a cash basis, federally matched moneys received for vouchers released after June 30, 2017 will be recorded in Fiscal Year 2018. Fiscal Year 2017 Expenditures General Funds operating expenditures and transfers to other State funds processed through the Office of the Comptroller for Fiscal Year 2017 totaled $35.7 billion (excluding prior year adjustments). Expenditures on the operating budget, not including pension contributions, totaled $24.1 billion, an increase of $3.5 billion (17.2 percent) from Fiscal Year 2016. General Funds pension contributions totaled $7.0 billion, an increase of $319 million (4.8 percent). Fiscal Year 2017 General Funds appropriations included language allowing State agencies to pay amounts carried over from Fiscal Year 2016 with Fiscal Year 2017 appropriations. Certain Fiscal Year 2017 appropriations were used to pay Fiscal Year 2016 commitments. Utilizing Fiscal Year 2017 appropriations for Fiscal Year 2016 costs limited agencies’ ability to process vouchers through the Comptroller’s office for Fiscal Year 2017 obligations. Not all current obligations of the state were paid during Fiscal Year 2017, while services continued with expectations of future payments. Areas for which the State did not provide payments at previous years’ levels from the General Funds, but for which the State has historically provided significant financial commitment, include General Revenue Fund payments to state employee health insurance providers and operational costs of certain state agencies. REVIEW OF FISCAL YEAR 2018 Fiscal Year 2018 Budget Actions As of May 31, 2017, no appropriations bills for spending for Fiscal Year 2018 had passed both chambers of the General Assembly. Fiscal Year 2018 began on July 1, 2017. Three budget-related Public Acts went into effect on July 6, 2017: PA 100-21 (appropriations), PA 100-22 (revenues) and PA 100-23 (the budget implementation statutory changes). Included in PA 100-22 were permanent increases in the individual income tax rate from 3.75 percent to 4.95 percent and in the corporate income tax rate from 5.25 percent to 7.0 percent, effective July 1, 2017. Other changes included revisions to certain tax credits and corporate income tax deductions. PA 100-23 included several legislative changes, some of which affected the State’s Fiscal Year 2018 General Funds Budget. These items include:
• Beginning in Fiscal Year 2018, State income and sales tax revenues shared with local governments, which previously were deposited in the General Revenue Fund and then transferred out to other funds, are now deposited directly into the Local Government Distributive Fund, Public Transportation Fund and Downstate Public Transportation Fund at the time revenues are collected. See APPENDIX A- Part IV: Tax Review. Local governments are expected to receive their payments from the State more quickly under this structure.

-26-
• Authorization for the State to issue up to $6 billion in Section 7.6 Bonds which were issued on November 8, 2017 and generated proceeds of approximately $6.5 billion. The proceeds of the issuance of the Section 7.6 Bonds were used to reduce the State’s accumulated unpaid bills by paying State vouchers incurred prior to July 1, 2017.
• Authorization for the Comptroller to reallocate in Fiscal Year 2018 up to $292.8 million from specific funds in the State Treasury to the General Revenue Fund, Budget Stabilization Fund, Healthcare Provider Relief Fund, or Health Insurance Reserve Fund, to enable the Comptroller to reduce the backlog of bills.
• Authorization for the Comptroller to temporarily transfer balances in other State funds in the State Treasury to General Funds or the Health Insurance Reserve Fund prior to December 31, 2018 to assist with the liquidity of the funds and assist in decreasing the State’s payables. The authority for this borrowing was extended to February 28, 2019 by P.A. 100-587. Any such interfund borrowing amounts are required to be paid back within 24 months of the borrowing under current statute. Outstanding interfund borrowing cannot at any time exceed $1.2 billion. $656 million of such borrowing was outstanding as of January 31, 2019.
• As described above, General Funds have been defined to include the General Revenue Fund, the Common School Fund, the General Revenue-Common School Special Account Fund, the Education Assistance Fund, the Fund for the Advancement of Education, the Commitment to Human Services Fund and the Budget Stabilization Fund.
On August 31, 2017, the Governor signed Public Act 100-465 into law, which provided for an evidence-based method of allocating funding among the State’s school districts. On June 4, 2018, the Governor signed Public Act 100-586, which, along with providing appropriations for Fiscal Year 2019, included $1.1 billion in supplemental appropriations for Fiscal Year 2018. These supplemental appropriations were primarily meant to address prior year liabilities that remained unpaid. Fiscal Year 2018 Revenues Base General Funds revenues, as impacted by the changes to the individual income tax and corporate income tax rates, for Fiscal Year 2018 totaled $36.9 billion, an increase of $6.6 billion, or 21.8 percent, when compared to Fiscal Year 2017 results under the new definition of General Funds. This increase primarily reflects an increase of $4.7 billion in individual income tax and corporate income tax revenues generated by increase in such tax rates. Individual income taxes deposited into the General Funds totaled $17.7 billion, while corporate income taxes totaled $2.0 billion for Fiscal Year 2018. These amounts include $1.2 billion deposited into the Commitment to Human Services Fund and the Fund for the Advancement of Education that are now included in the definition of General Funds. Excluded from these numbers are $1.1 billion of income tax revenue deposited directly with local governments. Net sales tax revenue deposits into the General Funds totaled $7.8 billion. This excludes $446 million of sales tax revenues deposited directly into local transit funds. Revenues from other state sources totaled $3.5 billion. Base federal source revenues increased to $4.0 billion in Fiscal Year 2018 from the Fiscal Year 2017 total of $2.5 billion. Use of the proceeds from the Section 7.6 Bonds to pay down prior

-27-
year Medicaid liabilities added an additional $1.2 billion to Fiscal Year 2018 totals. This additional amount is not included in the base revenues for Fiscal Year 2018 as it is attributable to the payment of prior year liabilities. The transfer in to the General Funds of $2.5 billion in Section 7.6 Bond proceeds is also not included in base revenues for Fiscal Year 2018. Other transfers in, not including amounts from fund reallocations or interfund borrowing authorized in PA 100-23, increased to $1.9 billion in Fiscal Year 2018 from actual Fiscal Year 2017 results of $1.5 billion. Fund reallocations in the approximate amount of $293 million were authorized in PA 100-23 along with statutory authority for the Comptroller to borrow from available balances in other State funds up to an aggregate amount of $1.2 billion over Fiscal Years 2018 and 2019 for deposit into the General Funds or the Health Insurance Reserve Fund in order to meet cash flow deficits and maintain liquidity in such funds. The Comptroller executed a total of $269 million in fund reallocations and $533 million in interfund borrowing in Fiscal Year 2018 ($128 million of the interfund borrowing was repaid by the Comptroller during Fiscal Year 2018). Under current statute, interfund borrowing must be repaid within 24 months of such borrowing. Fiscal Year 2018 Expenditures General Funds operating expenditures under the revised General Funds definition, totaled $35.4 billion, an increase of $4.4 billion or 14.2 percent from Fiscal Year 2017 results. Notable increases in spending, including supplemental appropriations for prior year costs, included $521 million for elementary and secondary education (plus $221 million for the State’s contribution to the Chicago teachers’ pension system), $1.6 billion for the Department of Healthcare and Family Services, $814 million for the Department of Corrections and an increase in General Funds pension contribution appropriations of $63 million (reduced from original estimates as described in APPENDIX E – PENSION AND OTHER POST EMPLOYMENT BENEFITS – 2017 Legislation Modifying Pension Structure). Additionally, the Fiscal Year 2018 General Funds amount includes General Revenue Fund appropriations of $1.9 billion for State employee and retiree health insurance which was not covered by a General Revenue Fund appropriation in Fiscal Year 2017. Statutory transfers out of the General Funds declined by $1.8 billion to $582 million in Fiscal Year 2018 from actual Fiscal Year 2017 results primarily due to a switch to direct deposits of the State’s local government revenue sharing portions of income and sales taxes into other State funds instead of the prior practice of depositing them into the General Funds and transferring them out to the other State funds. $1.6 billion of local government revenue sharing was direct deposited in Fiscal Year 2018 to other State funds which previously would have been deposited first into the General Funds before transfer to the other State funds. Debt service for GO Bonds, including pension bonds, totaled $2.4 billion from the General Funds, an increase of $137 million (6.1% increase from Fiscal Year 2017). Additionally, Fiscal Year 2018 included debt service transfers totaling $527 million for Section 7.6 Bonds and transfers to other State funds for interfund borrowing repayment of $128 million. Fiscal Year 2018 Results After adjusting for transfers to the General Funds as reported by the Comptroller, total Fiscal Year 2018 General Funds expenditures exceeded Fiscal Year 2018 General Funds revenues by $1.4 billion.
-28-
However, this deficit was reduced on a reporting basis by $3.7 billion due to the transfer into the General Funds of a portion of the proceeds of the Section 7.6 Bonds and the related federal match from the use of the Section 7.6 Bond proceeds.
After adjusting for those one-time revenues, Fiscal Year 2018 results reflect a $2.3 billion increase in the General Funds budgetary balance (the June 30 cash balance less the General Funds obligations paid in the state’s lapse period). The budgetary deficit lessened from $8.0 billion in Fiscal Year 2017 to a deficit of $5.7 billion in Fiscal Year 2018. In accordance with the State Budget Law, the estimated General Funds total of budget basis accounts payable, estimated Fiscal Year 2018 liabilities not paid, Section 25 liabilities and income tax refunds outstanding as of June 30, 2018 was $8.8 billion. Fiscal Year 2018 Bill Payment Delays State agencies are submitting vouchers for payment to the Comptroller for items that have enacted annual appropriations or continuing appropriations. Based on the revenues available to make such payments, there have been delays in making those payments to the vendors. As of March 1, 2019, the Comptroller was holding $6.8 billion in unpaid General Funds vouchers and pending transfers, and the Comptroller estimated that state agencies were holding an additional $1.1 billion. At its peak, the Comptroller estimated that the backlog of unpaid bills totaled $16.7 billion, and the late payment interest and penalties related thereto exceeded $1.25 billion The estimates of the amounts on hold at the agencies include bills that accumulated due to the lack of appropriations in Fiscal Year 2016 and Fiscal Year 2017 for General Revenue Fund State employee health insurance costs and estimated amounts not appropriated in Fiscal Year 2017 and carried forward in Fiscal Year 2018 for State agency costs. Supplemental appropriations in Public Act 100-586 (“PA 100-586”) were used to address these accumulated bills during the Fiscal Year 2018 lapse period, which ended on October 31, 2018. On June 30, 2017, a federal judge ordered the Comptroller to comply with the Memisovski and Beeks consent decrees by prioritizing certain payments to medical providers serving Medicaid clients as significant delays in payments to Medicaid providers were occurring. The direction from the court was to ensure payment of $586 million of monthly payments to Medicaid providers (including managed care providers). The court also ordered that Medicaid providers must be paid an additional $2 billion in Fiscal Year 2018 to begin reducing the accumulated backlog of Medicaid bills on hold at the Comptroller’s office. These are gross payments, inclusive of the share that would be covered by reimbursement by the federal government under the Medicaid program. All required payments, and some payments in excess of the requirement, were made during Fiscal Year 2018. For additional details, see “LITIGATION – Beeks v. Bradley and Memisovski v. Maram”. A portion of the proceeds of the Section 7.6 Bonds were used to make some of these Medicaid payments. On November 8, 2017, the Comptroller transferred $2.5 billion to the General Revenue Fund and approximately $4.0 billion to the Health Insurance Reserve Fund from the Section 7.6 Bond proceeds, which significantly reduced the amount of State employee health insurance and Medicaid bills on hold. This paydown in Medicaid bills generated federal match revenues in the amount of $1.2 billion. The federal matching funds were used to pay additional Medicaid bills, generating an additional $1.0 billion in federal matching funds which were also used to pay

-29-
Medicaid bills. Therefore, in the aggregate, $4.7 billion in Medicaid bills were paid as a result of the issuance of the Section 7.6 Bonds and the federal match. FISCAL YEAR 2019 BUDGET On June 4, 2018, Governor Rauner signed PA 100-586, authorizing an agreed upon Fiscal Year 2019 budget. Revenue estimates reflect projections by the Department of Revenue and GOMB consistent with current law. The Fiscal Year 2019 description that follows is based on current estimates, released in February 2019, of the Fiscal Year 2019 budget. Fiscal Year 2019 Estimated Revenues Fiscal Year 2019 base revenues and transfers in are estimated to be $37.4 billion, an increase of $467 million (1.3%) from Fiscal Year 2018 levels. The State’s three largest revenue sources, individual income tax, corporate income tax and state sales tax, are estimated to total $28.7 billion, a net increase of $1.1 billion (4.1%) when compared to Fiscal Year 2018. The estimate is net of anticipated direct deposits of $1.8 billion into the Local Government Distributive Fund, Public Transportation Fund and Downstate Public Transportation Funds from income and sales tax receipts. Base federal revenues are projected to total $3.2 billion, a decrease of $812 million (20.1%) from Fiscal Year 2018 base federal revenues. However, a proposed issuance of additional Section 7.6 Bonds within Fiscal Year 2019 is projected to add $166 million to Fiscal Year 2019 federal revenue totals through improvement in cash flow. Budgeted transfers for Fiscal Year 2019 are projected to be $2.1 billion, an increase of $147 million (7.7%) above Fiscal Year 2018. Additionally, total Fiscal Year 2019 revenues include an estimated $250 million in interfund borrowing and $700 million in Treasurer’s investment borrowing. Such revenues from the Treasurer’s investment borrowing program are not included in the State’s base revenues. For additional information regarding this program, see “INVESTMENT OF FUNDS” herein. Fiscal Year 2019 Estimated Expenditures Total General Funds operating expenditures for Fiscal Year 2019 are projected to total $35.7 billion, an increase of $275 million (0.8%) from Fiscal Year 2018 results. This does not include potential expenditures of up to approximately $381 million for paying for retroactive step payments to AFSCME employees for Fiscal Years 2016, 2017 and 2018 and the first three quarters of Fiscal Year 2019, which would require additional Fiscal Year 2019 appropriations. Governor Pritzker has proposed a $381 million Fiscal Year 2019 supplemental appropriation to provide for such costs. He also instructed agencies to pay affected AFSCME employees (and employees of other unions that have not received step increases since June 30, 2015) at the correct step and salary for pay periods beginning April 1, 2019. Current Fiscal Year 2019 appropriations will be utilized to pay the correct step and salary to employees after this date. Some agencies will require supplemental appropriations to make these payments. Statutory transfers out of the General Funds unrelated to debt service are projected to decline by approximately $149 million to $434 million in Fiscal Year 2019 from actual Fiscal Year 2018 results of $582 million. Debt service transfers from the General Funds for GO Bonds, including pension bonds, and Section 7.6 Bonds, is projected to total $2.7 billion from the General Funds. This includes debt service with respect to the Section 7.7 Bonds and a proposed new issuance of GO Bonds to reduce the bill backlog (the “Additional Section 7.6 Bonds”). See “FUTURE FINANCING” herein. Fiscal Year 2019 expenditures also include $713 million for the repayment

-30-
of the Treasurer’s investment borrowing, including interest, and $60 million for potential interfund borrowing repayments. Fiscal Year 2019 Projected Results The Fiscal Year 2019 budget is now expected to result in a projected budgetary deficit of $1.2 billion. After accounting for (i) potential additional costs of the retroactive step increases to AFSCME employees from Fiscal Year 2016 through the third quarter of Fiscal Year 2019 in the amount of $381 million, (ii) additional supplemental appropriations needed to complete Fiscal Year 2019 (in the amount of $92 million, including some supplemental appropriations for directed fourth quarter step increases), (iii) increases to total revenues from the deposit into the General Funds of the proceeds of the sale of the proposed Additional Section 7.6 Bonds in the amount of $600 million and (iv) the deposit into the General Funds of the federal revenues related to the use of the proceeds of the Additional Section 7.6 Bonds, the projected General Funds budgetary basis deficit totals $897 million. The budget basis fund deficit at the end of Fiscal Year 2019 is estimated to be $6.6 billion. In accordance with the State Budget Law, the General Funds total of budget basis accounts payable, Section 25 Liabilities and income tax refunds outstanding at the end of Fiscal Year 2019 is estimated to be $8.4 billion, as an additional $900 million of proceeds from the proposed Additional Section 7.6 Bonds is estimated to be utilized to address unpaid health insurance bills. FISCAL YEAR 2020 BUDGET PROPOSAL On February 20, 2019, Governor Pritzker submitted his Fiscal Year 2020 operating budget proposal to the General Assembly. The Governor’s budget proposal is based on the stated priorities of restoring economic and budgetary stability, creating a world class education system accessible to all, strengthening the State’s social safety network, reforming the criminal justice system and investing in public safety, rebuilding and expanding the State’s infrastructure and making the State a world leader that is competitive in the global economy. Fiscal Year 2020 Proposed Revenues The Governor’s Fiscal Year 2020 budget proposal estimates base State revenues and transfers in from other State funds to total $38.9 billion in Fiscal Year 2020, an increase of $1.5 billion (4.0%) from the estimated Fiscal Year 2019 base levels. The State’s three largest revenue sources, individual income tax, corporate income tax and state sales tax, are estimated to total $29.7 billion, an increase of $1.0 billion (3.6%) from Fiscal Year 2019 estimates. The estimate is net of $1.8 billion of income and sales tax revenues deposited directly into the Local Government Distributive Fund, Downstate Public Transportation Fund and Public Transportation Fund. The Fiscal Year 2020 budget holds the formula for these deposits prorated at 95 percent, consistent with the Fiscal Year 2019 level. Other State source revenues are projected to total $3.8 billion, a $359 million increase from Fiscal Year 2019 levels based on the proposals set forth in the proposed Fiscal Year 2020 budget. Included in this projection are receipts from several new revenue enhancement and adjustment proposals, including the legalization of sports wagering, estimated to generate $212 million for the General Funds, and legalization of recreational adult use cannabis, estimated to generate $170 million for the General Funds. The estimated $212 million from sports wagering derives from upfront licensing fees generated by the legalization of sports wagering based on a preliminary model projecting 20 licenses at $10 million each being issued throughout the State for a total of

-31-
$200 million, and an additional $12 million transferred to the General Funds from taxes on sports wagering. The estimated $170 million generated by the legalization of recreational adult use cannabis is based on potential revenues from upfront license fees collected by the State. The Governor’s proposed Fiscal Year 2020 budget seeks to revise the distribution of cigarette and other tobacco products taxes to direct the first $6 million in receipts per month to the Common School Fund and the remainder to the Healthcare Provider Relief Fund. This decreases the General Funds portion of the cigarette taxes to $72 million in Fiscal Year 2020 from a Fiscal Year 2019 total of $347 million. This will redirect $267 million of existing cigarette tax revenues from the General Revenue Fund to the Healthcare Provide Relief Fund. The Healthcare Provider Relief Fund is a fund outside of the General Funds that can support costs of the Medicaid program. The Governor also proposed an increase in the State’s cigarette tax and proposed a tax on e-cigarettes in line with the current tax on Other Tobacco Products under State law which would generate $65 million for deposit into the Healthcare Provider Relief Fund. Additionally, the Governor proposed that the State enact an assessment on managed care organizations similar to some of the other assessments that the State has in place. This proposal would generate $390 million for deposit into the Healthcare Provider Relief Fund. These combined deposits into the Healthcare Provider Relief Fund will enable the State to reduce the amount of annual appropriated deposits from the General Revenue Fund into the Healthcare Provider Relief Fund by $722 million. Taking into account the revision to the cigarette tax distribution formula discussed above, the net relief associated with the Medicaid Program through the new revenues to the Healthcare Provider Relief Fund is $455 million. In addition to these changes, the Governor is proposing that the State enact a plastic bag tax ($20 million), switch the State tax on video gaming to a progressive rate structure ($89 million to the Capital Projects Fund), decouple from the federal credit related to foreign derived intangible income ($94 million), cap the amount of retailers discount on sales tax collections ($75 million for the General Funds), and limit tax credits related to a private school scholarship program ($6 million). In total, estimated new revenue enhancements and adjustments outlined in the Governor’s Fiscal Year 2020 budget proposal would generate approximately $1.1 billion in benefit to the General Funds, although not all would be deposited directly into the General Funds. The Governor is also recommending the State undertake a delinquent tax payment incentive plan to generate an estimated $175 million. Transfers in to the General Funds are projected to total $1.8 billion, a decrease of $232 million (11.3%) from Fiscal Year 2019 estimates. This decrease is primarily due to a larger-than-usual transfer in from the Income Tax Refund Fund in Fiscal Year 2019. $327 million was transferred from this fund in Fiscal Year 2019, compared to a projection of $25 million in Fiscal Year 2020. Federal revenues are projected to total $3.5 billion, an increase of $327 million (10.2%). This reflects an assumption that cash availability in the General Funds will allow the Comptroller to prioritize payments of federally-matchable Medicaid bills in order to maximize federal receipts in Fiscal Year 2020. Fiscal Year 2020 Proposed Expenditures The Governor’s Fiscal Year 2020 budget proposal focuses on spending in key priority areas including education, early childhood and human services. Included in the proposed Fiscal Year

-32-
2020 budget is an increase of $630 million to support pre-K-12 and higher education, and an increase of $542 million to support human services agencies. These increases, coupled with other proposals outlined in the Governor’s proposed Fiscal Year 2020 budget, bring the estimated Fiscal Year 2020 operating expenditures to $36.0 billion, an increase from fiscal year 2019 of $332 million (0.9%). This also reflects the shift of Medicaid related expenditures to the Healthcare Provider Relief Fund totaling $722 million and the effect of the Governor’s proposed changes to the State’s retirement systems. See APPENDIX E-FUTURE PENSION REFORM PROPOSALS herein. Statutory transfers out of the General Funds, other than debt service transfers, are projected to decline by approximately $70 million to $364 million in Fiscal Year 2020 from estimated Fiscal Year 2019 results of $434 million. This reflects the proposal to suspend certain transfers out of the General Funds for Fiscal Year 2020 only in the amount of $36 million. Debt service for GO Bonds, including pension bonds and Section 7.6 Bonds and Section 7.7 Bonds, is projected to total $2.3 billion from the General Funds. This includes debt service on a proposed new issuance of pension funding bonds and reflects the final maturity of the 2011 pension bonds, which occurred on March 1, 2019, reducing debt service by $953 million. See “FUTURE FINANCING” herein. Fiscal Year 2020 expenditures also include $85 million for estimated partial repayments of interfund borrowing accompanied by the flexibility of the Comptroller to delay unneeded repayments in Fiscal Year 2020 for an additional 24 months. Fiscal Year 2020 Proposed Results In total, estimated new revenue enhancements and adjustments outlined in the Governor’s Fiscal Year 2020 budget proposal would generate approximately $1.1 billion in benefit to the General Funds. In the absence of any of these needed revenues or alternative revenue enhancements, an equal amount of spending would have to be eliminated. The Governor does not recommend such reductions, but, should they become necessary due to revenue shortfalls, each agency’s spending in the General Funds budget, aside from debt service, pensions and employee healthcare costs, would be reduced by 4.0% to ensure a balanced budget. This action would diminish much needed investments in education, higher education, social services and criminal justice programs. As proposed by the Governor, the Fiscal Year 2020 budget, including additional revenues, would result in a budgetary surplus of $155 million. These surplus revenues would be used to further address the State’s bill backlog. The estimated budget basis fund deficit at the end of Fiscal Year 2020 totals $6.4 billion. In accordance with the State Budget Law, the General Funds total of budget balance accounts payable, Section 25 Liabilities and income tax refunds outstanding at the end of Fiscal Year 2020 are estimated to be $7.9 billion, a $495 million reduction from the end of Fiscal Year 2019. Income Tax Proposal. The Governor’s budget proposal also seeks to change the State’s income tax system from a flat tax to a progressive tax as a means of addressing the State’s fiscal challenges. The Governor is advancing such proposal in lieu of other proposals for balancing the State’s budget, including substantially cutting discretionary spending, increasing the flat tax rate (likely from 4.95% percent to 5.95 percent) for all taxpayers, or some combination thereof. Such a proposal would require approval by 3/5ths of each house of the General Assembly and submission to the voters of the State at a general election. The next general election at which such

-33-
an amendment could be considered will occur on November 3, 2020, which would allow for implementation in January 2021, providing a half year of additional revenue in State Fiscal Year 2021. Under the Governor’s proposal, income tax rates would be adopted in separate legislation with the implementation thereof contingent on the passage of the constitutional amendment. In a subsequent address, the Governor provided additional detail on his income tax proposal. In lieu of the current individual income tax flat rate of 4.95%, the proposal would tax income at marginal tax rates between 4.75% and 4.95% for income up to $250,000, would tax income between $250,001 and $500,000 at a rate of 7.75%, and income between $500,000 and $1,000,000 at a rate of 7.85%. Households with an income in excess of $1,000,000 would pay a flat income tax rate of 7.95% on all income. In connection with these changes, the Governor also proposed (i) an increase to the State’s residential property tax credit from 5% to 6% of property taxes paid and (ii) a per-child tax credit of up to $100 for individuals earning less than $80,000 and households earning less than $100,000. The Governor estimates that such proposals would generate approximately $3.4 billion in additional revenue for the State annually, and would reduce tax bills for approximately 97% of the State’s taxpayers.
COLLECTIVE BARGAINING As of December 31, 2018, 45,562 (or 92%) of the State’s 49,684 employees are covered by collective bargaining agreements. As of March 1, 2019, the State has entered into 19 collective bargaining agreements for the July 1, 2015-June 30, 2019 time period, covering approximately 6,000 employees. Meanwhile, the remaining 15 collective bargaining agreements covering nearly 40,000 State employees under the jurisdiction of the Governor expired on June 30, 2015, and have yet to be renegotiated. The State entered into tolling agreements with several unions, including the American Federation of State, County and Municipal Employees (“AFSCME”), which represents approximately 35,600 (or 78%) of the State employees covered by collective bargaining agreements. Tolling agreements provide that the parties will maintain the status quo under the expiring collective bargaining agreement and that the parties will neither implement a strike nor a lockout until they are at an impasse in negotiations. When these collective bargaining agreements expired in 2015, the State stopped paying step increases to employees covered by the agreements. Since the expiration of their collective bargaining agreement, two concurrent legal actions have been ongoing involving the State and AFSCME. On January 15, 2016, the State asked the Illinois Labor Relations Board (the “ILRB”) to determine whether negotiations between the State and AFSCME were at an impasse. The ILRB ruled in favor of the State, and AFSCME sought judicial review in the appellate courts. The Appellate Court, on October 23, 2018, declared its belief that the record did not adequately support a finding of impasse. It vacated the ILRB’s order and remanded the case to the ILRB for proceedings consistent with its opinion and to permit the ILRB an opportunity to either explain why it departed from previous practice or to apply the Taft factors in accordance with its precedent. Concurrently with the action above, AFSCME filed an unfair labor practices charge, arguing that stopping step increases failed to preserve the status quo between the parties during negotiations. The ILRB dismissed the charge. AFSCME appealed, and on November 6, 2017 the

-34-
Illinois Appellate Court for the Fifth District reversed the ILRB and remanded the matter for further proceedings. The State petitioned for leave to appeal in the Illinois Supreme Court, but the petition was denied on March 21, 2018. The matter was remanded to the ILRB to take action consistent with the Appellate Court’s decision (the “AFSCME Decision”). On remand, the ILRB issued an order dated July 10, 2018, directing the State to restore the status quo of paying step increases and to “make whole” the bargaining unit employees. The ILRB referred the matter to its compliance process to address specific issues necessary to implement the make whole order. The Compliance Officer gathered relevant information from the State, and the matter was assigned to an Administrative Law Judge. The matter is currently on a 90-day hold in order to give the parties an opportunity to pursue settlement of all the issues. ECONOMIC AND FISCAL POLICY REPORT: FY 2019–FY 2024 GOMB is required, pursuant to 20 ILCS 3005/7.3 et seq., to prepare annually and submit to the General Assembly an economic and fiscal policy report. Public Act 99-854 moved up the required date of publication of this report from the third business day in January to November 15th and added additional reporting requirements, including two additional years of forecasts and review of fiscal policy options when budgetary shortfalls are projected. This report (the “Economic and Fiscal Policy Report”) is intended to provide additional information on the State’s economic and fiscal objectives and fiscal policy intentions for the upcoming fiscal year and succeeding four fiscal years, and is not a projection of the financial condition of the State for this period. GOMB also publishes a quarterly unaudited report of revenues, expenditures, and other financing sources of major State funds. These reports are prepared primarily on a modified accrual basis and are available on GOMB’s website (see APPENDIX F—WEBSITE INDEX). The most recent Economic and Fiscal Policy Report was released on November 15, 2018. The report provides that, without changes to the trajectory of the State’s finances, year-end accounts payable will continue to grow year by year during the five-year reporting period. The complete report is available at https://www2.illinois.gov/sites/budget/Pages/PolicyReports.aspx.
GENERAL OBLIGATION INDEBTEDNESS OUTSTANDING GENERAL OBLIGATION BONDS Table 6 shows the statutory general obligation bond authorization, Table 7 shows the maturity schedule for all outstanding GO Bonds, and Table 8 provides certain information with respect to all outstanding GO Bonds. Except as noted in such tables, the amount of outstanding GO Bonds shown in Tables 6 and 7 has not been reduced by the remaining amounts otherwise available in the GOBRI Fund.

-35-
TABLE 6 GENERAL OBLIGATION BOND AUTHORIZATION
(As of March 1, 2019)
Authorization Category Amount
Authorized1Amount Issued2
Authorized Unissued
Amount Outstanding3
Multi-purpose $32,174,577,443 $28,276,378,451 $3,898,198,992 $9,764,995,646Special-purpose4 250,000,000 249,998,067 1,933 0Refunding Bonds5 4,839,025,000 11,467,856,425 1,059,704,273 3,779,320,728Subtotal $37,263,602,443 $39,994,232,943 $4,957,905,198 $13,544,316,374 Pension Bonds 17,562,348,300 17,166,000,000 396,348,300 9,025,000,000Section 7.7 Bonds 1,000,000,000 0 1,000,000,000 0Section 7.6 Bonds6 6,000,000,000 6,000,000,000 0 5,500,000,000Total $61,825,950,743 $63,160,232,943 $6,354,253,498 $28,069,316,374 Currently Authorized Less
Refunding Bonds7 $56,986,925,743 $51,692,376,518
Source: Governor’s Office of Management and Budget. 1 As authorized under the Bond Act. 2 Includes bond premiums, except for Refunding Bonds and Section 7.6 Bonds. 3 Amount outstanding reflects principal outstanding on March 1, 2019, taking into account principal paid off through March 1, 2019. The
Refunding Bond row reflects principal and premium outstanding, reflecting principal and premium that have amortized through March 1, 2019. 4 Special-purpose authorization was to issue bonds to fund Medicaid expenses. This authorization existed only in fiscal year 2010. 5 The State is authorized to issue and have outstanding $4,839,025,000 of GO Refunding Bonds. The authorized unissued amount of refunding
bonds is the difference between the amount authorized and the amount outstanding. 6 Amount issued does not include bond premium. 7 Section 2 of the Bond Act states that the aggregate authorized amount of the general obligation bonds (excluding authorization for refunding
bonds) is $57,717,925,743. The difference is attributable to expired authorization for Tobacco bonds (30 ILCS 330/7.5) and a $19,000,000 miscalculation in Section 2 of the Bond Act.

-36-
TABLE 7 MATURITY SCHEDULE – GENERAL OBLIGATION BONDS
(As of March 1, 2019)(1)
General Obligation Section 7.7
Series 2019A Bonds Series 2019B Bonds General Obligation Capital
Improvement and Refunding Bonds(2)
General Obligation Section 7.6 November 2017 ABCD Bonds General Obligation Pension Bonds Total
Fiscal Year June 30 Principal Interest Principal Interest Principal Interest Principal Interest Principal Interest
Combined Total Debt Service
2019 $ 964,512,317 $ 732,316,212 $ 500,000,000 $ 286,537,500 $ 1,075,000,000 $ 511,105,500 $ 4,069,471,529 2020 $ 12,000,000 $ 15,640,533 $ 6,280,342 938,221,629 693,157,196 500,000,000 261,537,500 225,000,000 449,550,000 3,095,106,859 2021 12,000,000 15,546,000 $ 5,000,000 6,896,500 932,000,883 639,545,706 500,000,000 236,537,500 275,000,000 438,412,500 3,049,042,589 2022 12,000,000 15,096,000 16,000,000 6,371,500 907,357,410 583,098,963 500,000,000 211,537,500 325,000,000 424,800,000 2,978,889,873 2023 12,000,000 14,646,000 16,000,000 5,571,500 895,772,922 541,474,275 500,000,000 186,537,500 375,000,000 408,712,500 2,934,143,197 2024 12,000,000 14,166,000 16,000,000 4,771,500 857,198,968 487,980,912 500,000,000 161,537,500 450,000,000 390,150,000 2,873,033,380 2025 12,000,000 13,662,000 16,000,000 3,971,500 789,958,835 445,748,025 500,000,000 136,537,500 525,000,000 367,200,000 2,790,106,360 2026 12,000,000 13,122,000 23,070,000 2,994,750 796,540,000 401,202,950 500,000,000 111,537,500 575,000,000 340,425,000 2,749,827,450 2027 12,000,000 12,552,000 6,000,000 2,264,250 705,350,000 361,879,975 500,000,000 87,018,750 625,000,000 311,100,000 2,614,900,725 2028 12,000,000 11,952,000 41,000,000 1,085,500 711,170,000 322,466,375 500,000,000 62,500,000 700,000,000 279,225,000 2,599,313,375 2029 12,000,000 11,328,000 1,210,000 30,250 692,555,000 284,287,775 500,000,000 37,500,000 775,000,000 243,525,000 2,556,195,775 2030 12,000,000 10,680,000 - - 636,335,000 248,338,275 500,000,000 12,500,000 875,000,000 204,000,000 2,498,853,275 2031 12,000,000 10,008,000 - - 598,285,000 215,218,100 - - 975,000,000 159,375,000 1,969,886,100 2032 12,000,000 9,324,000 - - 527,250,000 184,478,640 - - 1,050,000,000 109,650,000 1,892,702,640 2033 12,000,000 8,628,000 - - 502,230,000 155,911,130 - - 1,100,000,000 56,100,000 1,834,869,130 2034 12,000,000 7,920,000 - - 538,820,000 127,376,020 - - - - 686,116,020 2035 12,000,000 7,200,000 - - 468,840,000 100,015,660 - - - - 588,055,660 2036 12,000,000 6,480,000 - - 386,600,000 74,003,800 - - - - 479,083,800 2037 12,000,000 5,760,000 - - 338,600,000 55,340,000 - - - - 411,700,000 2038 12,000,000 5,040,000 - - 283,600,000 38,586,450 - - - - 339,226,450 2039 12,000,000 4,320,000 - - 251,600,000 24,492,900 - - - - 292,412,900 2040 12,000,000 3,600,000 - - 104,600,000 13,889,500 - - - - 134,089,500 2041 12,000,000 2,880,000 - - 104,600,000 9,025,750 - - - - 128,505,750 2042 12,000,000 2,160,000 - - 63,400,000 4,179,500 - - - - 81,739,500 2043 12,000,000 1,440,000 - - 44,200,000 1,555,000 - - - - 59,195,000 2044 12,000,000 720,000 - - - - 12,720,000
Total $300,000,000 $223,870,533 $140,280,000 $40,237,592 $14,039,597,963 $6,745,569,090 $6,000,000,000 $1,791,818,750 $9,925,000,000 $4,693,330,500 $43,719,186,837
Source: Governor's Office of Management and Budget Note: Interest on Build America Bonds is shown gross of the 35% Federal subsidy. (1) This table provides the maturity schedule for the State’s GO Bonds, but gives effect to the issuance of the Bonds and the refunding of the Refunded Bonds. Includes all debt service paid or payable during fiscal year 2019 (2) Includes principal and interest on the Series 2019B Bonds, less debt service on the refunded bonds. Interest on the 2003B variable rate bonds and related swaps prior to redemption on 09/06/18 is calculated at 8.083%, which includes the related swap fixed payer rates plus the 2003B base note spread adjusted to include a post tax-reform gross-up that became effective in 2018

-37-
TABLE 8 OUTSTANDING GENERAL OBLIGATION BONDS
(As of March 1, 2019)
Par1 Bond Series Dated Date $965,770,000 General Obligation Refunding Bonds Series of September 2018 September 5, 2018$500,000,000 General Obligation Bonds Series of May 2018 May 9, 2018$750,000,000 General Obligation Bonds Series of December 2017 December 13, 2017
$6,000,000,000 General Obligation Bonds Series of November 2017 November 8, 2017$480,000,000 General Obligation Bonds Series November 2016 November 17, 2016
$1,303,145,000 General Obligation Refunding Bonds Series October 2016 November 2, 2016$550,000,000 General Obligation Bonds Series June 2016 June 29, 2016$480,000,000 General Obligation Bonds Series January 2016 January 26, 2016$750,000,000 General Obligation Bonds Series May 2014 May 8, 2014$250,000,000 General Obligation Bonds Series April 2014 April 17, 2014
$1,025,000,000 General Obligation Bonds Series February 2014 February 13, 2014$350,000,000 General Obligation Bonds Series December 2013 (Taxable) December 19, 2013
$1,300,000,000 General Obligation Bonds Series June 2013 July 10, 2013$450,000,000 General Obligation Bonds Series A of April 2013 April 10, 2013$350,000,000 General Obligation Bonds Series B of April 2013 (Taxable) April 10, 2013$50,000,000 General Obligation Bonds Series September 2012 September 25, 2012
$1,797,740,000 General Obligation Refunding Bonds Series May 2012 May 8, 2012$575,000,000 General Obligation Bonds Series March 2012 March 27, 2012$525,000,000 General Obligation Bonds Series A of January 2012 January 20, 2012$275,000,000 General Obligation Bonds Series B of January 2012 (Taxable) January 20, 2012$900,000,000 General Obligation Bonds Series 2010-5 (BABs) July 21, 2010$300,000,000 General Obligation Bonds Series 2010-4 (BABs) July 1, 2010$700,000,000 General Obligation Bonds Series 2010-3 (BABs) April 26, 2010$300,000,000 General Obligation Bonds Series 2010-2 (BABs) April 26, 2010$56,000,000 General Obligation Bonds Series March 2010 (Taxable) April 26, 2010
$1,501,300,000 General Obligation Refunding Bonds Series February 2010 March 3, 2010$1,000,000,000 General Obligation Bonds Series 2010-1 (BABs) February 4, 2010
$400,000,000 General Obligation Bonds Series September 2009 September 23, 2009$150,000,000 General Obligation Bonds Series April 2009 April 14, 2009$125,000,000 General Obligation Bonds Series April 2008 May 1, 2008$329,000,000 General Obligation Refunding Bonds Series June 2007B June 27, 2007$108,000,000 General Obligation Bonds Series June 2007A June 26, 2007$150,000,000 General Obligation Bonds Series April 2007 April 19, 2007$285,000,000 General Obligation Bonds Series June 2006A June 29, 2006$274,950,000 General Obligation Refunding Bonds Series June 2006 June 29, 2006$325,000,000 General Obligation Bonds Series January 2006 January 18, 2006$300,000,000 General Obligation Bonds Series September 2005 September 29, 2005$285,000,000 General Obligation Bonds Series September 2004 September 28, 2004
$10,000,000,000 General Obligation Bonds Series June 2003 (Pension) June 12, 2003$62,078,508 College Savings Bonds Series October 2002 November 1, 2002
$375,000,000 General Obligation Bonds Series November 2001 November 1, 2001$101,855,029 College Savings Bonds Series October 2000 October 19, 2000$122,334,152 College Savings Bonds Series November 1998 November 10, 1998$168,330,467 College Savings Bonds Series November 1997 November 13, 1997
Source: Governor’s Office of Management and Budget 1 Amounts are the original par value as of date of issue.

-38-
SHORT-TERM DEBT Pursuant to the Illinois Constitution and the Short Term Borrowing Act, the Governor, Comptroller and Treasurer are authorized to borrow limited amounts on a short-term basis. See “STATE OF ILLINOIS—CONSTITUTIONAL PROVISIONS–Constitutional Provisions Relating to Short-Term Borrowing.” The Short Term Borrowing Act constitutes an appropriation of any money in the State Treasury of an amount sufficient to pay the principal and interest on short-term certificates issued pursuant to such Act. The State has no Short-Term Debt currently outstanding, and has not issued Short-Term Debt since July 2010. INVESTMENT OF FUNDS The Treasurer may, with the Governor’s approval, invest and reinvest any money in the GOBRI Fund which is not needed for current expenditures due or about to become due from such Fund in securities constituting direct obligations of the United States Government, or obligations the principal of and interest on which are guaranteed by the United States Government, or certificates of deposit of any state or national bank or savings and loan association. For amounts not insured by the Federal Deposit Insurance Corporation or the Federal Savings and Loan Insurance Corporation or their lawful successors as security, the Treasurer is required to accept securities constituting direct obligations of the United States Government, or obligations the principal of and interest on which are guaranteed by the United States Government. Earnings received from such investments are paid into the GOBRI Fund. The Deposit of State Monies Act (15 ILCS 520/22.5) was amended in 2018 to create a new “permitted investment” for the Treasurer. Within certain parameters, the Treasurer is permitted to invest up to $2 billion of the money in the State treasury, including proceeds from the issuance of general obligation bonds, with the Office of the Comptroller in order to enable the Comptroller to pay outstanding vouchers. As of March 1, 2019, the Treasurer has entered into seven investment agreements with the Office of the Comptroller totaling $700 million. All are short-term investments to be repaid by the Comptroller during Fiscal Year 2019. As of January 2019, $15 million deposited pursuant to these agreements have been repaid. The Bond Act prohibits the use of money deposited in the GOBRI Fund for this type of investment. FUTURE FINANCINGS The State is contemplating the issuance of additional bonds, potentially in the amount of $1.5 billion, to finance a portion of the State’s bill backlog during Fiscal Year 2019. Such borrowing would require additional authorization by the General Assembly, as the State has issued all of the Section 7.6 Bonds presently authorized by the Bond Act. The Governor’s Fiscal Year 2020 budget proposal outlines several additional issuances of bonds being contemplated by the State. The budget proposal contemplates the issuance of approximately $1.1 billion of general obligation bonds to finance capital expenditures. Such capital bonds would be issued in continuation of the bonding authorization under the 2009 Capital Program. In addition, the budget contemplates the issuance of the remaining $700 million of Section 7.7 Bonds authorized by the Bond Act. Finally, the State is contemplating issuing approximately $2 billion of additional bonds for the purpose of making additional contributions to the State’s retirement systems for the purpose of increasing the assets available to pay pension benefits (the “2020 Pension Bonds”). The State is deliberating whether to issue such 2020 Pension Bonds as additional

-39-
general obligation bonds, or whether to issue the 2020 Pension Bonds as revenue bonds payable specifically from a revenue stream of the State, such as income taxes. Regardless of the security for the 2020 Pension Bonds, such bonds will require authorization by the General Assembly. Such 2020 Pension bonds would only be issued if such transaction would be cost effective for the State. See APPENDIX E herein for additional information. The State also periodically reviews its existing debt and has authorization to enter into refunding transactions from time to time as dictated by economic conditions. The State evaluates its short-term cash needs from time to time and based on such evaluations may seek to issue Short-Term Debt due within one year from its date of issuance under existing law.
REVENUE OBLIGATIONS STATE REVENUE BONDS Revenue obligations are either those obligations for which the State or an authority of the State dedicates a specific revenue source for debt service or those obligations under which the State is committed to retire debt issued by certain authorities or municipalities created and organized pursuant to law and operating within the State. Debt service with respect to each of these obligations continues to be paid in a timely manner. The State’s commitment is based upon various Illinois statutes and upon contractual arrangements with the issuers. A description of each State revenue bond program follows. Table 11 identifies the current level of State revenue bonds indebtedness. BUILD ILLINOIS The Build Illinois program funds initiatives in business development, infrastructure construction and replacement, education, and environmental protection. The Build Illinois Bonds are dedicated State tax revenue bonds. The current Build Illinois Bond authorization is $6,246,009,000. The Build Illinois Bond Act (30 ILCS 425) contains restrictions on the issuance of Build Illinois Bonds similar to those contained in the Bond Act and described under “INTRODUCTION—AUTHORITY FOR ISSUANCE.” Build Illinois Bonds are direct, limited obligations of the State payable solely from and secured by an irrevocable, first priority pledge of and lien on moneys on deposit in the Build Illinois Bond Retirement and Interest Fund, a separate fund in the State Treasury. Such moneys are derived primarily from the State’s share of sales tax receipts and certain tax revenues and other moneys transferred from the Capital Projects Fund, to the extent available. Build Illinois Bonds are not general obligations of the State and are not secured by a pledge of the full faith and credit of the State. The holders of Build Illinois Bonds may not require the levy or imposition of any taxes or the application of other State revenue or funds to the payment of the bonds, except for the specified sales tax revenues pledged to the bonds. METROPOLITAN EXPOSITION AND AUDITORIUM AUTHORITIES—CIVIC CENTER PROGRAM In 1989, GOMB was authorized to issue Civic Center Bonds. Prior to this change, eligible civic center authorities, and later the Department of Commerce and Community Affairs, issued State-supported bonds to finance the development of community civic centers. State of Illinois Civic Center Bonds are direct, limited obligations of the State payable from and secured by an irrevocable pledge and lien on moneys deposited in the Illinois Civic Center Bond

-40-
Retirement and Interest Fund. The payment of debt service is subject to annual appropriation by the General Assembly. The bonds are not general obligations of the State and are not secured by a pledge of the full faith and credit of the State. The bondholders may not require the levy or imposition of any taxes or the application of other State revenues or funds to the payment of the bonds.

-41-
TABLE 9 MATURITY SCHEDULE – STATE REVENUE BONDS1
As of March 1, 2019
Build Illinois Bonds Civic Center Bonds Total, State Revenue Bonds Fiscal Year Principal Interest Principal Interest
Combined Total Principal
Combined Total Interest
Combined Total Debt Service
2019 $ 214,615,000 $104,185,168 $ 5,875,462 $ 8,558,600 $ 220,490,462 $112,743,768 $ 333,234,230 2020 198,570,000 99,421,396 6,103,026 8,328,380 204,673,026 107,749,776 312,422,802 2021 167,710,000 90,989,963 5,405,000 168,906 173,115,000 91,158,869 264,273,869 2022 178,170,000 84,149,398 - - 178,170,000 84,149,398 262,319,398 2023 166,885,000 76,349,623 - - 166,885,000 76,349,623 243,234,623 2024 159,690,000 69,077,442 - - 159,690,000 69,077,442 228,767,442 2025 158,575,000 61,767,527 - - 158,575,000 61,767,527 220,342,527 2026 156,725,000 54,642,906 - - 156,725,000 54,642,906 211,367,906 2027 135,120,000 47,577,885 - - 135,120,000 47,577,885 182,697,885 2028 113,620,000 41,535,624 - - 113,620,000 41,535,624 155,155,624 2029 112,620,000 36,617,210 - - 112,620,000 36,617,210 149,237,210 2030 104,515,000 31,725,781 - - 104,515,000 31,725,781 136,240,781 2031 109,495,000 27,367,522 - - 109,495,000 27,367,522 136,862,522 2032 102,860,000 22,870,798 - - 102,860,000 22,870,798 125,730,798 2033 97,040,000 18,637,709 - - 97,040,000 18,637,709 115,677,709 2034 94,575,000 14,753,655 - - 94,575,000 14,753,655 109,328,655 2035 69,060,000 11,004,286 - - 69,060,000 11,004,286 80,064,286 2036 69,060,000 8,026,368 - - 69,060,000 8,026,368 77,086,368 2037 38,850,000 5,048,450 - - 38,850,000 5,048,450 43,898,450 2038 26,350,000 3,349,850 - - 26,350,000 3,349,850 29,699,850 2039 9,600,000 2,142,000 - - 9,600,000 2,142,000 11,742,000 2040 9,600,000 1,720,500 - - 9,600,000 1,720,500 11,320,500 2041 9,600,000 1,293,250 - - 9,600,000 1,293,250 10,893,250 2042 9,600,000 866,000 - - 9,600,000 866,000 10,466,000 2043 9,600,000 433,000 - - 9,600,000 433,000 10,033,000 Total $2,522,105,000 $915,553,310 $17,383,488 $17,055,887 $2,539,488,488 $932,609,197 $3,472,097,685
1 Includes all debt service paid or payable during fiscal year 2019 Note: Columns may not add due to rounding.

-42-
STATE AUTHORITY REVENUE BONDS A description of revenue bond programs of State authorities follows. Table 10 identifies the current level of indebtedness for these State authority bonds. METROPOLITAN PIER AND EXPOSITION AUTHORITY—EXPANSION PROJECT BONDS Metropolitan Pier and Exposition Authority (“MPEA”) is authorized to issue McCormick Place Expansion Project Bonds. Public Act 100-23 increased the MPEA’s bond authorization by $293 million, to $2.85 billion. These bonds are secured by locally imposed taxes including hotel/motel, restaurant, car rental and airport departure taxes and, to the extent such taxes are insufficient, are further secured by State sales tax revenues, subject to appropriation. Transfers of State sales tax revenues are subject to the prior claim for payments into the Build Illinois Fund. Public Act 96-898 provided additional financial support from the State for operations of MPEA in an amount up to $31.7 million annually until 2032. On December 6, 2017, MPEA issued bonds in the approximate principal amount of $473 million. ILLINOIS SPORTS FACILITIES AUTHORITY The Illinois Sports Facilities Authority (“ISFA”) is authorized to finance sports facilities within the City of Chicago. Debt issued by ISFA is an obligation of ISFA and is not backed by the full faith and credit of the State. The ISFA has four issues of outstanding revenue bonds, totaling $407.5 million in principal amount as of June 30, 2018, which are payable, subject to appropriation, from (i) a $10 million subsidy derived equally from State hotel tax revenues and amounts allocable to the City of Chicago under the State Revenue Sharing Act (30 ILCS 115/0.1 et seq.) and (ii) an advance of certain State hotel tax revenues which is required to be repaid annually by receipts derived from a 2.0% hotel tax imposed by ISFA within the City of Chicago. In the event the ISFA tax is insufficient to repay the advance of State hotel tax revenues, the deficiency will be paid from additional amounts otherwise payable to the City of Chicago under the State Revenue Sharing Act. The State expects that all amounts advanced as described in clause (ii) above will be repaid to the State. RAILSPLITTER TOBACCO SETTLEMENT AUTHORITY In December 2010, the Railsplitter Tobacco Settlement Authority (“Railsplitter”) issued revenue bonds in the amount of $1.5 billion. After funding Railsplitter’s various business purposes, including the funding of a debt service reserve fund, the State received $1.35 billion in exchange for selling to Railsplitter its rights to substantially all of the payments under the Master Settlement Agreement (“MSA”) between various states, including the State, and various cigarette manufacturers (the Original Participating Manufacturers or “OPM”). In December 2017, Railsplitter issued approximately $671 million in revenue bonds to refund a portion of the 2010 revenue bond issuance. The MSA calls for the OPMs to make annual payments which are allocated among the various participating states. These funds had been used by the State primarily to fund Medicaid programs. Railsplitter purchased substantially all of the State’s rights to the MSA payments but, by the terms of the purchase, may keep only the amount of funds required each year for debt service, costs of operations and enforcement of the MSA by the State Attorney General. Any excess amounts (“Excess MSA Payments”) must be transferred to the State. The revenue bonds issued by Railsplitter are secured only by the MSA payments and the State is not obligated in any way to pay principal and interest on these bonds. Such payments are not subject to appropriation.

-43-
However, as a result of the Railsplitter bond financing, other revenues are being used to fund those portions of the Medicaid programs previously funded by the MSA payments now retained by Railsplitter. These revenues include amounts in the General Revenue Fund. In addition, Railsplitter has a priority claim on Illinois’ share of the MSA payments. If those amounts should decline in future years, the State’s share of any Excess MSA Payments will be correspondingly reduced.

-44-
TABLE 10 MATURITY SCHEDULE – STATE AUTHORITY REVENUE BONDS
(As of March 1, 2019) 1
MPEA Expansion Project Sports Facilities Authority Railsplitter Tobacco Settlement
Authority Total Authority Revenue Bonds Fiscal Year Principal Interest2 Principal Interest2 Principal Interest Total Principal Total Interest Total Debt Service
2019 $ 17,868,492 $ 178,826,753 $ 7,157,123 $ 35,927,690 $ 93,620,000 $ 48,924,706 $ 118,645,615 $ 263,679,149 $ 382,324,764 2020 21,690,604 189,341,028 7,587,434 38,091,378 98,565,000 44,209,588 127,843,039 271,641,994 399,485,033 2021 72,251,202 173,622,093 7,998,976 40,426,337 103,900,000 39,034,925 184,150,178 253,083,354 437,233,533 2022 47,719,997 212,154,381 8,400,360 42,943,453 109,655,000 33,548,250 165,775,357 288,646,083 454,421,440 2023 102,434,013 172,435,022 8,799,047 45,649,516 112,260,000 28,065,500 223,493,060 246,150,038 469,643,098 2024 39,951,513 234,925,174 9,185,634 48,542,929 109,745,000 22,452,500 158,882,147 305,920,603 464,802,750 2025 42,220,150 232,649,615 9,500,244 51,723,069 107,305,000 16,965,250 159,025,394 301,337,933 460,363,328 2026 61,079,129 214,927,058 15,537,481 49,373,582 105,370,000 11,600,000 181,986,610 275,900,640 457,887,250 2027 108,269,225 180,969,326 48,410,000 20,538,313 103,360,000 6,331,500 260,039,225 207,839,138 467,878,363 2028 127,972,687 176,228,000 37,791,552 35,316,261 23,270,000 1,163,500 189,034,239 212,707,761 401,742,000 2029 148,875,321 170,364,404 40,260,210 37,329,053 - - 189,135,531 207,693,456 396,828,988 2030 10,081,635 325,161,090 50,655,825 26,280,413 - - 60,737,459 351,441,503 412,178,963 2031 16,220,954 331,025,896 73,580,000 8,200,500 - - 89,800,954 339,226,396 429,027,350 2032 12,650,997 334,583,856 82,620,000 4,337,550 - - 95,270,997 338,921,406 434,192,403 2033 11,998,844 335,250,633 - - - - 11,998,844 335,250,633 347,249,478 2034 11,432,732 335,804,371 - - - - 11,432,732 335,804,371 347,237,103 2035 10,987,216 336,260,261 - - - - 10,987,216 336,260,261 347,247,478 2036 9,070,302 338,169,633 - - - - 9,070,302 338,169,633 347,239,935 2037 8,706,797 338,537,550 - - - - 8,706,797 338,537,550 347,244,348 2038 8,408,151 338,832,354 - - - - 8,408,151 338,832,354 347,240,505 2039 8,145,844 339,098,975 - - - - 8,145,844 339,098,975 347,244,819 2040 7,974,547 339,266,633 - - - - 7,974,547 339,266,633 347,241,180 2041 20,635,397 326,606,161 - - - - 20,635,397 326,606,161 347,241,558 2042 232,416,135 114,825,988 - - - - 232,416,135 114,825,988 347,242,124 2043 41,557,297 305,683,259 - - - - 41,557,297 305,683,259 347,240,556 2044 39,434,758 307,805,982 - - - - 39,434,758 307,805,982 347,240,740 2045 37,721,831 309,521,652 - - - - 37,721,831 309,521,652 347,243,483 2046 36,133,031 311,107,195 - - - - 36,133,031 311,107,195 347,240,226 2047 83,607,355 263,636,492 - - - - 83,607,355 263,636,492 347,243,846 2048 280,733,248 66,509,823 - - - - 280,733,248 66,509,823 347,243,071 2049 293,154,595 54,084,063 - - - - 293,154,595 54,084,063 347,238,658 2050 268,716,264 78,519,767 - - - - 268,716,264 78,519,767 347,236,030 2051 40,863,854 306,379,293 - - - - 40,863,854 306,379,293 347,243,147 2052 173,573,118 173,667,496 - - - - 173,573,118 173,667,496 347,240,615 2053 154,112,138 193,128,411 - - - - 154,112,138 193,128,411 347,240,548 92054 68,697,913 278,545,595 - - - - 68,697,913 278,545,595 347,243,507 2055 66,383,107 280,861,473 - - - - 66,383,107 280,861,473 347,244,580 2056 69,562,467 277,678,237 - - - - 69,562,467 277,678,237 347,240,703 2057 165,361,670 181,886,955 - - - - 165,361,670 181,886,955 347,248,625Total $2,978,674,530 $9,658,881,946 $407,483,884 $484,680,041 $967,050,000 $252,295,719 $4,353,208,416 $10,395,857,706 $14,749,066,126
Note: Columns may not add due to rounding. 1 Includes all debt service paid or payable during fiscal year 2019. 2, Interest for MPEA Expansion Project Bonds and Sports Facilities Authority Bonds includes accreted principal amount on capital appreciation bonds.

-45-
MORAL OBLIGATION BONDS AND OTHER MORAL OBLIGATION COMMITMENTS Currently, six entities in the State may issue moral obligation bonds. As of June 30, 2018, debt evidenced by moral obligation bonds was currently outstanding in the amount of $16.3 million. The moral obligation pledge generally provides that in the event the authority issuing moral obligation bonds determines that revenue available to such authority will be insufficient for the payment of principal and interest on such bonds during the next State fiscal period, such authority shall certify to the Governor the amount required to pay such principal and interest and any amounts withdrawn from bond reserve funds to pay principal and interest on moral obligation bonds. The Governor must then submit the amounts so certified to the General Assembly. However, the recommendations of the Governor for State appropriations are a matter of executive discretion. Thus, although the Governor is required to submit the certified amounts to the General Assembly, the moral obligation pledge does not constitute a legally enforceable obligation of the Governor to recommend a State appropriation. Moreover, the General Assembly is not statutorily required to make an appropriation for the amount so certified by the authority, nor must the Governor sign any such appropriation bill if passed by the General Assembly. Debt evidenced by moral obligation bonds is not debt of the State, and is not secured by any State funds. From time to time, the State has received notices from certain entities which have issued moral obligation bonds that insufficient monies are available for the payment of principal and interest on one or more series of moral obligation bonds or that amounts withdrawn from bond reserve funds to pay principal and interest on moral obligation bonds have not been replenished. The State does not have a legal obligation to pay any such amounts and cannot predict whether appropriations for such amounts will continue to be enacted. No assurance can be given that future requests for State appropriations will not be received by the State or that such requests will not be for material amounts. Further, no assurance can be given that an appropriation would be enacted with respect to such future request. College Illinois, the State’s Prepaid Tuition Program, is operated by the Illinois Student Assistance Commission (“ISAC”). College Illinois is supported by a moral obligation commitment of the State. As of its June 30, 2018 valuation, College Illinois had an unfunded liability of approximately $308 million. No additional prepaid tuition contracts were sold during Fiscal Years 2017 and 2018 as program enrollment is currently on hold pending discussions with policy makers to help define and advance proposals that will address the College Illinois unfunded liability and strengthen the program. Should no additional prepaid tuition contracts be sold under the College Illinois program, actuaries estimate that the State will need to provide additional funds to College Illinois to support its obligations. These additional funds would need to be provided starting in 2026 and concluding in 2053 and, depending upon which actuarial assumptions are used, could total in excess of $501 million. For additional information, see ISAC’s College Illinois website in APPENDIX F—WEBSITE INDEX. ISAC, in conjunction with the General Assembly and the Governor, are in discussions as to how to address the projected shortfall. Legislation has been introduced into the General Assembly which would establish an irrevocable, continuing appropriation of the amounts necessary for the State to pay the contractual obligations of the College Illinois program, and would pledge the full faith and credit of the State to such payments. No assurances as to what solution, the timing of the solution or the ultimate cost to the State, if any, can be made at this time.

-46-
AGRICULTURAL LOAN GUARANTEE PROGRAM The Illinois Finance Authority (the “IFA”) is authorized to issue up to $385 million in guarantees for loans by financial institutions to agriculture and agribusiness borrowers. The IFA currently maintains two reserve funds from which lump-sum payments may be made in the event of a default on any of these loans. As of June 30, 2018, the available balances in the reserve funds held by the IFA were $10.3 million and $8.1 million, respectively. These reserve funds are backed by a continuing appropriation of the State’s General Funds. As of June 30, 2018, the IFA loan programs secured $3.9 million in Illinois Agricultural Loans and $2.6 million in Illinois Farmer & Agribusiness Loans. In total, 85% of these two Loan Programs, or $5.5 million, is guaranteed by the State. To date, there has not been a required transfer from the State’s General Funds for default lump-sum payments under this loan program.
PENSION AND OTHER POST EMPLOYMENT BENEFITS Information relating to the State’s funding for the retirement systems and other post-employment benefits, including the method of determining employer contributions, the actuarial methods and assumptions used by the retirement systems to calculate the actuarial value of assets and the actuarial accrued liability, actuarial assumptions, the net pension obligation of each retirement system, the history of contributions to the retirement systems, the funded status and projections of funded status, a discussion of the 2010 and 2017 legislation modifying the pension structure as well as a description of the post employment health, dental, vision and life insurance benefits for certain State retirees and the funding and annual cost of such benefits is described in APPENDIX E—PENSION AND OTHER POST EMPLOYMENT BENEFITS.
LITIGATION There is no litigation pending, or to the knowledge of the State threatened, in any way questioning the title of the State officials to their respective offices or any proceedings of the State incident to the authorization and issuance of the Bonds, or in any way concerning the validity or enforceability of the Bonds, or the manner of payment thereof or the appropriation for the payment thereof. The following describes certain lawsuits. BEEKS V. BRADLEY and MEMISOVSKI V. MARAM Beeks v. Bradley, 92-cv-4204 (N.D. Ill.), and Memisovski v. Maram, 92-cv-1982 (N.D. Ill.), are long-standing, consolidated consent decrees from 1993 and 2005, respectively, that require the State to continue furnishing Medicaid benefits during a budget impasse. In the context of the State’s 2015-2017 budget impasse, the district court entered several orders directing payments to be made to Medicaid providers. Those orders eventually culminated in a June 30, 2017, order, in which the district court ordered the State to make payments of $586 million per month (50% of which consist of federal Medicaid matching funds) against vouchers submitted after that date by Medicaid service providers, plus a total of $2 billion over the course of Fiscal Year 2018 (July 1, 2017 through June 30, 2018) to pay down unpaid vouchers submitted for Medicaid services. As of January 31, 2018, the Comptroller’s Office had paid all of the approximately $4.19 billion of vouchers awaiting payment as of June 30, 2017, plus additional amounts above the $586 million for Fiscal Year 2018 vouchers each month required under the June 30 Orders. Between July 1 and January 31, 2018, the Comptroller’s Office paid more than $13.7 billion of vouchers for Medicaid-

-47-
funded services. On January 24, 2018, the court entered an agreed order terminating the State’s obligations under the June 30, 2017 order, except for a reporting requirement running through June 30, 2018. ILLINOIS (DEP’T OF CENTRAL MGMT. SERVS.) V. ILRB On December 13, 2016, the Illinois Labor Board declared that the State and the American Federation of State, County and Municipal Employees, Council 31 (AFSCME), were at impasse in their negotiations for a 2015-19 collective bargaining agreement. AFSCME is the State’s largest public sector union, representing approximately 35,600 State employees. On December 22, 2016, the Illinois First District Court of Appeals issued a temporary stay preventing the State from implementing its last, best, and final offer pending AFSCME’s appeal from the Illinois Labor Board’s impasse declaration. On January 31, 2017, the Illinois Supreme Court determined that the appeal should be heard in the Illinois Fourth District Court of Appeals and consolidated several proceedings in that court. On March 1, 2017, the Fourth District made the First District’s December 22, 2016 stay order permanent pending review of the merits. Opening briefs in the Fourth District were filed October 10, 2017, and oral arguments were held on June 13, 2018. The Appellate Court, on October 23, 2018, declared its belief that the record did not adequately support a finding of impasse. It vacated the ILRB’s order and remanded the case to the ILRB for proceedings consistent with its opinion and to permit the ILRB an opportunity to either explain why it departed from previous practice or to apply the Taft factors in accordance with its precedent. The parties are currently in discussions that could lead to a settlement agreement. N.B. V. NORWOOD N.B. v. Norwood, 11-6866 (N.D. Ill.), filed in 2011 and amended in 2012, is a certified class action lawsuit alleging that the Illinois Department of Healthcare and Family Services (HFS) is not in compliance with the Early and Periodic Screening Diagnostic and Treatment requirement of the federal Medicaid statute for treatment of children's behavioral and mental health disorders. Additionally, the class alleges that HFS is violating the federal Americans with Disabilities Act and the Rehabilitation Act by failing to provide services for these children in most community-integrated settings. In February 2014, the Court certified a class of “[a]ll Medicaid eligible children under the age of 21 in the State of Illinois: (1) who have been diagnosed with a mental health or behavioral disorder; and (2) for whom a licensed practitioner of the healing arts has recommended intensive home and community-based services to correct or ameliorate their disorders.” The parties conducted settlement discussions, ultimately resulting in a consent decree that the district court preliminarily approved on October 27, 2017. The district court conducted a fairness hearing on December 19, 2017 and granted final approval to the consent decree on January 16, 2018. The consent decree requires HFS to develop, through an implementation plan, a behavioral health delivery model to provide a continuum of Medicaid-authorized mental and behavioral health services, and to achieve certain 5-year and 7-year benchmarks for implementation of the required services. LIGAS V. NORWOOD
Ligas v. Norwood is a class action lawsuit. On August 18, 2017, HFS and DHS were found not to be in substantial compliance with the Consent Decree entered on June 15, 2011. The agencies were supposed to establish a plan for compliance, but the Court, on June 6, 2018, determined that the

-48-
proposed plan does not adequately address shortcomings previously identified. They failed to provide resources of sufficient quality, scope, and variety. They were supposed to (1) expand the pool of candidates for service providers, (2) increase funding for wages, (3) enhance monitoring of service delivery, and (4) make programmatic adjustments and enhancements. Efforts were found inadequate to address wages, staffing and retention. The Court found Defendants’ plan for wages inadequate, and declared that for the defendants to truly comply and provide adequate services, the parties and stakeholders will have to come together to formulate a long-term plan to address these issues. The Court directed the parties to continue to develop a plan to address the issues causing the reduction in services and to bring the State into substantial compliance. The parties are finalizing the “reasonable pace” plan required to move people off of the wait list for waiver services and working on other things to achieve compliance, such as rate increases for direct service providers and compliance monitoring of a sample of Ligas class members to ensure appropriate services are being provided. RASHO V. WALKER Rasho v. Walker is a class-action lawsuit, filed in 2007, that challenges the constitutional adequacy of the mental health services provided statewide to offenders with a particular emphasis on those who are seriously mentally ill. The Department of Corrections (“DOC”) currently has 11,374 offenders on the mental health caseload and 4,481 of those offenders are seriously mentally ill. In March 2012, Dr. Fred Cohen generated a report which identified various deficiencies in DOC’s mental health services. Cohen surmised that DOC was deliberately indifferent to the needs of the seriously mentally ill population. As a result of that report, DOC began engaging in settlement negotiations with the Plaintiffs to change many DOC practices including, but not limited to, filling mental health staffing vacancies, procuring inpatient care for the most seriously mentally ill offenders, and coming up with a comprehensive plan to improve the DOC mental health care system. As part of the comprehensive plan previously agreed to by the then court-appointed monitor and Plaintiffs, DOC established four levels of care: inpatient, residential, outpatient and crisis, and began making plans to provide care at each level, which included capital projects. Offenders in need of inpatient level of care need to be housed in a forensic hospital-like setting. A temporary facility is now open and operational at Elgin Mental Health Center and a new permanent facility is under construction at Joliet. Offenders in need of residential treatment are now being housed in residential treatment units (“RTUs”) located at Dixon, Logan, IYC Joliet and Pontiac. In addition to serving the residential treatment population, IYC Joliet will also serve the sub-acute and behavioral management populations. Establishment of these levels of care and housing units has required extensive hiring and construction which is nearly complete at each of the four residential treatment facilities. On May 13, 2016, the judge approved the parties’ settlement agreement. Under the settlement agreement, the parties agreed that the Court would retain jurisdiction for a three-year period after a budget is approved to allow DOC time to (1) fully develop the four levels of care, (2) complete necessary capital projects, (3) hire and train requisite staff and, ultimately, (4) revamp DOC’s entire mental health system and allow plaintiffs to reopen litigation in the event of non-compliance with the terms of the agreement. The State continues to work on implementation of the Rasho settlement. In October 2017, plaintiffs filed a motion to enforce the settlement agreement. The court held hearings and entered an order dated May 25, 2018, finding DOC out of compliance with the settlement agreement, citing inadequate staffing as a chief concern, and imposing obligations

-49-
on DOC pursuant to a preliminary injunction to take certain actions during the 90 days following the date of the order. Actions taken during the 90 days did not satisfy the court, and a permanent injunction was entered in November 2018. DOC continues efforts to come into compliance with the settlement agreement as it appeals the permanent injunction. GRANT V. DIMAS Grant v. Dimas, Case No. 2017-CH-12080, is a proposed class action in the Cook County Circuit Court by personal assistants employed by the Illinois Department of Human Services (“DHS”) and the Service Employees International Union, Healthcare Illinois and Indiana (“SEIU”). The suit seeks a wage increase under P.A. 100-0023, which stated that the hourly wage paid to personal assistants and individual maintenance home health workers shall be increased by $0.48 per hour beginning August 5, 2017. The State filed a motion to dismiss on the basis that the rate of pay is required by statute to be collectively bargained, and the court denied the motion. The State filed a motion to reconsider, and the plaintiffs filed a motion for summary judgment. The court ruled on both motions on March 13, 2018, denying the motion to reconsider and granting the motion for summary judgment. The court ordered the State to implement the $.48-cent wage increase for all personal assistants and individual maintenance home health workers for all hours worked beginning August 5, 2017 by March 21, 2018. The State sought and was granted a stay of the court’s order so that it could appeal the ruling. The State is making payments into an escrow account held by the State Comptroller pending a final decision. To date, nearly $28 million has been set aside. The State estimates that the amounts being set aside will be sufficient to pay any wage increases that may be required pursuant to a final order. On February 22, 2019, the Appellate Court affirmed the lower court’s ruling. On March 14, 2019, the parties entered into a settlement agreement pursuant to which the State agreed to implement the $0.48 wage increase going forward beginning with the payroll period starting April 1, 2019. The State also agreed to pay the $0.48 wage increase retroactively back to August 1, 2017. Back payments are to be made before the end of the Fiscal Year 2019 lapse period. BROCK V. DIMAS Brock v. Dimas, Case No. 2018 CH 11835, is a proposed class action in which the plaintiffs are child and day care home providers (and members of SEIU) receiving compensation for their services pursuant to the Child Care Assistance Program (“CCAP”) administered by the Department of Human Services (“DHS”). Plaintiffs are seeking a writ of mandamus to compel DHS to implement a 4.26% increase in the rates they are paid in accordance with a provision of P.A. 100-587, which stated that within 30 days after its effective date DHS was to increase increase the previously established rates by 4.26%. July 4, 2018, was 30 days after the effective date. DHS increased the rates for providers not covered by the SEIU collective bargaining agreement. However, it did not increase the rate for those who were covered by collective bargaining, because the statute states that the terms and conditions of their employment are supposed to be collectively bargained, and the rates are part of the terms and conditions in the collective bargaining agreement. Should the State be unsuccessful in this matter, the cost of the 4.26% increase for Fiscal Year 2019 could be approximately $20 million. On March 14, 2019, the parties entered into a settlement agreement pursuant to which the State agreed to implement the 4.26% rate increase going forward beginning with payments for the period starting April 1, 2019. The State also agreed to pay the

-50-
4.26% rate increase retroactively back to July 1, 2018. Back payments are to be made before the end of the Fiscal Year 2019 lapse period. CAHOKIA UNIT SCHOOL DISTRICT NO. 187 V. GOV. RAUNER AND THE STATE OF ILLINOIS Cahokia Unit School District No. 187 v. Gov. Rauner and the State of Illinois, Case No. 2017-CH-301, is a suit filed in St. Clair County by 22 school districts to compel the State of Illinois to increase funding for public schools. Plaintiffs filed an Amended Complaint on May 21, 2018 claiming as a matter of constitutional right that the State’s funding of K-12 public education should increase by an additional $7.2 billion and seeking a judgment requiring the State to pay nearly double the existing appropriation. The State filed a motion to dismiss on July 20, 2018. The Court dismissed the complaint with prejudice. The plaintiffs have filed a notice of appeal. KOSS V. NORWOOD AND DIMAS Koss v. Norwood and Dimas, Case No. 17-cv-2762, is a proposed class action in the Northern District of Illinois that was filed in April 2017 on behalf of individuals seeking eligibility for and payment of long-term care Medicaid benefits in nursing facilities and supportive living facilities. The plaintiffs allege that the Department of Health and Family Services and Department of Human Services fail to make a timely determination of eligibility and to pay those benefits, and they seek an order requiring the departments to make timely determinations and payments, including by presuming eligibility for benefits. On March 29, 2018, Judge Gottschall certified a class and issued a preliminary injunction requiring the state defendants to determine the eligibility of class members for long-term care Medicaid benefits by June 28, 2018 and, beginning June 28, 2018, to pay the long-term care services and other Medicaid benefits to class members while their applications remain pending beyond the Medicaid Act’s deadlines for eligibility determination. The state defendants filed a motion for reconsideration of that order on April 26, 2018, the plaintiffs filed a brief in opposition on June 5, 2018, and the defendants filed a reply on June 13, 2018. The parties await a ruling on the motion for reconsideration regarding the preliminary injunction, but the District Court is proceeding with the case and discovery requests have recently been made by Plaintiffs.
RATINGS Moody’s has assigned a rating of “Baa3” (Stable Outlook) to the Bonds, S&P has assigned a rating of “BBB-” (Stable Outlook) to the Bonds and Fitch has assigned a rating of “BBB” (Negative Outlook) to the Bonds. See “CERTAIN INVESTMENT CONSIDERATIONS—Investment Considerations Relating to the Financial Condition of the State—Ratings”. These ratings reflect the view of such organizations, and an explanation of the significance of such ratings may be obtained only from the respective rating agency. As part of the State’s application for the ratings, certain information and materials, some of which are not contained in this Official Statement, have been supplied to the rating agencies. The ratings are neither a “market” rating nor a recommendation to buy, sell or hold the Bonds and the ratings and the Bonds should be evaluated independently.

-51-
The State will provide appropriate periodic credit information necessary for maintaining ratings on the Bonds to the rating agencies. Except as may be required by the Undertakings as defined below under the heading “CONTINUING DISCLOSURE,” the State undertakes no responsibility either to bring to the attention of the owners of the Bonds any proposed change in or withdrawal of such ratings or to oppose any such revision or withdrawal. If assigned, there is no assurance that any such ratings will be maintained for any given period of time or that they will not be lowered or withdrawn entirely. Any revision or withdrawal of any such ratings could have a material adverse effect on the availability of a market for the Bonds or the prices at which the Bonds may be resold.
PURCHASE The Purchasers set forth on the cover of this Official Statement (together, the “Purchasers”) have agreed, subject to the approval of certain legal matters by counsel and to certain other conditions, to purchase (i) the Series 2019A Bonds at a price of $298,870,000.00, representing the par amount of the Series 2019A Bonds less a net original issue discount of $404,400.00, less the Purchasers’ discount of $725,600.00 and (ii) the Series 2019B Bonds at a price of $152,393,883.40, representing the par amount of the Series 2019B Bonds plus an original issue premium of $12,266,788.60, less the Purchasers’ discount of $152,905.20. The Purchasers have agreed to purchase all of the Bonds if any of the Bonds are purchased. The Purchasers have agreed to make a bona fide public offering of the Bonds at not in excess of the public offering prices set forth on the inside front cover page of this Official Statement.
TAX MATTERS THE SERIES 2019A BONDS Interest on the Series 2019A Bonds is includible in gross income of the owners thereof for federal income tax purposes. Ownership of the Series 2019A Bonds may result in other federal income tax consequences to certain taxpayers. Holders of the Series 2019A Bonds should consult their tax advisors with respect to the inclusion of interest on the Bonds in gross income for federal income tax purposes and any collateral tax consequences. THE SERIES 2019B BONDS Federal tax law contains a number of requirements and restrictions which apply to the Series 2019B Bonds, including investment restrictions, periodic payments of arbitrage profits to the United States, requirements regarding the proper use of bond proceeds and the facilities financed therewith, and certain other matters. The State has covenanted to comply with all requirements that must be satisfied in order for the interest on the Series 2019B Bonds to be excludable from gross income for federal income tax purposes. Failure to comply with certain of such covenants could cause interest on the Series 2019B Bonds to become includible in gross income for federal income tax purposes retroactively to the date of issuance of the Series 2019B Bonds. Subject to the State’s compliance with the above-referenced covenants, under present law, in the separate opinions of Co-Bond Counsel to be delivered upon the issuance of the Series 2019B Bonds, interest on the Series 2019B Bonds, is excludable from the gross income of the owners thereof for federal income tax purposes and is not included as an item of tax preference in computing the federal alternative minimum tax for individuals.

-52-
In rendering their opinions, Co-Bond Counsel will rely upon certifications of the State with respect to certain material facts within the State’s knowledge. Co-Bond Counsels’ opinions represent their legal judgment based upon their review of the law and the facts that they deem relevant to render such opinions and are not guarantees of a result. Ownership of the Series 2019B Bonds may result in collateral federal income tax consequences to certain taxpayers, including, without limitation, corporations subject to the branch profits tax, financial institutions, certain insurance companies, certain S corporations, individual recipients of Social Security or Railroad Retirement benefits and taxpayers who may be deemed to have incurred (or continued) indebtedness to purchase or carry tax-exempt obligations. Prospective purchasers of the Series 2019B Bonds should consult their tax advisors as to applicability of any such collateral consequences. The issue price for original issue discount (as further discussed below) and market discount purposes (the “OID Issue Price”) for each maturity of the Series 2019B Bonds is the price at which a substantial amount of such maturity of the Series 2019B Bonds is first sold to the public (excluding bond houses and brokers and similar persons or organizations acting in the capacity of underwriters, placement agents or wholesalers). The OID Issue Price of a maturity of the Series 2019B Bonds may be different from the price set forth, or the price corresponding to the yield set forth, on the inside cover page hereof. If the OID Issue Price of a maturity of the Series 2019B Bonds is less than the principal amount payable at maturity, the difference between the OID Issue Price of each such maturity, if any, of the Series 2019B Bonds (the “OID Series 2019B Bonds”) and the principal amount payable at maturity is original issue discount. For an investor who purchases an OID Series 2019B Bond in the initial public offering at the OID Issue Price for such maturity and who holds such OID Series 2019B Bond to its stated maturity, subject to the condition that the State complies with the covenants discussed above, (a) the full amount of original issue discount with respect to such OID Series 2019B Bond constitutes interest which is excludable from the gross income of the owner thereof for federal income tax purposes; (b) such owner will not realize taxable capital gain or market discount upon payment of such OID Series 2019B Bond at its stated maturity; (c) such original issue discount is not included as an item of tax preference in computing the alternative minimum tax for individuals under the Internal Revenue Code of 1986, as amended (the “Code”); and (d) the accretion of original issue discount in each year may result in certain collateral federal income tax consequences in each year even though a corresponding cash payment may not be received until a later year. Based upon the stated position of the Illinois Department of Revenue under Illinois income tax law, accreted original issue discount on such OID Series 2019B Bonds is subject to taxation as it accretes, even though there may not be a corresponding cash payment until a later year. Owners of OID Series 2019B Bonds should consult their own tax advisors with respect to the state and local tax consequences of original issue discount on such OID Series 2019B Bonds. Owners of Series 2019B Bonds who dispose of Series 2019B Bonds prior to the stated maturity (whether by sale, redemption or otherwise), purchase Series 2019B Bonds in the initial public offering, but at a price different from the OID Issue Price or purchase Series 2019B Bonds subsequent to the initial public offering should consult their own tax advisors. If a Series 2019B Bond is purchased at any time for a price that is less than the Series 2019B Bond’s stated redemption price at maturity or, in the case of an OID Series 2019B Bond, its OID

-53-
Issue Price plus accreted original issue discount (the “Revised Issue Price”), the purchaser will be treated as having purchased a Series 2019B Bond with market discount subject to the market discount rules of the Code (unless a statutory de minimis rule applies). Accrued market discount is treated as taxable ordinary income and is recognized when a Series 2019B Bond is disposed of (to the extent such accrued discount does not exceed gain realized) or, at the purchaser’s election, as it accrues. Such treatment would apply to any purchaser who purchases an OID Series 2019B Bond for a price that is less than its Revised Issue Price. The applicability of the market discount rules may adversely affect the liquidity or secondary market price of such Series 2019B Bond. Persons purchasing the Series 2019B Bonds should consult their own tax advisors regarding the potential implications of market discount with respect to the Series 2019B Bonds. An investor may purchase a Series 2019B Bond at a price in excess of its stated principal amount. Such excess is characterized for federal income tax purposes as “bond premium” and must be amortized by an investor on a constant yield basis over the remaining term of the Series 2019B Bond in a manner that takes into account potential call dates and call prices. An investor cannot deduct amortized bond premium relating to a tax-exempt bond. The amortized bond premium is treated as a reduction in the tax-exempt interest received. As bond premium is amortized, it reduces the investor’s basis in the Series 2019B Bond. Investors who purchase a Series 2019B Bond at a premium should consult their own tax advisors regarding the amortization of bond premium and its effect on the Series 2019B Bond’s basis for purposes of computing gain or loss in connection with the sale, exchange, redemption or early retirement of the Series 2019B Bond. There are or may be pending in the Congress of the United States legislative proposals, including some that carry retroactive effective dates, that, if enacted, could alter or amend the federal tax matters referred to above or affect the market value of the Series 2019B Bonds. Prospective purchasers of the Series 2019B Bonds should consult their own tax advisors regarding any pending or proposed federal tax legislation. Co-Bond Counsel express no opinion regarding any pending or proposed federal tax legislation. The Service has an ongoing program of auditing tax-exempt obligations to determine whether, in the view of the Service, interest on such tax-exempt obligations is includible in the gross income of the owners thereof for federal income tax purposes. It cannot be predicted whether or not the Service will commence an audit of the Series 2019B Bonds. If an audit is commenced, under current procedures the Service may treat the State as a taxpayer and the Series 2019B Bondholders may have no right to participate in such procedure. The commencement of an audit could adversely affect the market value and liquidity of the Series 2019B Bonds until the audit is concluded, regardless of the ultimate outcome. Payments of interest on, and proceeds of the sale, redemption or maturity of, tax-exempt obligations, including the Series 2019B Bonds, are in certain cases required to be reported to the Service. Additionally, backup withholding may apply to any such payments to any Series 2019B Bond owner who fails to provide an accurate Form W-9 Request for Taxpayer Identification Number and Certification, or a substantially identical form, or to any Series 2019B Bond owner who is notified by the Service of a failure to report any interest or dividends required to be shown on federal income tax returns. The reporting and backup withholding requirements do not affect the excludability of such interest from gross income for federal tax purposes.
-54-
STATE TAX TREATMENT Interest on the Bonds is not exempt from present State of Illinois income taxes. Ownership of the Bonds may result in other state and local tax consequences to certain taxpayers. Bond Counsel expresses no opinion regarding any such collateral consequences arising with respect to the Bonds. Prospective purchasers of the Bonds should consult their tax advisors regarding the applicability of any such state and local taxes.
CONTINUING DISCLOSURE The State will enter into a Continuing Disclosure Undertaking (the “Undertaking”) for the benefit of the beneficial owners of the Bonds to send certain information annually and to provide notice of certain events to the MSRB pursuant to the requirements of Section (b)(5) of Rule 15c2-12 (the “Rule”) adopted by the SEC under the Securities Exchange Act of 1934, as amended. The proposed form of the Undertaking is included as APPENDIX D to this Official Statement. In the previous five years, there have been certain failures by the State in connection with its continuing disclosure filings. • For Fiscal Year 2014, the annual financial information for certain series of the State’s debt
obligations omitted tables titled “Revenues and Cash Expenditures-General Revenue Fund,” “Cash Expenditures by Category and Function-General Revenue Fund,” “General Obligation Bonds,” “Cash Expenditures by Category–Road Fund,” “General Funds Appropriations” and “Illinois School Enrollment.” Failure to File Annual Financial Information notices were filed on EMMA in December, 2015, noting the correction.
There have also been numerous rating actions reported by the rating agencies affecting the municipal bond insurance companies, some of which had insured obligations previously issued by the State. In some instances, event notices were not timely filed in respect of these ratings changes. The State has filed its “Annual Financial Information” within the time periods prescribed in its various continuing disclosure undertakings. During the last five years, the State’s Comprehensive Annual Financial Report (“Audited Financial Statements”) has not been available when the Annual Financial Information has been filed, but has been filed within 30 days after its availability to GOMB. A failure by the State to comply with the Undertaking will not constitute a default under the Bond Sale Order, adopted by the Governor and the Director authorizing the issuance of the Bonds (the “Bond Sale Order”), and beneficial owners of the Bonds are limited to the remedies described in the Undertaking. A failure by the State to comply with the Undertaking must be reported in accordance with the Rule and must be considered by any broker, dealer or municipal securities dealer before recommending the purchase or sale of the Bonds in the secondary market. Consequently, such a failure may adversely affect the transferability and liquidity of the Bonds and their market price. On May 14, 2012, the State adopted disclosure policies and procedures. Such policies and procedures were amended on March 15, 2019, to incorporate procedures related to the additional reportable events added by amendments to the Rule, which will be included in the Undertaking executed by the State in connection with the issuance of the Bonds.

-55-
CERTAIN LEGAL MATTERS Certain legal matters incident to the authorization, issuance and sale of the Bonds are subject to the approving legal opinions of Co-Bond Counsel, i.e., Chapman and Cutler LLP, Chicago, Illinois (“Chapman”), and Charity & Associates, P.C., Chicago, Illinois, each of which act as Co-Bond Counsel to the State in connection with the issuance of the Bonds. Co-Bond Counsel make no representation as to the suitability of the Bonds for investment by any investor. The opinions of Co-Bond Counsel will accompany the delivery of the Bonds and be in substantially the form included in this Official Statement as APPENDIX B. Chapman has also been retained by the State to serve as Disclosure Counsel to the State with respect to the Bonds. Although as Disclosure Counsel to the State, Chapman has assisted the State with certain disclosure matters, Chapman has not undertaken to independently verify the accuracy, completeness or fairness of this Official Statement or other offering material related to the Bonds and does not guarantee the accuracy, completeness or fairness of such information. Chapman’s engagement as Disclosure Counsel was undertaken solely at the request and for the benefit of the State, to assist it in discharging its responsibility with respect to this Official Statement, and not for the benefit of any other person (including the Purchasers and any person purchasing Bonds from the Purchasers), and did not include any obligation to establish or confirm factual matters, forecasts, projections, estimates or any other financial or economic information in connection therewith. The fees of Co-Bond Counsel and Disclosure Counsel for services rendered with respect to the sale of the Bonds are contingent upon the issuance and delivery of the Bonds.
AUDITED FINANCIAL STATEMENTS The State Auditor General has performed an audit of the basic financial statements that accompany each CAFR in accordance with generally accepted auditing standards in the United States of America and Government Auditing Standards issued by the Comptroller General of the United States. His unqualified opinion appears at the beginning of the financial section of each CAFR. The State Auditor General has not been requested to update the information contained in the financial statements in the Fiscal Year 2017 CAFR which has been filed with EMMA and is referred to in “STATE FINANCIAL INFORMATION.” A portion of the TBFR not included in this Official Statement was audited by an independent accounting firm in accordance with accounting practices prescribed or permitted by the State of Illinois State Comptroller Act. Tables 3 and 4, which appear under “STATE FINANCIAL INFORMATION,” Table A-4, which appears in APPENDIX A—CERTAIN INFORMATION REGARDING THE STATE OF ILLINOIS, and Table G-1, which appears in APPENDIX G—ACCOUNTING PRACTICES USED IN STATE FINANCIAL INFORMATION, are not part of the financial statements in the TBFR that were the subject of such audit.
MUNICIPAL ADVISOR Columbia Capital Management, LLC and Sycamore Advisors LLC are serving as Municipal Advisors to the State in connection with the issuance of the Bonds. The Municipal Advisors (the “Advisors”) are independent advisory firms and are not engaged in the business of underwriting, trading or distributing municipal securities or other public securities. Under the terms of its engagement, the Advisors are not obligated to undertake, and have not undertaken, an independent verification of, nor have they assumed responsibility for, the accuracy, completeness or fairness of

-56-
the information contained in this Official Statement. The fees of the Advisors for services rendered with respect to the sale of the Bonds are contingent upon the issuance and delivery of the Bonds.
ADDITIONAL INFORMATION The information contained in this Official Statement is subject to change without notice and no implication may or shall be derived therefrom or from the sale of the Bonds that there has been no change in the affairs of the State or the information contained in this Official Statement since the dates as of which such information is given. Any statements in this Official Statement involving matters of opinion or estimate, whether or not expressly so stated, are intended as such and not as representations of fact. This Official Statement is not to be construed as a contract or agreement between the State and the purchaser of any of the Bonds.

-57-
MISCELLANEOUS The State has authorized the distribution of this Official Statement. This Official Statement has been duly executed and delivered by the Director of GOMB on behalf of the State.
STATE OF ILLINOIS
By: /s/ Alexis Sturm Director, Governor’s Office of Management and
Budget

[THIS PAGE INTENTIONALLY LEFT BLANK]

A-1
APPENDIX A
CERTAIN INFORMATION REGARDING THE STATE OF ILLINOIS PART I: MEASURES OF DEBT BURDEN Tables A-1 through A-3 show various measures of the relative burden of the State’s general obligation debt and debt service.
TABLE A-1 RATIO OF GENERAL OBLIGATION DEBT SERVICE
TO TOTAL GENERAL AND ROAD FUND APPROPRIATIONS FISCAL YEARS 2014-2018
June 30 Fiscal Year End
Fiscal Year
Total Appropriations1
($ In Millions)
Capital ImprovementBonds Debt Service
% of Appropriations
Pension Bonds
Debt Service % of Appropriations
Section 7.6 Bonds Debt Service
% of Appropriations
2014 38,351 3.91% 4.26% 0.00% 2015 37,987 4.60% 4.73% 0.00% 20162 34,304 4.96% 3.95% 0.00% 20172 38,915 4.37% 4.23% 0.00% 2018 41,687 4.07% 3.88% 0.34%
Source: Illinois Office of the Comptroller and the Governor's Office of Management and Budget.
1 Appropriations include the Road Fund and the General Funds. The General Funds include the General Revenue Fund, the Education Assistance Fund, the Common School Fund, the General Revenue-Common School Special Account Fund, the Fund for Advancement of Education, the Commitment to Human Services Fund and the Budget Stabilization Fund. The latter three funds were added to the state definition of General Funds beginning in FY 2018 with ILCS 20/50-40. Appropriations in this table have been restated to include all of the funds currently included in the definition of General Funds.
2 FY2016 and FY2017 Total Appropriations include enacted General Funds (reflecting the new definition of General Funds) appropriations and enacted Road Fund appropriations, continuing appropriations and spending authority established pursuant to court orders or consent decrees from the General Funds.
TABLE A-2
RATIO OF GENERAL OBLIGATION DEBT OUTSTANDING TO ILLINOIS PERSONAL INCOME
FISCAL YEARS 2014-20181
June 30 Fiscal Year End
Fiscal Year
Illinois Personal Income
($ In Billions)
Capital Improvement and
Refunding Bonds % of Personal Income
Pension Bonds2 % of Personal
Income
Section 7.6 Bonds % of Personal
Income
2014 621.8 2.43% 2.22% N/A 2015 651.4 2.17% 1.95% N/A 2016 670.3 2.13% 1.79% N/A 2017 682.5 2.01% 1.61% N/A 2018 708.8 1.98% 1.40% 0.85%
Source: Bureau of Economic Analysis and Governor's Office of Management and Budget. 1 Current data as of December 20, 2018. Debt outstanding as of June 30 each fiscal year. 2 Includes 2003, 2010, and 2011 pension funding bonds. The 2010 pension bonds fully matured in fiscal year 2015.

A-2
TABLE A-3 GENERAL OBLIGATION DEBT PER CAPITA – ILLINOIS
FISCAL YEARS 2014-2018 June 30 Fiscal Year End1
FY2014 FY2015 FY2016 FY2017 FY2018
Population (in Thousands) 12,888 12,875 12,851 12,820 12,787
Capital Improvement and Refunding Bonds $1,171 $1,099 $1,108 $1,069 $1,097
Pension Bonds2 $1,070 $986 $934 $856 $776
Section 7.6 Bonds N/A N/A N/A N/A $469 Source: Bureau of Economic Analysis, U.S. Census Bureau and Governor's Office of Management and Budget. 1 Current data as of December 20, 2018. Debt represented is the amount outstanding on June 30 of each year. 2 Includes 2003, 2010, and 2011 pension funding bonds.

A-3
PART II: HISTORICAL STATE RECEIPTS, APPROPRIATIONS AND DISBURSEMENTS
TABLE A-4 10 YEAR HISTORY OF RECEIPTS, APPROPRIATIONS AND WARRANTS
($ in millions) June 30 Fiscal Year End
Fund Group FY2009 FY2010 FY2011 FY2012 FY2013 FY2014 FY2015 FY2016 FY2017 FY2018
CASH RECEIPTS General Funds .................................. $29,883 $26,424 $29,548 $31,886 $34,332 $34,580 $32,872 $28,752 $27,831 $36,240 Highway Funds ................................ 4,157 4,480 4,403 4,256 4,094 4,225 4,538 4,410 4,452 4,062 Special State Funds .......................... 15,137 19,570 22,145 16,961 19,334 21,574 24,701 23,157 24,233 33,956 Bond Financed Funds ....................... 152 3,489 1,191 2,145 2,038 4,227 0 1,084 1,133 1,302 Debt Service Funds(1) ...................... 117 1,840 572 2,595 734 835 798 835 2,304 960 Federal Trust Funds .......................... 4,483 4,949 5,095 5,274 4,970 5,148 4,856 4,846 4,825 4,581 Revolving Funds .............................. 475 525 545 627 539 618 534 335 617 409 State Trust Funds .............................. 3,360 3,598 4,106 4,335 4,535 4,593 2,614 1,741 1,951 5,037
TOTAL, CASH RECEIPTS ................. $57,764 $64,875 $67,605 $68,079 $70,576 $75,800 $70,913 $65,160 $67,346 $86,547
APPROPRIATIONS General Funds .................................. $30,280 $27,198 $26,079 $29,584 $30,848 $32,146 $31,799 $28,536 $31,783 $36,179 Highway Funds ................................ 9,644 9,219 8,826 8,888 8,284 8,387 8,093 8,070 7,954 8,507 Special State Funds .......................... 19,416 22,566 24,488 23,925 28,679 31,649 33,710 33,550 39,982 36,166 Bond Financed Funds ....................... 3,765 18,750 17,420 15,372 13,948 11,387 9,882 4,346 4,955 4,534 Debt Service Funds(1) ...................... 3,514 5,942 4,617 5,371 3,545 3,600 4,285 3,536 5,237 3,960 Federal Trust Funds .......................... 8,158 10,377 10,429 9,479 8,026 8,160 8,058 8,288 8,752 8,282 Revolving Funds .............................. 802 895 896 946 981 953 905 927 1,468 938 State Trust Funds .............................. 620 743 737 750 857 931 638 604 625 605
TOTAL, APPROPRIATIONS ............... $76,199 $95,690 $93,492 $94,315 $95,168 $97,213 $97,370 $87,857 $100,756 $99,171
WARRANTS ISSUED General Funds .................................. $29,774 $26,301 $25,447 $29,209 $30,293 $31,479 $30,763 $26,750 $29,421 $35,381 Highway Funds ................................ 3,943 4,003 3,686 3,836 3,598 3,626 3,728 4,039 3,748 3,813 Special State Funds .......................... 15,576 16,785 17,474 17,808 21,079 22,512 25,285 22,356 28,298 29,366 Bond Financed Funds ....................... 161 1,328 1,969 2,134 2,655 2,394 2,226 777 1,352 531 Debt Service Funds(1) ...................... 3,432 5,875 4,596 5,187 3,330 3,589 4,050 3,536 5,212 3,960 Federal Trust Funds .......................... 4,278 5,254 5,258 5,090 4,969 5,061 4,781 4,906 4,787 4,597 Revolving Funds .............................. 642 677 655 685 716 704 681 546 733 699 State Trust Funds .............................. 3,224 4,207 4,331 3,924 4,173 4,298 2,257 1,248 1,184 5,181
TOTAL, WARRANTS ISSUED .......... $61,030 $64,430 $63,416 $67,873 $70,813 $73,663 $73,771 $64,158 $74,735 $83,528
Source: Illinois Office of the Comptroller, Traditional Budgetary Financial Report, Fiscal Year 2018; unaudited.
(1) Includes the General Obligation Bond Retirement and Interest Fund.

A-4
TABLE A-5 CASH RECEIPTS AND DISBURSEMENT – GENERAL FUNDS1
FISCAL YEARS 2014-2018 ($ in millions)
June 30 Fiscal Year End FY2014 FY2015 FY2016 FY2017 FY2018 Available Balance, Beginning $430 $349 $942 $967 $1,368Cash Receipts State Revenues
Income Tax $19,806 $18,604 $15,779 $14,993 $19,742 Sales Tax 7,675 8,030 8,063 8,043 7,810Public Utility Tax 1,013 1,006 926 884 896Cigarette Tax 353 353 353 353 344Inheritance Tax 276 333 306 261 358Liquor Gallonage Tax 165 167 169 171 172Insurance Tax & Fees 333 353 398 391 432Corporate Franchise Tax 203 211 207 207 207Investment Income 20 25 25 37 79Intergovernmental Transfers 244 244 244 244 244Other 624 735 574 726 719Total, State Revenues $30,713 $30,061 $27,045 $26,308 $31,003
Federal Revenues Medicaid & Social Services $ 3,903 $ 3,331 $ 2,665 $ 2,483 $ 5,238
Transfers In From Other State Funds2 $ 2,152 $ 2,931 $ 1,581 $ 1,542 $ 4,677
Total Revenues $36,768 $36,323 $31,291 $30,333 $40,918Interfund Borrowing $ 3773 $ 0 $ 0 $ 533
Total Cash Receipts4 $36,768 $36,700 $31,291 $30,333 $41,451Cash Disbursements Expenditures for Appropriations
Operations $ 9,721 $10,643 $ 7,041 $ 8,112 $11,464 Awards and Grants 21,079 21,311 20,394 21,943 23,626 Permanent Improvements 7 7 5 6 6 Refunds 5 0 0 0 5Vouchers Payable Adjustment 1,129 (459) (888) (4,054) 3,721 Prior Year Adjustments (60) (12) (12) (5) (28)
Transfers Out Debt Service Funds5 2,258 2,094 1,979 2,235 2,899Other State Funds2 2,710 2,522 2,746 1,696 874Repayment of Interfund Borrowing 0 0 0 15 128
Total Cash Disbursements $36,848 $36,107 $31,264 $29,933 $42,695Cash Balance, Ending $ 349 $ 942 $ 967 $ 1,368 $ 125
Source: Based on information from the Illinois Office of the Comptroller. May not add due to rounding. Note: This table replaces the General Funds Cash Flow Summary table in previous Disclosures. 1 Prior to Fiscal Year 2018, General Funds included the General Revenue Fund, Common School Fund, General Revenue-Common School Special
Account Fund and the Education Assistance Fund. Starting in Fiscal Year 2018, General Funds also includes Commitment to Human Services Fund, Fund for the Advancement of Education and Budget Stabilization Fund. All Fiscal Years in this table represent the current definition of General Funds. Fiscal Years prior to Fiscal Year 2018 have been restated from previous versions of this table.
2 Excludes transfers to and from the Budget Stabilization Fund. In previous continuing disclosure undertakings the revenues from the sale of river boat gambling licenses were reported as Transfers In from other state funds, but are now reflected in Other State Revenues.
3 Pursuant to Public Act 099-0523, the $377 million of interfund borrowing in Fiscal Year 2015 is not required to be repaid. However, the State has repaid $15 million.
4 See “State Indebtedness Information” section for additional information. 5 Reflects debt service on 2003, 2010, and 2011 pension funding bonds.

A-5
TABLE A-6 CASH RECEIPTS AND DISBURSEMENTS – ROAD FUND
FISCAL YEARS 2014-2018 ($ in millions)
June 30 Fiscal Year End
FY2014 FY2015 FY2016 FY2017 FY2018 Available Balance, Beginning $ 825 $915 $916 $1,134 $1,213 Cash Receipts
State Revenues
Motor Vehicle & License Fees 769 783 779 803 737 Certificates of Title 81 86 87 86 84 Property Sales (City & County) 91 142 125 91 93 Miscellaneous 62 74 76 143 84 Total, State Revenues $1,003 $1,085 $1,068 $1,123 $ 998
Federal Revenues 1,503 1,721 1,537 1,558 1,276 Transfers In
Motor Fuel Fund 296 289 307 303 305 Other Funds 0 0 0 0 0
Total Cash Receipts $2,803 $3,095 $2,913 $2,984 $2,579 Cash Disbursements Expenditures for Appropriations 2,332 2,478 2,332 2,576 2,562 Transfers Out
Debt Service Funds1 359 347 334 305 349 Other State Funds2 23 271 30 23 258
Total Cash Disbursements $2,713 $3,096 $2,695 $2,904 $3,169
Prior Year Adjustments (1) (3) 0 (1) 0
Cash Balance, Ending $ 915 $916 $1,134 $1,213 $ 624 Source: Illinois Office of the Comptroller. May not add due to rounding. 1 Reflects debt service on GO Bonds. 2 Fiscal Year 2015 includes Fund Reallocation transfers to the General Revenue Fund in the amount of $250 million.

A-6
PART III: ECONOMIC DATA Illinois is a state of diversified economic strength. Based on data from the U.S. Department of Commerce Bureau of Economic Analysis, the Illinois economy is the 5th largest in the United States and, based on information from the International Monetary Fund and the World Bank, the Illinois economy is the 19th largest in the world. Measured by per capita personal income, Illinois ranks third among the ten most populous states and fifteenth among all states. Chicago serves as the transportation center of the Midwest and the headquarters of many of the nation’s major corporations and financial institutions. Table A-7 shows Illinois has a historically higher per capita GDP than the Great Lakes Region and the United States. Table A-8 shows the distribution of Illinois non-agricultural employment by industry sector.
TABLE A-7 PER CAPITA REAL GDP (CHAINED 2009 DOLLARS)
CALENDAR YEARS 2013-2017
2013 2014 2015 2016 2017
United States $52,162 $53,040 $54,157 $54,604 $55,418 Illinois 56,214 56,994 57,596 57,829 58,217 Great Lakes Region 48,859 49,841 50,333 50,776 51,365
Source: Bureau of Economic Analysis, current data as of November 14, 2018.
TABLE A-8 NON-AGRICULTURAL PAYROLL JOBS BY INDUSTRY
CALENDAR YEAR 2018 (Thousands)
% of % of Industry Employment Sector Illinois Total U.S. Total
Financial Activities 402 6.6% 8,569 5.7% Manufacturing 588 9.6% 12,689 8.5% Trade, Transportation and Utilities 1216 19.9% 27,659 18.6% Leisure and Hospitality 617 10.1% 16,348 11.0% Education and Health Services 934 15.3% 23,667 15.9% Mining, Logging, Information and Other Services 357 5.8% 9,405 6.3% Government 826 13.5% 22,449 15.1% Professional and Business Services 951 15.6% 20,999 14.1% Construction 226 3.7% 7,289 4.9%
Total 6,118 100.0% 149,074 100.0% Source: Bureau of Labor Statistics, March 13, 2019. Both State and National data are not seasonally adjusted.

A-7
Illinois ranks prominently among states for agricultural activity and exports. Table A-9 summarizes key agricultural production statistics including rank among all states in 2017.
TABLE A-9 AGRICULTURAL EXPORTS
CALENDAR YEAR 2017 ($ in Millions)
Agricultural Exports U.S. Total Illinois Share % of U.S. Rank
All Commodities $138,152 $8,158 5.9% 3Soybeans 21,452 3,058 14.3% 1Feeds 8,312 1,122 13.5% 2Corn 9,119 1,442 15.8% 2Grain Products 4,408 507 11.5% 2
Source: U.S. Department of Agriculture, Economic Research Service. Calendar year 2017 is the most recent calendar year for which information is available, which data was most recently revised as of October 25, 2018.
U.S. trade policy has generated some concern among certain U.S. producers who fear retaliatory tariffs may increase import costs, decrease commodity prices, disrupt supply lines and possibly cause an economic slowdown. Many argue that the main risk to trade growth is uncertainty regarding the direction of U.S. trade policy. In Illinois, the agricultural and manufacturing industries are the most export-dependent industries. Higher tariffs on imports will likely lead to retaliation by trading partners, which could reduce exports. For example, China has announced it is imposing tariffs on imports of U.S. soybeans and is diverting some of its purchasing to Brazilian production in response to President Trump’s tariffs on steel, aluminum and solar imports. Per capita income in Illinois is greater than the average in both the United States and the Great Lakes Region. Table A-10 presents per capita income comparisons, and Table A-11 shows unemployment rate comparisons for the United States, Illinois and its metropolitan areas.

A-8
TABLE A-10 PER CAPITA PERSONAL INCOME
CALENDAR YEARS 2013-2017
2013 2014 2015 2016 2017 2017 Rank
Illinois $47,160 $49,530 $51,648 $52,473 $54,203 15 United States 44,826 47,025 48,940 49,831 51,640 --
Ten Most Populous States: New York 54,845 56,939 59,170 60,916 64,540 1California 49,173 52,237 55,679 57,497 59,796 2Illinois 47,160 49,530 51,648 52,473 54,203 3Pennsylvania 46,341 48,310 50,240 51,393 53,300 4Florida 40,582 43,146 45,352 46,148 47,684 5Texas 43,821 46,406 46,709 46,146 47,362 6Ohio 41,187 42,826 44,451 45,176 46,732 7Michigan 39,328 41,116 43,471 44,751 46,201 8North Carolina 38,078 39,976 41,814 42,707 44,222 9Georgia 37,404 39,556 41,457 42,621 44,145 10
Great Lakes States: Illinois 47,160 49,530 51,648 52,473 54,203 1 Wisconsin 43,079 44,785 46,571 47,426 48,941 2Ohio 41,187 42,826 44,451 45,176 46,732 3Michigan 39,328 41,116 43,471 44,751 46,201 4Indiana 39,517 40,890 42,312 43,588 45,150 5
Source: U.S. Department of Commerce, Bureau of Economic Analysis. Current data as of September 25, 2018.

A-9
TABLE A-11 UNEMPLOYMENT RATE (%) CALENDAR YEARS 2014-2018
2014 2015 2016 2017 2018
United States 6.2 5.3 4.9 4.4 3.9 Illinois 7.1 6.0 5.8 5.0 4.3 Bloomington-Normal MSA 5.6 4.9 5.1 4.1 3.9 Carbondale-Marion MSA 6.8 5.9 5.7 4.8 4.6 Champaign-Urbana MSA 6.0 5.2 5.1 4.2 4.1 Chicago-Naperville-Elgin MSA 7.1 5.9 5.8 4.9 4.2 Danville MSA 8.4 7.1 7.1 6.3 5.7 Davenport-Moline-Rock Island MSA 6.2 5.6 5.4 4.4 4.0 Decatur MSA 8.5 7.0 6.6 5.5 5.2 Kankakee MSA 7.9 6.7 6.3 5.2 4.8 Peoria MSA 7.1 6.4 6.5 5.4 4.9 Rockford MSA 8.2 6.9 6.5 6.4 5.4 Springfield MSA 5.9 5.2 4.8 4.2 4.0
Source: U.S. Department of Labor, Bureau of Labor Statistics, data as of February 22, 2019. Regional and State data are not seasonally adjusted, National data are seasonally adjusted.

A-10
Illinois is the nation’s sixth most populous state.
TABLE A-12 POPULATION
ILLINOIS AND SELECTED METROPOLITAN STATISTICAL AREAS BY CENSUS YEARS
1990 2000 2010 Illinois 11,430,602 12,419,293 12,830,632 Chicago CMSA (IL Part) 7,410,858 8,272,768 8,586,609 St. Louis MSA (IL Part) 588,995 599,845 633,042 Rockford MSA 283,719 320,204 349,431 Peoria MSA 358,552 366,899 379,186 Springfield MSA 189,550 201,437 210,170 Champaign-Urbana MSA 202,848 210,275 231,891
Source: U.S. Bureau of the Census, Population Division, as of July 9, 2018.
TABLE A-13 ILLINOIS POPULATION BY AGE GROUP
BY CALENDAR YEAR
2017 % of Total Population
Under 18 years 2,897,185 22.6% 18 to 24 years 1,195,103 9.3% 25 to 44 years 3,415,241 26.7% 45 to 64 years 3,349,096 26.2% 65 years and over 1,945,398 15.2% Total 12,802,023 100%
Source: U.S. Bureau of the Census, as of June 2018.

A-11
In 2018, 37 companies on the Fortune 500 list had headquarters located in Illinois. Illinois is among the top four states for number of businesses on the Fortune 500 list: New York: 58; California: 49; Texas: 48; and Illinois: 37. The State’s reauthorization of the EDGE (Economic Development for a Growing Economy) program, which provides tax incentives to encourage companies to locate or expand operations in the State over competing states, will improve the State’s ability to compete for major economic development projects.
TABLE A-14 ILLINOIS-BASED COMPANIES INCLUDED IN THE FORTUNE 500
Rank Revenues Assets Profits
2018 2017 Company (millions
USD)(millions
USD)(millions
USD)IndustryCategory Location
No. ofEmployees
19 17 Walgreens Boots Alliance $118,214 $66,009 $ 4,078 Food and Drug Stores Deerfield, IL 290,000 27 24 Boeing 93,392 92,333 8,197 Aerospace & Defense Chicago, IL 140,800 36 33 State Farm Insurance Cos. 78,331 272,345 2,207 Insurance: Property and
Casualty (Mutual)Bloomington, IL 65,664
48 45 Archer Daniels Midland 60,828 39,963 1,595 Food Production Chicago, IL 31,300 65 74 Caterpillar 45,462 76,962 754 Construction and Farm
MachineryDeerfield, IL 98,400
79 84 Allstate 38,524 112,422 3,189 Insurance: Property and Casualty (Stock)
Northbrook, IL 42,680
81 83 United Continental Holdings 37,736 42,326 2,131 Airlines Chicago, IL 89,800 92 89 Exelon 33,531 116,700 3,770 Utilities: Gas and Electric Chicago, IL 34,621 102 105 Deere 29,738 65,786 2,159 Construction and Farm
MachineryMoline, IL 60,476
110 111 AbbVie 28,216 70,786 5,309 Pharmaceuticals North Chicago, IL 29,000 111 135 Abbott Laboratories 27,390 76,250 477 Medical Products and
EquipmentAbbott Park, IL 99,000
117 109 Mondelez International 25,896 63,109 2,922 Food Consumer Products Deerfield, IL 83,000 121 124 US Foods 24,147 9,037 444 Wholesalers: Food and
GroceryRosemont, IL 25,204
131 112 McDonald's 22,820 33,804 5,192 Food Services Oak Brook, IL 235,000 172 127 Sears Holdings 16,702 7,262 (383) General Merchandisers Hoffman Estates,
IL 89,000
189 199 CDW 15,192 6,957 523 Information Technology Services
Lincolnshire, IL 8,726
204 202 Illinois Tool Works 14,314 16,780 1,687 Industrial Machinery Glenview, IL 50,000 263 277 Discover Financial Services 11,545 100,087 2,099 Commercial Banks Riverwoods, IL 16,500 283 281 Baxter International 10,561 17,111 717 Medical Products and
EquipmentDeerfield, IL 47,000
287 282 W.W. Grainger 10,425 5,804 586 Wholesalers: Diversified Lake Forest, IL 25,050 300 304 LKQ 9,848 9,367 534 Wholesalers: Diversified Chicago, IL 43,000 320 322 Tenneco 9,274 4,842 207 Motor Vehicles & Parts Lake Forest, IL 32,000 321 197 Conagra Brands 9,235 10,096 639 Food Consumer Products Chicago, IL 12,600 342 337 Navistar International 8,570 6,135 30 Construction and Farm
MachineryLisle, IL 11,400
349 338 Univar 8,254 5,733 120 Wholesalers: Diversified Downers Grove, IL
8,600
356 391 Jones Lang LaSalle 7,932 8,015 254 Real Estate Chicago, IL 81,900 357 359 Anixter International 7,927 4,252 109 Wholesalers: Electronics and
Office EquipmentGlenview, IL 8,900
360 392 Dover 7,830 10,658 812 Industrial Machinery Downers Grove, IL
29,000
406 388 R.R. Donnelley & Sons 6,940 3,905 (34) Publishing, Printing Chicago, IL 42,700 436 450 Packaging Corp. of America 6,445 6,198 669 Packaging, Containers Lake Forest, IL 14,600 443 433 Motorola Solutions 6,380 8,208 (155) Network and Other
Communications Equipment
Chicago, IL 15,000
446 427 TreeHouse Foods 6,307 5,779 (286) Food Consumer Products Oak Brook, IL 13,489 450 439 Old Republic International 6,263 19,404 561 Insurance: Property and
Casualty (Stock)Chicago, IL 8,700
454 462 Arthur J. Gallagher 6,160 12,897 463 Diversified Financials Rolling Meadows, IL
26,783
471 524 Ulta Beauty 5,885 2,909 555 Specialty Retailers: Other Bolingbrook, IL 24,200 478 456 Ingredion 5,832 6,080 519 Food Production Westchester, IL 11,000 486 501 Northern Trust 5,716 138,591 1,199 Commercial Banks Chicago, IL 18,100 Source: Fortune Magazine.

A-12
PART IV: TAX REVIEW The State of Illinois levies taxes or fees on several categories of goods, services and revenues. A complete discussion of the history of such taxes and revenues generated can be found in The Illinois Tax Handbook for Legislators, 34th Edition February 2018 published by the Legislative Research Unit. (See APPENDIX F—WEBSITE INDEX.) The discussion below is from the Handbook, updated to summarize changes pursuant to Public Act 100-22. The State’s revenues are derived from several categories of taxes and fees. Historically, individual income taxes, sales taxes and corporate income taxes provide approximately 89% of total State revenues (not including revenues from the federal government and transfers from other State funds). Motor fuel taxes and vehicle registration fees support GO Bonds issued for Road Fund purposes under Section 4(a) of the Bond Act or bonds issued under the authorization of Public Act 98-781 (or GO Bonds issued to refund such GO Bonds). Individual Income Taxes The Individual Income Tax (“IIT”) is imposed on the taxable income of individuals, trusts and estates. Originally enacted in 1969, the IIT rate has been adjusted a number of times. Prior to the enactment of Public Act 100-22, the applicable IIT rate was 3.75% from January 1, 2015 through June 30, 2017. Public Act 100-22 permanently increased the rate to 4.95% for the taxable period beginning July 1, 2017. There is a lengthy list of exemptions that apply to the IIT. The change in the IIT tax rate in Public Act 100-22 is estimated to generate $3.9 billion of additional revenue annually. Net of funds currently being diverted to the Tax Refund Fund (see “Note 1–Income Tax Refund Fund” below), IIT is currently distributed as follows:
• 6.06% goes to the Local Government Distributive Fund beginning August 1, 2017 (reduced by 10% for Fiscal Year 2018 pursuant to Public Act 100-23 and 5% for Fiscal Year 2019 pursuant to Public Act 100-587.).
• 7.3% goes to the Education Assistance Fund.
• 3.3% goes to the Fund for the Advancement of Education.
• 3.3% goes to the Commitment to Human Services Fund.
• 5% of collections from audits goes to the Tax Compliance and Administration Fund.
• The remainder goes to the General Revenue Fund.
Corporate Income Tax The Corporate Income Tax (“CIT”) is imposed on the taxable income of corporations, associations, joint-stock companies and cooperatives. Corporations are also subject to a supplemental income tax for local governments referred to as the Personal Property Tax Replacement Tax (see Note 2 PPRT discussion below). Originally enacted in 1969, the CIT rate has been changed a number of times. Prior to the enactment of Public Act 100-22, the applicable CIT rate was 5.25%. Public Act 100-22 permanently increased the rate to 7.00% for the period beginning July 1, 2017. As with the IIT, various exemptions and deductions apply to the CIT. The change in the CIT tax rate in Public Act 100-22 is estimated to generate $460 million of additional revenue annually.

A-13
Net of the amounts currently diverted to the Income Tax Refund Fund (see discussion under “Note 1–Income Tax Refund Fund” below), the CIT is distributed as follows:
• 6.85% to the Local Government Distributive Fund beginning August 1, 2017 (reduced by 10% for Fiscal Year 2018 pursuant to Public Act 100-23 and 5% for Fiscal Year 2019 pursuant to Public Act 100-587).
• 7.3% goes to the Education Assistance Fund.
• 5% of collections from audits goes to the Tax Compliance and Administration Fund.
• The remainder goes to the General Revenue Fund.
A small portion of the corporate income tax that is imposed on certain estates and trusts is directed to the Fund for the Advancement of Education and the Commitment to Human Services Fund. Sales Tax The Sales Tax (“ST”) is made up of two matching pairs of taxes, the Retailers’ Occupation Tax and Use Tax and the Service Occupation Tax and Service Use Tax. The Retailer’s Occupation Tax is imposed on gross receipts of retailers from sales of tangible personal property in Illinois. The Use Tax is imposed on persons who use tangible personal property in Illinois. The Service Occupation Tax and Service Use Tax are similar to the Retailers’ Occupation and Use Taxes but apply to tangible property received incidental to buying a service. If out-of-state sellers have offices or other facilities in Illinois, the Illinois Department of Revenue can require them to collect these taxes on their sales in Illinois. The collection of these taxes is administered by the Department of Revenue (35 ILCS 105/1 ff (use tax); 120/1 ff (retailers occupation tax); 110/1 ff (service use tax); and 115/1 ff (service occupation tax). Taxes on sales are currently at a rate of 6.25% of the purchase price of applicable goods. The State keeps the part equal to 5% of the purchase price (the “State Share of Sales Tax”), and pays the remaining 1.25% to local governments. The State Share of Sales Tax, is distributed as follows:
• 5.55% to the Build Illinois Fund primarily for Build Illinois bond debt service. • A portion pursuant to statutory formula of the State Share of Sales Tax is deposited
into the Public Transportation Fund from sales in the counties of Cook, DuPage, Kane, Lake, McHenry and Will, reduced by 10% for Fiscal Year 2018 only (pursuant to Public Act 100-23) and by 5% for Fiscal Year 2019 pursuant to Public Act 100-587.
• 3/32 of the State Share of Sales Tax collected in certain downstate counties to the Downstate Public Transportation Fund, reduced by 10% for Fiscal Year 2018 only (pursuant to Public Act 100-23) and by 5% for Fiscal Year 2019 pursuant to Public Act 100-587.
• Less than 1% goes to Other State Funds. • The remainder to the General Funds.
Motor Fuel Taxes The Motor Fuel Taxes (“MFT”) are imposed on gasoline ($0.19/gallon) and special fuels including diesel fuel ($0.215/gallon). Additional amounts are levied for underground storage tanks and other environmental impact fees; these additional levies are deposited into the Underground Storage

A-14
Tank Fund. On an annual basis, $30 million of Motor Fuel Tax revenues are deposited into the Vehicle Inspection Fund for use by the Illinois Environmental Protection Agency. MFT are distributed as follows:
• $0.025/gallon on special fuels to the State Construction Account Fund.
• $47 million for Grade Crossing Protection Fund and the State Boating Act Fund.
• Sufficient amounts for administrative costs of the Illinois Department of Revenue and the Illinois Department of Transportation.
• Of the remainder:
▪ 45.6% to the State Construction Account Fund (37%) and the State Road Fund (63%).
▪ 54.4% to municipalities by population (49.10%), Cook County (16.74%), Other Counties (18.27%) and townships/road districts (15.89%).
Motor Vehicle Fees: Revenue from motor vehicle fees is derived primarily from vehicle registrations, with fees from operators and chauffeurs licenses and vehicle titles representing a smaller portion of the total. Approximately 51 percent of these fees are paid into the Road Fund, 31 percent to the State Construction Account Fund, 14 percent to the Capital Projects Fund, and the rest to other funds of the State. Motor vehicle registration fees are $101 annually, with large truck and trailer registration fees range going as high as $3,191 for an 80,000 pound truck. Note 1: Income Tax Refund Fund The Income Tax Refund Fund is funded by a portion of both the CIT (17.25% of gross CIT receipts for Fiscal Year 2017; 17.5% of gross CIT receipts for Fiscal Year 2018; 15.5% of gross CIT receipts for Fiscal Year 2019) and IIT (11.2% of gross IIT receipts for Fiscal Year 2017; 9.8% of gross IIT receipts for Fiscal Year 2018; 9.7% of gross IIT receipts for Fiscal Year 2019) to fund tax refunds due to tax filers. The rates are set by formula, but the formula can and has frequently been overridden by the General Assembly to set the rates at a particular value. Priority of payment has been to pay IIT refunds first, followed by CIT refunds. If funds are left over in the Income Tax Refund Fund, they are returned to the General Revenue Fund. This resulted in moneys being returned to the General Revenue Fund in Fiscal Year 2018 in the amount of $1.4 million, and $327 million in Fiscal Year 2019. If insufficient funds are available in the Income Tax Refund Fund, CIT refunds are held until sufficient funds become available, which may be in a subsequent fiscal year. The Income Tax Refund Fund had a balance of $405.7 million as of March 1, 2018. As of March 1, 2018, there were no unpaid CIT or IIT refunds. Part of the Income Tax Refund Fund is also used to “true up” payments due to local governments under the Personal Property Replacement Tax (“PPRT”). Should insufficient funds be available in the Income Tax Refund Fund to pay these “true up” payments, they must be paid, by statute, from deposits into the Income Tax Refund Fund in the first quarter of the subsequent fiscal year. Note 2: Personal Property Replacement Taxes The Illinois Constitution of 1970 abolished all ad valorem personal property taxes. In 1979, the General Assembly replaced these taxes on businesses with the PPRT that is earmarked to local governments to replace the ad valorem tax. The tax for corporations is 2.5% of federal taxable

A-15
income. The tax for partnerships, trusts and “S” corporations is 1.5% of federal taxable income. The PPRT is distributed to local governments based on their relative share of the personal property tax collections in 1976 (Cook County) and 1977 (other 101 counties). Local governments in Cook County receive 51.65% of the PPRT, with the balance of 48.35% to the local governments in the other 101 counties.

[THIS PAGE INTENTIONALLY LEFT BLANK]

B-1
APPENDIX B
FORM OF APPROVING OPINION OF CO-BOND COUNSEL
[LETTERHEAD OF RESPECTIVE CO-BOND COUNSEL]
[TO BE DATED CLOSING DATE]
We hereby certify that we have examined a certified copy of the proceedings (the “Proceedings”) of the Governor of the State of Illinois (the “State”) and the Director of the Governor’s Office of Management and Budget of the State authorizing the issue by the State of its fully registered $440,280,000 General Obligation Bonds, Series of April 2019, dated the date hereof, in two separate series: Taxable Series of April 2019A (the “Series of April 2019A Bonds”) in the principal amount of $300,000,000 and Tax-Exempt Refunding Series of April 2019B in the principal amount of $140,280,000 (the “Series of April 2019B Bonds” and, together with the Series of April 2019A Bonds, the “Bonds”), dated the date hereof. The Bonds mature on the dates of the years, in the amounts and bear interest as follows:
SERIES OF APRIL 2019A BONDS
YEAR OF MATURITY (APRIL 1)
PRINCIPAL AMOUNT ($)
RATE OF INTEREST (%)
YEAR OF MATURITY (APRIL 1)
PRINCIPAL AMOUNT ($)
RATE OF INTEREST (%)
2020 12,000,000 3.750 2029 12,000,000 5.400 2021 12,000,000 3.750 2030 12,000,000 5.600 2022 12,000,000 3.750 2031 12,000,000 5.700 2023 12,000,000 4.000 2032 12,000,000 5.800 2024 12,000,000 4.200 2033 12,000,000 5.900 2025 12,000,000 4.500 2034 12,000,000 6.000 2026 12,000,000 4.750 2038 48,000,000 6.000 2027 12,000,000 5.000 2044 72,000,000 6.000 2028 12,000,000 5.200

B-2
SERIES OF APRIL 2019B BONDS
YEAR OF MATURITY
(SEPTEMBER 1) PRINCIPAL
AMOUNT ($) RATE OF
INTEREST (%)
2020 5,000,000 5.000 2021 16,000,000 5.000 2022 16,000,000 5.000 2023 16,000,000 5.000 2024 16,000,000 5.000 2025 23,070,000 5.000 2026 6,000,000 5.125 2027 41,000,000 5.000 2028 1,210,000 5.000
The Series of April 2019A Bonds due on or after April 1, 2030, are subject to redemption prior to maturity at the option of the State in whole, or in part in integral multiples of $5,000, from such maturities as may be selected by the State (less than all of the Series of April 2019A Bonds of a single maturity to be selected by the Bond Registrar), on April 1, 2029, or on any date thereafter, at the redemption price of par plus accrued interest to the redemption date.
The Series of April 2019A Bonds due on April 1, 2038, are also subject to mandatory redemption, in integral multiples of $5,000 selected by the Bond Registrar, at a redemption price of par plus accrued interest to the redemption date, on April 1 of the years and in the principal amounts as follows:
YEAR
PRINCIPAL AMOUNT TO BE REDEEMED
2035 $12,000,000 2036 12,000,000 2037 12,000,000 2038 (maturity) 12,000,000
The Series of April 2019A Bonds due on April 1, 2044, are also subject to mandatory redemption, in integral multiples of $5,000 selected by the Bond Registrar, at a redemption price of par plus accrued interest to the redemption date, on April 1 of the years and in the principal amounts as follows:
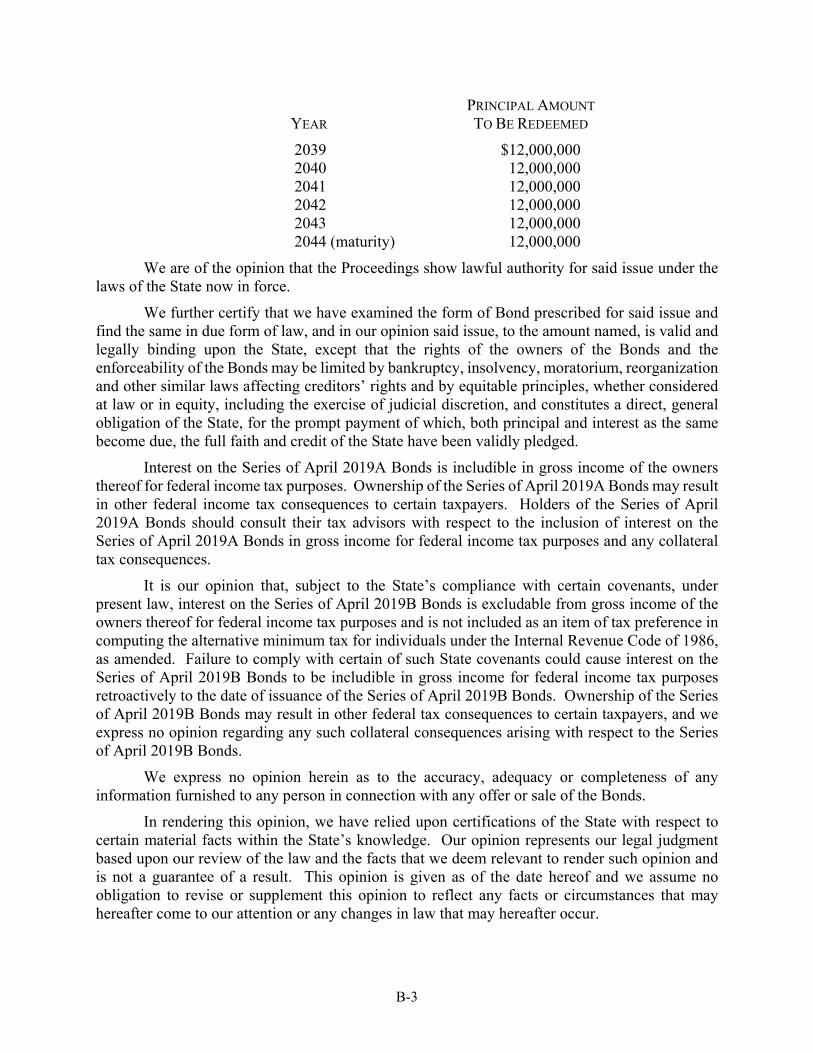
B-3
YEAR
PRINCIPAL AMOUNT TO BE REDEEMED
2039 $12,000,000 2040 12,000,000 2041 12,000,000 2042 12,000,000 2043 12,000,000 2044 (maturity) 12,000,000
We are of the opinion that the Proceedings show lawful authority for said issue under the laws of the State now in force.
We further certify that we have examined the form of Bond prescribed for said issue and find the same in due form of law, and in our opinion said issue, to the amount named, is valid and legally binding upon the State, except that the rights of the owners of the Bonds and the enforceability of the Bonds may be limited by bankruptcy, insolvency, moratorium, reorganization and other similar laws affecting creditors’ rights and by equitable principles, whether considered at law or in equity, including the exercise of judicial discretion, and constitutes a direct, general obligation of the State, for the prompt payment of which, both principal and interest as the same become due, the full faith and credit of the State have been validly pledged.
Interest on the Series of April 2019A Bonds is includible in gross income of the owners thereof for federal income tax purposes. Ownership of the Series of April 2019A Bonds may result in other federal income tax consequences to certain taxpayers. Holders of the Series of April 2019A Bonds should consult their tax advisors with respect to the inclusion of interest on the Series of April 2019A Bonds in gross income for federal income tax purposes and any collateral tax consequences.
It is our opinion that, subject to the State’s compliance with certain covenants, under present law, interest on the Series of April 2019B Bonds is excludable from gross income of the owners thereof for federal income tax purposes and is not included as an item of tax preference in computing the alternative minimum tax for individuals under the Internal Revenue Code of 1986, as amended. Failure to comply with certain of such State covenants could cause interest on the Series of April 2019B Bonds to be includible in gross income for federal income tax purposes retroactively to the date of issuance of the Series of April 2019B Bonds. Ownership of the Series of April 2019B Bonds may result in other federal tax consequences to certain taxpayers, and we express no opinion regarding any such collateral consequences arising with respect to the Series of April 2019B Bonds.
We express no opinion herein as to the accuracy, adequacy or completeness of any information furnished to any person in connection with any offer or sale of the Bonds.
In rendering this opinion, we have relied upon certifications of the State with respect to certain material facts within the State’s knowledge. Our opinion represents our legal judgment based upon our review of the law and the facts that we deem relevant to render such opinion and is not a guarantee of a result. This opinion is given as of the date hereof and we assume no obligation to revise or supplement this opinion to reflect any facts or circumstances that may hereafter come to our attention or any changes in law that may hereafter occur.

[THIS PAGE INTENTIONALLY LEFT BLANK]

C-1
APPENDIX C
GLOBAL BOOK-ENTRY SYSTEM The Bonds will be available only in book-entry form. DTC will act as the initial securities depository for the Bonds. The Bonds will be issued as fully-registered securities registered in the name of Cede & Co. (DTC’s partnership nominee) or such other name as may be requested by an authorized representative of DTC. One or more fully-registered bond certificates will be issued for each series of the Bonds of each maturity, in the aggregate principal amount thereof, and will be deposited with DTC. The State, the Bond Registrar and the Purchasers cannot and do not give any assurances that DTC, direct participants or indirect participants of DTC, will distribute to the beneficial owners of the Bonds (1) payments of principal of or interest or redemption premium on the Bonds, (2) confirmations of their ownership interests in the Bonds or (3) other notices sent to DTC or Cede & Co., its partnership nominee, as the registered owner of the Bonds, or that they will do so on a timely basis, or that DTC, direct participants or indirect participants of DTC, will serve and act in the manner described in this Official Statement. Neither the State nor the Bond Registrar will have any responsibility or obligations to DTC, direct participants or the indirect participants of DTC, or the beneficial owners with respect to (1) the accuracy of any records maintained by DTC or any direct participants or indirect participants of DTC; (2) the payment by DTC or any direct participants or indirect participants of DTC of any amount due to any beneficial owner in respect of the principal amount of or interest or redemption premium on the Bonds; (3) the delivery by DTC or any direct participants or indirect participants of DTC of any notice to any beneficial owner that is required or permitted to be given to owners under the terms of the Bond Sale Order; (4) the selection of the beneficial owners to receive payment in the event of any partial redemption of the Bonds; or (5) any consent given or other action taken by DTC as Owner of the Bonds. Portions of the information below concerning DTC, and DTC’s book-entry system are based on information furnished by DTC to the State. No representation is made herein by the State, the bond registrar, or the Purchasers as to the accuracy, completeness or adequacy of such information, or as to the absence of material adverse, changes in such information subsequent to the date of this official statement. DTC will act as securities depository for the Bonds. The Bonds will be issued as fully-registered bonds registered in the name of Cede & Co. (DTC’s partnership nominee) or such other name as may be requested by an authorized representative of DTC. One fully-registered Bond certificate will be issued for each maturity of each series of the Bonds, in the aggregate principal amount of such maturity, and will be deposited with DTC. DTC, the world’s largest securities depository, is a limited-purpose trust company organized under the New York Banking Law, a “banking organization” within the meaning of the New York Banking Law, a member of the Federal Reserve System, a “clearing corporation” within the meaning of the New York Uniform Commercial Code, and a “clearing agency” registered pursuant to the provisions of Section 17A of the 1934 Act. DTC holds and provides asset servicing for over 3.5 million issues of U.S. and non-U.S. equity issues, corporate and municipal debt issues, and money market instruments (from over 100 countries) that DTC’s participants (“Direct Participants”) deposit with DTC. DTC also facilitates the post-trade settlement among Direct

C-2
Participants of sales and other securities transactions in deposited securities, through electronic computerized book-entry transfers and pledges between Direct Participants’ accounts. This eliminates the need for physical movement of securities certificates. Direct Participants include both U.S. and non-U.S. securities brokers and dealers, banks, trust companies, clearing corporations, and certain other organizations. DTC is a wholly-owned subsidiary of The Depository Trust & Clearing Corporation (“DTCC”). DTCC is the holding company for DTC, National Securities Clearing Corporation and Fixed Income Clearing Corporation, all of which are registered clearing agencies. DTCC is owned by the users of its regulated subsidiaries. Access to the DTC system is also available to others such as both U.S. and non-U.S. securities brokers and dealers, banks, trust companies, and clearing corporations that clear through or maintain a custodial relationship with a Direct Participant, either directly or indirectly (“Indirect Participants”). DTC has a Standard & Poor’s rating of “AA+”. The DTC Rules applicable to its Participants are on file with the Commission. More information about DTC can be found at www.dtcc.com. Purchases of Bonds under the DTC system must be made by or through Direct Participants, which will receive a credit for the Bonds on DTC’s records. The ownership interest of each actual purchaser of each Bond (“Beneficial Owner”) is in turn to be recorded on the Direct and Indirect Participants’ records. Beneficial Owners will not receive written confirmation from DTC of their purchase. Beneficial Owners are, however, expected to receive written confirmations providing details of the transaction, as well as periodic statements of their holdings, from the Direct or Indirect Participant through which the Beneficial Owner entered into the transaction. Transfers of ownership interests in the Bonds are to be accomplished by entries made on the books of Direct and Indirect Participants acting on behalf of Beneficial Owners. Beneficial Owners will not receive certificates representing their ownership interests in Bonds, except in the event that use of the book-entry system for the Bonds is discontinued. To facilitate subsequent transfers, all Bonds deposited by Direct Participants with DTC are registered in the name of DTC’s partnership nominee, Cede & Co., or such other name as may be requested by an authorized representative of DTC. The deposit of Bonds with DTC and their registration in the name of Cede & Co. or such other DTC nominee do not effect any change in beneficial ownership. DTC has no knowledge of the actual Beneficial Owners of the Bonds; DTC’s records reflect only the identity of the Direct Participants to whose accounts such Bonds are credited, which may or may not be the Beneficial Owners. The Direct and Indirect Participants will remain responsible for keeping account of their holdings on behalf of their customers. Conveyance of notices and other communications by DTC to Direct Participants, by Direct Participants to Indirect Participants, and by Direct Participants and Indirect Participants to Beneficial Owners will be governed by arrangements among them, subject to any statutory or regulatory requirements as may be in effect from time to time. Beneficial Owners of Bonds may wish to take certain steps to augment the transmission to them of notices of significant events with respect to the Bonds, such as redemptions, tenders, defaults, and proposed amendments to the Bond documents. For example, Beneficial Owners of Bonds may wish to ascertain that the nominee holding the Bonds for their benefit has agreed to obtain and transmit notices to Beneficial Owners. In the alternative, Beneficial Owners may wish to provide their names and addresses to the Bond Registrar and request that copies of notices be provided directly to them.

C-3
Redemption notices shall be sent to DTC. If less than all of the Bonds within an issue are being redeemed, DTC’s practice is to determine by lot the amount of the interest of each Direct Participant in such issue to be redeemed. Neither DTC nor Cede & Co. (nor any other DTC nominee) will consent or vote with respect to the Bonds unless authorized by a Direct Participant in accordance with DTC’s MMI Procedures. Under its usual procedures, DTC mails an Omnibus Proxy to the State as soon as possible after the record date. The Omnibus Proxy assigns Cede & Co.’s consenting or voting rights to those Direct Participants to whose accounts the Bonds are credited on the record date (identified in a listing attached to the Omnibus Proxy). Redemption proceeds, distributions, and dividend payments on the Bonds will be made to Cede & Co., or such other nominee as may be requested by an authorized representative of DTC. DTC’s practice is to credit Direct Participants’ accounts upon DTC’s receipt of funds and corresponding detail information from the State or Bond Registrar, on payable date in accordance with their respective holdings shown on DTC’s records. Payments by Participants to Beneficial Owners will be governed by standing instructions and customary practices, as is the case with bonds held for the accounts of customers in bearer form or registered in “street name,” and will be the responsibility of such Participant and not of DTC, the Bond Registrar, or the State, subject to any statutory or regulatory requirements as may be in effect from time to time. Payment of redemption proceeds, distributions, and dividend payments to Cede & Co. (or such other nominee as may be requested by an authorized representative of DTC) is the responsibility of the State or the Bond Registrar, disbursement of such payments to Direct Participants will be the responsibility of DTC, and disbursement of such payments to the Beneficial Owners will be the responsibility of Direct and Indirect Participants. DTC may discontinue providing its services as securities depository with respect to the Bonds at any time by giving reasonable notice to the State or the Bond Registrar. Under such circumstances, in the event that a successor securities depository is not obtained, Bond certificates are required to be printed and delivered. The State may decide to discontinue use of the system of book-entry transfers through DTC (or a successor securities depository). In that event, Bond certificates will be printed and delivered to DTC. The information in this section concerning DTC and DTC’s book-entry system has been obtained from sources that the State believes to be reliable, but neither of the State nor the Bond Registrar takes any responsibility for the accuracy thereof.

[THIS PAGE INTENTIONALLY LEFT BLANK]

D-1
APPENDIX D
FORM OF CONTINUING DISCLOSURE UNDERTAKING FOR THE PURPOSE OF PROVIDING
CONTINUING DISCLOSURE INFORMATION UNDER SECTION (B)(5) OF RULE 15C2-12
This Continuing Disclosure Undertaking (this “Agreement”) is executed and delivered by the State of Illinois (the “State”), in connection with the issuance of $300,000,000 General Obligation Bonds, Taxable Series of April 2019A (the “April 2019A Bonds”) and $140,280,000 General Obligation Bonds, Tax-Exempt Refunding Series of April 2019B (the “April 2019B Bonds” and, together with the April 2019A Bonds, the “Bonds”). The Bonds are being issued pursuant to a Bond Sale Order approved by the Governor and the Director of the Governor’s Office of Management and Budget of the State, dated March 15, 2019, as supplemented by separate Sale Confirmation Certificates for the April 2019A Bonds and the April 2019B Bonds, each dated March 26, 2019 confirming the terms of sale of the respective series of the Bonds (collectively, the “Bond Order”).
In consideration of the issuance of the Bonds by the State and the purchase of such Bonds by the beneficial owners thereof, the State covenants and agrees as follows: 1. PURPOSE OF THIS AGREEMENT. This Agreement is executed and delivered by the State as of the date set forth below, for the benefit of the beneficial owners of the Bonds and in order to assist the Participating Underwriters in complying with the requirements of the Rule (as defined below). The State represents that it will be the only obligated person with respect to the Bonds at the time the Bonds are delivered to the Participating Underwriters and that no other person is expected to become so committed at any time after issuance of the Bonds. 2. DEFINITIONS. The terms set forth below shall have the following meanings in this Agreement, unless the context clearly otherwise requires.
Annual Financial Information means the financial information and operating data described in Exhibit I.
Annual Financial Information Disclosure means the dissemination of disclosure concerning Annual Financial Information and the dissemination of the Audited Financial Statements as set forth in Section 4.
Audited Financial Statements means the Comprehensive Annual Financial Report of the State (“CAFR”) as described in Exhibit I.
Commission means the Securities and Exchange Commission. Dissemination Agent means any agent designated as such in writing by the State and which
has filed with the State a written acceptance of such designation, and such agent’s successors and assigns.
EMMA means the MSRB through its Electronic Municipal Market Access system for municipal securities disclosure or through any other electronic format or system prescribed by the MSRB for purposes of the Rule.
Exchange Act means the Securities Exchange Act of 1934, as amended.

D-2
Financial Obligation of the State means a (i) debt obligation, (ii) derivative instrument entered into in connection with, or pledged as security or a source of payment for, an existing or planned debt obligation, or (iii) guarantee of (i) or (ii), provided, that such term does not include municipal securities as to which a final official statement has been provided to the MSRB consistent with the Rule.
MSRB means the Municipal Securities Rulemaking Board. Official Statement means the Final Official Statement, dated March 26, 2019, and relating
to the Bonds. Participating Underwriter means each broker, dealer or municipal securities dealer acting
as an underwriter in the primary offering of the Bonds. Reportable Event means the occurrence of any of the Events with respect to the Bonds set
forth in Exhibit II. Reportable Events Disclosure means dissemination of a notice of a Reportable Event as set
forth in Section 5. Rule means Rule 15c2-12 adopted by the Commission under the Exchange Act, as the same
may be amended from time to time. Undertaking means the obligations of the State pursuant to Sections 4 and 5.
3. CUSIP NUMBERS. The CUSIP Numbers of the Bonds are set forth in Exhibit III. The State will include the CUSIP Numbers in all disclosure materials described in Sections 4 and 5 of this Agreement. 4. ANNUAL FINANCIAL INFORMATION DISCLOSURE. Subject to Section 8 of this Agreement, the State hereby covenants that it will disseminate its Annual Financial Information and its Audited Financial Statements (in the form and by the dates set forth in Exhibit I) to EMMA in such manner and format and accompanied by identifying information as is prescribed by the MSRB or the Commission at the time of delivery of such information and by such time so that such entities receive the information by the dates specified. MSRB Rule G-32 requires all EMMA filings to be in word-searchable PDF format. This requirement extends to all documents to be filed with EMMA, including financial statements and other externally prepared reports.
If any part of the Annual Financial Information can no longer be generated because the operations to which it is related have been materially changed or discontinued, the State will disseminate a statement to such effect as part of its Annual Financial Information for the year in which such event first occurs.
If any amendment or waiver is made to this Agreement, the Annual Financial Information for the year in which such amendment or waiver is made (or in any notice or supplement provided to EMMA) shall contain a narrative description of the reasons for such amendment or waiver and its impact on the type of information being provided. 5. REPORTABLE EVENTS DISCLOSURE. Subject to Section 8 of this Agreement, the State hereby covenants that it will disseminate in a timely manner (not in excess of ten business days after the occurrence of the Reportable Event) Reportable Events Disclosure to EMMA in such manner and format and accompanied by identifying information as is prescribed by the MSRB or the Commission at the time of delivery of such information. References to “material” in Exhibit

D-3
II refer to materiality as it is interpreted under the Exchange Act. MSRB Rule G-32 requires all EMMA filings to be in word-searchable PDF format. This requirement extends to all documents to be filed with EMMA, including financial statements and other externally prepared reports. Notwithstanding the foregoing, notice of optional or unscheduled redemption of any Bonds or defeasance of any Bonds need not be given under this Agreement any earlier than the notice (if any) of such redemption or defeasance is given to the Bondholders pursuant to the Bond Order. 6. CONSEQUENCES OF FAILURE OF THE STATE TO PROVIDE INFORMATION. The State shall give notice in a timely manner to EMMA of any failure to provide Annual Financial Information Disclosure when the same is due hereunder.
In the event of a failure of the State to comply with any provision of this Agreement, the beneficial owner of any Bond may seek mandamus or specific performance by court order, to cause the State to comply with its obligations under this Agreement. A default under this Agreement shall not be deemed a default under the Bond Order, and the sole remedy under this Agreement in the event of any failure of the State to comply with this Agreement shall be an action to compel performance. 7. AMENDMENTS; WAIVER. Notwithstanding any other provision of this Agreement, the State by resolution authorizing such amendment or waiver, may amend this Agreement, and any provision of this Agreement may be waived, if:
(a) (i) The amendment or waiver is made in connection with a change in circumstances that arises from a change in legal requirements, including without limitation, pursuant to a “no-action” letter issued by the Commission, a change in law, or a change in the identity, nature, or status of the State, or type of business conducted; or (ii) This Agreement, as amended, or the provision, as waived, would have complied with the requirements of the Rule at the time of the primary offering, after taking into account any amendments or interpretations of the Rule, as well as any change in circumstances; and (b) The amendment or waiver does not materially impair the interests of the beneficial owners of the Bonds, as determined by parties unaffiliated with the State (such as Co-Bond Counsel). In the event that the Commission or the MSRB or other regulatory authority shall approve
or require Annual Financial Information Disclosure or Reportable Events Disclosure to be made to a central post office, governmental agency or similar entity other than EMMA or in lieu of EMMA, the State shall, if required, make such dissemination to such central post office, governmental agency or similar entity without the necessity of amending this Agreement. 8. TERMINATION OF UNDERTAKING. The Undertaking of the State shall be terminated hereunder if the State shall no longer have any legal liability for any obligation on or relating to repayment of the Bonds under the Bond Order. The State shall give notice to EMMA in a timely manner if this Section is applicable. 9. DISSEMINATION AGENT. The State may, from time to time, appoint or engage a Dissemination Agent to assist it in carrying out its obligations under this Agreement, and may discharge any such Dissemination Agent, with or without appointing a successor Dissemination Agent.

D-4
10. ADDITIONAL INFORMATION. Nothing in this Agreement shall be deemed to prevent the State from disseminating any other information, using the means of dissemination set forth in this Agreement or any other means of communication, or including any other information in any Annual Financial Information Disclosure or notice of occurrence of a Reportable Event, in addition to that which is required by this Agreement. If the State chooses to include any information from any document or notice of occurrence of a Reportable Event in addition to that which is specifically required by this Agreement, the State shall have no obligation under this Agreement to update such information or include it in any future disclosure or notice of occurrence of a Reportable Event. 11. BENEFICIARIES. This Agreement has been executed in order to assist the Participating Underwriters in complying with the Rule; however, this Agreement shall inure solely to the benefit of the State, the Dissemination Agent, if any, and the beneficial owners of the Bonds, and shall create no rights in any other person or entity. 12. RECORDKEEPING. The State shall maintain records of all Annual Financial Information Disclosure and Reportable Events Disclosure, including the content of such disclosure, the names of the entities with whom such disclosure was filed and the date of filing such disclosure. 13. ASSIGNMENT. The State shall not transfer its obligations under the Bond Order unless the transferee agrees to assume all obligations of the State under this Agreement or to execute an Undertaking under the Rule. 14. GOVERNING LAW. This Agreement shall be governed by the laws of the State.
STATE OF ILLINOIS
Signed By: ______________________________ Director, Governor’s Office of
Management and Budget Name: Alexis Sturm
Address: 100 W. Randolph, 15-100 Date: April 9, 2019 Chicago, Illinois 60601

EXHIBIT I D-5
EXHIBIT I ANNUAL FINANCIAL INFORMATION AND TIMING AND
AUDITED FINANCIAL STATEMENTS Annual Financial Information: financial information and operating data including
information of the type contained in the Official Statement as follows (i) in Tables 1 and 2 under the heading “SECURITY,” (ii) in Tables 3, 4, 6 and 7 under the heading “STATE FINANCIAL INFORMATION”, (iii) in Table A-1 in APPENDIX A—CERTAIN INFORMATION REGARDING THE STATE OF ILLINOIS, (iv) in Tables E-5, E-6 and E-18 in APPENDIX E—PENSION AND OTHER POST EMPLOYMENT BENEFITS, and (v) in Tables G-1 and G-2 in APPENDIX G—ACCOUNTING PRACTICES USED IN STATE FINANCIAL INFORMATION.
All or a portion of the Annual Financial Information and the Audited Financial Statements as set forth below may be included by reference to other documents which have been submitted to EMMA or filed with the Commission. If the information included by reference is contained in a Final Official Statement, the Final Official Statement must be available on EMMA; the Final Official Statement need not be available from the Commission. The State shall clearly identify each such item of information included by reference.
Annual Financial Information exclusive of Audited Financial Statements will be submitted to EMMA by 330 days after the last day of the State’s fiscal year (currently June 30).
Audited Financial Statements are created and published by the Office of the Illinois Comptroller in the form of the State’s Comprehensive Annual Financial Report (“CAFR”). Once available to the Governor’s Office of Management and Budget, the CAFR will be submitted to EMMA within 30 days. The CAFR will be prepared in conformity with generally accepted accounting principles applicable to state governments as prescribed by the Governmental Accounting Standards Board.
If any change is made to the Annual Financial Information as permitted by Section 4 of the Agreement, the State will disseminate a notice of such change as required by Section 4.

EXHIBIT II D-6
EXHIBIT II EVENTS WITH RESPECT TO THE BONDS
FOR WHICH REPORTABLE EVENTS DISCLOSURE IS REQUIRED 1. Principal and interest payment delinquencies 2. Non-payment related defaults, if material 3. Unscheduled draws on debt service reserves reflecting financial difficulties 4. Unscheduled draws on credit enhancements reflecting financial difficulties 5. Substitution of credit or liquidity providers, or their failure to perform 6. Adverse tax opinions, the issuance by the Internal Revenue Service of proposed or final
determinations of taxability, Notices of Proposed Issue (IRS Form 5701-TEB) or other material notices or determinations with respect to the tax status of the security, or other material events affecting the tax status of the security
7. Modifications to the rights of security holders, if material 8. Bond calls, if material, and tender offers 9. Defeasances 10. Release, substitution or sale of property securing repayment of the securities, if material 11. Rating changes 12. Bankruptcy, insolvency, receivership or similar event of the State∗ 13. The consummation of a merger, consolidation, or acquisition involving the State or the sale
of all or substantially all of the assets of the State, other than in the ordinary course of business, the entry into a definitive agreement to undertake such an action or the termination of a definitive agreement relating to any such actions, other than pursuant to its terms, if material
14. Appointment of a successor or additional trustee or the change of name of a trustee, if material
15. Incurrence of a Financial Obligation, if material, or agreement to covenants, events of default, remedies, priority rights, or other similar terms of a financial obligation of the State, any of which affect security holders, if material
16. Default, event of acceleration, termination event, modification of terms, or other similar events under the terms of a Financial Obligation, any of which reflect financial difficulties.
∗ This event is considered to occur when any of the following occur: the appointment of a receiver, fiscal agent or similar officer for the
State in a proceeding under the U.S. Bankruptcy Code or in any other proceeding under state or federal law in which a court or governmental authority has assumed jurisdiction over substantially all of the assets or business of the State, or if such jurisdiction has been assumed by leaving the existing governing body and officials or officers in possession but subject to the supervision and orders of a court or governmental authority, or the entry of an order confirming a plan of reorganization, arrangement or liquidation by a court or governmental authority having supervision or jurisdiction over substantially all of the assets or business of the State.

EXHIBIT III D-7
EXHIBIT III CUSIP NUMBERS
APRIL 2019A BONDS
YEAR OF MATURITY
CUSIP NUMBER (452152)
2020 3K5 2021 3L3 2022 3M1 2023 3N9 2024 3P4 2025 3Q2 2026 3R0 2027 3S8 2028 3T6 2029 3U3 2030 3V1 2031 3W9 2032 3X7 2033 3Y5 2034 3Z2 2038 4D0 2044 4K4
APRIL 2019B BONDS
YEAR OF MATURITY
CUSIP NUMBER (452152)
2020 4L2 2021 4M0 2022 4N8 2023 4P3 2024 4Q1 2025 4R9 2026 4S7 2027 4T5 2028 4U2

[THIS PAGE INTENTIONALLY LEFT BLANK]

APPENDIX E
PENSION AND OTHER POST EMPLOYMENT BENEFITS

[THIS PAGE INTENTIONALLY LEFT BLANK]
E-1
APPENDIX E
PENSION AND OTHER POST EMPLOYMENT BENEFITS
GENERAL
The State provides funding for the Retirement Systems, which provide benefits upon retirement, death or disability to employees and beneficiaries. The Retirement Systems are, in order from largest to smallest membership: (i) the Teachers’ Retirement System of the State of Illinois (“TRS”); (ii) the State Universities Retirement System of Illinois (“SURS”); (iii) the State Employees’ Retirement System of Illinois (“SERS”); (iv) the Judges Retirement System of Illinois (“JRS”); and (v) the General Assembly Retirement System, State of Illinois (“GARS”) (each a “Retirement System” and collectively, the “Retirement Systems”).
To fund the benefits to be paid by a defined-benefit pension plan, both employees and employers make contributions to the plan’s assets. Generally, employees contribute a fixed percentage of their annual salary, and employers contribute the additional amounts necessary, when combined with the projected investment earnings on plan assets, to pay the benefits under and the expenses of the pension plan. The necessary employer contributions to the Retirement Systems are calculated and recommended annually by an independent actuary based on State law requirements and certified by the Board of each Retirement System. See “—DETERMINATION OF EMPLOYER CONTRIBUTIONS.” Information regarding the benefits provided by each Retirement System is available at the website for such system. See APPENDIX F—“WEBSITE INDEX.”
For SERS, the State provides the majority of employer contributions for State employees combined with contributions from trust, federal and certain state grant funds. For GARS and JRS, the State provides the sole employer contribution to the Retirement Systems. For TRS, the State’s contributions are combined with contributions from federal funds and the individual school districts (which employ the majority of TRS members), special districts and State agencies employing TRS members. For SURS, State contributions, combined with trust and federal funds and contributions from employers for employees paid from certain State grants and non-State funds, serve as the employer contribution. Public Act 100-0023 (“Public Act 100-23”), which became effective July 6, 2017, provides that TRS and SURS employers will contribute additional amounts to such Retirement Systems in the future. See “—2017 LEGISLATION MODIFYING PENSION STRUCTURE” herein.
Section 5 of Article XIII of the Illinois Constitution provides that “[m]embership in any pension or retirement system of the State, any unit of local government or school district, or any agency or instrumentality thereof, shall be an enforceable contractual relationship, the benefits of which shall not be diminished or impaired” (the “Pension Protection Clause”). The benefits available under the Retirement Systems accrue throughout the time a member is employed by an employer participating in one of the Retirement Systems. Although the benefits accrue during employment, certain age and service requirements must be achieved for retirement annuities, survivor annuities or death benefits to be paid to the employee or the employee’s survivors and beneficiaries, if any, respectively.
State contributions to the Retirement Systems are made following appropriation by the General Assembly. The Board of each Retirement System is required, on or before November 1 of each year, to submit a proposed certification to the State Actuary of the amount necessary to pay the Required Annual Statutory Contribution (as defined below) for inclusion in the Governor’s budget for the following fiscal year. On or before November 1 of each year, the Retirement Systems are required to prepare preliminary actuarial valuation reports. By January 1 of each year, the State Actuary is required to issue a report on such preliminary actuarial valuation reports, providing a review of the actuarial assumptions used in the proposed certification by the Retirement Systems and recommend any changes for consideration. See “—

E-2
RECENT REPORTS REGARDING THE RETIREMENT SYSTEMS—State Actuary’s Fiscal Year 2018 Report.” The Board of each Retirement System must consider all recommendations of the State Actuary prior to providing a final certification to the State of the Required Annual Statutory Contribution on or before January 15 of each year, beginning January 15, 2013. This Official Statement reflects the most current, final reports of the Retirement Systems and Auditor General. Final audits of the Retirement Systems may be found at the Auditor General’s website. The final Actuarial Valuations (as defined herein) for Fiscal Year 2018 may be found at each Retirement System’s website. See APPENDIX F—WEBSITE INDEX.
In the event that the General Assembly fails to appropriate the amount certified by the Retirement Systems, the Pension Code (40 ILCS 5/ et seq.) and the State Pension Funds Continuing Appropriation Act (40 ILCS 15/ et seq.) require payments to be made by the Comptroller and the Treasurer to the Retirement Systems in amounts sufficient to meet the requirements of the Statutory Funding Plan (as defined herein). See “—DETERMINATION OF EMPLOYER CONTRIBUTIONS—The Actuarial Valuation” below. Despite the continuing appropriation, the possibility still exists that the Retirement Systems will not receive the required contribution when due because there could be insufficient funds available in the State’s General Funds. If such funds are not available, the State could fail to meet its payment obligation or be forced to make such payment from another source.
The Retirement Systems submit monthly payment requests to the Comptroller, but the Comptroller is not required to make monthly payments upon receipt of the requests. During Fiscal Year 2018, some delays in the monthly payments occurred. The annual payments for Fiscal Year 2018 were paid in full by the end of the Fiscal Year 2018 lapse period. Delays have also occurred in making monthly payments during Fiscal Year 2019. The State expects that any delayed payments for Fiscal Year 2019 will be made by the end of the Fiscal Year 2019 lapse period. If the full amount of Required Annual Statutory Contributions (as defined herein) is not paid in a timely manner, the Retirement Systems may be required to sell more assets than planned to pay benefits as they become due. Asset sales would reduce the amount of assets invested by the Retirement Systems and, as such, reduce the amount of investment income earned by the Retirement Systems in the future. For a description of the instances in which the Retirement Systems have been funded at less than the Actuarially Required Contribution (as defined herein) level, and the effect of a sale of the Retirement Systems’ assets to pay benefits, see “—HISTORY OF CONTRIBUTIONS TO THE RETIREMENT SYSTEMS.”
SOURCE INFORMATION With regard to the following, except “Excluded Information” defined below, the information contained in this APPENDIX E relies on materials produced by the Retirement Systems, their independent accountants and their independent actuaries (the “Source Information”). The information in this APPENDIX E is presented on the basis of the Source Information. The State has not independently verified the Source Information and makes no representations nor expresses any opinion as to the accuracy of the Source Information. “Excluded Information” means information contained under the following sub-captions below: “—2010 LEGISLATION MODIFYING PENSION STRUCTURE,” “—2013 LEGISLATION MODIFYING PENSION STRUCTURE,” “—2017 LEGISLATION MODIFYING PENSION STRUCTURE,” “—RECENT REPORTS REGARDING THE RETIREMENT SYSTEMS,” “—SEC ORDER,” and “—PENSION DISCLOSURE POLICIES AND PROCEDURES.”
Furthermore, where tables in this disclosure present aggregate information regarding the Retirement Systems, specifically in Tables E-5 through E-15, such combined information results solely from the arithmetic calculation of numbers compiled from the Source Information.
The State is obligated to make contributions to the Retirement Systems as set forth in the Pension Code. See “—DETERMINATION OF EMPLOYER CONTRIBUTION” herein. In addition, the Retirement Systems’ members make contributions to the Retirement Systems from their salaries. For more information on the amount of contributions made by the State and Retirement System members in each of Fiscal Years 2014 through 2018, see Tables E-6 through E-10.

E-3
The Actuarial Valuations of the Retirement Systems and the comprehensive annual financial reports (each a “CAFR”) for the fiscal year ending June 30, 2018 are available on the respective websites of the Retirement Systems, provided, however, that the contents of such websites are not incorporated herein by such reference.
BACKGROUND INFORMATION REGARDING THE RETIREMENT SYSTEMS
As described above, the State provides funding for the five Retirement Systems. The following is a description of each Retirement System. Membership information and member contribution information for each Retirement System is presented at the end of this section in Table E-1.
The Teachers’ Retirement System, TRS, is a cost-sharing, multiple-employer, public employee defined-benefit pension plan that provides coverage to teachers employed by public school districts in the State (excluding teachers employed by Chicago Public Schools). TRS is governed by a 13-member Board of Trustees, consisting of the State Superintendent of Education, six trustees appointed by the Governor with the advice and consent of the Senate, four trustees elected by contributing TRS members, and two trustees elected by TRS annuitants. Two appointed trustee positions are currently vacant. All trustees except for the State Superintendent of Education serve four-year staggered terms.
Although most of TRS’s covered employees are not employees of the State, approximately 95% of the employer funding for TRS is paid by the State. TRS receives contributions from 851 local school districts, 127 special districts and 12 other State agencies. To date, the contributions made by individual school districts, special districts and State agencies have been minimal. However, Public Act 100-23 requires certain additional contributions by such school districts. See “—2017 LEGISLATION MODIFYING PENSION STRUCTURE” herein.
The State Universities Retirement System, SURS, is a cost-sharing, multiple-employer, public employee defined-benefit pension plan. SURS provides coverage to faculty and staff of State universities, community colleges and related agencies. SURS is governed by an 11-member Board of Trustees, consisting of the Chairperson of the Illinois Board of Higher Education, four trustees appointed by the Governor with the advice and consent of the Senate, four trustees elected by contributing SURS members and two trustees elected by SURS annuitants. All trustees except for the Chairperson of the Illinois Board of Higher Education serve six-year staggered terms.
SURS draws contributions from employees of nine universities, 39 community college districts and 13 other affiliated agencies. Public Act 100-23 will require the universities, community colleges and other affiliated agencies participating in SURS to contribute to SURS. See “—2017 LEGISLATION MODIFYING PENSION STRUCTURE” herein.
SURS also provides a public employee defined contribution plan, termed the “Self-Managed Plan.” In a defined contribution plan, the employee and the employer contribute specified amounts to the pension plan. These contributions, plus the investment earnings on the money in each employee’s account, represent the employee’s benefits under the plan. As opposed to defined-benefit plans which provide a predetermined level of benefits to the employee, the benefit in a defined contribution plan is not predetermined. The benefit is based on the individual account balance (consisting of contributions and investment returns thereon) available at retirement or termination. Members contribute 8.0% of their gross earnings and the State contributes 7.6% of payroll to provide employer contributions (of this amount, up to 1.0% is used to fund disability benefits).
The State Employees’ Retirement System, SERS, is a single-employer, public employee defined-benefit pension plan. SERS provides benefits for most State employees not eligible for another State-sponsored retirement plan, as well as for certain employees appointed by the Governor and requiring confirmation by the Senate that elect to become members of SERS. SERS is governed by a 13-member Board of Trustees, consisting of the Comptroller, six trustees appointed by the Governor with the advice and consent of the Senate, four trustees elected by the SERS members, and two trustees elected by the SERS

E-4
retirees. One appointed trustee position is currently vacant. All trustees except for the Comptroller serve five-year staggered terms.
Certain members of SERS are eligible for federal Social Security benefits. As of June 30, 2017, of active employees, 58,492 are coordinated with Social Security. All other active employees are not coordinated with Social Security.
The Judges’ Retirement System, JRS, is a single-employer, public employee defined-benefit pension plan that covers judges, associate judges and, under certain conditions, the administrative director of the State courts. Participation by judges is mandatory unless a judge makes an election not to participate within 30 days of receipt of notice of the option not to participate. JRS is governed by a five-person Board of Trustees, consisting of the Treasurer, the Chief Justice of the Supreme Court, and three participating judges who are appointed by the Supreme Court. The three participating judges serve three-year terms.
The General Assembly Retirement System, GARS, is a single-employer, public employee defined-benefit pension plan that covers members of the General Assembly, State Constitutional Officers and, under certain circumstances, the Clerk and Assistant Clerk of the House and the Secretary and Assistant Secretary of the Senate. GARS is governed by a seven-member Board of Trustees, consisting of the President of the Senate (or his designee), two members of the Senate appointed by the President of the Senate; three members of the House of Representatives appointed by the Speaker of the House; and one person elected from the member annuitants under rules prescribed by the Board of Trustees. All appointed trustees serve two-year terms while the elected trustee serves a four-year term.
With the exception of certain SERS members, as discussed above, and a small number of SURS members, members of the Retirement Systems do not participate in Social Security through their employment with an employer participating in a Retirement System.
As of June 30, 2018, the membership in each of the Retirement Systems and the required membership contributions as a percentage of member salary were as follows:

E-5
TABLE E-1 MEMBERSHIP AND MEMBER CONTRIBUTIONS
Retirement System Active Members
Inactive/ Entitled to
Benefits Retirees and Beneficiaries Total
Member Contribution(1)
TRS 160,859 134,010 122,423 417,292 9.0% SURS 62,844 82,115 66,169 211,128 8.0% - 9.5%(2) SURS/SMP (3) 12,106 9,759 739 22,604 8.0% SERS 61,397 3,925 73,179 138,501 4.0% - 12.5%(4) JRS 936 9 1,193 2,138 8.5% or 11%(5) GARS 132 52 417 601 9.5% or 11.5%(6) Total 298,274 229,870 264,120 792,264 ____________________ Source: CAFRs of the Retirement Systems as of June 30, 2018.(1) Represents the percentage of salary a member is required to contribute annually to the respective Retirement System under the
Pension Code. Certain school districts provide for member contributions on behalf of their employees. (2) Most members contribute a total of 8.0% of pensionable pay. Police officers and firefighters contribute a total of 9.5% of pensionable
pay. (3) The SURS/SMP refers to the SURS Self Managed Plan. (4) Members covered by Social Security contribute 4% of their salary if ineligible for an alternative benefits formula and 8.5% of salary
if eligible for such a formula. Members not covered by Social Security contribute 8% of their salary if ineligible for an alternative benefits formula and 12.5% of salary if eligible for such a formula.
(5) Members contribute 11.0% of their salaries, consisting of a retirement annuity (7.5%), an automatic annuity increase (1.0%) and a survivor’s annuity (2.5%). Certain members may elect not to participate in the survivor’s annuity and therefore contribute 8.5% of salary
(6) Members contribute 11.5% of their salaries, consisting of a retirement annuity (8.5%), an automatic annuity increase (1.0%) and a survivor’s annuity (2.0%). Certain members may elect not to participate in the survivor’s annuity and therefore contribute 9.5% of salary
State law regulates the Retirement Systems’ investments. The respective Boards of Trustees of TRS and SURS manage the investments of such Retirement Systems. The Illinois State Board of Investment manages the investments of SERS, JRS and GARS. Additional information on each Retirement System’s investments and investment management may be found on such Retirement System’s website provided in APPENDIX F—“WEBSITE INDEX.”
DETERMINATION OF EMPLOYER CONTRIBUTIONS
Actuaries and the Actuarial Process
Under the Pension Code, the required employer contributions to the Retirement Systems are calculated and recommended by independent actuaries on an annual basis. Each Retirement System’s actuary produces a report, certified by the board of such Retirement System, called the “Actuarial Valuation,” in which the actuary reports in part on the Retirement System’s assets, liabilities, and Required Annual Statutory Contribution for the following fiscal year. The Actuarial Valuation also includes financial reporting information prepared pursuant to applicable GASB pronouncements.
The Pension Code requires each Retirement System to produce an Actuarial Valuation for each fiscal year. Each Retirement System hires an actuary independent of the State to prepare its Actuarial Valuation. The Actuarial Valuations are publicly available and may be obtained from the respective Retirement Systems. See “—SOURCE INFORMATION.”

E-6
The Required Annual Statutory Contribution is computed in accordance with the Pension Code and, more specifically, the Statutory Funding Plan, as hereinafter defined. The Statutory Funding Plan did not conform to the financial reporting standards promulgated by the Governmental Accounting Standards Board (“GASB”) previously in effect (such standards to be hereinafter described and defined as the Prior GASB Standards). The Prior GASB Standards required calculation of an “Actuarially Required Contribution”1 which, as a result of the Statutory Funding Plan, differed from the Required Annual Statutory Contribution. The differences between the requirements of the Prior GASB Standards and the State’s statutory requirements are discussed in “—DETERMINATION OF EMPLOYER CONTRIBUTION–Statutory Funding Plan Not in Accordance with GASB Standards.”
The Actuarial Valuation
The primary purpose of the Actuarial Valuation is to determine the amount the State must contribute to each Retirement System in a given fiscal year to satisfy its current and future obligations to pay benefits to eligible members of the Retirement Systems as provided in the Pension Code (the “Required Annual Statutory Contribution”). Each Actuarial Valuation must be accompanied by a statement from an actuarial firm that, to the best of its knowledge, the Actuarial Valuation is complete and accurate and has been prepared in accordance with generally accepted actuarial principles and practices, with the Actuarial Standards of Practice issued by the Actuarial Standards Board, and with applicable statutes.
To determine the Required Annual Statutory Contribution, the actuary calculates both the “Actuarial Accrued Liability” and the “Actuarial Value of Assets.” To calculate the Actuarial Accrued Liability, the actuary uses a variety of demographic data about the Retirement System’s membership (such as employee age, salary and service credits), the benefit provisions of the Retirement System, and various assumptions (such as estimated salary increases, interest rates, employee turnover, retirement, mortality and disability rates) to estimate future benefit payments, which are then discounted using an assumed investment rate of return to determine the present value of future benefits (the “PV of Future Benefits”). The PV of Future Benefits is an estimate of the value of the benefits to all members as of the date of the Actuarial Valuation, and includes benefits not yet earned, but assumed to be earned, by members of the Retirement System. Beginning in Fiscal Year 2018, any changes in the State’s contributions to the Retirement Systems caused by a change in actuarial assumptions will be recognized in contributions over a five-year period. See “—ACTUARIAL ASSUMPTIONS” below. Using an actuarial cost method, the actuary allocates the PV of Future Benefits to past, current and future service for each member of the Retirement System. The portion of the PV of Future Benefits allocated to past service is referred to as the Actuarial Accrued Liability and the portion of the PV of Future Benefits allocated to current service is referred to as the “Normal Cost.” The Actuarial Value of Assets reflects the value of the investments and other assets held by the Retirement System. Various methods exist for calculating the Actuarial Value of Assets. For a discussion of these methods and assumptions used to calculate the Actuarial Accrued Liability and the Actuarial Value of Assets of the Retirement Systems, see “—ACTUARIAL METHODS” and “—ACTUARIAL ASSUMPTIONS” below.
Any shortfall between the Actuarial Value of Assets and the Actuarial Accrued Liability is referred to as the “Unfunded Actuarial Accrued Liability” or “UAAL.” The UAAL represents the portion of the Actuarial Accrued Liability that is not matched by current plan assets. In addition, the actuary will compute the “Funded Ratio,” which is the result obtained by dividing the Actuarial Value of Assets by 1 The Prior GASB Standards refers to this concept as the Annual Required Contribution. In this Official Statement, this concept is
referred to as the Actuarially Required Contribution and differs from the State’s statutorily defined concept of the Required Annual Statutory Contribution. The Actuarially Required Contribution, under the Prior GASB Standards is the amount required to pay the employer’s normal cost plus the cost to amortize the plan’s UAAL over a period of no more than 30 years. The method of determining the State’s Required Annual Statutory Contribution is put forth in the applicable statutes of the Illinois Pension Code (40 ILCS 5/) for each State Retirement System.
E-7
the Actuarial Accrued Liability. The Funded Ratio and the UAAL are used to measure the financial health of a pension plan. An increasing UAAL or a decreasing Funded Ratio from year to year may signal a deterioration in the financial health of a pension plan because it indicates the incurrence of additional liability without a corresponding increase in assets necessary to pay those additional liabilities. Conversely, a decreasing UAAL or an increasing Funded Ratio may indicate an improvement in the financial health of a pension plan because such a change reflects a closing gap between the liabilities accrued by the pension plan and the assets necessary to pay those liabilities when they become due. A 100% Funded Ratio means existing actuarial assets are sufficient to pay the present value of projected benefits earned as of the valuation date.
The actuaries use the Actuarial Accrued Liability, the Actuarial Value of Assets and the UAAL to compute the Required Annual Statutory Contribution for each Retirement System in accordance with the Pension Code. The Pension Code sets forth the manner of calculating the Required Annual Statutory Contribution under the Statutory Funding Plan. The Statutory Funding Plan requires the State to contribute annually an amount equal to a level percent of payroll necessary to allow each Retirement System to achieve a 90% Funded Ratio by Fiscal Year 2045, subject to any revisions necessitated by actuarial gains or losses, or actuarial assumptions.
In addition, beginning with the fiscal year ended June 30, 2014, the Actuarial Valuation includes the financial reporting information required by the New GASB Standards, as defined and described in the succeeding section hereof.
GASB Financial Reporting Standards
GASB promulgates standards for financial reporting with respect to financial statements prepared by public pension systems and governments sponsoring such pension systems. Although the Retirement Systems’ actuaries utilize these standards in preparing certain aspects of the Actuarial Valuation, such standards do not impact the calculation of the State’s contribution to the Retirement Systems which is determined pursuant to the Statutory Funding Plan.
At present, several GASB standards apply to preparing financial reports with respect to defined benefit pension plans, specifically: GASB Statement No. 67 (Financial Reporting for Pension Plans) (“GASB 67”) which replaced GASB Statement No. 25 (Financial Reporting for Defined Benefit Pension Plans) (“GASB 25”), and GASB Statement No. 68 (Accounting and Financial Reporting for Pensions) (“GASB 68” and, together with GASB 67, the “New GASB Standards”) which replaced GASB Statement No. 27 (Accounting for Pensions by State and Local Government Employers) (“GASB 27” and, together with GASB 25, the “Prior GASB Standards”), beginning with the fiscal year ended June 30, 2015. GASB 25 and GASB 67 establish standards for financial reporting by pension plans and GASB 27 and GASB 68 establish standards for financial reporting by the governments sponsoring such pension plans. GASB 67 and GASB 68, were approved by GASB on June 25, 2012. GASB 67 is applicable to fiscal years beginning after June 15, 2013. GASB 68 is applicable to fiscal years beginning after June 15, 2014. The New GASB Standards have subsequently been modified by GASB Statement No. 71 (Pension Transition for Contributions Made Subsequent to the Measurement Date) and GASB Statement No. 73 (Accounting and Financial Reporting for Pensions and Related Assets).
The system of financial reporting established by the Prior GASB Standards measured the funding of pension plans through the calculation of the Actuarially Required Contribution and a comparison of the contributions actually made by an employer during a given period to such Actuarially Required Contribution for such period. The calculation of the Actuarially Required Contribution pursuant to the Prior GASB Standards differs in several ways from the calculation of contributions under the Statutory Funding Plan. The differences between the Statutory Funding Plan and the Prior GASB Standards are described in “—Statutory Funding Plan Not in Accordance with Prior GASB Standards” below.

E-8
Unlike the Prior GASB Standards, the New GASB Standards do not establish approaches to funding pension plans. Instead, the New GASB Standards provide standards solely for financial reporting and accounting related to pension plans. The New GASB Standards require that the Net Pension Liability (as described below) be disclosed in the notes to the financial statements of the pension system and that a proportionate share of the Net Pension Liability be recognized on the balance sheet of the employer. In addition, the New GASB Standards require an expense (the “Pension Expense”) to be recognized on the income statement. The recognition of the Net Pension Liability and the Pension Expense do not measure the manner in which a pension plan is funded. As such, the New GASB Standards do not conflict with the manner of funding established in the Statutory Funding Plan.
However, certain of the actuarial assumptions and actuarial methods required by the New GASB Standards differ from those used by the Retirement Systems in preparing their Actuarial Valuations. For example, the New GASB Standards require the Retirement Systems to value their assets at the fair market value of such assets on the valuation date, whereas the Pension Code requires the Retirement Systems to use the Asset Smoothing Method (as defined herein) to value their assets for purposes of determining the State’s contribution. See “ACTUARIAL METHODS—Actuarial Value of Assets” herein. In addition, the New GASB Standards require use of the EAN Method (as defined herein) to calculate the liability of each Retirement System, whereas the Pension Code requires the Retirement Systems to use the PUC Method (as defined herein) for such calculations. See “ACTUARIAL METHODS—Actuarial Accrued Liability” herein. Finally, the calculated Discount Rate (as hereinafter defined) used to discount the liabilities of each Retirement System under the New GASB Standards may differ from assumed investment rate of return assumptions separately established by the boards of each of the Retirement Systems. See “ACTUARIAL ASSUMPTIONS—Assumed Investment Rate of Return” herein.
Statutory Funding Plan Not in Accordance with Prior GASB Standards
The method of amortizing the UAAL used by the Statutory Funding Plan does not conform with the provisions of the Prior GASB Standards, particularly GASB 25. The provisions of the Statutory Funding Plan differ from those generally accepted accounting principles formerly required by GASB 25 in two significant respects.
First, the goal of the Statutory Funding Plan is to amortize the portion of the UAAL necessary for the Retirement Systems’ Funded Ratio to reach 90% over a 50-year closed period, commencing in Fiscal Year 1996 and ending in Fiscal Year 2045, whereas GASB 25 allowed amortization of the entire UAAL over a 30-year open or closed amortization period. Second, the Statutory Funding Plan allowed the State to contribute less than the level percent of payroll necessary to reach the desired funding level for the first 15 years of the Statutory Funding Plan (the “ramp-up” period discussed below, which ended at the conclusion of Fiscal Year 2010). In contrast, GASB 25 did not permit a ramp-up to full contributions.
A closed amortization period means that the UAAL is amortized over a fixed number of years such that the UAAL will decrease to a legally defined target (which, for the State, is a 90% Funded Ratio in accordance with the Statutory Funding Plan) upon the passage of the amount of time established as the amortization period (which, for the State, is the number of years between the current period and 2045 in accordance with the Statutory Funding Plan), provided required payments are made. For example, under the Statutory Funding Plan, a 30-year amortization period was used to calculate the Required Annual Statutory Contribution for Fiscal Year 2016, while a 29-year amortization period was used to calculate the Required Annual Statutory Contribution for Fiscal Year 2017. Conversely, an open amortization period has no term limit and is therefore recalculated over the full period (generally 30 years) each time a valuation is performed. Assuming that the time periods are the same at the beginning of an amortization, amortizing through use of a closed period will have the effect of decreasing the UAAL at a greater rate than an open amortization period and, in the case of the State, will allow the State to reach its funding target by Fiscal Year 2045, provided that all required contributions are made. The actual results of both

E-9
an open or closed amortization schedule will be impacted by any changes in actuarial assumptions and/or the performance of the asset portfolio.
These differences between GASB 25 and the Statutory Funding Plan account for the variation between the Required Annual Statutory Contribution and the Actuarially Required Contribution. See “—FUNDED STATUS” below. As a result, the Required Annual Statutory Contribution determined by the Retirement Systems’ actuaries, while in conformity with State law, historically was less than the contribution that would otherwise have been determined in accordance with GASB 25 (the “Actuarially Required Contribution”). The Actuarially Required Contribution calculated pursuant to the Prior GASB Standards consisted of three components: (1) the Normal Cost, (2) an amortized portion of the UAAL sufficient to eliminate the UAAL over a period of time (as described in “—ACTUARIAL METHODS–Actuarial Accrued Liability”), and (3) one year’s interest, calculated at the Assumed Actuarial Rate, on the unfunded pension liability. As discussed above, the Statutory Funding Plan requires the determination of the Required Annual Statutory Contribution by calculation of a level percent of payroll necessary to reach a 90% Funded Ratio by Fiscal Year 2045 and does not require elimination of the entire UAAL.
ACTUARIAL METHODS
The Retirement Systems use the following actuarial methods to calculate the Actuarial Value of Assets and the Actuarial Accrued Liability.
Actuarial Value of Assets
Prior to Fiscal Year 2009, the State valued assets at fair value, recognizing all investment gains and losses as they occurred. The Actuarial Value of Assets is a measure of the value of the assets available in the pension plan to pay benefits. Beginning with Fiscal Year 2009, the State recognizes actuarial investment gains and losses on such assets equally over a five-year period when determining the Actuarial Value of Assets. This method of valuation is called the “Asset Smoothing Method.” Under the Asset Smoothing Method, the State will recognize in the current year 20% of the investment gain or loss incurred in each of the previous five years. State law provides for application of the Asset Smoothing Method prospectively, beginning with Fiscal Year 2009. The Asset Smoothing Method, which is an approved method for determining the Actuarial Value of Assets under the Prior GASB Standards but is not an approved method under the New GASB Standards (which require calculation of the Actuarial Value of Assets at fair market value), is intended to mitigate against extreme fluctuations in the Actuarial Value of Assets, the UAAL, the Funded Ratio, and the Required Annual Statutory Contribution that may otherwise occur as a result of market volatility. Because asset smoothing recognizes each year’s gains and losses over a five-year period, the current Actuarial Value of Assets does not reflect the fair value of such assets at the time of measurement. As a result, the Actuarial Value of Assets as determined under the Asset Smoothing Method most likely will differ from the value of such assets pursuant to a valuation method that immediately recognizes investment gains and losses annually.
Actuarial Accrued Liability
As described above, the actuary for a Retirement System uses an actuarial cost method in calculating the Actuarial Accrued Liability and the Normal Cost. While actuarial cost methods differ, all are based on the concept that the funding of benefits should occur as benefits are earned by active members of a Retirement System. Different actuarial cost methods will produce different contribution patterns, but such actuarial cost methods will not change the actual cost of the benefits.
The Pension Code requires that the Actuarial Accrued Liability of the Retirement Systems be calculated pursuant to the projected unit credit actuarial cost method (the “PUC Method”), which was an approved actuarial cost method under the Prior GASB Standards. The Prior GASB Standards also authorized the use of the entry age normal actuarial cost method (the “EAN Method”) instead of the PUC Method. The EAN Method is the actuarial cost method required by the New GASB Standards.

E-10
The PUC Method allocates the PV of Future Benefits based on the service credits of each member of a Retirement System. In contrast, under the EAN Method, the Normal Cost rate for each member is developed as the level percent of payroll that, if applied to the member’s pay each year and contributed over the member’s expected career, would fully fund the member’s PV of Future Benefits. The EAN Method is designed to produce a Normal Cost that is stable in amounts that increase at the same rate as the employer’s payroll, whereas the PUC Method results in a Normal Cost that tends to increase at a greater rate than the employer’s payroll.
Considered independently of other factors, use of the EAN Method results in higher contribution rates associated with the earlier years of employment for active employees, when compared to the PUC Method. This allows a Retirement System to accumulate greater investment returns throughout the careers of such employees and results in lower aggregate employer contributions in the long-term. In contrast, use of the PUC Method tends to result in lower contribution rates in the earlier years of employment for active employees and, therefore, a slower accumulation of assets and rising, rather than level, contribution rates when compared to the EAN Method. Such differences between the PUC Method and the EAN Method result from the fact that the PUC Method allocates a higher portion of retirement costs closer to retirement, while the EAN Method spreads those costs evenly as a percentage of pay over the member’s period of employment.
ACTUARIAL ASSUMPTIONS
General
The Actuarial Valuations of the Retirement Systems use a variety of assumptions to calculate the Actuarial Accrued Liability and the Actuarial Value of Assets. Although several of the assumptions are the same across all of the Retirement Systems, each Retirement System determines, within actuarial standards, the assumptions to be used in its Actuarial Valuation. The specific assumptions used by a Retirement System can have a substantial impact on the UAAL, the Net Pension Liability, the Funded Ratio and the State’s required contribution to the Retirement System. No assurance can be given that any of the assumptions underlying the Actuarial Valuations will reflect the actual results experienced by the Retirement Systems. Variances between the assumptions and actual results will cause an increase or decrease in the Actuarial Value of Assets, the Actuarial Accrued Liability, the UAAL, the Funded Ratio or the Actuarially Required Contribution. Certain of these assumptions are summarized in Table E-2. For additional information on these assumptions, please see each Retirement System’s Actuarial Valuation.

E-11
TABLE E-2 - CERTAIN ACTUARIAL ASSUMPTIONS USED BY THE RETIREMENT SYSTEMS
TRS SURS SERS GARS JRS
Actuarial Cost Method(1) Projected Unit
Credit Projected Unit
Credit Projected Unit
Credit Projected Unit
Credit Projected Unit
Credit Investment Rate of Return 7.00% 6.75% 7.00% 6.75% 6.75% Assumed Inflation Rate 2.50% 2.25% 2.50% 2.50% 2.50% Post-Retirement Increase (Tier 1)(2) 3.00% 3.00% 3.00% 3.00% 3.00% Projected Salary Increases Various(3) 3.25% to 12.25%(4) Various(5) 2.75%(6) 3.00%(6) ____________________ Source: Actuarial Valuations of the Retirement Systems as of June 30, 2018.
(1) Under the projected unit credit actuarial cost method, the actuarial liability is the actuarial present value of that portion of a participant’s projected benefit that is attributable to service to date on the basis of future compensation projected to retirement. The Normal Cost represents the actuarial present value of the participant’s projected benefit that is attributable to service in the current year, again based on future compensation projected to retirement.
(2) All values are compounded.
(3) Compensation is assumed to increase between 4.00% and 9.50% based on years of service. Of these increases, 2.50% represents inflation adjustments and 0.75% represents real wage growth.
(4) Each member’s compensation is assumed to increase by 3.25% each year, 2.25% reflecting salary inflation and 1.00% reflecting standard of living increases. For members with less than 34 years of service, an additional projected salary increase factor is added to the assumed rate.
(5) Assumed rates of increase vary by age and include an inflation component of 2.50%.
(6) Consists of an inflation component of 2.50% and a productivity/merit/promotion component of 0.25%.
The Pension Code requires each of the Retirement Systems to conduct an actuarial experience review every three years. GARS, JRS and SERS last conducted an actuarial experience review based on the three-year period ending June 30, 2015. TRS last conducted an experience review in preparation of the Actuarial Valuation for the Fiscal Year ended June 30, 2018. SURS recently concluded an experience study based on the four-year period ended June 30, 2017. The purpose of the experience review is to determine the reasonableness of the actuarial assumptions regarding mortality, retirement, disability, employment, turnover, interest and earnable compensation of the members and beneficiaries of the Retirement Systems. Pursuant to the passage of Public Act 97-694, the State Actuary is required to review and deliver a report to the Boards regarding the reasonableness of the actuarial assumptions contained in the Actuarial Valuations of the Retirement Systems. Based upon the results of this review, the board of the applicable Retirement System may revise such actuarial assumptions as it deems appropriate. The most recent report of the State Actuary, with respect to the fiscal year ended June 30, 2018, is discussed under “—RECENT REPORTS REGARDING THE RETIREMENT SYSTEMS—State Actuary’s Fiscal Year 2018 Report.”
Public Act 100-23 provides that, beginning in Fiscal Year 2018, changes to the amount of the State’s contributions to the Retirement Systems caused by a change in the actuarial assumptions of a Retirement System will be recognized over a period of five years. This requirement applies retroactively to any changes in actuarial assumptions made since the Actuarial Valuation for the Fiscal Year ended June 30, 2012, for the Fiscal Year 2014 State contribution, and prospectively for any changes in assumption made beginning with the Fiscal Year 2016 Actuarial Valuation (for the Fiscal Year 2018 State contribution to the Retirement Systems). See “—2017 LEGISLATION MODIFYING PENSION STRUCTURE” herein.
Assumed Investment Rate of Return
The Actuarial Valuations assume an investment rate of return on the assets in each Retirement System. For the Fiscal Year ending June 30, 2009, each Retirement System assumed an investment rate of return of either 8.00% or 8.50%. Each Retirement System has since reduced its respective investment rate of return. SERS and TRS reduced their respective investment rate of return assumptions to 7.00%, and

E-12
GARS and JRS reduced their respective investment rate of return assumptions to 6.75% for Fiscal Year 2016. SURS reduced its assumed investment rate of return to 6.75% for Fiscal Year 2018. The reductions previously approved by the Retirement Systems have the effect of increasing the UAAL and the Required Annual Statutory Contribution as the Retirement Systems assume that plan assets will produce less income to pay projected benefits. Due to the volatility of the marketplace, however, the actual rate of return earned by the Retirement Systems on their assets may be higher or lower than the assumed rate. See Table E-3 for the rates of return on the Retirement Systems’ assets for the last ten fiscal years. Changes in the Retirement Systems’ assets as a result of market performance will lead to an increase or decrease in the UAAL and the Funded Ratio. As a result of the State’s adoption of the Asset Smoothing Method, however, only a portion of these increases or decreases will be recognized in the current year, with the remaining actuarial gain or loss spread over the remaining four years. See “—ACTUARIAL METHODS–Actuarial Value of Assets” above.
The assumed investment rates of return utilized by the Retirement Systems complied with the requirements of the Prior GASB Standards. The New GASB Standards similarly employ a rate, referred to in such statements as the “Discount Rate,” which is used to discount the projected benefit payments to current participants to be made by the Retirement Systems to their actuarial present values. The Discount Rate may be a blended rate comprised of (1) a long-term expected rate of return on a Retirement System’s investments (to the extent that such assets are projected to be sufficient to pay benefits) and (2) a tax-exempt municipal bond rate meeting certain specifications set forth in the New GASB Standards. Therefore, in certain cases in which the assets of a Retirement System are not expected to be sufficient to pay the projected benefits of such Retirement System, the Discount Rate calculated pursuant to the New GASB Standards may be lower than the investment rate of return established by the Retirement System when reporting pursuant to the Prior GASB Standards, which will have the effect of increasing the Net Pension Liability of such Retirement System relative to the Net Pension Liability of such Retirement System calculated under the rate determined pursuant to the Prior GASB Standards. See “—NET PENSION LIABILITY” herein for information regarding the sensitivity of the Net Pension Liability to changes in the Discount Rate.
Adverse market conditions resulted in negative investment returns on the Retirement Systems’ assets in Fiscal Years 2008 and 2009, resulting in a significant reduction in the Funded Ratio and a corresponding increase in the UAAL. No assurance can be given that negative trends in investment performance will not occur again in subsequent fiscal years, thereby resulting in a reduction in the Funded Ratio and a corresponding increase in the UAAL when considered independently of other factors.

E-13
TABLE E-3 - INVESTMENT RATES OF RETURN, FISCAL YEARS 2009-2018 TRS SURS SERS GARS JRS
Fiscal Year Assumed Actual Assumed Actual Assumed Actual Assumed Actual Assumed Actual2009 8.50% -22.7% 8.50% -19.7% 8.50% -20.1% 8.00% -20.1% 8.00% -20.1%2010 8.50% 12.9% 7.75% 15.0% 7.75% 9.1% 8.00% 9.1% 7.00% 9.1%2011 8.50% 23.6% 7.75% 23.8% 7.75% 21.7% 7.00% 21.7% 7.00% 21.7%2012 8.00% 0.8% 7.75% 0.5% 7.75% 0.1% 7.00% 0.1% 7.00% 0.1%2013 8.00% 12.8% 7.75% 12.5% 7.75% 14.1% 7.00% 14.1% 7.00% 14.1%2014 7.50% 17.4% 7.25% 18.2% 7.25% 17.9% 7.00% 17.9% 7.00% 17.9%2015 7.50% 4.0% 7.25% 2.9% 7.25% 4.7% 7.00% 4.7% 7.00% 4.7%2016 7.00% 0.0% 7.25% 0.2% 7.00% -0.8% 6.75% -0.8% 6.75% -0.8%2017 7.00% 12.6% 7.25% 12.2% 7.00% 12.3% 6.75% 12.3% 6.75% 12.3%2018 7.00% 8.5% 6.75% 8.2% 7.00% 7.6% 6.75% 7.6% 6.75% 7.6%
5-Yr. Avg. Geometric
Return 8.3% 8.1% 8.2% 8.2% 8.2%
10-Yr Avg. Geometric
Return 6.2% 6.7% 6.0% 6.0% 6.0%
______ Source: CAFRs of the Retirement Systems for the fiscal years ending June 30, 2009 through June 30, 2018.
HISTORY OF CONTRIBUTIONS TO THE RETIREMENT SYSTEMS
Under the Pension Code, the State is required to make the Required Annual Statutory Contribution in each fiscal year.
The General Assembly and Governor enacted the Pension Funding Act in 1994. The Pension Funding Act created a 50-year schedule of State contributions to the Retirement Systems designed to achieve a 90% Funded Ratio by the end of Fiscal Year 2045 (the “Statutory Funding Plan”). In each fiscal year beyond Fiscal Year 2045, the Pension Funding Act requires that the State annually contribute the amount necessary to maintain the Funded Ratio at 90% for each Retirement System.
The Statutory Funding Plan consists of two parts: (i) a ramp-up period of increasing State contributions as a percentage of payroll in each of the Fiscal Years 1996 to 2010 and (ii) a period of contributions equal to the level percent of payroll necessary to cause the assets of the Retirement Systems to equal 90% of the total Actuarial Accrued Liability by the end of Fiscal Year 2045. The level percent of payroll is revised and adjusted each year based on modifications to the actuarial assumptions and changes in the Actuarial Value of Assets. During the ramp-up period, the Statutory Funding Plan required that the percentage of payroll contributed by the State increase by an equal amount in each year such that, by Fiscal Year 2010, the contribution percentage of payroll was equal to the same percentage of payroll required to be contributed for years 2011 through 2045.
The State made the Required Annual Statutory Contribution for each of Fiscal Years 1996 through 2002. These contributions were not sufficient to cover the full Normal Cost and interest, determined pursuant to the Prior GASB Standards, for such fiscal years. As a result, the UAAL continued to grow during the ramp-up period. See “—DETERMINATION OF EMPLOYER CONTRIBUTIONS–Actuaries and the Actuarial Process” and “—DETERMINATION OF EMPLOYER CONTRIBUTION–Statutory Funding Plan Not in Accordance with GASB Standards” above.
On June 12, 2003, the State issued $10 billion of general obligation pension funding bonds (the “2003 Pension Bonds”) pursuant to authority granted by the General Assembly in Public Act 93-0002 (the “2003 Pension Bond Act”). The net proceeds of the 2003 Pension Bonds were used to (i) reimburse the State’s General Revenue Fund for $300 million of the Required Annual Statutory Contribution made for

E-14
Fiscal Year 2003, (ii) provide funding to the State’s General Revenue Fund for the full Fiscal Year 2004 Required Annual Statutory Contribution in the amount of $1.86 billion and (iii) fund a portion of the UAAL in the amount of $7.3 billion in Fiscal Year 2004. As a result, the State funded approximately 25% of its Fiscal Year 2003 Required Annual Statutory Contribution and all of its Fiscal Year 2004 Required Annual Statutory Contribution from the proceeds of the 2003 Pension Bonds and not from the General Revenue Fund. The 2003 Pension Bond Act also provided that, beginning in Fiscal Year 2005, the State’s Required Annual Statutory Contributions in each fiscal year during which the 2003 Pension Bonds are outstanding may not exceed the Required Annual Statutory Contribution for each Retirement System that would have been required if the System had not received any payments from the proceeds of the 2003 Pension Bonds less the portion of the State’s total debt service payments on the 2003 Pension Bonds allocated to such Retirement System based on the total moneys distributed to such Retirement System from the proceeds of the 2003 Pension Bonds (the “2003 Pension Bond Limitation”). See Table E-4 below for a schedule of the remaining annual debt service payments on the 2003 Pension Bonds.
The $7.3 billion contribution from the proceeds of the 2003 Pension Bonds directly reduced the UAAL, and, therefore, reduced future contributions from the levels that would have been required if the bond proceeds had not been used as additional contributions. The reduction of future Required Annual Statutory Contributions by the debt service payments on the 2003 Pension Bonds had the effect of increasing the UAAL, however, because the State does not make the full contribution originally required by the Statutory Funding Plan as a result of this reduction. At the time of the issuance of the 2003 Pension Bonds, the State assumed that the investment returns made on the 2003 Pension Bond proceeds used to reduce the UAAL would be greater than the debt service on the 2003 Pension Bonds, creating a net decrease in the UAAL in each year. The total interest cost percentage of the 2003 Pension Bond proceeds at the date of issuance was 5.05%. Therefore, in any year that actual investment returns, measured in dollars, exceed debt service payments on the 2003 Pension Bonds for such year, the UAAL is reduced from what the UAAL would have been in the absence of the issuance of the 2003 Pension Bonds. Conversely, in those fiscal years in which actual investment returns, measured in dollars, are less than debt service payments on the 2003 Pension Bonds, the UAAL is increased from what the UAAL would have been in the absence of the issuance of the 2003 Pension Bonds. The Retirement Systems’ investment rates of return for Fiscal Years 2009 through 2018 are set forth in Table E-3. The State’s future debt service requirements with respect to the 2003 Pension Bonds are set forth in Table E-4. No assurance can be given that future investment trends or legislation affecting the Statutory Funding Plan will not occur, causing further change in the UAAL.
TABLE E-4 - DEBT SERVICE ON 2003 PENSION BONDS (1)
FISCAL YEAR
DEBT SERVICE DUE ON 2003 PENSION BONDS
FISCALYEAR
DEBT SERVICE DUE ON 2003 PENSION BONDS
2019 633.2 2027 $ 936.1 2020 674.6 2028 979.2 2021 713.4 2029 1,018.5 2022 749.8 2030 1,079.0 2023 783.7 2031 1,134.4 2024 840.2 2032 1,159.7 2025 892.2 2033 1,156.1 2026 915.4
___________________ (1) In millions of dollars.
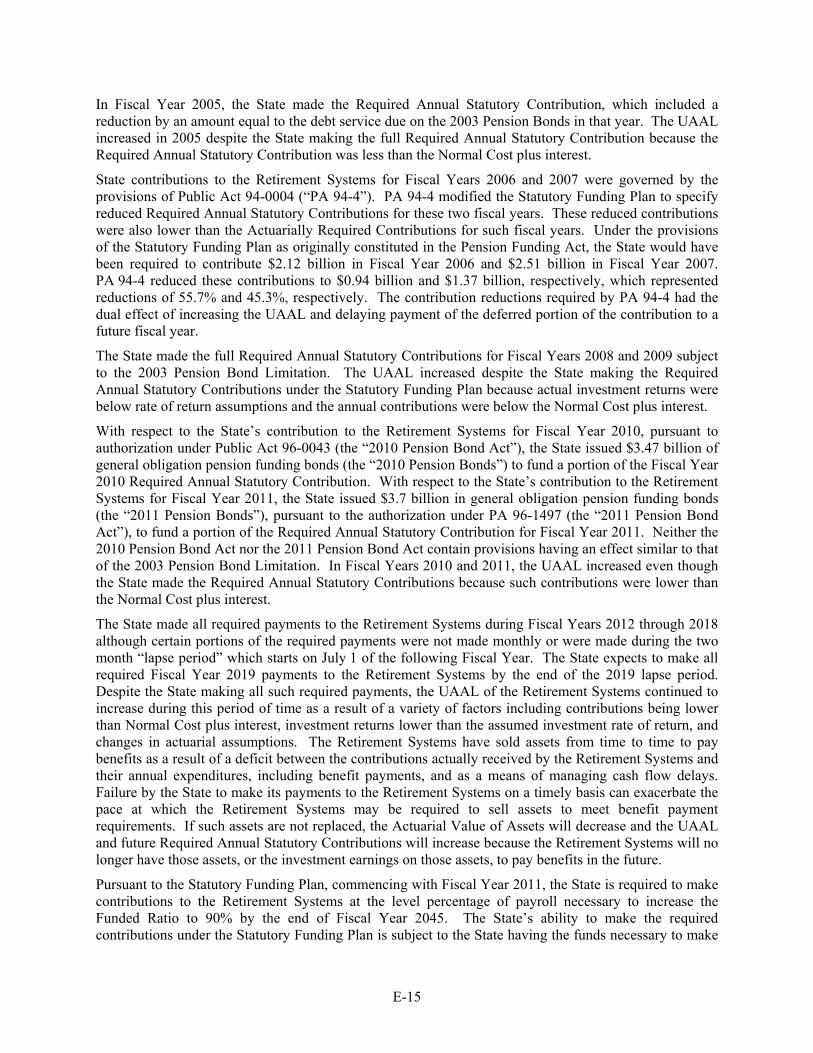
E-15
In Fiscal Year 2005, the State made the Required Annual Statutory Contribution, which included a reduction by an amount equal to the debt service due on the 2003 Pension Bonds in that year. The UAAL increased in 2005 despite the State making the full Required Annual Statutory Contribution because the Required Annual Statutory Contribution was less than the Normal Cost plus interest.
State contributions to the Retirement Systems for Fiscal Years 2006 and 2007 were governed by the provisions of Public Act 94-0004 (“PA 94-4”). PA 94-4 modified the Statutory Funding Plan to specify reduced Required Annual Statutory Contributions for these two fiscal years. These reduced contributions were also lower than the Actuarially Required Contributions for such fiscal years. Under the provisions of the Statutory Funding Plan as originally constituted in the Pension Funding Act, the State would have been required to contribute $2.12 billion in Fiscal Year 2006 and $2.51 billion in Fiscal Year 2007. PA 94-4 reduced these contributions to $0.94 billion and $1.37 billion, respectively, which represented reductions of 55.7% and 45.3%, respectively. The contribution reductions required by PA 94-4 had the dual effect of increasing the UAAL and delaying payment of the deferred portion of the contribution to a future fiscal year.
The State made the full Required Annual Statutory Contributions for Fiscal Years 2008 and 2009 subject to the 2003 Pension Bond Limitation. The UAAL increased despite the State making the Required Annual Statutory Contributions under the Statutory Funding Plan because actual investment returns were below rate of return assumptions and the annual contributions were below the Normal Cost plus interest.
With respect to the State’s contribution to the Retirement Systems for Fiscal Year 2010, pursuant to authorization under Public Act 96-0043 (the “2010 Pension Bond Act”), the State issued $3.47 billion of general obligation pension funding bonds (the “2010 Pension Bonds”) to fund a portion of the Fiscal Year 2010 Required Annual Statutory Contribution. With respect to the State’s contribution to the Retirement Systems for Fiscal Year 2011, the State issued $3.7 billion in general obligation pension funding bonds (the “2011 Pension Bonds”), pursuant to the authorization under PA 96-1497 (the “2011 Pension Bond Act”), to fund a portion of the Required Annual Statutory Contribution for Fiscal Year 2011. Neither the 2010 Pension Bond Act nor the 2011 Pension Bond Act contain provisions having an effect similar to that of the 2003 Pension Bond Limitation. In Fiscal Years 2010 and 2011, the UAAL increased even though the State made the Required Annual Statutory Contributions because such contributions were lower than the Normal Cost plus interest.
The State made all required payments to the Retirement Systems during Fiscal Years 2012 through 2018 although certain portions of the required payments were not made monthly or were made during the two month “lapse period” which starts on July 1 of the following Fiscal Year. The State expects to make all required Fiscal Year 2019 payments to the Retirement Systems by the end of the 2019 lapse period. Despite the State making all such required payments, the UAAL of the Retirement Systems continued to increase during this period of time as a result of a variety of factors including contributions being lower than Normal Cost plus interest, investment returns lower than the assumed investment rate of return, and changes in actuarial assumptions. The Retirement Systems have sold assets from time to time to pay benefits as a result of a deficit between the contributions actually received by the Retirement Systems and their annual expenditures, including benefit payments, and as a means of managing cash flow delays. Failure by the State to make its payments to the Retirement Systems on a timely basis can exacerbate the pace at which the Retirement Systems may be required to sell assets to meet benefit payment requirements. If such assets are not replaced, the Actuarial Value of Assets will decrease and the UAAL and future Required Annual Statutory Contributions will increase because the Retirement Systems will no longer have those assets, or the investment earnings on those assets, to pay benefits in the future.
Pursuant to the Statutory Funding Plan, commencing with Fiscal Year 2011, the State is required to make contributions to the Retirement Systems at the level percentage of payroll necessary to increase the Funded Ratio to 90% by the end of Fiscal Year 2045. The State’s ability to make the required contributions under the Statutory Funding Plan is subject to the State having the funds necessary to make

E-16
the contributions required under the plan. The availability of such funds will require funded appropriations and the availability of sufficient revenues to the Retirement Systems by the State or the issuance of additional pension obligation bonds. No assurances can be given that the State will have the revenues necessary to fund the Retirement Systems from continuing operations, that payments from revenues will be made to the Retirement Systems or that such bonds will be issued. If the State for any reason does not contribute the Required Annual Statutory Contribution in any fiscal year, and it does not contribute the shortfall between the actual contribution and the Required Annual Statutory Contribution in a subsequent fiscal year, the Funded Ratio will decrease and it is unlikely that the State will be able to achieve a 90% Funded Ratio by the end of Fiscal Year 2045. If the State issues additional pension obligation bonds to make the Required Annual Statutory Contribution in any year and reduces future Required Annual Statutory Contributions by the amount of the debt service on such bonds, the UAAL will increase by the amount of such debt service. No assurance can be given that the State will not, through legislative action, subsequently modify the amount to be contributed in any given year.
Table E-5 shows the State’s Actuarially Required Contributions (for fiscal years 2008 through 2015 for each of the Retirement Systems except TRS, and fiscal years 2008 through 2016 for TRS) and the ADC (as hereinafter defined) (for fiscal years 2016, 2017 and 2018 for each of the Retirement Systems except TRS, and fiscal years 2017 and 2018 for TRS) along with the percentage of those contributions actually made in each of 2009 through 2018.

E-17
TABLE E-5 - HISTORY OF STATE CONTRIBUTIONS (1)
Fiscal Year Amount Contributed(2)
Actuarially Required
Contribution or ADC Percentage Contributed
2009 $2,891.9 $4,076.4 70.9% 2010 4,130.9 4,786.8 86.3% 2011 4,298.6 5,906.6 72.8% 2012 5,012.8 6,609.6 75.8% 2013 5,893.9 7,015.3 84.0% 2014 6,944.7 7,752.0 89.6% 2015 7,020.1 7,896.8 88.9% 2016(3) 7,501.9 8,388.4 89.4% 2017(3) 7,803.6 10,422.7 74.9%(4) 2018(3) 7,788.9 11,882.4 65.5%
____________________ Source: Comprehensive Annual Financial Reports of the Retirement Systems for the fiscal years ending June 30, 2008 through June 30, 2018. (1) In millions of dollars. (2) Includes all State funds. TRS also includes local employers and federal funds that count towards the Actuarially Required
Contribution (ARC).
(3) As described under the heading “DETERMINATION OF EMPLOYER CONTRIBUTIONS—GASB Financial Reporting Standards,” the New GASB Standards no longer require the calculation of the Actuarially Required Contribution. Under the New GASB Standards, the Board of a Retirement System calculates an Actuarially Determined Contribution (“ADC”) on a basis set forth in its Actuarial Valuation. Prior to the fiscal year ended June 30, 2016 (June 30, 2017 for TRS), the Retirement Systems used the Actuarially Required Contribution as the ADC. Beginning with the fiscal year ended June 30, 2016 (June 30, 2017 for TRS), the Actuarial Valuations of the Retirement Systems included an ADC which amortizes the UAAL of the respective Retirement System over a fixed period of time as opposed to the open 30-year amortization period used to calculate the Actuarially Required Contribution. For the fiscal year ended June 30, 2018, the remaining amortization periods (with the original amortization period provided in parentheses) used in calculating the ADCs of the individual Retirement Systems were as follows: TRS: 19 years (20 years); SURS: 27 (30 years); SERS: 22 years (25 years); JRS: 22 years (25 years); and GARS: 17 years (20 years). Future gains and losses will be amortized over subsequent original amortization periods. As a result of the differences in the calculation of the ADC and the Actuarially Required Contribution discussed in this note, the ADC for the fiscal year ended June 30, 2018 would exceed the amount of the Actuarially Required Contribution had it been calculated, and, as a result, the percentage of the ADC contributed is lower than the percentage of the Actuarially Required Contribution would have been had it been calculated, primarily as a result of the remaining amortization periods used in calculating the ADC being (i) less than the 30 year period used in calculating the Actuarially Required Contribution, and (ii) fixed time periods as opposed to open time periods.
(4) The State’s percentage contributed declined in Fiscal Year 2017 primarily as a result of TRS establishing a 20-year closed amortization period in calculating its ADC. This amortization period, which is shorter than that used in calculating the Required Annual Statutory Contribution, causes the ADC for TRS to substantially exceed the Required Annual Statutory Contribution which the State is authorized to pay under the Pension Code, and, as such, the difference between the ADC and the actual State contribution to TRS increased.
The preliminary certifications of the State’s contribution to the Retirement Systems for Fiscal Year 2019 provide for a contribution of approximately $8,451 million. This contribution is greater than contributions in previous fiscal years as a result of, among other factors, the reduction in the assumed investment rate of return by TRS and SERS, changes in other assumptions by SERS and investment returns in Fiscal Year 2017 being substantially lower than assumed. However, P.A. 100-587 provides that the Retirement Systems must recertify the amount of the Fiscal Year 2019 contribution as a result of changes made to the Pension Code in that legislation. The Pension Code requires that such recertification occur by June 30, 2019. The State makes no prediction as to the effect of such recertification on the amount of the State’s Fiscal Year 2019 contribution to the Retirement Systems. The State expects that its contributions to SERS will increase in future years as a result of the AFCSME Decision, as described in the Preliminary Official Statement under the heading “STATE FINANCIAL INFORMATION—Collective Bargaining”, which caused a retroactive increase in pensionable salaries for certain State employees.

E-18
FUNDED STATUS
As of the end of Fiscal Year 2018, the Retirement Systems had an aggregate UAAL of approximately $133,478 million on a fair value basis and $133,674 million on an actuarial basis (calculated pursuant to the Asset Smoothing Method), resulting in respective Funded Ratios of 40.2% and 40.1%. Factors contributing to the increased UAAL from Fiscal Year 2017 to Fiscal Year 2018 include State contributions less than the Actuarially Required Contribution.
The following tables summarize the financial condition of the Retirement Systems for Fiscal Years 2014 through 2018.

E-19
TABLE E-6 FINANCIAL CONDITION OF THE RETIREMENT SYSTEMS
FISCAL YEAR 2018 ($ IN THOUSANDS)
SERS TRS SURS GARS JRS Total Self-Managed
Plan of SURS(1)
Beginning Net Assets(2) $16,530,180 $49,375,665 $ 18,484,820 $ 54,349 $ 941,804 $ 85,386,818 $ 2,170,251 Income Member Contributions $ 254,442 $ 938,037 $ 282,726 $ 1,255 $ 14,296 $1,490,756 $ 84,219 State and Employer Contributions 1,929,175 4,179,758 1,607,880 21,155 135,962 $7,873,930 69,432 Investment Income 1,257,040 4,049,272 1,499,829 3,734 69,950 $6,879,825 259,006 Total $3,440,657 $9,167,067 $3,390,435 $26,144 $220,208 $16,244,511 $412,657 Expenditures Benefits and Refunds $ 2,492,301 $ 6,551,634 $2,539,783 $ 23,328 $ 148,629 $11,755,675 $ 82,004 Administration 15,258 21,551 14,397 348 897 $ 52,451 452 Total $2,507,559 $6,573,185 $2,554,180 $23,676 $149,526 $11,808,126 $82,456
Ending Net Assets (Fair value) $17,463,278 $51,969,547 $19,321,075 $56,816 $1,012,485 $89,823,201 $2,500,452Actuarial Value of Assets 17,478,140 51,730,890 19,347,886 57,618 1,012,757 $89,627,291 N/AActuarial Accrued Liabilities 47,925,683 127,019,330 45,258,751 375,779 2,721,853 $223,301,396 N/A UAAL (Fair Value) 30,462,405 75,049,783 25,937,676 318,962 1,709,368 $133,478,194 N/A UAAL (Actuarial Value)(3) 30,447,543 75,288,440 25,910,865 318,160 1,709,096 $133,674,104 N/A Funded Ratio (Fair Value) 36.4% 40.9% 42.7% 15.1% 37.2% 40.2% N/A Funded Ratio (Actuarial Value)(3) 36.5% 40.7% 42.7% 15.3% 37.2% 40.1% N/A
____________________ Source: Source: Annual Actuarial Valuations of the Retirement Systems as of June 30, 2018. Table may not add due to rounding. Certain information was provided by the Retirement
Systems.
(1) The SURS Self-Managed Plan (“SMP”) is not included in the totals. The SMP is a defined contribution plan and, by definition, is fully funded and does not carry unfunded liability. See “BACKGROUND INFORMATION REGARDING THE RETIREMENT SYSTEMS”.
(2) Reflects valuation of assets on a fair value basis as of June 30, 2017.
(3) The actuarial value is determined by the methods as discussed in “ACTUARIAL METHODS - Actuarial Value of Assets.”

E-20
TABLE E-7 FINANCIAL CONDITION OF THE RETIREMENT SYSTEMS
FISCAL YEAR 2017 ($ IN THOUSANDS)
SERS TRS SURS GARS JRS Total Self-Managed
Plan of SURS(1)
Beginning Net Assets(2) $15,038,528 $45,250,957 $17,005,630 $ 49,052 $ 840,289 $ 78,184,456 $1,825,506 Income Member Contributions $ 251,611 $ 929,130 $ 278,643 $ 1,284 $ 14,770 $ 1,475,438 $ 85,217 State and Employer Contributions 1,798,348 4,135,860 1,650,551 21,721 131,334 7,737,814 66,916 Investment Income 1,812,878 5,520,453 1,994,310 5,140 97,796 9,430,577 266,350 Total $ 3,862,837 $10,585,443 $ 3,923,504 $ 28,145 $ 243,900 $ 18,643,829 $ 418,483 Expenditures Benefits and Refunds $ 2,355,228 $ 6,438,006 $ 2,429,467 $ 22,493 $ 141,471 $ 11,386,665 $ 73,282 Administration 15,957 22,729 14,847 355 914 54,802 456 Total $ 2,371,185 $ 6,460,735 $ 2,444,314 $ 22,848 $ 142,385 $ 11,441,467 $ 73,738
Ending Net Assets (Fair value) $16,530,180 $49,375,665 $18,484,820 $ 54,349 $ 941,804 $ 85,386,818 $2,170,251 Actuarial Value of Assets 16,558,873 49,467,525 18,594,326 55,063 942,988 85,618,775 N/A Actuarial Accrued Liabilities 46,701,348 122,904,034 41,853,348 370,758 2,649,258 214,478,746 N/A UAAL (Fair Value) 30,171,168 73,528,369 23,368,528 316,409 1,707,454 129,091,928 N/A UAAL (Actuarial Value)(3) 30,142,475 73,436,509 23,259,022 315,695 1,706,270 128,859,971 N/A Funded Ratio (Fair Value) 35.4% 40.3% 44.2% 14.7% 35.6% 39.8% N/A Funded Ratio (Actuarial Value)(3) 35.5% 40.3% 44.4% 14.9% 35.6% 39.9% N/A
____________________ Source: Source: Annual Actuarial Valuations of the Retirement Systems as of June 30, 2017. Table may not add due to rounding. Certain information was provided by the Retirement
Systems.
(1) The SURS Self-Managed Plan (“SMP”) is not included in the totals. The SMP is a defined contribution plan and, by definition, is fully funded and does not carry unfunded liability. See “BACKGROUND INFORMATION REGARDING THE RETIREMENT SYSTEMS”.
(2) Reflects valuation of assets on a fair value basis as of June 30, 2016.
(3) The actuarial value is determined by the methods as discussed in “ACTUARIAL METHODS - Actuarial Value of Assets.”

E-21
TABLE E-8 FINANCIAL CONDITION OF THE RETIREMENT SYSTEMS
FISCAL YEAR 2016 ($ IN THOUSANDS)
SERS TRS SURS GARS JRS Total Self Managed
Plan of SURS(1)
Beginning Net Assets(2) $15,258,867 $46,406,916 $17,462,968 $ 54,574 $ 833,910 $ 80,017,235 $1,753,554 Income Member Contributions $ 256,198 $ 951,809 $ 278,884 $ 1,310 $ 14,962 $ 1,503,163 $ 76,457 State and Employer Contributions 1,882,243 3,890,510 1,582,294 16,073 132,060 7,503,180 65,370 Investment Income (125,443) (44,103) 17,044 (539) (6,471) (159,512) 3,192 Total $ 2,012,999 $ 4,798,216 $ 1,878,222 $ 16,843 $ 140,552 $ 8,846,831 $ 145,019 Expenditures Benefits and Refunds $ 2,217,210 $ 5,931,207 $ 2,320,829 $ 21,983 $ 133,230 $ 10,624,459 $ 72,588 Administration 16,127 22,968 14,731 382 943 55,151 479 Total $ 2,233,337 $ 5,954,175 $ 2,335,560 $ 22,365 $ 134,173 $ 10,679,610 $ 73,067
Ending Net Assets (Fair value) $15,038,528 $45,250,957 $17,005,630 $ 49,052 $ 840,289 $ 78,184,456 $1,825,506 Actuarial Value of Assets 15,632,604 47,222,098 17,701,646 50,823 870,893 81,478,064 N/A Actuarial Accrued Liabilities 45,515,370 118,629,890 40,923,301 363,337 2,546,450 207,978,348 N/A UAAL (Fair Value) 30,476,842 73,378,934 23,917,671 314,285 1,706,161 129,793,898 N/A UAAL (Actuarial Value)(3) 29,882,766 71,407,792 23,221,655 312,514 1,675,557 126,500,284 N/A Funded Ratio (Fair Value) 33.0% 38.1% 41.6% 13.5% 33.0% 37.6% N/A Funded Ratio (Actuarial Value)(3) 34.4% 39.8% 43.3% 14.0% 34.2% 39.2% N/A
____________________ Source: Source: Annual Actuarial Valuations of the Retirement Systems as of June 30, 2016. Table may not add due to rounding. Certain information was provided by the Retirement
Systems
(1) The SURS Self Managed Plan (“SMP”) is not included in the totals. The SMP is a defined contribution plan and, by definition, is fully funded and does not carry unfunded liability. See “BACKGROUND INFORMATION REGARDING THE RETIREMENT SYSTEMS.”
(2) Reflects valuation of assets on a fair value basis as of June 30, 2015.
(3) The actuarial value is determined by application of the Asset Smoothing Method as discussed in “ACTUARIAL METHODS–Actuarial Value of Assets.”

E-22
TABLE E-9 FINANCIAL CONDITION OF THE RETIREMENT SYSTEMS
FISCAL YEAR 2015 ($ IN THOUSANDS)
SERS TRS SURS GARS JRS Total Self Managed
Plan of SURS(1) Beginning Net Assets(2) $14,581,565 $45,825,382 $17,391,323 $ 56,790 $ 776,012 $78,631,072 $1,584,691 Income Member Contributions $ 266,139 $ 935,451 $ 267,682 $ 1,487 $ 15,431 $ 1,486,191 $ 72,328 State and Employer Contributions 1,804,319 3,523,257 1,528,525 15,871 134,040 7,006,012 62,334 Investment Income 681,377 1,770,550 503,200 2,288 36,009 2,993,424 90,461 Total $ 2,751,835 $ 6,229,257 $ 2,299,407 $ 19,646 $ 185,480 $11,485,625 $ 225,123 Expenditures Benefits and Refunds $ 2,057,987 $ 5,625,037 $ 2,213,694 $ 21,467 $ 126,600 $10,044,785 $ 55,794 Administration 16,548 21,687 14,069 395 983 53,681 466 Total $ 2,074,535 $ 5,646,724 $ 2,227,763 $ 21,861 $ 127,583 $10,098,466 $ 56,260
Ending Net Assets (Fair value) $15,258,865 $46,407,915 $17,462,967 $ 54,574 $ 833,909 $80,018,230 $1,753,554 Actuarial Value of Assets 14,741,736 45,435,193 17,097,255 52,565 804,189 78,130,937 N/A Actuarial Accrued Liabilities 40,743,410 108,121,825 39,520,687 328,244 2,314,147 191,028,313 N/A UAAL (Fair Value) 25,484,545 61,713,910 22,057,720 273,670 1,480,238 111,010,083 N/A UAAL (Actuarial Value)(3) 26,001,674 62,686,632 22,423,432 275,679 1,509,959 112,897,376 N/A Funded Ratio (Fair Value) 37.5% 42.9% 44.2% 16.6% 36.0% 41.9% N/A Funded Ratio (Actuarial Value)(3) 36.2% 42.0% 43.3% 16.0% 34.8% 40.9% N/A
____________________ Source: Source: Annual Actuarial Valuations of the Retirement Systems as of June 30, 2015. Table may not add due to rounding. Certain information was provided by the Retirement
Systems
(1) The SURS Self Managed Plan (“SMP”) is not included in the totals. The SMP is a defined contribution plan and, by definition, is fully funded and does not carry unfunded liability. See “BACKGROUND INFORMATION REGARDING THE RETIREMENT SYSTEMS.”
(2) Reflects valuation of assets on a fair value basis as of June 30, 2014.
(3) The actuarial value is determined by application of the Asset Smoothing Method as discussed in “ACTUARIAL METHODS–Actuarial Value of Assets.”

E-23
TABLE E-10 FINANCIAL CONDITION OF THE RETIREMENT SYSTEMS
FISCAL YEAR 2014 ($ IN THOUSANDS)
SERS TRS SURS GARS JRS Total Self Managed
Plan of SURS(1) Beginning Net Assets(2) $12,400,299 $39,858,768 $15,037,102 $ 54,348 $ 643,329 $67,993,846 $1,259,340 Income Member Contributions $ 269,232 $ 928,746 $ 283,081 $ 1,503 $ 15,919 $ 1,498,481 $ 65,531 State and Employer Contributions 1,699,448 3,596,717 1,502,864 13,957 126,816 6,939,802 57,162 Investment Income 2,169,346 6,782,032 2,667,900 8,363 110,059 11,737,700 246,288 Total $ 4,138,026 $11,307,495 $ 4,453,845 $ 23,823 $ 252,794 $20,175,983 $ 368,981 Expenditures Benefits and Refunds $ 1,940,145 $ 5,320,663 $ 2,085,766 $ 21,046 $ 119,279 $ 9,486,899 $ 43,190 Administration 16,615 21,218 13,858 335 832 52,858 440 Total $ 1,956,760 $ 5,341,881 $ 2,099,624 $ 21,381 $ 120,111 $ 9,539,757 $ 43,630
Ending Net Assets (Fair value) $14,581,565 $ 45,824,382 $17,391,323 $ 56,790 $ 776,012 $78,630,072 $1,584,691 Actuarial Value of Assets 13,315,613 42,150,765 15,844,714 51,598 705,250 72,067,940 N/A Actuarial Accrued Liabilities 39,526,845 103,740,377 37,429,515 323,379 2,229,277 183,249,393 N/A UAAL (Fair Value) 24,945,280 57,915,995 20,038,192 266,589 1,453,265 104,619,321 N/A UAAL (Actuarial Value)(3) 26,211,232 61,589,612 21,584,801 271,781 1,524,027 111,181,453 N/A Funded Ratio (Fair Value) 36.9% 44.2% 46.5% 17.6% 34.8% 42.9% N/AFunded Ratio (Actuarial Value)(3) 33.7% 40.6% 42.3% 16.0% 31.6% 39.3% N/A
____________________ Source: Source: Annual Actuarial Valuations of the Retirement Systems as of June 30, 2014. Table may not add due to rounding. Certain information was provided by the Retirement
Systems.
(1) The SURS Self Managed Plan (“SMP”) is not included in the totals. The SMP is a defined contribution plan and, by definition, is fully funded and does not carry unfunded liability. See “BACKGROUND INFORMATION REGARDING THE RETIREMENT SYSTEMS.”
(2) Reflects valuation of assets on a fair value basis as of June 30, 2013.
(3) The actuarial value is determined by application of the Asset Smoothing Method as discussed in “ACTUARIAL METHODS–Actuarial Value of Assets.”

E-24
Tables E-11 presents information regarding the aggregate funding progress of the Retirement Systems for Fiscal Years 2009 through 2018.
TABLE E-11 - SCHEDULE OF FUNDING PROGRESS(1)
FAIR VALUE OF ASSETS AND ACTUARIAL VALUE OF ASSETS ($ IN MILLIONS)
BASED ON FAIR VALUE OF ASSETS
FY Fair Value of Assets(2)
Actuarial Accrued Liability UAAL
Funded Ratio Payroll
UAAL as a % of
Payroll (a) (b) (b-a) (a/b) (c) ([b-a]/c)
2009 $48,542 $126,436 $77,893 38.4% $16,607 469.0% 2010 53,225 138,794 85,569 38.3% 17,042 502.1% 2011 63,382 146,460 83,078 43.3% 17,062 486.9% 2012 61,813 158,612 96,798 39.0% 17,314 559.1% 2013 67,934 165,458 97,524 41.1% 17,357 561.9% 2014 78,630 183,249 104,619 42.9% 17,637 593.2% 2015 79,981 191,028 111,048 41.9% 17,890 620.7% 2016 78,184 207,798 129,794 37.6% 17,798 729.3% 2017 85,387 214,479 129,092 39.8% 17,813 724.7% 2018 89,823 223,301 133,478 40.2% 18,021 740.7%
BASED ON ACTUARIAL VALUE OF ASSETS
FY
Actuarial Value
of Assets(3)
Actuarial Accrued Liability UAAL
Funded Ratio Payroll
UAAL as a % of
Payroll (a) (b) (b-a) (a/b) (c) ([b-a]/c)
2009 $63,996 $126,436 $62,439 50.6% $16,601 376.0% 2010 63,053 138,794 75,741 45.4% 17,042 444.4% 2011 63,553 146,460 82,907 43.4% 17,062 485.9% 2012 64,030 158,612 94,582 40.4% 17,314 546.3% 2013 64,957 165,458 100,501 39.3% 17,357 579.0% 2014 72,068 183,249 111,181 39.3% 17,637 630.4% 2015 78,131 191,028 112,897 40.9% 17,890 631.1% 2016 81,478 207,978 126,500 39.2% 17,798 710.7% 2017 85,619 214,479 128,860 39.9% 17,813 723.4% 2018 89,627 223,301 133,674 40.1% 18,021 741.8%
____________________ Source: Comprehensive Annual Financial Reports of the Retirement Systems for the fiscal years ending June 30, 2009, through June 30, 2018.
(1) The SURS Self Managed Plan (“SMP”) is not included in the totals. The SMP is a defined contribution plan and, by definition, is fully funded and does not carry unfunded liability. See “BACKGROUND INFORMATION REGARDING THE RETIREMENT SYSTEMS.”
(2) Measures assets at fair value.
(3) The actuarial value of assets is determined in accordance with the Asset Smoothing Method. See discussion of Asset Smoothing Method in “ACTUARIAL METHODS–Actuarial Value of Assets.”

E-25
NET PENSION LIABILITY
GASB 67 calls for the calculation and disclosure of the “Net Pension Liability,” which is the difference between the actuarial present value of projected benefit payments that is attributed to past periods of employee service calculated pursuant to the methods and assumptions set forth in the New GASB Standards (referred to in such statements as the “Total Pension Liability”) and the value of the pension plan’s assets (referred to as the “Fiduciary Net Position”), calculated at fair market value.
The concept of the Net Pension Liability is similar to the concept of the UAAL. However, because the Fiduciary Net Position is calculated at fair market value, and because of the differences in the manner of calculating the Total Pension Liability as compared to the Actuarial Accrued Liability under the Prior GASB Standards, the Retirement Systems’ UAAL and Net Pension Liability most likely will differ on each measurement date.
Table E-12A presents the Net Pension Liability of each Retirement System as of June 30 of the years 2014 through 2018. Table E-12B provides information regarding the impact of potential changes to the Discount Rate on the Net Pension Liability for fiscal year ended June 30, 2018. For additional discussion regarding the rates of return and the Discount Rate as employed by the actuaries of the Retirement Systems, see “ACTUARIAL ASSUMPTIONS—Assumed Investment Rate of Return” above. The June 30, 2014, calculation of the Net Pension Liability was the initial calculation of the Net Pension Liability pursuant to the New GASB Standards, and, as such, historical information is not available.

E-26
TABLE E-12A - NET PENSION LIABILITY (1)
Total Pension
Liability Plan Net Position
Net Pension Liability
Plan Net Position as a Percentage of Total Pension
Liability TRS
2014 $106,683 $45,824 $60,858 43.0% 2015 111,917 46,407 65,510 41.5% 2016 124,187 45,251 78,936 36.4% 2017 125,774 49,376 76,398 39.3% 2018 129,914 51,970 77,945 40.0% SURS 2014 $39,182 $17,391 $21,791 44.4% 2015 41,219 17,463 23,756 42.4% 2016 42,971 17,006 25,965 39.6% 2017 43,966 18,485 25,481 42.0% 2018 46,816 19,321 27,495 41.3% SERS 2014 $41,685 $14,582 $27,104 35.0% 2015 43,267 15,259 28,008 35.3% 2016 49,184 15,039 34,145 30.6% 2017 49,437 16,530 32,907 33.4% 2018 50,520 17,463 33,056 34.6% JRS 2014 $2,231 $776 $1,455 34.8% 2015 2,353 834 1,519 35.4% 2016 2,638 840 1,797 31.9% 2017 2,713 942 1,771 34.7% 2018 2,784 1,013 1,771 36.4% GARS 2014 $398 $57 $341 14.3% 2015 333 55 278 16.5% 2016 374 49 325 13.1% 2017 378 54 324 14.3% 2018 383 57 326 14.8% Total 2014 $190,179 $78,630 $111,549 41.3% 2015 199,090 80,017 119,071 40.2% 2016 219,353 78,185 141,169 35.6% 2017 222,268 85,387 136,881 38.4% 2018 230,416 89,824 140,594 39.0%
______________________________ Source: The Actuarial Valuations of the Retirement Systems for the fiscal years ended June 30, 2014 through June 30, 2018. (1) In millions. Rows and columns may not sum due to rounding.

E-27
TABLE E-12B - SENSITIVITY OF NET PENSION LIABILITY TO CHANGES IN THE DISCOUNT RATE (1)
FISCAL YEAR 2018
1%
DECREASE CURRENT 1% INCREASE TRS Discount Rate 6.00% 7.00% 8.00% Net Pension Liability $95,592 $77,945 $63,734 SURS Discount Rate 5.65% 6.65% 7.65% Net Pension Liability $33,352 $27,495 $22,651 SERS Discount Rate 5.81% 6.81% 7.81% Net Pension Liability $40,018 $33,056 $27,353 GARS Discount Rate 5.68% 6.68% 7.68% Net Pension Liability 370 326 289 JRS Discount Rate 5.60% 6.60% 7.60% Net Pension Liability $2,095 $1,771 $1,499
______________________________ Source: The Actuarial Valuations of the Retirement Systems for the fiscal years ended June 30, 2018. (1) In millions.
COMPONENTS OF CHANGE IN UNFUNDED LIABILITY
A variety of factors impact the Retirement Systems’ UAAL. Unexpected increases in member salary and benefits, a lower return on investment than that assumed by the Retirement Systems and employer contributions less than the Actuarially Required Contribution will, each taken independently of other legislative or market effects, cause an increase in the UAAL. Conversely, unexpected decreases in member salary and benefits, a higher return on investment than assumed, an increase in employee contributions and employer contributions in excess of the Actuarially Required Contribution, each taken independently of other legislative or market effects, will decrease the UAAL. In addition, changes in actuarial assumptions and certain other factors may also impact the UAAL. Table E-13 provides information regarding the sources of the change in the UAAL for the Retirement Systems from Fiscal Years 2009 through 2018. The UAAL on a fair value basis increased from approximately $78 billion at the end of Fiscal Year 2009 to approximately $134 billion at the end of Fiscal Year 2018, an increase of approximately $56 billion. No assurances can be given that the State will make the appropriations necessary to meet any deficiencies incurred by the Retirement Systems.

E-28
TABLE E-13 - COMPONENTS OF CHANGE IN UNFUNDED LIABILITY
Fiscal Year
Salary Increases/
(Decreases)
Investment Returns
(Higher)/Lower Than Assumed(2)
Employer Contributions
(Higher)/Lower than Normal Cost
Plus Interest(3) Benefit Increases
Changes In Actuarial
Assumptions Other
Factors(4)
Total Change in Unfunded Liability
From Previous Year
2009 $ (105.8) $ 3,831.9 $ 3,231.3 $0.0 $ 0.0 $ 1,097.7 $ 8,055.2 2010 (421.9) 4,818.1 2,746.1 0.0 5,209.1 950.5 13,301.8 2011 (847.3) 2,667.2 3,666.0 0.0 581.3 1,098.7 7,166.0 2012 (1,294.5) 2,844.8 4,308.0 0.0 4,625.0 1,191.5 11,674.8 2013 (631.2) 2,398.7 3,353.0 0.0 71.3 727.3 5,919.1 2014 (229.0) (3,130.5) 2,408.9 0.0 11,107.0 524.2 10,680.6 2015 (820.3) (2,399.6) 3,212.9 0.0 1,559.3 163.7 1,715.9 2016 (957.9) 701.8 2,730.4 0.0 9,669.0 1,471.4 13,614.7 2017 (598.9) (701.7) 3,195.2 0.0 0.0 465.0 2,359.6 2018 (342.1) (500.4) 3,189.1 0.0 864.4 1,603.0 4,814.0 Total ($6,248.9) $10,530.3 $32,040.9 $0.0 $33,686.4 $9,293.0 $79,301.7
____________________ Source: Commission on Government Forecasting and Accountability, Report on the Financial Condition of the Illinois Retirement Systems:
Financial Condition as of June 30, 2014. See “RECENT REPORTS AND OTHER DEVELOPMENTS REGARDING THE RETIREMENT SYSTEMS—Report of the Commission on Government Forecasting and Accountability.” Information regarding Fiscal Years 2015 through Fiscal Year 2018 was provided by the Retirement Systems.
(1) Dollars in millions. Table may not add due to rounding. (2) Investment returns beginning Fiscal Year 2009 based on Asset Smoothing Method. (3) To determine whether employer contributions represented an increase or decrease in UAAL, such contributions are measured against
contributions based on the Normal Cost plus interest. If employer contributions exceed Normal Cost plus interest, the UAAL will decrease. If employer contributions are less than Normal Cost plus interest, the UAAL will increase.
(4) Other factors include, but are not limited to, higher or lower incidences of retirement, disability, in-service mortality, retiree mortality or terminations than assumed.

E-29
PROJECTION OF CONTRIBUTIONS AND FUNDED STATUS
Table E-14 provides a projection of the State’s Required Annual Statutory Contribution and Table E-15 provides a projection of the Actuarial Value of Assets, the Actuarial Accrued Liability, the UAAL and the Funded Ratio throughout the life of the Statutory Funding Plan. These projections are forward-looking statements regarding future events and are based on the actuarial assumptions contained in the Statutory Funding Plan and assumptions made regarding such future events, including the assumption that all projected contributions to the Retirement Systems are made as required. No assurance can be given that the assumptions underlying these projections will reflect actual experience of the Retirement Systems. In the event that the Retirement Systems’ experience is different from these assumptions, no assurance can be given that such experience will not cause material changes to the data presented in this table. Specifically, as described in “ACTUARIAL ASSUMPTIONS—General” above, recent actuarial assumption changes by TRS and SERS will increase the State’s contribution to the Retirement Systems in future years.
TABLE E-14 - PROJECTED REQUIRED ANNUAL STATUTORY CONTRIBUTIONS TO THE RETIREMENT SYSTEMS(1)
Fiscal Year
Projected Required Annual Statutory Contributions(1)
2019 $ 8,431 2020 9,251 2021 9,727 2022 10,157 2023 10,379 2024 10,629 2025 10,877 2030 12,313 2035 14,711 2040 16,746 2045 18,933
____________________ Source: Annual Actuarial Valuations of the Retirement Systems as of June 30, 2018. (1) Dollars in millions. Excludes, with respect to TRS and SURS, contributions from trust funds and
federal funds and, with respect to TRS, minimum retirement allowances.

E-30
TABLE E-15- PROJECTION OF FUTURE RETIREMENT SYSTEMS FUNDING STATUS (1)
Fiscal Year Actuarial Value
of Assets(2)
Actuarial Accrued Liability
Unfunded Accrued Actuarial Liabilities (UAAL)
Funded Ratio
(a) (b) (b-a) (a/b)
2019 $ 90,898 $ 229,348 $138,450 39.6% 2020 95,079 235,785 140,706 40.3% 2021 100,523 242,145 141,622 41.5% 2022 105,613 248,534 142,921 42.5% 2023 110,606 254,817 144,211 43.4% 2024 115,681 260,971 145,290 44.3% 2025 120,826 266,969 146,143 45.3% 2030 148,296 293,949 145,653 50.4% 2035 182,002 314,244 132,242 57.9% 2040 229,170 326,296 97,126 70.2% 2045 297,856 330,953 33,097 90.0%
____________________ Source: Annual Actuarial Valuations of the Retirement Systems as of June 30, 2018. (1) Dollars in millions. (2) Measured in accordance with the Asset Smoothing Method. See discussion of the Asset Smoothing
Method under “ACTUARIAL METHODS—Actuarial Value of Assets.”
2010 LEGISLATION MODIFYING PENSION STRUCTURE The State has not provided significant benefit enhancements for Retirement System members since 2003.
On March 24, 2010, the State of Illinois enacted Public Act 96-0889 (“PA 96-889”). PA 96-889 provided for significant reforms to the Retirement Systems, most notably by establishing a “two-tier” pension system expected to reduce pension payments for employees who become members of the Retirement Systems after January 1, 2011 (“Tier Two Employees”), as compared to those provided to State employees who commenced employment prior to January 1, 2011 (“Tier One Employees”). PA 96-889 did not impact persons that first became members or participants prior to its effective date of January 1, 2011. An additional tier of employees, hereinafter defined as Tier Three Employees, was created by Public Act 100-23. See “—2017 LEGISLATION MODIFYING PENSION STRUCTURE” herein.
Taken independently of other legislative or market effects, the reduced benefits afforded new hires by PA 96-889 are expected to reduce the growth in the Actuarial Accrued Liability, the UAAL and the Required Annual Statutory Contribution. In calculating the Actuarial Accrued Liability, the actuaries make assumptions about future benefit levels. As a greater percentage of the State’s workforce is covered by PA 96-889, the value of future benefits is expected to decrease and the Actuarial Accrued Liability is expected to decrease. Consequently, the UAAL is expected to decrease and the Funded Ratio to increase. As the growth in the UAAL slows, the Required Annual Statutory Contribution is expected to decline as the amount of UAAL to be amortized decreases.
Because the actuarial calculations look to the future to determine the amount of assets and liabilities that will accumulate over time, the reduction in future benefits under PA 96-889 caused an immediate reduction in the State’s required contribution to the Retirement System for Fiscal Year 2011 under the current Statutory Funding Plan after recertification pursuant to Public Act 96-1497. In the long-term, this decrease in future benefits is expected to reduce the sum of contributions required to reach the applicable

E-31
statutorily required target Funded Ratio because the State’s liability for benefits is expected to decrease as a greater number of employees earn lower benefits, assuming a relatively static pool of employees. In the short-term, however, these decreased contributions are expected to have the effect of increasing the UAAL because the majority of employees earning benefits in the short-term will earn those benefits under the provisions of the former plan. Therefore, although the cost of benefits will not change dramatically until a large portion of employees are covered by the new benefits, in the short-term the amount of the Required Annual Statutory Contribution will decrease, increasing the UAAL and decreasing the Funded Ratio. The Retirement Systems currently project that the number of Tier Two Employees will exceed the number of Tier One Employees beginning in the fiscal years as follows: (i) for TRS, Fiscal Year 2025; (ii) for SERS, Fiscal Year 2022; (iii) for SURS, Fiscal Year 2021; (iv) for GARS, Fiscal Year 2019; and (v) for JRS, Fiscal Year 2021.
2013 LEGISLATION MODIFYING PENSION STRUCTURE PA 98-0599 was signed into law on December 5, 2013 and provided for changes to funding levels, automatic annual increases, retirement ages and employee contributions for TRS, SERS, SURS and GARS. PA 98-0599 was scheduled to take effect on June 1, 2014. However, PA 98-0599 was declared unconstitutional and void in its entirety by the Illinois Supreme Court on May 8, 2015. The State did not file an appeal to the U.S. Supreme Court with respect to the Illinois Supreme Court’s determination regarding the constitutionality of PA 98-0599.
2017 LEGISLATION MODIFYING PENSION STRUCTURE
Public Act 100-23, which became effective on July 6, 2017, includes several reforms to the Retirement Systems. Specifically, Public Act 100-23: (i) establishes a new benefit plan for Tier Three Employees (as hereinafter defined), (ii) shifts certain pension costs to local employers participating in a Retirement System, and (iii) smooths changes in the State’s contributions to the Retirement Systems resulting from changes in actuarial assumptions by the Retirement Systems.
Creation of Tier 3. With respect to TRS, SURS and SERS, Public Act 100-23 creates an additional tier (“Tier 3”) of benefits and related contributions. Employees (“Tier Three Employees”) will join Tier 3 either by (1) being a new employee who elects to receive Tier 3 benefits or (2) being an existing Tier 2 employee who elects to receive Tier 3 benefits. Employees may join Tier 3 once their respective Retirement System implements the plan.
The Tier 3 plan will offer a combination of a defined benefit and defined contribution plan. The defined benefit portion of Tier 3 includes the following provisions:
• A pensionable salary cap indexed to the social security wage base (currently $132,300); • A cost of living adjustment equal to ½ of the Consumer Price Index for Urban Wage
Earners and Clerical Workers, not compounded; • A normal retirement age indexed to social security (currently age 67); • A final average salary equal to the average salary over the last ten years of an employee’s
service with the retirement annuity calculated by multiplying each year of service by the final average salary multiplied by 1.25%.
Once implemented, local employers and employees will assume the normal cost for the defined benefit costs for Tier Three Employees. Employees will contribute the lesser of the Normal Cost or 6.2% of salary for the defined benefit portion. Employers of employees who elect to participate in Tier 3 are to contribute (i) with respect to TRS and SURS employers only, the employer normal cost, plus an amount necessary to reduce the UAAL over a 30-year open amortization period, and (ii) beginning in Fiscal Year 2021, an additional 2% of the total payroll of each employee participating in Tier 3. In addition, employers of employees who elect to participate in Tier 2 in lieu of Tier 3 are to contribute (i) with respect to SURS employers only, the employer normal cost, plus an amount necessary to reduce the

E-32
UAAL over a 30-year open amortization period, and (ii) beginning in Fiscal Year 2021, an additional 2% of the total payroll of each employee participating in Tier 2 in lieu of Tier 3.
In addition to the defined benefit, Tier Three Employees will have a defined contribution plan. The defined contribution will consist of funds invested in an individual account for each employee. Employees must contribute a minimum of 4% of salary to the defined contribution portion of the Tier 3 plan. Employers must contribute no less than 2%, but no more than 6% of salary for each employee with at least one year of service with that employer.
Tier 3 does not apply to employees participating in GARS or JRS, and only applies to State employees not participating in the federal social security program, with the exception of a small number of SURS employees which will participate in social security in addition to Tier 3. Public Act 100-23 does not provide for immediate enactment of the Tier 3 plan, though it states that the respective Boards of Trustees of the Retirement Systems should implement the Tier 3 plan as soon as possible. Prior to implementation, each Retirement System must create and establish the Tier 3 plan, and such plan must be approved by the Internal Revenue Service. On and after the respective date of implementation for each Retirement System, all new participants in such Retirement System will be Tier Three Employees. Employees hired after the implementation of the combination Tier 3 plan will have the option to irrevocably elect to receive Tier 2 benefits and, with respect to SURS, the Self-Managed Plan. In addition, Tier Two Employees hired prior to the implementation of the Tier 3 plan will be provided the opportunity to irrevocably elect to become Tier Three Employees under Public Act 100-23. The Tier 3 plan was not implemented during Fiscal Year 2018. Legislation was introduced into the 100th General Assembly which certain of the Retirement Systems believe is necessary to implement the provisions of Public Act 100-23. Such legislation was not adopted by the 100th General Assembly, and has not been adopted as of the date hereof, and the Retirement Systems expect that the Tier 3 plan will not be implemented until such legislation, or similar legislation, is adopted. TRS, SURS and SERS are currently analyzing the long-term impact that Tier 3 will have on their respective financial positions. The State makes no prediction as to the impact such reform will have on the Retirement Systems or the State’s contributions to TRS, SURS and SERS going forward. Shift of Certain Pension Costs to Local Employers. With respect to TRS and SURS, Public Act 100-23 provides that the individual school districts, universities and community colleges whose employees participate in such Retirement Systems will assume certain costs of benefits upon implementation of the Tier 3 plan. On and after the Tier 3 implementation, local employers will assume the normal costs and future unfunded liabilities for Tier Three Employees and Tier Two Employees who elect to become Tier Three Employees. Beginning in Fiscal Year 2021, such employers will also be responsible for paying to the applicable Retirement System 2% of the total payroll of each employee participating in Tier 3, as well as each employee participating in Tier 2 in lieu of Tier 3. In addition, Public Act 100-23 requires individual school districts, universities and community colleges to assume the Normal Cost of benefits with respect to all employees whose salaries exceed the Governor’s salary to the extent such employee’s salary exceeds the Governor’s salary. Smoothing of State Contributions. Public Act 100-23 provides that, beginning in Fiscal Year 2018, the State’s contributions to the Retirement Systems will be calculated such that any changes in the State’s contributions to any Retirement System caused by a change in the actuarial assumptions employed by such Retirement System in preparing its Actuarial Valuation will be recognized equally over a five-year period (“Contribution Smoothing”). Furthermore, Public Act 100-23 provides that Contribution Smoothing will be retroactively applied to changes in actuarial assumptions which first applied to State contributions during Fiscal Years 2014 through 2017.

E-33
As a result of the adoption of Public Act 100-23, the Retirement Systems re-certified the State’s contribution to the Retirement Systems for Fiscal Year 2018. As a result of such recertification, the State’s contribution for Fiscal Year 2018 declined from $8,820 million to $7,911 million, a reduction of approximately $909 million. Such reduction in the State contribution was due primarily to the Contribution Smoothing and also to the shift to local school districts, universities and community colleges of the cost of benefits attributable to the portion of employee salaries in excess of the Governor’s salary. The reforms in Public Act 100-23 are expected to reduce the State’s UAAL over time. The State’s UAAL, as modified by the provisions of Public Act 100-23, has not yet been recalculated by the Retirement Systems and, as such, the State is unable to provide any information regarding revisions to the UAAL as a result of Public Act 100-23, if any, at this time.
ACCELERATED PENSION BENEFIT PAYMENT PROGRAM AND OTHER PROVISIONS UNDER PUBLIC ACT 100-0587 Public Act 100-0587, which became effective on June 4, 2018 (“P.A. 100-587”), establishes two programs pursuant to which eligible members of the Retirement Systems may forego certain benefits to which they are entitled under the Pension Code in exchange for a payment from the State. The first program, which is available to Tier 1 and Tier 2 members of the TRS, SURS and SERS meeting certain eligibility requirements set forth in P.A. 100-587, provides that an eligible member may forfeit rights to future benefit payments in exchange for an accelerated pension benefit payment equal to 60% of the present value of the pension benefit to which the member is entitled (the “Pension Buyout Program”). The second program, which is available only to Tier 1 members of TRS, SURS and SERS meeting certain eligibility requirements set forth in P.A. 100-587, provides that an eligible member may forfeit the 3%, compounded automatic annual increase (“AAI”) in exchange for (i) a delayed 1.5% non-compounded AAI and an accelerated pension benefit payment from the State equal to 70% of the difference in the present value of such AAIs (the “AAI Reduction Program” and, together with the Pension Buyout Program, the “Programs”). Each of the Programs has separate eligibility rules. To be eligible for the Pension Buyout Program, a member must (i) have terminated service, (ii) have accrued sufficient service credit to be eligible to receive a retirement annuity under the applicable article of the Pension Code, and (iii) not have received any retirement annuity under the applicable article of the Pension Code. To be eligible for the AAI Reduction Program, a member must (i) submit an application for a retirement annuity under the applicable article of the Pension Code, (ii) meet the age and service requirements for receiving a retirement annuity under the applicable article of the Pension Code and (iii) not have received any retirement annuity under the applicable article of the Pension Code. In addition, eligible members may participate in only one of the Programs. With respect to the Pension Buyout Program, P.A. 100-587 provides that eligible members may make the election to participate in such program until June 30, 2021. Such election may be made only after such member has requested a determination by the applicable Retirement System of the amount of the accelerated pension benefit payment offered pursuant to the Pension Buyout Program. With respect to the AAI Reduction Program, P.A. 100-587 directs each of the applicable Retirement Systems to implement the AAI Reduction Program. Upon the request of an eligible member, the applicable Retirement System will calculate the accelerated pension benefit payment and will offer such payment to the eligible member. Eligible members will then have the opportunity to irrevocably elect to participate in the AAI Reduction Program until June 30, 2021. Such election must be made prior to the eligible member receiving the first payment of a retirement annuity otherwise payable under the applicable article of the Pension Code.

E-34
P.A. 100-587 provides that, upon receipt by a Retirement System of an election by an eligible member to participate in either of the Programs, such Retirement System will submit a voucher to the Comptroller for payment of the applicable accelerated pension benefit payment. To finance the costs of the Programs, P.A. 100-587 authorizes the issuance of the Section 7.7 Bonds (as defined in the Official Statement) in the amount of $1,000,000,000 and establishes the State Pension Obligation Acceleration Bond Fund (the “Acceleration Fund”). The proceeds of the Section 7.7 Bonds, including the Series 2019A Bonds (as defined in the Official Statement), will be deposted into the Acceleration Fund and be used to make the accelerated pension benefit payments as described in this Section. The bond proceeds deposited into the Acceleration Fund constitute the only authorized source of funding for accelerated pension benefit payments, therefore requiring the State to issue Section 7.7 Bonds for the Programs to be operational. The State expects that the Programs will, taken independently of other factors, cause a reduction in the UAAL of the applicable Retirement Systems, however, the State is unable to quantify the amount or timing of any such reduction at this time. The State provides no assurance as to whether the Programs will be implemented or the degree to which members choose to participate in the Programs. Any reduction in the UAAL is dependent on the implementation of, participation by members in and funding of the Programs. In addition, P.A. 100-587 lowers the threshold from 6% to 3% on the annual salary increase used in final average salary calculations for active TRS and SURS members above which the employing entity, rather than the State, is responsible for paying the present value of additional retirement benefits. This provision shifts TRS and SURS retirement contributions to non-State entities but does not reduce future liabilities of such Retirement Systems. Status of the Programs. SERS began offering accelerated pension benefits, pursuant to its AAI Reduction Program, to applicants for retirement in December 2018. As of March 1, 2019, out of 1,318 applicants for retirement, 294 (22.3%) have elected the accelerated pension benefit. The average payout is $96,400, requiring a total of $28.3 million. SERS aims to begin its Pension Buyout Program in April for its nearly 4,000 inactive vested members. SERS typically administers approximately 3,000 retirements annually. TRS made its AAI Reduction Program available to retirees in January 2019. Many potential retirees have asked for a calculation of accelerated pension benefits, however, little utilization data regarding use of the accelerated payment option exists at this time. The heaviest months for retirements by TRS members are May and June. TRS aims to begin its Pension Buyout Program in May 2019 for its approximately 20,000 inactive vested members. TRS typically administers approximately 4,000 retirements annually. SURS is planning implementation of both the AAI Reduction and the Pension Buyout Program to begin on or before June 30, 2019, and will not have significant data about utilization of the accelerated payment options until Fiscal Year 2020. SURS has approximately 13,000 inactive vested members, and typically administers approximately 3,000 retirements annually.
FUTURE PENSION REFORM PROPOSALS
The Governor’s Fiscal Year 2020 Budget proposal includes several pension reform recommendations. Estimated savings from such proposed pension reforms are incorporated into the proposed Fiscal Year 2020 budget. The proposal is a multi-tiered approach to pension stabilization that maintains promised levels of benefits to retirees. The components of the proposal are to:

E-35
• Issue $2 billion in pension bonds (the “2020 Pension Bonds”) to increase the assets held by the Retirement Systems. None of the proceeds of the 2020 Pension Bonds would be used for current year pension contributions.
• Reamortize the accrued liabilities of the Retirement Systems by extending the target date for 90% funding by seven years from June 30, 2045, to June 30, 2052 so that annual contributions today can be set at a more manageable level. This change is estimated, when considered independently of all other facts, to reduce the Fiscal Year 2020 Required Annual Statutory Contribution as reported in Table E-14 above by more than $900 million, including a reduction of $878 million in the General Funds contribution for the fiscal year.
• Make the Programs permanent which, when considered independently of other factors, will reduce the Retirement Systems’ UAAL and increase the Retirement Systems’ Funded Ratio.
• If the progressive income tax proposed by the Governor is enacted, dedicate $200 million annually of the tax revenues generated thereby for supplemental contributions to the Retirement Systems in excess of the Required Annual Statutory Contribution. The progressive income tax proposal will require a constitutional amendment approved by 3/5ths of each house of the General Assembly and submission to and approval by the voters of the State at a general election no earlier than November 3, 2020.
• Study and recommend State assets that could be assigned to the Retirement Systems to enhance the value of State’s pension funds.
The Governor has cautioned the General Assembly not to choose only a portion of the proposals, but instead, to consider all of the proposals as a complete package. The retirement systems have not prepared financial analyses of the Governor’s reform proposals. Legislation has not been introduced with respect to these reforms. The State provides no assurance as to whether any of such reforms will be implemented.
RECENT REPORTS REGARDING THE RETIREMENT SYSTEMS
State Actuary’s Fiscal Year 2018 Report
By January 1 of each year, the State Actuary is required to issue a preliminary report providing a review of the actuarial assumptions used by the Retirement Systems in preparing their proposed certification of the amount necessary to pay the Required Annual Statutory Contribution. The position of State Actuary is within the Office of the Auditor General and responsible for reviewing actuarial practices, assumptions, and valuations of the actuaries of the Retirement Systems. The State Actuary’s Fiscal Year 2018 report on the actuarial assumptions and valuations of the Retirement Systems is available on the State Auditor General’s website. See APPENDIX F—WEBSITE INDEX. The assumptions contained in the 2018 Actuarial Valuation reports of the Retirement Systems were determined to be generally reasonable by the State Actuary, and the State Actuary did not recommend any changes to these assumptions. [However, recommendations were made for additional disclosure to the 2017 Actuarial Valuations, for changes to the formula for funding the Retirement Systems set forth in the Pension Code to fully fund future plan benefit accruals, for the Retirement Systems set forth in the Pension Code to include stress tests in the Actuarial Valuations, for the conduct of periodic, independent, actuarial audits by SERS, JRS, and GARS, and for each of the Retirement Systems, with the exception of TRS, to review the manner in which such Retirement Systems phase-in changes in assumption as a result of Public Act 100-23 or demonstrate with additional disclosures that such methods currently used to phase-in such changes produces the result intended by Public Act 100-23.] The Board of each Retirement System must consider all recommendations of the State Actuary; however, no assurance can be given that any recommendations

E-36
will be adopted. The responses of each System to the recommendations of the State Actuary are contained in Appendix C of the aforementioned report.
Report of the Commission on Government Forecasting and Accountability
The Commission on Government Forecasting and Accountability (“COGFA”) prepared a report dated March 2018, on the financial condition of the Retirement Systems as of June 30, 2017 (the “COGFA Report”). COGFA is a bipartisan and bi-cameral legislative commission whose purpose is to provide the General Assembly with information relevant to the State economy, taxes, and other sources of revenue and debt obligations of the State. Among COGFA’s list of specific responsibilities is to make an annual estimate of public pension funding requirements and to prepare pension impact notes. Furthermore, COGFA has a mandate to report to the General Assembly on economic trends in relation to long-range planning and budgeting and to study and make such recommendations as it deems appropriate on local and regional economic and fiscal policies and on federal fiscal policy as the same may affect the State. As a result of these responsibilities, COGFA issues several reports on an annual basis, including the COGFA Report, which provides an overview of the financial condition of the Retirement Systems.
The COGFA Report provides significant information on the funded status of the Retirement Systems, historical and projected information with respect to each of the Retirement Systems and an exhaustive history of pension legislation. COGFA does not make findings in the COGFA Report. The COGFA Report is available from COGFA’s website listed in APPENDIX F—WEBSITE INDEX. The State makes no representations nor expresses any opinion on the COGFA Report.
SEC ORDER
The State was originally contacted in September 2010 by the Securities and Exchange Commission (the “SEC”) regarding a non-public inquiry into communications by the State relating to the financial effects of PA 96-889 on Illinois public pensions, including communications relating to the potential savings or reductions in contributions by the State to the Illinois public pensions. The SEC inquiry ultimately turned to disclosures relating to the Statutory Funding Plan.
On March 11, 2013, the SEC instituted administrative proceedings and imposed a cease-and-desist order (the “Order”). The Order can be found on the Electronic Municipal Market Access website. See APPENDIX F—“WEBSITE INDEX” herein. In its Order, the SEC found that, between 2005 and March 2009, the State acted negligently and (i) misled bond investors by omitting to disclose information about the adequacy of the Statutory Funding Plan and the risks created by the State’s structural underfunding of its pension obligations, (ii) misled bond investors about the effect of changes to the Statutory Funding Plan, including the State’s failure to make the full pension contributions in 2006 and 2007 and (iii) omitted material information which rendered certain statements misleading to bond investors regarding the State’s ability to fund its pension obligations or the impact of the State’s pension obligations on the State’s financial condition. In agreeing to the Order, the State did not admit or deny the SEC’s findings in the Order. Under the terms of the Order, the State was not required to pay any civil fines or penalties, and the SEC noted that it considered the State’s cooperation during the inquiry as well as the remedial measures instituted by the State to ensure compliance with its disclosure obligations under the federal securities laws, as described in the Order.
Prior to the SEC inquiry and in response to statements made by the SEC in an enforcement action against the State of New Jersey (SEC Rel. No. 9135, August 18, 2010), the State engaged outside counsel to assist the State in reviewing the enforcement action against New Jersey, to update certain of the information contained in this Appendix and to draft the disclosure policies and procedures set forth in the following subsection. The State has continued to engage Disclosure Counsel to assist the State in updating the information contained in this Appendix and to implement the disclosure policies and procedures set forth in the following subsection.

E-37
PENSION DISCLOSURE POLICIES AND PROCEDURES
The State has reviewed, evaluated, and enhanced its pension disclosure process by instituting formal, written policies and procedures. The State’s written policies and procedures, among other things, established a committee within the GOMB consisting of GOMB employees (the “Disclosure Committee”) to oversee the pension disclosure process. The GOMB Director of Capital Markets serves as chairperson of the Disclosure Committee, and the General Counsel of the GOMB serves as an ex-officio member. The Disclosure Committee has primary responsibility for drafting, editing and updating the State’s pension disclosure. Prior to release of the pension disclosure in an official statement or at the time of an update as mandated in the policies and procedures, the pension disclosure is submitted to the Retirement Systems, COGFA, the Office of the Comptroller and the Office of the Attorney General for their review and comment.
In addition, the State has implemented an annual mandatory training program for the Disclosure Committee and the other GOMB employees involved in the disclosure process. The training is intended to ensure compliance with the State’s disclosure obligations under the federal securities laws.
OTHER POST-EMPLOYMENT BENEFITS PLAN DESCRIPTION The State Employees Group Insurance Act of 1971 (“Group Insurance Act”), as amended, authorizes the State to provide health, dental, vision, and life insurance benefits for certain retirees and their dependents. Substantially all State and State university component unit employees become eligible for these other postemployment benefits (“OPEB”) if they become annuitants of one of the State sponsored pension plans. The Department of Central Management Services (“CMS”) administers these benefits for annuitants with the assistance of the Retirement Systems. The portions of the Group Insurance Act related to OPEB established a cost-sharing multiple-employer defined benefit OPEB plan with a special funding situation for employees of the State’s component unit universities.
FUNDING POLICY AND ANNUAL OPEB COST The State contributes toward the cost of an annuitant’s coverage under the basic program of group health, dental, and vision benefits an amount equal to five percent of that cost for each full year of creditable service up to a maximum of one hundred percent for an annuitant with twenty or more years of creditable service. The amount the State contributes is determined from negotiations with the collective bargaining units within the various Retirement Systems. Therefore, the benefits provided and contribution amounts are subject to periodic changes.
The State is not required to fund the plan other than the pay-as-you-go amount necessary to provide the current benefits to retirees. However, the appropriated amount has been insufficient in recent years resulting in a backlog of reimbursements to health care providers and retirees.
The State’s Annual OPEB Cost is calculated pursuant to GASB Statement No. 45 (“GASB 45”). GASB 45 funding requirements differ significantly from the pay-as-you-go funding method used by the State to make contributions to the plan. Therefore, the actual contributions made by the State to the plan differ from the Actuarially Required Contribution and the Annual OPEB Cost. The State’s Annual OPEB Cost for the prior year and related information is included in Tables E-16, E-17 and E-18.

E-38
TABLE E-16 NET OTHER POST EMPLOYMENT BENEFITS
OBLIGATION FISCAL YEAR 2017 ($ IN MILLIONS)
Actuarially Required Contribution (Net of ARC adjustments) $ 2,592 Plus: Interest on Net OPEB Obligations 533 Adjustment to ARC (507) Annual OPEB Cost $ 2,617 Benefits paid during the year (337) Increase in Net OPEB Obligations $ 2,281 Net OPEB Obligations at June 30, 2016 14,204 Net OPEB Obligations at June 30, 2017 $16,485
_________ Source: The CAFR.
TABLE E-17 OTHER POST EMPLOYMENT BENEFITS – FISCAL YEARS 2013-2017
($ IN MILLIONS) 2013 2014 2015 2016 2017
Annual Required Contribution1 $2,378 $2,344 $2,292 $2,415 $2,617 Benefits paid during the year 625 905 810 185 337 Increase in Net OPEB Obligations 1,753 1,439 1,482 2,230 2,280 Net OPEB Obligations Balance 9,053 10,492 11,975 14,204 16,485 _________ Source: Illinois State Employment Group Insurance Program GASB No. 45 Actuarial Valuation Report and the CAFR. 1 The Annual Required Contribution numbers include interest on Net OPEB Obligations and adjustments to the Annual Required
Contributions.
GASB Statement No. 45 requires the calculation of the OPEB Actuarial Accrued Liability (“AAL”) which is the actuarial present value of future plan benefits earned as of the valuation date. The AAL was $38,138 million at the end of Fiscal Year 2016. The AAL has not been calculated for Fiscal Year 2017. The OPEB Actuarially Required Contribution (“ARC”) is an amount that is actuarially determined in accordance with the requirements so that, if paid on an ongoing basis, it would be expected to provide sufficient resources to fund both the normal cost for each year and the amortized unfunded AAL over the amortization period of thirty years.
The State will adopt GASB Statement No. 75 (“GASB 75”) beginning with the Fiscal Year ending June 30, 2018. GASB 75 reforms the manner in which OPEB is accounted for and presented in the financial statements of an employer, such as the State. The State expects that the adoption of GASB 75 will result in changes to the presentation of the State’s OPEB liability, as set forth herein, and will also result in changes to the amount recognized by the State as a liability with respect to OPEB in the State’s CAFR beginning with the Fiscal Year ending June 30, 2018.

E-39
TABLE E-18 OTHER POST EMPLOYMENT BENEFITS UNFUNDED
ACTUARIAL ACCRUED LIABILITY – FISCAL YEARS 2012-2016 ($ IN MILLIONS)
2012* 2013 2014 2015** 2016 Unfunded Actuarial $35,200 $34,488 $33,051 $34,766 $38,138 Accrued Liability _________ Source: Illinois State Employment Group Insurance Program GASB No. 45 Actuarial Valuation Report and the CAFR. Note: The GASB No. 45 Actuarial Valuation Report is produced biennially, however, beginning in Fiscal Year 2015, the report is produced as
of June 30 of the previous fiscal year. * Estimation in the succeeding year’s report. ** Estimation in the preceding year’s report.

[THIS PAGE INTENTIONALLY LEFT BLANK]

F-1
APPENDIX F
WEBSITE INDEX
Organization or Department Website Address Description of Website
State of Illinois http://www.illinois.gov/ Lead portal for all State informationGovernor’s Office of
Management and Budget http://www.illinois.gov/gov/budget/ https://www2.illinois.gov/sites/budget/Pages/PolicyReports.aspx
Lead portal for operating budgets, economic and fiscal reports and three year projections and quarterly reports
Fiscal Year 2020 Budget Book https://www2.illinois.gov/sites/budget/Pages/default.aspx Link to the Governor’s Budget BookState of Illinois Capital
Markets http://www.illinois.gov/gov/budget/capitalmarkets/Pages/default.aspx Lead portal to the State of Illinois Capital Markets
Illinois Administrative Code http://www.ilga.gov/commission/jcar/admincode/080/08002200sections.html Link to Illinois General Assembly’s Administrative Code database - CMS State Employees Group Insurance Program Retiree Premium Contributions
Comptroller http://www.illinoiscomptroller.gov/ Lead portal for all Comptroller based information Comptroller (CAFR) https://illinoiscomptroller.gov/financial-data/find-a-report/comprehensive-reporting/comprehensive-annual-financial-report-cafr/ Link to CAFR LibraryComptroller, Traditional
Budgetary Financial Report https://illinoiscomptroller.gov/financial-data/find-a-report/budgetary-reporting/traditional-budgetary-financial-report/ Link to the Traditional Budgetary Financial Report
General Assembly http://www.ilga.gov/ Lead portal to the Illinois General Assembly Auditor General http://www.auditor.illinois.gov/ Lead portal to the Auditor GeneralCollege Illinois http://www.collegeillinois.org/Downloads/Actuarial-Soundness-Report-2018.pdf Link to the College Illinois actuarial report
Tax Handbook http://www.ilga.gov/commission/lru/2018TaxHandbook.pdf Legislative Research Unit handbook on all Illinois taxes
Illinois Department of Revenue
http://iltax.org/ Lead portal to the Department of Revenue
Retirement Systems: TRS http://trsil.org/ Lead portal to Teachers’ Retirement System SURS http://www.surs.org/ Lead portal to State Universities Retirement System SERS http://www.srs.illinois.gov/sers/home_sers.htm Lead portal to State Employees’ Retirement System JRS http://www.srs.illinois.gov/Judges/home_jrs.htm Lead portal to Judges’ Retirement System GARS http://www.srs.illinois.gov/gars/home_gars.htm Lead portal to General Assembly Retirement System
Commission on Government Forecasting and Accountability
http://cgfa.ilga.gov/ Lead portal to COGFA, contains its report on the financial condition of the Retirement Systems
Illinois State Board of Investment
http://www.isbinvestment.com Lead portal to the Illinois State Board of Investment
Illinois Department of Central Management Services
http://www.cms.illinois.gov/ Lead portal to the Illinois Department of Central Management Services
State Actuary Report http://www.auditor.illinois.gov/Other-Public-Documents/State-Actuary-Reports.asp Link to the Auditor General’s State Actuary Reports
Electronic Municipal Market Access
http://emma.msrb.org/ Lead portal to MSRB’s EMMA

[THIS PAGE INTENTIONALLY LEFT BLANK]

G-1
APPENDIX G
ACCOUNTING PRACTICES USED IN STATE FINANCIAL INFORMATION MEASUREMENT BASES Financial information reported by the State is prepared and reported under one of three measurement bases. The cash basis of accounting recognizes revenues when cash funds are received and ordered into the State Treasury by the Comptroller during the fiscal year. Disbursements are recognized when vouchers have been approved and released for payment by the Comptroller, again during the fiscal year. The budget basis of accounting recognizes revenues using the same approach and timing as the cash basis (with the exception of transfers in when the prior fiscal year had carried over transfers due to the General Funds). Expenditures are recognized when the legal liability is incurred and sufficient appropriation authority exists. Budget basis expenditures also include disbursements made during the two month “lapse period” (for most appropriations) starting July 1 of the subsequent fiscal year. However the liability must have been incurred during the prior fiscal year and sufficient remaining appropriation authority from that fiscal year must also exist. The GAAP (Generally Accepted Accounting Principles) basis of accounting recognizes revenues that were earned during the fiscal year but are actually collected and deposited during the fiscal year plus the first 60 days of the subsequent fiscal year. GAAP basis expenditures are recognized when the legal liability is incurred during the fiscal year, regardless of whether remaining appropriation authority existed from that fiscal year and irrespective of the date when the disbursement is made. Of particular note, Medicaid and group health insurance spending represent the primary instances of expenditures where appropriation authority may have been exceeded but are nevertheless disbursed by statutory authorization (i.e., Section 25 Liabilities) that permits the State to pay such liabilities using available appropriation of the subsequent fiscal year. DIFFERENCES BETWEEN ACCOUNTING PRACTICES IN TRADITIONAL BUDGETARY FINANCIAL
REPORT AND CAFR Key differences between the accounting practices used in the TBFR and GAAP utilized in preparing the fiscal year CAFR, include the following:
Revenue Recognition: • The TBFR recognizes as revenues those amounts collected and deposited by June 30
of each fiscal year. • The CAFR recognizes as revenues amounts earned but collected and deposited no later
than 60 days after the end of the fiscal year. Expenditure and Liability Recognition: • The TBFR recognizes as expenditures and liabilities only those amounts that are
appropriated for that fiscal year, incurred by June 30, and paid no later than December 31 following the end of the fiscal year.

G-2
• The CAFR recognizes all expenditures that are incurred and paid by June 30, or that are legal liabilities of that fiscal year, even if such amounts exceed the appropriations for that fiscal year.
• “Section 25 Liabilities” reflect a portion of the difference in TBFR versus CAFR expenditures when insufficient appropriations exist for incurred liabilities. Section 25 refers to statutory authorization that permits the Comptroller to pay such liabilities during the subsequent fiscal year, as shown in Table 5 in the Official Statement, “STATE FINANCIAL INFORMATION—ACCOUNTS PAYABLE–TABLE 5.”
Statutory Transfers: • The TBFR recognizes transfers in and transfers out on a modified accrual accounting
basis wherein the transfer is recognized if statutorily required during a fiscal year even though the actual transfer may occur during the subsequent fiscal year. Under GAAP accounting, the CAFR only recognizes statutory transfers that have been made in cash during the fiscal year.
Pension Expenditures: • The TBFR reflects statutorily required contributions. Amounts shown in Tables 3 and
4 represent only the General Funds portion (approximately 89% of the total required contribution) as certified by each of the five State pension systems net of the debt service on the Fiscal Year 2003 General Obligation Pension Funding Bonds pursuant to the authorizing statute, net of contributions from other State funds with payroll costs, and net of transfers from the State’s Unclaimed Property Trust Fund.
• For additional differences between statutory funding requirements and GAAP and other important disclosures of the pension obligations of the State, see APPENDIX E—PENSION AND OTHER POST EMPLOYMENT BENEFITS.
Scope of General Funds: • The TBFR and Tables 3 and 4 in the Official Statement, “STATE FINANCIAL
INFORMATION—FINANCIAL RESULTS: FY 2014-FY 2018” and Table G-1 reflect the General Revenue Fund, the Common School Fund, the General Revenue-Common School Special Account Fund and the Education Assistance Fund.1
• The CAFR data in Table G-2 also includes the Budget Stabilization Fund, Medicaid Provider Assessment Program Funds, and certain other funds as more fully described in Note 1 therein. See also “TABLE G-2–Note 1–Cash/Budget to GAAP Perspective Differences” below.
Table G-1 effectively reflects an operating statement that explains the changes during Fiscal Year 2018 in both cash balance as well as fund balance, reflecting the cash basis and budget basis,
1 Prior to Fiscal Year 2018, the State’s General Funds included four funds – the General Revenue Fund, the
Education Assistance Fund, the Common School Fund, and the General Revenue-Common School Special Account Fund. Public Act 100-23 amended the State Budget Law (15 ILCS 20/50-40) to add the Fund for the Advancement of Education and the Commitment to Human Services Fund (both of which receive a portion of State income tax receipts) and the Budget Stabilization Fund to the State definition of General Funds. Tables, including those in the TBFR, in this Official Statement for Fiscal Year 2017 and earlier reflect the original definition of General Funds, except where noted.

G-3
respectively. The left hand column, labeled “Available Balance Concept,” reflects the cash basis results. That column details the change in Available Cash Balance at the beginning of the fiscal year, concluding with the Available Cash Balance at the end of the fiscal year. Total Revenues were detailed in Table 3, while Expenditures reflect cash disbursed during Fiscal Year 2018 which includes prior year lapse period expenditures (detailed in the middle column) as well as expenditures of Fiscal Year 2018. The right hand column of Table G-1, labeled “Budgetary Balance Concept,” reflects the budget basis results and change in budget basis fund balance during Fiscal Year 2017. Total budget basis revenues are the same as cash basis revenues for the fiscal year (with the exception of Transfers In when the prior fiscal year had carried over transfers due to the General Funds), both reflecting cash receipts during the fiscal year. Budget basis expenditures are disbursements for the Fiscal Year appropriations and statutory transfers. Total expenditures are detailed in Table 4. Lapse period expenditures are listed in the middle column of Table G-1. Lapse period expenditures are in substance “accounts payable” and the end of column reflects the basic accounting equation of “cash less accounts payable equals budget basis fund balance.” The lapse period amount (i.e., budget basis accounts payable) is subtracted from the ending cash balance resulting in a deficit or surplus.

G-4
TABLE G-1 GENERAL FUNDS SUMMARY OF TRANSACTIONS
FISCAL YEAR ENDED JUNE 30, 2018 AVAILABLE BALANCE CONCEPT BUDGETARY BALANCE CONCEPT
BEGINNING BALANCES $ 1,077 ....................................... Available Cash Balance on June 30, 2017
Less Lapse Period – Warrants Issued from Fiscal Year 2017 Appropriations and Fiscal Year 2017 Transfers Out:
Operations ...................................................... $ 816 Awards and Grants......................................... 507 Permanent Improvements .............................. 2 Vouchers Payable (June 30) .......................... 6,939 Net Transfers Payable (June 30) .................... 797 Total .................................................................... $9,061
Fund Balance – Budgetary Basis to begin
Fiscal Year 2018 ............................................................................................ $ (7,984) 291 ...................................... Adjustment for Fund Classification Changes ..................................................... 21 $ 1,368 ...................................... Adjusted Balances $(7,963)
PLUS REVENUES State Sources: Cash Receipts: $19,742 ....................................... Income Taxes ......................................... $19,742 7,810 ....................................... Sales Taxes ......................................... 7,810 3,451 ....................................... Other Sources ......................................... 3,451 5,210 ....................................... Transfers In ......................................... 5,015 36,213 ....................................... Total, State Sources ......................................... $36,018 Federal Sources: $ 5,237 ....................................... Cash Receipts ......................................... $ 5,237 1 ....................................... Transfers In ......................................... 1 $ 5,238 ....................................... Total, Federal Sources ......................................... $ 5,238
$41,451 ....................................... Total, Revenues ......................................... $41,256
LESS EXPENDITURES From FY 2018 Appropriations and Lapse Period From Fiscal Year 2018 Appropriations Spending from FY 2017 Appropriations
$ 11,464 ....................................... Operations ......................................... $ 12,059 23,626 ....................................... Awards and Grants ......................................... 23,341 5 ....................................... Refunds ......................................... 5 5 ....................................... Permanent Improvements ......................................... 4 (3,721) ...................................... Vouchers Payable Adjustment ......................................... 0 (28) ...................................... Prior Year Adjustments ......................................... (28)
$38,793 ....................................... Total, Warrants Issued ......................................... $35,381
3,901 ....................................... Transfers Out ......................................... 3,610
$42,694 ....................................... Total, Expenditures ......................................... $38,991
EQUALS ENDING BALANCES
$ 125 ..................................... Available Cash Balance on June 30, 2018
Less Lapse Period – Warrants Issued from Fiscal Year 2018 Appropriations and Fiscal Year 2018 Transfers Out:
Operations.................................................... $ 1,418 Awards and Grants ...................................... 485 Permanent Improvements ............................ 1 Vouchers Payable (June 30) ........................ 3,218 Net Transfers Payable (June 30) ................. 701 Total ........................................................ $5,823
Fund Balance – Budgetary Basis to begin
Fiscal Year 2019 ............................................................................................. $ (5,698)
Source: Traditional Budgetary Financial Report Fiscal Year 2018; unaudited.

G-5
Table G-2, which is presented below, is a General Funds Reconciliation among cash, budgetary and GAAP basis of accounting for Fiscal Year 2017. The information in this table is contained within the State’s CAFR and, as such, information with respect to Fiscal Year 2018 will not be able until the Fiscal Year 2018 CAFR is released. See “AUDITED FINANCIAL STATEMENTS” herein.
TABLE G-2 STATE OF ILLINOIS
GENERAL FUNDS RECONCILIATION – FISCAL YEAR 2017 ($ in thousands)
Cash Basis
Adjustments for Budgetary
Basis Budgetary
Basis Adjustments
for GAAP GAAP Basis Revenues:
Income Taxes (net) $14,054,094 - $14,054,094 $ (1,229,660) $ 12,824,434 Sales Taxes (net) 8,042,759 - 8,042,759 5,144 8,047,903 Public Utility Taxes (net) 884,212 - 884,212 96,755 980,967 Federal government (net) 2,450,998 - 2,450,998 8,780,441 11,231,439 Other (net) 2,387,672 - 2,387,672 3,716,043 6,103,715
Total revenues $27,819,735 - $27,819,735 $11,368,723 $ 39,188,458 Expenditures:
Current: Health and Social Services $ 367,200 $ 222,581 $ 589,781 $ 22,719,792 $ 23,309,573 Education 13,185,602 1,458,564 14,644,166 (834,878) 13,809,288 General Government 1,603,777 83,404 1,687,181 271,898 1,959,079 Employment and Economic Development 3,352 3,490 6,842 110,998 117,840
Transportation - - - 554,591 554,591 Public Protection and Justice 526,883 148,270 675,153 1,976,875 2,652,028 Environment and Business Regulation 1 (1) - 165,616 165,616
Debt Service: Principal - - - 2,150 2,150 Interest - - - 495 495
Capital Outlays 934 (507) 427 52,879 53,306 Total expenditures $ 15,687,749 $ 1,915,801 $ 17,603,550 $ 25,020,416 $ 42,623,966 Excess of revenues over expenditures
$ 12,131,986 $ (1,915,801) $ 10,216,185 $ (13,651,693) $ (3,435,508)
Other sources (uses) of financial resources: Transfers-in $ 8,253,676 $ 210,178 $ 8,463,854 $ (6,748,665) $ 1,715,189 Transfers-out (10,624,854) (689,764) (11,314,618) 8,013,530 (3,301,088)Capital lease financing - - - 1,123 1,123
Net other (uses) of financial resources $ (2,371,178) $ (479,586) $ (2,850,764) $ 1,265,988 $ (1,584,776)
Budgetary funds – non-budgeted accounts $ (8,928,933) $ (2,878,812) $(11,807,745) $ 11,807,745 $ -
Excess of revenues over expenditures and net other (uses) of financial resources 831,875 (5,274,199) (4,442,324) (577,960) (5,020,284)
Fund balances (deficit), July 1, 2016 $ 245,530 $ (3,787,409) $ (3,541,879) $ (6,049,340) $ (9,591,219)Increase (decrease) for changes in inventories - - - (110) (110) Fund balances (deficit), June 30, 2017 $ 1,077,405 $ (9,061,608) $ (7,984,203) $ (6,627,410) $(14,611,613)
Source: Illinois Office of the Comptroller

G-6
GENERAL FUNDS RECONCILIATION–TABLE G-2 Table G-2 reconciles the three measurement bases used by the State: cash basis, budget basis and GAAP basis. As described above, Tables 3 and 4 in the Official Statement, “STATE FINANCIAL INFORMATION–FINANCIAL RESULTS: FY 2013-FY2017—Tables 3 and 4” and Table G-1 above reflect underlying detail between the cash and budget bases. Table G-2 draws the revenues and expenditures from those tables and incorporates GAAP basis revenues and expenditures drawn from the Fiscal Year 2017 CAFR. Two adjustment columns are also incorporated in Table G-2 that detail the amounts necessary to adjust revenues and expenditures from cash basis to budget basis and then from budget basis to GAAP basis amounts. Table G-2 also reports the excess of revenues over expenditures (i.e., operating surplus or deficit) for Fiscal Year 2017 for the three bases equaling $832 million surplus for cash basis, $4.432 billion deficit for budget basis and $5.020 billion deficit for GAAP basis. Similarly, ending cash basis fund balance surplus of $1.077 billion, budget basis fund balance deficit of $7.984 billion and GAAP basis fund balance deficit of $14.612 billion, are shown in the bottom line of Table G-2. While Table G-2 only incorporates select GAAP basis data, the complete CAFR for Fiscal Year 2017, prepared in accordance with GAAP, has been filed on EMMA and is incorporated in this Official Statement by reference. Such report is also available upon request from the Comptroller at (217) 782-6000 or from the Comptroller’s webpage. See APPENDIX F—WEBSITE INDEX. The CAFR for Fiscal Year 2017 was prepared by the Comptroller and examined and certified by the State Auditor General. For Fiscal Year 2017, the Auditor General has expressed an unqualified opinion on the CAFR. When reviewing Table G-2, the following explanatory notes should be considered in connection with the review of the CAFR for Fiscal Year 2017 (all amounts are presented in thousands of dollars). Note 1 – Cash-Budget to GAAP Perspective Difference On the GAAP basis, the Medicaid Provider Assessment Program Funds, the Income Tax Refund Fund and various other funds are reported as part of the General Fund; whereas, they are not considered part of the General Fund on the budgetary basis or the cash basis. During Fiscal Year 2017, the State operated without a complete budget resulting in significant payments pursuant to various court orders. These court-ordered payments have been reported on a cash and budgetary basis under the “Budgetary Funds - Nonbudgeted Accounts” line item versus the individual functional expenditure line items. Note 2 – Cash to Budget Adjustments The budgetary basis fund balance deficit of $7,984,203 equals the June 30, 2017 cash balance of $1,077,405 less cash lapse period expenditures and transfers-out of $9,061,608. Adjustments from the cash basis of accounting for Fiscal Year 2017 to the budgetary basis include adding Fiscal Year 2017 lapse period spending and subtracting Fiscal Year 2016 lapse period spending. Lapse period expenditures are payments between July 1 – August 31 for services received and for goods “encumbered” (ordered or contracted for) on or before June 30 and received no later than August 31 which are paid from Fiscal Year 2017 “lapsing accounts.” Public Act 97-0691 extended the lapse period to December 31 for Fiscal Year 2013 and future fiscal years for medical assistance payments of the Department of Healthcare and Family Services. Lapse period transfers are statutory transfers approved on or prior to June 30, 2017 but not made until after June 30, 2017.
G-7
Note 3 – Budget to GAAP Adjustments A reconciliation of the budgetary basis vs. GAAP is presented in the Notes to Required Supplemental Information in the CAFR. Significant differences noted in the financial statements include recording accounts receivable, unavailable revenue and accounts payable at year-end. Accounts payable include liabilities which will be paid from future year appropriations (e.g., income tax refunds, Healthcare and Family Services medical reimbursements and payments to local school boards for State Board of Education reimbursement programs). There were also classification differences between the budgetary basis and GAAP. Interest paid on income tax refunds is reported as general government expenditures for GAAP reporting purposes and as a reduction of revenues in the budgetary presentation. In addition, transfers from the General Revenue Fund to the Common School Fund and from the Common School Special Account to the Common School Fund, which are reported on the budgetary basis, have been eliminated for GAAP reporting purposes.

[THIS PAGE INTENTIONALLY LEFT BLANK]

H-1
APPENDIX H GENERAL OBLIGATION BONDS REFUNDED BY THE BONDS
This exhibit reflects the bonds anticipated to be refunded with the proceeds of the Bonds. The State reserves the right to change or modify the refunding plan, including the maturities and amounts thereof to be refunded. All information in this APPENDIX H is preliminary, subject to change.
TABLE H All of the Refunded Bonds will be redeemed on May 9, 2019 at a redemption price of par plus accrued interest to the date of redemption.
SERIES DESIGNATION MATURITY DATE INTEREST RATE (%) PAR AMOUNT ($) CUSIP
NUMBER(1)
General Obligation Bonds, Series of September 2005
9/1/2025 4.500 7,070,000 452152 J69
General Obligation Bonds, Series of April 2007
4/1/2027 4.500 6,000,000 452151 M42 4/1/2029(2) 4.750 6,000,000 452151 M91 4/1/2030(2) 4.750 6,000,000 452151 M91
General Obligation Bonds, Series of April 2008
4/1/2021 4.750 5,000,000 452151 3Z4
General Obligation Bonds, Series A of September 2009
9/1/2021 4.000 16,000,000 452151 8A4 9/1/2022 4.000 16,000,000 452151 8B2 9/1/2023 4.000 16,000,000 452151 8C0 9/1/2024 4.500 16,000,000 452151 8D8
9/1/2025 4.000 16,000,000 452151 8E6 General Obligation Bonds, Series of February 2014
2/1/2028 5.250 41,000,000 452152 VE8
______________________________ (1) CUSIP is a registered trademark of American Bankers Association. CUSIP data in this Official Statement are provided by CUSIP Global
Services LLC, managed on behalf of the American Bankers Association by S&P Capital Q, a part of McGraw-Hill Financial, Inc. The CUSIP numbers listed are being provided solely for the convenience of the bondholders only at the time of issuance of the Bonds and the State does not make any representation with respect to such numbers or undertake any responsibility for their accuracy now or at any time in the future. The CUSIP number for a specific maturity may be changed after the issuance of the Bonds as a result of various subsequent actions including, but not limited to, a refunding in whole or in part of such maturity or as a result of various subsequent actions including, but not limited to, a refunding in whole or in part of such maturity or as a result of the procurement of secondary market portfolio insurance or other similar enhancement by investors that is applicable to all or a portion of certain maturities of the Bonds.
(2) Mandatory sinking fund payment for term bond maturing April 1, 2032.

[THIS PAGE INTENTIONALLY LEFT BLANK]


ST
AT
E O
F IL
LIN
OIS
• Ge
ne
ra
l Ob
liG
at
iOn b
On
ds, s
er
ies O
f ap
ril 2019