state of industry report 2015 - nepra.org.pk of industry... · 1 foreword the power sector is...
TRANSCRIPT

1
State of Industry Report 2015


STATE OF INDUSTRY REPORT
2015


v
CONTENTS
FOREWORD ........................................................................................................................................................ 1
1. OVERVIEW ............................................................................................................................................ 51.1 China-Pakistan Economic Corridor (C-PEC) Project ..................................................................................5
1.2 Donors’ Support ......................................................................................................................................................5
1.3 Load Shedding .........................................................................................................................................................5
1.4 Reduction in the Cost of Generation ..............................................................................................................5
1.5 Tariffs of Renewable Energy Projects ..............................................................................................................6
1.6 Performance of GENCOs ......................................................................................................................................6
1.7 Transmission Network NTDC .............................................................................................................................6
1.8 Projected Capacity and Power Balance of NTDC System ........................................................................7
1.9 Expansion Plan of NTDC ......................................................................................................................................7
1.10 Timely Completion of Upcoming Projects ....................................................................................................7
1.11 Power Balance of K-Electric System .................................................................................................................8
1.12 Environmental Impact of Coal Based Power Plants ...................................................................................8
1.13 Infrastructure Development ...............................................................................................................................8
1.14 Data Reporting ........................................................................................................................................................8
1.15 Power Market Reforms ..........................................................................................................................................8
1.16 Receivables of DISCOs ..........................................................................................................................................9
1.17 Transmission and Distribution (T&D) Losses of DISCOs .........................................................................9
1.18 Circular Debt .............................................................................................................................................................9
1.19 Tariff Differential Subsidy ...................................................................................................................................9
1.20 Multi-Year Tariff (MYT) Regime for DISCOs ...................................................................................................9
1.21 Generation Capacity of K-Electric .....................................................................................................................9
1.22 K-Electric Transmission and Distribution Systems ..................................................................................10
1.23 Upfront Tariffs.........................................................................................................................................................10
1.24 Net-Metering Regime..........................................................................................................................................10
1.25 Special Purpose Transmission Licence under Section 19 of NEPRA Act .........................................10
1.26 Recommendations ...............................................................................................................................................11
2. PERFORMANCE OF GENERATION SECTOR ...................................................................................... 152.1 General ......................................................................................................................................................................15
2.2 Source-wise Installed Capacity ........................................................................................................................15
2.3 Hydropower ............................................................................................................................................................15
2.4 Thermal .....................................................................................................................................................................15
2.4.1 Jamshoro Power Company Limited (GENCO-I) ........................................................................152.4.2 Central Power Generation Company Limited (GENCO-II) ....................................................162.4.3 Northern Power Generation Company Limited (GENCO-III) ...............................................162.4.4 Lakhra Power Generation Company Limited (GENCO-IV) ....................................................162.4.5 Overall Performance of GENCOs ....................................................................................................162.4.6 Independent Power Producers (IPPs) ...........................................................................................172.4.7 Installed versus Dependable Capacity .........................................................................................172.4.8 Manpower to MW Ratio .....................................................................................................................17
i

vi
2.5 Nuclear (CHASNUPP-I and II) ..........................................................................................................................18
2.6 Wind...........................................................................................................................................................................18
2.7 Bagasse .....................................................................................................................................................................18
2.8 Solar ...........................................................................................................................................................................18
2.9 K-Electric Limited ..................................................................................................................................................18
3. PERFORMANCE OF TRANSMISSION SECTOR .................................................................................. 233.1 General ......................................................................................................................................................................23
3.2 Overloading of Existing Power Transformers .............................................................................................23
3.3 Power Dispersal Constraints in Transmission Networks ........................................................................26
3.3.1 Uch-II Power (Pvt.) Limited ...............................................................................................................263.3.2 Engro Powergen Qadirpur Limited................................................................................................263.3.3 Altern Energy Limited .........................................................................................................................263.3.4 TNB Liberty Power Limited ...............................................................................................................263.3.5 Habibullah Coastal Power Company Limited ............................................................................263.3.6 Foundation Power Company (Daharki) Limited .......................................................................263.3.7 Nishat Power Limited and Nishat Chunian Power Limited ..................................................27
3.4 Induction of New Generation Power Plants ...............................................................................................27
3.5 Future NTDC Network.........................................................................................................................................29
3.6 NTDC Financial Plans ..........................................................................................................................................30
3.7 K-Electric Transmission System .......................................................................................................................30
4. PERFORMANCE OF DISTRIBUTION SECTOR ................................................................................... 354.1 Constraints in DISCOs’ System ........................................................................................................................35
4.2 Receivables of DISCOs ........................................................................................................................................35
4.3 Transmission and Distribution (T&D) Losses of DISCOs .......................................................................36
4.4 Circular Debt ...........................................................................................................................................................37
4.5 Tariff Differential Subsidy...................................................................................................................................37
4.6 Constraints in K-Electric System .....................................................................................................................37
4.7 Uploading of Performance Reports submitted by DISCOs and K-Electric on Quarterly
Basis on Website....................................................................................................................................................37
4.8 Legal Proceedings against DISCOs and K-Electric due to non-compliance of Performance Standards (Distribution) Rules, (PSDR) 2005 ..............................................................................................37
5. INITIATIVES BY NEPRA ...................................................................................................................... 415.1 Upfront Tariff for Wind Power Projects ........................................................................................................41
5.2 Upfront Tariff for New Bagasse based Co-Generation Power Projects ............................................41
5.3 Upfront Tariff for Coal Power Projects ..........................................................................................................41
5.4 Tariff for Conversion of Oil to Coal Projects ...............................................................................................42
5.5 Upfront Tariff for Solar Power Projects .........................................................................................................42
5.6 Upfront Tariff for Small Hydropower Projects ...........................................................................................42
5.7 Upfront Tariff for LNG based Power Projects .............................................................................................43
5.8 Tariff for Short-Term IPPs ...................................................................................................................................43
5.9 Development of NEPRA (Alternative and Renewable Energy) Distributed Generation and Net Metering Regulations, 2015 ..............................................................................................................................43
ii

vii
5.10 Integrated Generation, Transmission and Distribution Plans (IGTDPs) ...........................................43
5.10.1 Development of IGTDPs ...................................................................................................................435.10.2 Evaluation/Review of IGTDPs by NEPRA .....................................................................................445.10.3 Recommendations for Resubmission of IGTDPs ......................................................................445.10.4 Final Guidelines and Formats to Develop IGTDPs by NEPRA .............................................45
5.11 Special Purpose Transmission Licence (SPTL) under Section 19 of NEPRA Act ...........................45
5.12 Development of NEPRA Interconnection Guidelines, 2015 .................................................................45
6. MONITORING OF THE SECTOR ......................................................................................................... 496.1 Visits of DISCOs to Verify/Inspect the Sanctioned Load vis-a-vis Connected Load ...................49
6.2 Real Time Monitoring ..........................................................................................................................................49
6.3 Undue Scheduled/Unscheduled Load Shedding by K-Electric ...........................................................49
6.4 Safety Record of Distribution Companies ...................................................................................................49
6.5 Annual Performance Report (APR) of NTDC ..............................................................................................50
6.5.1 Number of Voltage Variations (Violating Prescribed Criteria) ............................................516.5.2 System Frequency ................................................................................................................................54
6.6 Annual Performance Report (APR) of K-Electric .......................................................................................55
6.7 Energy not served in KE System ......................................................................................................................57
6.8 Frequent Tripping of Transmission and Grid System in NTDC ............................................................58
6.9 Handing Over of Switchyards of GENCOs to NTDC ................................................................................59
6.10 Implementation of Performance Standards (Generation) Rules, (PSGR) 2009 .............................59
6.11 Implementation of Grid Code ..........................................................................................................................59
6.12 Implementation of Distribution Code ..........................................................................................................59
6.13 Development of Power Safety Code .............................................................................................................60
7. INITIATIVES BY STAKEHOLDERS ...................................................................................................... 637.1 Market Structure ....................................................................................................................................................63
7.2 Creation of Central Power Purchasing Agency - Guarantee Limited (CPPA-G) ............................63
7.3 ModificationinTransmissionLicenceofNTDC .........................................................................................63
7.4 Market Operator Registration (Standards and Procedure) Rules, 2015 ...........................................63
7.5 PPIB Policy for Private Sector Transmission Projects 2015 ...................................................................64
7.6 Central Asia-South Asia (CASA-1000) Project ..............................................................................................64
7.7 Import of Electricity from Iran .........................................................................................................................64
7.7.1 Import of 74 MW (Jackigur – Mand) .............................................................................................647.7.2 Import of 100 MW (Polan – Gawadar) .........................................................................................647.7.3 Import of 1000 MW (Zahedan – Quetta) ....................................................................................64
7.8 Alternative and Renewable Energy Developments .................................................................................65
7.8.1 Steps/initiatives for Development of ARE Sector ....................................................................657.8.2 On-Grid Projects ...................................................................................................................................667.8.3 Off-Grid Applications....... .....................................................................................................................66
8. MISCELLANEOUS ................................................................................................................................ 738.1 Promulgation of New Rules/Regulations ....................................................................................................73
8.2 Advisories issued by NEPRA to the Government of Pakistan ..............................................................73
8.3 Consumer Affairs ..................................................................................................................................................73
8.3.1 Achievements/Development ...........................................................................................................74
iii

viii
9. Energy Sector Overview .................................................................................................................... 779.1 Oil................................................................................................................................................................................77
9.2 Gas ..............................................................................................................................................................................77
9.3 Coal ............................................................................................................................................................................77
9.4 Primary Energy Supplies ....................................................................................................................................77
9.5 Final Energy Consumption ................................................................................................................................79
9.6 Fuel Consumption in Power Sector ...............................................................................................................80
10. ELECTRICITY SECTOR OVERVIEW ..................................................................................................... 8310.1 Installed Capacity ..................................................................................................................................................83
10.2 Load Pattern and Peak Load Hours ............................................................................................................115
10.3 Maximum Demand ............................................................................................................................................117
10.4 Pattern of Electricity Consumption .............................................................................................................118
10.5 Surplus/DeficitinDemandandSupplyduringPeakHours(actualandprojected) ................ 119
11. ELECTRICITY GENERATION ............................................................................................................. 12311.1 General ...................................................................................................................................................................123
11.2 Thermal Generation ..........................................................................................................................................124
11.3 Thermal Power Generation and Fuel Consumption .............................................................................124
11.4 Hydel Generation ...............................................................................................................................................125
11.5 Nuclear Power Plants .......................................................................................................................................127
11.6 Renewable Energy .............................................................................................................................................128
11.7 Available Power Generation Capacity ........................................................................................................129
11.8 Investment Plan for Power Generation Projects ....................................................................................130
11.9 Economic Load Dispatch System .................................................................................................................136
11.10 Generation Licenses Granted ........................................................................................................................139
12. ELECTRICITY TRANSMISSION ......................................................................................................... 15112.1 General ...................................................................................................................................................................151
12.2 Transmission Lines and Grid Stations with NTDC .................................................................................151
12.3 Transmission Losses ..........................................................................................................................................152
12.4 Utilization of Transmission Lines and Power Transformers ...............................................................153
12.5 Investment Plan - NTDC System ..................................................................................................................154
12.6 Transmission Lines and Grid Stations with K-Electric ..........................................................................157
13. ELECTRICITY DISTRIBUTION ........................................................................................................... 16513.1 General ...................................................................................................................................................................165
13.2 Function of Distribution Companies ..........................................................................................................166
13.3 Distribution System Performance ................................................................................................................166
14. ELECTRICITY TARIFF......................................................................................................................... 19114.1 Tariff Setting .........................................................................................................................................................191
14.2 Tariff Standards ...................................................................................................................................................191
LIST OF TABLES .............................................................................................................................................. 213
ACRONYMS AND ABBREVIATIONS ............................................................................................................. 215
SOURCE OF INFORMATION .......................................................................................................................... 217
iv
1
FOREWORD
The power sector is presently undergoing a major transformation where the Federal and Provincial Governments have aligned their priorities for overcoming the energy crises which have been adversely affecting the social, economicandfinancialprogressofthecountryforthepastmanyyears.TheGovernmentofPakistan’s(GoP)efforts for bringing new power generation plants through China-Pakistan Economic Corridor (C-PEC) Agreement reflectstherealizationthatthecountryisindireneedofenergyresourcestosatisfybaseloadrequirements.Similarly, overall generation mix is also planned to have renewable energy projects which will provide necessary diversificationandincreasedenergysecuritytothesector.TheintroductionofRe-GasifiedLiquidNaturalGas(R-LNG) Projects is also a step towards adding relatively clean and cheaper energy generation resources.
According to the available plans, more than 17,200 MW are expected to be added to the system. In order to meet peak time demand about 8,000 MW will be inducted by the end of June, 2017. Although such a target by June, 2017 is quite ambitious yet this is achievable, as this planned capacity includes Solar and Wind Projects, 3,600 MW R-LNG based Projects, and under-construction hydropower projects at Tarbela and Neelum-Jhelum. Sustained efforts are, however, required at all levels so that smooth and transparent implementation of these projects is achieved within the target dates.
While it is satisfying to note that the generation sector has been drawing all the due attention, strengthening of the transmission and distribution sectors is equally critical. One of the problems faced by these sectors is their overloaded networks which not only hinder their power transfer capability but also add to wastage of electricity through increased losses. The constraints on transmission networks have also led to severe power evacuationproblemswiththeresultthatthecapacitiesofsomeofthemostefficientplantscannotbeutilizedto their optimum level. Therefore, addition of new generation facilities of around 8,000 MW by June, 2017 and strengthening of existing transmission system requires large scale investment in this area, besides hugely improved managerial performance by NTDC, in order to ensure availability of a reliable transmission system well before the completion of generation facilities.
In addition to funding constraints, the Distribution Companies (DISCOs) are required to enhance their ability and competence especially in the areas of designing, specifying and constructing 132 kV facilities which shall complement the additional energy referred to above.
It is noted that due to better load management policies, fewer agitations and protests were witnessed during 2014-15, especially in the later part of the year. Not only, improvement in uninterrupted supply to the industrial sector has been ensured, load shedding in the domestic and commercial sectors remained somewhat predictable whereas unscheduled load shedding hours have been considerably reduced. The improved continued electricity supply to the industrial sector is expected to help increase the industrial production besides creating more employment opportunities.
The ability of DISCOs to have accommodated and distributed more than 16,000 MW this year shows an improvement over the previous year.
The DISCOs did not show any noticeable improvement in their performance and continued with the business as usual in the areas of T&D losses, recoveries and technical operations. While overall averages for the year in the above areas remained almost the same as for 2013-14, the second half of the current year (January to June) showed slight improvements in the above areas relative to corresponding period of 2013-14. The safety aspect deterioratedwhichisreflectedintheincreasednumberoffatalincidentsoverthepreviousyearinmostoftheDISCOs.
The receivables of distribution sector increased by more than Rs. 120 billion during 2014-15, which on 30th June, 2015 stood at Rs. 633.119 billion. Out of Rs. 120 billion, Rs. 75 billion increase is due to the receivables from private sector, whereas Rs. 15 billion increase stood against AJK share. Another Rs. 13 billion increase is due to the Provincial Governments (especially Government of Sindh’s receivables). The Federal Government needs to
State of Industry Report 2015

2
pay attention to creating a smooth payment mechanism from the government connections especially in Sindh andAJK.Therecoveriesfromagricultureconnectionsalsoremainasourceofconstantinflowintothecirculardebt and cannot be resolved unless the provincial governments lend their active support to DISCOs.
K-Electric, despite having the generation capacity, is continuously carrying out load shedding for certain categories of its consumers. Although K-Electric has been reporting satisfactory performance in relation to NEPRAperformancestandards,thecrisesinK-ElectricterritoryinJune,2015haveprovedotherwise.ThefindingsofNEPRA’sfactfindingteamhavebroughtoutsomerealconcernsaboutthehealthofK-Electricsystem,theseissuesarerequiredtobeaddressedimmediatelywhichneedreasonableinvestmentspecificallyintransmissionand distribution networks.
Although no major steps were taken for the past many years to move towards a competitive market, despite NEPRA having indicated about the slow pace of reform process initiated in 1992, recent changes by creating a Central Power Purchasing Agency - Guarantee Limited (CPPA-G) out of the umbrella of NTDC are encouraging as these changes aimed at not only bringing transparency in the operations of power procurement agency, but also helping in smooth transition towards market based operations in the power sector.
During the year, the Authority has introduced up-front tariff regimes, in technologies of Solar, Wind, Bagasse, Small Hydro, R-LNG and Coal. The Authority also announced a number of land mark decisions including grant of “Special Purpose Transmission Licence” (SPTL) to a private entity, regulations on sale of power by renewable energy sources and regulations on net-metering regime. It is believed that the above decisions especially about SPTL and net-metering would prove to be the game-changer in the areas of transmission and distribution sectors. NEPRA expects that the GoP would also incentivize solar industry so that consumers are encouraged to participate not only in net-metering regime but also in off-grid application of solar power. Availability of funds would not only facilitate consumers to install solar panels but will also help in meeting supply-demand gap.
It has been observed that the targets set for the sector are reasonably ambitious but critical at the same time. It is, therefore, desired that coherent efforts are made in the sector with continuous vigor and zeal. Continuous monitoring ensuring transparency for timely completion of all envisaged projects is equally important.
The detailed statistics and data provided on the power sector in the State of Industry Report 2015, besides being a source of information, would also be helpful and useful for the decision makers.
State of Industry Report 2015
OVERVIEW 1


5
State of Industry Report 2015
1. OVERVIEW
Notwithstanding the issues and shortcomings in the power sector, some of the following factors during the year 2014-15 have shown positive developments as a result of various steps taken by the Federal and Provincial Governments coupled with international trends in the capital and fuel markets.
1.1 China-Pakistan Economic Corridor (C-PEC) ProjectThe US$ 46 billion Agreement under China-Pakistan Economic Corridor (C-PEC) Project between the Governments of China and Pakistan includes around US$ 33.8 billion for various energy projects. Under the C-PEC agreement, US$ 15.5 billion worth of coal, wind, solar and hydropower projects will add 10,400 MW of energy to the National Grid. C-PEC also foresees cooperation between the two countries in developing nuclear energy based projects. It is expected that the development of nuclear and coal projects would meet the necessary base load requirementsintheoveralldemandprofileofthecountryinthelongrun.Expensiveenergymixhasremainedone of the major contributors to relatively higher tariffs for the end-consumers. Coal power plants operating at high utilization levels will help in bringing down the cost of energy generation.
1.2 Donors’ SupportThe support of donor agencies in the infrastructure development and capacity building has resulted in some noticeable improvement. In the generation sector, refurbishment through USAID funding in public sector generation companies (GENCOs) has led to recovery of additional useful capacities at relatively better operational efficiencies. GENCOs were also helped by USAID in carrying out performance testing of their generationfacilities. Through JICA and USAID support, detailed studies for National Transmission and Dispatch Company Limited (NTDC) have been initiated, including preparation of a National Least Cost Expansion Plan and studies for absorption levels of renewable energy projects in the National Grid. The World Bank has been providing assistance for improving the functioning of Central Power Purchasing Agency (CPPA). Similarly, infrastructure improvement of SCADA system is being contemplated at National Power Control Centre (NPCC), through JICA support. USAID, World Bank and Asian Development Bank are also helping in importing power from Central Asian States.
1.3 Load SheddingOwingtooverallmonitoringbytheMinistryofWaterandPowerandrealtimemonitoringofpowerflowsatthefeeder level, the DISCOs have been able to achieve marked improvement in demand management. Reportedly, the load shedding duration has been reduced from 12 hours in 2013 to 6 hours in 2015 in the urban areas. Similarly, load shedding in the industrial sector has been reduced from 12 hours to 4 hours over the same period. Rural areas have also witnessed relative reduction in their load shedding hours.
1.4 Reduction in the Cost of GenerationDue to reduction in oil prices in the international market, the cost of generation declined in the year 2014-15, compared to the last year. A comparison of the two years is shown in the following table:
Source-wise Fuel Cost (Rs./kWh)
Source Hydel Coal HSD RFO Gas Nuclear Import Iran Mixed Wind Solar Average
Basket Price2013-14 - 4.05 21.85 15.97 4.81 1.32 9.35 9.31 - - 10.592014-15 - 4.50 17.14 12.54 4.81 1.19 10.03 8.23 - - 9.84
Source: NEPRA
It may be noted that up to June 2015, except for coal and import from Iran, which constitute only 0.11% and 0.46% respectively of the overall energy generated, the cost of generating a unit of energy through major fuels declined. Generation on furnace oil made up 32.66% of total energy. The unit cost of energy on furnace oil reduced by Rs. 3.43 per kWh. Similarly, the cost of generation on high speed diesel (HSD) which provided 3.01% of total generation reduced by Rs. 4.71 from 2013-14. The cost of generation on gas remained almost the same. The reduction in cost of generation was passed on to the consumers for the respective months of 2014-15 as tabulated herein. An overall impact of the reduction in cost has been noted as Rs. 87.97 billion during the year:

6
State of Industry Report 2015
Increase/(Decrease) Rs./kWh
July Aug. Sept. Oct. Nov. Dec. Jan. Feb. March April May June
0.43 (0.30) 0.52 (0.48) (2.97) (3.24) (2.08) (4.43) (3.62) (1.86) (2.68) (2.19)Source: NEPRA
1.5 Tariffs of Renewable Energy ProjectsThereductionincapitalcostsandtechnological improvementsinrenewableenergyhasreaffirmedNEPRA'sstance that such projects should be inducted with due consideration to these factors. NEPRA, in order to provide incentivestoinvestors,andtobuildtheirconfidenceandwithaviewtointroducingwindtechnologyinthecountry, determined an upfront levelized tariff of Rs. 13.1998 per kWh, for wind power projects in 2013. In view of the improvement in technology and overall decline in project costs, the tariff was revised at Rs. 10.6048 in 2015. Similarly, in order to introduce solar technology in the country, NEPRA determined an upfront levelized tariff of Rs. 17.1216 per kWh in 2014 and the same was capped at a maximum of 50 MW, out of which 46.5 MW tariff was secured, which in 2015 has been determined at the rate of Rs. 14.8591 per kWh. Renewable energy not only provides energy security but is also instrumental in saving foreign exchange, guarantees predictability and is environment friendly. In view of the continuous improvements in technology, reduction in prices and the grid stability, renewable energy has to be inducted gradually in the system. For creating more space for renewable energy projects, detailed studies need to be carried out to identify short term and long term expansion plans for strengthening the grid system.
1.6 Performance of GENCOsThe performance of GENCOs has been a matter of concern for the regulator and an aggressive monitoring programhasbeeninitiatedforoverseeingGENCOs'regulatoryaffairs.Earlier,alltheGENCOswereadvisedbytheAuthoritytocarryoutperformancetestssothatdegradationintheiroperationalcapabilities,efficienciesand administrative factors like manpower, timely overhauling and maintenance are set afresh. Particularly, the surplus human resource which is sitting idle due to closure and non-operational plants and over employment are major factors contributing towards higher cost of generation. NEPRA during forthcoming tariff determinations for GENCOs will keep these factors in view in order to rationalize their tariff. The surplus and skilled human resource of these GENCOs can be absorbed and utilized in the upcoming power generation projects.
1.7 Transmission Network NTDCUnder its transmission license, NTDC is required to play a number of roles. As a network operator, it is required to construct and operate Extra High Voltage transmission lines and grid stations for transporting power from the existing and new generation facilities to the DISCOs. NTDC has a critical role in the sense that it has to match not only the availability of its transmission facilities with the timing of new power generation plants, but also to periodically refurbish and upgrade its existing system to cater for the increased load demand put on by the DISCOs, besides managing transmission losses. The transmission network of NTDC includes 5,197 km long transmission lines operating at 500 kV level and 9,814 km long 220 kV lines.
As of 30th June 2015, NTDC is maintaining 13 No. 500 kV grid stations with a transformation capacity of 18,624 MVA. There are 33 No. 500/220 kV transformers and 28 No. 220/132 kV transformers installed at these grid stations. At 220 kV level, there are 37 grid stations with a transformation capacity of 24,063 MVA. There are 101No. 220/132 kV transformers installed at 220 kV and after inclusion of 28 No. 220/132 kV transformers installed at 500 kV grid stations, total 220/132 kV transformers come to 129. An overview of the existing transmission capacity shows that EHV network is barely enough to cater for the present generation capacity. It has been noted that out of 33, 500/220 kV transformers, 8 are overloaded. Similarly, out of 129 No. 220/132 kVtransformers,90areoverloaded,whichifnotrectifiedareapotentialthreattothereliableoperationofthesystem. It is imperative that NTDC besides strengthening of existing transmission network should ensure timely completionoftheplannedtransmissionrequirementsidentifiedforevacuationofpowerfromtheupcominggeneration projects.

7
State of Industry Report 2015
1.8 Projected Capacity and Power Balance of NTDC SystemThe following table provides peak time demand in NTDC system, year-wise capacity additions and resulting installed capacity till 2020-21:
Financial Year ending 30th June
NTDC Peak Demand (MW)
Capacity Addition per yearin NTDC System (MW)
Total Installed Capacityper year (MW)
2015 21,701 1,504 22,9282016 23,711 689 23,6172017 24,871 6,643 30,2602018 26,105 9,961 40,2212019 27,408 1,279 41,5002020 28,773 4,580 46,0802021 30,156 2,200 48,280
Source: NTDC
Ifnewgenerationasnotedaboveisaddedtothesystem,itisexpectedthatby2017,negligibledeficitwillbefaced at the peak time only, while no load shedding during other times be required. However, for this to happen, not only the generation but the transmission and distribution systems must be strengthened so that constraints in the existing system are completely removed.
1.9 Expansion Plan of NTDCTo cater for the needs for transmission of power from upcoming generation power plants and strengthening of existing system, grid station expansion plan of NTDC over the next two years is shown in the following table, which provides that by the end of 2017, 3 new grid stations at 500 kV level will be added which will add 3750 MVA in transformation capacity in the system, the fourth 500 kV grid station will be complete by the end of 2020 adding additional 1500 MVA to the system. At 220 kV level, 8 new grid stations with a cumulative transformation capacity of 5750 MVA will be added in the system. Similarly, one overloaded 500 kV grid station will be strengthened, while six such grid station at 220 kV level be improved by 2019-20. The adequacy of NTDC system is discussed further in the later sections of the report.
Grid Station Expansion Plan of NTDC
Period of Report
500/220 kV Grids 220/132 kV Grids
Nos. MVA Capacity
Expected COD
*Estimated Cost (Rs. Million) Nos. MVA
CapacityExpected
CODEstimated Cost
(Rs. Million)New Grid Station
2015-16 3 3750 2016-17 20,399 8 5750 2016-17 26,2332016-17 1 1500 2019-20 3,500 - - - -
Extension2015-16 1 430 2016-17 697 - - - -
Addition/Reinforcement of Transformers at Overloaded Grid Stations2015-16 1 0 2016-17 1,413 - - - -2016-17 - - - - - - - -2017-18 - - - - 6 3000 2019-20 16,400
* The cost of 500/220 kV Grid Stations also include the cost of 220/132 kV Transformers.Source: NTDC
1.10 Timely Completion of Upcoming ProjectsIt is noted that by June 2017, a large generation capacity has been planned to be added which is expected to reduce the gap between supply and demand. Similarly, transmission system is required to be strengthened for evacuation of power from these generation facilities. However, it is noted that to meet these targets, timely completion of projects is critical and of paramount importance. From the above tables it is also evident that more than 10,000 MW will be surplus to the demand requirements by 2021, which will essentially be required to maintain necessary reserve and operating margins in the system as per international practices.

8
State of Industry Report 2015
1.11 Power Balance of K-Electric SystemThefollowingtableshowsyear-wiseprojectedfiguresofpowerbalancesinrespectofK-Electrici.e.plannedgenerationcapability,projecteddemandgrowthrate,projecteddemandduringpeakhoursandsurplus/deficit:
Financial Year ending
30th June
Generation* Capability as per
K-EL (MW)
KEL's Projected Demand Growth
Rate (%)
KEL's Projected Demand during
Peak hours (MW)
Surplus/ (Deficit) (MW)
2015 2,632 - 3,056 -424
2016 2,752 (including 20 + 100 MW SNPC) 5.00 3,209 -457
2017 2,804 (including 52 MW FPCL) 5.00 3,369 -565
20183,674
(including 450 LNG + 420 Coal Conversion)
5.00 3,538 136
2019 4,374 (including 700 MW Coal)** 5.00 3,715 659
2020 4,374 5.00 3,900 474* includes 650 MW from NTDC** Subject to approval of acceptable tariff by NEPRA and other regulatory approvals.Source: K-Electric Limited
It may be noted that the above generation capability data as reported by K-Electric includes 650 MW from NTDC implying thereby that K-Electric will barely meet its requirements by 2019 provided that additional generation capacity is timely achieved.
1.12 Environmental Impact of Coal Based Power PlantsInduction of coal based power plants at a large scale would affect the environmental balance due to various issues related to coal power. These include increased emission levels, particulate matter and disposal of ash. Similarly, the coal-based power plants proposed to be constructed in mid-country would also require a robust transportation system for a continued supply of coal. The environmental issues put a huge responsibility on the relevant environmental agencies for monitoring coal based projects during their planning, construction and operation stages.
1.13 Infrastructure DevelopmentThe Federal Government is also required to ensure availability of infrastructure i.e. road/rail facilities before the completion of coal-based projects for transportation of coal from the port to project sites without interruption. Efforts on war footing are also required for the development of infrastructure at port and transmission lines for R-LNG supply to upcountry power plants.
1.14 Data ReportingThe DISCOs have been continuing with manual record keeping and its functionaries are prone to in-accurate reporting as well as human errors and discretion, which distort reported data leading to skewed decisions, not reflectingthetruepicture.Inviewthereof,itisreiteratedandemphasizedthatallpowersectorentitiesshouldimmediately explore and adopt automation to have system generated reports to minimize the human factor thus forming the basis for informed and real time decisions.
1.15 Power Market ReformsThe Authority granted transmission license to NTDC in 2002, which required NTDC to create a number of entities within its setup. In this respect, CPPA was also created which was responsible for procurement of power on behalf of DISCOs. Similarly, an independent system operator, a network operator and a contract registrar were also to be created. The operations of the sector were expected to move forward from a single-buyer mode tosingle-buyer-plusmodeandfinallytoabilateralcontractmarket.Underthestructureofbilateralmarket,theCPPA and the contract registrar were to be taken out of the NTDC umbrella for the transparency of functions. Over the years, however, the power sector structure could not make progress as stipulated in the transmission license as the single-buyer mode has continued. Almost all of the major contracts by IPPs have been entered

9
State of Industry Report 2015
into on long terms with CPPA/NTDC through sovereign guarantees of the GoP. During the year, the Authority consideredaLicenseeProposedModification(LPM)byNTDCforrevisioninitstransmissionlicenseandcreationofanewentityasCPPA-G.NEPRAhasapprovedsuchmodification.CreationofCPPA-Gwillhelpprovidingenablingenvironmenttomovefromsinglebuyermodeltosinglebuyerplusmodelandfinallytothebilateralcontract mode.
1.16 Receivables of DISCOsThe overall receivables of DISCOs at the end of June, 2015 increased by Rs. 120 billion over the previous year. it is noted that apart from Federal Government and agriculture tube wells in Balochistan which show a reduction of around Rs. 0.7 billion and Rs. 0.2 billion respectively, receivables from other areas increased. As on 30th June, 2015 the overall distribution sector receivables stood at Rs. 633 billion (including Rs. 43.97 billion pertaining to K-Electric).
1.17 Transmission and Distribution (T&D) Losses of DISCOsDISCOs' performance in the area of losses, has been mixed. Certain DISCOs have reported very slightimprovement; others have maintained the same level of losses, whereas a number of DISCOs have reported higher losses than they had reported to NEPRA during earlier years. In this respect, PESCO and SEPCO have shown increase in losses. Adding further to T&D losses is the low recovery ratio of DISCOs. The Authority assessed a recovery target of 100% while setting the consumer tariff for DISCOs, however according to the information provided by DISCOs, the actual level of recovery remained around 89.16% for the year 2014-15.
1.18 Circular DebtCircular debt is still a major issue confronting power sector. One of the contributors of circular debt remained hightransmissionanddistributionlossesinDISCOs.Basedonthecurrentlynotifiedconsumer-endtariffof10th June, 2015, if DISCOs fail to show any improvement in their actual level of losses, the impact of missing the Authority’s set T&D loss target would result in an annual gap of Rs. 41 billion. It is pertinent to mention that the authorityhassetanaveragelosstargetof15.29%for2014-15,whereasDISCOs'reportedlossesforthesameperiod remained around 18.73%.
1.19 Tariff Differential Subsidy GoP is providing Tariff Differential Subsidy (TDS), primarily to the agriculture and residential class of consumers, having consumption of up to 300 units. The GoP intends to decrease the gap between NEPRA determined consumer-endtariffandtheGoPnotifiedtariffthroughimpositionofTariffRationalizationSurchargeonsomecategories of consumers of different DISCOs so that its burden in the shape of TDS is reduced from Rs. 135 billion to Rs. 65 billion.
1.20 Multi-Year Tariff (MYT) Regime for DISCOsAccordingtoNEPRATariffStandardsandProcedureRules,1998determinationofDISCOs'tariffrequiresaveryelaborate procedure to be followed. DISCOs are required to provide extensive information which is generally delayed. Furtherdelaysmayoccurduringnotificationof tariff.Conducting suchproceedingsannuallyhavebeenprovingtobeinefficient.Therefore,tostreamlinetheprocessandtoregulatetherevenuestreamsfortheentitiesinvolvedandfurthertobringin-builtincentivesandefficiency,NEPRAhasdecidedtore-introduceMYTregime. MYT being a performance based tariff will require DISCOs to achieve certain targets of performance over the control period to receive revenue streams based on known tariffs.
1.21 Generation Capacity of K-ElectricIt is noted that K-Electric was required to enhance its generation capacity by 1000 MW over the capacity indicated in its Generation License. K-Electric has added 1034 MW in the system however it has decommissioned or permanently closed 685 MW of its existing generation capacity. Therefore, effectively about 349 MW has been added by K-Electric considering retirement and permanent closure of its generation facilities. Inability of K-Electric to effectively increase its generation capacity has made it dependent on external power sources, including the import from NTDC system. To meet its demand, it has to operate its generation facilities and other resources specifically650MW fromNTDCat theirmaximum. It isobserved that reservemarginsperinternational standards are required in order to avert any breakdown in the system.

10
State of Industry Report 2015
The contract of power supply between NTDC and K-Electric has already expired, however, the power is still being imported out of necessity. The Authority has advised K-Electric and NTDC to enter into a contract if such arrangement is to continue, without which import of 650 MW will be ostensibly illegal and unlawful.
1.22 K-Electric Transmission and Distribution Systems The Authority has noted that recently with increase in load demand, the tripping on Extra High Voltage Transmission (EHT) network has increased. Normally, EHT is considered the strongest link between power generation and consumers as it is used only for transporting electricity, therefore, increased tripping indicates weakness in K-Electric system.
TheloadingprofileofEHTnetworkduringJune2015,showsthatoutofatotal129powertransformers,45are overloaded. Out of these, 16 are overloaded between 90% and 100% whereas a number of transformers are noted to be operating at more than 100% of their rated capacity. It is also noted that in order to ensure that power transformers are loaded within their limits, feeders are isolated by K-Electric as a routine, so that overloading can be avoided. The Authority has noted that EHT system of K-Electric lacks enough capacity to transmit power to the underlying network. NEPRA has taken cognizance of this unwarranted situation and is proceeding as per law.
1.23 Upfront TariffsUnder NEPRA Tariff (Standards and Procedure) Rules 1998, it takes around four months to determine tariff of a facility. Taking cognizance of the electricity shortage in the country, which has direct bearing on the social and economic health of consumers besides GDP, NEPRA under its Up-front Tariff (Approval & Procedure) Regulations, 2011 has decided to introduce the regime of up-front tariff. Under this regime, the time has been reduced to 10 days for determination by the Authority in case the investors decide to opt for the respective upfront tariff for thattechnology.Theregime,besidesprovidingpredictabilityandlevelplayingfieldforallinvestors,willalsoallow inbuilt incentives for early completion of the projects. Accordingly, up-front tariffs for all technologies i.e. small hydropower, wind, solar, bagasse, R-LNG and coal have been announced by NEPRA. The up-front tariff for coal is basically structured on using local coal, which will reduce the import of oil and save from shocks of volatile oil market, which can rebound any time as has been experienced by power sector in the past. It is to be noted that the up-front tariffs announced by NEPRA are periodically revised in view of introduction of new technologies and international market trends.
1.24 Net-Metering RegimePakistan has a huge potential for solar-based energy. In order to make optimum use of this potential, NEPRA, besides announcing up-front tariff for solar technology, has also decided to introduce net-metering regime.
The regime will enable commercial units, industry and household consumers to install solar PV panels on their roof tops who will be able to sell surplus electricity in the national grid through the mechanism provided in net-metering regulations. This will not only provide an opportunity for the common man to earn energy based income but will also mitigate the shortfall of energy, bringing stability in the system. It is expected that GoP will introduceafinancialpackagetofacilitatehouseholdconsumersashasbeendoneinthecaseofsolartubewellschemes.
The introduction of this regime will encourage the investors to setup necessary solar panel and allied equipment manufacturing facilities in the country to further reduce its cost. Such facilities will help in generation of employment opportunities throughout the country. Solar panels and net-metering are also expected to encourage provision of electricity in remote areas through off-grid solutions.
1.25 Special Purpose Transmission Licence under Section 19 of NEPRA Act (Special Transmission Facilities for Private Entities)Only a distribution licensee has an exclusive right to construct, own, maintain and operate the 132 kV and 11 kVlines/networksinthespecifiedserviceterritoryofthatDISCOasperprovisionsunderSection20and21ofthe Act. Therefore, no entity can engage in the distribution regime except a DISCO. However, under Section 19

11
State of Industry Report 2015
of the Act, the Authority granted a Special Purpose Transmission Licence (SPTL) to a private entity to engage in construction,ownership,maintenanceandoperationofspecifictransmissionfacilities(66kVandabove)builtfor provision of transmission and interconnection services to NTDC and others by connecting its facilities at transmission and distribution networks.
SPTL regime will not only open the sector, it will reduce response time for attending faults, restoration of system and increase reliability of transmission and distribution networks. Due to this regime, the opportunities for the private sector for investment in generation and transmission facilities within reasonable resources will increase. It is expected that introduction of SPTL regime will facilitate off-grid solutions for supplying electricity through the technologies like solar and small hydropower plants.
1.26 RecommendationsIn view of the above, following recommendations are made:
1.26.1 For the power sector to come out of the existing crises, it is critical that timely completion of planned powergenerationprojects,specificallythroughChina-PakistanEconomicCorridorisensured.
1.26.2 For the protection of environment from the emissions by coal power projects, the relevant agencies must adopt an aggressive monitoring regime before and during operation of such power plants.
1.26.3 Infrastructure for coal transportation and R-LNG are potential hotspots on which the operation of the mid country coal power plants and R-LNG based power plants is dependent. In view thereof, it shall be ensured that infrastructure for coal transportation and R-LNG meet the timeline envisaged for respective projects.
1.26.4 Transmission and distribution are hardly adequate to meet the existing requirements and have little or no potential to absorb planned generation in the South. In view thereof, it is imperative that transmission and distribution systems may be strengthened and stabilized besides completion of new transmission and distribution systems planned to transmit electricity generated by upcoming projects.
1.26.5 The Federal Government may provide incentives to the households intending to enter into net-metering regime on the lines already announced for solar tube well schemes.
1.26.6 In order to reduce losses, control theft and improve the service delivery to consumers and effective revenue recording, use of technology i.e. smart meters/prepaid meters may be immediately introduced in all DISCOs.
1.26.7 Out-sourcingofinefficientserviceindistributionsystemmaybeexploredandconsidered by theDISCOs.

12
State of Industry Report 2015

PERFORMANCE OF GENERATION SECTOR 2


15
State of Industry Report 2015
2. PERFORMANCE OF GENERATION SECTOR
2.1 GeneralTheinstalledgenerationcapacityoftheNTDC'ssystemon30th June, 2015 stands at 22,928 MW, against 21,424 MW on 30th June, 2014 recording an increase of 1,504 MW or 7.02% over the last year. The power plants connectedwithNTDC'ssystemgenerated97,284GWhofenergyduringtheyear2014-15,whileoverthesameperiod during 2013-14, 93,903 GWh were produced; an increase by 3,381 GWh or 3.60%. During July, 2014 to June2015,themajoradditionstoinstalledcapacityofNTDC'ssystemareGuddu(747MW)andNandipur(425MW)thermalpowerplants.Inaddition,320MWhavebeenaddedtoNTDC'ssystemthroughrenewableandalternative energy (Solar, Wind and Bagasse) based power plants during 2014-15.
2.2 Source-wise Installed CapacityThe following table gives additional details of installed capacity and energy generation by different power plantsconnectedwithNTDC'ssystemandcomparisonoflasttwoyears:
SourceInstalled Capacity
(MW)Generation
(GWh)Variation
Capacity Generation
2013-14 2014-15 2013-14 2014-15 MW % GWh %
WAPDA Hydel 6,902 6,902 31,656 31,877 0 -- 221 0.70
IPPs Hydel 214 214 1,015 1,070 0 -- 55 5.43
Total Hydel 7,116 7,116 32,671 32,947 0 -- 276 0.84
GENCO-I 1,024 1,024 3,152 3,320 0 -- 168 5.32
GENCO-II 1,690 2,437 4,484 5,541 747 44.20 1,057 23.56
GENCO-III 1,965 2,390 5,307 5,203 425 21.63 -104 -1.96
GENCO-IV 150 150 112 141 0 -- 29 26.21
Total GENCOs 4,829 6,001 13,055 14,205 1,172 24.27 1,150 8.81
Thermal IPPs 8,723 8,735 43,706 44,332 12 0.14 626 1.43
Nuclear 650 650 4,208 5,006 0 -- 798 18.97
Wind 106 256 263 459 150 141.50 196 74.58
Bagasse 0 70 0 308 70 -- 308 --
Solar 0 100 0 28 100 -- 28 --
GRAND TOTAL 21,424 22,928 *93,903 *97,284 1,504 7.02 3,381 3.60* The generation from SPPs/CPPs and energy import from Iran have not been included.Source: NEPRA
2.3 HydropowerIt may be noted that the installed capacity of WAPDA Hydropower remaining at 6,902 MW in 2014 and 2015, the 31,877 GWh generated in 2014-15 shows an increase of 221 GWh from the last year. Similarly, the IPP (hydel) also contributed 55 GWh more in the system during 2014-15 with the same installed capacity as in 2013-14. The hydropower production pattern over the year remained consistent with the historical trends. The availability and overall performance of hydropower plants has also remained satisfactory during the 2014-15.
2.4 ThermalOn the thermal side, overview of the public sector GENCOs is as follows:
2.4.1 Jamshoro Power Company Limited (GENCO-I)There has been no increase in the installed capacity of 1,024 MW of GENCO-I Power Stations at the end of June, 2015 over that of 2014. The GENCO-I has a dependable capacity of 830 MW. The energy generated by GENCO-I during the 2014-15 was 2,961 GWh, while, it was 3,153 GWh in 2013-14; a decrease of 192 GWh or 6.09%, over lastyear.NetelectricalefficiencyofGENCO-Iduring2014-15stoodat28.30%.Withacapacityutilizationof

16
State of Industry Report 2015
45.66% due to forced outages and various maintenance issues, the overall performance of GENCO-I has not been satisfactory.
2.4.2 Central Power Generation Company Limited (GENCO-II)Total installed capacity of GENCO-II, up to 30th June, 2015 has been noted as 2,437 MW, while the capacity available for generation i.e. the dependable capacity is observed as 1,952 MW. The installed and dependable capacities of GENCO-II were 1,690 MW and 1,180 MW respectively at the end of June, 2014. During the 2014-15, the installed capacity of GENCO-II has increased by 747 MW or 44.20%, as compared to 2013-14, due to the addition of Guddu 747 power plant. The energy generated by GENCO-II during the 2014-15 has been recorded at 5,610 GWh, while, it was 4,444 GWh during the 2013-14. The energy generated by GENCO-II during the 2014-15, has increased by 1,166 GWh or 26.24%, compared with that of the last year.
It is observed that various units of GENCO-II have been off-bar for more than two years due to various maintenance issues, forced outages, fuel constraints and rehabilitation activities etc. and are not being fully utilized. With annualefficiencyof33.95%andcapacityutilizationofonly32.43%,theoverallperformanceofGENCO-IIhasbeen unsatisfactory.
2.4.3 Northern Power Generation Company Limited (GENCO-III)Total installed capacity of GENCO-III, up to 30th June, 2015 has been noted as 2,151 MW, while the capacity available for generation i.e. the dependable capacity is observed as 1,925 MW. The installed and dependable capacities of GENCO-III were 1,726 MW and 1,530 MW respectively at the end of June, 2014. During the 2014-15, the installed capacity of GENCO-III has increased by 425 MW or 21.63%, as compared with that of the year 2013-14, due to the addition of Nandipur power plant. The energy generated by GENCO-III during the 2014-15 was 4,627 GWh, while it was 5,307 GWh during the 2013-14 showing a decline of 680 GWh or 12.81%, compared with the last year.
ItisobservedthatvariousunitsofGENCO-IIIhaveremainedoff-barsincelongduetotheirpoorefficiencylevels.TheoverallnetefficiencyofGENCO-III isalsovery lowat24.84%.Furthermore,duetovariousmaintenanceissues, forced outages and fuel constraints etc. resulting in annual capacity utilization of 38.44%, the overall performance of GENCO-III cannot be termed as satisfactory.
2.4.4 Lakhra Power Generation Company Limited (GENCO-IV)Total installed capacity of GENCO-IV, up to 30th June, 2015 has been noted as 150 MW, while the capacity available for generation i.e. the dependable capacity is observed as 30 MW. GENCO-IV had three units of 50 MW, however, due to lack of proper maintenance and cannibalization, only one unit is in working condition though at a reduced level for the past number of years. GENCO-IV during 2014-15 generated 102 GWh.
It may be noted that, against the installed capacity of 150 MW, approximately, one third capacity of GENCO-IV isavailableforgeneration,whichalsoisnotbeingfullyutilizedduetoforcedoutagesetc.Withnetefficiencyof17.74%, the overall performance of GENCO-IV has not remained satisfactory.
2.4.5 Overall Performance of GENCOsItisnotedthat,althoughthetotalinstalledcapacityofGENCOs'powerplantshasincreasedby1,172MWduringthe2014-15(includingefficientmachinesatGuddu),ascomparedwiththecapacityof thesepowerstationsduring theyear2013-14, the impactof increasedcapacityofGENCOspowerplants isyet tobe reflected inthe performance of these power stations. It is noted that overall non-availability of GENCOs on account of fuel constraints reduced in 2014-15 due to better availability of fuel at all the GENCO power plants. The overall furnaceoilinventoryatthefiveplantssuppliedbyPSO(Muzaffargarh,Jamshoro,KAPCO,HUBCOandNandipur)was only 49,123 metric tons in June 2014, which increased to 223,819 metric tons in June 2015.
It is also observed that other than fuel, GENCOs power plants remained off bar, due to various maintenance issues, forced outages, and rehabilitation activities etc. and their available capacity has not been fully utilized. The prevailing situation warrants maximum generation from public sector thermal power plants to cater for the dire need of the system.

17
State of Industry Report 2015
2.4.6 Independent Power Producers (IPPs)Total installed and dependable capacities of thermal IPPs at the end of June, 2015 are noted as 8,735 MW and 7,935 MW respectively, representing a ratio between dependable and installed capacities of 0.91. These capacities were 8,723 MW and 7,960 MW during June, 2014 representing a ratio of dependable and installed capacities as 0.912. The energy generated by thermal IPPs during the year 2014-15 is noted as 45,369 GWh, against 44,809 GWh during the year 2013-14.
It is also noted that due to certain disputes with NTDC/WAPDA, two IPPs namely Japan Power and SEPCOL are not contributing power to the grid and if these issues are properly addressed, approximately 270 MW will be added to the National Grid, which will help reduce the demand and supply gap of the system.
2.4.7 Installed versus Dependable CapacityThe ratios between the dependable capacity and the installed capacity of the four GENCOs are also noted here:
Ratio of Dependable Capacityand Installed Capacity
GENCO-I(JPCL)
GENCO-II(CPGCL)
GENCO-III(NPGCL)
GENCO-IV(LPGCL)
2013-14 0.81 0.70 0.78 0.20
2014-15 0.81 0.80 0.80 0.20Source: NEPRA
The ratios of dependable capacity and installed capacity for GENCOs and IPPs (indicated earlier) provide clear evidence about the manner in which the private and public sectors have been able to maintain their power plants. Whereas such ratios are more than 90% in both the years for IPPs, GENCO-I has a ratio of slightly more than 0.8, whereas ratios close to 0.8 have been achieved by GENCO-II and GENCO-III, only after new plants were added (Guddu 747 and Nandipur 425). The present state of GENCO-IV is evidence of typical public sector management failure, which has deprived the sector of a source of cheap power.
2.4.8 Manpower to MW RatioThe following table compares the ratio between the number of employees and MW installed in different power plants in Pakistan and other countries. It may be noted that only one plant in Bangladesh has comparable ratio with GENCO-II, whereas all other power plants have very low ratios of manpower per MW.
S.No.
Power Plant LocationInstalled Capacity
(MW)No. of
EmployeesManpower
to MW ratio
Capacity Utilization
(%)
1 HUBCO Pakistan 1,292 300 0.232 64.48
2 KAPCO Pakistan 1,345 588 0.437 58.81
3 Lal Pir Power Pakistan 362 110 0.303 54.29
4 Pak. Gen. Power Pakistan 365 110 0.301 40.29
5 Tongi Power Bangladesh 105 98 0.933 ---
6 NTPC India 652 295 0.452 ---
7 MSEB India 912 277 0.303 ---
8 Power Gen. UK 700 33 0.047 ---
9 GENCO-I Pakistan 1,054 1,578 1.490 45.66
10 GENCO-II Pakistan 2,431 1,977 0.813 32.43
11 GENCO-III* Pakistan 1,921 2,634 1.370 38.44
12 GENCO-IV Pakistan 150 546 3.640 53.33* Excluding Nandipur and Shahdara Power Plant and including NGPS Multan.Source: NEPRA, GENCOs

18
State of Industry Report 2015
2.5 Nuclear (CHASNUPP-I and II)During the year 2014-15, total installed and dependable capacity of Nuclear power plants connected with NTDC'ssystem,arenotedas650MWand615MWrespectively,whicharethesamefortheyear2013-14.Theenergy generated by Nuclear power plants during the year 2014-15 stands at 5,006 GWh, which is an increase of 798 GWh over the energy during the year 2013-14. The overall performance of Nuclear power plants connected withNTDC'ssystemhasremainedsatisfactoryduringtheyear2014-15asnomajoroutageisnoted.
2.6 WindDuring2014-15,totalinstalledcapacityofwindpowerplantsconnectedwithNTDC'ssystem,isnotedas256MW, while, it was 106 MW during the year 2013-14. The installed capacity of wind power plants has increased by 150 MW during the year 2014-15 due to the addition of three wind based power plants (FWEL-I, FWEL-II and TGF) having capacity of 50 MW each. 459 GWh of energy has been generated by wind power plants during the 2014-15 against 263 GWh during the 2013-14.
2.7 BagasseDuring 2014-15, three new bagasse based power plants (JDW-II, JDW-III and RYKML) have been connected withtheNTDC'ssystemhavingtotalinstalledcapacityof70MW,while,therewasnobagassebasedgeneratingfacility during the year 2013-14. The energy generated by these power plants, during the 2014-15 is noted as 308 GWh.
2.8 SolarDuring2014-15, 100MWoffirst solarpowerproject (Quaid-e-AzamSolar)hasbeenadded to theNTDC'ssystem, contributing 28 GWh.
2.9 K-Electric LimitedAs for K-Electric Limited, the Implementation Agreement (IA) and the Amended Implementation Agreement (AIA) put binding requirements on it to make certain investment for refurbishment and development of generation, transmission and distribution sectors. It is noted that K-Electric was required to enhance its generation capacity by 1000 MW over the capacity indicated in its Generation Licence. K-Electric has added the following facilities to its Generation capacity:
Name of Commissioned Plants Capacity (MW) Year
Korangi Combined Cycle Power Plant (KCCPP) 220.00 2009
Gas Engines at Korangi 97.31 2013
Gas Engines at SITE 97.31 2013
CCPP at Bin Qasim 572.67 2013
Steam Turbine at KCCPP 27.50 2015
Steam Turbine at Gas Engines at Korangi 10.00 2015
Steam Turbine at Gas Engines at SITE 10.00 2015
Total 1,034.79Source: K-Electric Limited

19
State of Industry Report 2015
However, at the same time, K-Electric also retired or permanently closed following power plants:
Name of Retired or Closed Plants Capacity (MW) Year
Korangi Thermal Power Station (Unit 4) 125 2013
Korangi Town Gas Turbines Power Station (Units 1, 2 & 4) 75 2013
SITE Gas Turbines Power Station (Units 1, 3, 4 & 5) 100 2013
Korangi Thermal Power Station (Unit 3) 125 2015
Korangi Town Gas Turbines Power Station (Unit 3) 25 2015
SITE Gas Turbine Power Station (Unit 2) 25 2015
Bin Qaim Unit 4 (closed) 210 2012
Total 685Source: K-Electric Limited
Therefore, effectively about 349 MW has been added by K-Electric considering retirement and permanent closure of its generation facilities. Since K-Electric is responsible for maintaining integrated systems of generation, transmission and distribution, therefore shortage of generation capacity is not helpful in overcoming supply and demand gap. Inability of K-Electric to effectively increase its generation capacity has made it dependent on external power sources, including the import from NTDC system. To meet demand, it has to operate its generationfacilitiesandotherresourcesspecifically650MWfromNTDCattheirmaximum.Itmayalsobenotedthat the contract of power supply between NTDC and K-Electric has already expired, however, the power is still being imported out of necessity.

20
State of Industry Report 2015
PERFORMANCE OF TRANSMISSION SECTOR

PERFORMANCE OF TRANSMISSION SECTOR 3


23
State of Industry Report 2015
3. PERFORMANCE OF TRANSMISSION SECTOR
3.1 GeneralThe transmission line network of NTDC includes 5,197 km long transmission lines operating at 500 kV level and 9,814 km long 220 kV lines. The power generation plants connected at high voltage levels are summarized here:
Voltage Level 500 kV 220 kV 132 kV Total
Installed Capacity (MW) 6,948 9,625 6,172 22,745Source: NTDC
As of 30th June 2015, NTDC is maintaining 13 No. 500 kV grid stations with a transformation capacity of 18,624 MVA. There are 33 No. 500/ 220 kV transformers and 28 No. 220/132 kV transformers installed at these grid stations. At 220 kV level there are 37 grid stations with a transformation capacity of 24,063 MVA. There are 101 No. 220/132 kV transformers installed at 220 kV and after inclusion of 28 No. 220/132 kV transformers installed at 500 kV grid stations, total 220/132 kV transformers come to 129.
3.2 Overloading of Existing Power TransformersAs discussed earlier, the transmission system is critical for a reliable power supply to DISCOs. The following table showsoverloaded(above80%)transformersat500kVand220kVgridstationsindifferentregionsdefinedbyNTDC. It is also noted that on average around 11,000 MW to 15,000 MW have been transmitted through these transformers in different months depending on the generation and electricity load demand. With increasing demand and more generation expected in the system as a result of upcoming projects, the overloading of below noted transformers would also increase in future years.
A. Over Loading of 500 kV and 220 kV Transformers at 500 kV Grid Stations:
(above 80%)
Continued.....

24
State of Industry Report 2015
(above 80%)
(above 80%)
Source: NTDC
B. Over Loading of 220 kV Transformers at 220 kV Grid Stations
Continued.....

25
State of Industry Report 2015
(above 80%)
Continued.....

26
State of Industry Report 2015
Shikarpur
T-1 220/132 160 700 660 94.29 T-2 220/132 160 700 640 91.43 T-3 220/132 160 700 640 91.43
T.M.K. Road
T-1 220/132 160 700 690 98.57 T-2 220/132 160 700 680 97.14
Khuzdar T-1 220/132 160 700 680 97.14
(above 80%)
There are 13 No. 500 kV Grid Stations with 33 transformers at 500/220 kV level. Out of these 8 transformers are loaded above 80% of their rated capacity. Similarly, out of total 129 No. 220/132 kV transformers 90 transformers are overloaded representing around 70% overloading in the system.
3.3 Power Dispersal Constraints in Transmission NetworksIn addition to overloading of EHV transformers, constraints in power dispersal from certain major power plants andqualityissuesinNTDC'ssystemhavealsobeenreported.AsperinformationanddatareportedtoNEPRA,following power plants faced evacuation problems due to transmission constraints.
3.3.1 Uch-II Power (Pvt.) LimitedUch-IIisalowBTUGasfiredpowerplanthavinggrosscapacityof404MWandnetcapacityof375.2MWlocatedat Dera Murad Jamali, District Naseerabad, Balochistan. It was planned to construct a 125 km long 220 kV double circuit twin bundle transmission line form Uch-II power plant to Sibbi substation for evacuation of power. The proposed transmission line was to pass through three (03) Districts of Balochistan Province (a) Naseerabad (b) Kachi and (c) Sibbi. In addition, a 500 kV grid station at Shikarpur was also to be constructed.
Due to non-fulfillment of contractual obligations by NTDC, Uch-II power plant is facing power dispersalproblems, transmission system constraints and frequent tripping on EHV networks. The reasons for delay in completion of the transmission projects by NTDC are reportedly: (a) Late retendering, (b) Bad law and order situation in the area, (c) Security threats to Supervisory Engineers, Revenue Staff and Construction Crews and (d) Failure to start major construction activity on time.
3.3.2 Engro Powergen Qadirpur LimitedEngro Powergen Qadirpur Limited (EPQL) is a combined cycle power plant having installed capacity of 226.52 MW with derated capacity of 223.8 MW located at Qadirpur, District Ghotki, Sindh. This plant is also facing the problem of low dispatch/part load operation due to limitation and constraints of auto-transformer at 500 kV Guddu Grid Station, which is reportedly resulting in a revenue loss of Rs. 80 million per year to the GoP.
3.3.3 Altern Energy LimitedAltern Energy Limited (AEL) complex is facing frequent tripping due to over/under voltage from 66 kV WAPDA grid. Further during the year 2012-13 and 2013-14, AEL has experienced tripping 63 and 99 times respectively due to WAPDA grid failure resulting in generation loss of 1459.25 MWh and 1309.57 MWh respectively.
3.3.4 TNB Liberty Power LimitedThe power evacuation constraints confronted by the company are due to the tripping of grid system and other technical reasons of transmission lines.
3.3.5 Habibullah Coastal Power Company LimitedThe two major issues which have been faced by the generation facility resulting in non-optimal power evacuation are, gas curtailment during the winter months and low voltage on the power system.
3.3.6 Foundation Power Company (Daharki) LimitedAs per PPA signed between NTDC and FPCDL, the plant was to be connected with 220 kV New Rohri Grid, but due to delay in construction of 220 kV grid and transmission lines, the Daharki power complex was temporarily connected with 132 kV grid station Sadiqabad. NTDC constructed a temporary grid of 220/132 kV adjacent to

27
State of Industry Report 2015
FPCDL. FPCDL has experienced many tripping since commissioning due to the problems in transmission lines between Guddu and Sadiqabad. Later on, 220 kV New Rohri grid was commissioned and power dispersal was provided on both end, but still major part of power dispersal is through 132 kV Sadiqabad which is not an efficientsolution.
3.3.7 Nishat Power Limited and Nishat Chunian Power LimitedBoth companies are facing power evacuation problems since commissioning due to constraints in LESCO grid system. The main problem is the constraint in the capacity of three feeders which connect Bhai Pheru and Sarfraz Nagar Grids. In case one line is out, the remaining two get overloaded and trip; leading to total shutdown of both Nishat Power Plants (400 MW) and supply failure at all the above mentioned grids due to disconnection from NPCC. As reported, Nishat Power has faced 14 such shutdowns during last 12 months. Similarly, Nishat Chunian has faced 45 shutdowns since commissioning of its plant.
3.4 Induction of New Generation Power PlantsThe following table provides yearly additions in the generation capacity as planned under different initiatives by the federal government and private sector:
Sr.No. Name of the Project Location Installed
Capacity (MW)Commissioning
DateAddition during Fiscal Year 2015-16
1 Sapphire Wind Power Company Limited Jhampir, Sindh 49.5 October, 20152 Appolo Solar Development Pakistan
Limited (Zonergy)Lal Sohanra, Cholistan, Punjab
100 December, 2015
3 Best Green Energy Pakistan Limited (Zonergy)
Lal Sohanra, Cholistan, Punjab
100 December, 2015
4 Crest Energy Pakistan Limited (Zonergy) Lal Sohanra, Cholistan, Punjab
100 December, 2016
5 CHASNUPP-III Chashma, KPK 340 March, 2016Addition during Fiscal Year 2016-17
6 Elbel Green Energy Pakistan Limited (Zonergy)
Lal Sohanra, Cholistan, Punjab
100 July, 2016
7 Flare Solar Development Pakistan Limited (Zonergy)
Lal Sohanra, Cholistan, Punjab
100 July, 2016
8 Golden Eye Solar Development Pakistan Limited (Zonergy)
Lal Sohanra, Cholistan, Punjab
100 July, 2016
9 Yunus Energy Limited Jhampir, Sindh 50 July, 201610 Metro Power Company Limited Jhampir, Sindh 50 July, 201611 Tenaga Generasi Limited Gharo/Bhambore/
Kuttikun, Sindh49.5 July, 2016
12 Gul Ahmed Energy Limited Jhampir, Sindh 50 July, 201613 Master Wind Energy Limited Jhampir, Sindh 49.5 July, 201614 HydroChina Dawood Power Limited Gharo/Bhambore/
Kuttikun, Sindh49.5 July, 2016
15 Tapal Wind Jhampir, Sindh 30 July, 201616 United Energy Pakistan Limited Jhampir, Sindh 99 July, 201617 Zephyr Power (Pvt.) Limited Gharo/Bhambore/
Kuttikun, Sindh50 July, 2016
18 Neelum Jhelum Hydel Nauseri/Muzaffarabad, AJK
969 November, 2016
19 CHASNUPP-IV Chashma, KPK 340 December, 201620 High Flying Solar Development Pakistan
Limited (Zonergy)Lal Sohanra, Cholistan, Punjab
100 January, 2017
21 Indigo Solar Development Pakistan Limited (Zonergy)
Lal Sohanra, Cholistan, Punjab
100 February, 2017
22 King Rider Solar Development Pakistan Limited (Zonergy)
Lal Sohanra, Cholistan, Punjab
100 February, 2017
23 Tarbela 4th Ext. Project Tarbela, KPK 1,410 March, 201724 Patrind HPP Kunhar River, AJK 147 April, 2017
Continued.....

28
State of Industry Report 2015
Sr.No. Name of the Project Location Installed
Capacity (MW)Commissioning
Date25 LNG Based Plants (Phase-I) Bhikki/Baloki, Punjab 2,400 April, 201726 Solar Power Plants near Chishtian Chishtian, Punjab 300 June, 2017
Addition during Fiscal Year 2017-1827 Keyal Khwar Dasu District, KPK 128 October, 201728 Coal Plant at Sahiwal Sahiwal, Punjab 1,320 December, 201729 Port Qasim Power Plant Port Qasim Karachi,
Sindh1,320 December, 2017
30 Engro Thar Coal (Unit-1) Thar, Sindh 330 December, 201731 Nooriabad Gas Plant Nooriabad ,Sindh 100 December, 201732 Hub Power Company Limited Hub, Balochistan 660 December, 201733 Other Wind Power Plants Jhampir/Gharo/Bhambore/
Kuttikun, Sindh973 December, 2017
34 Engro Thar Coal (Unit-2) Thar, Sindh 330 April, 201835 LNG Based Plants (Phase-II) Haveli Bahadur Shah,
Jhang, Punjab1,200 April, 2018
36 Coal Plant at Salt Range Salt Range, Punjab 300 June, 201837 Tarbela 5th Ext. Project Tarbela, KPK 1,320 June, 201838 Hub Power Company Limited Hub, Balochistan 660 June, 201839 SSRL Thar, Sindh 1,320 June, 2018
Addition during Fiscal Year 2018-1940 Golen Gol HPP Chitral, KPK 106 July, 201841 Siddiqsons Energy Limited Port Qasim, Sindh 350 June, 201942 Lucky Electric Power Company Ltd. Port Qasim, Sindh 660 June, 201943 Grange Holding Arifwala, Punjab 163 June, 2019
Addition during Fiscal Year 2019-2044 CASA Cross Border
Interconnection1,000 July, 2019
45 Gulpur Poonch River Poonch River/Gulpur, AJK
100 October, 2019
46 TPS Jamshoro (Phase-1) Jamshoro, Sindh 660 December, 201947 TPS Jamshoro (Phase-2) Jamshoro, Sindh 660 March, 202048 Dasu HPP-1 7 km upstream of Dasu
Village on Indus River, KPK2,160 June, 2020
Addition during Fiscal Year 2020-2149 Karachi Coastal Power Plant (Unit-1) Karachi, Sindh 1,100 August, 202050 Karachi Coastal Power Plant (Unit-2) Karachi, Sindh 1,100 June, 2021
Addition during Fiscal Year 2021-2251 Suki Kinari HPP Kunhar River/
Mansehra, KPK840 September, 2021
52 Karot HPP Jehlum River, Distt. Rawalpindi, Punjab
720 June, 2022
53 Kotli HPP Poonch River/Kotli, AJK 100 June, 202254 Azad Pattan HPP Jehlum River/Sudhnoti, AJK 640 June, 202255 Coal Plant at Lakhra Lakhra, Sindh 660 June, 2022
Source: NTDC
A summary of above additions is shown in the following table:(MW)
2015-16 2016-17 2017-18 2018-19 2019-20 2020-21 2021-22 TotalSindh 49.50 477.50 4,373 1,010 1,320 2,200 660 10,090Punjab 300 3,300 2,820 163 0 0 720 8,303Khyber Pakhtunkhwa 340 1,750 1,448 106 3,160 0 840 6,644Balochistan 0 0 1,320 0 0 0 0 1,320AJK 0 1,116 0 0 100 0 740 1,956Total 689.50 6,643.50 9,961 1,279 4,580 2,200 2,960 28,313
Source: NTDC

29
State of Industry Report 2015
3.5 Future NTDC NetworkAs discussed earlier new transmission lines and grid stations are essential for the new power generation projects which also include the projects proposed under the China-Pakistan Economic Corridor. NTDC has plans to strengthen its system and also add new transmission facilities to remove system constraints and to cater for thenewpowergeneration.ThefollowingfigureshowsNTDC'sEHVtransmissionsystemplanneduptoyear2021-22.

30
State of Industry Report 2015
3.6 NTDC Financial PlansNTDC has also prepared its 5 years Investment Plan (2015-16 to 2019-20) for construction of new grid stations/transmission lines and for augmentation and extension in its existing transmission networks as follows:
Financing Requirement for Five Year Plan
S. No.
DescriptionCompletion
YearNo. of
Projects
EstimatedCost
Financing Arranged
Financing Required
Mil. Rs. Mil. US$ Mil. Rs. Mil. US$ Mil. Rs. Mil. US$
1 Short Term Plan (Ongoing Projects) 2015-16 22 94,249 1,174 89,419 1,127 4,830 47
2Medium Term Plan (Projects Ready for Implementation)
2016-17 21 106,017 1,153 47,373 557 58,664 596
3Long Term Plan(Future Development Projects)
2019-20 21 141,882 1,391 51,000 500 90,882 891
Total 64 342,148 3,718 187,792 2,184 154,356 1,534Source: NTDC
Under short term projects, expected to complete in 2015-16, new transformation capacity, augmentation in transformation capacity and addition in transmission lines are planned as shown in the table here:
S. No.Voltage Level
(kV)Addition in Transformation Capacity (MVA) Addition in
Transmission Line (km)New Augmentation Total
1 500 4500 300 4800 549
2 220 6050 900 6950 687Source: NTDC
The total estimated cost for above plan is US$ 1,174 million of which an amount of US$ 384 million has already been incurred. Under medium term projects, expected to complete in 2016-17, 1800 MVA and 3430 MVA of transformation capacity is to be added at 500 kV and 220 kV grid stations respectively. Further to that 1637 km and 426 km of 500 kV and 220 kV transmission lines respectively will also be added.
Under long term projects, to be completed by 2019-20, 4500 MVA transformation capacity at 500 kV and 6000 MVA at 220 kV grid stations are to be added. Addition of 1099 km at 500 kV and 543 km long 220 kV transmissionlinesisalsobeexpectedunderlongtermplanforwhichUS$500millionwillbefinancedbytheWorldBankandJICA.RemainingfinancingrequirementofUS$891millionnotyetarrangedforlongtermplan.In addition to the plans up to 2019-20, funding will also be required in 2021-22 to meet minimum objectives of reliability, requiring all out efforts by the relevant agencies.
3.7 K-Electric Transmission SystemBased on the information provided by K-Electric, the year-wise status of Transmission lines and Grid stations is as follows:
Transmission Lines in km 2010-11 2011-12 2012-13 2013-14 2014-15
Overhead Lines
220 kV 321 321 323 323 323
132 kV 611 611 611 611 611
66 kV 149 149 149 149 149
Underground Lines
220 kV 17 17 15 15 15
132 kV 150 150 150 150 151
66 kV 0 0 0 0 0Source: K-Electric Limited

31
State of Industry Report 2015
It may be noted that only 2 km of 220 kV overhead transmission lines have been added by K-Electric over the fiveyears,whereastheunderground220kVlineshavebeenreducedby2km.Only7kmof132overheadlinesand 30 km of 132 kV underground lines have been added in 2010-11 whereas no further additions have been made over the remaining period till 2014-15 and only 1 km of underground line was added. No additions have been made in the 66 kV transmission network. The status of Grid Stations owned by K-Electric is as follows:
K-Electric owned Grid Stations
2010-11 2011-12 2012-13 2013-14 2014-15
No. MVA No. MVA No. MVA N0. MVA No. MVA
220 kV 7 3000 7 3000 7 3000 7 3000 7 3000
132 kV 50 n.p 51 n.p. 52 4611 53 4679 54 4732
66 kV 3 n.p. 3 n.p. 3 60 3 60 3 69Source: K-Electric Limited
Reportedly, K-Electric has added/refurbished 4 grid stations of 132 kV whereas no transformation capacity has been added at 220 kV level over the 5-year period which stands at 3000 MVA.

32
State of Industry Report 2015

PERFORMANCE OF DISTRIBUTION SECTOR 4


35
State of Industry Report 2015
4. PERFORMANCE OF DISTRIBUTION SECTOR
4.1 Constraints in DISCOs’ SystemDISCOs have constraints in their network which restrict their ability to supply power from their 132 kV network to11kVsystem.SuchconstraintsinDISCOs'systemhavetakenthebackseatuptillnow,howevertheseareinfact more damaging as the generation capacity though available, is not being supplied to the end-consumers. The following table shows that except for two companies having less than 40% overloaded transformers the others have close to or more than 50% of total transformers overloaded (loaded above 80% of their rated capacity):
132 kV (As on 30th June, 2015)
DISCOsTotal No. of
Grid StationsTotal No. of Power
Transformers
Total Capacity of Power Transformers
(MVA)
No. of Power Transformers Overloaded (Above 80%)
PESCO 67 176 4,559 95
TESCO 7 17 344 8
IESCO 78 168 4,048 65
GEPCO 52 149 3,800 78
LESCO 89 226 6,610 105
FESCO 62 146 3,984 95
MEPCO 96 201 5,106 131
HESCO 53 91 1,868 61
SEPCO 53 80 1,610 07
QESCO 58 118 2,597 63
Total 615 1,372 34,526 708Source: DISCOs
At the 11 kV level the problem areas are more pronounced. In Khyber Pakhtunkhwa, more than 51%, of 11 kV feeders are overloaded. Similarly, more than 51% distribution transformers are also overloaded in Khyber Pakhtunkhwa. Such a state of affairs calls for immediate attention of the management of the DISCOs and the relevant authorities at the federal level. The table below presents details in this respect:
Province
11 kV Feeders Distribution TransformersNo. of11 kV
Feeders
No. ofOver-Loaded
Feeders%
No. ofDistribution Transformers
No. ofOver-LoadedTransformers
%
Punjab 5,291 1,465 27.59 441,932 57,672 13.05Sindh 854 198 23.18 71,555 8,961 12.52Khyber Pakhtunkhwa 1,029 526 51.12 75,280 38,792 51.53Balochistan 570 85 14.91 51,886 8,282 15.96Total 7,744 2,274 29.36 640,653 113,707 17.75
Source: DISCOs
4.2 Receivables of DISCOsThe overall receivables of DISCOs at the end of June, 2015 increased by Rs. 120 billion over the previous year. it is noted that apart from Federal Government and agriculture tube wells in Balochistan which show a reduction of around Rs. 0.7 billion and Rs. 0.2 billion respectively, receivables from other areas increased. As on 30th June, 2015 the overall distribution sector receivables stood at Rs. 633 billion (including Rs. 43.97 billion pertaining to K-Electric) as shown in the following table:

36
State of Industry Report 2015
Break-up of Receivables of DISCOs Financial Year ended June, 2015 (Rs. in Billion)
S. No.
CategoryReceivables (FY ended
June, 2014)
July, 2014to June, 2015
Receivables (FY ended
June, 2015)Billing Collection
1 FEDERAL GOVERNMENT
a) Federal Governments Departments 0.431 12.207 12.487 0.145
b) Local Bodies under Federal Government 2.344 4.391 5.002 1.730
c) Autonomous Bodies under Fed. Govt. 1.488 6.392 6.284 1.579
d) Defence 0.082 15.855 15.946 -0.043
e) W&P 1.753 1.437 1.270 1.922
Total Federal Government 6.098 40.282 40.989 5.333
2 AJ&K GOVERNMENT
i) GoP Share 0.402 - - 0.402
ii) DISCOs Share -0.004 - - -0.004
iii) AJ&K Share 37.571 18.732 3.579 52.725
Total AJ&K 37.969 18.732 3.579 53.123
3 PROVINCIAL GOVT. DEPTTS./AGENCIES
a) Punjab 2.906 19.558 19.036 3.46
b) Khyber Pakhtunkhwa 19.851 6.220 6.389 19.715
c) Sindh 56.341 23.086 13.267 66.210
d) Balochistan 5.882 4.169 2.374 7.704
Total Provincial Govt. Deptts./Agencies 84.980 53.033 41.066 97.089
TOTAL (1 TO 3) 129.047 112.047 85.634 155.545
4 FATA (DOMESTIC CONSUMERS) 34.248 12.947 10.106 37.089
5 AGRICULTURAL TUBEWELLS IN BALOCHISTAN
i) GoP Share excluding GST subsidy 5.860 3.072 4.000 4.932
ii) GOB Share 2.068 4.609 3.908 2.768
Total Agri. Tubewells in Balochistan 7.928 7.681 7.908 7.700
6 PRIVATE 313.454 829.053 753.859 388.793
7 IPPS 0.028 0.619 0.629 0.018
8 KARACHI ELECTRIC LIMITED 28.204 51.572 36.000 43.974
GRAND TOTAL (3+4+5+6+7+8) 512.909 1013.919 894.136 633.119Source: PEPCO
4.3 Transmission and Distribution (T&D) Losses of DISCOsDISCOs'lossesremainedalmostatthesamelevelasforpreviousyear,ratheranumberofDISCOshavereportedhigher losses than earlier years.
DISCOs' Losses (2014-15)PESCO TESCO IESCO GEPCO LESCO FESCO MEPCO HESCO SEPCO QESCO
Targets set by the Authority (%) 26.00 22.31 9.44 9.98 11.75 9.50 15.00 20.50 27.50 17.50
Actual Results of DISCOs (%) 34.81 21.68 9.41 10.72 14.10 11.03 15.50 27.08 38.29 23.10
Source: NEPRA/DISCOs

37
State of Industry Report 2015
Adding further to T&D losses is the low recovery ratio of DISCOs. The Authority assessed a recovery target of 100% while setting the consumer tariff for DISCOs, however as per information the actual level of recovery remainedaround89.16%forthefinancialyear2014-15.
4.4 Circular DebtCircular debt is still a major issue confronting power sector. One of the contributors of circular debt remained hightransmissionanddistributionlossesinDISCOs.Basedonthecurrentlynotifiedconsumer-endtariffof(10th June, 2015), if DISCOs fail to show any improvement in their actual level of losses, the impact of missing the Authority’s set T&D loss target would result in an annual gap of Rs. 41 billion. It is pertinent to mention that theAuthorityhassetanaveragelosstargetof15.29%forthefinancialyear2014-15,whereasDISCOs'reportedlosses for the same period remained around 18.73%.
4.5 Tariff Differential SubsidyGoP is providing Tariff Differential Subsidy (TDS), primarily to the agriculture and residential class of consumers, having consumption of up to 300 units. The GoP intends to decrease the gap between NEPRA determined consumer-endtariffandtheGoPnotifiedtariffthroughimpositionofTariffRationalizationSurchargeonsomecategories of consumers of different DISCOs so that its burden in the shape of TDS is reduced. Without such surcharge, the TDS requirement would have been Rs. 135 billion, which with the tariff rationalization surcharge would be limited to Rs. 65 billion.
4.6 Constraints in K-Electric SystemAccording to K-Electric, there are a total of 1,431 feeders (11 kV) for supplying electricity to its consumers as summarized in the following table:
Year Sept. 2008 2008-09 2009-10 2010-11 2011-12 2012-13 2013-14 2014-15 Total
Addition per year --- 88 93 74 35 20 47 53 410
Total Feeders 1,021 1,109 1,202 1,276 1,311 1,331 1,378 1,431
Source: K-Electric
The record shows that K-Electric has generally supplied around 2100 to 2200 MW to its transmission and distribution network. Supplying more than above power through the system this June to meet increased load demand, has brought the constraints in its system to fore with increased tripping of grids, overloading of power transformers,damagetoPoleMountedTransformersandfireincidentsinthegridstations.Suchbehaviorofthe underlying network directly points to inadequacy of its transmission and distribution systems as these could not support the supply of additional power from generation plants. The Authority attributes this as a failure of K-Electric to timely plan, strengthen and construct its transmission and distribution networks so that reliable power supply is ensured.
4.7 Uploading of Performance Reports submitted by DISCOs and K-Electric on Quarterly Basis on WebsiteThe Authority decided that all DISCOs and K-Electric will upload their Performance Reports on their website, onquarterlybasisforawarenessandinformationofallstakeholdersandtofulfilltherequirementsofdonoragencies. Some of the DISCOs have initiated uploading of their data however the data uploaded in its present form is not relevant to the needs of the stakeholders and the Regulator.
4.8 Legal Proceedings against DISCOs and K-Electric due to non-compliance of Performance Standards (Distribution) Rules, (PSDR) 2005
Legal proceedings in the form of explanation and Show Cause Notices were initiated against all DISCOs and K-Electric due to non-compliance of PSDR, 2005. Accordingly, hearings in the matter were conducted, wherein, DISCOs were called to justify their position in respect of non-compliance of Distribution Standards.

38
State of Industry Report 2015

INITIATIVES BY NEPRA 5


41
State of Industry Report 2015
5. INITIATIVES BY NEPRA
NEPRA undertook following initiatives to facilitate setting up of new power plants of various technologies:
5.1 Upfront Tariff for Wind Power ProjectsNEPRA announced Upfront Tariff for Wind Power Projects which drew considerable interest of investors. Fourteen companies, with cumulative of 1128.70 MW, opted for Upfront Tariff for Wind Power Projects announced on 24th April, 2013. Three cases, 549.20 MW, were processed during the year under review. However, eight companies, havingaggregate installedcapacityof430.30MW,wereable toachievefinancial closewithin thespecifieddeadline of 31st March, 2015.
Upon expiry of the validity period of the previous Upfront Tariff, the Authority in exercise of its powers under the Act, Rules and Regulations decided to initiate proceedings for determination of new Upfront Tariff for generation of electricity from wind. A Public Hearing was held on 16th April, 2015 which was attended by the Alternative Energy Development Board, Planning Commission, Government of Sindh, Project Developers, Turbine Suppliers, and various other stakeholders. After detailed deliberations, Upfront Tariff, determined afresh, was issued on 24th June, 2015. Following levelized Upfront Tariff was determined:
Year Tariff (with 100% Foreign Debt) Tariff (with 100% Local Debt)
(Rs./kWh) (US cents/kWh) (Rs./kWh) (US cents/kWh)
1-10 Years 12.4782 12.2938 15.3226 15.0962
11-20 Years 5.7458 5.6609 5.9208 5.8333
Levelized 10.6048 10.4481 12.7064 12.5186Source: NEPRA
5.2 Upfront Tariff for New Bagasse based Co-Generation Power ProjectsIn order to facilitate co-generation power projects, NEPRA announced Upfront Tariff for new bagasse based co-generation power projects on 29thMay,2013whichwassubsequentlymodifiedon28th August, 2013.
Upon expiry of applicability period on 28th May, 2014, the Authority extended the validity of reference Upfront Tariff up to 28thMay,2015.TheapplicationforacceptanceofUpfrontTarifffiledbyHamzaSugarMillsLimited(15 MW) was processed and the decision was issued on 12th September, 2014.
5.3 Upfront Tariff for Coal Power ProjectsInduction of base-load power plants on relatively cheaper fuels has always been on top of the recommendations proposed by NEPRA. Therefore, for facilitating efforts of the Federal Government for bringing in large coal-based power plants, NEPRA announced Upfront Tariff for power plants on imported coal as well as coal at Thar, havingoneofthelargestreservesofligniteintheworld,whichisspecificforinvestorsinusingTharCoalbyoffering them relatively more attractive terms.
The Authority announced the following Upfront Tariffs for imported/local coal based power plants on 26th June, 2014forvariouscategoriesfor30yearswhichwasnotifiedvideSRONo.942(I)/2014dated5th October, 2014:
Capacity (MW)
Levelized Tariff (US Cents/kWh)
Local Financing Foreign Financing
Local Imported Local Imported
220 9.2978 9.6774 8.2537 8.6417
350 9.2759 9.6240 8.1784 8.5353
660 9.2100 9.5422 8.0116 8.3601
1100 8.7897 9.1198 7.6738 8.0189Source: NEPRA

42
State of Industry Report 2015
Various companies have unconditionally accepted the Upfront Tariff for Coal announced on 26th June, 2014 including Grange Power Limited (150 MW), Port Qasim Electric Power Company (Pvt.) Limited (2x660 MW), Huaneng Shandong Ruyi (Pakistan) Energy (Pvt.) Limited (2x660 MW), Lucky Electric Power Company Limited (660 MW) and Siddiqsons Energy Limited (350 MW).
The Authority announced following Upfront Tariffs based on Thar Coal on 9th July, 2014 for various categories for30years,notifiedvideSRONo.51(I)/2015dated20th January, 2015:
Capacity (MW)Levelized Tariff (US Cents/kWh)
Local Financing Foreign Financing
330 9.5643 8.5015
660 9.5668 8.3341
1100 9.1368 7.9889Source: NEPRA
The Engro Powergen Thar (Pvt.) Limited unconditionally accepted the Upfront Tariff for Coal.
5.4 Tariff for Conversion of Oil to Coal ProjectsThe Authority has approved the following tariff for coal conversion of existing RFO based Power Plants:
S. No. Company Capacity(MW)
Levelized Tariff(US Cents/kWh)
1 Lal Pir Power Limited 362 7.2087
2 Pak. Gen. Power Limited 365 7.1672
3 Saba Power Company (Pvt.) Limited 136 7.8919
Total Net Capacity 863Source: NEPRA
5.5 Upfront Tariff for Solar Power ProjectsNEPRA also approved Upfront Tariff for Solar Power Projects during the year for various categories for 25 years whichwasnotifiedvideSRONo.183(I)/2015dated3rd March, 2015:
Capacity (MW)Levelized Tariff (US Cents/kWh)
North Region South Region
>1≤20MW 15.0279 14.4096
>20≤50MW 14.8953 14.2825
>50≤100MW 14.7588 14.1516Source: NEPRA
Several companies unconditionally accepted the Upfront Solar Tariff announced on 22nd January, 2015. These included Quaid-e-Azam Solar Power (Pvt.) Limited, Appolo Solar Development Pakistan, Best Green Energy Pakistan Limited and Crest Energy Pakistan Limited with installed capacity of 100 MW each.
5.6 Upfront Tariff for Small Hydropower ProjectsNEPRA determined the generation tariff in matter of upfront tariff for Small Hydropower Generation Projects upto 25 MW installed capacity on 2nd April, 2015:

43
State of Industry Report 2015
Levelized Tariff100% Foreign Financing
(Rs./kWh)100% Local Financing
(Rs./kWh)Low Head (1-25 MW) 8.3194 10.8941High Head (1-25 MW) 7.6177 9.9960
Source: NEPRA
5.7 Upfront Tariff for LNG based Power ProjectsThe Authority announced the following Upfront Tariffs on 3rd April, 2015 for various categories of LNG based new power projects for 30 years:
Capacity (MW)Levelized Tariff (US Cents/kWh)
Local Financing Foreign FinancingLNG HSD LNG HSD
225 10.5541 16.8757 10.1767 16.4983400 9.9604 15.7785 9.5392 15.3572800 9.7797 15.5099 9.3628 15.0930
Source: NEPRA
5.8 Tariff for Short-Term IPPsNEPRA determined the generation tariff in the matter of utilization of existing available generation capacity Policy for Short Term IPP’s on 7th April, 2015. Reshma Power and Gulf Power unconditionally accepted the upfront tariff for Short-Term IPPs:
Year 1 Year 2 Year 3Tariff (Rs./kWh) 11.2799 11.2799 11.2799
Source: NEPRA
5.9 Development of NEPRA (Alternative and Renewable Energy) Distributed Generation and Net Metering Regulations, 2015
Inordertoencourageandpromoterenewableenergy inPakistan,specificallysolarandwind, theAuthoritydecided to look into the possibility of introducing net metering at the consumer level. Accordingly, an initial draft document of NEPRA (Alternative & Renewable Energy) Distributed Generation and Net Metering Regulations was prepared and uploaded on NEPRA website seeking comments from all concerned stakeholders.
After analyzing the comments of stakeholders, a revised document of NEPRA (Alternative & Renewable Energy) Distributed Generation and Net Metering Regulations was prepared which was approved by the Authority for notification.
5.10 Integrated Generation, Transmission and Distribution Plans (IGTDPs)
5.10.1 Development of IGTDPs Development of IGTDP was initiated to satisfy provisions under:
5.10.1.1 Section 31 (Tariff Setting) and Section 32 (Investment and Power Acquisition Programs) of the NEPRA Act, 1997.
5.10.1.2 NEPRA Tariff (Standards and Procedure) Rules, 1998.
5.10.1.3 Multi-year Tariff Setting for DISCOs under Federal Government’s National Power Policy, 2013.
5.10.1.4 National Tariff and Subsidy Policy, 2014 (Distribution Margin/Charges Determination and Expansion Plans).
5.10.1.5 Part–VI (Annual Tariff Methodology), Section 4 of NEPRA Tariff Methodology Guidelines, 2015.

44
State of Industry Report 2015
Major objective of IGTDPs is planning of power sector in a coordinated and integrated manner by taking into account NTDC’s expansion plan and investment plan. IGTDP also requires integration with generation projects currently under completion and future generation projects to be initiated under the Power Policy, 2013.
NEPRA Tariff Methodology Guidelines, 2015 require an integrated planning process for power sector. In order to comply with NEPRA Guidelines, Power Policy, 2013 and National Tariff and Subsidy Policy 2014, the Ministry of Water and Power directed all DISCOs and NTDC to submit their IGTDPs to NEPRA.
5.10.2 Evaluation/Review of IGTDPs by NEPRAThe following observations were noted while reviewing the IGTDPs of DISCOs:
5.10.2.1 The IGTDPs have been prepared based on a Power Market Survey (PMS) which was carried out in 2012-13 and the same has been added without updating the assumptions under the present scenario.
5.10.2.2 The yearly investments have been proposed without discussing the base-line conditions and the reasons for such base-line conditions. The documents assume that the performance indices as providedbytheDISCOstoNEPRAaspartoftheirAnnualReportsarenottruereflectionoftheirperformance therefore using these would not provide the true results.
5.10.2.3 Detailed analysis has not been carried out for the whole network. Top-Down approach has been usedandload-flowstudieshavebeencarriedouttodevelopexpansionplansfor132kVnetworkwhich is then translated to lower voltage expansions.
5.10.2.4 Detailed analysis about 11 kV and below system is missing. This approach totally fails to point out the issues at the 11 kV and lower levels.
5.10.2.5 The present approach is based only on estimating future growth of load demand and assuming that expansion based on the simulation studies would by itself take care of different problems.
5.10.2.6 No analysis has been carried out to back up the proposed improvement in Performance Standard Indices. Similarly, no supporting data has been included to justify reduction in Transmission and Distribution losses.
5.10.2.7 The benefit to cost ratios and payback period calculations are based on the simulation studieswithout linking those to the investment made by the companies over the previous years and whether DISCOs demonstrated to achieve such savings.
5.10.3 Recommendations for Resubmission of IGTDPsIn view of the above observations the IGTDPs submitted by the DISCOs were not accepted. The DISCOs were advised to follow the following guidelines for the preparation of their IGTDPs and resubmit the same for approval:
5.10.3.1 Identify base line conditions in respect of every feeder and every sub-division including technical losses,NEPRA’sPerformanceStandardIndicesandvoltageprofilesinthearea.
5.10.3.2 Recommend concrete proposals for improvement in relevant sub-division which are achievable as-well as measurable. For achieving the desired objectives, categorize the expansion schemes to include improvement in metering system, event recording, network digitization, loss reduction and so on.
5.10.3.3 Expansion due to increased demand is only one of the factors. DISCOs are also required to electrify villageseveryyearwhichononehandmaynotbefinanciallyviableandwouldcertainlyleadtomorelosses. It is important to include such schemes for review of the Regulator.

45
State of Industry Report 2015
5.10.3.4 Power Market Survey (PMS) needs to be updated and load growth is also required to be mapped at thesub-divisionlevel.Theloadflowstudieswillprovidethebasisforexpansioninthe132kVsystemalong with allied substations.
5.10.3.5 The expansion plans need to be linked with the least cost expansion plan which is missing in the current DISCOs submission.
5.10.4 Final Guidelines and Formats to Develop IGTDPs by NEPRAA full round of exercises (Workshops and Consultative Meetings) was conducted with USAID (as Consultant), NTDC and DISCOs in June, 2015. Finalized guidelines and associated formats have also been delivered to the licensees for preparation and resubmission of IGTDPs in an appropriate manner within stipulated time period.
5.11 Special Purpose Transmission Licence (SPTL) under Section 19 of NEPRA Act (Special Transmission Facilities for Private Entities)Under Section 19 of the Act, the Authority granted a SPTL to a private entity to engage in construction, ownership,maintenanceandoperationofspecifictransmissionfacilities(66kVandabove)builtforprovisionof transmission and interconnection services to NTDC and others (such as BPCs) by connecting its facilities at transmission and distribution networks.
5.12 Development of NEPRA Interconnection Guidelines, 2015As per requirement under clause 8.2.1 Guaranteed Market, Mandatory Purchase of Electricity of the Policy for Development of Renewable Energy (RE) for Power Generation 2006, it is mandatory for the DISCO(s) to buy all the electricity offered to them by the RE projects.
Similarly, clause 6.1 Point of Delivery of the Policy for Power Generation Projects 2002 provides different options for construction, maintenance and operations of the lines for power dispersal from power plants to point of delivery. Queries were however raised by the stakeholders about the maximum distance and voltage levels on which such projects were required to be connected. RE Policy 2006 and NEPRA Grid Code 2005 provided some of the relevant information; however, the same was not interpreted in a consistent manner.
NEPRA had already issued NEPRA (Sale of Electric Power by Renewable Energy Companies) Guidelines, 2015 which assign and clarify the responsibility of DISCO(s) and Transmission Company about procurement of power.
Inadditionoftheaboveguidelines,NEPRAformulatedtheinterconnectionguidelineswhichprovideaunifiedapproach about construction of interconnection facilities with the networks of NTDC and DISCOs.

46
State of Industry Report 2015

MONITORING OF THE SECTOR 6


49
State of Industry Report 2015
6. MONITORING OF THE SECTOR
6.1 Visits of DISCOs to Verify/Inspect the Sanctioned Load vis-a-vis Connected LoadDuringthereportedperiod,NEPRAprofessionalsvisiteddifferentDISCOsforverificationofthesanctionedloadviz-a-viz connected load of consumers for analyzing tripping and overloading position of DISCOs’ system:
So far, GEPCO, MEPCO, HESCO, SEPCO, LESCO, QESCO and PESCO have been visited and meetings with management of DISCOs were held. Power Distribution Centers were also visited for examining their demand, supply and load shedding plans.
Inquiries were also conducted about overloading of transformers, feeders and increased number of interruptions. Random inspection of load of a small sample of consumers (11 kV and 440 V) was also carried out. It was observed that:
6.1.1 The connected/running load of most of the consumers inspected under domestic, commercial and industrial B-2 consumers is more than their sanctioned load. Whereas, no action in form of issuing notices or extending the load has been taken by DISCOs.
6.1.2 A number of Transformers inspected were loaded from 80% to 100% due to which frequent tripping occur.
6.1.3 11 kV metering rooms inspected were found in poor conditions, having inadequate protection (relay) system.
6.1.4 Certain lines and Poles were also found in poor condition which lead to increasing number of interruptions.
6.2 Real Time MonitoringIn order to have improved access to data about the functioning of the sector, a real time monitoring of total power generation in Pakistan, power demand by DISCOs, allocation of power quota and load shedding plans will be started shortly, enabling NEPRA for effective evaluation of the performance of its licensees.
6.3 Undue Scheduled/Unscheduled Load Shedding by K-ElectricThe Authority noted that undue scheduled/unscheduled load shedding during the recent heat wave in 2015 was carried out by K-Electric. In this regard, the Authority, in order to determine the veracity of data and implementation of Performance Standards, constituted a team which visited K-Electric, wherein, same of its gridswerealsocheckedandfieldsurveyswereconducted.Duringthevisit,certaingridstationsofK-Electricwere found in poor conditions lacking proper maintenance.
6.4 Safety Record of Distribution CompaniesThesafetyaspectisconsideredasoneofthemostimportantparametersforjudgingDISCOs'performance.Thefollowing table shows that except for LESCO and SEPCO the number of safety incidents increased from last year. DISCOs will be asked to explain their position in this matter.

50
State of Industry Report 2015
Number of Safety Accidents for both Employees and Public
DISCOs/Years 2010-11 2011-12 2012-13 2013-14 2014-15
PESCO 19 25 25 20 29
IESCO 19 15 10 12 15
GEPCO 9 11 10 12 15
LESCO 25 29 14 35 24
FESCO 32 22 26 29 29
MEPCO 21 14 12 17 34
HESCO 46 26 7 14 22
SEPCO - 3 3 45 34
QESCO 20 16 07 02 20
K-Electric 26 14 9 5 4Source: DISCOs
6.5 Annual Performance Report (APR) of NTDCAs per requirements of Rule 9 of Performance Standards (Transmission) Rules (PSTR) 2005, APRs submitted by both NTDC and K-Electric for 2014-15, were analyzed and a comprehensive Performance Evaluation Report (PER) was prepared. As per PSTR, 2005 a comparison was made for each of the evaluated parameter for the last fiveyearsi.e.from2010-11to2014-15.
APR of NTDC for the year 2014-15 indicates variation in voltage limits beyond the permissible limits of ±5% (Normal Condition) and ±10% (N-1 Condition) of nominal voltage. Such deviations of NTDC from the permissible voltagelimitsrevealthevoltageprofilefor220kVSibbiandKhuzdarGridStationsremainedaslowas180kVand 185 kV respectively under normal conditions. Further, voltage limits violations show an increase of 6.2% as compared to 2013-14. It is noted that during 2014-15, most of the circuits of NTDC have not complied with the voltage limits as mentioned in PSTR, 2005. NEPRA would initiate necessary proceedings on the performance of NTDC under applicable documents.
0
5
10
15
20
25
30
35
40
45
50
PESCO IESCO GEPCO LESCO FESCO MEPCO HESCO SEPCO QESCO K-Electric
2010-11 2011-12 2012-13 2013-14 2014-15
DISCO-wise Number of Safety Accidents

51
State of Industry Report 2015
6.5.1 Number of Voltage Variations (Violating Prescribed Criteria)The performance indicator for NTDC with a region-wise breakup is shown as follows:
Condition Region 2010-11 2011-12 2012-13 2013-14 2014-15
Normal
Islamabad 14,081 13,413 24,065 22,539 30,165
Lahore 20,570 44,172 57,363 55,990 68,552
Multan 713 182 1,660 1,560 1,439
Hyderabad 17,014 20,754 26,347 43,973 28,958
N-1
Islamabad 4,677 1,788 3,215 2,906 1,914
Lahore 1,878 5,980 7,730 11,545 11,684
Multan ‒ ‒ ‒ 12 ‒Hyderabad 5,770 6,241 9,666 2,087 6,669
Total NTDC (Normal) 52,378 78,521 109,435 124,062 129,114
Total NTDC (N-1) 12,325 14,009 20,611 16,550 20,267
Total NTDC (Normal & N-1) 64,703 92,530 130,046 140,612 149,381Source: NTDC
The region wise details of voltage variations along with a comparison for the preceding years are shown as follows:
0
25,000
50,000
75,000
100,000
125,000
150,000
Region-wise Voltage Variations Violating Prescribed Criteria [Nos.]
2010-11 2011-12 2012-13 2013-14 2014-15

52
State of Industry Report 2015
A. Islamabad Region (Total Number of Violations)
S. No. Grid Station 2010-11 2011-12 2012-13 2013-14 2014-15
1 500 kV Rawat 611 3,749 7,473 7,242 9,376
2 500 kV Peshawar 1,108 1,521 3,807 335 2,538
3 220 kV Bannu 5,388 473 502 3,381 3,413
4 220 kV Burhan 76 8 30 73 422
5 220 kV Daud Khel 4,725 3,132 4,642 4,863 8,714
6 220 kV ISPR 27 77 13 19 9
7 220 kV Mardan 4,189 4,535 5,161 5,328 4,653
8 220 kV Shahi Bagh 2,100 1,288 4,975 3,840 1,991
9 220 kV University 534 418 677 364 963
Total 18,758 15,201 27,280 25,445 32,079Source: NTDC
B. Lahore Region (Total Number of Violations)
S. No. Grid Station 2010-11 2011-12 2012-13 2013-14 2014-15
1 500 kV Gatti 294 416 789 335 1,189
2 500 kV Nokhar – – – – –
3 500 kV Sheikhupura 78 621 75 78 4,837
4 220 kV Bund Road 707 325 3,035 4,574 4,031
5 220 kV Gakkhar 2,946 1,445 1,639 902 997
6 220 kV Jaranwala 70 19 222 303 278
7 220 kV Kala Shah Kaku 3,995 5,014 8,863 9,114 10,410
8 220 kV Ludewala 1,441 468 646 543 442
9 220 kV Nishatabad 148 0 0 0 20
10 220 kV NKLP 6,937 26,528 28,037 26,251 22,707
11 220 kV Ravi 3,192 7,070 13,756 14,693 19,209
12 220 kV Samundri Road – 24 204 556 1,160
13 220 kV Sarfaraz Nagar 1,317 3,752 3,806 4,636 3,531
14 220 kV Sialkot 1,323 1,533 1,207 1,022 982
15 220 kV WAPDA Town – 2,937 2,814 3,216 4,976
16 220 kV Shalamar Commissioned/Energized on 05-03-2014 1,312 5,165
17 220 kV Ghazi Road Commissioned/Energized on 05-03-2014 61
18 220 kV Bandala Commissioned/Energized on 26-06-2014 –
19 220 kV T.T. Singh Commissioned/Energized on 28-06-2015 241
Total 22,448 50,152 65,093 67,535 80,236Source: NTDC
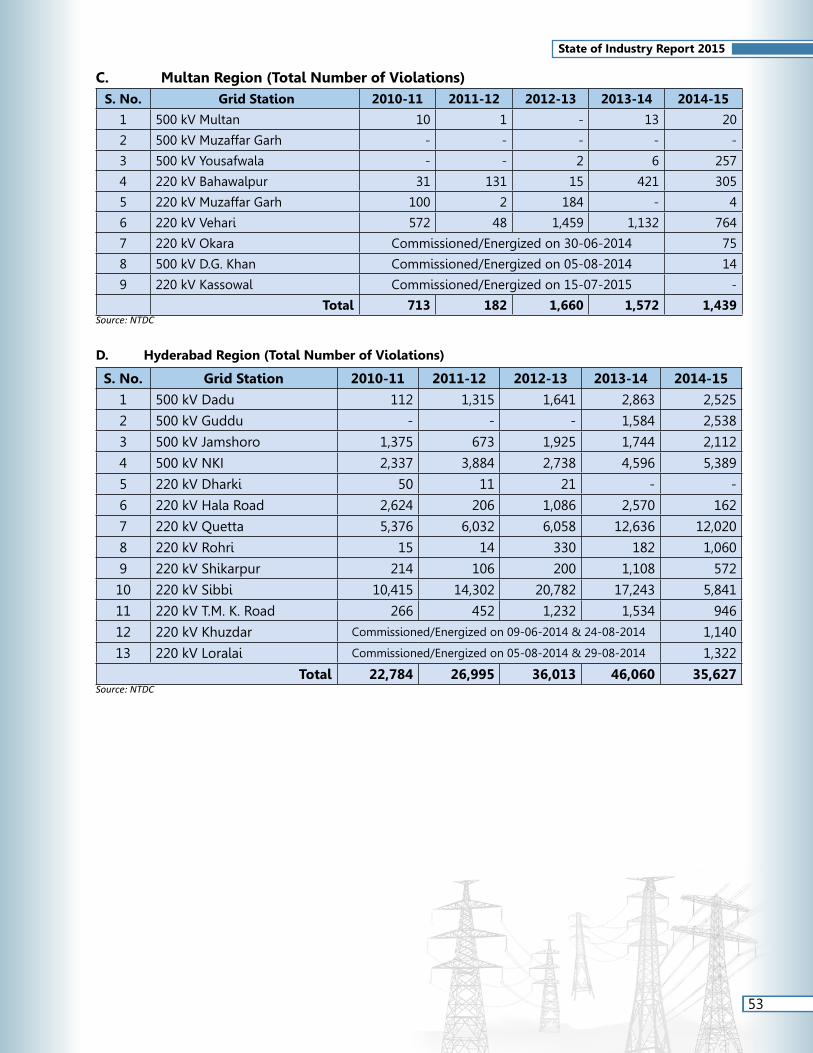
53
State of Industry Report 2015
C. Multan Region (Total Number of Violations)S. No. Grid Station 2010-11 2011-12 2012-13 2013-14 2014-15
1 500 kV Multan 10 1 - 13 20
2 500 kV Muzaffar Garh - - - - -
3 500 kV Yousafwala - - 2 6 257
4 220 kV Bahawalpur 31 131 15 421 305
5 220 kV Muzaffar Garh 100 2 184 - 4
6 220 kV Vehari 572 48 1,459 1,132 764
7 220 kV Okara Commissioned/Energized on 30-06-2014 75
8 500 kV D.G. Khan Commissioned/Energized on 05-08-2014 14
9 220 kV Kassowal Commissioned/Energized on 15-07-2015 -
Total 713 182 1,660 1,572 1,439Source: NTDC
D. Hyderabad Region (Total Number of Violations)
S. No. Grid Station 2010-11 2011-12 2012-13 2013-14 2014-15
1 500 kV Dadu 112 1,315 1,641 2,863 2,525
2 500 kV Guddu - - - 1,584 2,538
3 500 kV Jamshoro 1,375 673 1,925 1,744 2,112
4 500 kV NKI 2,337 3,884 2,738 4,596 5,389
5 220 kV Dharki 50 11 21 - -
6 220 kV Hala Road 2,624 206 1,086 2,570 162
7 220 kV Quetta 5,376 6,032 6,058 12,636 12,020
8 220 kV Rohri 15 14 330 182 1,060
9 220 kV Shikarpur 214 106 200 1,108 572
10 220 kV Sibbi 10,415 14,302 20,782 17,243 5,841
11 220 kV T.M. K. Road 266 452 1,232 1,534 946
12 220 kV Khuzdar Commissioned/Energized on 09-06-2014 & 24-08-2014 1,140
13 220 kV Loralai Commissioned/Energized on 05-08-2014 & 29-08-2014 1,322
Total 22,784 26,995 36,013 46,060 35,627Source: NTDC

54
State of Industry Report 2015
6.5.2 System FrequencyThe data submitted by NTDC for 2014-15 indicates 1264 variation in frequency limits beyond the permissible limits of 49.50 Hertz and 50.50 Hertz. It is also noted that such variations in frequency limits ranged from 45 Hertzto58.63HertzPrimafaciecontraveningRule8ofthePSTR,2005.Thefollowingtablesandfiguresshowthesystemfrequencyprofile.
NTDC Highest System Frequency (2010-11 to 2014-15)
Month 2010-11 2011-12 2012-13 2013-14 2014-15
July 50.54 50.56 50.48 50.20 50.71
August 50.53 50.48 50.52 50.31 50.68
September 50.56 50.44 50.56 50.22 50.55
October 50.43 50.44 50.45 50.35 50.69
November 50.44 50.56 50.40 50.30 50.62
December 50.39 50.48 50.40 50.28 58.63
January 50.40 50.44 50.21 50.70 54.69
February 50.40 50.36 50.10 50.63 -*
March 50.48 50.48 50.34 50.63 50.65
April 50.44 50.40 50.30 50.68 50.66
May 50.50 50.44 50.26 50.60 50.69
June 50.48 50.48 50.23 50.57 50.68* Value can’t be validated.Source: NTDC

55
State of Industry Report 2015
NTDC Lowest System Frequency (2010-11 to 2014-15)
Month 2010-11 2011-12 2012-13 2013-14 2014-15
July 48.99 48.72 48.76 49.05 48.74
August 48.84 48.72 48.80 49.15 48.91
September 48.91 48.72 48.72 49.35 48.93
October 48.81 48.80 48.80 49.50 48.99
November 49.02 48.92 48.72 49.31 48.83
December 48.80 48.76 48.72 49.15 45.00
January 48.80 48.72 49.10 48.67 45.00
February 48.78 48.80 48.66 48.87 49.06
March 48.81 48.76 49.40 48.92 49.11
April 48.75 48.76 49.32 48.89 49.02
May 48.62 48.76 49.48 49.20 49.20
June 48.68 48.76 49.20 49.19 -* * Value can’t be validated.Source: NTDC
6.6 Annual Performance Report (APR) of K-ElectricThe data submitted by K-Electric in its APR for 2014-15 indicates variation in frequency limits number of times beyond the permissible limits of 49.50 Hertz and 50.50 Hertz. It was observed that in the month of July and November the minimum frequency limit was 48.97 Hertz and 48.94 Hertz respectively. Similarly, in the month of August and December the maximum frequency limit was 50.64 Hertz and 50.82 Hertz respectively. This data indicates, that K-Electric has not complied with the frequency limits which are permissible under NEPRA PerformanceStandardsTransmissionRules(PSTR,)2005.ThefollowingtablesandfiguresshowK-Electricsystemfrequencyprofilealongwithacomparisonwiththeprecedingyears.
NTDC Lowest System Frequency

56
State of Industry Report 2015
K-Electric Lowest System Frequency (2010-11 to 2014-15)
Month 2010-11 2011-12 2012-13 2013-14 2014-15
July 48.80 48.51 48.56 48.61 48.97
August 48.80 48.60 48.60 48.68 49.10
September 48.80 48.60 48.59 48.73 49.13
October 48.80 48.51 48.60 48.80 49.18
November 48.80 48.67 48.60 48.74 48.94
December 48.80 48.60 48.59 48.76 49.15
January 48.79 48.60 48.50 48.61 49.07
February 48.80 48.52 47.12 48.80 49.39
March 48.88 48.60 48.80 48.59 49.26
April 48.40 48.60 48.74 48.63 49.26
May 46.64 48.54 48.63 48.66 49.29
June 46.38 48.59 48.62 48.80 49.32Source: K-Electric
K-Electric Highest System Frequency (2010-11 to 2014-15)
Month 2010-11 2011-12 2012-13 2013-14 2014-15
July 50.92 50.61 50.60 51.15 50.58
August 50.97 50.96 51.05 51.70 50.64
September 50.61 50.90 50.65 51.70 50.51
October 50.81 50.46 50.65 51.69 50.53
November 50.52 50.55 50.57 51.93 50.55
December 50.73 50.57 50.76 51.68 50.82
January 50.54 50.61 50.80 51.15 50.54
February 50.58 50.56 50.59 51.10 50.51
March 50.77 50.90 50.72 51.91 50.58
April 50.47 50.28 51.08 51.28 50.51
May 50.65 51.25 51.49 51.06 50.57
June 50.73 50.78 51.55 51.72 50.52Source: K-Electric
50.00
50.50
51.00
51.50
52.00KE Highest System Frequency
2010-11 2011-12 2012-13 2013-14 2014-15

57
State of Industry Report 2015
Above statistics about voltage and frequency limits indicates that NTDC and K-Electric have failed to maintain their Transmission Lines and Grid Stations as required under NEPRA Rules, Licences and Codes. In view of above, explanations have been called from both the NTDC and K-Electric under Rule 4 (1) and (2) of the NEPRA (Fines) Rules, 2002.
6.7 Energy not served in KE SystemThefollowingtableandfiguresshowtheenergynotservedintheK-Electricsystemforthelastfiveyearsi.e.from 2010-11 to 2014-15.
S. No. Name of CircuitYear-wise Overall System Energy Not Served (MWh)
2010-11 2011-12 2012-13 2013-14 2014-15
1 KDA - Federal B 0 218 0 172 91
2 KDA - Maymar 0 227 0 178 95
3 KDA - Gulshan 0 131 0 103 55
4 KDA - Johar 0 113 0 89 47
5 KDA - Memon Goth 0 183 0 144 77
6 Pipri - RECP 0 52 35 0 0
7 Pipri - BOC 0 39 26 0 0
8 Pipri - Port Qasim 0 96 64 0 0
9 Pipri - KEPZ 0 78 52 0 0
10 Pipri - Landhi 0 74 49 0 0
11 Pipri - Korangi Town 0 65 44 0 0
12 Pipri - Steel 1 0 15 10 0 0
13 Pipri - Steel 2 0 15 10 0 0
14 Korangi West - Defence 8 182 361 144 286
15 Korangi West - PRL 0 48 95 38 75
16 Korangi West - Gizri / Baloch 17 334 664 264 526
17 Korangi West - Korangi East 0 373 740 295 586
18 Korangi West - DHA 1 0 19 38 15 30
19 Queens Road - Elander Road 1 16 96 190 110 92
20 Queens Road - Elander Road 2 16 96 190 110 92
46.00
46.50
47.00
47.50
48.00
48.50
49.00
49.50KE Lowest System Frequency
2010-11 2011-12 2012-13 2013-14 2014-15
Continued.....

58
State of Industry Report 2015
S. No. Name of CircuitYear-wise Overall System Energy Not Served (MWh)
2010-11 2011-12 2012-13 2013-14 2014-15
21 Queens Road - Gizri 145 497 987 574 477
22 Queens Road - Clifton 41 707 1,405 817 679
23 Queens Road - Old Town 97 516 1,025 597 496
24 Mauripur - Haroonabad 1 468 704 49 631 342
25 Mauripur - Haroonabad 2 468 815 49 631 342
26 Baldia - Hub Chowki 7 51 30 56 32
27 Baldia - SGT 1 16 204 120 222 129
28 Baldia SGT - SITE 16 204 120 222 129
29 Baldia - Orangi 52 663 389 723 418
30 Baldia - Valika 43 578 339 630 364
31 ICI - PTA 0 - - - -
Total 1,410 7,393 7,081 6,765 5,460Source: K-Electric
6.8 Frequent Tripping of Transmission and Grid System in NTDCDuringthereportedperiod,NTDC'sinvestmentsandO&Mexpenditureoverlastfiveyearswereevaluatedtoknowitspriorities.Specifically,informationwasobtainedtoconfirmthatNTDCinvestedonthosegridswhereheavy tripping occurred. The Authority has noted that NTDC could not prioritize its investment for improving those grids where tripping occurred last year.
These observations were sent, in the form of an advisory to the Ministry of Water and Power. NTDC was also asked to provide the details about its plans for the next cycle of foggy weather. NEPRA teams also visited NTDC'sfollowinggridstationsofIslamabadRegiontomonitortheprecautionarymeasurestakenbyNTDCinthis regard:
220 kV Burhan Grid Station November 13, 2014220 kV University Grid Station November 14, 2014500 kV Rawat Grid Station November 14, 2014
59
State of Industry Report 2015
During visit, it was found that maintenance of lines and grids has not been taken as per their SOPs prepared by NTDC. It was also noted that there was no proper record mechanism and equipment were found in poor conditions.
Further, during the reported period, a major system disturbance occurred in January, 2015 due to tripping at 500 kV Guddu grid station followed by cascaded outages and system breakdown. Taking serious notice of the incident, NTDC/NPCC was asked by the Authority for detailed explanation. Based on the presentation, the concerns of the Authority were sent to Ministry of Water and Power and NTDC.
6.9 Handing Over of Switchyards of GENCOs to NTDCDuring the reported period, GENCO-III requested the Authority to allow its handing over of the switchyard of TPS, Muzaffargarh to NTDC as it has no expertise to maintain this grid. Based on the requirements under the Grid Code, the Authority decided that GENCO-III shall continue to maintain its own switchyard as the protection schemes of switchyards and grid stations are totally different.
6.10 Implementation of Performance Standards (Generation) Rules, (PSGR) 2009The quarterly reports on Key Performance Indicators (KPIs) as per requirements of Performance Standards (Generation) Rules, 2009 have been collected from different generation companies i.e. public sector GENCOs, IPPs and hydel plants for the year 2013-14 and 2014-15, which are under analysis. During review, it has been observed that the data submitted by public sector GENCOs is inconsistent and does not meet the requirements of PSGR.
The submitted data by IPPs i.e. HUBCO, FKPCL, Foundation Power etc. was also analyzed and found that the performance of IPPs is relatively better than public sector GENCOs. However, there is also a need of training for awareness of PSGR, 2009. It was also found that non-availability of fuel is the main reason of the poor performance of IPPs. Similarly, analysis of hydel power stations like Tarbela, Mangla, Chashma, Ghazi Barotha is also being carried out.
It is important to note that the data about KPIs would be used for benchmarking their performance for using in the subsequent tariff determinations.
6.11 Implementation of Grid CodeNTDC has created a “Grid Code Implementation Cell” to monitor compliance with various provisions of the Grid Code, as the Grid Code was approved by NEPRA in June, 2005 as an “Applicable Document”. NTDC is pursuing the administration/enforcement of various provisions of the Grid Code through Grid Code Cell of NTDC, and keeps NEPRA informed of its activities in this regard. During the reported period a number of meetings of Grid Code Review Panel were held to discuss Grid Code Addendum-I, Development of Grid Code Addendum-II for induction of Solar Power Plants, Development of Grid Code Addendum-III for Small Hydel Power Plants and Issue of Power Factor Range etc. The Authority approved Grid Code Addendum-II for integration of Solar Power Plants.
A major study is also being conducted by NTDC Grid Code Review Panel for setting up a maximum limit on the inductionandabsorptionofrenewableenergyprojects,specificallywindandsolarsothatthereisnoadverseeffectontheoperationandperformanceofNationalGrid.However,thedelayedfinalizationofthestudybyNTDC is hindering further progress in this area.
6.12 Implementation of Distribution CodeFor addressing the matters related to Distribution Code, a workshop regarding implementation of Distribution Code (Establishment of Distribution Code Review Panel) (DCRP) was conducted by NEPRA in October, 2014 at Lahore. The purpose of establishing DCRP is to ensure implementation of Distribution Code in true letter and spirit. During workshop, following decisions were made:
6.12.1 Initially Chairman of DCRP will be from LESCO for a period of two (02) years with effect from 21st October, 2014.

60
State of Industry Report 2015
6.12.2 After two (02) years, next Chairman from other DISCOs will be on rotation basis on alphabetical order for a period of 01 year.
6.12.3 First meeting of the members of DCRP, will be arranged by LESCO before 30th of November, 2014.
6.12.4 The NTDC will provide proper support and guidance to LESCO, in the functioning/establishment of DCRP.
6.12.5 Website of DCRP will be established by LESCO and mechanism of feedback will also be given due consideration.
6.12.6 Initially Secretariat Support will also be provided by LESCO.
First meeting of the DCRP was held in February, 2015, wherein, concerns of DISCOs pertaining to interconnection issues of generators and upcoming solar and wind projects were discussed.
6.13 Development of Power Safety CodeAs per requirements of Distribution Code and Grid Code, all Licensees shall have comprehensive, NEPRA approved Power Safety Code in place and available at all times. Pursuant to instructions of the Authority, the firstdraftofPowerSafetyCodeforTransmissionandDistributionLicenseeswasuploadedonNEPRA’swebsiteandsenttoalltheconcernedstakeholdersaswellfortheircommentsbeforefinalizingit.
Based on the comments of stakeholders the Authority approved the Power Safety Code for Transmission and Distribution licensees on 8th July, 2015. The Authority also decided that LESCO and MEPCO will prepare a standard Draft Safety Manual in the light of approved Power Safety Code for Transmission and Distribution licensees to be adopted by other DISCOs as well. The Authority further directed NTDC for developing its Safety Manual for the approval of the Authority. The approved document noted above is also uploaded on NEPRA’s website.
Further, all the public sector GENCOs and IPPs have been directed to submit their safety manuals for consideration and approval of the Authority. Some of the IPPs have submitted their safety manuals which are under review.

INITIATIVES BY STAKEHOLDERS 7


63
State of Industry Report 2015
7. INITIATIVES BY STAKEHOLDERS
7.1 Market StructureThe market structure envisaged by NEPRA has been outlined in the transmission licence granted to NTDC. The license stipulates a time frame for moving from a single-buyer mode to a competitive market mode. As indicated in earlier sections of report the bilateral market structure required creation and operation of a number of entities for which the Authority noted that progress towards a market structure has not been made as planned. A CPPA has been in operation, however its present role may not support the objectives of a competitive market. Therefore, there was an urgent need to review the present role of CPPA so that its functioning is more aligned to the overall objectives.
7.2 Creation of Central Power Purchasing Agency - Guarantee Limited (CPPA-G)In view of the above and for bringing transparency, promote corporate culture and keep check on circular debt, the Federal Government proposed for the separation the CPPA from NTDC to create an independent company named as Central Power Purchasing Agency - Guarantee Limited (CPPA-G).
The CPPA-G will be an independent company and shall be performing the function of settlement of dues of electricity between buyers and sellers. It is international best practice and imperative to separate the functions and business of settlement and development of competitive power market structure from the generation, transmission and distribution systems. The move is being said a major reform the power sector so a to achieve efficiencythroughtransparentsettlementofpowersectorduesandbuildindustrystandardstomanagethepower sector business.
7.3 Modification in Transmission Licence of NTDCPursuant to Section 17 of Regulation of Generation, Transmission and Distribution of Electric Power Act, 1997 (XL of 1997) and subject to provisions of Section 7 (4) thereof, NEPRA granted Transmission Licence No. TL/01/2002 on 31st December, 2002 to NTDC for a period of 30 years valid upto 30th December, 2032.
NTDCsoughtamodificationtotheArticle7and8ofitsTransmissionLicencethroughaLicenseeProposedModification(LPM)forseparatingtheprocurementofpoweronbehalfofDISCOsandthesettlement,fromthenetwork functions performed by NTDC. The administration and development of competitive power markets will also be among the functions of a separate corporate entity; CPPA-G.
It may be noted that CPPA under the umbrella of NTDC was foreseen as a transition measure before taking it out of NTDC, which has core functions of transmission network and system operation business.
NEPRAafterfollowingthedueprocessunderitslawhasapprovedmodificationinNTDClicenseandFederalGovernment is now in the process of transferring the agency functions (power procurement on behalf of DISCOs and the function of settlement, administration and development of competitive power market).
7.4 Market Operator Registration (Standards and Procedure) Rules, 2015NEPRA has recently approved the Market Operator Registration (Standards and Procedure) Rules, 2015 to authorize CPPA-G as market operator which is responsible to commence and conduct the power market operations such as:
7.4.1 Financial and Organizational Affairs7.4.2 Accounting Practices and Audit7.4.3 Maintenance of Records
Apreliminarydesignofpowermarketalongwithtimelinestowardsacompetitiveregimeisalsospecifiedinthedocument that will substitute the existing single buyer arrangement in the sector.

64
State of Industry Report 2015
7.5 PPIB Policy for Private Sector Transmission Projects 2015A large scale capacity additions in the electrical generation system are planned in the next few years which will necessitate corresponding augmentation in the transmission network. Due to the encouraging response of the private sector for investment in power generation and the constraints on public sector resources, the GoP has decidedtosolicitproposalsfromtheprivatesectorforinvestmentinthefieldofACandDCExtraHighVoltage(EHV) Power Transmission Lines, Substations, and Converter Stations.
7.6 Central Asia-South Asia (CASA-1000) ProjectThe CASA 1000 project is a comprehensive initiative to interconnect Tajikistan, the Kyrgyz Republic, Afghanistan and Pakistan to form a Central Asia-South Asia (CASA) Regional Electricity Market. The core elements of the project include: a 500 kV, 750 km HVDC power interconnection with DC/AC conversion capacities of 1300 MW at Sangtuda (Tajikistan), 300 MW at Kabul (Afghanistan) and 1300 MW at Peshawar (Pakistan); and a 500 kV, 477 km high voltage alternating current (HVAC) power Interconnection between Kyrgyz Republic (Datka substation) and Tajikistan (Khoujand substation). The HVDC converter capacity in Pakistan (Peshawar) is equal to that in Tajikistan (Sangtuda). ThisprovidesflexibilityforPakistantoabsorbupto1300MW,shouldAfghanistannotneedtoimportitsentireshare.The present project cost is estimated to be around US$ 873 million (SNC Lavalin, February, 2011).
CASA-1000 project is unique in the sense that it was multi-seller and multi-buyer sort of arrangement and four countries were involved in it as foundation members. Under open access, other states of the Central and South Asia may also get engaged in the project. It was pursued under the concept of establishing an inter-regional electricity trade arrangement among the four participating countries. In view of its unique characteristics and upon the request of the participating countries, USAID with the support of World Bank established a CASA Secretariat to undertake all pre-construction project development activities.
In view of the complexity of the transaction, the contracting parties decided to supervise the project development through a body named as “Inter-Governmental Council” (IGC), headed by the relevant Ministers of four counties. IGC decided that this Project will be implemented by Parties as “Contractual Joint Venture”. Moving forward with this concept, the legal counsels of the participating counties as well as of CASA Secretariat were of the view that thereshouldbea“MasterAgreement”(MA)andfiveindependentPPAstoestablishthecontractualrelationshipamong the parties.TheMAandPPAsbetweenNTDCandtransmissionentitiesofsellers(TajikistanandKyrgyzstan)werefinalizedinthefirstweekofApril,2015andsignedon24th April, 2015.
7.7 Import of Electricity from Iran
7.7.1 Import of 74 MW (Jackigur – Mand)WAPDA and Tavanir Iran entered into an Agreement for sale and purchase of 74 MW of Power from Iran to Pakistan to meet the demand of Makran Division Balochistan comprising the Districts of Turbat, Gwadar and Panjgoor and border towns of Mashkail, Mand and Taftan. The existing tariff was agreed within the limit of 7.00 to 10.00 Cents/kWh. Iran has also offered to supply 30 MW additional capacity on the same transmission line. Total supply would be 104 MW.
7.7.2 Import of 100 MW (Polan – Gawadar)A Contract was signed between Tavanir and NTDC on 7th February, 2007 for supply of 100 MW for Gwadar for 30yearsandtheTariffatUScents6.25/kWh.ExportDevelopmentBankofIranwillfinance70%andremaining30%willbefinancedbyNTDC’soutofitsownsources.220kVdoublecircuitTransmissionLineand220kVGISgrid station are being constructed at Gwadar by Sunir-Iran. The project cost is estimated as Euro 31 million.
7.7.3 Import of 1000 MW (Zahedan – Quetta)A Memorandum of Understanding (MoU) was signed between Iran and Pakistan on 8th April, 2007 for supply of 1000 MW. In this regard, a Feasibility Study was conducted jointly by Moshanir (Iran) and NESPAK (Pakistan) and submitted on 26th April, 2010. The main points of the Feasibility Study are as follows:
7.7.3.1 The Parties agreed to HVDC interconnection on ± 500 kV level. Converter and Switching stations at Zahedan and Quetta will be constructed.

65
State of Industry Report 2015
7.7.3.2 Total length of Transmission line will be around 678 km. 93 km will be constructed in Iran and 585 km will be constructed in the territory of Pakistan.
7.7.3.3 Iran will construct dedicated 1300 MW power plant at Zahedan for supply of 1000 MW to Pakistan.
The total estimated cost of transmission line project will be US$ 700 million. The cost of ± 500 HVDC interconnection project including two HVDC converter/Inverter substations is estimated to be approximately US$ 700 million excluding the cost of 1300 MW power plant needs to be constructed on the Iranian side. Tavanir consented forfinancing theHVDC InterconnectionProject cost in itsown territory (approximatelyUS$265million)sideforthisproject.ThepartiesagreetofinancetheHVDCInterconnectionProjectforPakistaniside(approximately US$ 435 million), as follows:
7.7.3.4 70%which is approximatelyequals toUS$300millionwillbearrangedandfinancedby IranianFinancial Institutions.
7.7.3.5 30% which is approximately equals to US$ 135 million will be financed by Pakistani FinancialInstitutions.
7.7.3.6 Upon the approval of Economic Coordination Committee (ECC), an application for determination of Tariff has been submitted to NEPRA.
PPAisrequiredtobefinalizedwithTavanirtoinitiatefurtherprogressontheProject.
7.8 Alternative and Renewable Energy DevelopmentsThe GoP is promoting the use of Alternative and Renewable Energy (ARE) technologies in order to diversify itsenergymixsoastoensureEnergySecurity,EconomicBenefits,SocialEquityandEnvironmentalProtection.AlternativeandRenewableEnergieshavethepotentialofbeingastrongcontributorintheenvisageddiversifiedenergy mix. Alternative and Renewable Energy resources are widely and abundantly available in Pakistan that canbeeffectivelyandefficientlyutilizedforpowergeneration.
AEDB, acting as a one-window facility for the development and promotion of ARE technologies in the country, has undertaken a number of supportive measures for the promotion and development of RE technology in the country and to attract private sector investments. With all the requisite ingredients in place - a proven RE potential, robust policy framework, enabling tariff structures and bankable security documents, the RE sector of Pakistan has become an investment destination for private investors and has attracted a foreign investment of more than US$ 3 billion during the last one year.
7.8.1 Steps/initiatives for Development of ARE SectorAEDB has undertaken a number of measures in order to promote ARE technologies and to attract private sector investments, which include:
7.8.1.1 Development of large scale grid connected power generation projects using wind, solar, biomass and bagasse.
7.8.1.2 Identificationofnewcorridors forwindandsolarenergyprojectsdevelopment.Detailedgroundcorrelated resource mapping of wind, solar and biomass is being carried out thought ESMAP – World Bank’s Assistance.
7.8.1.3 Framework for Power Co-Generation-2013 (Bagasse/Biomass) approved by ECC for high pressure boiler based power generation from the existing sugar mills. 1500-2000 MW of power is expected to be generated in next 3-4 years.
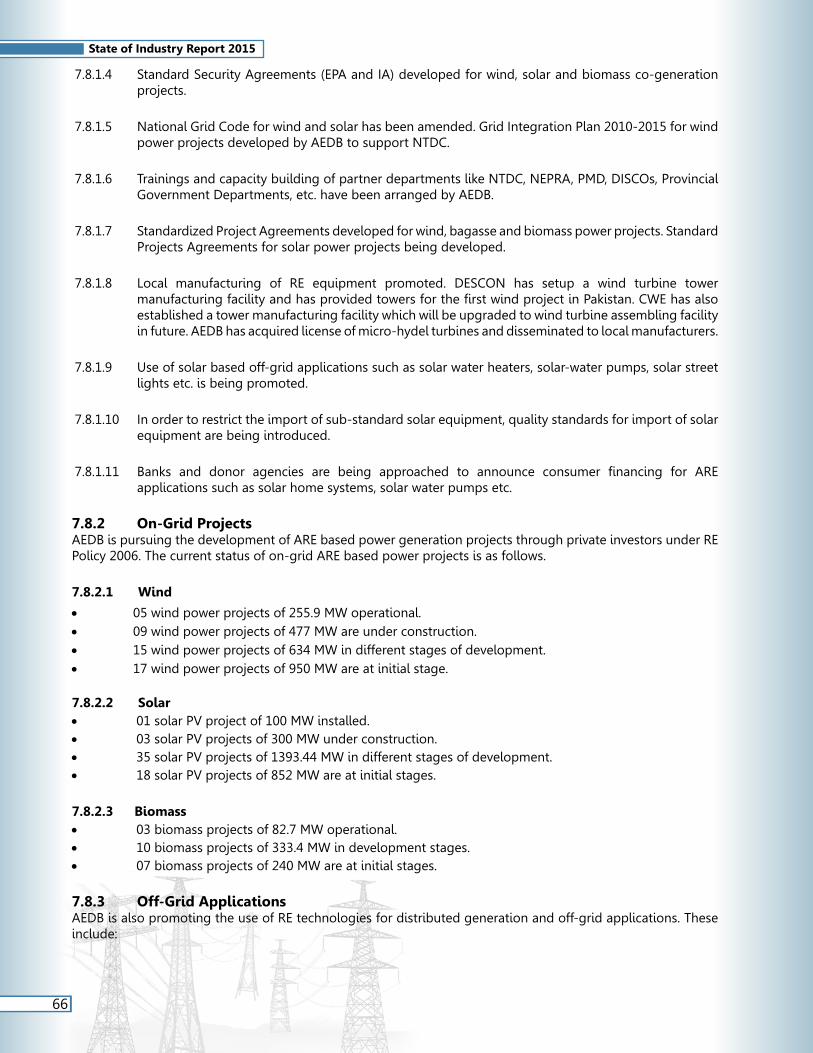
66
State of Industry Report 2015
7.8.1.4 Standard Security Agreements (EPA and IA) developed for wind, solar and biomass co-generation projects.
7.8.1.5 National Grid Code for wind and solar has been amended. Grid Integration Plan 2010-2015 for wind power projects developed by AEDB to support NTDC.
7.8.1.6 Trainings and capacity building of partner departments like NTDC, NEPRA, PMD, DISCOs, Provincial Government Departments, etc. have been arranged by AEDB.
7.8.1.7 Standardized Project Agreements developed for wind, bagasse and biomass power projects. Standard Projects Agreements for solar power projects being developed.
7.8.1.8 Local manufacturing of RE equipment promoted. DESCON has setup a wind turbine tower manufacturingfacilityandhasprovidedtowersforthefirstwindprojectinPakistan.CWEhasalsoestablished a tower manufacturing facility which will be upgraded to wind turbine assembling facility in future. AEDB has acquired license of micro-hydel turbines and disseminated to local manufacturers.
7.8.1.9 Use of solar based off-grid applications such as solar water heaters, solar-water pumps, solar street lights etc. is being promoted.
7.8.1.10 In order to restrict the import of sub-standard solar equipment, quality standards for import of solar equipment are being introduced.
7.8.1.11 Banks and donor agencies are being approached to announce consumer financing for AREapplications such as solar home systems, solar water pumps etc.
7.8.2 On-Grid ProjectsAEDB is pursuing the development of ARE based power generation projects through private investors under RE Policy 2006. The current status of on-grid ARE based power projects is as follows.
7.8.2.1 Wind
• 05 wind power projects of 255.9 MW operational.• 09 wind power projects of 477 MW are under construction. • 15 wind power projects of 634 MW in different stages of development.• 17 wind power projects of 950 MW are at initial stage.
7.8.2.2 Solar• 01 solar PV project of 100 MW installed.• 03 solar PV projects of 300 MW under construction.• 35 solar PV projects of 1393.44 MW in different stages of development.• 18 solar PV projects of 852 MW are at initial stages.
7.8.2.3 Biomass• 03 biomass projects of 82.7 MW operational.• 10 biomass projects of 333.4 MW in development stages.• 07 biomass projects of 240 MW are at initial stages.
7.8.3 Off-Grid ApplicationsAEDB is also promoting the use of RE technologies for distributed generation and off-grid applications. These include:

67
State of Industry Report 2015
• Solar PV based systems for domestic, commercial and industrial sectors.• Solar water pumping.• Solar water heating.• Solar street lights.• Biogas plants.• Mini/micro hydel power for distribution generation.
The use of ARE technologies for power generation is also being promoted for captive and grid spill-over purposes. In this regard, NEPRA on the request of AEDB, has announced NEPRA (Alternative and Renewable Energy) Distributed Generation and Net Metering Regulations, 2015 which will enable the consumers to supply surplus power generated through ARE sources to the National Grid.
The following table provides details of renewable energy projects:
A: Existing Projects (in-operation and under construction)
S. No.
Name of ProjectCapacity
(MW)Expected
Commissioning yearEstimated Cost (US$ Million)
Wind Technology:
1 FFC Energy Limited 49.50 May, 2013 133.557
2 Zorlu Energy Pakistan Limited 56.40 July, 2013 143.740
3 Three Gorges First Wind Farm Pakistan (Pvt.) Limited 50 November, 2014 130.279
4 Foundation Wind Energy-II Limited 50 December, 2014 124.907
5 Foundation Wind Energy-I Limited 50 April, 2015 125.899
6Sapphire Wind Power Company (Pvt.) Limited
49.50 January, 2016 120.00-130.00
7 Metro Power Company (Pvt.) Limited 50 August, 2016 125.236
8 Yunus Energy Limited 50 August, 2016 120.00-130.00
9 Master Wind Energy (Pvt.) Limited 49.50 September, 2016 120.00-130.00
10 Hydrochina Dawood Power (Pvt.) Limited 49.50 September, 2016 120.00-130.00
11 United Energy Pakistan Limited 99 September, 2016 240.00-260.00
12 Tapal Wind Energy (Pvt.) Limited 30 September, 2016 72.00-78.00
13 Tenega Generasi Limited 49.50 September, 2016 120.00-130.00
14 Gul Ahmed Energy Limited 50 September, 2016 120.00-130.00
Solar PV Technology:
15 Quaid-e-Azam Solar Power (Pvt.) Limited 100 July, 2015 151.4
16 Appolo Solar Development Pakistan Limited 100 December, 2016 151.40
17 Best Green Energy Pakistan (Pvt.) Limited 100 December, 2016 151.40
18 Crest Energy Pakistan Limited 100 December, 2016 151.40
Bagasse/Biomass Technology:
19 JDW Sugar Mills Limited (Unit-II) 26.35 June, 2014Based on
Upfront Tariff20 JDW Sugar Mills Limited (Unit-III) 26.35 October, 2014
21 RYK Mills Limited 30 March, 2015Continued.....

68
State of Industry Report 2015
B: Future Projects
S. No.
Name of ProjectCapacity
(MW)Expected
Commissioning yearEstimated Cost (US$ Million)
Wind Technology:1 Sachal Energy Development (Pvt.) Limited 50 June, 2017 133.9182 Hawa Holding Limited 50 December, 2017 120.00-130.003 China Sunec Energy (Pvt.) Limited 50 December, 2017 120.00-130.004 Jhampir Wind Power (Pvt.) Limited 50 December, 2017 120.00-130.005 Trident Energy (Pvt.) Limited 10 January, 2018 24.00-26.006 Burj Wind Energy (Pvt.) Limited 14 April, 2018 33.60-34.40
7 Tricon Boston Consulting Corporation (Pvt.) Limited (A) 50 April, 2018 120.00 -130.00
8 Tricon Boston Consulting Corporation (Pvt.) Limited (B) 50 April 2018 120.00-130.00
9 Tricon Boston Consulting Corporation (Pvt.) Limited (C) 50 April, 2018 120.00 -130.00
10 Hartford Alternative Energy (Pvt.) Limited 50 July, 2018 120.00-130.0011 Wind Eagle Limited (1) 50 July, 2018 120.00-130.0012 Wind Eagle Limited (2) 50 July, 201813 Western Energy (Pvt.) Limited 50 July, 2018 120.00-130.0014 Zephyr Power (Pvt.) Limited 50 August, 2018 134.09915 Titan Wind Power (Pvt.) Limited 10 August, 2018 24.00-26.00
Solar PV Technology:16 Zonergy (Pvt.) Limited 600 June, 2016 840.00-900.0017 Access Electric (Pvt.) Limited 10 August, 2016 16.00-19.0018 Buksh Solar (Pvt.) Limited 10 August, 2016 16.00-19.0019 Sanjwal Solar Power (Pvt.) Limited 5.04 August, 2016 8.00-9.5020 Safe Solar Power (Pvt.) Limited 10.28 August, 2016 16.00-19.0021 Access Solar (Pvt.) Limited 11.52 August, 2016 16.00-19.0022 Blue Star Hydel (Pvt.) Limited 1 August, 2016 1.56223 Blue Star Electric (Pvt.) Limited 1 April, 2017 1.56224 Harappa Solar (Pvt.) Limited 10 June, 2017 14.00-15.0025 Fauji Foundation 10 August, 2017 14.00-15.0026 Siddiqsons Energy Limited 50 September, 2017 70.00-75.0027 Integrated Power Station 50 December, 2017 75.00-78.0028 Jafri and Associates 50 December, 2017 75.00-78.0029 Solar Blue (Pvt.) Limited 50 December, 2017 75.00-78.0030 RE Solar (Pvt.) Limited (1) 20 December, 2017 28.00-30.0031 RE Solar (Pvt.) Limited (2) 20 December, 2017 28.00-30.0032 HanergyGlobalSolarAsiaPacificLimited(1) 50 May, 2018 70.00-75.0033 HanergyGlobalSolarAsiaPacificLimited(2) 10 May, 2018 14.00-15.0034 Janpur Energy Limited (1) 10 May, 2018 14.00-15.0035 Janpur Energy Limited (2) 10 May, 2018 14.00-15.0036 Nizam Power (Pvt.) Limited (1) 5.65 June, 2018 7.00-8.0037 Nizam Power (Pvt.) Limited (2) 5.65 June, 2018 7.00-8.0038 Nizam Power (Pvt.) Limited (3) 11.30 June, 2018 16.00-17.00
Continued.....

69
State of Industry Report 2015
S. No.
Name of ProjectCapacity
(MW)Expected
Commissioning yearEstimated Cost (US$ Million)
39 Sino Pak Energy Development Company (Pvt.) Limited 10 June, 2018 14.00-15.00
40 Ayan Energy (Pvt.) Limited 50 June, 2018 70.00-75.0041 Total Energies Nouvelles Ventures 100 December, 2018 140.00-150.0042 AJ Power (Pvt.) Limited 10 December, 2018 14.00-15.0043 Adamjee Power Generation (Pvt.) Limited 5 December, 2018 7.00-8.0044 ET Solar (Pvt.) Limited (1) 25 December, 2018 35.00-38.0045 ET Solar (Pvt.) Limited (2) 25 December, 2018 35.00-38.0046 ET Solar (Pvt.) Limited (3) 25 December, 2018 35.00-38.0047 Crystal Energy (Pvt.) Limited 2 May, 2019 3.50-4.0048 ACT Solar (Pvt.) Limited 50 May, 2019 70.00-75.0049 Asia Petroleum 30 June, 2019 42.00-45.0050 Forshine (Pakistan) 50 June, 2019 70.00-75.00
Bagasse /Biomass Technology:51 Chiniot Power Limited 62.40 2015
Based on Upfront Tariff
52 Hamza Sugar Mill Limited 15 201654 Layyah Sugar Mills Limited 41 201655 SafinaSugarMillsLimited 20 July, 201653 Alliance Sugar Mills Limited 19 201756 Almoiz Industries Limited 36 201757 Etihad Power Generation Limited 67 January, 201758 Shahtaj Sugar Mills Limited 15 201859 Chanar Energy Limited 22 201860 RYK Energy Limited 36 2018
C: Proposals of following Projects accepted by AEDB and issuance of LOI:
S. No.
Name of ProjectCapacity
(MW)Expected
Commissioning yearEstimated Cost (US$ Million)
Wind Technology:
1 Gul Ahmed Energy Limited 50 2019 120.00-130.00
2 Metro Power Company Limited 50 2019 120.00-130.00
3 Electrique (Pvt.) Limited 50 2019 120.00-130.00
4 Shaheen Foundation (PAF) 50 2019 120.00-130.00
5 Emerald Energy Limited 50 2019 120.00-130.00
6 Aleph Systems (SMC-Pvt.) Limited 100 2019 240.00-260.00
7 Wind Energy Limited 50 2019 120.00-130.00
8 Power China Huadong Engineering Corporation Limited 50 2019 120.00-130.00
9 Indus Wind Energy Limited 50 2019 120.00-130.00
10 NASDA Energy (Pvt.) limited 50 2019 120.00-130.00
11 Green Power (Pvt.) Limited (1) 50 2019 120.00-130.00
12 Green Power (Pvt.) Limited (2) 50 2019 120.00-130.00
13 Trans Atlantic Energy (Pvt.) Limited (1) 50 2019 120.00-130.00
14 Trans Atlantic Energy (Pvt.) Limited (2) 50 2019 120.00-130.00Continued.....

70
State of Industry Report 2015
S. No.
Name of ProjectCapacity
(MW)Expected
Commissioning yearEstimated Cost (US$ Million)
15 MepconIncemet Energias Renovables 50 2019 120.00-130.00
16 Master Green Energy Limited 100 2019 240.00-260.00
17 Din Energy Limited 50 2019 120.00-130.00
Solar PV Technology:
18 MST Power (Pvt.) Limited 5 2019 7.00-8.00
19 RT Power (Pvt.) Limited 10 2019 14.00-15.00
20 Ravi Renewable Energy 20 2019 28.00-30.00
21 Gran Solar 20 2019 28.00-30.00
22 First Solar (Pvt.) Limited 2 2017 2.80-3.00
23 Pakistan PV Power 01 (Pvt.) Limited 50 2019 70.00-75.00
24 KSJ International FZE 200 2019 280.00-300.00
25 Sapphire Wind Power Company Limited 40 2019 56.00-60.00
26 Gul Ahmed Energy Limited 50 2019 70.00-75.00
27 Metro Solar Power Limited 50 2019 70.00-75.00
28 Master Solar Energy Limited 20 2019 28.00-30.00
29 Uch-II Power (Pvt.) Limited 10 2019 14.00-15.00
30 China Han Power Company Limited (1) 50 2019 70.00-75.00
31 China Han Power Company Limited (2) 200 2019 280.00-300.00
32 Liberty Solar (Pvt.) Limited 50 2019 70.00-75.00
33 Adamjee Power Generation 5 2019 7.00-8.00
34 Conergy 20 2019 28.00-30.00
35 Fotwatio Renewable Ventures 50 2019 70.00-75.00
Bagasse/Biomass Technology:
36 Ansari Powergen Company (Pvt.) Limited 30 2019
Based on Upfront Tariff
37 Bandhi Powergen Company (Pvt.) Limited 30 2019
38 TAY Powergen Company (Pvt.) Limited 30 2019
39 Faran Sugar Mills Limited 25 2019
40 Shakargarj Mills Limited (1) 40 2019
41 Shakarganj Mills Limited (2) 60 2019
42 Indus Sugar Mills Limited 25 2019Notes: The expected dates for some of the projects as provided by AEDB do not exactly match with the expansion plans provided by NTDC. For consistency of report the data provided by NTDC has been used in the analysis.

MISCELLANEOUS 8


73
State of Industry Report 2015
8. MISCELLANEOUS
8.1 Promulgation of New Rules/RegulationsThe following Rules/Regulations/Guidelines and amendments in existing Rules and Regulations have been promulgated during the period being reported:
8.1.1 NEPRA (Market Operator Registration, Standards and Procedure) Rules, 2015
8.1.2 Standards Operating Procedures (SOPs) for Inspection, Examination and Provision of Copies of Documents, 2015
8.1.3 NEPRA (Sale of Electric Power by Renewable Energy Companies) Guidelines, 2015
8.1.4 NEPRA Guidelines for determination of Consumer-end Tariff (Methodology and Process), 2015
8.1.5 Amendment made in NEPRA (Tariff Standards and Procedure) Rules, 1998
8.1.6 Amendment made in NEPRA Performance Standards (Distribution) Rules, 2005
8.1.7 Amendment made in NEPRA (Fines) Rules, 2002
8.1.8 Amendment made in NEPRA (Uniform System of Accounts) Rules, 2009
8.2 Advisories issued by NEPRA to the Government of Pakistan
Sr. No. Subject Sent to
1 Delay in finalization of Security Documents in thematter of Upfront SolarPower Projects
Ministry of Water and Power
2 Frequent Tripping EHV Transmission and Grid System during Foggy Weather Ministry of Water and Power
3 Delay Caused in Execution of Hydropower Projects due to repeated extensions of Letter of Intents
Ministry of Water and Power
4 Advisory in the matter of Finalizing PPA ad IA in the stipulated time regarding Solar Power Projects
Ministry of Water and Power
5 Delay in Finalization of Security Documents in the matter of Upfront Tariff of Solar Power Projects
Ministry of Water and Power
6 Delay Caused in Execution of Hydropower Projects due to repeated extensions of Letter of Intents
Ministry of Water and Power
7 Transmission System Breakdown on 24th January, 2015 Ministry of Water and Power
8 Need for Strengthening the Security Measures at Grid Stations/ Switches of Generating Companies
Ministry of Water and Power
8.3 Consumer AffairsSafeguarding the interest of consumers and protection them from discriminatory treatment or victimization is a vital objective of NEPRA. The Consumer Affairs Department is responsible for handling the complaints of consumers who can approach NEPRA without any procedural hindrance. NEPRA has established its Regional OfficesatalltheProvincialCapitalsinordertofacilitatetheelectricityconsumersforspeedyredressaloftheirgrievances.
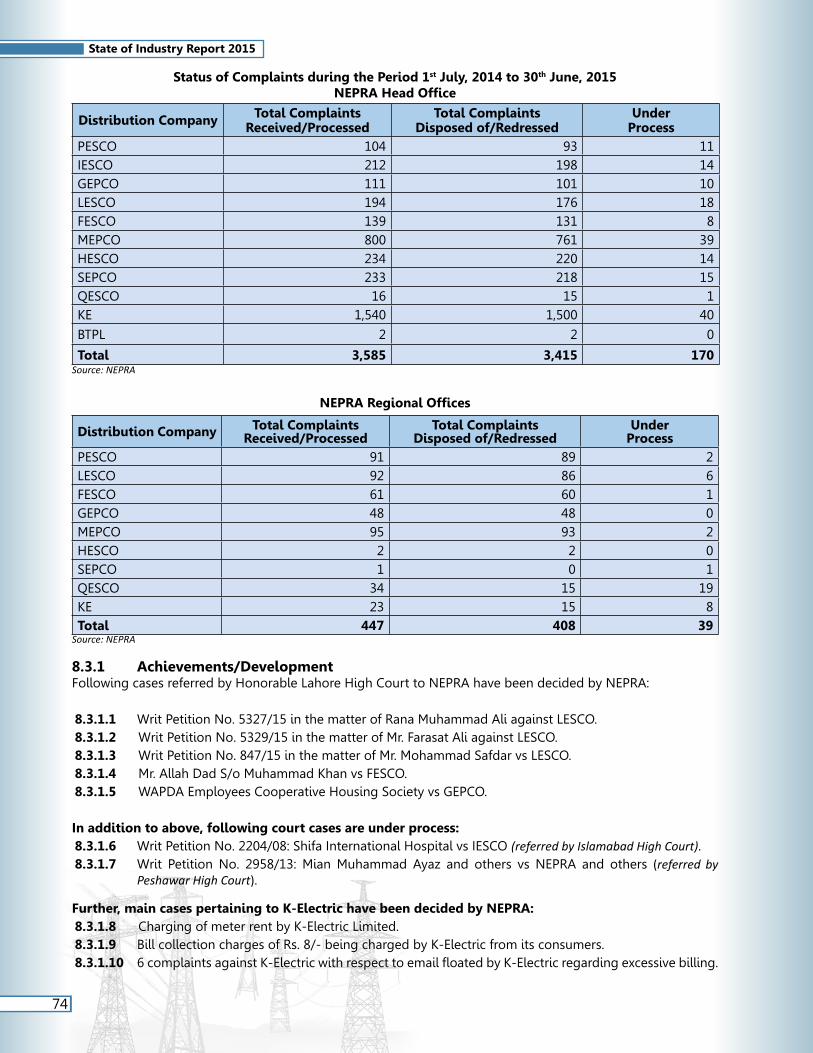
74
State of Industry Report 2015
Status of Complaints during the Period 1st July, 2014 to 30th June, 2015NEPRA Head Office
Distribution Company Total ComplaintsReceived/Processed
Total ComplaintsDisposed of/Redressed
UnderProcess
PESCO 104 93 11IESCO 212 198 14GEPCO 111 101 10LESCO 194 176 18FESCO 139 131 8MEPCO 800 761 39HESCO 234 220 14SEPCO 233 218 15QESCO 16 15 1KE 1,540 1,500 40
BTPL 2 2 0
Total 3,585 3,415 170Source: NEPRA
NEPRA Regional Offices
Distribution Company Total Complaints Received/Processed
Total ComplaintsDisposed of/Redressed
UnderProcess
PESCO 91 89 2LESCO 92 86 6FESCO 61 60 1GEPCO 48 48 0MEPCO 95 93 2HESCO 2 2 0SEPCO 1 0 1QESCO 34 15 19KE 23 15 8Total 447 408 39
Source: NEPRA
8.3.1 Achievements/DevelopmentFollowing cases referred by Honorable Lahore High Court to NEPRA have been decided by NEPRA:
8.3.1.1 Writ Petition No. 5327/15 in the matter of Rana Muhammad Ali against LESCO.8.3.1.2 Writ Petition No. 5329/15 in the matter of Mr. Farasat Ali against LESCO.8.3.1.3 Writ Petition No. 847/15 in the matter of Mr. Mohammad Safdar vs LESCO.8.3.1.4 Mr. Allah Dad S/o Muhammad Khan vs FESCO.8.3.1.5 WAPDA Employees Cooperative Housing Society vs GEPCO.
In addition to above, following court cases are under process:8.3.1.6 Writ Petition No. 2204/08: Shifa International Hospital vs IESCO (referred by Islamabad High Court).8.3.1.7 Writ Petition No. 2958/13: Mian Muhammad Ayaz and others vs NEPRA and others (referred by
Peshawar High Court).
Further, main cases pertaining to K-Electric have been decided by NEPRA:8.3.1.8 Charging of meter rent by K-Electric Limited.8.3.1.9 Bill collection charges of Rs. 8/- being charged by K-Electric from its consumers.8.3.1.10 6complaintsagainstK-ElectricwithrespecttoemailfloatedbyK-Electricregardingexcessivebilling.
ENERGY SECTOR OVERVIEW 9


77
State of Industry Report 2015
9. ENERGY SECTOR OVERVIEW
Primary commercial energy supplies in Pakistan comprise of oil, natural gas, coal, hydro and nuclear electricity. The primary energy supplies of the country during 2013-14 increased by 3.50% and reached 66.85 MTOE as compared to 64.59 MTOE during the same period last year. The overall contribution of gas in primary energy supplies of the country, during 2013-14, was the highest with 30.96 MTOE (46.32%) followed by the Oil 23.01 MTOE (34.42%), Hydro Electricity 7.61 MTOE (11.38%), Coal 3.59 MTOE (5.37%), Nuclear Electricity 1.22 MTOE (1.82%), LPG 0.36 MTOE (0.54%) and Imported Electricity 0.10 MTOE (0.15%).
9.1 OilThe balance recoverable reserves of crude oil of the country as on 30th June, 2014 were 371.029 million barrels while theproductionduring2013-14was recordedas31.58millionbarrel.The totaloil refiningcapacityofthe country as on 30th June, 2014 was 18.79 million tonnes per year while the total crude oil processed in the refineriesofthecountrywere11.76milliontonnes.Thetotalimportofthecrudeoilofthecountryduring2013-14 was 8.04 million tonnes which cost an amount of 6572.68 million US$ while during 2012-13 the total import of crude oil was 7.40 million tonnes with total cost of 6006.10 million US$. The consumption of petroleum products (Furnace Oil, Light Diesel Oil, High Speed Diesel and Motor Spirit) in power sector during 2013-14 was recorded as 9.01 million tonnes while during 2012-13 it was recorded as 7.75 million tonnes.
9.2 GasThe balance recoverable reserves of natural gas of the country as on 30th June, 2014 were 23.64074 trillion cft. while the production during 2013-14 was recorded as 1493508 million cft. The consumption of natural gas in power sector during 2013-14 was recorded as 349535 million cft. while during 2012-13 it was recorded as 362262 million cft. The total network for distribution of natural gas in Pakistan as on 30th June, 2014 was 149516 km. The total number of natural gas consumers in Pakistan, as on 30th June, 2014 was 7373708 of which the share of domestic, commercial and industrial consumers were (7285402), (77697) and (10609), respectively.
9.3 CoalThe estimated total coal reserves of the country as on 30th June, 2014 were about 186 billion tonnes while production of coal during 2013-14 was recorded as 3.44 million tonnes. The total coal imported by the country during 2013-14 was 3.12 million tonnes, which cost an amount of Rs. 31072 million. The total coal consumption in power sector during 2013-14 was 160710 tonnes as compared to 63039 tonnes, same period last year. However, the electricity generated through coal during 2012-13 and 2013-14 was 40 GWh and 112 GWh respectively.
9.4 Primary Energy SuppliesThe main primary energy production of the country consists of oil, gas, coal, nuclear electricity net generation (converted to Btu using the nuclear plants heat rate); and conventional hydroelectricity net generation (converted to Btu using the fossil-fueled plants heat rate). The primary commercial energy supplies by source from 2009-10 to 2013-14 is given in table 1.
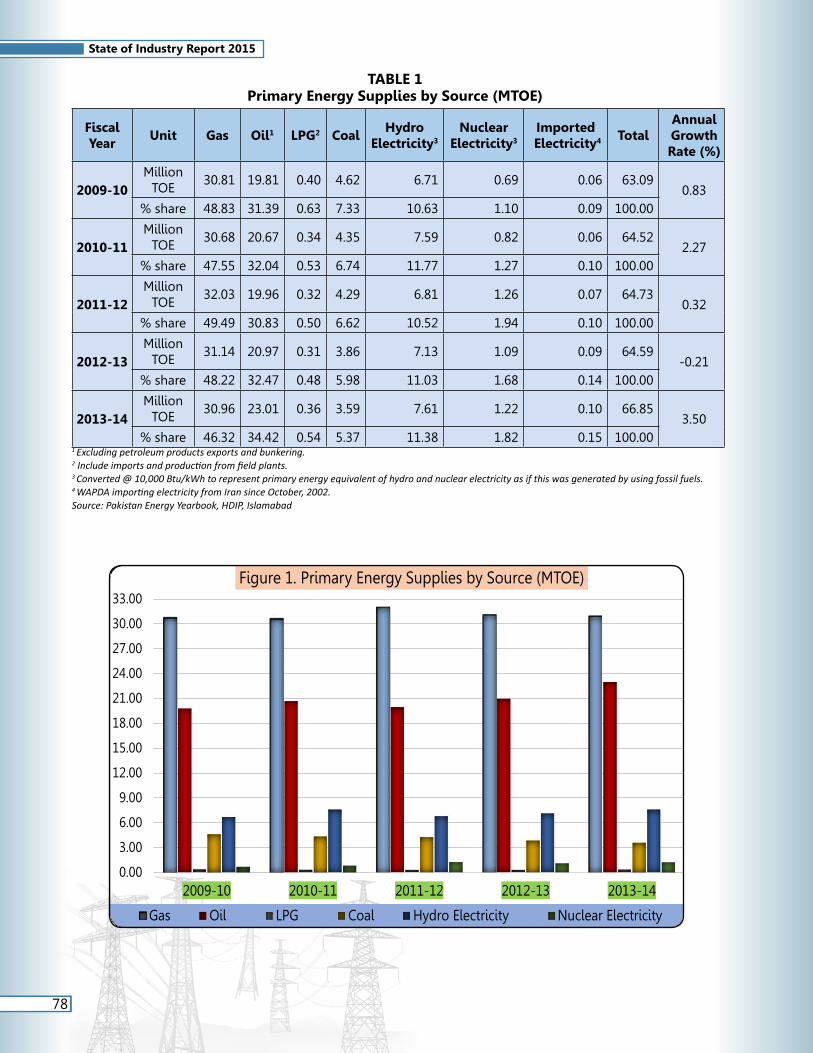
78
State of Industry Report 2015
TABLE 1Primary Energy Supplies by Source (MTOE)
Fiscal Year
Unit Gas Oil1 LPG2 CoalHydro
Electricity3
Nuclear Electricity3
Imported Electricity4 Total
Annual Growth Rate (%)
2009-10Million
TOE30.81 19.81 0.40 4.62 6.71 0.69 0.06 63.09
0.83% share 48.83 31.39 0.63 7.33 10.63 1.10 0.09 100.00
2010-11Million
TOE30.68 20.67 0.34 4.35 7.59 0.82 0.06 64.52
2.27% share 47.55 32.04 0.53 6.74 11.77 1.27 0.10 100.00
2011-12Million
TOE32.03 19.96 0.32 4.29 6.81 1.26 0.07 64.73
0.32% share 49.49 30.83 0.50 6.62 10.52 1.94 0.10 100.00
2012-13Million
TOE31.14 20.97 0.31 3.86 7.13 1.09 0.09 64.59
-0.21% share 48.22 32.47 0.48 5.98 11.03 1.68 0.14 100.00
2013-14Million
TOE30.96 23.01 0.36 3.59 7.61 1.22 0.10 66.85
3.50% share 46.32 34.42 0.54 5.37 11.38 1.82 0.15 100.00
1 Excluding petroleum products exports and bunkering.2 Include imports and production from field plants.3 Converted @ 10,000 Btu/kWh to represent primary energy equivalent of hydro and nuclear electricity as if this was generated by using fossil fuels.4 WAPDA importing electricity from Iran since October, 2002.Source: Pakistan Energy Yearbook, HDIP, Islamabad
0.00
3.00
6.00
9.00
12.00
15.00
18.00
21.00
24.00
27.00
30.00
33.00
2009-10 2010-11 2011-12 2012-13 2013-14
Figure 1. Primary Energy Supplies by Source (MTOE)
Gas Oil LPG Coal Hydro Electricity Nuclear Electricity

79
State of Industry Report 2015
9.5 Final Energy ConsumptionFinal energy is a form of energy available to the user following the conversion from primary energy. Gasoline ordieseloil,purifiedcoal,purifiednaturalgas,electricity,mechanicalenergyaredifferentformsoffinalenergy.Whengoingfromprimaryenergytofinalenergy,therearealwayslossofsomeenergywhichdependsontheefficiencyoftheconversiondevice.Thefinalenergyconsumptionbysourcefrom2009-10to2013-14isgivenin table 2.
TABLE 2Final Energy Consumption by Source (MTOE)
Fiscal Year Unit Gas2 Oil1 LPG Coal2 Electricity3 TotalAnnual Growth Rate (%)
2009-10Million TOE 17.02 10.83 0.58 4.28 6.05 38.77
3.81% share 43.91 27.93 1.49 11.05 15.62 100.00
2010-11Million TOE 16.78 11.25 0.50 4.03 6.28 38.84
0.19% share 43.20 28.97 1.30 10.36 16.17 100.00
2011-12Million TOE 17.62 11.62 0.48 4.06 6.25 40.03
3.05% share 44.02 29.03 1.20 10.14 15.62 100.00
2012-13Million TOE 17.52 12.22 0.53 3.66 6.25 40.18
0.40% share 43.60 30.41 1.31 9.11 15.56 100.00
2013-14Million TOE 16.28 12.72 0.59 3.45 6.79 39.82
-0.91% share 40.88 31.94 1.47 8.65 17.06 100.00
1 Excluding consumption for power generation.2 Excluding consumption for power generation and feedstock.3 @ 3412 Btu/kWh being the actual energy content of electricity.Source: Pakistan Energy Yearbook, HDIP, Islamabad
0.00
2.00
4.00
6.00
8.00
10.00
12.00
14.00
16.00
18.00
2009-10 2010-11 2011-12 2012-13 2013-14
Figure 2. Final Energy Consumption by Source (MTOE)
Gas Oil LPG Coal Electricity
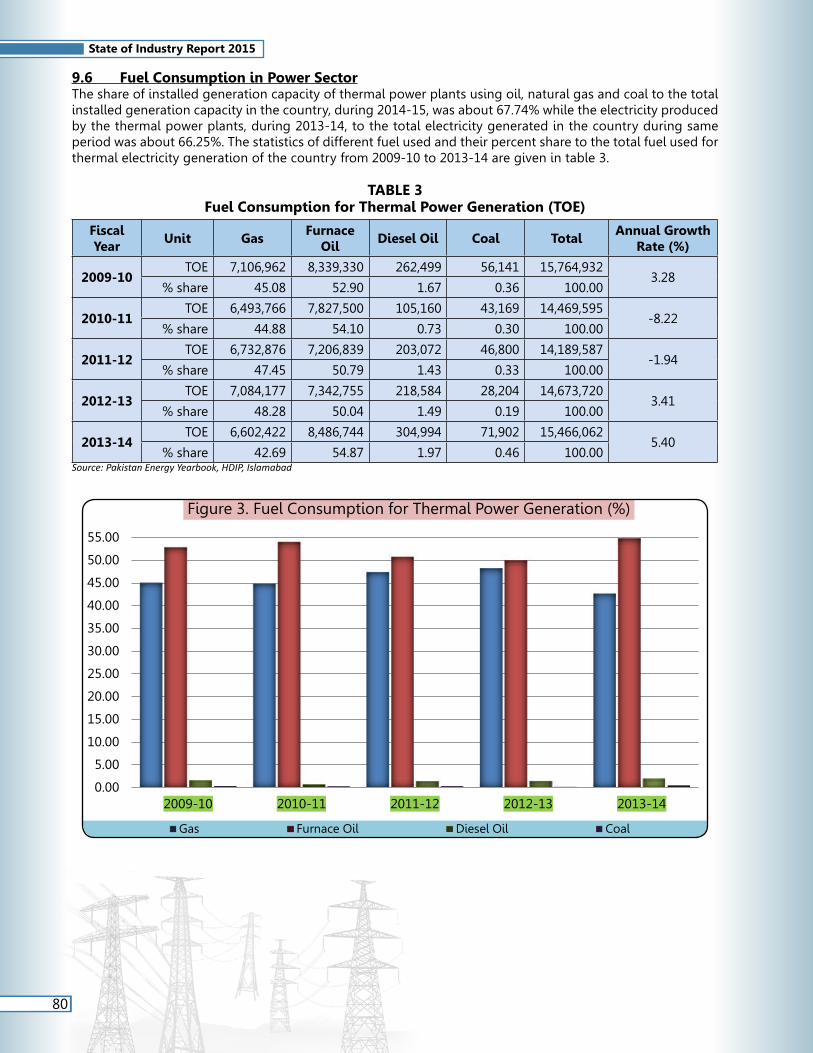
80
State of Industry Report 2015
9.6 Fuel Consumption in Power SectorThe share of installed generation capacity of thermal power plants using oil, natural gas and coal to the total installed generation capacity in the country, during 2014-15, was about 67.74% while the electricity produced by the thermal power plants, during 2013-14, to the total electricity generated in the country during same period was about 66.25%. The statistics of different fuel used and their percent share to the total fuel used for thermal electricity generation of the country from 2009-10 to 2013-14 are given in table 3.
TABLE 3Fuel Consumption for Thermal Power Generation (TOE)
Fiscal Year
Unit GasFurnace
OilDiesel Oil Coal Total
Annual Growth Rate (%)
2009-10TOE 7,106,962 8,339,330 262,499 56,141 15,764,932
3.28% share 45.08 52.90 1.67 0.36 100.00
2010-11TOE 6,493,766 7,827,500 105,160 43,169 14,469,595
-8.22% share 44.88 54.10 0.73 0.30 100.00
2011-12TOE 6,732,876 7,206,839 203,072 46,800 14,189,587
-1.94% share 47.45 50.79 1.43 0.33 100.00
2012-13TOE 7,084,177 7,342,755 218,584 28,204 14,673,720
3.41% share 48.28 50.04 1.49 0.19 100.00
2013-14TOE 6,602,422 8,486,744 304,994 71,902 15,466,062
5.40% share 42.69 54.87 1.97 0.46 100.00
Source: Pakistan Energy Yearbook, HDIP, Islamabad
0.00
5.00
10.00
15.00
20.00
25.00
30.00
35.00
40.00
45.00
50.00
55.00
2009-10 2010-11 2011-12 2012-13 2013-14
Figure 3. Fuel Consumption for Thermal Power Generation (%)
Gas Furnace Oil Diesel Oil Coal
10ELECTRICITY SECTOR OVERVIEW

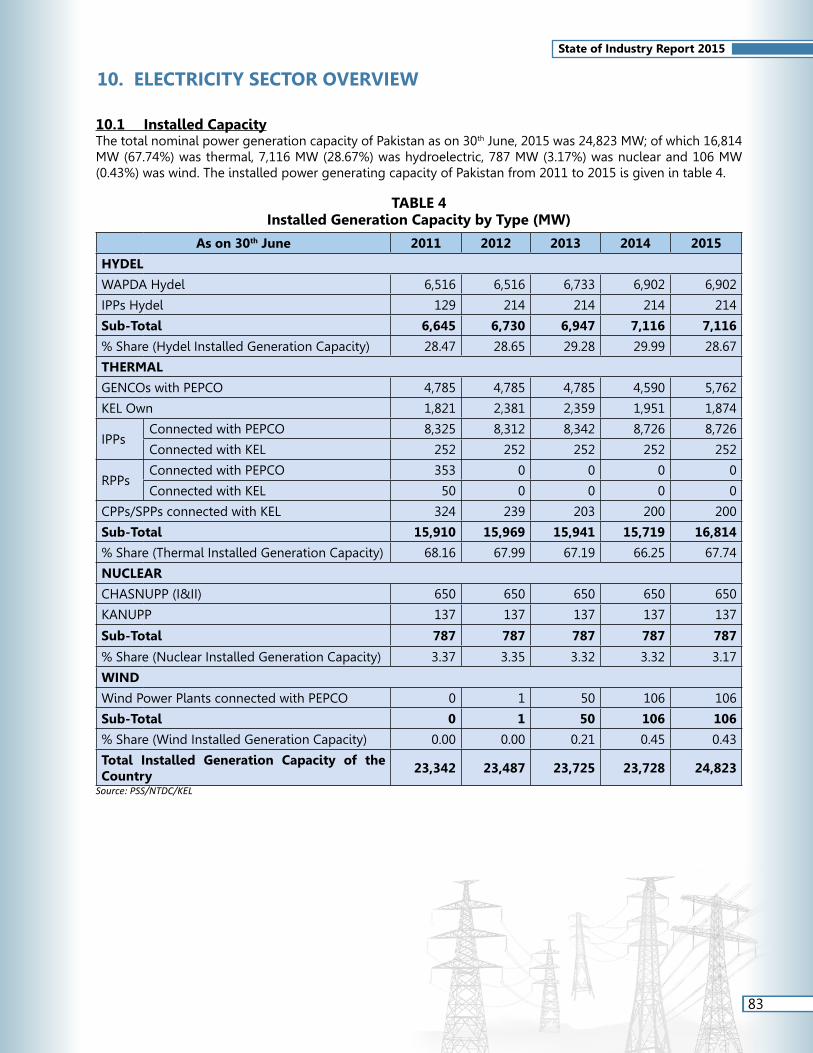
83
State of Industry Report 2015
10. ELECTRICITY SECTOR OVERVIEW
10.1 Installed CapacityThe total nominal power generation capacity of Pakistan as on 30th June, 2015 was 24,823 MW; of which 16,814 MW (67.74%) was thermal, 7,116 MW (28.67%) was hydroelectric, 787 MW (3.17%) was nuclear and 106 MW (0.43%) was wind. The installed power generating capacity of Pakistan from 2011 to 2015 is given in table 4.
TABLE 4Installed Generation Capacity by Type (MW)
As on 30th June 2011 2012 2013 2014 2015
HYDEL
WAPDA Hydel 6,516 6,516 6,733 6,902 6,902
IPPs Hydel 129 214 214 214 214
Sub-Total 6,645 6,730 6,947 7,116 7,116
% Share (Hydel Installed Generation Capacity) 28.47 28.65 29.28 29.99 28.67
THERMAL
GENCOs with PEPCO 4,785 4,785 4,785 4,590 5,762
KEL Own 1,821 2,381 2,359 1,951 1,874
IPPsConnected with PEPCO 8,325 8,312 8,342 8,726 8,726
Connected with KEL 252 252 252 252 252
RPPsConnected with PEPCO 353 0 0 0 0
Connected with KEL 50 0 0 0 0
CPPs/SPPs connected with KEL 324 239 203 200 200
Sub-Total 15,910 15,969 15,941 15,719 16,814
% Share (Thermal Installed Generation Capacity) 68.16 67.99 67.19 66.25 67.74
NUCLEAR
CHASNUPP (I&II) 650 650 650 650 650
KANUPP 137 137 137 137 137
Sub-Total 787 787 787 787 787
% Share (Nuclear Installed Generation Capacity) 3.37 3.35 3.32 3.32 3.17
WIND
Wind Power Plants connected with PEPCO 0 1 50 106 106
Sub-Total 0 1 50 106 106
% Share (Wind Installed Generation Capacity) 0.00 0.00 0.21 0.45 0.43
Total Installed Generation Capacity of the Country
23,342 23,487 23,725 23,728 24,823
Source: PSS/NTDC/KEL

84
State of Industry Report 2015
TABLE 5Plant-wise Installed Generation Capacity (MW) as on 30th June
Power Station Plant Location Type of Power Station 2011 2012 2013 2014 2015
A1: Hydel (WAPDA)
Major Hydropower Units
Tarbela Tarbela, KPK Reservoir 3,478 3,478 3,478 3,478 3,478
Ghazi Barotha Ghazi Barotha, Punjab Run of River 1,450 1,450 1,450 1,450 1,450
Mangla Mangla, AJ&K Reservoir 1,000 1,000 1,000 1,000 1,000
Warsak Warsak, KPK Reservoir 243 243 243 243 243
Chashma Chashma, Punjab Run of River 184 184 184 184 184
Khan Khwar Shangla, KPK Reservoir 72 72 72 72 72
Allai Khwar Battagram, KPK Reservoir 0 0 121 121 121
Jinnah Mianwali, Punjab Run of River 0 0 96 96 96
Duber Khwar Kohistan, KPK Reservoir 0 0 0 130 130
Small Hydropower Units
Dargai Dargai, KPK Run of Canal 20 20 20 20 20
Rasul Rasul, Punjab Run of Canal 22 22 22 22 22
Shadiwal Shadiwal, Punjab Run of Canal 14 14 14 14 14
Chichoki Mallian Chichoki Mallian, Punjab Run of Canal 13 13 13 13 13
Nandipur Nandipur, Punjab Run of Canal 14 14 14 14 14
Kurram Garhi Kurram Garhi, KPK Run of Canal 4 4 4 4 4
Renala Renala, Punjab Run of Canal 1 1 1 1 1
Chitral Chitral, KPK Run of Canal 1 1 1 1 1
Gomal Zam South Waziristan Agency, KPK Reservoir 0 0 0 17 17
Malakand/Jabban Malakand, KPK Run of River 0 0 0 22 22
Total Hydel (WAPDA) 6,516 6,516 6,733 6,902 6,902
0.00
10.00
20.00
30.00
40.00
50.00
60.00
70.00
2011 2012 2013 2014 2015
Figure 4. Share of Installed Generation Capacity by Type (%)
% Share (Hydel Installed Generation Capacity) % Share (Thermal Installed Generation Capacity)% Share (Nuclear Installed Generation Capacity) % Share (Wind Installed Generation Capacity)
Continued.....

85
State of Industry Report 2015
Power Station Plant Location Type of Power Station 2011 2012 2013 2014 2015
A2: Hydel (IPPs)
Jagran AJ&K Jagran, AJ&K Hydro 30 30 30 30 30
Malakand-III (PEDO) Malakand, KPK Hydro 81 81 81 81 81
Pehur (PEDO) Swabi, KPK Hydro 18 18 18 18 18
Laraib Energy Jhelum River, AJ&K Hydro 0 84 84 84 84
Garam Chashma Chitral, KPK Hydro 0 1 1 1 1
Total Hydel (IPPs) 129 214 214 214 214
Total Hydel (A1+A2) 6,645 6,730 6,947 7,116 7,116
B1: Thermal (GENCOs in PEPCO system)
TPS Jamshoro Jamshoro, Sindh STs 850 850 850 850 850
GTPS Kotri Kotri, Sindh GTs+CCPP 174 174 174 174 174
TPS Guddu Guddu, Sindh STs+GTs+CCPPs 1,655 1,655 1,655 1,655 2,402
TPS Quetta Quetta, Balochistan GT 35 35 35 35 35
TPS Muzaffargarh Muzaffargarh, Punjab STs 1,350 1,350 1,350 1,350 1,350
SPS GTPS Faisalabad Faisalabad, Punjab STs+GTs+CCPPs 376 376 376 376 376
NGPS Multan Multan, Punjab STs 195 195 195 0 0
Nandipur Gujranwala, Punjab GTs+CCPPs 0 0 0 0 425
FBC Lakhra Lakhra, Sindh STs 150 150 150 150 150
Total Thermal (GENCOs in PEPCO system) 4,785 4,785 4,785 4,590 5,762
B2: Thermal (IPPs connected with PEPCO system)
Lal Pir Power Mehmood Kot, Punjab ST 362 362 362 362 362
Pak Gen. Power Mehmood Kot, Punjab ST 365 365 365 365 365
Altern Energy Fateh Jang, Punjab GEs 31 31 31 31 31
Fauji Kabirwala Kabirwala, Punjab GTs+CCPP 157 157 157 157 157
Habibullah Coastal Quetta, Balochistan GTs+CCPP 140 140 140 140 140
HUBCO Hub, Balochistan STs 1,292 1,292 1,292 1,292 1,292
Japan Power Raiwind, Punjab DE 135 135 135 135 135
KAPCO Kot Addu, Punjab GTs+CCPPs 1,639 1,638 1,638 1,638 1,638
Kohinoor Energy Raiwind, Punjab DEs+ST 131 131 131 131 131
Rousch Power Sidhnai, Punjab GTs+ST 450 450 450 450 450
Saba Power Farooqabad, Punjab ST 134 134 134 134 134
Southern Electric Raiwind, Punjab DEs 136 117 136 136 136
TNB Liberty Power Daharki, Sindh GTs+CCPP 235 235 235 235 235
Uch Power Murad Jamali, Balochistan GTs+ST 586 586 586 586 586
Attock Gen. Attock Morgah, Punjab DGs+ST 165 164 164 165 165
Atlas Power Sheikhupura, Punjab REs+ST 224 224 224 219 219
Engro Power Gen. Qadirpur Qadirpur, Sindh GT+ST 226 227 227 217 217
Saif Power Sahiwal, Punjab GTs+ST 225 225 225 225 225
Orient Power Balloki, Punjab GTs+ST 225 225 225 225 225
Nishat Power Qasur, Punjab REs+ST 202 202 202 202 202
Nishat Chunian Qasur, Punjab DEs+ST 202 202 202 202 202
Sapphire Electric Muridke, Punjab GTs+ST 229 235 235 235 235
Halmore Power Bhikki, Punjab GTs+ST 225 225 225 225 225
HUBCO Narowal Narowal, Punjab DEs+ST 225 225 225 214 214Continued.....

86
State of Industry Report 2015
Power Station Plant Location Type of Power Station 2011 2012 2013 2014 2015
Liberty Power Tech. Faisalabad, Punjab DEs+ST 202 202 202 202 202
Foundation Power Daharki, Sindh GT+ST 182 183 183 185 185
Davis Energen. Jhang, Punjab GEs 0 0 11 11 11
Uch Power-II Murad Jamali, Balochistan GTs+ST 0 0 0 381 381
JDW (II & III) (Bagasse) Rahim Yar Khan, Punjab STs 0 0 0 26 26
Rental Power Plants 353 0 0 0 0
Total Thermal (IPPs connected with PEPCO system) 8,678 8,312 8,342 8,726 8,726
Total Thermal in PEPCO system (B1+B2) 13,463 13,097 13,127 13,316 14,488
C1: Thermal (KEL Own)
Bin Qasim TPS-I Karachi, Sindh STs 1,260 1,260 1,260 840 840
Bin Qasim TPS-II Karachi, Sindh GTs 0 560 560 572 572
Korangi TPS Karachi, Sindh STs 125 125 125 125 0
Korangi Town GTPS-I Karachi, Sindh GTs 20 20 0 0 0
Korangi Town GTPS-II Karachi, Sindh GTs 88 88 97 97 107
Site GTPS-I Karachi, Sindh GTs 20 20 0 0 0
Site GTPS-II Karachi, Sindh GTs 88 88 97 97 107
Korangi CCPP Karachi, Sindh GTs 220 220 220 220 248
Total Thermal (KEL Own) 1,821 2,381 2,359 1,951 1,874
C2: Thermal (IPPs connected with KEL)
Gul Ahmed Karachi, Sindh DE+ST 128 128 128 128 128
Tapal Energy Karachi, Sindh DE+ST 124 124 124 124 124
Total Thermal (IPPs connected with KEL) 252 252 252 252 252
C3: Thermal (Others connected with KEL)
PASMIC Karachi, Sindh STs 110 110 165 165 165
Anoud Power Karachi, Sindh DGs 12 12 15 12 12
DHA Cogen. Karachi, Sindh GT+ST 94 94 0 0 0
ISL (19 MW) Karachi, Sindh GEs+ST 19 19 19 19 19
IIL (4 MW) Karachi, Sindh GEs 4 4 4 4 4
Aggreko (Rental) Karachi, Sindh --- 50 0 0 0 0
Engro Polymer Karachi, Sindh GTs+ST 70 0 0 0 0
Al-Abbas (Coal) Karachi, Sindh ST 15 0 0 0 0
Total Thermal (Others connected with KEL) 374 239 203 200 200
Total Thermal KEL (C1+C2+C3) 2,447 2,872 2,814 2,403 2,326
D: Nuclear
CHASNUPP-I Chashma, Punjab STs 325 325 325 325 325
CHASNUPP-II Chashma, Punjab STs 325 325 325 325 325
KANUPP Karachi, Sindh STs 137 137 137 137 137
Total Nuclear (D) 787 787 787 787 787
E: Renewable Energy (connected with PEPCO system)
Zorlu Enerji Pakistan Thatta, Sindh Wind 0 1 50 56 56
FFC Energy Thatta, Sindh Wind 0 0 0 50 50
Total Renewable Energy (connected with PEPCO system) (E) 0 1 50 106 106
Grand Total (A+B+C+D+E) 23,342 23,487 23,725 23,728 24,823Source: PSS/NTDC/KEL
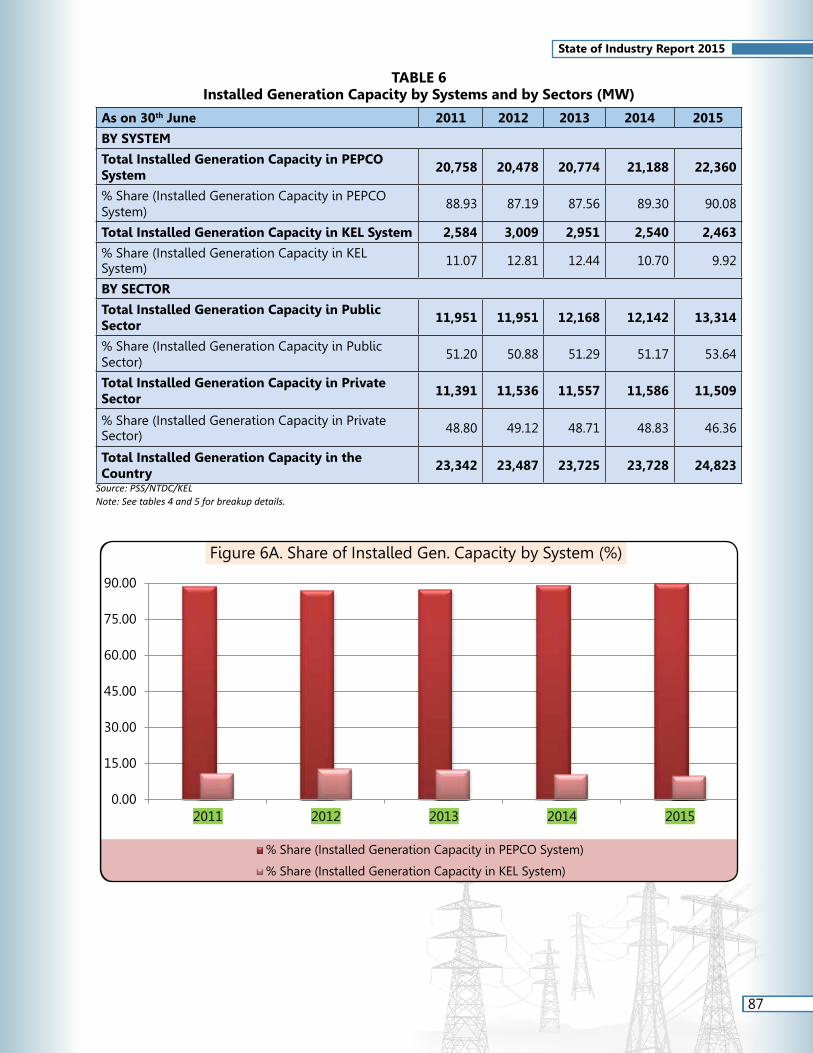
87
State of Industry Report 2015
TABLE 6Installed Generation Capacity by Systems and by Sectors (MW)
As on 30th June 2011 2012 2013 2014 2015
BY SYSTEM
Total Installed Generation Capacity in PEPCO System
20,758 20,478 20,774 21,188 22,360
% Share (Installed Generation Capacity in PEPCO System)
88.93 87.19 87.56 89.30 90.08
Total Installed Generation Capacity in KEL System 2,584 3,009 2,951 2,540 2,463
% Share (Installed Generation Capacity in KEL System) 11.07 12.81 12.44 10.70 9.92
BY SECTOR
Total Installed Generation Capacity in Public Sector
11,951 11,951 12,168 12,142 13,314
% Share (Installed Generation Capacity in Public Sector)
51.20 50.88 51.29 51.17 53.64
Total Installed Generation Capacity in Private Sector
11,391 11,536 11,557 11,586 11,509
% Share (Installed Generation Capacity in Private Sector) 48.80 49.12 48.71 48.83 46.36
Total Installed Generation Capacity in the Country
23,342 23,487 23,725 23,728 24,823
Source: PSS/NTDC/KELNote: See tables 4 and 5 for breakup details.
0.00
15.00
30.00
45.00
60.00
75.00
90.00
2011 2012 2013 2014 2015
Figure 6A. Share of Installed Gen. Capacity by System (%)
% Share (Installed Generation Capacity in PEPCO System)
% Share (Installed Generation Capacity in KEL System)

88
State of Industry Report 2015
TABLE 7Electricity Generation by Type (GWh)
As on 30th June 2010-11 2011-12 2012-13 2013-14 2014-15HYDELWAPDA Hydel 31,685 28,207 29,327 31,204 31,941IPPs Hydel 305 436 706 1,035 1,038Sub-Total 31,990 28,643 30,033 32,239 32,979 % Share (Hydel Electricity Generation) 31.80 28.85 30.44 30.50 30.24THERMALGENCOs with PEPCO 13,018 12,652 12,872 13,016 13,300KEL Own 7,826 8,029 8,567 8,709 9,319
IPPsConnected with PEPCO 41,209 42,222 40,062 43,701 44,638Connected with KEL 1,538 933 1,116 1,380 1,525
RPPsConnected with PEPCO 546 758 0 0 0Connected with KEL 158 0 0 0 0
CPPs/SPPs connected with PEPCO 587 730 1,280 1,108 1,015CPPs/SPPs connected with KEL 287 154 137 168 191Sub-Total 65,169 65,478 64,034 68,082 69,988% Share (Thermal Electricity Generation) 64.79 65.94 64.91 64.41 64.17NUCLEARCHASNUPP (I&II) 2,930 4,413 3,640 4,402 4,996KANUPP 200 459 541 293 353Sub-Total 3,130 4,872 4,181 4,695 5,349 % Share (Nuclear Electricity Generation) 3.11 4.91 4.24 4.44 4.90IMPORTImport from Iran 269 296 375 419 443Import from KEL 26 0 0 0 0Sub-Total 295 296 375 419 443% Share (Imported Electricity Generation) 0.29 0.30 0.38 0.40 0.41WINDWind Power Plants connected with PEPCO 0 6 32 263 300Sub-Total 0 6 32 263 300% Share (Wind Electricity Generation) 0.00 0.01 0.03 0.25 0.27Total Electricity Generation of the Country 100,584 99,295 98,655 105,698 109,059
Source: PSS/NTDC/KEL
0.00
10.00
20.00
30.00
40.00
50.00
60.00
2011 2012 2013 2014 2015
Figure 6B. Share of Installed Gen. Capacity by Sector (%)
% Share (Installed Generation Capacity in Public Sector)
% Share (Installed Generation Capacity in Private Sector)

89
State of Industry Report 2015
TABLE 8Plant-wise Electricity Generation (GWh)
Power StationPrimary
FuelAlternate
Fuel2010-11 2011-12 2012-13 2013-14 2014-15
A1: Hydel (WAPDA)
Major Hydropower Units
Tarbela Hydel Hydel 15,909 14,057 14,756 15,138 14,809
Ghazi Barotha Hydel Hydel 7,354 6,979 7,083 6,937 6,694
Mangla Hydel Hydel 5,969 4,666 4,577 5,725 6,496
Warsak Hydel Hydel 1,036 991 1,034 870 975
Chashma Hydel Hydel 1,001 1,016 1,115 1,024 987
Khan Khwar Hydel Hydel 114 179 288 257 253
Allai Khwar Hydel Hydel 0 0 0 470 462
Jinnah Hydel Hydel 0 0 189 291 191
Duber Khwar Hydel Hydel 0 0 0 0 613
Small Hydropower Units
Dargai Hydel Hydel 83 84 94 89 108
Rasul Hydel Hydel 96 68 48 51 68
Shadiwal Hydel Hydel 32 33 31 30 26
Chichoki Mallian Hydel Hydel 32 34 40 36 33
Nandipur Hydel Hydel 43 42 49 41 35
Kurram Garhi Hydel Hydel 10 11 14 19 19
Renala Hydel Hydel 3 3 3 3 2
Chitral Hydel Hydel 3 4 4 4 4
Gomal Zam Hydel Hydel 0 0 0 26 44
Malakand/Jabban Hydel Hydel 0 0 2 73 122
Others Hydel Hydel 0 40 0 120 0
Total Hydel (WAPDA) 31,685 28,207 29,327 31,204 31,941
0.00
10.00
20.00
30.00
40.00
50.00
60.00
70.00
2010-11 2011-12 2012-13 2013-14 2014-15
Figure 7. Share of Electricity Generation by Type (%)
% Share (Hydel Electricity Generation) % Share (Thermal Electricity Generation)% Share (Nuclear Electricity Generation) % Share (Imported Electricity Generation)% Share (Wind Electricity Generation)
Continued.....
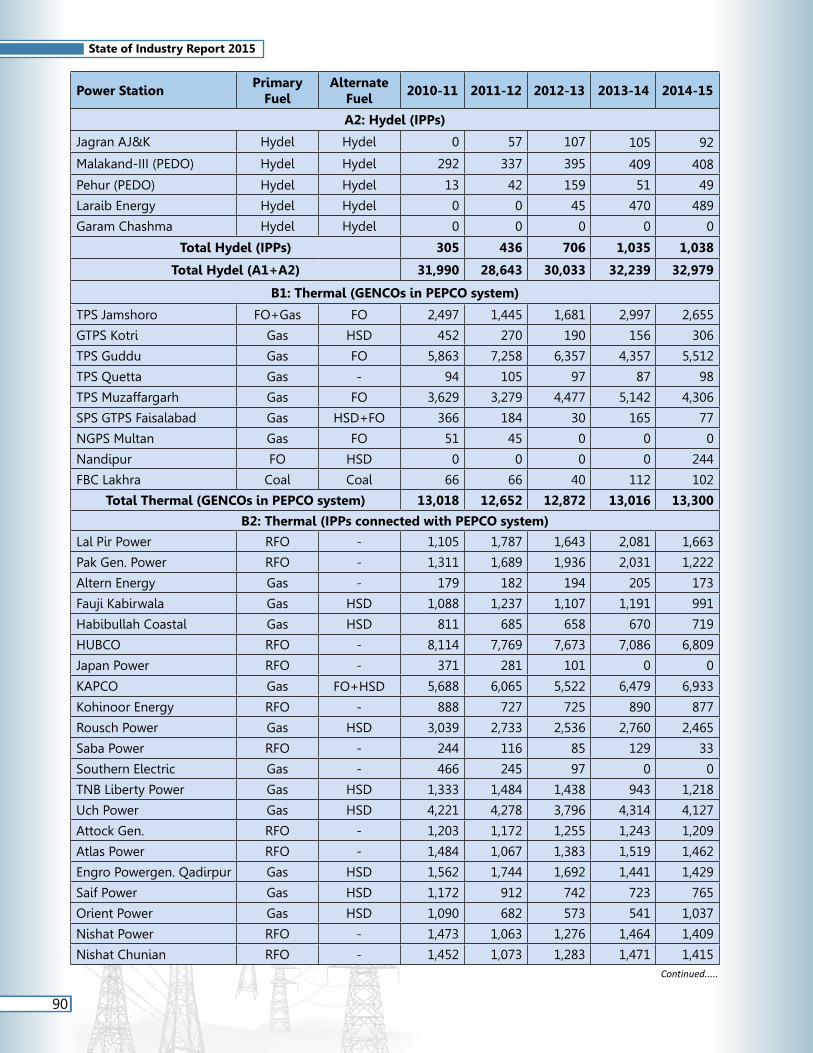
90
State of Industry Report 2015
Power StationPrimary
FuelAlternate
Fuel2010-11 2011-12 2012-13 2013-14 2014-15
A2: Hydel (IPPs)
Jagran AJ&K Hydel Hydel 0 57 107 105 92
Malakand-III (PEDO) Hydel Hydel 292 337 395 409 408
Pehur (PEDO) Hydel Hydel 13 42 159 51 49
Laraib Energy Hydel Hydel 0 0 45 470 489
Garam Chashma Hydel Hydel 0 0 0 0 0
Total Hydel (IPPs) 305 436 706 1,035 1,038
Total Hydel (A1+A2) 31,990 28,643 30,033 32,239 32,979
B1: Thermal (GENCOs in PEPCO system)
TPS Jamshoro FO+Gas FO 2,497 1,445 1,681 2,997 2,655
GTPS Kotri Gas HSD 452 270 190 156 306
TPS Guddu Gas FO 5,863 7,258 6,357 4,357 5,512
TPS Quetta Gas - 94 105 97 87 98
TPS Muzaffargarh Gas FO 3,629 3,279 4,477 5,142 4,306
SPS GTPS Faisalabad Gas HSD+FO 366 184 30 165 77
NGPS Multan Gas FO 51 45 0 0 0
Nandipur FO HSD 0 0 0 0 244
FBC Lakhra Coal Coal 66 66 40 112 102
Total Thermal (GENCOs in PEPCO system) 13,018 12,652 12,872 13,016 13,300
B2: Thermal (IPPs connected with PEPCO system)
Lal Pir Power RFO - 1,105 1,787 1,643 2,081 1,663
Pak Gen. Power RFO - 1,311 1,689 1,936 2,031 1,222
Altern Energy Gas - 179 182 194 205 173
Fauji Kabirwala Gas HSD 1,088 1,237 1,107 1,191 991
Habibullah Coastal Gas HSD 811 685 658 670 719
HUBCO RFO - 8,114 7,769 7,673 7,086 6,809
Japan Power RFO - 371 281 101 0 0
KAPCO Gas FO+HSD 5,688 6,065 5,522 6,479 6,933
Kohinoor Energy RFO - 888 727 725 890 877
Rousch Power Gas HSD 3,039 2,733 2,536 2,760 2,465
Saba Power RFO - 244 116 85 129 33
Southern Electric Gas - 466 245 97 0 0
TNB Liberty Power Gas HSD 1,333 1,484 1,438 943 1,218
Uch Power Gas HSD 4,221 4,278 3,796 4,314 4,127
Attock Gen. RFO - 1,203 1,172 1,255 1,243 1,209
Atlas Power RFO - 1,484 1,067 1,383 1,519 1,462
Engro Powergen. Qadirpur Gas HSD 1,562 1,744 1,692 1,441 1,429
Saif Power Gas HSD 1,172 912 742 723 765
Orient Power Gas HSD 1,090 682 573 541 1,037
Nishat Power RFO - 1,473 1,063 1,276 1,464 1,409
Nishat Chunian RFO - 1,452 1,073 1,283 1,471 1,415Continued.....

91
State of Industry Report 2015
Power StationPrimary
FuelAlternate
Fuel2010-11 2011-12 2012-13 2013-14 2014-15
Sapphire Electric Gas HSD 843 871 877 760 944
Halmore Power Gas HSD 209 570 374 504 713
HUBCO Narowal RFO - 463 1,321 820 1,562 1,418
Liberty Power Tech. RFO - 997 1,068 892 1,520 1,515
Foundation Power Gas - 403 1,401 1,380 1,359 1,323
Davis Energen. Gas - 0 0 4 54 70
Uch Power-II Low BTU Gas - 0 0 0 752 2,415
JDW (II & III) (Bagasse) Bagasse + Biomass 0 0 0 9 284
Others (SPPs/CPPs) in PEPCO system 587 730 1,280 1,108 1,015
Rental Power Plants 546 758 0 0 0
Total Thermal (IPPs/SPPs/CPPs connected with PEPCO system)
42,342 43,710 41,342 44,809 45,653
Total Thermal in PEPCO system (B1+B2) 55,360 56,362 54,214 57,825 58,953
C1: Thermal (KEL Own)
Bin Qasim TPS-I Dual 5,068 4,704 3,722 3,765 3,925
Bin Qasim TPS-II Dual 0 1,140 3,567 3,639 3,907
Korangi TPS Dual 271 163 0 0 0
Korangi Town GTPS-I Gas 1 0 0 0 0
Korangi Town GTPS-II Gas 675 595 327 393 435
Site GTPS-I Gas 0 0 0 0 0
Site GTPS-II Gas 586 416 156 113 160
Korangi CCPP Gas 1,225 1,011 795 799 892
Total Thermal (KEL Own) 7,826 8,029 8,567 8,709 9,319
C2: Thermal (IPPs connected with KEL)
Gul Ahmed FO 745 452 432 582 718
Tapal Energy FO 793 481 684 798 807
Total Thermal (IPPs connected with KEL) 1,538 933 1,116 1,380 1,525
C3: Thermal (Others connected with KEL)
PASMIC Gas 64 8 4 9 21
Anoud Power Gas 75 52 56 84 95
DHA Cogen. Gas 0 0 0 0 0
ISL (19 MW) Gas 99 88 72 67 67
IIL (4 MW) Gas 5 6 5 8 8
Aggreko (Rental) Gas 158 0 0 0 0
Engro Polymer Gas 2 0 0 0 0
Al-Abbas (Coal) Coal 43 0 0 0 0
Total Thermal (Others connected with KEL) 445 154 137 168 191
Total Thermal KEL (C1+C2+C3) 9,809 9,116 9,820 10,257 11,035Continued.....

92
State of Industry Report 2015
Power StationPrimary
FuelAlternate
Fuel2010-11 2011-12 2012-13 2013-14 2014-15
D: Nuclear
CHASNUPP-I NUC NUC 2,387 2,127 2,121 2,194 2,455
CHASNUPP-II NUC NUC 543 2,286 1,519 2,208 2,541
KANUPP NUC NUC 200 459 541 293 353
Total Nuclear (D) 3,130 4,872 4,181 4,695 5,349
E: Import
Import from Iran (Tavanir) 269 296 375 419 443
Import from K-Electric Limited 26 0 0 0 0
Total import in PEPCO system (E) 295 296 375 419 443
F: Renewable Energy (connected with PEPCO system)
Zorlu Enerji Pakistan Wind Wind 0 6 32 134 161
FFC Energy Wind Wind 0 0 0 129 139
Total Renewable Energy (connected with PEPCO system) (F)
0 6 32 263 300
Grand Total (A+B+C+D+E+F) 100,584 99,295 98,655 105,698 109,059Source: PSS/NTDC/KEL
TABLE 9Electricity Generation by Systems and by Sectors (GWh)
As on 30th June 2010-11 2011-12 2012-13 2013-14 2014-15
BY SYSTEM
Total Electricity Generation in PEPCO System
90,549 89,720 88,294 95,148 97,671
% Share (Generation in PEPCO System) 90.02 90.36 89.50 90.02 89.56
Total Electricity Generation in KEL System
10,035 9,575 10,361 10,550 11,388
% Share (Generation in KEL System) 9.98 9.64 10.50 9.98 10.44
BY SECTOR
Total Electricity Generation in Public Sector
47,833 45,731 46,380 48,915 50,590
% Share (Generation in Public Sector) 47.56 46.06 47.01 46.28 46.39
Total Electricity Generation in Private Sector
52,751 53,564 52,275 56,783 58,469
% Share (Generation in Private Sector) 52.44 53.94 52.99 53.72 53.61
Total Electricity Generation of the Country
100,584 99,295 98,655 105,698 109,059
Source: PSS/NTDC/KELNote: See tables 7 and 8 for details and explanations.

93
State of Industry Report 2015
0.00
10.00
20.00
30.00
40.00
50.00
60.00
70.00
80.00
90.00
2010-11 2011-12 2012-13 2013-14 2014-15
Figure 9A. Share of Electricity Generation by System (%)
% Share (Generation in PEPCO System) % Share (Generation in KEL System)
0.00
10.00
20.00
30.00
40.00
50.00
60.00
2010-11 2011-12 2012-13 2013-14 2014-15
Figure 9B. Share of Electricity Generation by Sector (%)
% Share (Generation in Public Sector) % Share (Generation in Private Sector)

94
State of Industry Report 2015
TABLE 10Electricity Statistics of K-Electric Limited
Name of Plant Year Units Generated
Auxiliary Consumption Units Sent OutGWh %
1 Units Generated by KEL Own (GWh)
1.1Bin Qasim Thermal Power
Station-I (BQTPS-I)
2010-11 5068.28 435.91 8.60 4632.372011-12 4704.00 414.00 8.80 4290.00
2012-13 3722.00 341.00 9.16 3381.00
2013-14 3765.00 341.00 9.06 3424.00
2014-15 3925.00 360.00 9.17 3565.00
1.2Bin Qasim Thermal Power
Station-II (BQTPS-II)
2011-12 1140.00 102.00 8.95 1038.002012-13 3567.00 239.00 6.70 3328.00
2013-14 3639.00 237.00 6.51 3402.00
2014-15 3907.00 251 6.42 3656.00
1.3Korangi Thermal Power
Station (KTPS)
2010-11 270.51 34.10 12.61 236.412011-12 163.00 20.00 12.27 143.00
2012-13 0.00 2.00 0.00 -2.00
2013-14 0.00 0.00 0.00 0.00
2014-15 0.00 0.00 0.00 0.00
1.4Korangi Town Gas
Turbine Power Station-I (KTGTPS-I)
2010-11 0.61 0.02 3.28 0.592011-12 0.00 0.00 0.00 0.00
2012-13 0.00 0.00 0.00 0.00
2013-14 0.00 0.00 0.00 0.00
2014-15 0.00 0.00 0.00 0.00
1.5Korangi Town Gas Turbine
Power Station-II (KTGTPS-II)
2010-11 675.07 15.13 2.24 659.942011-12 595.00 14.00 2.35 581.00
2012-13 327.00 9.00 2.75 318.00
2013-14 393.00 10.00 2.54 383.00
2014-15 435.00 11.00 2.53 424.00
1.6Site Gas Turbine Power
Station-I (SGTPS-I)
2010-11 0.10 0.01 10.00 0.092011-12 0.00 0.00 0.00 0.00
2012-13 0.00 0.00 0.00 0.00
2013-14 0.00 0.00 0.00 0.00
2014-15 0.00 0.00 0.00 0.00
1.7Site Gas Turbine Power
Station-II (SGTPS-II)
2010-11 586.20 15.06 2.57 571.142011-12 416.00 11.00 2.64 405.00
2012-13 156.00 8.00 5.13 148.00
2013-14 113.00 6.00 5.31 107.00
2014-15 160.00 8.00 5.00 152.00
1.8Korangi Combined Cycle
Power Plant
2010-11 1225.50 91.39 7.46 1134.112011-12 1011.00 75.00 7.42 936.00
2012-13 795.00 66.00 8.30 729.00
2013-14 799.00 64.00 8.01 735.00
2014-15 892.00 74.00 8.30 818.00Continued.....

95
State of Industry Report 2015
Name of Plant Year Units Generated
Auxiliary Consumption Units Sent OutGWh %
1.9Total Units Generated from KEL's Own Power
Plants
2010-11 7826.27 591.62 7.56 7234.652011-12 8029.00 636.00 7.92 7393.00
2012-13 8567.00 665.00 7.76 7902.00
2013-14 8709.00 658.00 7.56 8051.00
2014-15 9319.00 704.00 7.55 8615.00
2 Units Purchased by KEL (GWh) 2010-11 2011-12 2012-13 2013-14 2014-15
2.1 KANUPP 199.53 458.82 541.00 293.00 353.00
2.2 Gul Ahmed 745.01 451.52 432.00 582.00 718.00
2.3 Tapal Energy 793.16 481.46 684.00 798.00 807.00
2.4 NTDC 5449.00 5683.67 5463.00 5441.00 5427.00
2.5 PASMIC 63.61 8.06 4.00 9.00 21.00
2.6 Anoud Power 75.07 52.13 56.00 84.00 95.00
2.7 DHA Cogen. 0.00 0.00 0.00 0.00 0.00
2.8 ISL (19 MW) 98.71 87.98 72.00 67.00 67.00
2.9 IIL (4 MW) 5.19 6.07 5.00 8.00 8.00
2.10 Aggreko (Rental) 158.21 0.00 0.00 0.00 0.00
2.11 Engro Polymer 1.52 0.00 0.00 0.00 0.00
2.12 Al-Abbas (Coal) 43.13 0.00 0.00 0.00 0.002.13 Total 7632.14 7229.71 7257.00 7282.00 7496.00
3Total Units Purchased by KEL including Own Generation (GWh)
15458.41 15258.71 15824.00 15991.00 16815.00
4 Units Available for Distribution (GWh)
14866.79 14622.71 15159.00 15333.00 16111.00
5 Units Sold (GWh) 10071.27 10279.00 10942.00 11453.00 12294.00
6T&D Losses (excluding Auxiliary Consumption)
GWh 4795.52 4343.71 4217.00 3880.00 3817.00
% 32.26 29.71 27.82 25.30 23.69
7 Percentage (%) Ratio of Fuel Consumption in KEL Generation
2010-11 2011-12 2012-13 2013-14 2014-157.1 Gas 65.53 72.00 73.00* 75.00 73.00
7.2 Furnace Oil 34.47 28.00 27.00* 25.00 27.00* Based on SSGC Gas Bills
8 Average Fuel Price 2010-11 2011-12 2012-13 2013-14 2014-15
8.1 Gas (Rs./MCF) 393.76 471.98 525.00* 515.23* 488.23*
8.2 Furnace Oil (Rs./M. Ton.) 44200.00 56009.64 65509.00 65906.00 51391.00
8.3 LDO (Rs./Ltr.) 0.00 0.00 0.00 0.00 0.00
8.4 HSD (Rs./Ltr.) 0.00 0.00 0.00 0.00 0.00* This is based on GIDC of Rs.27/MMBTU, effective from October 8, 2012 as per the Order of Honourable High Court of Sindh.Source: K-Electric Limited

96
State of Industry Report 2015
TABLE 11Thermal Electricity Generation by Fuel (GWh)
2010-11 2011-12 2012-13 2013-14 2014-15
In PEPCO Area
Gas* 31,498 24,161 21,817 23,877 23,903
Percentage share to the total thermal generation in PEPCO
56.90 42.87 40.24 41.29 40.55
Percentage share to the total thermal generation in the Country
48.33 36.90 34.07 35.07 34.15
FO + HSD** 23,796 32,135 32,357 33,836 34,948
Percentage share to the total thermal generation in PEPCO
42.98 57.02 59.68 58.51 59.28
Percentage share to the total thermal generation in the Country
36.51 49.08 50.53 49.70 49.93
Coal 66 66 40 112 102
Percentage share to the total thermal generation in PEPCO
0.12 0.12 0.07 0.19 0.17
Percentage share to the total thermal generation in the Country
0.10 0.10 0.06 0.16 0.15
Sub-Total 55,360 56,362 54,214 57,825 58,953
Percentage share to the total thermal generation in the Country
84.95 86.08 84.66 84.93 84.23
In KEL Area
Gas* 5,578 6,001 6,373 6,892 7,293
Percentage share to the total thermal generation in KEL
56.87 65.83 64.90 67.19 66.09
Percentage share to the total thermal generation in the Country
8.56 9.16 9.95 10.12 10.42
5330.00 (34.99%)
4795.52(32.26%)
4343.71(29.71%)
4217.00(27.82%)
3880.00(25.30%)
Figure 10. T&D Losses of K-EL (GWh)(excluding Auxiliary Consumption)
2011-12 2012-13 2013-14 2014-152010-11
Continued.....

97
State of Industry Report 2015
2010-11 2011-12 2012-13 2013-14 2014-15
FO + HSD** 4,188 3,115 3,447 3,365 3,742
Percentage share to the total thermal generation in KEL
42.70 34.17 35.10 32.81 33.91
Percentage share to the total thermal generation in the Country
6.43 4.76 5.38 4.94 5.35
Coal 43 0 0 0 0
Percentage share to the total thermal generation in KEL
0.44 0.00 0.00 0.00 0.00
Percentage share to the total thermal generation in the Country
0.07 0.00 0.00 0.00 0.00
Sub-Total 9,809 9,116 9,820 10,257 11,035
Percentage share to the total thermal generation in the Country
15.05 13.92 15.34 15.07 15.77
In the Country
Gas 37,076 30,162 28,190 30,769 31,196
Percentage share to the total thermal generation in the Country
56.89 46.06 44.02 45.19 44.57
FO + HSD 27,984 35,250 35,804 37,201 38,690
Percentage share to the total thermal generation in the Country
42.94 53.83 55.91 54.64 55.28
Coal 109 66 40 112 102
Percentage share to the total thermal generation in the Country
0.17 0.10 0.06 0.16 0.15
Total 65,169 65,478 64,034 68,082 69,988 * Including generation of SPPs. ** Including generation of CPPs.Source: PSS/NTDC/KEL
TABLE 12Fuel Cost in GENCOs and K-Electric Limited
Fiscal Year ending 30th
June
Cost of Fuel (Rs. in million)
Electricity Generation (GWh)
Cost of Fuel (Paisa/kWh)
GENCOs KEL Own GENCOs KEL Own GENCOs KEL Own
2010-11 151,260 50,691 13,018 7,826 1,159.61 647.73
2011-12 144,251 58,436 12,652 8,029 1,060.00 727.81
2012-13 165,065 67,808 12,872 8,567 1,167.00 791.50
2013-14 193,334 64,336 13,016 8,709 1,283.38 738.73
2014-15 n.p. 59,950 13,300 9,319 1,025.69 643.31Source: PSS/NTDC/KEL

98
State of Industry Report 2015
TABLE 13Fuel Consumption and Cost of Electricity Generation in GENCOs
2010-11 2011-12 2012-13 2013-14 2014-15
GAS:
Generation on Gas (GWh) 7,184.00 7,857.00 7,410.60 5,099.22 n.p.
Quantity of Gas Used (000 MCF) 97,029.00 103,294.00 102,912.00 55,788.00 n.p.
Consumption/kWh (Cft) 13.51 13.17 13.89 10.94 n.p.
Cost/kWh (Paisa) 428.81 494.88 597.00 588.00 n.p.
FURNACE OIL (FO):
Generation on Furnace Oil (GWh) 6,802.45 5,639.00 6,676.30 8,971.30 n.p.
Quantity of Furnace Oil Used (000 M.Tons)
1,882.00 1,542.00 1,741.99 2,325.20 n.p.
Consumption/kWh (Kg) 0.28 0.27 0.26 0.26 n.p.
Cost/kWh (Paisa) 1367.49 1,854.17 1,806.00 1,814.00 n.p.
HIGH SPEED DIESEL (HSD):
Generation on HSD (GWh) 35.00 13.00 - - n.p.
Quantity of HSD Used (000 Ltrs.) 10,057.00 3,460.00 420.12 368.38 n.p.
Consumption/kWh (Ltr.) 0.29 0.32 - - n.p.
Cost/kWh (Paisa) 1,840.24 2,447.40 - - n.p.
COAL:
Generation on Coal (GWh) 66.00 66.00 40.00 112.00 n.p.
Quantity of Coal Used (000 M.Tons) 96.00 105.00 63.04 160.71 n.p.
Consumption/kWh (Kg) 1.09 1.09 1.04 1.03 n.p.
Cost/kWh (Paisa) 278.26 339.29 348.00 374.00 n.p.
Overall Fuel Cost and Cost of Fuel per kWh
Overall Fuel Cost used in GENCOs for Generation of Electricity (Rs. Million)
151,260.00 144,251.00 165,065.00 193,334.00 n.p.
Overall Cost of Fuel (Paisa/kWh) 1159.61 1,060.00 1,167.00 1,283.38 1,025.69Source: PSS/NTDC

99
State of Industry Report 2015
TABLE 14Fuel Consumption and Cost of Generation Data - GENCOs
Power Station YearGen. on Gas
(GWh)
Gas ConsumptionGen. on
FO (GWh)
FO Consumption Total Generation
(GWh)
Cost of Generation (Paisa/kWh)
Total (MMCFT)
Cft/kWh (Average)
(000 M.Ton)
(Kg/kWh)
TPS Jamshoro (GENCO-I)
2010-11 477.00 7,226 13.48 2,020.00 623 0.27 2,497.00 1,258.60
2011-12 67.32 881 11.16 1,377.82 466 0.29 1,445.14 1,839.00
2012-13 151.00 2,105 13.07 1,530.00 462 0.27 1,681.00 1,704.00
2013-14 2,951.00 623 12.09 46.00 852 0.26 2,997.00 1,980.76
2014-15 418.58 n.p. n.p. 2,236.62 n.p. n.p. 2,655.21 1363.79
GTPS Kotri (GENCO-I)
2010-11 452.00 5,530 11.72 0.00 - - 452.00 575.24
2011-12 270.00 3,228 11.37 0.00 - - 270.00 517.00
2012-13 190.00 6,483 13.06 0.00 - - 190.00 742.00
2013-14 169.98 2,144 11.98 0.00 - - 169.98 799.63
2014-15 306.11 n.p. n.p. 0.00 - - 306.11 662.35
TPS Guddu (GENCO-II)
2010-11 5,714.00 80,245 - 149.00 46 0.26 5,863.00 -
2011-12 7,093.00 96,602 - 165.00 49 0.28 7,258.00 -
2012-13 6,357.00 91,846 - 0.70 0 0.28 6,357.70 -
2013-14 4,357.48 47,747 - 0.00 0 0.00 4,357.48 638.44
2014-15 5,511.72 n.p. n.p. n.p. 0 0.00 5,511.72 565.80
TPS Quetta (Isolated
Generation) (GENCO-II)
2010-11 94.00 1,558 16.25 0.00 - - 94.00 646.23
2011-12 105.41 1,765 16.32 0.00 - - 105.41 773.00
2012-13 97.00 1,744 17.62 0.00 - - 97.00 918.00
2013-14 87.19 1,549 18.29 0.00 - - 87.19 930.86
2014-15 98.13 n.p. n.p. 0.00 - - 98.13 866.89
TPS Muzaffargarh (GENCO-III)
2010-11 16.00 381 20.44 3,613.00 1,124 0.27 3,629.00 1,417.98
2011-12 23.76 312 20.67 3,254.84 954 0.26 3,278.61 1,840.00
2012-13 5.50 326 53.84 4,471.50 1,279 0.26 4,477.00 1,811.00
2013-14 8.45 296 36.25 5,134.00 1474 0.26 5,142.45 1,898.83
2014-15 0.00 n.p. n.p. 4,306.15 n.p. n.p. 4,306.15 1,501.36
SPS Faisalabad (GENCO-III)
2010-11 144.00 30 0.00 0.00 0 0 144.00 1,595.48
2011-12 35.68 61 380.25 0.00 0 0 35.68 2,241.00
2012-13 30.00 0 0.00 0.00 0 0 30.00 0.00
2013-14 165.00 814 15.73 0.00 0 0 165.00 1,645.13
2014-15 7.21 n.p. n.p. 39.89 0 0 47.10 2,217.08
NGPS Multan (GENCO-III)
2010-11 0.00 12 0.00 51.00 23 0.37 51.00 2,267.63
2011-12 0.00 4 0.00 45.30 22 0.40 45.30 2,318.00
2012-13 0.00 0 0.00 0.00 0 0.00 0.00 0.00
2013-14 0.00 0 0.00 0.00 0 0.00 0.00 0.00
2014-15 0.00 0 0.00 0.00 0 0.00 0.00 1.00
Power Station YearGen. on FO
(GWh)
FO Consumption Gen. on HSD (GWh)
HSD Consumption Total Generation
(GWh)
Cost of Generation (Paisa/kWh)
(000 M.Ton)
(Kg/kWh)(000
M.Ton)(Kg/kWh)
GTPS Faisalabad (GENCO-III)
2010-11 188.00 2,046 12.87 34.00 9,728 - 222.00 847.15
2011-12 144.00 441 11.96 5.14 2,978 - 149.14 581.00
2012-13 0.00 408 11.51 0.00 0 - 0.00 622.00
2013-14 0.00 2,613 13.25 0.00 0 - 0.00 724.00
2014-15 29.88 n.p. n.p. 0.00 0 - 29.88 526.26
Nandipur (GENCO-III)
2014-15 n.p. n.p. n.p. 244.00 n.p. n.p. 244.00 n.p.
Continued.....

100
State of Industry Report 2015
FBC Lakhara (GENCO-IV)
YearGeneration on Coal
(GWh)Coal Consumption (000 metric tons)
Coal Consumption (kg/kWh)
Cost of Generation (Paisa/kWh)
2010-11 66.00 96 1.09 1,141.99
2011-12 66.00 105 1.09 312.00
2012-13 40.00 63 1.04 358.00
2013-14 112.00 161 1.03 422.86
2014-15 102.27 n.p. n.p. 465.98 Source: PSS/NTDC
TABLE 15Fuel Consumption and Cost of Generation Data - K-Electric Limited
Dual (Gas+Furnace Oil)
Power Station
YearGen. on
Gas (GWh)
Gas ConsumptionGen.
on FO (GWh)
FO ConsumptionTotal
Generation (GWh)
Cost of Generation
(Paisa/kWh)
Total MMCFT
CFT/kWh (Average)
Total (000 M. Tons)
(kg/kWh)
Bin Qasim TPS-I
2010-11 2,492 28,756 11.54 2,576 681.00 0.26 5,068 798
2011-12 2,577 29,279 11.36 2,127 560.00 0.26 4,704 934
2012-13 1,446 16,299 11.00 2,276 587.00 0.30 3,722 1,250
2013-14 1,865 19,624 10.50 1,900 497.00 0.26 3,765 1,249
2014-15 1,802 18,313 10.20 2,122 568.00 0.30 3,924 1,073
Korangi TPS
2010-11 271 3,533 13.06 0 0.00 0.00 271 498
2011-12 163 2,199 13.48 0 0.00 0.00 163 564
2012-13 0 0 0.00 0 0.00 0.00 0 0
2013-14 0 0 0.00 0 0.00 0.00 0 0
2014-15 0 0 0.00 0 0.00 0.00 0 0
Gas
Power Station
Year Gen. on Gas (GWh)Gas Consumption Cost of Generation
(Paisa/kWh)Total MMCFT CFT/kWh (Average)
BQTPS-II
2011-12 1,139 11,111 9.75 440
2012-13 3,567 31,740 9.00 434
2013-14 3,639 30,333 8.00 454
2014-15 3,907 30,775 7.90 417
Korangi Town GTPS-I
2010-11 1 12 19.92 700
2011-12 0 0 0.00 0
2012-13 0 0 0.00 0
2013-14 0 0 0.00 0
2014-15 0 0 0.00 0
Korangi Town GTPS-II
2010-11 675 7,112 10.53 0
2011-12 595 6,188 10.39 462
2012-13 327 3,452 11.00 505
2013-14 393 4,140 10.50 512
2014-15 435 4,321 9.90 476 Continued.....

101
State of Industry Report 2015
Gas
Power Station
Year Gen. on Gas (GWh)Gas Consumption Cost of Generation
(Paisa/kWh)Total MMCFT CFT/kWh (Average)
Site GTPS-I
2010-11 0 2 20.49 700
2011-12 0 0 0.00 0
2012-13 0 0 0.00 0
2013-14 0 0 0.00 0
2014-15 0 0 0.00 0
Site GTPS-II
2010-11 586 6,075 10.36 378
2011-12 416 4,311 10.41 440
2012-13 156 1,678 11.00 546
2013-14 113 1,216 10.80 541
2014-15 160 1,659 10.40 490
Korangi CCPP
2010-11 1,226 10,704 8.73 333
2011-12 1,011 8,678 8.59 393
2012-13 795 6,629 8.00 433
2013-14 799 6,961 8.70 487
2014-15 892 7453 8.40 451
Furnace Oil
Power Station
Year Gen. on FO (GWh)
FO ConsumptionCost of Generation
(Paisa/kWh)Total (000 M. Tons)
(kg/kWh)
Gul Ahmed
2010-11 745 n.p. n.p. 1,324
2011-12 452 n.p. n.p. 1,584
2012-13 432 n.p. n.p. 1,564
2013-14 582 n.p. n.p. 1,846
2014-15 718 n.p. n.p. 1,442
Tapal Energy
2010-11 793 172.92 n.p. 1,330
2011-12 481 n.p. n.p. 1,512
2012-13 684 n.p. n.p. 1,548
2013-14 798 n.p. n.p. 1,795
2014-15 807 n.p. n.p. 1435Source: KEL
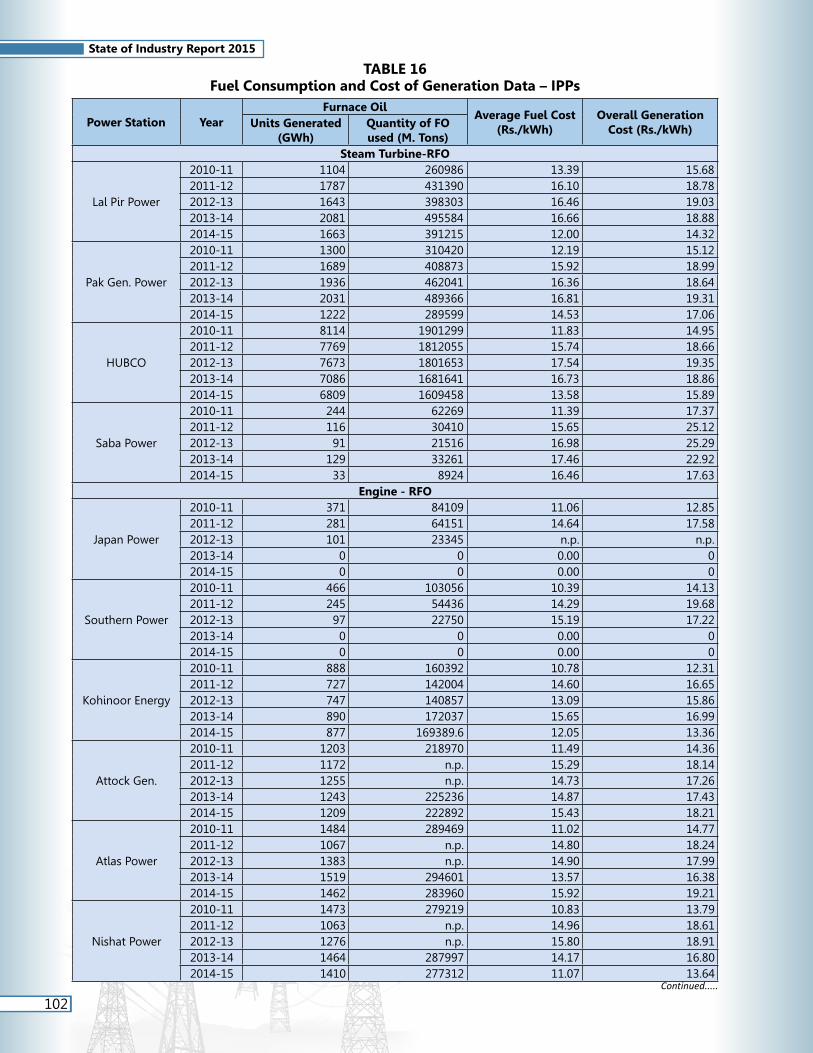
102
State of Industry Report 2015
TABLE 16Fuel Consumption and Cost of Generation Data – IPPs
Power Station YearFurnace Oil
Average Fuel Cost (Rs./kWh)
Overall Generation Cost (Rs./kWh)Units Generated
(GWh)Quantity of FO used (M. Tons)
Steam Turbine-RFO
Lal Pir Power
2010-11 1104 260986 13.39 15.682011-12 1787 431390 16.10 18.782012-13 1643 398303 16.46 19.032013-14 2081 495584 16.66 18.882014-15 1663 391215 12.00 14.32
Pak Gen. Power
2010-11 1300 310420 12.19 15.122011-12 1689 408873 15.92 18.992012-13 1936 462041 16.36 18.642013-14 2031 489366 16.81 19.312014-15 1222 289599 14.53 17.06
HUBCO
2010-11 8114 1901299 11.83 14.952011-12 7769 1812055 15.74 18.662012-13 7673 1801653 17.54 19.352013-14 7086 1681641 16.73 18.862014-15 6809 1609458 13.58 15.89
Saba Power
2010-11 244 62269 11.39 17.372011-12 116 30410 15.65 25.122012-13 91 21516 16.98 25.292013-14 129 33261 17.46 22.922014-15 33 8924 16.46 17.63
Engine - RFO
Japan Power
2010-11 371 84109 11.06 12.852011-12 281 64151 14.64 17.582012-13 101 23345 n.p. n.p.2013-14 0 0 0.00 02014-15 0 0 0.00 0
Southern Power
2010-11 466 103056 10.39 14.132011-12 245 54436 14.29 19.682012-13 97 22750 15.19 17.222013-14 0 0 0.00 02014-15 0 0 0.00 0
Kohinoor Energy
2010-11 888 160392 10.78 12.312011-12 727 142004 14.60 16.652012-13 747 140857 13.09 15.862013-14 890 172037 15.65 16.992014-15 877 169389.6 12.05 13.36
Attock Gen.
2010-11 1203 218970 11.49 14.362011-12 1172 n.p. 15.29 18.142012-13 1255 n.p. 14.73 17.262013-14 1243 225236 14.87 17.432014-15 1209 222892 15.43 18.21
Atlas Power
2010-11 1484 289469 11.02 14.772011-12 1067 n.p. 14.80 18.242012-13 1383 n.p. 14.90 17.992013-14 1519 294601 13.57 16.382014-15 1462 283960 15.92 19.21
Nishat Power
2010-11 1473 279219 10.83 13.792011-12 1063 n.p. 14.96 18.612012-13 1276 n.p. 15.80 18.912013-14 1464 287997 14.17 16.802014-15 1410 277312 11.07 13.64
Continued.....

103
State of Industry Report 2015
Power Station YearFurnace Oil
Average Fuel Cost (Rs./kWh)
Overall Generation Cost (Rs./kWh)Units Generated
(GWh)Quantity of FO used (M. Tons)
Nishat Chunian
2010-11 1452 256117 11.11 14.372011-12 1073 n.p. 15.02 18.952012-13 1283 n.p. 15.69 18.952013-14 1471 289439 14.12 16.812014-15 1415 278398 11.05 13.77
Liberty Power Tech.
2010-11 997 124767 11.44 13.102011-12 1068 n.p. 14.85 19.322012-13 1438 n.p. 15.07 18.022013-14 1520 298903 14.27 17.062014-15 1515 297916 15.42 18.57
HUBCO Narowal
2010-11 464 61935 11.89 13.322011-12 1321 n.p. 14.86 17.152012-13 820 n.p. 15.22 22.172013-14 1562 308585 14.28 18.332014-15 1418 278760 11.73 16.26
Power Station YearGas
Average Fuel Cost (Rs./kWh)
Overall Generation Cost (Rs./kWh)Units Generated
(GWh)Quantity of Gas used (MMBTU)
Gas Engines / Gas Turbine (CCPP)
Altern Energy
2010-11 179 1827204 3.06 5.542011-12 182 1829598 3.99 6.312012-13 194 1759674 5.58 7.482013-14 205 2021299 5.63 7.632014-15 173 1744940 5.37 7.38
Fauji Kabirwala
2010-11 1088 9161323 2.82 5.652011-12 1237 10458701 3.10 5.242012-13 1107 8735108 4.37 5.652013-14 1191 10203547 4.42 5.502014-15 991 8514108 4.62 6.02
Habibullah Coastal
2010-11 811 6692114 2.71 4.892011-12 685 5792294 3.61 6.292012-13 658 5686043 5.26 7.532013-14 670 5734357 4.65 7.402014-15 719 6187693 4.63 7.06
Rousch Power
2010-11 3039 24342820 2.78 4.982011-12 2733 21952366 3.56 6.062012-13 2535 20172645 4.91 5.192013-14 2760 20002297 4.63 5.892014-15 2465 19635093 4.49 7.22
TNB Liberty Power
2010-11 1333 10848976 7.55 10.292011-12 1484 12045461 10.13 13.342012-13 892 7269215 11.02 12.332013-14 943 7640542 17.40 22.522014-15 1218 10004282 12.39 14.66
Uch Power
2010-11 4221 32561224 2.22 5.072011-12 4278 33037265 2.27 5.042012-13 3796 28724603 3.07 5.652013-14 4314 30644390 3.01 5.632014-15 4127 31549804 2.93 5.08
Davis Energen.
2013-14 54 397509 7.14 11.172014-15 70 n.p. 5.20 8.09
Continued.....

104
State of Industry Report 2015
Power Station
Year
Gas FOHSD
Generation (GWh)
Total Generation
(GWh)
Average Fuel Cost (Rs./kWh)
Overall Generation Cost (Rs./
kWh)
Units Generated
(GWh)
Quantity of Gas used (MMBTU)
Units Generated
(GWh)
Quantity of FO used (M.Tons)
Dual Fuel
KAPCO
2010-11 446 4332015 5175 1056863 68 5689 10.08 15.21
2011-12 414 4228212 5629 1156728 22 6065 13.57 19.01
2012-13 170 1673453 5222 1064832 129 5521 12.44 19.83
2013-14 306 3116410 6027 1233299 146 6479 14.04 20.00
2014-15 845 8097993 5852 1179958 236 6933 13.37 16.39
Power Station Year
GasHSD
Generation (GWh)
Total Generation
(GWh)
Average Fuel Cost (Rs./kWh)
Overall Generation Cost (Rs./
kWh)
Units Generated
(GWh)
Quantity of Gas used (MMBTU)
Sapphire Electric
2010-11 705 5427189 137 842 4.00 6.49
2011-12 404 n.p. 467 871 12.12 16.62
2012-13 369 n.p. 509 877 14.20 18.07
2013-14 268 2051567 493 761 15.61 20.95
2014-15 282 2153880 685 967 14.60 19.24
Saif Power
2010-11 1056 7762893 116 1172 4.04 7.33
2011-12 398 n.p. 512 909 12.52 16.52
2012-13 386 n.p. 357 742 12.69 17.17
2013-14 265 2037078 458 723 15.47 21.56
2014-15 95 744873 675 771 16.01 21.83
Orient Power
2010-11 983 7311571 107 1090 3.90 6.22
2011-12 487 n.p. 195 682 9.82 14.28
2012-13 346 n.p. 228 573 11.40 16.32
2013-14 266 2065360 274 541 13.60 20.31
2014-15 311 2385081 726 1037 14.44 18.14
Engro Power Gen. Qadirpur
2010-11 1562 15134204 n.p. n.p. 3.09 4.60
2011-12 1742 n.p. 2 1744 4.04 5.84
2012-13 1692 n.p. 2 1693 4.79 6.72
2013-14 1441 11881740 0 1441 5.06 5.37
2014-15 1429 11993204 0 1429 5.06 5.37
Foundation Power
2010-11 403 1312680 n.p. n.p. 3.09 4.33
2011-12 1401 n.p. n.p. n.p. 3.71 6.05
2012-13 1380 n.p. n.p. n.p. 4.84 7.14
2013-14 1359 10563546 0 1359 4.91 7.25
2014-15 1305 10421325 18 1322 4.36 7.71
Halmore Power
2011-12 407 n.p. 162 570 8.45 11.48
2012-13 294 n.p. 79 374 8.23 18.42
2013-14 250 n.p. 254 504 6.10 13.66
2014-15 93 n.p. 620 713 9.43 13.98
Uch Power-II2013-14 752 n.p. 0 752 3.45 6.18
2014-15 2415 18014780 0 2415 1.08 1.94Source: PSS/WPPO (NTDC)

105
State of Industry Report 2015
TABLE 17Auxiliary Consumption and other Factors of Hydel Power Stations
Power Station
YearAuxiliary Consumption Maximum
Load (MW)Load Factor
(%)Capacity
Factor (%)Utilization Factor (%)(GWh) (%)
Tarbela
2010-11 97.44 --- 3594 50.70 103.34 52.39
2011-12 48.30 0.30 3702 43.38 106.44 46.17
2012-13 18.02 0.12 3674 45.95 105.64 48.54
2013-14 16.07 0.10 3605 47.93 103.65 49.68
2014-15 15.94 0.11 3605 46.89 103.65 48.61
Mangla
2010-11 118.86 --- 1150 60.26 115.00 69.30
2011-12 133.40 2.80 1120 48.78 112.00 54.64
2012-13 10.00 0.21 1115 48.25 111.50 53.80
2013-14 10.08 0.17 1115 59.95 111.50 66.84
2014-15 11.31 0.17 1115 66.51 111.50 73.86
Ghazi Barotha
2010-11 80.68 --- 1450 58.37 100.00 58.37
2011-12 98.56 1.40 1450 55.43 100.00 55.43
2012-13 8.67 0.12 1450 56.41 100.00 56.41
2013-14 9.61 0.11 1450 55.02 100.00 55.02
2014-15 7.75 0.12 1450 52.70 100.00 57.94
Warsak
2010-11 4.19 --- 215 55.09 88.49 48.75
2011-12 0.32 0.00 204 55.31 83.96 46.44
2012-13 1.50 0.14 203 58.09 83.55 48.53
2013-14 1.58 0.16 201 52.89 82.73 43.77
2014-15 1.63 0.17 185 60.17 76.14 45.82
Chashma
2010-11 -85.14 --- 184 56.66 100.00 56.66
2011-12 7.95 0.70 184 62.86 100.00 62.86
2012-13 5.97 0.53 184 69.62 100.00 69.62
2013-14 6.05 0.58 184 63.75 100.00 63.76
2014-15 5.64 0.01 184 61.22 100.00 61.22
Dargai
2010-11 0.32 --- 19 51.08 92.50 47.25
2011-12 0.37 0.40 17 56.69 85.00 48.18
2012-13 0.30 0.31 18 60.32 90.48 55.19
2013-14 0.30 0.33 18 56.65 68.50 50.98
2014-15 0.41 0.39 18 67.59 79.52 60.63
Rasul
2010-11 4.99 --- 19 60.51 86.36 52.26
2011-12 2.93 4.30 16 48.42 72.73 35.21
2012-13 0.51 1.03 9 59.47 43.18 25.68
2013-14 0.80 1.52 13 47.85 56.82 28.10
2014-15 2.80 4.18 14 67.27 63.64 36.36
Shadiwal
2010-11 2.60 --- 8 49.12 56.30 27.65
2011-12 0.91 2.80 7 82.55 52.59 41.58
2012-13 0.42 1.34 7 69.23 38.36 26.54
2013-14 0.39 1.27 6 55.59 39.81 25.94
2014-15 0.44 1.7 5 60.87 36.30 22.10Continued.....

106
State of Industry Report 2015
Power Station
YearAuxiliary Consumption Maximum
Load (MW)Load Factor
(%)Capacity
Factor (%)Utilization Factor (%)(GWh) (%)
Chichoki Malian
2010-11 0.90 --- 8 49.08 60.61 29.75
2011-12 2.25 6.50 8 49.06 60.61 29.74
2012-13 0.40 0.93 8 61.49 60.61 37.27
2013-14 0.40 1.09 9 46.31 58.25 31.58
2014-15 0.35 0.89 7 53.88 53.03 28.57
Nandipur
2010-11 0.88 --- 9 54.57 66.67 36.38
2011-12 0.90 2.20 9 55.00 66.67 50.12
2012-13 0.60 1.13 9 62.47 66.67 41.64
2013-14 0.50 1.18 9 52.03 66.67 34.69
2014-15 0.81 2.30 9 43.09 66.67 28.72
Kurram Garhi
2010-11 2.10 --- 4 34.29 100.00 34.29
2011-12 0.48 4.40 4 31.05 100.00 31.05
2012-13 0.43 3.01 4 40.78 100.00 40.78
2013-14 0.44 2.09 4 57.16 100.00 54.30
2014-15 0.54 2.70 4 56.25 100.00 56.25
Renala
2010-11 0.04 --- 1 40.69 72.73 29.59
2011-12 0.06 2.00 1 41.04 72.72 29.85
2012-13 0.03 0.95 1 63.75 46.61 32.83
2013-14 0.02 0.68 1 56.14 45.65 30.00
2014-15 0.04 1.60 1 54.83 43.79 25.67
Chitral
2010-11 0.02 --- 1 39.25 100.00 39.25
2011-12 0.02 0.40 1 38.33 103.80 39.79
2012-13 0.01 0.30 1 42.28 103.80 49.97
2013-14 0.01 0.30 1 42.02 103.20 41.90
2014-15 0.01 0.19 1 46.36 102.90 42.09
Khan Khwar
2011-12 3.34 1.90 68 30.38 30.38 28.69
2012-13 1.35 0.00 72 41.24 41.24 41.24
2013-14 1.24 1.80 72 41.24 41.40 41.24
2014-15 4.40 1.99 72 40.11 40.11 40.11
Jinnah
2012-13 1.99 0.99 60 38.63 24.02 24.02
2013-14 3.18 1.10 70 48.25 61.44 35.18
2014-15 2.91 1.50 45 47.95 47.29 22.67
Allai Khwar
2012-13 0.11 0.05 121 44.34 65.21 44.34
2013-14 0.84 0.18 121 44.45 90.95 44.45
2014-15 0.79 0.17 121 44.19 78.32 43.44
Gomal Zam
2013-14 0.02 0.38 17 16.99 17.80 17.00
2014-15 0.18 2.04 17 31.01 66.00 31.00
Jabban2013-14 0.58 0.77 22 38.37 100.00 38.37
2014-15 0.92 0.76 22 61.85 81.25 76.12
Duber Khwar
2013-14 0.19 0.07 130 65.55 59.71 64.77
2014-15 0.74 0.12 130 53.59 100.00 53.59Source: PSS/NTDC

107
State of Industry Report 2015
TABLE 18Auxiliary Consumption and other Factors of Public Sector Thermal Power Stations
Power Station YearAuxiliary
Consumption Maximum Load (MW)
Load Factor (%)
Capacity Factor (%)
Utilization Factor (%)
(GWh) (%)
TPS Jamshoro (GENCO-I)
2010-11 306.99 11.46 645 49.49 79.38 43.852011-12 211.21 12.75 510 36.98 60.00 27.002012-13 206.19 10.93 520 41.42 61.18 30.772013-14 345.71 10.47 722 52.07 84.94 53.702014-15 n.p. n.p. n.p. n.p. n.p. n.p.
GTPS Kotri (GENCO-I)
2010-11 19.69 4.17 135 39.89 77.59 37.392011-12 13.81 5.00 108 29.92 62.00 23.002012-13 28.81 5.80 114 49.70 65.52 40.472013-14 10.10 5.64 119 17.13 68.39 14.562014-15 n.p. n.p. n.p. n.p. n.p. n.p.
TPS Guddu (GENCO-II)
2010-11 n.p. n.p. n.p. n.p. n.p. n.p.2011-12 n.p. n.p. n.p. n.p. n.p. n.p.2012-13 n.p. n.p. n.p. n.p. n.p. n.p.2013-14 n.p. n.p. n.p. n.p. n.p. n.p.2014-15 n.p. n.p. n.p. n.p. n.p. n.p.
TPS Quetta (Isolated
Generation) (GENCO-II)
2010-11 0.00 n.p. 25 43.68 99.27 39.102011-12 2.40 2.00 25 49.00 71.00 49.002012-13 2.51 2.54 26 43.47 74.29 45.212013-14 2.26 2.67 25 38.57 71.43 38.572014-15 n.p. n.p. n.p. n.p. n.p. n.p.
TPS Muzaffargarh (GENCO-III)
2010-11 478.12 11.64 785 59.73 58.15 43.012011-12 402.62 10.94 865 48.45 64.07 37.932012-13 478.86 9.66 1115 50.74 82.59 50.062013-14 596.52 10.41 1157 56.37 85.70 57.722014-15 n.p. n.p. n.p. n.p. n.p. n.p.
SPS Faisalabad (GENCO-III)
2010-11 24.13 11.60 85 27.94 64.39 24.792011-12 19.71 12.06 72 25.83 54.54 19.372012-13 0.92 0.00 0 0.00 0.00 0.002013-14 7.89 15.25 70 8.42 53.03 5.892014-15 n.p. n.p. n.p. n.p. n.p. n.p.
GTPS Faisalabad (GENCO-III)
2010-11 0.01 n.p. 210 10.55 94.06 10.552011-12 7.03 14.69 92 5.92 37.70 2.592012-13 5.43 15.30 69 5.87 28.28 1.932013-14 16.54 8.39 192 11.70 78.69 10.692014-15 n.p. n.p. n.p. n.p. n.p. n.p.
NGPS Multan (GENCO-III)
2010-11 9.82 16.14 72 9.65 36.92 3.562011-12 9.37 16.84 64 9.90 49.00 11.002012-13 2.04 0.00 0 0.00 0.00 0.002013-14 1.34 0.00 0 0.00 0.00 0.002014-15 n.p. n.p. n.p. n.p. n.p. n.p.
Nandipur (GENCO-III) 2014-15 n.p. n.p. n.p. n.p. n.p. n.p.
FBC Lakhra (GENCO-IV)
2010-11 22.52 25.52 36 27.99 30.00 8.402011-12 30.46 32.00 32 34.14 64.00 36.002012-13 20.97 34.51 40 17.34 80.00 23.122013-14 30.46 19.44 34 52.45 68.00 59.452014-15 n.p. n.p. n.p. n.p. n.p. n.p.
Source: PSS/NTDC
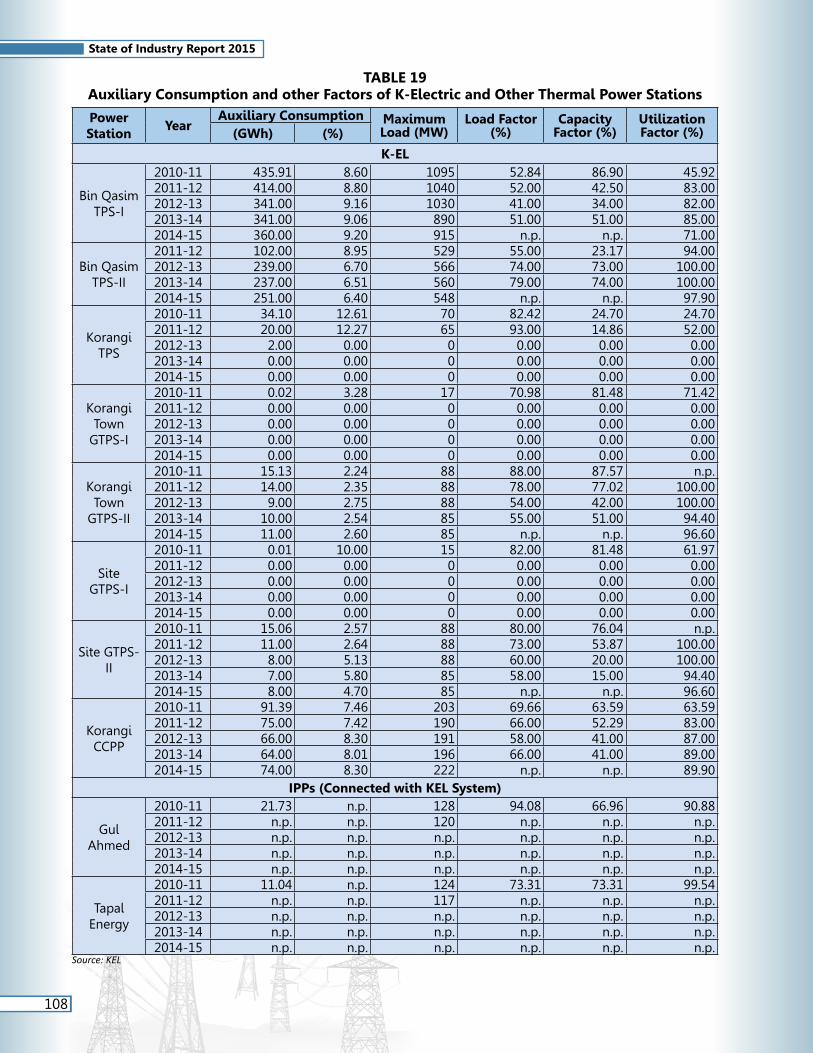
108
State of Industry Report 2015
TABLE 19Auxiliary Consumption and other Factors of K-Electric and Other Thermal Power Stations
Power Station
YearAuxiliary Consumption Maximum
Load (MW)Load Factor
(%)Capacity
Factor (%)Utilization Factor (%)(GWh) (%)
K-EL
Bin Qasim TPS-I
2010-11 435.91 8.60 1095 52.84 86.90 45.922011-12 414.00 8.80 1040 52.00 42.50 83.002012-13 341.00 9.16 1030 41.00 34.00 82.002013-14 341.00 9.06 890 51.00 51.00 85.002014-15 360.00 9.20 915 n.p. n.p. 71.00
Bin Qasim TPS-II
2011-12 102.00 8.95 529 55.00 23.17 94.002012-13 239.00 6.70 566 74.00 73.00 100.002013-14 237.00 6.51 560 79.00 74.00 100.002014-15 251.00 6.40 548 n.p. n.p. 97.90
Korangi TPS
2010-11 34.10 12.61 70 82.42 24.70 24.702011-12 20.00 12.27 65 93.00 14.86 52.002012-13 2.00 0.00 0 0.00 0.00 0.002013-14 0.00 0.00 0 0.00 0.00 0.002014-15 0.00 0.00 0 0.00 0.00 0.00
Korangi Town
GTPS-I
2010-11 0.02 3.28 17 70.98 81.48 71.422011-12 0.00 0.00 0 0.00 0.00 0.002012-13 0.00 0.00 0 0.00 0.00 0.002013-14 0.00 0.00 0 0.00 0.00 0.002014-15 0.00 0.00 0 0.00 0.00 0.00
Korangi Town
GTPS-II
2010-11 15.13 2.24 88 88.00 87.57 n.p.2011-12 14.00 2.35 88 78.00 77.02 100.002012-13 9.00 2.75 88 54.00 42.00 100.002013-14 10.00 2.54 85 55.00 51.00 94.402014-15 11.00 2.60 85 n.p. n.p. 96.60
Site GTPS-I
2010-11 0.01 10.00 15 82.00 81.48 61.972011-12 0.00 0.00 0 0.00 0.00 0.002012-13 0.00 0.00 0 0.00 0.00 0.002013-14 0.00 0.00 0 0.00 0.00 0.002014-15 0.00 0.00 0 0.00 0.00 0.00
Site GTPS-II
2010-11 15.06 2.57 88 80.00 76.04 n.p.2011-12 11.00 2.64 88 73.00 53.87 100.002012-13 8.00 5.13 88 60.00 20.00 100.002013-14 7.00 5.80 85 58.00 15.00 94.402014-15 8.00 4.70 85 n.p. n.p. 96.60
Korangi CCPP
2010-11 91.39 7.46 203 69.66 63.59 63.592011-12 75.00 7.42 190 66.00 52.29 83.002012-13 66.00 8.30 191 58.00 41.00 87.002013-14 64.00 8.01 196 66.00 41.00 89.002014-15 74.00 8.30 222 n.p. n.p. 89.90
IPPs (Connected with KEL System)
Gul Ahmed
2010-11 21.73 n.p. 128 94.08 66.96 90.882011-12 n.p. n.p. 120 n.p. n.p. n.p.2012-13 n.p. n.p. n.p. n.p. n.p. n.p.2013-14 n.p. n.p. n.p. n.p. n.p. n.p.2014-15 n.p. n.p. n.p. n.p. n.p. n.p.
Tapal Energy
2010-11 11.04 n.p. 124 73.31 73.31 99.542011-12 n.p. n.p. 117 n.p. n.p. n.p.2012-13 n.p. n.p. n.p. n.p. n.p. n.p.2013-14 n.p. n.p. n.p. n.p. n.p. n.p.2014-15 n.p. n.p. n.p. n.p. n.p. n.p.
Source: KEL
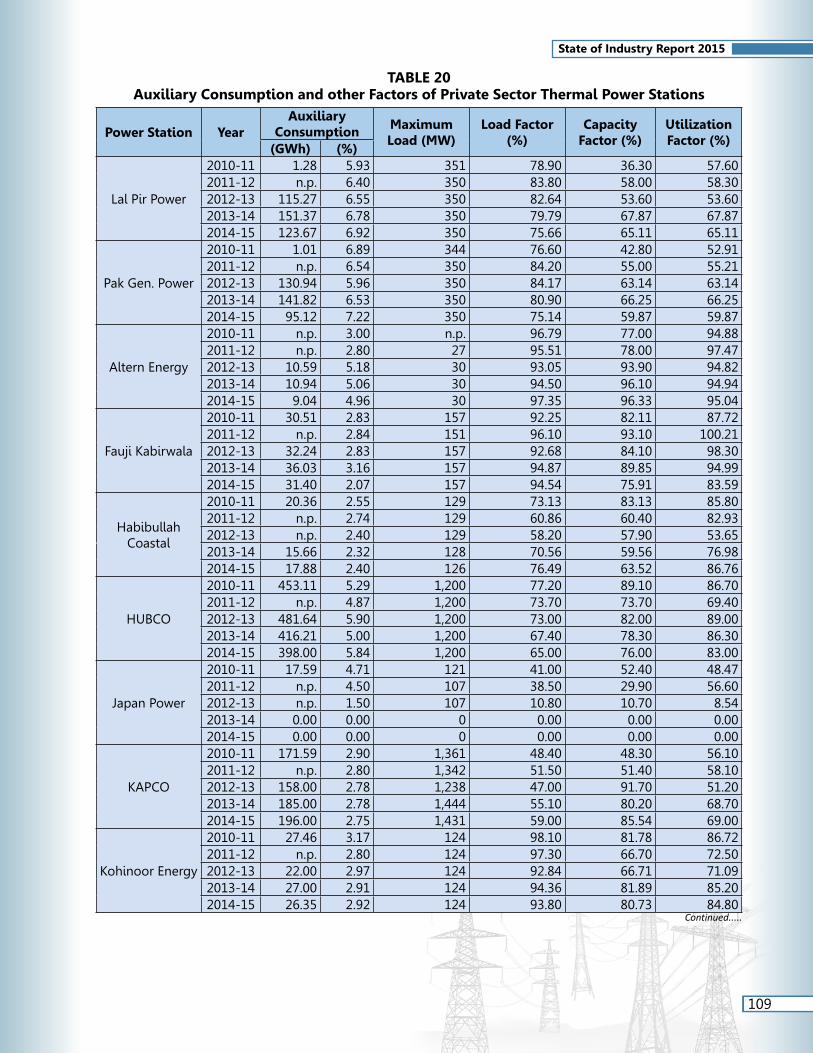
109
State of Industry Report 2015
TABLE 20Auxiliary Consumption and other Factors of Private Sector Thermal Power Stations
Power Station YearAuxiliary
Consumption Maximum Load (MW)
Load Factor (%)
Capacity Factor (%)
Utilization Factor (%)
(GWh) (%)
Lal Pir Power
2010-11 1.28 5.93 351 78.90 36.30 57.602011-12 n.p. 6.40 350 83.80 58.00 58.302012-13 115.27 6.55 350 82.64 53.60 53.602013-14 151.37 6.78 350 79.79 67.87 67.872014-15 123.67 6.92 350 75.66 65.11 65.11
Pak Gen. Power
2010-11 1.01 6.89 344 76.60 42.80 52.912011-12 n.p. 6.54 350 84.20 55.00 55.212012-13 130.94 5.96 350 84.17 63.14 63.142013-14 141.82 6.53 350 80.90 66.25 66.252014-15 95.12 7.22 350 75.14 59.87 59.87
Altern Energy
2010-11 n.p. 3.00 n.p. 96.79 77.00 94.882011-12 n.p. 2.80 27 95.51 78.00 97.472012-13 10.59 5.18 30 93.05 93.90 94.822013-14 10.94 5.06 30 94.50 96.10 94.942014-15 9.04 4.96 30 97.35 96.33 95.04
Fauji Kabirwala
2010-11 30.51 2.83 157 92.25 82.11 87.722011-12 n.p. 2.84 151 96.10 93.10 100.212012-13 32.24 2.83 157 92.68 84.10 98.302013-14 36.03 3.16 157 94.87 89.85 94.992014-15 31.40 2.07 157 94.54 75.91 83.59
Habibullah Coastal
2010-11 20.36 2.55 129 73.13 83.13 85.802011-12 n.p. 2.74 129 60.86 60.40 82.932012-13 n.p. 2.40 129 58.20 57.90 53.652013-14 15.66 2.32 128 70.56 59.56 76.982014-15 17.88 2.40 126 76.49 63.52 86.76
HUBCO
2010-11 453.11 5.29 1,200 77.20 89.10 86.702011-12 n.p. 4.87 1,200 73.70 73.70 69.402012-13 481.64 5.90 1,200 73.00 82.00 89.002013-14 416.21 5.00 1,200 67.40 78.30 86.302014-15 398.00 5.84 1,200 65.00 76.00 83.00
Japan Power
2010-11 17.59 4.71 121 41.00 52.40 48.472011-12 n.p. 4.50 107 38.50 29.90 56.602012-13 n.p. 1.50 107 10.80 10.70 8.542013-14 0.00 0.00 0 0.00 0.00 0.002014-15 0.00 0.00 0 0.00 0.00 0.00
KAPCO
2010-11 171.59 2.90 1,361 48.40 48.30 56.102011-12 n.p. 2.80 1,342 51.50 51.40 58.102012-13 158.00 2.78 1,238 47.00 91.70 51.202013-14 185.00 2.78 1,444 55.10 80.20 68.702014-15 196.00 2.75 1,431 59.00 85.54 69.00
Kohinoor Energy
2010-11 27.46 3.17 124 98.10 81.78 86.722011-12 n.p. 2.80 124 97.30 66.70 72.502012-13 22.00 2.97 124 92.84 66.71 71.092013-14 27.00 2.91 124 94.36 81.89 85.202014-15 26.35 2.92 124 93.80 80.73 84.80
Continued.....
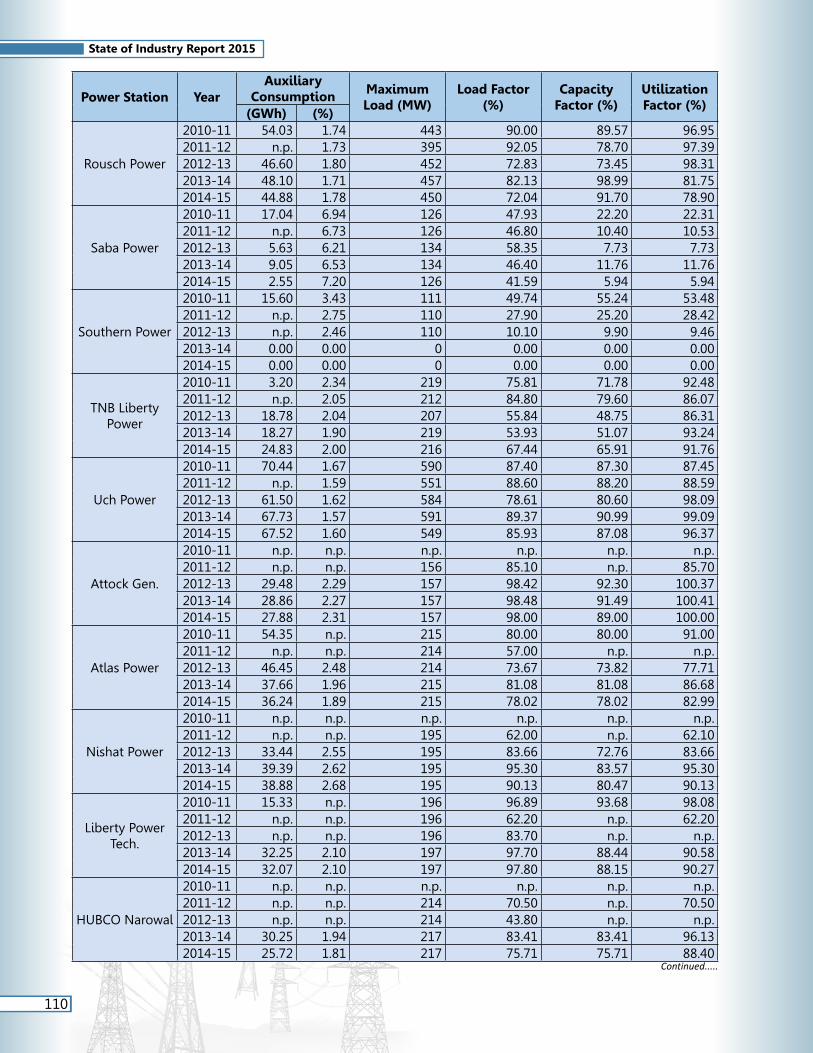
110
State of Industry Report 2015
Power Station YearAuxiliary
Consumption Maximum Load (MW)
Load Factor (%)
Capacity Factor (%)
Utilization Factor (%)
(GWh) (%)
Rousch Power
2010-11 54.03 1.74 443 90.00 89.57 96.952011-12 n.p. 1.73 395 92.05 78.70 97.392012-13 46.60 1.80 452 72.83 73.45 98.312013-14 48.10 1.71 457 82.13 98.99 81.752014-15 44.88 1.78 450 72.04 91.70 78.90
Saba Power
2010-11 17.04 6.94 126 47.93 22.20 22.312011-12 n.p. 6.73 126 46.80 10.40 10.532012-13 5.63 6.21 134 58.35 7.73 7.732013-14 9.05 6.53 134 46.40 11.76 11.762014-15 2.55 7.20 126 41.59 5.94 5.94
Southern Power
2010-11 15.60 3.43 111 49.74 55.24 53.482011-12 n.p. 2.75 110 27.90 25.20 28.422012-13 n.p. 2.46 110 10.10 9.90 9.462013-14 0.00 0.00 0 0.00 0.00 0.002014-15 0.00 0.00 0 0.00 0.00 0.00
TNB Liberty Power
2010-11 3.20 2.34 219 75.81 71.78 92.482011-12 n.p. 2.05 212 84.80 79.60 86.072012-13 18.78 2.04 207 55.84 48.75 86.312013-14 18.27 1.90 219 53.93 51.07 93.242014-15 24.83 2.00 216 67.44 65.91 91.76
Uch Power
2010-11 70.44 1.67 590 87.40 87.30 87.452011-12 n.p. 1.59 551 88.60 88.20 88.592012-13 61.50 1.62 584 78.61 80.60 98.092013-14 67.73 1.57 591 89.37 90.99 99.092014-15 67.52 1.60 549 85.93 87.08 96.37
Attock Gen.
2010-11 n.p. n.p. n.p. n.p. n.p. n.p.2011-12 n.p. n.p. 156 85.10 n.p. 85.702012-13 29.48 2.29 157 98.42 92.30 100.372013-14 28.86 2.27 157 98.48 91.49 100.412014-15 27.88 2.31 157 98.00 89.00 100.00
Atlas Power
2010-11 54.35 n.p. 215 80.00 80.00 91.002011-12 n.p. n.p. 214 57.00 n.p. n.p.2012-13 46.45 2.48 214 73.67 73.82 77.712013-14 37.66 1.96 215 81.08 81.08 86.682014-15 36.24 1.89 215 78.02 78.02 82.99
Nishat Power
2010-11 n.p. n.p. n.p. n.p. n.p. n.p.2011-12 n.p. n.p. 195 62.00 n.p. 62.102012-13 33.44 2.55 195 83.66 72.76 83.662013-14 39.39 2.62 195 95.30 83.57 95.302014-15 38.88 2.68 195 90.13 80.47 90.13
Liberty Power Tech.
2010-11 15.33 n.p. 196 96.89 93.68 98.082011-12 n.p. n.p. 196 62.20 n.p. 62.202012-13 n.p. n.p. 196 83.70 n.p. n.p.2013-14 32.25 2.10 197 97.70 88.44 90.582014-15 32.07 2.10 197 97.80 88.15 90.27
HUBCO Narowal
2010-11 n.p. n.p. n.p. n.p. n.p. n.p.2011-12 n.p. n.p. 214 70.50 n.p. 70.502012-13 n.p. n.p. 214 43.80 n.p. n.p.2013-14 30.25 1.94 217 83.41 83.41 96.132014-15 25.72 1.81 217 75.71 75.71 88.40
Continued.....

111
State of Industry Report 2015
Power Station YearAuxiliary
Consumption Maximum Load (MW)
Load Factor (%)
Capacity Factor (%)
Utilization Factor (%)
(GWh) (%)
Nishat Chunian
2010-11 26.54 n.p. 196 97.00 86.00 93.002011-12 n.p. n.p. 196 62.60 n.p. 62.602012-13 n.p. n.p. 196 74.80 n.p. n.p.2013-14 27.50 2.37 196 95.66 85.80 88.702014-15 27.40 2.36 196 93.05 81.33 85.02
Sapphire Electric Power
2010-11 n.p. n.p. n.p. n.p. n.p. n.p.2011-12 n.p. n.p. 212 47.00 n.p. 48.102012-13 n.p. n.p. 212 47.20 n.p. n.p.2013-14 23.68 2.93 225 45.61 40.87 45.732014-15 29.83 2.91 222 54.36 51.88 54.50
Engro Power Gen. Qadirpur
2010-11 43.81 n.p. n.p. 86.60 93.50 92.602011-12 n.p. n.p. 214 92.40 n.p. 93.102012-13 45.50 2.69 214 89.00 90.13 99.802013-14 39.50 2.75 217 84.56 101.00 84.002014-15 41.00 2.80 217 84.00 91.00 91.00
Saif Power
2010-11 n.p. n.p. n.p. n.p. n.p. n.p.2011-12 n.p. n.p. 205 47.50 n.p. 50.702012-13 n.p. n.p. 205 40.60 n.p. n.p.2013-14 23.61 3.16 216 43.20 38.95 41.312014-15 24.15 3.04 220 47.52 41.86 43.03
Orient Power
2010-11 25.87 n.p. 224 59.00 62.00 98.002011-12 n.p. n.p. 213 36.60 n.p. 36.602012-13 n.p. n.p. 213 30.80 n.p. n.p.2013-14 18.36 3.40 219 33.93 31.38 31.382014-15 29.17 2.81 218 65.45 60.54 60.54
Foundation Power
2010-11 n.p. n.p. n.p. n.p. n.p. n.p.2011-12 n.p. n.p. 172 90.00 n.p. n.p.2012-13 49.98 3.61 193 100.10 92.90 n.p.2013-14 49.55 3.64 200 97.68 92.57 90.122014-15 48.75 3.69 197 96.31 89.97 87.59
Uch Power-II
2013-14 n.p. n.p. n.p. n.p. n.p. n.p.2014-15 59.16 2.38 381 72.56 73.89 79.30
Davis Energen.
2013-14 n.p. n.p. n.p. n.p. n.p. n.p.2014-15 n.p. n.p. n.p. n.p. n.p. n.p.
Source: PSS/NTDC

112
State of Industry Report 2015
TABLE 21Main Electricity Statistics of the Country
2010-11 2011-12 2012-13 2013-14 2014-15
1: Maximum Energy Demand (MW)
PEPCO Area 20,559 21,997 22,883 23,425 23,381
KEL Area 2,591 2,596 2,778 2,929 3,056 Un-diversifiedEnergyDemandof the Country 21,086 21,536 21,605 23,505 n.p.
DiversifiedEnergyDemandofthe Country 20,673 21,114 21,181 23,044 n.p.
2: Consumers (Nos.)
PEPC
O A
rea
Domestic 17,321,552 17,977,777 18,712,912 19,322,664 20,147,827
Commercial 2,421,224 2,482,677 2,550,812 2,635,089 2,723,707
Industrial 273,067 286,393 296,849 305,294 315,116
Agricultural 280,603 286,287 301,115 310,578 318,081
Public Lighting 8,386 8,696 8,927 9,158 9,348
Bulk Supply + Others 4,650 4,778 4,985 5,087 5,168
Total in PEPCO Area 20,309,482 21,046,608 21,875,600 22,587,870 23,519,247
KEL
Are
a
Domestic 1,632,604 1,659,766 1,660,768 1,650,034 1,695,782
Commercial 452,667 456,537 452,329 438,150 439,130
Industrial 20,595 20,537 20,462 20,464 20,613
Agricultural 2,233 2,536 2,616 2,410 77
Public Lighting 57 67 66 74 198
Bulk Supply + Others 1,464 423 367 202 2
Total in KEL Area 2,109,620 2,139,866 2,136,608 2,111,334 2,155,802
Total in the Country 22,419,102 23,186,474 24,012,208 24,699,204 25,675,049
3: Auxiliary Consumption and System Losses (in percentage)
PEPCO Area
Auxiliary Consumption 3.11 2.95 n.p. 2.70 2.70
Transmission Losses 3.03 2.82 3.05 2.82 2.63
Distribution Losses 18.37 18.17 17.60 19.80 19.90
KEL AreaAuxiliary Consumption (KEL Own) 7.56 7.92 7.76 7.56 7.55
T&D Losses (excluding Auxiliary Consumption) 32.26 29.71 27.82 25.30 23.69
4: Average Sales Price (Rs./kWh)
PEPCO Area 6.25 8.03 8.94 10.35 9.32
KEL Area 8.29 9.01 11.02 12.15 12.08 5: Per Capita Electricity Consumption PEPCO systemPopulation (Million) 162.59 165.70 168.82 172.12 n.p.
Energy Sale (GWh) 71,661.57 71,155.56 70,447.04 76,493.93 78,070.12 Per capita electricity consumption (kWh) 441 431 418 445 n.p.
Continued.....

113
State of Industry Report 2015
2010-11 2011-12 2012-13 2013-14 2014-15Average Sale/ Consumer (kWh) 3,260.18 3,110.80 2,970.62 3,145.62 3,088.67
KEL system
Population (Million) 13.84 14.34 15.11 16.06 n.p.
Energy Sale (GWh) 10,098.00 10,280.00 10,942.00 11,454.00 12,293.00
Per capita electricity consumption (kWh) 570 586 547 487 523
Average Sale/ Consumer (kWh)
4,774.31 4,804.03 5,121.20 5,425.00 5,695.71
Source: PSS/NTDC/DISCOs/KEL
TABLE 22Category-wise Energy Sales in PEPCO and K-Electric System (GWh)
2010-11 2011-12 2012-13 2013-14 2014-15
PEPCO System
Domestic 30,972 30,203 30,321 33,322 34,566
Percentage share 43.22 42.45 43.04 43.56 44.28
Commercial 4,682 4,562 4,434 4,793 4,853
Percentage share 6.53 6.41 6.29 6.27 6.22
Industrial 17,699 18,399 18,641 20,551 21,085
Percentage share 24.70 25.86 26.46 26.87 27.01
Agricultural 8,847 8,410 7,550 8,129 7,866
Percentage share 12.35 11.82 10.72 10.63 10.08
Public Lighting 353 363 387 390 393
Percentage share 0.49 0.51 0.55 0.51 0.50
Bulk Supply 2,581 2,598 3,623 3,837 3,846
Percentage share 3.60 3.65 5.14 5.02 4.93
Others + Traction 1,078 936 27 31 33
Percentage share 1.50 1.32 0.04 0.04 0.04
Supplied to KEL 5,449 5,684 5,463 5,441 5,427
Percentage share 7.60 7.99 7.75 7.11 6.95
Total in PEPCO area 71,662 71,156 70,447 76,494 78,070
KEL System
Domestic 4,257 4,564 5,083 5,489 6,161
Percentage share 42.16 44.40 46.45 47.92 50.12
Commercial 1,043 1,128 1,507 1,507 1,589
Percentage share 10.33 10.97 13.77 13.16 12.93
Industrial 3,447 3,342 3,445 3,568 3,648
Percentage share 34.14 32.51 31.48 31.15 29.68Continued.....

114
State of Industry Report 2015
2010-11 2011-12 2012-13 2013-14 2014-15
Agricultural 125 134 149 160 166
Percentage share 1.24 1.30 1.36 1.40 1.35
Public Lighting 82 118 111 106 110
Percentage share 0.81 1.15 1.01 0.93 0.89
Bulk Supply + Others 1,118 994 647 624 619
Percentage share 11.07 9.67 5.91 5.45 5.04
Supplied to NTDC 26 0 0 0 0
Percentage share 0.26 0.00 0.00 0.00 0.00
Total in KEL area 10,098 10,280 10,942 11,454 12,293
Country
Domestic 35,229 34,767 35,404 38,811 40,727
Percentage share 46.18 45.90 46.63 47.04 47.95
Commercial 5,725 5,690 5,941 6,300 6,442
Percentage share 7.50 7.51 7.82 7.64 7.59
Industrial 21,146 21,741 22,086 24,119 24,733
Percentage share 27.72 28.70 29.09 29.23 29.12
Agricultural 8,972 8,544 7,699 8,289 8,032
Percentage share 11.76 11.28 10.14 10.05 9.46
Public Lighting 435 481 498 496 503
Percentage share 0.57 0.63 0.66 0.60 0.59
Bulk Supply + Others 4,778 4,528 4,297 4,492 4,498
Percentage share 6.26 5.98 5.66 5.44 5.30
Total in the Country* 76,285 75,752 75,926 82,507 84,936* excluding supplied to KEL and supplied to NTDCSource: PSS/NTDC/DISCOs/KEL
TABLE 23Category-wise Consumers and their Electricity Consumption (%)
2010-11 2011-12 2012-13 2013-14 2014-15
PEPCO Area (Consumers and Consumption in percentage to the total)
DomesticConsumers 85.29 85.42 85.54 85.54 85.67
Consumption 43.22 42.45 43.04 43.56 44.28
CommercialConsumers 11.92 11.80 11.66 11.67 11.58
Consumption 6.53 6.41 6.29 6.27 6.22
IndustrialConsumers 1.34 1.36 1.36 1.35 1.34
Consumption 24.70 25.86 26.46 26.87 27.01
AgriculturalConsumers 1.38 1.36 1.38 1.37 1.35
Consumption 12.35 11.82 10.72 10.63 10.08
Public LightingConsumers 0.04 0.04 0.04 0.04 0.04
Consumption 0.49 0.51 0.55 0.51 0.50Continued.....

115
State of Industry Report 2015
2010-11 2011-12 2012-13 2013-14 2014-15
Bulk Supply + Traction + Others
Consumers 0.02 0.02 0.02 0.02 0.02
Consumption 5.11 4.97 5.18 5.06 4.97
Supplied to KEL Consumption 7.60 7.99 7.75 7.11 6.95
KEL Area (Consumers and Consumption in percentage to the total)
DomesticConsumers 77.39 77.56 77.73 78.15 78.66
Consumption 42.16 44.40 46.45 47.92 50.12
CommercialConsumers 21.46 21.33 21.17 20.75 20.37
Consumption 10.33 10.97 13.77 13.16 12.93
IndustrialConsumers 0.98 0.96 0.96 0.97 0.96
Consumption 34.14 32.51 31.48 31.15 29.68
AgriculturalConsumers 0.11 0.12 0.12 0.11 0.00
Consumption 1.24 1.30 1.36 1.40 1.35
Public LightingConsumers 0.00 0.00 0.00 0.00 0.01
Consumption 0.81 1.15 1.01 0.93 0.89
Bulk Supply + OthersConsumers 0.07 0.02 0.02 0.01 0.00
Consumption 11.07 9.67 5.91 5.45 5.04
Supplied to NTDC Consumption 0.26 0.00 0.00 0.00 0.00
Country (Consumers and Consumption in percentage to the total)
DomesticConsumers 84.54 84.69 84.85 84.91 85.08
Consumption 46.18 45.90 46.63 47.04 47.95
CommercialConsumers 12.82 12.68 12.51 12.44 12.32
Consumption 7.50 7.51 7.82 7.64 7.59
IndustrialConsumers 1.31 1.32 1.32 1.32 1.31
Consumption 27.72 28.70 29.09 29.23 29.12
AgriculturalConsumers 1.26 1.25 1.26 1.27 1.24
Consumption 11.76 11.28 10.14 10.05 9.46
Public LightingConsumers 0.04 0.04 0.04 0.04 0.04
Consumption 0.57 0.63 0.66 0.60 0.59
Bulk Supply + OthersConsumers 0.03 0.02 0.02 0.02 0.02
Consumption 4.85 4.74 5.62 5.41 5.26
TractionConsumers 0.00 0.00 0.00 0.00 0.00
Consumption 1.41 1.24 0.04 0.04 0.04Source: PSS/NTDC/DISCOs/KEL
10.2 Load Pattern and Peak Load HoursThe electrical load pattern in the country varies from season to season; during summer season there is an increase in the inductive load while in winter season increase in resistive load has been observed. The peak hour timinginthesystemisnormallyfrom6PMto10PM.Thehourlyloadfiguresforatypicalworkingandnon-working day in summer and winter, during 2014, are given hereunder.

116
State of Industry Report 2015
TABLE 24Hourly System Demand (MW)
Hours of the day
Maximum Demand (MW) (January, 2014 - December,
2014)
System Demand for a Typical day in Summer
(January, 2014 - December, 2014)
System Demand for a Typical Day in Winter
(January, 2014 - December, 2014)
Summer (23-07-2014)
Winter (03-01-2014)
Working day (23-07-2014)
Non-working day (20-07-2014)
Working day (03-01-2014)
Non-working day (05-01-2014)
1 19,167 11,205 19,167 18,016 11,205 10,449 2 19,090 10,903 19,090 17,674 10,903 10,158 3 19,514 10,611 19,514 18,298 10,611 10,126 4 19,922 10,791 19,922 18,269 10,791 10,123 5 18,640 11,041 18,640 17,445 11,041 10,090 6 18,756 11,432 18,756 16,848 11,432 10,970 7 18,657 12,374 18,657 17,025 12,374 11,271 8 19,035 12,620 19,035 17,380 12,620 11,324 9 19,249 12,613 19,249 17,751 12,613 11,507 10 19,448 12,804 19,448 17,905 12,804 11,591 11 19,718 13,139 19,718 18,022 13,139 12,127 12 19,775 13,226 19,775 18,420 13,226 12,215 13 19,701 13,080 19,701 18,544 13,080 11,865 14 20,899 12,684 20,899 18,812 12,684 12,035 15 20,376 12,577 20,376 18,642 12,577 11,548 16 19,722 12,555 19,722 18,721 12,555 11,363 17 19,772 12,410 19,772 18,421 12,410 11,956 18 19,518 13,711 19,518 18,451 13,711 13,580 19 19,161 13,577 19,161 18,470 13,577 13,575 20 20,929 13,566 20,929 19,688 13,566 13,222 21 20,720 13,058 20,720 20,268 13,058 12,210 22 20,391 12,320 20,391 20,466 12,320 11,720 23 20,218 11,577 20,218 19,707 11,577 11,022 24 19,103 10,977 19,103 18,798 10,977 10,698
* Highlighted area indictes maximum demand.Source: National Power Control Centre, Islamabad

117
State of Industry Report 2015
10.3 Maximum DemandThe maximum demand in PEPCO and K-Electric systems for the years 2010-11 to 2014-15 and the year-wise percentage change in maximum demand is given in the following table.
TABLE 25Maximum Electricity Demand in the Country (MW)
Financial Year ending 30th June 2010-11 2011-12 2012-13 2013-14 2014-15
PEPCO Area 20,559 21,997 22,883 23,425 23,381
% change in Maximum Demand 6.59 6.99 4.03 2.37 -0.19
KEL Area 2,591 2,596 2,778 2,929 3,056
% change in Maximum Demand 1.13 0.19 7.01 5.44 4.34
Un-diversified Energy Demand of the Country 21,086 21,536 21,605 23,505 n.p.
% change in Maximum Demand 0.96 2.13 0.32 8.79 -
Diversified Energy Demand of the Country 20,673 21,114 21,181 23,044 n.p.
% change in Maximum Demand 0.96 2.13 0.32 8.80 -Source: PSS/NTDC/KEL
-
3,000
6,000
9,000
12,000
15,000
18,000
21,000
24,000
1 2 3 4 5 6 7 8 9 10 11 12 13 14 15 16 17 18 19 20 21 22 23 24
HOURS OF THE DAY
Figure 24B. System Demand for a Typical Dayin Summer and Winter (MW)
Working day(23-07-2014)
Non-working day(20-07-2014)
Working day(03-01-2014)
Non-working day(05-01-2014)

118
State of Industry Report 2015
10.4 Pattern of Electricity ConsumptionThe overall electricity consumption in the country since 2000 was growing steadily. However, during 2014-15 electricity consumption in the country excluding K-Electric area increased by 2.06%. The sector-wise electricity consumption and their share in total electricity consumption of the country, for the years 2010-11 to 2014-15 are given in the following table.
TABLE 26Annual Growth Rate of Electricity Consumption
2010-11 2011-12 2012-13 2013-14 2014-15
A: PEPCO area
DomesticGWh 30,972 30,203 30,321 33,322 34,566
% 5.12 -2.48 0.39 9.90 3.73
CommercialGWh 4,682 4,562 4,434 4,793 4,853
% 4.83 -2.56 -2.82 8.09 1.27
IndustrialGWh 17,699 18,399 18,641 20,551 21,085
% 7.96 3.96 1.32 10.24 2.60
AgriculturalGWh 8,847 8,410 7,550 8,129 7,866
% -7.68 -4.94 -10.22 7.67 -3.24
Public LightingGWh 353 363 387 390 393
% -5.14 2.84 6.67 0.73 0.87
Bulk SupplyGWh 2,581 2,598 3,623 3,837 3,846
% -22.92 0.65 39.43 5.90 0.24
Others + Traction
GWh 1,078 936 27 31 33
% 3494.17 -13.18 -97.10 15.52 5.16
Supplied to KELGWh 5,449 5,684 5,463 5,441 5,427
% 4.63 4.31 -3.88 -0.40 -0.26
Total GWh 71,662 71,156 70,447 76,494 78,070
Percentage change % 4.06 -0.71 -1.00 8.58 2.06
20,559 21,997
22,883 23,425 23,381
2,591 2,596 2,778 2,929 3,056
-
2,500
5,000
7,500
10,000
12,500
15,000
17,500
20,000
22,500
25,000
2010-11 2011-12 2012-13 2013-14 2014-15
Figure 25. Maximum Electricity Demand in the Country (MW)
PEPCO Area KEL Area
Continued.....
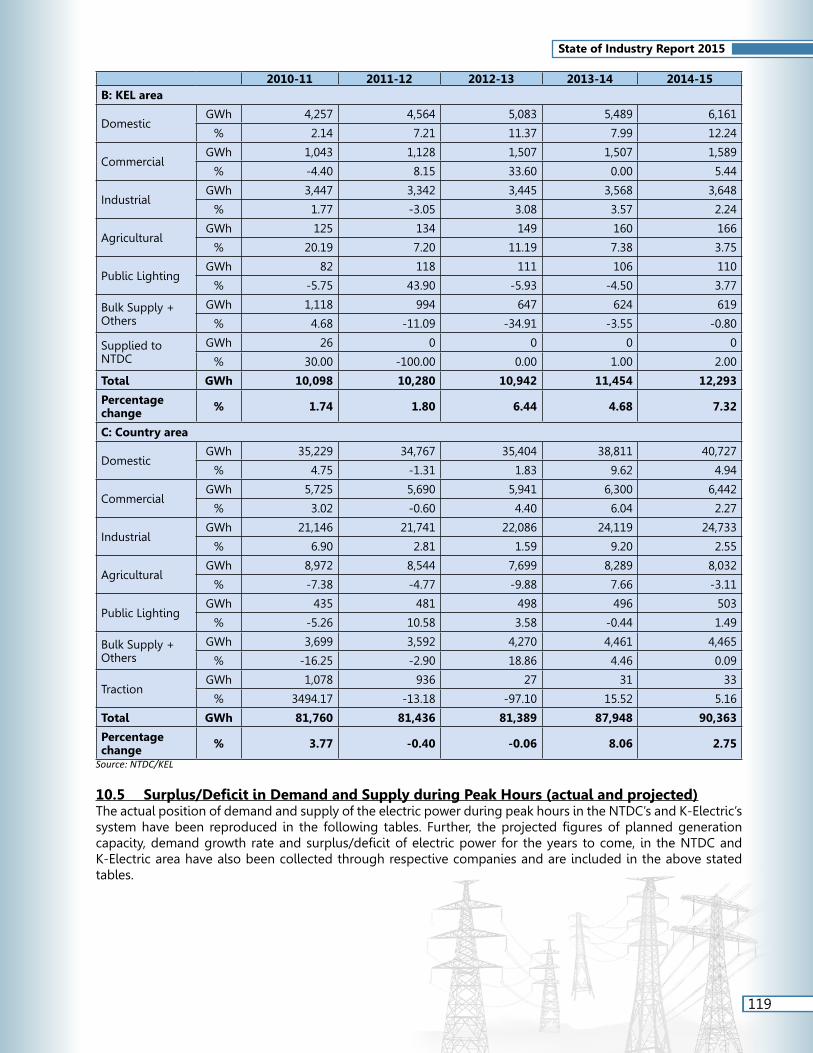
119
State of Industry Report 2015
2010-11 2011-12 2012-13 2013-14 2014-15B: KEL area
DomesticGWh 4,257 4,564 5,083 5,489 6,161
% 2.14 7.21 11.37 7.99 12.24
CommercialGWh 1,043 1,128 1,507 1,507 1,589
% -4.40 8.15 33.60 0.00 5.44
IndustrialGWh 3,447 3,342 3,445 3,568 3,648
% 1.77 -3.05 3.08 3.57 2.24
AgriculturalGWh 125 134 149 160 166
% 20.19 7.20 11.19 7.38 3.75
Public LightingGWh 82 118 111 106 110
% -5.75 43.90 -5.93 -4.50 3.77
Bulk Supply + Others
GWh 1,118 994 647 624 619
% 4.68 -11.09 -34.91 -3.55 -0.80
Supplied to NTDC
GWh 26 0 0 0 0
% 30.00 -100.00 0.00 1.00 2.00
Total GWh 10,098 10,280 10,942 11,454 12,293
Percentage change % 1.74 1.80 6.44 4.68 7.32
C: Country area
DomesticGWh 35,229 34,767 35,404 38,811 40,727
% 4.75 -1.31 1.83 9.62 4.94
CommercialGWh 5,725 5,690 5,941 6,300 6,442
% 3.02 -0.60 4.40 6.04 2.27
IndustrialGWh 21,146 21,741 22,086 24,119 24,733
% 6.90 2.81 1.59 9.20 2.55
AgriculturalGWh 8,972 8,544 7,699 8,289 8,032
% -7.38 -4.77 -9.88 7.66 -3.11
Public LightingGWh 435 481 498 496 503
% -5.26 10.58 3.58 -0.44 1.49
Bulk Supply + Others
GWh 3,699 3,592 4,270 4,461 4,465
% -16.25 -2.90 18.86 4.46 0.09
TractionGWh 1,078 936 27 31 33
% 3494.17 -13.18 -97.10 15.52 5.16
Total GWh 81,760 81,436 81,389 87,948 90,363
Percentage change % 3.77 -0.40 -0.06 8.06 2.75
Source: NTDC/KEL
10.5 Surplus/Deficit in Demand and Supply during Peak Hours (actual and projected)The actual position of demand and supply of the electric power during peak hours in the NTDC’s and K-Electric’s systemhavebeen reproduced in the following tables. Further, theprojectedfiguresofplannedgenerationcapacity,demandgrowthrateandsurplus/deficitofelectricpower for theyears tocome, in theNTDCandK-Electric area have also been collected through respective companies and are included in the above stated tables.

120
State of Industry Report 2015
TABLE 27Surplus/Deficit in Demand and Supply during NTDC’s System Peak Hours
A: Actual Figures
Financial Year ending 30th June
Generation Capability (MW)
Demand During NTDC’s System Peak
Hours (MW)
Surplus/ (Deficit) (MW)
2011 13,193 18,521 -5,3282012 12,320 18,940 -6,6202013 14,600 18,827 -4,2272014 16,170 20,576 -4,4062015 16,500 21,701 -5,201
B: Projected Figures
Financial Year ending 30th June
Planned Generation Capability as per
NTDC (MW)
NTDC Projected Demand Growth
Rate (%)
NTDC’s Projected Demand during
Peak Hours (MW)
Surplus/ (Deficit)
(MW)2016 17,551 5.98 22,457 -4,9062017 20,641 6.05 23,816 -3,1752018 25,077 5.56 25,140 -632019 29,171 5.17 26,439 2,7322020 31,216 4.86 27,725 3,491
Source: NTDC
TABLE 28Surplus/Deficit in Demand and Supply during K-Electric’s System Peak Hours
A: Actual Figures
Financial Year ending 30th
June
Generation Capability (MW)*
Demand During KEL’s System Peak Hours
(MW)
Surplus/ (Deficit) (MW)
2011 2,237 2,565 -328
2012 2,163 2,596 -433
2013 2,246 2,778 -532
2014 2,601* 2,929 -328
2015 2,632* 3,056 -424
B: Projected Figures
Financial Year ending 30th
June
Planned Generation Capability as per
KEL (MW)
KEL’s Projected Demand Growth
Rate (%)
KEL’s Projected Demand during
Peak hours (MW)
Surplus/ (Deficit) (MW)
2016 2,752 (including 20 + 100 MW NPC) 5.00 3,209 -457
2017 2,804 (including 52 MW FPCL) 5.00 3,369 -565
20183,674
(including 450 LNG + 420 Coal Conversion)
5.00 3,538 136
2019 4,374 (including 700 MW Coal)** 5.00 3,715 659
2020 4,374 5.00 3,900 474* includes 650 MW from NTDC. ** Subject to approval of acceptable tariff by NEPRA and other regulatory approvals.Source: KEL
11ELECTRICITY GENERATION

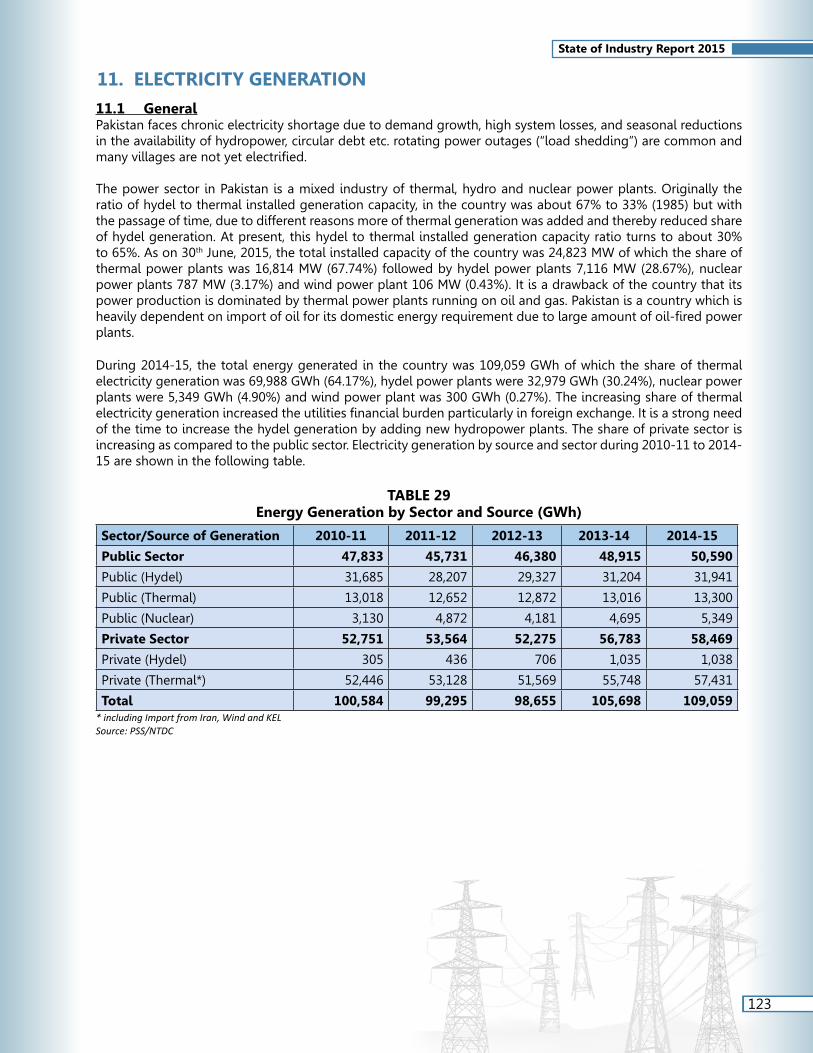
123
State of Industry Report 2015
11. ELECTRICITY GENERATION
11.1 GeneralPakistan faces chronic electricity shortage due to demand growth, high system losses, and seasonal reductions in the availability of hydropower, circular debt etc. rotating power outages (“load shedding”) are common and manyvillagesarenotyetelectrified.
The power sector in Pakistan is a mixed industry of thermal, hydro and nuclear power plants. Originally the ratio of hydel to thermal installed generation capacity, in the country was about 67% to 33% (1985) but with the passage of time, due to different reasons more of thermal generation was added and thereby reduced share of hydel generation. At present, this hydel to thermal installed generation capacity ratio turns to about 30% to 65%. As on 30th June, 2015, the total installed capacity of the country was 24,823 MW of which the share of thermal power plants was 16,814 MW (67.74%) followed by hydel power plants 7,116 MW (28.67%), nuclear power plants 787 MW (3.17%) and wind power plant 106 MW (0.43%). It is a drawback of the country that its power production is dominated by thermal power plants running on oil and gas. Pakistan is a country which is heavilydependentonimportofoilforitsdomesticenergyrequirementduetolargeamountofoil-firedpowerplants.
During 2014-15, the total energy generated in the country was 109,059 GWh of which the share of thermal electricity generation was 69,988 GWh (64.17%), hydel power plants were 32,979 GWh (30.24%), nuclear power plants were 5,349 GWh (4.90%) and wind power plant was 300 GWh (0.27%). The increasing share of thermal electricitygenerationincreasedtheutilitiesfinancialburdenparticularlyinforeignexchange.Itisastrongneedof the time to increase the hydel generation by adding new hydropower plants. The share of private sector is increasing as compared to the public sector. Electricity generation by source and sector during 2010-11 to 2014-15 are shown in the following table.
TABLE 29Energy Generation by Sector and Source (GWh)
Sector/Source of Generation 2010-11 2011-12 2012-13 2013-14 2014-15
Public Sector 47,833 45,731 46,380 48,915 50,590
Public (Hydel) 31,685 28,207 29,327 31,204 31,941
Public (Thermal) 13,018 12,652 12,872 13,016 13,300
Public (Nuclear) 3,130 4,872 4,181 4,695 5,349
Private Sector 52,751 53,564 52,275 56,783 58,469
Private (Hydel) 305 436 706 1,035 1,038
Private (Thermal*) 52,446 53,128 51,569 55,748 57,431
Total 100,584 99,295 98,655 105,698 109,059 * including Import from Iran, Wind and KELSource: PSS/NTDC

124
State of Industry Report 2015
11.2 Thermal GenerationMajority of Pakistan’s power generation is thermal, with furnace oil, high-speed diesel and natural gas as fuels; coal is almost non-existent yet. During 2014-15, the share of thermal power generation in the energy mix of Pakistan was 64.17% as against 64.41% during last year.
Most of the upcoming power projects in the country would be based on coal and gas. The list of power plants planned in private sector shows the fuel of their operation, prepared by PPIB, is also included in this report. The thermalpowerplants runningonoilwill increase thecurrentaccountdeficitwhich is alreadyproblemfor thecountry.The importofoil isoneof themainreasonsofcurrentaccountdeficit.Anystrategytocutcurrentaccountdeficitrequirestocutdowntheoilimportsandforthisitisessentialtoreducetheelectricitygeneration through oil. Similarly, the thermal power plants running on natural gas has negative externality. The economiclossresultingfromdeficiencyofnaturalgasduetoexcessiverelianceongasfiredpowergenerationis a negative externality. The total installed capacity of thermal power plants in the country as on 30th June, 2015 was 16,814 MW out of which thermal power plants of 5,762 MW were in public sector.
11.3 Thermal Power Generation and Fuel ConsumptionGas: During the year 2014-15, the share of electricity generated using gas in the total electricity generation of the country was 44.57% while this share during 2013-14 was 45.19%.
Oil: During the year 2014-15, the share of electricity generated using oil in the total electricity generation of the country was 55.28% while this share during 2013-14 was 54.64%.
Coal: During the year 2014-15, the share of electricity generated using coal in the total electricity generation of the country was 0.15% while this share during 2013-14 was 0.16%.
The historical record of thermal electricity generation using different fuels, from the years 2010-11 to 2014-15 is given in the following table.
-
5,000
10,000
15,000
20,000
25,000
30,000
35,000
40,000
45,000
50,000
2010-11 2011-12 2012-13 2013-14 2014-15
Figure 29: Energy Generation by Sector and Source (GWh)
Public (Hydel) Private (Hydel) Public (Thermal) Private (Thermal) Public (Nuclear)

125
State of Industry Report 2015
TABLE 30Thermal Electricity Generation by Sector and by Fuel (GWh)
2010-11 2011-12 2012-13 2013-14 2014-15
Thermal Genertion by:
GENCOs 13,018 12,652 12,872 13,016 13,300
KEL Own Power Plants 7,826 8,029 8,567 8,709 9,319
IPPsPEPCO Area 41,209 42,222 40,062 43,701 44,638
KEL Area 1,538 933 1,116 1,380 1,525
RPPsPEPCO Area 546 758 0 0 0
KEL Area 158 0 0 0 0
CPPs/SPPsPEPCO Area 587 730 1,280 1,108 1,015
KEL Area 287 154 137 168 191
Total Thermal Generation 65,169 65,478 64,034 68,082 69,988
Thermal Generation using:
Gas
PEPCO Area* 31,498 24,161 21,817 23,877 23,903
KEL Area 5,578 6,001 6,373 6,892 7,293
Total 37,076 30,162 28,190 30,769 31,196
FO and HSD
PEPCO Area** 23,796 32,135 32,357 33,836 34,948
KEL Area 4,188 3,115 3,447 3,365 3,742
Total 27,984 35,250 35,804 37,201 38,690
Coal
PEPCO Area 66 66 40 112 102
KEL Area 43 0 0 0 0
Total 109 66 40 112 102
Total Thermal Generation 65,169 65,478 64,034 68,082 69,988 * Including generation of SPPs. ** Including generation of CPPs.Source: PSS/NTDC/KEL
11.4 Hydel GenerationWaterflowingintherivershaskineticenergy.Onceitisusedtodrivetheturbineandproduceelectricity,thepower thus generated is called hydel energy. Power produced by the turbines depends on quantity of water flowingperminutesandtheheadofwateravailable.
Pakistan has a potential of around 40,000 MW hydropower, whereas the installed hydel power capacity of Pakistan at the end of 2014-15 was 7,116 MW. The share of existing hydel power installed capacity to the total installed generation capacity of the country is only 28.67% while this share in year 1985 was around 67%. The share of hydel power generation during 2014-15, in the energy mix of Pakistan, was 30.24% as against 30.50% during same period last year. Most of the installed hydel power capacity of the country is owned by public sector (WAPDA) and only 214 MW installed hydel power capacity is in private sector.
As discussed earlier, the availability of hydel power generation is subject to seasonal variation i.e. it depends upon the reservoir levels, inflow of water and discharge of water from the reservoir. Monthly variation inmaximumhydrogenerationcapacity,duringpastfiveyears,hasbeencollectedfromNPCCandisgiveninthefollowing table.

126
State of Industry Report 2015
TABLE 31Monthly Variation in Maximum Hydel Generating Capability (MW)
Mo
nth
Year Tarbela ManglaGhazi
BarothaWarsak
Chashma Hydel
Jinnah Hydel
Allai Khwar
Khan Khwar
Duber Khwar
Small Hydels
Total
July
2010 3,546 1,150 1,450 205 176 - - - - 55 6,582
2011 3,238 1,035 1,450 204 184 - - - - 117 6,228
2012 2,923 1,039 1,450 186 144 - - - - 116 5,858
2013 3,605 1,115 1,450 190 160 39 121 - - 127 6,807
2014 3,522 1,115 1,450 180 120 n.p. n.p. n.p. n.p. 80 6,467
Aug
ust
2010 3,594 1,150 1,450 207 86 - - - - 48 6,535
2011 3,634 1,060 1,450 200 184 - - - - 106 6,634
2012 3,603 1,092 1,450 203 168 - - - - 126 6,642
2013 3,578 1,115 1,450 191 160 32 121 - - 128 6,775
2014 3,605 1,115 1,450 175 184 n.p. n.p. n.p. n.p. 78 6,607
Sep
tem
ber
2010 3,600 1,150 1,450 150 184 - - - - 54 6,588
2011 3,702 1,120 1,450 200 184 - - - - 107 6,763
2012 3,674 1,115 1,450 203 184 - - - - 120 6,746
2013 3,613 1,115 1,450 190 184 70 121 - - 114 6,857
2014 3,605 1,115 1,450 150 184 n.p. n.p. n.p. n.p. 81 6,585
Oct
ob
er
2010 3,395 1,150 1,450 215 176 - - - - 54 6,440
2011 3,438 1,115 1,450 200 184 - - - - 109 6,496
2012 3,587 1,115 1,450 203 191 - - - - 86 6,632
2013 3,397 1,115 1,450 160 184 73 121 121 - 60 6,681
2014 3,605 1,000 1,450 150 181 n.p. n.p. n.p. n.p. 82 6,468
No
vem
ber
2010 3,056 1,035 1,450 180 161 - - - - 44 5,926
2011 3,371 1,115 1,450 166 168 - - - - 94 6,364
2012 2,980 1,115 1,450 144 160 - - - - 76 5,925
2013 2,654 1,115 1,160 130 184 60 121 68 - 40 5,532
2014 2,808 1,115 1,450 150 168 n.p. n.p. n.p. n.p. 80 5,771
Dec
emb
er
2010 2,914 980 1,450 150 136 - - - - 34 5,664
2011 3,199 1,111 1,450 133 136 - - - - 52 6,081
2012 2,853 1,081 1,450 144 147 - - - - 71 5,746
2013 2,584 1,115 1,160 130 184 58 121 72 - 51 5,475
2014 2,268 1,115 1,160 148 140 n.p. n.p. n.p. n.p. 61 4,892
Janu
ary
2011 1,440 754 1,450 150 154 - - - - 16 3,964
2012 2,139 711 1,160 133 161 - - - - 29 4,333
2013 1,661 674 1,250 142 138 - - - - 49 3,914
2014 1,604 880 1,160 140 120 36 121 68 - 34 4,163
2015 1,100 1,018 960 142 126 n.p. n.p. n.p. n.p. 25 3,371
Feb
ruar
y
2011 2,420 776 1,450 150 161 - - - - 74 5,031
2012 2,384 966 1,450 133 161 - - - - 66 5,160
2013 2,147 812 1,450 141 184 - - - - 102 4,836
2014 2,000 1,013 1,350 140 161 60 121 68 - 45 4,958
2015 2,049 977 1,450 141 158 n.p. n.p. n.p. n.p. 77 4,852 Continued.....

127
State of Industry Report 2015
Mo
nth
Year Tarbela ManglaGhazi
BarothaWarsak
Chashma Hydel
Jinnah Hydel
Allai Khwar
Khan Khwar
Duber Khwar
Small Hydels
Total
Mar
ch2011 2,182 714 1,450 150 126 - - - - 54 4,676
2012 1,740 650 1,450 140 133 - - - - 47 4,160
2013 1,478 730 1,160 177 161 - - - - 118 3,824
2014 1,879 751 1,160 129 149 67 121 68 130 60 4,514
2015 1,355 803 1,160 140 150 n.p. n.p. n.p. n.p. 73 3,681
Ap
ril
2011 1,800 889 1,450 182 184 - - - - 118 4,623
2012 1,148 726 1,450 166 184 - - - - 118 3,792
2013 1,605 833 1,450 180 184 - - - - 122 4,374
2014 1,698 1,002 1,450 165 184 70 121 68 130 78 4,966
2015 1,395 1,000 1,350 140 183 n.p. n.p. n.p. n.p. 78 4,146
May
2011 2,590 1,060 1,450 205 184 - - - - 120 5,609
2012 1,882 750 1,450 190 184 - - - - 116 4,572
2013 2,197 947 1,450 196 178 60 121 - - 124 5,273
2014 2,200 1,107 1,450 201 184 67 121 68 128 87 5,613
2015 3,290 1,115 1,450 185 181 n.p. n.p. n.p. n.p. 93 6,314
June
2011 2,662 1,097 1,450 205 184 - - - - 115 5,713
2012 2,182 850 1,450 190 152 - - - - 120 4,944
2013 3364 1,115 1,450 192 160 45 122 - - 126 6,574
2014 2670 1115 1450 175 144 66 121 68 120 89 6,018
2015 3152 1115 1450 185 181 n.p. n.p. n.p. n.p. 88 6,171 Source: NPCC, Islamabad
11.5 Nuclear Power PlantsPakistan Atomic Energy Commission, interalia, undertakes the projects of nuclear power plants’ development, operation and maintenance in the country. The 1st Nuclear Power Plant (NPP) of the country, namely Karachi Nuclear Power Plant (KANUPP), was commissioned in 1971 in Karachi through a turn-key agreement. The total installed capacity of this plant was 137 MW and the useful life of this plant was 30 years. However, after completion of 30 years life, the Pakistan Nuclear Regulatory Authority extended the operational life of this plant, by another 15 year at reduced capacity. The 2nd NPP of the country, namely the Chashma Nuclear Power Plant (CHASNUPP-I) was commissioned in year 2000 also through a turnkey agreement by China National Nuclear Corporation. The 3rd NPP namely Chashma Nuclear Power Plant (CHASNUPP-II) was commissioned on 18th May, 2011. The installed capacity of this plant is 325 MW.
Total installed capacity of NPPs, as on 30th June, 2015, in the country was 787 MW as against the total installed electricity generation capacity of 24,823 MW, which constitutes a share of NPPs to the total installed generation capacity as 3.17%. The share of electricity generated through NPPs in the country, during 2014-15, was recorded as 5,349 GWh (4.90%) as against 4,695 GWh (4.44%) in the preceding year.
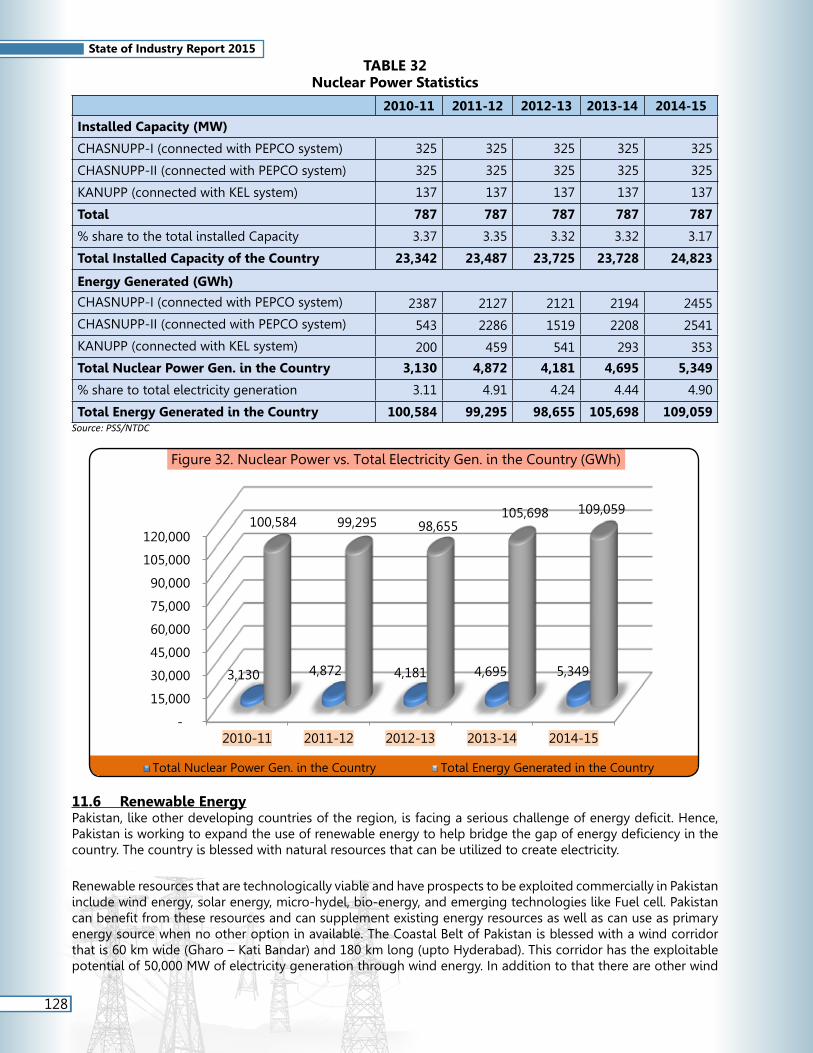
128
State of Industry Report 2015
TABLE 32Nuclear Power Statistics
2010-11 2011-12 2012-13 2013-14 2014-15
Installed Capacity (MW)
CHASNUPP-I (connected with PEPCO system) 325 325 325 325 325
CHASNUPP-II (connected with PEPCO system) 325 325 325 325 325
KANUPP (connected with KEL system) 137 137 137 137 137
Total 787 787 787 787 787
% share to the total installed Capacity 3.37 3.35 3.32 3.32 3.17
Total Installed Capacity of the Country 23,342 23,487 23,725 23,728 24,823
Energy Generated (GWh)
CHASNUPP-I (connected with PEPCO system) 2387 2127 2121 2194 2455
CHASNUPP-II (connected with PEPCO system) 543 2286 1519 2208 2541
KANUPP (connected with KEL system) 200 459 541 293 353
Total Nuclear Power Gen. in the Country 3,130 4,872 4,181 4,695 5,349
% share to total electricity generation 3.11 4.91 4.24 4.44 4.90
Total Energy Generated in the Country 100,584 99,295 98,655 105,698 109,059 Source: PSS/NTDC
11.6 Renewable EnergyPakistan,likeotherdevelopingcountriesoftheregion,isfacingaseriouschallengeofenergydeficit.Hence,Pakistanisworkingtoexpandtheuseofrenewableenergytohelpbridgethegapofenergydeficiencyinthecountry. The country is blessed with natural resources that can be utilized to create electricity.
Renewable resources that are technologically viable and have prospects to be exploited commercially in Pakistan include wind energy, solar energy, micro-hydel, bio-energy, and emerging technologies like Fuel cell. Pakistan canbenefitfromtheseresourcesandcansupplementexistingenergyresourcesaswellascanuseasprimaryenergy source when no other option in available. The Coastal Belt of Pakistan is blessed with a wind corridor that is 60 km wide (Gharo – Kati Bandar) and 180 km long (upto Hyderabad). This corridor has the exploitable potential of 50,000 MW of electricity generation through wind energy. In addition to that there are other wind
-
15,000
30,000
45,000
60,000
75,000
90,000
105,000
120,000
2010-11 2011-12 2012-13 2013-14 2014-15
3,130 4,872 4,181 4,695 5,349
100,584 99,295 98,655 105,698 109,059
Figure 32. Nuclear Power vs. Total Electricity Gen. in the Country (GWh)
Total Nuclear Power Gen. in the Country Total Energy Generated in the Country

129
State of Industry Report 2015
sites available in Coastal Area of Balochistan and some in Northern Areas. Technically the grid can take upto 30-40%ofwindenergy.Mostoftheremotevillagesinthesouthcanbeelectrifiedthroughmicrowindturbines.Morethan5,000villagescanbeelectrifiedthroughwindenergyinSindh,BalochistanandNorthernAreas.
The Government of Pakistan established the Alternative Energy Development Board in 2003 to create an environment in the country that is conducive to investment from the private sector in renewable energy.
Besides, AEDB the Irrigation and Power Departments of Punjab and Khyber Pakhtunkhwa are actively involved in development of small hydel power projects. The Provincial/AJ&K Organizations which are involved in development of small hydropower projects are as under:
i) Pakhtunkhwa Energy Development Organization (PEDO)ii) Punjab Power Development Board (PPDB)iii) Irrigation Power Development Board, Sindhiv) AJK Hydro Electric Board (AJKHEB) and AJK Private Power Cellv) Northern Area Public Works Department
The details of the project undertaken by PEDO and PPDB are included in this report. At present, the share of wind energy in the national grid of the country is non-existent as against a wind power potential of 50,000 MW in the country.
11.7 Available Power Generation CapacityCapability of thermal generation units varies due to their age, auxiliary consumption, fuel (gas) availability and site conditions. The availability of different power plants (technology-wise) against their installed capacity recorded during 2014-15 has been collected by the NPCC and K-Electric and is reproduced in following table.
TABLE 33Installed and Available Capacity (MW)
2010-11 2011-12 2012-13 2013-14 2014-15
PEPCO KEL PEPCO KEL PEPCO KEL PEPCO KEL PEPCO KELInstalled Capacity
Thermal (GENCOs+IPPs) 13,463 2,447 13,097 2,872 13,127 2,814 13,290 2,403 13,715 2,326
Nuclear 650 137 650 137 650 137 650 137 650 137 Hydel (WAPDA+IPPs) 6,645 - 6,730 - 6,947 - 7,116 - 7,116 -
Wind - - 1 - 50 - 106 - 254 - Total 20,758 2,584 20,478 3,009 20,774 2,951 21,162 2,540 21,735 2,463
Available Capacity
Thermal (GENCOs+IPPs) 11,865 1,787 11,151 2,256 11,399 1,862 12,680 1,872 12,845 1,880
Nuclear 615 84 615 80 615 75 615 75 615 75 Hydel (WAPDA+IPPs) Depends on Indents
Wind - - 1 - 50 - 106 254 - Total 12,480 1,871 11,767 2,336 12,064 1,937 13,401 1,947 13,714 1,955
Available Percentage of Installed Capacity
Thermal (GENCOs+IPPs) 88.13 73.03 85.14 78.55 86.84 66.17 95.41 77.90 93.66 80.83
Nuclear 94.62 61.31 94.62 58.39 94.62 54.74 94.62 54.74 94.62 54.74 Wind - - 100.00 - 100.00 - 100.00 - 100.00 - Total 60.12 72.41 57.46 77.63 58.07 65.64 63.33 76.65 63.10 79.37
Source: NPCC/KEL
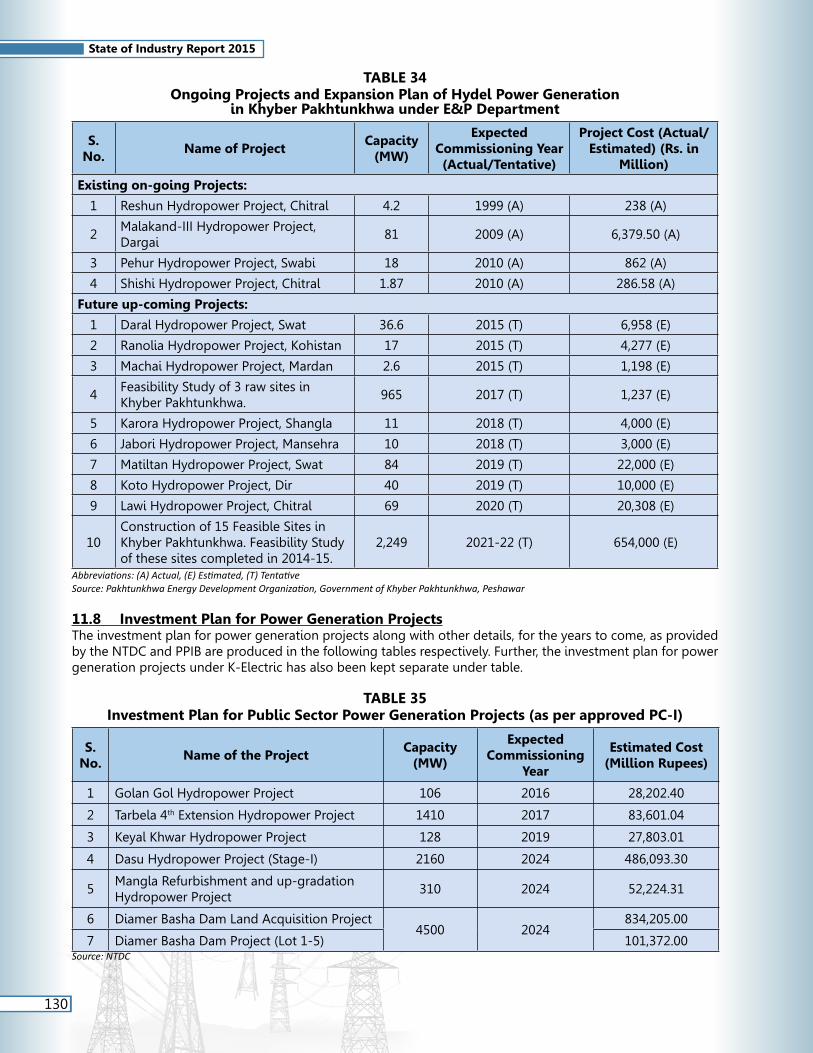
130
State of Industry Report 2015
TABLE 34Ongoing Projects and Expansion Plan of Hydel Power Generation
in Khyber Pakhtunkhwa under E&P Department
S.No.
Name of ProjectCapacity
(MW)
Expected Commissioning Year (Actual/Tentative)
Project Cost (Actual/Estimated) (Rs. in
Million)
Existing on-going Projects:
1 Reshun Hydropower Project, Chitral 4.2 1999 (A) 238 (A)
2Malakand-III Hydropower Project, Dargai
81 2009 (A) 6,379.50 (A)
3 Pehur Hydropower Project, Swabi 18 2010 (A) 862 (A)
4 Shishi Hydropower Project, Chitral 1.87 2010 (A) 286.58 (A)
Future up-coming Projects:
1 Daral Hydropower Project, Swat 36.6 2015 (T) 6,958 (E)
2 Ranolia Hydropower Project, Kohistan 17 2015 (T) 4,277 (E)
3 Machai Hydropower Project, Mardan 2.6 2015 (T) 1,198 (E)
4Feasibility Study of 3 raw sites in Khyber Pakhtunkhwa.
965 2017 (T) 1,237 (E)
5 Karora Hydropower Project, Shangla 11 2018 (T) 4,000 (E)
6 Jabori Hydropower Project, Mansehra 10 2018 (T) 3,000 (E)
7 Matiltan Hydropower Project, Swat 84 2019 (T) 22,000 (E)
8 Koto Hydropower Project, Dir 40 2019 (T) 10,000 (E)
9 Lawi Hydropower Project, Chitral 69 2020 (T) 20,308 (E)
10Construction of 15 Feasible Sites in Khyber Pakhtunkhwa. Feasibility Study of these sites completed in 2014-15.
2,249 2021-22 (T) 654,000 (E)
Abbreviations: (A) Actual, (E) Estimated, (T) TentativeSource: Pakhtunkhwa Energy Development Organization, Government of Khyber Pakhtunkhwa, Peshawar
11.8 Investment Plan for Power Generation ProjectsThe investment plan for power generation projects along with other details, for the years to come, as provided by the NTDC and PPIB are produced in the following tables respectively. Further, the investment plan for power generation projects under K-Electric has also been kept separate under table.
TABLE 35Investment Plan for Public Sector Power Generation Projects (as per approved PC-I)
S. No.
Name of the ProjectCapacity
(MW)
Expected Commissioning
Year
Estimated Cost (Million Rupees)
1 Golan Gol Hydropower Project 106 2016 28,202.40
2 Tarbela 4th Extension Hydropower Project 1410 2017 83,601.04
3 Keyal Khwar Hydropower Project 128 2019 27,803.01
4 Dasu Hydropower Project (Stage-I) 2160 2024 486,093.30
5Mangla Refurbishment and up-gradation Hydropower Project
310 2024 52,224.31
6 Diamer Basha Dam Land Acquisition Project4500 2024
834,205.00
7 Diamer Basha Dam Project (Lot 1-5) 101,372.00 Source: NTDC

131
State of Industry Report 2015
TABLE 36Investment Plan for Power Generation Projects (KEL) (2015-16 to 2016-17)
S. No.
Name of the Project Capacity (MW)Expected
Commissioning Year
Estimated Cost
(US$ Million)
KEL’s Own Programme
1 LNG Plant (with Engro) (IPP Model)* 375 (Net) 2018 486
2 Coal Conversion (IPP Model)* 370 (Net) 2018 400
3 700MWCoalGreenfield(IPPModel)* 645 (Net) 2019 1230
Plan to induct IPPs in KEL system
1 SNPC and SNPC Phase-II 100 (Net) June, 2016 120
2 FPCL 52 (Net) March, 2017 114* Subject to approval of acceptable tariff by NEPRA and other regulatory approvals.Source: KEL
TABLE 37Investment Plan for Private Sector Power Generation Projects
S. No.
Name of the ProjectGross
Capacity (MW)
Estimated Investments
(Million US$)
Achieved/ Expected
CODLatest Status of the Project
A: OIL
NIL
B: PIPELINE QUALITY GAS/DUAL FUEL/LNG
1 Kandra Power Project 120 90December, 2022
i) Project is based on both pipeline quality gasandgasfromadedicatedgasfield. ii) LOS not issued due to the non-allocation of pipeline quality gas required for commingling of low BTU Kandra gas.
C: DEDICATED GAS FIELDS
NIL
D: HYDEL
2 Patrind Hydropower Project 150 362 March, 2017 Project under construction.
3 Gulpur Hydropower Project 102 323 June, 2019 Projectunderfinancialclosing.
4 Sehra Hydel Project 130 344December, 2019
Approval of EPC stage tariff by NEPRA is under process.
5 Karot Hydel Project 720 1420 June, 2020 Projectunderfinancialclosing.
6 Azad Patan Hydel Project 640 1145 June, 2020Tariff review under consideration by NEPRA.
7Suki Kinari Hydropower Project
870 1801 September, 2021 Projectunderfinancialclosing.
8 Chakothi-Hattian Project 500 983December, 2022
Sponsors have approached Court of Law against NEPRA for giving low tariff. The matter is subjudice.
9Lower Palas Valley Hydropower Project
665 763December, 2022
Project under implementation under Public-Private Partnership (PPP) mode.
10Lower Spat Gah Hydropower Project
496 697December, 2022
Project under implementation under Public-Private Partnership (PPP) mode.
Continued.....

132
State of Industry Report 2015
S. No.
Name of the ProjectGross
Capacity (MW)
Estimated Investments
(Million US$)
Achieved/ Expected
CODLatest Status of the Project
11 Madian Hydropower Project 157 438December, 2022
Progress is slow due to Law and Order situation in the vicinity of project area and its perception internationally.
12 Asrit-Kedam Hydel Project 215 406December, 2022
Progress is slow due to Law and Order situation in the vicinity of project area and its perception internationally.
13 Mahl Hydropower Project 590 885December, 2023
LOI issued on 21st October, 2014. Feasibility Study is in process.
14 Kohala Hydropower Project 1100 2397December, 2023
LOSwillbeissuedafterfulfillmentofpre-requisites by Sponsors.
15 Kaigah Hydel Project 548 1565December, 2024
Sponsors are in process of submission of feasibility level tariff to NEPRA.
16 Rajdhani Hydropower Project 132 198December, 2024
PPIB is in consultation with the Government of AJK for the development of the project.
17Athmuqam Hydropower Project
350 525December, 2024
EOI for development of project to be re-advertised shortly.
18Turtonas-Uzghor Hydropower Project
58 87December, 2024
Proposals received against EOI are under evaluation process.
19Neckeherdm-Paur Hydropower Project
80 120December, 2025
EOI for development of project to be re-advertised shortly.
E: COAL
20Engro Powergen. Project at Thar Block-II, Sindh
660 957February, 2017
Projectunderfinancialclosing.
21Shanghai Electric Power Project at Thar Block-I, Sindh
1320 1914December, 2017
Project under issuance of Notice of Proceed (NTP)/LOI.
22Salt Range Power Project by CMEC, China
330 479December, 2017
Project under tariff determination by NEPRA.
23HUBCO Imported Coal based Power Project
1320 1914December, 2017
LOI issued, sponsors are in process to approach NEPRA for tariff.
24Shandong Imported Coal based Power Project
1320 1914 March, 2018 Projectunderfinancialclosing.
25Port Qasim Power Project by Sinohydro Resources Limited and Al Mirqab Capital
1320 1914 June, 2018 Projectunderfinancialclosing.
26 Grange Holding Power Project 163 251 January, 2019 Projectunderfinancialclosing.
27Siddiqsons Imported Coal based Power Project
350 508 March, 2019LOI issued, sponsors have approached NEPRA for tariff.
28Lucky Electric Imported Coal based Power Project
660 957October, 2019
Projectunderfinancialclosing.
Source: Private Power and Infrastructure Board, Islamabad
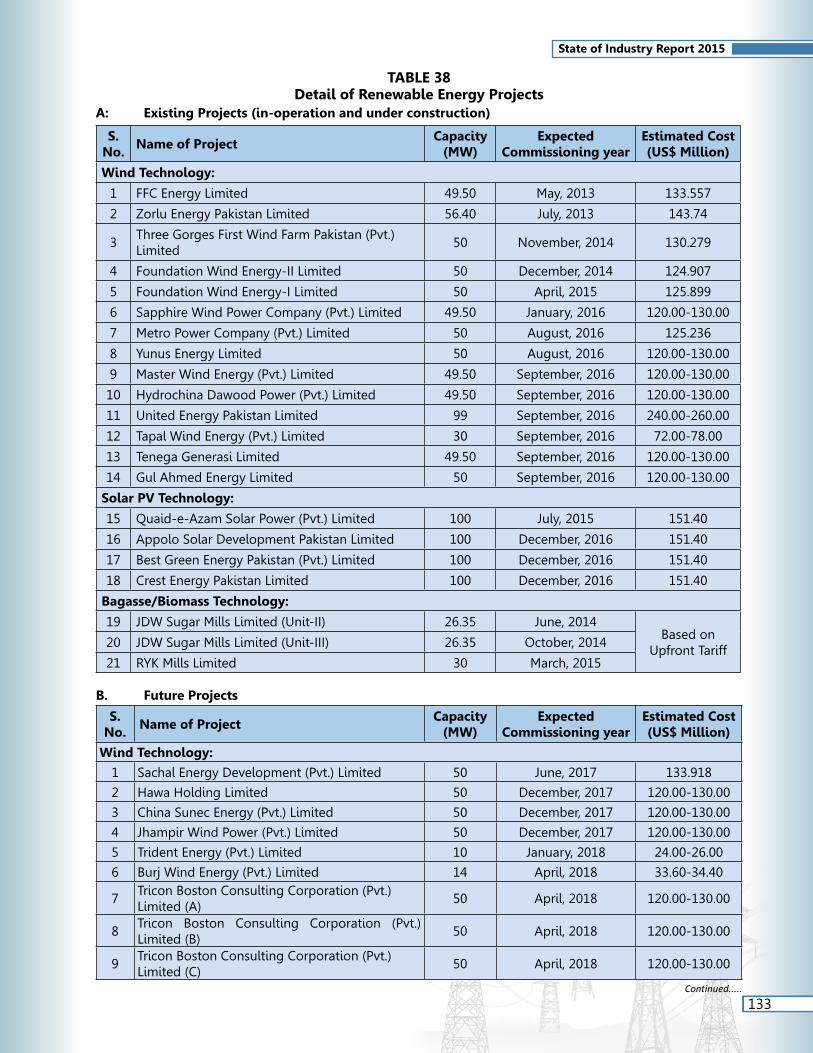
133
State of Industry Report 2015
TABLE 38Detail of Renewable Energy Projects
A: Existing Projects (in-operation and under construction)
S. No.
Name of ProjectCapacity
(MW)Expected
Commissioning yearEstimated Cost (US$ Million)
Wind Technology:
1 FFC Energy Limited 49.50 May, 2013 133.557
2 Zorlu Energy Pakistan Limited 56.40 July, 2013 143.74
3Three Gorges First Wind Farm Pakistan (Pvt.) Limited
50 November, 2014 130.279
4 Foundation Wind Energy-II Limited 50 December, 2014 124.907
5 Foundation Wind Energy-I Limited 50 April, 2015 125.899
6 Sapphire Wind Power Company (Pvt.) Limited 49.50 January, 2016 120.00-130.00
7 Metro Power Company (Pvt.) Limited 50 August, 2016 125.236
8 Yunus Energy Limited 50 August, 2016 120.00-130.00
9 Master Wind Energy (Pvt.) Limited 49.50 September, 2016 120.00-130.00
10 Hydrochina Dawood Power (Pvt.) Limited 49.50 September, 2016 120.00-130.00
11 United Energy Pakistan Limited 99 September, 2016 240.00-260.00
12 Tapal Wind Energy (Pvt.) Limited 30 September, 2016 72.00-78.00
13 Tenega Generasi Limited 49.50 September, 2016 120.00-130.00
14 Gul Ahmed Energy Limited 50 September, 2016 120.00-130.00
Solar PV Technology:
15 Quaid-e-Azam Solar Power (Pvt.) Limited 100 July, 2015 151.40
16 Appolo Solar Development Pakistan Limited 100 December, 2016 151.40
17 Best Green Energy Pakistan (Pvt.) Limited 100 December, 2016 151.40
18 Crest Energy Pakistan Limited 100 December, 2016 151.40
Bagasse/Biomass Technology:
19 JDW Sugar Mills Limited (Unit-II) 26.35 June, 2014Based on
Upfront Tariff20 JDW Sugar Mills Limited (Unit-III) 26.35 October, 2014
21 RYK Mills Limited 30 March, 2015
B. Future Projects
S. No.
Name of ProjectCapacity
(MW)Expected
Commissioning yearEstimated Cost (US$ Million)
Wind Technology:
1 Sachal Energy Development (Pvt.) Limited 50 June, 2017 133.918
2 Hawa Holding Limited 50 December, 2017 120.00-130.00
3 China Sunec Energy (Pvt.) Limited 50 December, 2017 120.00-130.00
4 Jhampir Wind Power (Pvt.) Limited 50 December, 2017 120.00-130.00
5 Trident Energy (Pvt.) Limited 10 January, 2018 24.00-26.00
6 Burj Wind Energy (Pvt.) Limited 14 April, 2018 33.60-34.40
7Tricon Boston Consulting Corporation (Pvt.) Limited (A)
50 April, 2018 120.00-130.00
8Tricon Boston Consulting Corporation (Pvt.) Limited (B)
50 April, 2018 120.00-130.00
9Tricon Boston Consulting Corporation (Pvt.) Limited (C)
50 April, 2018 120.00-130.00
Continued.....

134
State of Industry Report 2015
S. No.
Name of ProjectCapacity
(MW)Expected
Commissioning yearEstimated Cost (US$ Million)
10 Hartford Alternative Energy (Pvt.) Limited 50 July, 2018 120.00-130.00
11 Wind Eagle Limited (1) 50 July, 2018 120.00-130.00
12 Wind Eagle Limited (2) 50 July, 2018
13 Western Energy (Pvt.) Limited 50 July, 2018 120.00-130.00
14 Zephyr Power (Pvt.) Limited 50 August, 2018 134.099
15 Titan Wind Power (Pvt.) Limited 10 August, 2018 24.00-26.00
Solar PV Technology:
16 Zonergy (Pvt.) Limited 600 June, 2016 840.00-900.00
17 Access Electric (Pvt.) Limited 10 August, 2016 16.00-19.00
18 Buksh Solar (Pvt.) Limited 10 August, 2016 16.00-19.00
19 Sanjwal Solar Power (Pvt.) Limited 5.04 August, 2016 8.00-9.50
20 Safe Solar Power (Pvt.) Limited 10.28 August, 2016 16.00-19.00
21 Access Solar (Pvt.) Limited 11.52 August, 2016 16.00-19.00
22 Blue Star Hydel (Pvt.) Limited 1 August, 2016 1.562
23 Blue Star Electric (Pvt.) Limited 1 April, 2017 1.562
24 Harappa Solar (Pvt.) Limited 10 June, 2017 14.00-15.00
25 Fauji Foundation 10 August, 2017 14.00-15.00
26 Siddiqsons Energy Limited 50 September, 2017 70.00-75.00
27 Integrated Power Station 50 December, 2017 75.00-78.00
28 Jafri and Associates 50 December, 2017 75.00-78.00
29 Solar Blue (Pvt.) Limited 50 December, 2017 75.00-78.00
30 RE Solar (Pvt.) Limited (1) 20 December, 2017 28.00-30.00
31 RE Solar (Pvt.) Limited (2) 20 December, 2017 28.00-30.00
32 HanergyGlobalSolarAsiaPacificLimited(1) 50 May, 2018 70.00-75.00
33 HanergyGlobalSolarAsiaPacificLimited(2) 10 May, 2018 14.00-15.00
34 Janpur Energy Limited (1) 10 May, 2018 14.00-15.00
35 Janpur Energy Limited (2) 10 May, 2018 14.00-15.00
36 Nizam Power (Pvt.) Limited (1) 5.65 June, 2018 7.00-8.00
37 Nizam Power (Pvt.) Limited (2) 5.65 June, 2018 7.00-8.00
38 Nizam Power (Pvt.) Limited (3) 11.30 June, 2018 16.00-17.00
39Sino Pak Energy Development Company (Pvt.) Limited
10 June, 2018 14.00-15.00
40 Ayan Energy (Pvt.) Limited 50 June, 2018 70.00-75.00
41 Total Energies Nouvelles Ventures 100 December, 2018 140.00-150.00
42 AJ Power (Pvt.) Limited 10 December, 2018 14.00-15.00
43 Adamjee Power Generation (Pvt.) Limited 5 December, 2018 7.00-8.00
44 ET Solar (Pvt.) Limited (1) 25 December, 2018 35.00-38.00
45 ET Solar (Pvt.) Limited (2) 25 December, 2018 35.00-38.00
46 ET Solar (Pvt.) Limited (3) 25 December, 2018 35.00-38.00
47 Crystal Energy (Pvt.) Limited 2 May, 2019 3.50-4.00
48 ACT Solar (Pvt.) Limited 50 May, 2019 70.00-75.00
49 Asia Petroleum 30 June, 2019 42.00-45.00
50 Forshine (Pakistan) 50 June, 2019 70.00-75.00Continued.....

135
State of Industry Report 2015
S. No.
Name of ProjectCapacity
(MW)Expected
Commissioning yearEstimated Cost (US$ Million)
Bagasse /Biomass Technology:
51 Chiniot Power Limited 62.40 2015
Based on Upfront Tariff
52 Hamza Sugar Mill Limited 15 2016
54 Layyah Sugar Mills Limited 41 2016
55 SafinaSugarMillsLimited 20 July, 2016
53 Alliance Sugar Mills Limited 19 2017
56 Almoiz Industries Limited 36 2017
57 Etihad Power Generation Limited 67 January, 2017
58 Shahtaj Sugar Mills Limited 15 2018
59 Chanar Energy Limited 22 201860 RYK Energy Limited 36 2018
Source: Alternative Energy Development Board, Islamabad
C: Proposals of following Projects accepted by AEDB and issuance of LOI:
S. No.
Name of ProjectCapacity
(MW)Expected
Commissioning yearEstimated Cost (US$ Million)
Wind Technology:
1 Gul Ahmed Energy Limited 50 2019 120.00-130.00
2 Metro Power Company Limited 50 2019 120.00-130.00
3 Electrique (Pvt.) Limited 50 2019 120.00-130.00
4 Shaheen Foundation (PAF) 50 2019 120.00-130.00
5 Emerald Energy Limited 50 2019 120.00-130.00
6 Aleph Systems (SMC-Pvt.) Limited 100 2019 240.00-260.00
7 Wind Energy Limited 50 2019 120.00-130.00
8 Power China Huadong Engineering Corporation Limited 50 2019 120.00-130.00
9 Indus Wind Energy Limited 50 2019 120.00-130.00
10 NASDA Energy (Pvt.) limited 50 2019 120.00-130.00
11 Green Power (Pvt.) Limited (1) 50 2019 120.00-130.00
12 Green Power (Pvt.) Limited (2) 50 2019 120.00-130.00
13 Trans Atlantic Energy (Pvt.) Limited (1) 50 2019 120.00-130.00
14 Trans Atlantic Energy (Pvt.) Limited (2) 50 2019 120.00-130.00
15 MepconIncemet Energias Renovables 50 2019 120.00-130.00
16 Master Green Energy Limited 100 2019 240.00-260.00
17 Din Energy Limited 50 2019 120.00-130.00
Solar PV Technology:
18 MST Power (Pvt.) Limited 5 2019 7.00-8.00
19 RT Power (Pvt.) Limited 10 2019 14.00-15.00
20 Ravi Renewable Energy 20 2019 28.00-30.00
21 Gran Solar 20 2019 28.00-30.00
22 First Solar (Pvt.) Limited 2 2017 2.80-3.00
23 Pakistan PV Power 01 (Pvt.) Limited 50 2019 70.00-75.00
24 KSJ International FZE 200 2019 280.00-300.00
25 Sapphire Wind Power Company Limited 40 2019 56.00-60.00Continued.....

136
State of Industry Report 2015
S. No.
Name of ProjectCapacity
(MW)Expected
Commissioning yearEstimated Cost (US$ Million)
26 Gul Ahmed Energy Limited 50 2019 70.00-75.00
27 Metro Solar Power Limited 50 2019 70.00-75.00
28 Master Solar Energy Limited 20 2019 28.00-30.00
29 Uch-II Power (Pvt.) Limited 10 2019 14.00-15.00
30 China Han Power Company Limited (1) 50 2019 70.00-75.00
31 China Han Power Company Limited (2) 200 2019 280.00-300.00
32 Liberty Solar (Pvt.) Limited 50 2019 70.00-75.00
33 Adamjee Power Generation 5 2019 7.00-8.00
34 Conergy 20 2019 28.00-30.00
35 Fotwatio Renewable Ventures 50 2019 70.00-75.00
Bagasse/Biomass Technology:
36 Ansari Powergen Company (Pvt.) Limited 30 2019
Based on Upfront Tariff
37 Bandhi Powergen Company (Pvt.) Limited 30 2019
38 TAY Powergen Company (Pvt.) Limited 30 2019
39 Faran Sugar Mills Limited 25 2019
40 Shakargarj Mills Limited (1) 40 2019
41 Shakarganj Mills Limited (2) 60 2019
42 Indus Sugar Mills Limited 25 2019Notes: The expected dates for some of the projects as provided by AEDB do not exactly match with the expansion plans provided by NTDC. For consistency of report the data provided by NTDC has been used in the analysis.
11.9 Economic Load Dispatch SystemBased on the net heat rates of power plants, the National Power Control Centre, Islamabad decides the operation and load dispatch of power plants in the country except the power plants operated by K-Electric. Merit Order position of power plants in the area of NTDC and K-Electric, during 2014-15 is given in following two tables separately.
TABLE 39Merit Order for Power Generation Plants (PEPCO System)
(Based on the revised RFO and HSD prices effective from 16-06-2015) (Rs./kWh)
Order in
MeritPlant Groups Fuel Type
As on 16th June, 2015 Status in Last Year Merit
Order (16-06-2014)
FuelCost
O&MCost
Specific Cost
1 Uch (upto 152.375 GWh) Gas 0.55750 0.23340 0.79090 12 Liberty (upto 61.904 GWh) Gas 1.82378 0.31800 2.14178 33 Uch (+ 152.375 GWh) Gas 2.33620 0.23340 2.56960 24 Uch-II Gas 3.88440 0.14960 4.03400 --5 Foundation Power Gas 3.77690 0.35570 4.13260 106 GTPS Faisalabad 5-9 Gas 4.19570 0.02500 4.22070 127 Guddu 11-13 R. Gas 4.16600 0.06890 4.23490 138 FKPCL Gas 3.52630 0.73478 4.26108 59 Rousch Gas 4.09025 0.20535 4.29560 14
10 Engro Power Gen. Gas 4.05880 0.31390 4.37270 1511 HCPC Gas 3.97790 0.48712 4.46502 1612 Lakhra Coal 4.31019 0.19540 4.50559 4
Continued.....

137
State of Industry Report 2015
Order in
MeritPlant Groups Fuel Type
As on 16th June, 2015 Status in Last Year Merit
Order (16-06-2014)
FuelCost
O&MCost
Specific Cost
13 Altern (Phase-II) Gas 3.96579 0.65794 4.62373 1814 Guddu 5-10 R. Gas 4.62880 0.06890 4.69770 1915 Davis Energy Gas 4.58152 0.49345 5.07497 2116 GTPS Kotri 3-7 Gas 4.99800 0.08990 5.08790 2217 Muzaffargarh 4 Gas 5.22010 0.02500 5.24510 2318 Muzaffargarh 1-3 Gas 5.26700 0.02500 5.29200 2419 Guddu 3-4 Gas 5.55440 0.06890 5.62330 2520 Altern (Phase-I) Gas 5.09564 0.65794 5.75358 2621 Muzaffargarh 5-6 Gas 5.93570 0.02500 5.96070 2722 Guddu 1-2 Gas 5.95100 0.06890 6.01990 2823 Jamshoro 2-4 Gas 5.99140 0.13590 6.12730 2924 NGPS Multan 1-4 Gas 6.89090 0.02500 6.91590 3025 SPS Faisalabad 1-2 Gas 7.01470 0.02500 7.03970 3126 GTPS Faisalabad 1-4 Gas 7.50210 0.02500 7.52710 3227 Orient Power Gas (RLNG) 8.22630 0.20340 8.42970 628 Sapphire Electric Gas (RLNG) 8.22640 0.34220 8.56860 729 Saif Power Gas (RLNG) 8.22660 0.34600 8.57260 830 Halmore Power Gas (RLNG) 8.22680 0.34760 8.57440 931 Muzaffargarh 4 Mix (**) 8.81395 0.02500 8.83895 3432 Muzaffargarh 1-3 Mix (**) 8.89325 0.02500 8.91825 3633 KAPCO-I Gas (RLNG) 8.85219 0.25854 9.11073 1134 Guddu 3-4 Mix (**) 9.35555 0.06890 9.42445 3735 Liberty (+ 61.904 GWh) Gas 9.11888 0.31800 9.43688 3336 Attock Gen. RFO 8.56070 0.88420 9.44490 4237 KAPCO-I RFO 9.15710 0.44846 9.60556 4038 Engro Power Gen. Mix (***) 9.64480 0.31720 9.96200 3839 KAPCO-II Gas (RLNG) 9.70937 0.30241 10.01178 1740 Jamshoro 2-4 Mix (**) 9.88310 0.13590 10.01900 3941 Muzaffargarh 5-6 Mix (**) 10.02245 0.02500 10.04745 4142 Nishat Power RFO 9.27030 0.87000 10.14030 4543 GTPS Kotri 1-2 Gas 10.15620 0.08990 10.24610 3544 Nishat Chunian RFO 9.46180 0.86790 10.32970 4445 Liberty Power Tech. RFO 9.39460 0.96960 10.36420 4346 Atlas Power RFO 9.49720 0.87000 10.36720 4647 KEL RFO 9.94788 0.57397 10.52185 4848 KAPCO-III Gas (RLNG) 10.04191 0.58291 10.62482 2049 KAPCO-II RFO 10.05007 0.63127 10.68134 4950 Japan Power RFO 10.16165 0.54821 10.70986 5051 HUBCO Narowal RFO 9.96520 0.82570 10.79090 4752 HUBCO RFO 10.71459 0.18264 10.89723 5253 SEPCOL RFO 10.07020 0.90242 10.97262 51
Continued.....

138
State of Industry Report 2015
Order in
MeritPlant Groups Fuel Type
As on 16th June, 2015 Status in Last Year Merit
Order (16-06-2014)
FuelCost
O&MCost
Specific Cost
54 Saba Power RFO 10.96195 0.16184 11.12379 55
55 Lal Pir Power RFO 10.97112 0.16441 11.13553 5356 Pak Gen. Power RFO 10.97112 0.16441 11.13553 5457 NGPS Multan 1-4 Mix (**) 11.97715 0.02500 12.00215 5658 Jamshoro 1 RFO 11.96140 0.13590 12.09730 5859 SPS Faisalabad 1-2 Mix (**) 12.11960 0.02500 12.14460 5760 Muzaffargarh 4 RFO 12.40780 0.02500 12.43280 5961 Muzaffargarh 1-3 RFO 12.51950 0.02500 12.54450 6062 Guddu 3-4 RFO 13.15670 0.06890 13.22560 6163 Jamshoro 2-4 RFO 13.77480 0.13590 13.91070 6764 Muzaffargarh 5-6 RFO 14.10920 0.02500 14.13420 6865 KAPCO-I HSD 14.28386 0.25997 14.54383 6366 Orient Power HSD 14.22630 0.33350 14.55980 6267 Sapphire Electric HSD 14.13190 0.49390 14.62580 6468 Halmore Power HSD 14.14730 0.50180 14.64910 6569 Saif Power HSD 14.32970 0.49950 14.82920 6670 Engro Power Gen. HSD 15.23080 0.32050 15.55130 6971 KAPCO-II HSD 15.67671 0.34952 16.02623 7072 GTPS Faisalabad 5-9 HSD 16.75240 0.02500 16.77740 7173 NGPS Multan 1-4 RFO 17.06340 0.02500 17.08840 7374 KAPCO-III HSD 16.21305 0.88264 17.09569 7275 SPS Faisalabad 1-2 RFO 17.22450 0.02500 17.24950 7476 GTPS Kotri 3-7 HSD 19.63910 0.08990 19.72900 7577 NGPS Multan 1-4 HSD 29.95310 0.02500 29.97810 7678 GTPS Kotri 1-2 HSD 39.90720 0.08990 39.99710 77
(**) 50% FO and 50% Gas (***) 50% HSD and 50% GasSource: National Power Control Centre, Islamabad
TABLE 40Merit Order for Power Generation Plants (K-Electric System)
(Based on the Present Net Heat Rate at 100% Plant Factor) (Rs./kWh)
S. No.
Plant Groups
Fuel Type
As on 31st December, 2014
As on 31st March, 2015
As on 30th June, 2015
Fuel Cost
O&M Cost
Total Cost
Fuel Cost
O&M Cost
Total Cost
Fuel Cost
O&M Cost
Total Cost
1 BQPS-II Gas 8,230 1,336 9,566 11,315 1,905 13,220 15,252 2,587 17,839
2Korangi CCPP
Gas 1,874 762 2,636 2,381 1,051 3,432 3,683 1,430 5,113
3 SGTPS-II Gas 556 244 800 582 362 944 746 497 1,243
4 KTGTPS-II Gas 1,194 335 1,529 1,418 526 1,944 2,016 781 2,797
5 BQPS-I Gas 4,890 1,785 23,209
6,268 2,780 28,488
9,061 3,700 41,954
6 BQPS-I HFO 16,534 19,440 29,193 Note: The plant on dual fuel will occur at three places; firstly all on Gas, secondly on Mix Fuel (average 50:50 ratio of Gas and FO) and thirdly on FO.Source: KEL

139
State of Industry Report 2015
11.10 Generation Licenses GrantedIn Pakistan, the generation of electric power for the purpose of sale, is a licensed activity. NEPRA grants generation licence to different power producing companies who wish to sale their electric power to national grid or to sale their electric power production to bulk power consumers. However, there is no need of generation licence for those electric power producers which produce electricity for their self use. The details of up-to-date granted Licenses are given in following tables.
TABLE 41-AList of Generation Licensees (Hydel + Nuclear)
S. No.
Name of Company and LocationInstalled
Capacity (MW)Fuel Type
Hydel (Technology: Hydel)
1WAPDA Hydro Electric Power Company (Tarbela, Mangla, Warsak, Ghazi Barotha, Chashma etc.)
17359.96Storage Water / Run of
River / Canal
2Malakand-III, Pakhtunkhwa Energy Development Organization (PEDO), Malakand Agency, Khyber Pakhtunkhwa
83.70 Run of River/Canal
3Blue Star Energy (Pvt.) Limited, District Mardan, Khyber Pakhtunkhwa
3.021 Run of River/Canal
4SK Hydro (Pvt.) Limited, District Manshera, Khyber Pakhtunkhwa
840.00 Run of River
5 Olympus Energy (Pvt.) Limited, District Gujrat, Punjab 20.0016Canal Fall/
Run of River
6Pehur Hydropower Plant, PEDO, District Swabi, Khyber Pakhtunkhwa
18.00Canal Fall/
Run of River
7Punjnad Hydropower (Pvt.) Limited, District Muzaffargarh, Punjab
15.00 Run of River
8 Rasul Hydropower (Pvt.) Limited, District Jhelum, Punjab 20.0016 Run of River
9 Olympia Hydropower Limited, District Kasur, Punjab 12.60 Run of Canal
10 AlkaPowerPrivateLimited,DistrictHafizabad,Punjab 1.80 Canal Fall
11 Alka Power Private Limited, District Sahiwal, Punjab 3.30 Canal Fall
12 Chenab Energy (Pvt.) Limited, District Sahiwal, Punjab 4.80 Run/Fall of Canal
13Frontier Mega Structure and Power (Pvt.) Limited, District Mansehra, Khyber Pakhtunkhwa
2.40 Run of River
14SAR Energy (Pvt.) Limited, District Mardan, Khyber Pakhtunkhwa
1.30 Run of Canal
15Reshun Hydropower Plant, PEDO, Reshun Gol, District Chitral, Khyber Pakhtunkhwa
4.20Canal Fall/
Run of River
16Shishi Hydropower Plant, PEDO, Drosh, District Chitral, Khyber Pakhtunkhwa
1.875Canal Fall/
Run of River
17Machai Hydropower Plant, PEDO, Machai Canal near Village Alo, District Mardan, Khyber Pakhtunkhwa
2.60Low Head Canal Fall
18Ranolia Hydropower Plant, PEDO, Ranolia Khwar, District Kohistan, Khyber Pakhtunkhwa
17.00 Run of River
19Karot Power Company (Pvt.) Limited, Village Karot, District Rawalpindi, Punjab
732.00 Run of River
20 New Park Energy Limited, District Okara, Punjab 9.00 Canal FallContinued.....

140
State of Industry Report 2015
S. No.
Name of Company and LocationInstalled
Capacity (MW)Fuel Type
21Karimi Energy (Pvt.) Limited, District Haripur, Khyber Pakhtunkhwa
3.60 Canal Fall/Run of River
22Muntaha Power (Pvt.) Limited, District Muzaffargarh, Punjab
2.60Canal Fall/
Run of River
23Marala Hydropower Project, Punjab Power Development Company Limited (PPDCL), District Sialkot, Punjab
8.088Canal Fall/
Run of River
24Pakpattan Hydropower Project, PPDCL, District Pakpattan, Punjab
3.01Canal Fall/
Run of River
25Deg-Outfall Hydropower Project, PPDCL, District Sheikhpura, Punjab
4.268Low Head Canal Fall
26Chianwali Hydropower Project, PPDCL, District Gujranwala, Punjab
5.674Low Head Canal Fall
Nuclear (Technology: Pressurized Heavy Water Reactor)
1Chashma Nuclear Power Plant (Unit-1), Chashma Barrage, District Mianwali, Punjab
325.00 Uranium
2 Karachi Nuclear Power Plant, District Karachi, Sindh 137.00 Uranium
3Chashma Nuclear Power Plant (Unit-2), Chashma Barrage, District Mianwali, Punjab
325.00 Uranium
Note: Shaded area indicate licenses issued in 2014-15.Source: National Electric Power Regulatory Authority, Islamabad
TABLE 41-BList of Generation Licensees (Wind + Solar + Bagasse/Biomass)
S. No. Name of Company and LocationInstalled Capacity
(MW)Fuel Type Technology
Wind Power Projects under Renewable Energy Policy 2006
1 New Park Energy Limited, Mirpur Sakro, Thatta, Sindh 49.50 Wind Wind Turbine
2 Foundation Wind Energy-II (Pvt.) Limited, Thatta, Sindh 50.00 Wind Wind Turbine
3 Milergo Pakistan Limited, Thatta, Sindh 250.00 Wind Wind Turbine
4 Tenaga Generasi Limited, Thatta, Sindh 49.50 Wind Wind Turbine
5 HydroChina Dawood Power (Pvt.) Limited, Thatta, Sindh 49.50 Wind Wind Turbine
6 Zorlu Enerji Pakistan Limited, Jhampir, Thatta, Sindh 56.40 Wind Wind Turbine
7 SUNEC Wind Power Generation (Pvt.) Limited, Chakwal, Punjab 2.40 Wind Wind Turbine
8 Arabian Sea Wind Energy (Pvt.) Limited, Thatta, Sindh 49.50 Wind Wind Turbine
9 FFC Energy Limited, Jhampir, Thatta, Sindh 49.50 Wind Wind Turbine
10 Three Gorges First Wind Firm Pakistan (Pvt.) Limited, Thatta, Sindh 49.50 Wind Wind Turbine
11 Foundation Wind Energy-I Limited, Thatta, Sindh 50.00 Wind Wind Turbine
12 Gul Ahmed Wind Power Limited, Jhampir, Thatta, Sindh 50.00 Wind Wind Turbine
13 Metro Power Company Limited, Jhampir, Thatta, Sindh 50.00 Wind Wind Turbine
14 Master Wind Energy Limited, Thatta, Sindh 49.50 Wind Wind Turbine
15 Yunus Energy Limited, Jhampir, Thatta, Sindh 50.00 Wind Wind Turbine
16 Zephyr Power (Pvt.) Limited, Mirpur Sakro, Thatta, Sindh 49.50 Wind Wind Turbine
17 Sapphire Wind Power Company Limited, Jhampir, Thatta, Sindh 49.50 Wind Wind Turbine
18 Pakistan Wind Energy Generation (Pvt.) Limited, Jhampir, Thatta, Sindh 4.80 Wind Wind Turbine
19 Sachal Energy Development (Pvt.) Limited, Jhampir, Thatta, Sindh 49.50 Wind Wind Turbine
Continued.....

141
State of Industry Report 2015
S. No. Name of Company and LocationInstalled Capacity
(MW)Fuel Type Technology
20 Finergy (Pvt.) Limited, Jhampir, Thatta, Sindh 49.60 Wind Wind Turbine
21 UEP Wind Power (Pvt.) Limited, Jhampir, Thatta, Sindh 99.00 Wind Wind Turbine
22 Tapal Wind Energy (Pvt.) Limited, Jhampir, Thatta, Sindh 30.00 Wind Wind Turbine
23 Hawa Energy (Pvt.) Limited, Nooriabad, Thatta, Sindh 49.60 Wind Wind Turbine
24 NBT Wind Power Pakistan-II (Pvt.) Limited, Thatta, Sindh 249.60 Wind Wind Turbine
25 NBT Wind Power Pakistan-III (Pvt.) Limited, Thatta, Sindh 250.00 Wind Wind Turbine
26 Jhimpir Power (Pvt.) Limited, Thatta, Sindh 49.60 Wind Wind Turbine
27 Titan Energy Pakistan (Pvt.) Limited, Nooriabad, Thatta, Sindh 9.00 Wind Wind Turbine
28 China Sunec Energy (Pvt.) Limited, Nooriabad, Thatta, Sindh 49.50 Wind Wind Turbine
Solar Power Projects under Renewable Energy Policy 2006
1 DACC Power Generation Company (Pvt.) Limited, Bhawalpur, Punjab 50.00 P.V Cell P.V Cell
2 Sanjwal Solar Power (Pvt.) Limited, Sanjwal, Attock, Punjab 5.04 P.V Cell P.V Cell
3 Access Solar (Pvt.) Limited, Hattar, Punjab 11.52 P.V Cell P.V Cell
4 Buksh Energy (Pvt.) Limited, Bahawalnagar, Punjab 11.664 P.V Cell P.V Cell
5 Access Electric (Pvt.) Limited, Jehlum, Punjab 10.00 P.V Cell P.V Cell
6 Quaid-e-Azam Solar Power (Pvt.) Limited, Bahawalpur, Punjab 100.00 P.V Cell P.V Cell
7 Safe Solar Power (Pvt.) Limited, Bahawalpur, Punjab 10.2816 P.V Cell P.V Cell
8 Roshan Power (Pvt.) Limited, Kasur, Punjab 11.00 P.V Cell P.V Cell
9 First Solar (Pvt.) Limited, Chakwal, Punjab 2.0166 P.V Cell P.V Cell
10 Blue Star Hydel (Pvt.) Limited, Jhelum, Punjab 1.00 P.V Cell P.V Cell
11 Blue Star Electric (Pvt.) Limited, Jhelum, Punjab 1.00 P.V Cell P.V Cell
12 Ramzan Energy Limited, Chiniot, Punjab 1.52 P.V Cell P.V Cell
13 Crest Energy Pakistan Limited, Bahawalpur, Punjab 100.00 P.V Cell P.V Cell
14 Appolo Solar Development Pakistan Limited, Bahawalpur, Punjab 100.00 P.V Cell P.V Cell
15 Best Green Energy Pakistan Limited, Bahawalpur, Punjab 100.00 P.V Cell P.V Cell
Bagasse/Biomass Power Projects under Renewable Energy Policy 2006
1 SSJD Bioenergy Limited, Mirpur Khas, Sindh 12.00 Bagasse Bagasse
2 Lumen Energia (Pvt.) Limited, Jhang, Punjab 12.00 Biomass Steam Turbine
3 Shakarganj Mills Limited-II, Jhang, Punjab 12.00 Bagasse +FO Steam Turbine
4 Pak Ethanol (Pvt.) Limited, Tando Muhammad Khan, Sindh 9.132 Biogas Gas Engine
5 JDW Sugar Mills Limited, Rahim Yar Khan, Punjab 26.35 Bagasse +Biomass Steam Turbine
6 JDW Sugar Mills Limited, Ghotki, Sindh 26.35 Bagasse +Biomass Steam Turbine
7 Chiniot Power Limited, Chiniot, Punjab 62.40 Bagasse Steam Turbine
8 RYK Mills Limited, Rahim Yar Khan, Punjab 30.00 Bagasse Steam Turbine
9 Hamza Sugar Mills Limited, Rahim Yar Khan, Punjab 15.00 Bagasse Steam Turbine
10 Alliance Sugar Mills (Pvt.) Limited, Ghotki, Sindh 30.00 Bagasse Steam Turbine
11 Ansari Powergen Company (Pvt.) Limited, Tando Muhammad Khan, Sindh 30.00 Bagasse Steam Turbine
12 TAY Powergen Company (Pvt.) Limited, Tando Allayar, Sindh 30.00 Bagasse Steam Turbine
13 Bandhi Powergen Company (Pvt.) Limited, Shaheed Benazirabad, Sindh 30.00 Bagasse Steam Turbine
14 Etihad Power Generation Limited, RYK, Punjab 74.40 Bagasse Steam Turbine
15 The Thal Industries Corporation Limited, Chiniot, Punjab 20.00 Bagasse Steam Turbine
16 The Thal Industries Corporation Limited, Layyah, Punjab 41.00 Bagasse Steam Turbine
17 Almoiz Industries Limited, Mianwali, Punjab 36.00 Bagasse Steam TurbineNote: Shaded area indicate licenses issued in 2014-15.Source: National Electric Power Regulatory Authority, Islamabad

142
State of Industry Report 2015
TABLE 41-CList of Generation Licensees (SPPs, CPPs, IGCs, N-CPPs, DGPs, STIPPs and other IPPs)
S. No.
Name of Company and LocationInstalled Capacity
(MW)Fuel Type
Technology-wise Capacity (MW)
Technology Capacity
Small Power Producers (SPPs)
1ICI Pakistan PowerGen Limited, Sheikhupura, Punjab
14.00 HFO DE 14.00
2Sapphire Power Generation Limited, Sheikhupura, Punjab
56.80 HFO+Gas DE+GE 52.20+4.60
3 Crescent Powertec Limited, Shahkot, Punjab 10.60 HFO DE 10.60
4Ellcot Spinning Mills Limited, Kotri (Sindh), Kasur and Sheikhupura (Punjab)
21.96 HFO+ HSD DE 13.80+8.16
5Mahmood Textile Mills Limited, Muzaffargarh, Punjab
15.05 FO+Gas DE+GE 9.20+5.85
6Gulistan Power Generation Limited, Sheikhupura, Kasur (Punjab) & Kotri (Sindh)
20.945HSD+HFO
+GasDE+GE
11.82+4.68 +4.45
7 Kohinoor Mills Limited, Kasur, Punjab 31.23 HSD+HFO+Gas DE+GE17.88+5.85
+7.50
8Monnoo Energy Limited, Monnoopur, Sheikhupura, Punjab
4.60 HFO DE 4.60
9DS Power Limited, Bhikki, Sheikhupura, Punjab
1.98 HFO DE 1.98
10 Sitara Energy Limited, Faisalabad, Punjab 87.82 HFO+Gas DE+GE 51.62+36.20
11Bhanero Energy Limited, Kotri and Sheikhupura
37.33 HFO+Gas DE+GE 3.635+33.695
12Quetta Textile Mills Limited, Kotri (Sindh) & Bhai Pheru (Punjab)
30.806 HFO+Gas DE+GE 8.1+22.706
13 Ideal Energy Limited, Faisalabad, Punjab 11.82 HFO DE 11.82
14Genertech Pakistan Limited, Bhai Pheru, Punjab
27.52 HFO DE 27.52
15Kohinoor Power Company Limited, Faisalabad & Kasur, Punjab
15.24 HFO DE 10.16+5.08
16 Ghazi Power Limited, Lahore, Punjab 20.82 HFO DE 20.82
17CrescentBahumanLimited,Hafizabad,Punjab
23.03 HFO+ HSD +Gas DE 23.03
18 Zeeshan Energy Limited, Faisalabad, Punjab 6.90 HFO DE 6.90
19 Ibrahim Fibers Limited, Faisalabad, Punjab 58.30 HFO+ HSD +Gas RE 58.30
Captive Power Producers (CPPs)
1 Shakarganj Mills Limited, Jhang, Punjab 8.512 Biogas GT 8.512
2Prosperity Weaving Mills Limited, Sheikhupura, Punjab
6.90 HFO DE 6.90
3Almoiz Industries Limited, Dera Ismail Khan, Khyber Pakhtunkhwa
43.60 Bagasse +FO ST 43.60
4 Roomi Fabrics Limited, Multan, Punjab 15.87 Gas GE 15.87
5 Din Textile Mills Limited, Kasur, Punjab 9.68 HSD+ FO+Gas DE+GE +ST 5.18+4.50
6 Pakistan Steel Mills Limited, Karachi, Sindh 165.00 Gas ST 165.00
7 Nishat Mills Limited, Bhikki, Punjab 128.241 HSD+ FO+Gas DE+GE +ST 128.241
8 Indus Sugar Mills Limited, Rajanpur, Punjab 11.00 Bagasse +FO ST 11.00Continued.....
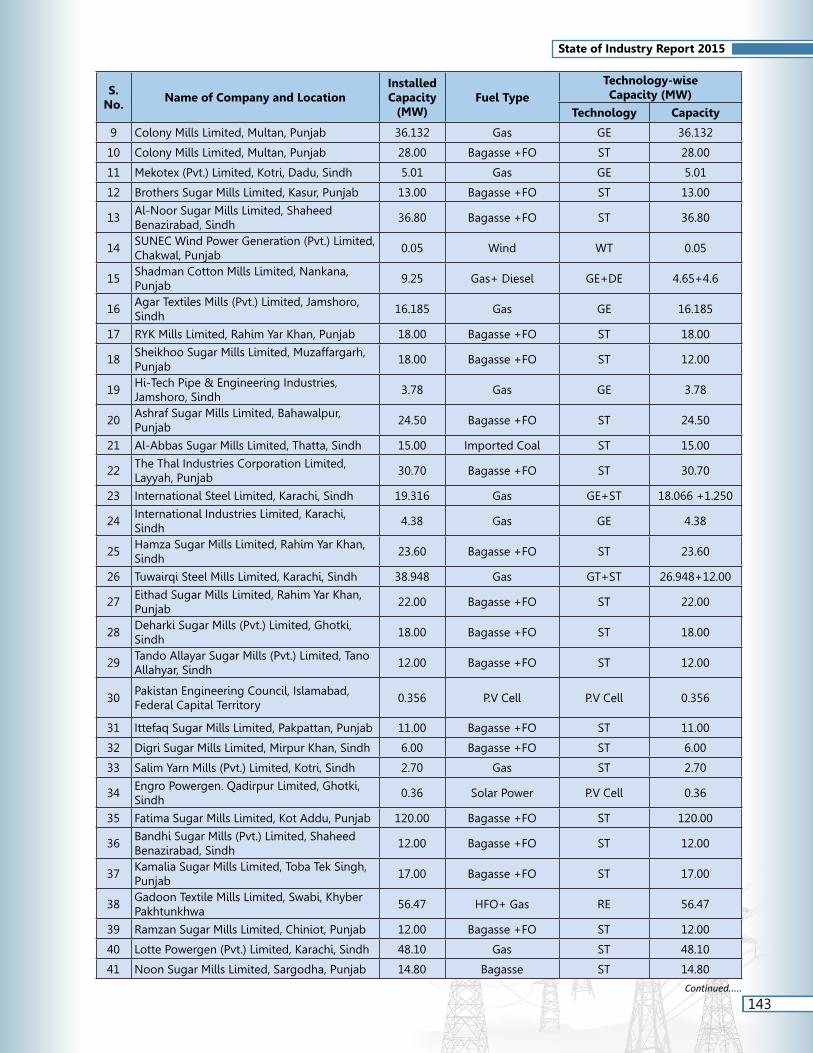
143
State of Industry Report 2015
S. No.
Name of Company and LocationInstalled Capacity
(MW)Fuel Type
Technology-wise Capacity (MW)
Technology Capacity
9 Colony Mills Limited, Multan, Punjab 36.132 Gas GE 36.132
10 Colony Mills Limited, Multan, Punjab 28.00 Bagasse +FO ST 28.00
11 Mekotex (Pvt.) Limited, Kotri, Dadu, Sindh 5.01 Gas GE 5.01
12 Brothers Sugar Mills Limited, Kasur, Punjab 13.00 Bagasse +FO ST 13.00
13Al-Noor Sugar Mills Limited, Shaheed Benazirabad, Sindh
36.80 Bagasse +FO ST 36.80
14SUNEC Wind Power Generation (Pvt.) Limited, Chakwal, Punjab
0.05 Wind WT 0.05
15Shadman Cotton Mills Limited, Nankana, Punjab
9.25 Gas+ Diesel GE+DE 4.65+4.6
16Agar Textiles Mills (Pvt.) Limited, Jamshoro, Sindh
16.185 Gas GE 16.185
17 RYK Mills Limited, Rahim Yar Khan, Punjab 18.00 Bagasse +FO ST 18.00
18Sheikhoo Sugar Mills Limited, Muzaffargarh, Punjab
18.00 Bagasse +FO ST 12.00
19Hi-Tech Pipe & Engineering Industries, Jamshoro, Sindh
3.78 Gas GE 3.78
20Ashraf Sugar Mills Limited, Bahawalpur, Punjab
24.50 Bagasse +FO ST 24.50
21 Al-Abbas Sugar Mills Limited, Thatta, Sindh 15.00 Imported Coal ST 15.00
22The Thal Industries Corporation Limited, Layyah, Punjab
30.70 Bagasse +FO ST 30.70
23 International Steel Limited, Karachi, Sindh 19.316 Gas GE+ST 18.066 +1.250
24International Industries Limited, Karachi, Sindh
4.38 Gas GE 4.38
25Hamza Sugar Mills Limited, Rahim Yar Khan, Sindh
23.60 Bagasse +FO ST 23.60
26 Tuwairqi Steel Mills Limited, Karachi, Sindh 38.948 Gas GT+ST 26.948+12.00
27Eithad Sugar Mills Limited, Rahim Yar Khan, Punjab
22.00 Bagasse +FO ST 22.00
28Deharki Sugar Mills (Pvt.) Limited, Ghotki, Sindh
18.00 Bagasse +FO ST 18.00
29Tando Allayar Sugar Mills (Pvt.) Limited, Tano Allahyar, Sindh
12.00 Bagasse +FO ST 12.00
30Pakistan Engineering Council, Islamabad, Federal Capital Territory
0.356 P.V Cell P.V Cell 0.356
31 Ittefaq Sugar Mills Limited, Pakpattan, Punjab 11.00 Bagasse +FO ST 11.00
32 Digri Sugar Mills Limited, Mirpur Khan, Sindh 6.00 Bagasse +FO ST 6.00
33 Salim Yarn Mills (Pvt.) Limited, Kotri, Sindh 2.70 Gas ST 2.70
34Engro Powergen. Qadirpur Limited, Ghotki, Sindh
0.36 Solar Power P.V Cell 0.36
35 Fatima Sugar Mills Limited, Kot Addu, Punjab 120.00 Bagasse +FO ST 120.00
36Bandhi Sugar Mills (Pvt.) Limited, Shaheed Benazirabad, Sindh
12.00 Bagasse +FO ST 12.00
37Kamalia Sugar Mills Limited, Toba Tek Singh, Punjab
17.00 Bagasse +FO ST 17.00
38Gadoon Textile Mills Limited, Swabi, Khyber Pakhtunkhwa
56.47 HFO+ Gas RE 56.47
39 Ramzan Sugar Mills Limited, Chiniot, Punjab 12.00 Bagasse +FO ST 12.00
40 Lotte Powergen (Pvt.) Limited, Karachi, Sindh 48.10 Gas ST 48.10
41 Noon Sugar Mills Limited, Sargodha, Punjab 14.80 Bagasse ST 14.80
Continued.....

144
State of Industry Report 2015
S. No.
Name of Company and LocationInstalled Capacity
(MW)Fuel Type
Technology-wise Capacity (MW)
Technology Capacity
42Bahria Town Electric Supply Company (Pvt.) Limited, Rawalpindi, Punjab
10.00 Coal Water Slurry DE 10.00
43 Fatima Energy Limited, Muzaffargarh, Punjab 120.00 Bagasse +Biomass ST 120.00
44Faran Sugar Mills Limited, Tando Muhammad Khan, Sindh
13.00 Biomass+FO ST 13.00
45Chambar Sugar Mills (Pvt.) Limited, Tando Allahyar, Sindh
5.00 Bagasse +FO ST 5.00
46Fimcotex Industries (Pvt.) Limited, Jamshoro, Sindh
35.538 Gas GE+ST 32.838+2.70
47Thal Industries Corporation Limited (forSafinaSugarMillsLimited-PlantI),Chiniot, Punjab
11.00 Bagasse ST 11.00
48Ranipur Sugar Mills (Pvt.) Limited, Khairpur, Sindh
25.50 Bagasse ST 25.50
49 Unicol Limited, Mirpur Khas, Sindh 6.60 Bagasse ST 6.60
50Lucky Cement Limited, Lakki Marwat, Khyber Pakhtunkhwa
16.00Waste Heat Recovery Based Thermal Power
Station
Steam Generators
16.00
51Alliance Sugar Mills (Pvt.) Limited, Ghotki, Sindh
13.50 Bagasse ST 13.50
52Habib Sugar Mills Limited, Benazirabad, Sindh
13.50 Bagasse ST 13.50
53Mehran Sugar Mills Limited, Tando Allahyar, Sindh
14.06 Bagasse ST 14.06
54 Shahmurad Sugar Mills Limited, Thatta, Sindh 15.25 Bagasse ST 15.25
55 Sanghar Sugar Mills Limited, Sanghar, Sindh 13.50 Bagasse ST 13.50
56Mirpurkhas Sugar Mills Limited, Mirpurkhas, Sindh
8.50 Bagasse ST 8.50
Isolated Generation Companies (IGCs)
1Engro Polymer and Chemicals Limited, Karachi, Sindh
79.02 HSD+ Gas GT 5.20
2Olympia Power Generation (Pvt.) Limited, Karachi, Sindh
5.88 Gas GE 5.88
3 Lucky Energy (Pvt.) Limited, Karachi, Sindh 46.57 Gas GE 46.57
4Nadeem Power Generation Limited, Karachi, Sindh
2.805 Gas GE 2.805
5Shakarganj Energy (Pvt.) Limited, Jhang, Punjab
31.50 Bagasse+FO ST 31.50
6Asia Generation (Pvt.) Limited, SITE & Kemari Town, Karachi
11.10 Gas GE 11.10
7Innovative Energy Solutions Limited, Karachi, Sindh
8.031 Gas GE 8.031
8 Aquagen (Pvt.) Limited, Karachi, Sindh 7.357 Gas GE 7.357
9Port Qasim Electric Power Company (Pvt.) Limited, Karachi, Sindh
1320.00 Imported Coal ST 2x660.00
New Captive Power Plants (N-CPPs)
1 Dadu Energy (Pvt.) Limited, Dadu, Sindh 49.448 Gas GE+ST 46.648+2.80
2Omni Power (Pvt.) Limited, Tando Muhammad Khan, Sindh
14.128 Gas GE+ST 13.328+0.80
3Shikarpur Power (Pvt.) Limited Shikarpur, Sindh
17.66 Gas GE+ST 16.66+1.00
4 Naudero Energy (Pvt.) Limited, Larkana, Sindh 17.66 Gas GE+ST 16.66+2.00
5 Anoud Textile Mills Limited, Jamshoro, Sindh 11.70 Gas GE 11.70
Continued.....

145
State of Industry Report 2015
S. No.
Name of Company and LocationInstalled Capacity
(MW)Fuel Type
Technology-wise Capacity (MW)
Technology Capacity
6 Lucky Cement Limited, Karachi, Sindh 29.73 Gas GE 29.73
7 Galaxy Textile Mills Limited, Jhang, Punjab 13.396 Gas GE 13.396
8 Thatta Power (Pvt.) Limited, Thatta, Sindh 45.984 Gas GE+ST 39.984+6.00
9Hi-Tech Pipe & Engineering Industries, Jamshoro, Sindh
15.00 Gas GT 12.00+3.00
Distributed Generation Plants (DGPs)
1Anoud Power Generation Limited, Karachi, Sindh
30.95 FO+Gas DG+GE 23.84+7.11
2 FFBL Power Company Limited, Karachi, Sindh 118.00 Coal+Gas ST 118.00
Short-Term Independent Power Producers (STIPPs)
1Gulf Powergen (Pvt.) Limited, Gujranwala, Punjab
83.84 RFO RE 83.84
2Reshma Power Generation (Pvt.) Limited, Kasur, Punjab
96.96 RFO RE 96.96
Other IPPs
1 K-Energy (Pvt.) Limited, Karachi, Sindh 421.90 Imported Coal ST 2x210.95GE = Gas Engines FO = Furnace OilDE = Diesel Engines RE = Reciprocating EnginesST = Steam Turbines GT = Gas TurbinesWT = Wind Turbines CB = Conventional BoilerNote: Shaded area indicate licenses issued in 2014-15.Source: National Electric Power Regulatory Authority, Islamabad
TABLE 41-DList of Public and Private Sector Power Generation Licensees
S. No.
CompanyDate of Licence
(Issued+Valid Until)
Installed Capacity
(MW)Fuel Type Technology
Generation Licence Granted to Public Sector Companies
1 Jamshoro Power Generation Company Limited (GENCO-I)
Issued 01-07-2002 Valid until 30-06-2021
2344.00*Gas+RFO
+CoalGTs+STs
2Central Power Generation Company Limited (GENCO-II)
Issued 01-07-2002 Valid until 30-06-2017
2431.70** Gas+RFO GTs+STs
3Northern Power Generation Company Limited (GENCO-III)
Issued 01-07-2002 Valid until 30-06-2027
1726.00*** Gas+RFO GTs+STs
4Lakhra Power Generation Company Limited (GENCO-IV)
Issued 18-02-2005 Valid until 17-02-2020
150.00Coal+RFO
+DOSTs
Generation Licence Granted to Private Sector Companies
1 K-Electric Limited (KEL)Issued 18-11-2002
Valid until 17-11-20272359.00 Gas+RFO GTs+STs
*Include 2x660 MW Coal Power Project under implementation.**Include 747 MW of CCPP at TPS Guddu.***NGPS Multan Power Plant has been excluded on expiry of its useful life.Source: National Electric Power Regulatory Authority, Islamabad

146
State of Industry Report 2015
TABLE 41-EList of Generation Licensees (IPPs under Power Policy 1994)
S. No.
Name of Company and LocationInstalled Capacity
(MW)Fuel Type
Technology-wise Capacity (MW)
Technology Capacity
1*Fauji Kabirwala Power Company Limited, Khanewal, Punjab
170 Gas GT+ST 96+74
2* TNB Liberty Power Limited, Daharki, Sindh 235 Gas GT+ST 156+79
3*Habibullah Coastal Power Company (Pvt.) Limited, Sheikh Manda, Balochistan
140 Gas GT+ST 111+29
4*Uch Power Limited, Murad Jamali, Naseerabad, Balochistan
586 Gas GT+ST 390+196
5*Rousch (Pakistan) Power Limited, Sidhnai, Khanewal, Punjab
450 Gas GT+ST 304+146
6 Altern Energy Limited, Fateh Jang, Punjab 14 Gas GE 14
7* Kohinoor Energy Limited, Raiwind, Punjab 131 FO DE+ST 125+6
8Lal Pir Power (Pvt.) Limited, Mehmood Kot, Muzaffargarh, Punjab
362 FO ST 362
9Pak Gen. Power (Pvt.) Limited, Mehmood Kot, Muzaffargarh, Punjab
365 FO ST 365
10Saba Power Company Limited, Farooqabad, Sheikhupura, Punjab
136 FO ST 136
11The Hub Power Company Limited, Hub, Lasbela, Balochistan**
1292 FO ST 1292
12Southern Electric Power, Raiwind, Lahore, Punjab
117 RFO DE 117
13 Japan Power Generation, Raiwind, Punjab 135.6 RFO DE 135.6
14Gul Ahmed Energy (Pvt.) Limited, Karachi, Sindh
136.17 RFO DE 136.17
15 Tapal Energy (Pvt.) Limited, Karachi, Sindh 126 RFO DE 126
16*Kot Addu Power Company, Kot Addu, Muzaffargarh, Punjab**
1600Gas+FO +HSD
GT+ST 1021+579
17 Davis Energen (Pvt.) Limited, Jhang, Punjab 12.16 Gas GE 12.16* Combined Cycle technology is being used in these plants.** Prior to 1994 Power PolicySource: National Electric Power Regulatory Authority, Islamabad

147
State of Industry Report 2015
TABLE 41-FList of Generation Licensees (IPPs under Power Policy 2002)
S. No. Name of Company and Location
Installed Capacity
(MW)Fuel Type
Technology-wise Capacity (MW)
Technology Capacity
1 DHA Cogen Limited, Karachi, Sindh 94.00 Gas GT+ST 67+27
2 Star Power Generation Limited, Daharki, Sindh 133.515 Gas GT+ST 88.244+45.271
3 Orient Power Company (Pvt.) Limited, Balloki, Punjab 225.00 Gas GT+ST 151+74
4 Saif Power Limited, Sahiwal, Punjab 225.00 Gas+HSD GT+ST 152+73
5 Sapphire Electric Power Company Limited, Sheikhupura, Punjab 235.00 Gas+HSD GT+ST 152+83
6 Attock Gen Limited, Rawalpindi, Punjab 165.285 FO+HSD DG+ST 153.275+12.01
7 Halmore Power Generation Company (Pvt.) Limited, Bhikki, Punjab 225.00 Gas+HSD GT+ST 150+75
8 Foundation Power Company (Daharki) Limited, Daharki, Sindh 179.05 Gas+HSD GT+ST 114.9+64.15
9 Atlas Power (Pvt.) Limited, Sheikhupura, Punjab 224.35 RFO+LDO RE+ST 207.9+16.45
10 Gujranwala Energy Limited, Gujranwala, Punjab 201.451 HSFO+HSD RE+ST 187.836+13.615
11 Eastern Power Company Limited, Pasroor, Punjab 152.475 FO+HSD RE+ST 143.975+8.5
12 Engro Power Gen. Qadirpur Limited, Qadirpur, Sindh 226.52 Gas+HSD GT+ST 127+100
13 Nishat Chunian Power Limited, Kasur, Punjab 202.179 RFO+HSD RE+ST 187.836+14.343
14 Nishat Power Limited, Kasur, Punjab 202.179 RFO+HSD RE+ST 187.836+14.343
15 Intergen (Pvt.) Limited, Lachi, Kohat, Khyber Pakhtunkhwa 165.285 HSFO+HSD RE+ST 153.684+11.60
16 The Hub Power Company Limited (Narowal Project), Narowal, Punjab 224.79 RFO+LDO RE+ST 207.9+16.89
17 Green Electric (Pvt.) Limited, Dadu, Sindh 188.00 Gas+HSD GT+ST 126+62
18 Liberty Power Tech Limited, Faisalabad, Punjab 202.179 RFO+HSD RE+ST 187.836+14.343
19 Grange Power Limited, Pakpattan, Punjab 163.353 Gas GT+ST 109+54.353
20 First Tri-Star Modaraba, Karachi, Sindh 110.00 Gas+HSD GT+ST 80+30
21 Uch-II Power (Pvt.) Limited, Naseerabad, Balochistan 404.00 Gas GT+ST 267.54+136.46
22 Radian Energy Power Generation Company (Pvt.) Limited, Faisalabad, Punjab 164.368 RFO+LFO RE+ST 153.684+10.684
23 Engro Powergen Thar (Pvt.) Limited, Tharparker, Sindh 660.00 Indigenous
Coal ST+CB 2x330
24 CMEC Power (Pvt.) Limited, Jhelum Punjab 330.00 Indigenous Coal ST+CB 330.00
25 Huaneng Shandong Ruyi (Pakistan) Energy (Pvt.) Limited, Sahiwal, Punjab 1320.00 Imported
Coal ST+CB 1320.00
Note: Shaded area indicate licenses issued in 2014-15.Source: National Electric Power Regulatory Authority, Islamabad

148
State of Industry Report 2015
TABLE 41-GList of Transmission and Distribution Licensees
S. No.
CompanyNumber of Consumers (as on 30th June, 2015)
Date of Licence Issued
Licence Valid Until
Transmission Licence Granted to Public Companies
1National Transmission and Dispatch Company Limited
--- 31-12-2002 30-12-2032
Transmission Licence Granted to Private Companies
1 K-Electric Limited --- 11-06-2010 10-06-2030
Distribution Licence Granted to Public Sector Companies
1Peshawar Electric Supply Company Limited
2,956,567 30-04-2002 29-04-2022
2Tribal Areas Electricity Supply Company Limited
441,562 12-08-2013 11-08-2033
3Islamabad Electric Supply Company Limited
2,462,167 02-11-2001 01-11-2021
4Gujranwala Electric Power Company Limited
2,923,493 23-04-2002 22-04-2022
5 Lahore Electric Supply Company Limited 3,909,862 01-04-2002 31-03-2022
6Faisalabad Electric Supply Company Limited
3,445,357 02-03-2002 01-03-2022
7 Multan Electric Power Company Limited 5,116,072 25-04-2002 24-04-2022
8Hyderabad Electric Supply Company Limited
976,888 23-04-2002 22-04-2022
9 Sukkur Electric Supply Company Limited 722,392 18-08-2011 17-08-2031
10 Quetta Electric Supply Company Limited 564,887 30-04-2002 29-04-2022
Distribution Licence Granted to Private Sector Companies
1 K-Electric Limited 2,158,290 21-07-2003 20-07-2023
2 Bahria Town (Pvt.) Limited 16,879 24-11-2010 23-11-2030
Distribution Licence Granted to Small Power Producers
1 Monnoo Energy Limited 3 20-10-2006 07-12-2016
2 Sapphire Power Generation Limited 8 20-10-2006 26-08-2016
3 Sitara Energy Limited 16 20-10-2006 01-01-2017
4 Gulistan Power Gen. Limited 4 20-10-2006 15-11-2016
5 Mahmood Textile Mills Limited 1 14-11-2006 21-10-2016
6 Kohinoor Mills Limited 1 14-11-2006 07-12-2016
7 Quetta Textile Mills Limited 3 14-11-2006 31-01-2017
8 Ibrahim Fibers (Pvt.) Limited 3 22-07-2008 30-12-2021
9 Crescent Powertec Limited 3 18-12-2008 21-10-2016
Distribution Licence Granted to Captive Power Producers
1 Engro Chemical Pakistan Limited Self Consumption 22-07-2009 21-07-2029Source: National Electric Power Regulatory Authority, Islamabad

12 ELECTRICITY TRANSMISSION


151
State of Industry Report 2015
12. ELECTRICITY TRANSMISSION
12.1 GeneralIn Pakistan, there are two companies which are, presently engaged, in the business of electric power transmission. One is National Transmission and Dispatch Company Limited and the other is K-Electric Limited. NTDC is the National Grid Company of Pakistan and is, exclusively, responsible for electric power transmission in whole country except for the area served by K-Electric. NTDC is a public sector company and came into existence as a result of restructuring of WAPDA in 1998 and then has succeeded in obtaining a transmission licence by NEPRA in 2002. NTDC is responsible for overall reliability, planning and coordination of the electricity in Pakistan except the area under K-Electric. At present, NTDC owns a network of 500 kV, 220 kV and some 132 kV (links) transmission lines and grid stations in its network.
Besides NTDC, the other company which is engaged in electric power transmission business of Pakistan is K-Electric. K-Electric is a vertically integrated company operating in private sector. Earlier the company was in public sector and responsible for generation, transmission and distribution of electric power in its area. Later-on, K-Electric was privatized as a single vertically integrated electric power utility. K-Electric, at present, has three separate licenses; one for their generation businesses, second is for the distribution of electricity in its designated area and third is for their transmission network. The transmission network of K-Electric is connected to the national grid of the country by 220 kV and 132 kV links.
The statistics of electricity imported and exported by NTDC for the years 2010-11 to 2014-15 is shown in following table.
TABLE 42Electricity Import and Export by NTDC (GWh)
Country/Agency 2010-11 2011-12 2012-13 2013-14 2014-15
Electricity Import
Iran 269 296 375 419 443
KEL 26 0 0 0 0
Total Electricity Imported 295 296 375 419 443
Electricity Export
KEL 5,449 5,684 5,463 5,441 5,427
Any other Country/Region 10 43 0 0 0
Total Electricity Exported 5,459 5,727 5,463 5,441 5,427
Source: NTDC
12.2 Transmission Lines and Grid Stations with NTDCThe integrated transmission system of NTDC comprises of 500 kV and 220 kV transmission lines and grid stations.Thestatusoftransmissionlinesandgridstations,attheendoffiscalyearsfrom2011to2015,ownedand operated by NTDC is mentioned in following table.

152
State of Industry Report 2015
TABLE 43Transmission Lines and Grid Stations with NTDC
A: Transmission Lines
As on 30th June
500 kV 220 kV Total Transmission Lines and No. of Circuits
No. of Circuits Total km No. of Circuits Total km No. of Circuits Total km
2011 30 5,078 114 7,427 144 12,505
2012 30 5,078 121 7,948 151 13,026
2013 30 5,144 124 8,358 154 13,502
2014 30 5,183 124 9,104 154 14,287
2015 30 5,197 124 9,814 154 15,011
B: Grid Stations
As on 30th June
500/220 kV 220/132 kV Total No. of Grid Stations and MVA Capacity
No. of Grid Station MVA Capacity No. of Grid
StationMVA
CapacityTotal No. of Grid Station
Total MVA Capacity
2011 12 14,850 27 16,494 39 31,344
2012 12 14,850 29 18,044 41 32,894
2013 12 15,750 29 18,231 41 33,981
2014 13 17,400 35 21,030 48 38,430
2015 13 18,624 37 24,063 50 42,687 Source: NTDC
12.3 Transmission LossesWhen power is transmitted through power carrier lines, some power is “lost” as dissipated heat, during transmission. Technically it is not possible to eliminate such losses however such losses can be reduced by transmitting electric power to higher voltages. The history of transmission losses of NTDC system for the years 2010-11 to 2014-15 are mentioned in following table.
-
1,000
2,000
3,000
4,000
5,000
6,000
2010-11 2011-12 2012-13 2013-14 2014-15
Figure 42: Electricity Import and Export by NTDC (GWh)
Total Electricity Imported Total Electricity Exported

153
State of Industry Report 2015
TABLE 44Unit Received, Delivered and Transmission Losses in NTDC System (GWh)
Unit 2010-11 2011-12 2012-13 2013-14 2014-15
Unit Received by NTDC GWh 90,575.00 88,987.00 87,080.00 95,566.00 97,474.00
Unit Delivered by NTDC GWh 87,835.00 86,479.00 84,424.00 92,868.00 94,909.00
Unit Losses (Transmission)
GWh 2,740.00 2,508.00 2,656.00 2,698.00 2,565.00
% 3.03 2.82 3.05 2.82 2.63 Source: NTDC
12.4 Utilization of Transmission Lines and Power TransformersAppropriate utilization of transmission lines and power transformers in any electric power system is important andhasaverysignificantimpactbothtechnicallyaswellasfinancially.Thepositionofutilizationoftransmissionlines in the NTDC’s network is mentioned in following table.
TABLE 45Utilization of Transmission Lines and Power Transformers in NTDC System
A: Loading Status of Transmission Lines 2010-11 2011-12 2012-13 2013-14 2014-15
Overloaded Transmission Lines/Circuits (Nos.)
500 kV 0 0 0 0 2220 kV 3 23 35 25 32
Underutilized Transmission Lines/Circuits (Nos.)
500 kV 4 34 34 34 30220 kV 25 85 78 95 74
B: Loading Status of Power Transformers 2010-11 2011-12 2012-13 2013-14 2014-15
Overloaded Power Transformers (Nos.)500 kV 7 5 4 5 5220 kV 25 58 56 63 47
Underutilized Power Transformers (Nos.)
500 kV 6 29 30 26 22220 kV 23 33 54 55 43
Source: NTDC
TABLE 46Transmission Lines Tripping in PEPCO and K-Electric System
PEPCO System
YearPlanned Outages Forced Outages500 kV 220 kV 500 kV 220 kV
2010-11No. of Outages 145 528 113 268Total duration in minutes 62066 219749 227048 428970Maximum duration of any single outage (Minutes) 6501 12383 6501 111825
2011-12No. of Outages 176 499 47 267Total duration in minutes 76684 233631 15836 111566Maximum duration of any single outage (Minutes) 3470 9921 7718 16045
2012-13No. of Outages 346 679 78 248Total duration in minutes 152515 257849 91819 263021Maximum duration of any single outage (Minutes) 3503 4983 56334 26281
2013-14No. of Outages 344 665 90 265Total duration in minutes 165426 264682 113460 101493Maximum duration of any single outage (Minutes) 14584 9566 41771 37339
2014-15No. of Outages 469 777 76 250Total duration in minutes 267263 230783 85656 727395Maximum duration of any single outage (Minutes) 3729 1990 12347 244003
Continued.....

154
State of Industry Report 2015
KEL System
YearPlanned Outages Forced Outages220 kV 132 kV 220 kV 132 kV
2010-11No. of Outages 263 666 60 519Total duration in minutes 11898 252539 16275 149411Maximum duration of any single outage (Minutes) 5672 n.p. 2853 n.p.
2011-12No. of Outages 259 786 17 519Total duration in minutes 113242 275553 2672 154545Maximum duration of any single outage (Minutes) 6177 3240 613 29545
2012-13No. of Outages 269 688 87 412Total duration in minutes 104550 234084 34298 76641Maximum duration of any single outage (Minutes) 6186 10910 16885 2245
2013-14No. of Outages 252 660 79 359Total duration in minutes 99767 219884 21423 85754Maximum duration of any single outage (Minutes) 1266 1081 1807 4368
2014-15No. of Outages n.p. 12 n.p. 39Total duration in minutes n.p. 3662 n.p. 5190Maximum duration of any single outage (Minutes) n.p. 849 n.p. 631
Source: NTDC / KEL
12.5 Investment Plan - NTDC SystemBeing National Grid Company of the country, NTDC is solely responsible for overall reliability, planning and coordination of the electricity transmission in Pakistan except, the area under K-Electric. Further, NTDC is solely responsible to provide interconnection arrangement to evacuate power from up-coming power projects in the country. To discharge its responsibility NTDC has prepared an investment plan for improvement of its transmission network and grid stations. Table shows that Grid Station and Transmission Expansion Plans of NTDC.
TABLE 47Grid Station Expansion Plan of NTDC
Period of Report
500/220 kV Grids 220/132 kV Grids
Nos. MVA Capacity
Expected COD
*Estimated Cost
(Rs. Million)Nos. MVA
CapacityExpected
COD
Estimated Cost
(Rs. Million)
New Grid Station
2015-16 3 3750 2016-17 20,399 8 5750 2016-17 26,233
2016-17 1 1500 2019-20 3,500 - - - -
Extension
2015-16 1 430 2016-17 697 - - - -
Addition/Reinforcement of Transformers at Overloaded Grid Stations
2015-16 1 0 2016-17 1,413 - - - -
2016-17 - - - - - - - -
2017-18 - - - - 6 3000 2019-20 16,400* The cost of 500/220 kV Grid Stations also include the cost of 220/132 kV Transformers.Source: NTDC

155
State of Industry Report 2015
TABLE 48Power Sector Investment Plan for NTDC Transmission Lines (as per approved PC-I)
S. No.
Name of ProjectTransmission Lines
Capacity (MVA)
Expected Completion Date
Estimated Cost
(Million Rs.)Voltage
Level (kV)Line Length
(km)
1 T.T. Singh 220 2 750 2015 1,759
2 Rahim Yar Khan 500 60 1700 2015 4,936
3 Dera Murad Jamali 220 5 260 June, 2015 880
4 Gujrat 220 4 750 December, 2015 1,966
5 Ghazi Road 220 80 480 December, 2015 2,592
6 Chistian 220 65 500 December, 2015 2,633
7 SVC at NKLP --- -- 450 December, 2015 2,087
8 Lahore 500 130 1500 December, 2015 12,664
9 Quetta --- -- 450 December, 2015 2,087
10 Shikarpur 500 84 1200 December, 2015 8,085
11 Nowshehra 220 10 750 2015-16 1,876
12 Lalian 220 8 750 2015-16 1,581
13 Mansehra 220 1 50 2015-16 905
14 Dera Ismail Khan 220 100 500 2015-16 3,744
15 Augmentation of Existing Grid Stations:
(i) Rawat 500 - 750
December, 2015 3900
(ii) Sheikh Muhammadi 220 - 1000
(iii) Burhan 220 - 1000
(iv) Bund Road 220 - 1000
(v) Mardan 220 - 500
(vi) Bahawalpur 220 - 500
(vii) Quetta Industrial 220 - 500Source: NTDC
TABLE 49Interconnection Arrangement to Evacuate Power from up-coming
(Public and Private Sector) Power Projects
S. No.
Name of Power Project
Plant Capacity
(MW)
Expected COD Proposed Transmission Scheme
1
Power Dispersal from Chashma Nuclear Power Project (C3 and C4)
2x340 2015-16
220 kV Chashma Nuclear - Bannu D/C T/L (125 km)
220 kV D/C T/L for in/out of existing C1 and C2 at C3 and C4 (2 km)
Extension at 220 kV Bannu
2 Power Dispersal from 747 CCPP at Guddu 747 2015-16
500 kV Guddu-Muzaffargarh S/C T/L (256 km)
Two 500 kV T/L for in/out of 500 kV Guddu-Multan S/C T/L at 500 kV Muzaffargarh (10 km)
Extension at 500 kV Muzaffargarh
3 Power Dispersal from Uch-II 404 2015-16
220 kV Uch-II - Sibbi D/C T/L (125 km)
220 kV D/C T/L for in/out of 200 kV existing Uch-I to Shikarpur New S/C T/L at Uch-II (0.5 km)
Reconductoring of 220 kV T/L Uch-I to Uch-II (I km)
Extension at 220 kV Sibbi SubstationContinued.....

156
State of Industry Report 2015
S. No.
Name of Power Project
Plant Capacity
(MW)
Expected COD Proposed Transmission Scheme
4
3rd Circuit (for Power Evacuation from 2x660 MW Coal Fired PPs at Jamshoro and Dispersal of Wind Power)
2270 2015-16
500 kV Jamshoro-Moro-RYK S/C T/L (535 km)
500 kV Moro-Dadu S/C T/L (55 km)
500 kV Switching Station at Moro
Extension at 500 kV Jamshoro, Dadu and RYK Grid Stations
5
Power Dispersal from Neelum Jhelum, Azad Pattan and Karot Hydropower Projects
969+650+ 720=2339 2015-16
500 kV D/C T/L from Neelum Jhelum to Domali (145 km)
500 kV D/C T/L from Domali to 500 kV Gujranwala Grid Station (130 km)
Extension at 500 kV Gujranwala (two lines bays with 3x37 MVA Shunt Reactors)
500 kV D/C T/L for in/out of 500 kV Neelum Jhelum Gujranwala S/C at Azad Pattan (5 km)
500 kV D/C T/L for in/out of 500 kV Neelum Jhelum Gujranwala S/C at Karot (5 km)
6
Evacuation of Power from 1000 MW Quaid-e-Azam Solar Park at Lal-Suhanra
100 2014-15 Phase I: 132 kV D/C T/Ls (4 km)
300 2014-15 Phase II: 132 kV D/C T/Ls (52 km)
600 2015-16
Phase III: 220 kV Grid Station at Lal-Suhanra with 3x250 MVA, 220/132 kV transformers along with allied equipment and accessories
220 kV D/C T/L from 220 kV Lal-Suhanra to 220 kV Bahawalpur (40 km)
Three 132 kV D/C T/Ls on Rail Conductor form Solar Projects Sites to 220 kV Grid Station at Lal-Suhanra (8 km each)
7
Evacuation of Power from Wind Power Projects at Jhimpir and Gharo Wind Clusters
330 2015-16Phase I: 132 kV Jhimpir New Collector Substation
132 kV D/C T/Lines (107 km)
620 2016-17
Phase II: Upgradation of 132 kV Jhimpir Substation to 220 kV Substation (3x250 MVA)
220 kV Gas Insulated Substation (GIS) at Gharo (2x250 MVA)
220 kV D/C T/Lines (155 km)
132 kV D/C T/Lines (85 km)
Addition of 450 MVA, 500/220 kV T/F at 500 kV Jamshoro
500 2016-17 Phase III: 220 kV D/C Line (10 km)
8Power Dispersal from Thar Coal based Power Plant
1200 2016-17500 kV Thar - Matiari D/C T/L (250 km)
500 kV Switching Station at Matiari
9Evacuation of Power from 1200 MW LNG Based PP at Bhikki
1200 2016-17 In/Out of existing 500 kV Lahore-Gatti Singh Circuit at 500 kV Switchyard of Bhikki Power Plant (3 km)
10Evacuation of Power from 1200 MW LNG Based PP at Bhikki
1200 2016-17
500 kV Double Circuit T/L from Balloki Power Project to Lahore South Grid Station (40 km)
Addition of 1x750 MVA 500/220 kV Transformer along with allied equipment and two 500 kV line baysat 500 kV Lahore South Grid Station
11
Evacuation of Power from 1200 MW LNG Based PP at Jhnag (Haveli Bahadur Shah)
1200 2016-17
In/Out of 500 kV D/C T/L from Muzaffargarh-Gatti at HB Shah (3 km)
In/Out of 500 kV Multan-Gatti D/C T/L at HB Shah (25 km)
12Evacuation of Power from 1320 MW Bin Qasim Project
1320 2016-17 500 kV D/C T/L from Bin Qasim Power Plant to Matiari Switching Station (180 km)
Continued.....

157
State of Industry Report 2015
S. No.
Name of Power Project
Plant Capacity
(MW)
Expected COD Proposed Transmission Scheme
13Evacuation of Power from 1320 MW Hub Power Company Ltd.
11320 2016-17 500 kV D/C T/L from Hub Power Plant to Matiari Switching Station (220 km)
14
Evacuation of Power from 300 MW Coal Fired Power Plant at Pind Dadin Khan
300 2016-17 132 kV D/C T/L (80 km)
15
Evacuation of Power from 1320 MW Imported Coal Based Power Plant at Sahiwal
1320 2016-17 In/Out of Yousafwala-Lahore 500 kV D/C T/L at Sahiwal (0.5 km)
16Evacuation of Power from 147 MW Patrind HPP
147 2016-17 132 kV T/L (70 km)
17Evacuation of Power from Tarbela 4th Extension
1410 2016-17
Replacement of Existing Tarbela-Burhan D/C T/L (35.1 km)
Replacement of Existing 220 kV Tarbela-Burhan-ISPR D/C T/L (62.5 km)
In/Out of one Circuit of 220 kV Mansehra-ISPR D/C T/L (40 km)
18Evacuation of Power from Tarbela 5th Extension
1320 2017-18 500 kV D/C T/L (77 km)
19Evacuation of Power from Siddiqsons Limited
350 2018-19 500 kV D/C T/L from Siddiqsons to South 500 kV Substation (32 km)
20Evacuation of Power from Lucky Electric Power Company Ltd.
660 2018-19 500 kV D/C T/L for In/Out of Siddiqsons - South 500 kV Substation (32 km)
21 Evacuation of Power from Dasu HPP 2160 2019-20 500 kV D/C T/L (615 km)
22 Evacuation of Power from Suki Kinari HPP 840 2019-20 500 kV D/C T/L (615 km)
Source: NTDC
12.6 Transmission Lines and Grid Stations with K-ElectricThe K-Electric was a vertically integrated public limited company, which was responsible for generation, transmission and distribution of electric power in the area of Karachi City and its suburb. Later-on, in year 2005, it was privatized with same function of generation, transmission and distribution of electric power in its area under separate licenses. K-Electric system is connected to the national grid of the country by 220 kV and 132 kV links. The statistics and investment/expansion plans in respect of K-Electric transmission lines and grid stations are given in the following tables:

158
State of Industry Report 2015
TABLE 50Transmission Lines and Grid Stations with K-Electric
2010-11 2011-12 2012-13 2013-14 2014-15
Length of Transmission Lines in km
Overhead Lines
220 kV 321 321 323 323 323
132 kV 611 611 611 611 611
66 kV 149 149 149 149 149
Underground Lines
220 kV 17 17 15 15 15
132 kV 150 150 150 150 151
66 kV 0 0 0 0 0
Number of Grid Stations in KEL Transmission System
2010-11 2011-12 2012-13 2013-14 2014-15
No. MVA No. MVA No. MVA No. MVA No. MVA
KEL’s Owned Grid Stations
220 kV 7 3000 7 3000 7 3000 7 3000 7 3000
132 kV 50 n.p. 51 n.p. 52 4611 53 4679 54 4732
66 kV 3 n.p. 3 n.p. 3 60 3 60 3 69
Consumers Owned Grid Stations
220 kV 1 40 1 40 1 40 1 80 1 80
132 kV 5 n.a. 8 n.a. 9 n.a. 9 452 9 452
66 kV 0 0 0 0 0 0 0 0 0 0
Total No. of Grid Stations
66 3040 70 3040 72 7711 73 8271 74 8333
Source: KEL
TABLE 51Transmission/Sub-Transmission Losses in K-Electric System (GWh)
2010-11 2011-12 2012-13 2013-14 2014-15
Total Units Purchased by KEL 7,632.14 7,229.71 7,257.00 7,282.00 7,496.00
Total Units Generated by KEL (Gross)
7,826.27 8,029.00 8,567.00 8,709.00 9,319.00
Auxiliary Consumption in KEL Plant
591.62 636.00 665.00 658.00 704.00
Unit Sent Out – KEL 7,234.65 7,393.00 7,902.00 8,051.00 8,615.00
Units Available for Distribution 14,866.79 14,622.71 15,159.00 15,333.00 16,111.00
Units Sold 10,071.27 10,279.00 10,942.00 11,453.00 12,294.00
Energy Losses
T&D Losses (GWh) 4,795.52 4,343.71 4,217.00 3,880.00 3,817.00
Auxiliary Losses (%) 7.56 7.92 7.76 7.56 7.55
T&D Losses (%) 32.26 29.71 27.82 25.30 23.69Source: KEL

159
State of Industry Report 2015
TABLE 52
Amount Injected (in million Rs.) to Reinforce/ Expand 220 and 132 kV Transmission System of K-Electric
Description2013-14 2014-15
FC LC Total FC LC Total
Grid Stations - - 671.00 - - 1568.00
Transmission and SCADA
- - 405.00 - - 425.00
Reinforcement - - - - - -
Others - - 67.00 - - 30.00
Total - - 1143.00 - - 2023.00
Investment Plan in Transmission Line (220 and 132 kV) (in million US$) of K-Electric
Description2015-16 2016-17
FC LC Total FC LC Total
Grid Stations - - 37.60 - - 48.00
Transmission - - 60.70 - - 71.00
SCADA - - 9.70 - - 11.70
Reinforcement - - 18.20 - - 29.10
Total - - 126.20 - - 159.80FC: Foreign Currency converted into equivalent US$ to Euro (1 Euro=US$ 1.107) LC: Local Currency converted into equivalent US$ with current US$ to Rupee Rate (1 US$=PkRs. 102)Source: KEL
0 2000 4000 6000 8000 10000 12000 14000 16000 18000
2010-11
2011-12
2012-13
2013-14
2014-15
Figure 51. Units Available, Units Sold and T&D Losses (GWh)
Units Available for Distribution Units Sold T&D Losses (GWh)

160
State of Industry Report 2015
Table 53Loading Position of 500 kV Grid Stations of NTDC (2014-15)
Name of Grid Station
Name of NTDC Region and
Name of DISCO
No. of Power Transformer
Voltage Level (kV)
Capacity of Transformer
(MVA)
Loading Position (%)
Rawat Islamabad (IESCO/GEPCO)
T-1 500/220 450 76.21
T-2 500/220 450 76.21
T-3 500/220 450 76.21
Sheikh Muhammadi
Peshawar
Islamabad (TESCO/PESCO)
T-1 500/220 450 77.05
T-2 500/220 450 77.05
T-9 500/220 450 77.05
Nokhar Lahore (GEPCO)
T-1 500/220 600 55.24
T-2 500/220 600 55.24
GattiLahore
(FESCO/GEPCO/ LESCO/MEPCO)
T-1 500/220 450 84.67
T-2 500/220 450 86.03
T-3 500/220 450 82.22
T-4 500/220 450 82.22
Sheikhupura Lahore (LESCO)
T-1 500/220 600 81.59
T-2 500/220 600 81.59
T-3 500/220 600 81.59
T-4 500/220 600 81.59
Multan Multan (MEPCO)
T-1 500/220 450 72.99
T-2 500/220 450 72.99
Muzafargarh Multan (MEPCO)
T-1 500/220 600 41.27
T-2 500/220 600 39.37
Yousafwala Multan (MEPCO/LESCO)
T-1 500/220 600 61.59
T-2 500/220 600 61.59
D.G. Khan Multan (MEPCO)
T-1 500/220 600 Proper meters not installed
T-2 500/220 600 PTW
Dadu Hyderabad (HESCO/SEPCO)
T-2 500/220 450 51.65
T-4 500/220 450 49.11
GudduHyderabad
(SEPCO/QESCO/ MEPCO)
T-1 500/220 450 24.13
T-2 500/220 450 24.13
T-3 500/220 450 24.13
NKI Hyderabad (HESCO/K-EL)
T-1 500/220 600 62.22
T-2 500/220 600 62.22
Jamshoro Hyderabad (HESCO/K-EL)
T-1 500/220 450 45.72
T-2 500/220 450 45.72Source: NTDC

161
State of Industry Report 2015
Table 54Loading Position of 220 kV Grid Stations of NTDC (2014-15)
Name of Grid Station
Name of NTDC Region and
Name of DISCO
No. of Power Transformer
Voltage Level (kV)
Capacity of Transformer
(MVA)
Loading Position (%)
Burhan Islamabad (IESCO/LESCO)
T-1 220/132 160 91.43T-4 220/132 160 91.43T-2 220/132 160 80.00T-3 220/132 250 82.19
Bannu Islamabad (PESCO/TESCO)
T-1 220/132 160 81.43T-2 220/132 160 81.43T-5 220/132 160 60.00
Daud Khail Islamabad (IESCO/FESCO)
T-1 220/132 160 90.14T-2 220/132 160 90.14
Mardan Islamabad (PESCO)
T-1 220/132 250 97.72T-2 220/132 160 100.29T-3 220/132 160 88.71
Sangjani Islamabad (IESCO)
T-1 220/132 160 97.14T-2 220/132 160 97.14T-3 220/132 160 84.29
Shahi Bagh Islamabad (PESCO/TESCO)
T-1 220/132 160 81.86T-2 220/132 160 81.86T-3 220/132 160 81.86
T-4 220/132 160 Shifted for Repair
University Islamabad (IESCO)
T-1 220/132 250 85.39T-2 220/132 250 18.26
NKLP Lahore Lahore (LESCO)
T-1 220/132 250 102.28T-2 220/132 250 105.02T-3 220/132 250 105.02
Ravi Lahore Lahore (LESCO)
T-1 220/132 250 93.15T-2 220/132 250 76.71T-3 220/132 250 76.71
Sarfraz Nagar Lahore (LESCO)
T-1 220/132 160 92.86T-2 220/132 160 92.86T-3 220/132 160 92.86T-4 220/132 160 92.86
Sialkot Lahore (GEPCO)
T-1 220/132 160 75.71T-2 220/132 160 75.71T-3 220/132 160 75.71
Kala Shah Kaku
Lahore (GEPCO/LESCO)
T-1 220/132 160 92.86T-2 220/132 160 92.86T-3 220/132 160 92.86
Band Road Lahore (LESCO)
T-1 220/132 250 65.30T-2 220/132 250 74.89T-3 220/132 250 65.30T-4 220/132 250 74.89
Shalamar Lahore (LESCO)
T-1 220/132 160 90.00T-2 220/132 160 86.71T-3 220/132 160 86.71
Ghakkar Lahore (GEPCO)
T-1 220/132 160 94.29T-2 220/132 160 78.57T-3 220/132 160 102.86T-4 220/132 160 94.29
WAPDA Town Lahore(LESCO)
T-1 220/132 160 82.86T-2 220/132 160 82.86T-3 220/132 160 82.86
Continued.....

162
State of Industry Report 2015
Name of Grid Station
Name of NTDC Region and
Name of DISCO
No. of Power Transformer
Voltage Level (kV)
Capacity of Transformer
(MVA)
Loading Position (%)
GZR Lahore (LESCO) T-1 220/132 250 82.19
Jaranwala Lahore (FESCO)
T-1 220/132 160 91.14T-2 220/132 160 91.43T-3 220/132 160 88.29T-4 220/132 160 100.00
Ludewala Lahore (FESCO)
T-1 220/132 160 104.29T-2 220/132 160 104.29T-3 220/132 160 104.29
Nishatabad Lahore (FESCO)
T-4 220/132 60/63.5 92.20T-5 220/132 160 95.00
Sammundari Road
Lahore (FESCO)
T-1 220/132 160 91.43T-2 220/132 160 109.29T-3 220/132 160 109.29
Toba Take Singh
Lahore(FESCO) T-1 220/132 250 106.85
Bahawalpur Multan (MEPCO)
T-1 220/132 160 91.43T-2 220/132 250 95.16T-3 220/132 250 95.16
Vehari Multan (MEPCO)
T-1 220/132 160 101.43T-2 220/132 160 101.43T-3 220/132 160 102.86
Muzafargarh Multan (MEPCO)
T-1 220/132 160 57.14T-2 220/132 160 57.14
Okara Multan (LESCO)
T-1 220/132 250 61.19T-2 220/132 250
Not EnergizedT-3 220/132 250
Kasswal Multan (MEPCO)
T-1 220/132 160 Not EnergizedT-2 220/132 160 111.43
Hala Road Hyderabad (HESCO)
T-1 220/132 160 90.00T-2 220/132 160 90.00T-3 220/132 160 92.86
Quetta Industrial
Hyderabad (QESCO)
T-1 220/132 160 74.29T-2 220/132 160 74.29T-3 220/132 160 71.43
Sibbi Hyderabad (QESCO)
T-1 220/132 160 77.43T-2 220/132 160 77.43
Shikarpur Hyderabad (SEPCO)
T-1 220/132 160 94.29T-2 220/132 160 91.43T-3 220/132 160 91.43
TMK Road Hyderabad (HESCO)
T-1 220/132 160 98.57T-2 220/132 160 97.14
Daharki Hyderabad (SEPCO)
T-1 220/132 250 56.62T-2 220/132 160 52.86
Rohri Hyderabad (SEPCO)
T-1 220/132 250 77.63T-2 220/132 250 29.22
Khuzdar Hyderabad (QESCO)
T-1 220/132 160 97.14T-2 220/132 160 48.57
Loralai Hyderabad (QESCO)
T-1 220/132 250 Not EnergizedT-2 220/132 250 56.62
Source: NTDC

13ELECTRICITY DISTRIBUTION


165
State of Industry Report 2015
13. ELECTRICITY DISTRIBUTION
13.1 GeneralPresently there are ten distribution companies in public sector, which are distributing electric power to end-consumers in Pakistan except the area served by K-Electric. In the area of Karachi City and its suburbs, K-Electric is solely responsible for distributing of electric power to end-consumers under a separate distribution licence granted by NEPRA. In addition to ten public sector Distribution Companies and two private sector Distribution Companies, NEPRA so far has granted nine distribution licenses to Small Power Producers and one distribution licence to Captive Power Producer for supply of electric power to designated BPCs. The List of distribution licence granted by NEPRA is given in following table.
TABLE 55List of Licenses Issued to Distribution Companies
S. No.
CompanyNumber of
Consumers (as on 30th June, 2015)
Date of Licence Issued
Licence Valid Until
Distribution Companies working in Public Sector
1 Peshawar Electric Supply Company Limited 2,956,567 30-04-2002 29-04-2022
2Tribal Areas Electricity Supply Company Limited
441,562 12-08-2013 11-08-2033
3 Islamabad Electric Supply Company Limited 2,462,167 02-11-2001 01-11-2021
4 Gujranwala Electric Power Company Limited 2,923,493 23-04-2002 22-04-2022
5 Lahore Electric Supply Company Limited 3,909,862 01-04-2002 31-03-2022
6 Faisalabad Electric Supply Company Limited 3,445,357 02-03-2002 01-03-2022
7 Multan Electric Power Company Limited 5,116,072 25-04-2002 24-04-2022
8 Hyderabad Electric Supply Company Limited 976,888 23-04-2002 22-04-2022
9 Sukkur Electric Supply Company Limited 722,392 18-08-2011 17-08-2031
10 Quetta Electric Supply Company Limited 564,887 30-04-2002 29-04-2022
Distribution Companies working in Private Sector
1 K-Electric Limited 2,158,290 21-07-2003 20-07-2023
2 Bahria Town (Pvt.) Limited 16,879 24-11-2010 23-11-2030
Distribution Licence Granted to Small Power Producers
1 Monnoo Energy Limited 3 20-10-2006 07-12-2016
2 Sapphire Power Generation Limited 8 20-10-2006 26-08-2016
3 Sitara Energy Limited 16 20-10-2006 01-01-2017
4 Gulistan Power Generation Limited 4 20-10-2006 15-11-2016
5 Mahmood Textile Mills Limited 1 14-11-2006 21-10-2016
6 Kohinoor Mills Limited 1 14-11-2006 07-12-2016
7 Quetta Textile Mills Limited 3 14-11-2006 31-01-2017
8 Ibrahim Fibers (Pvt.) Limited 3 22-07-2008 30-12-2021
9 Crescent Powertec Limited 3 18-12-2008 21-10-2016
Distribution Licence Granted to Captive Power Producers
1 Engro Chemical Pakistan Limited Self Consumption 22-07-2009 21-07-2029Source: National Electric Power Regulatory Authority
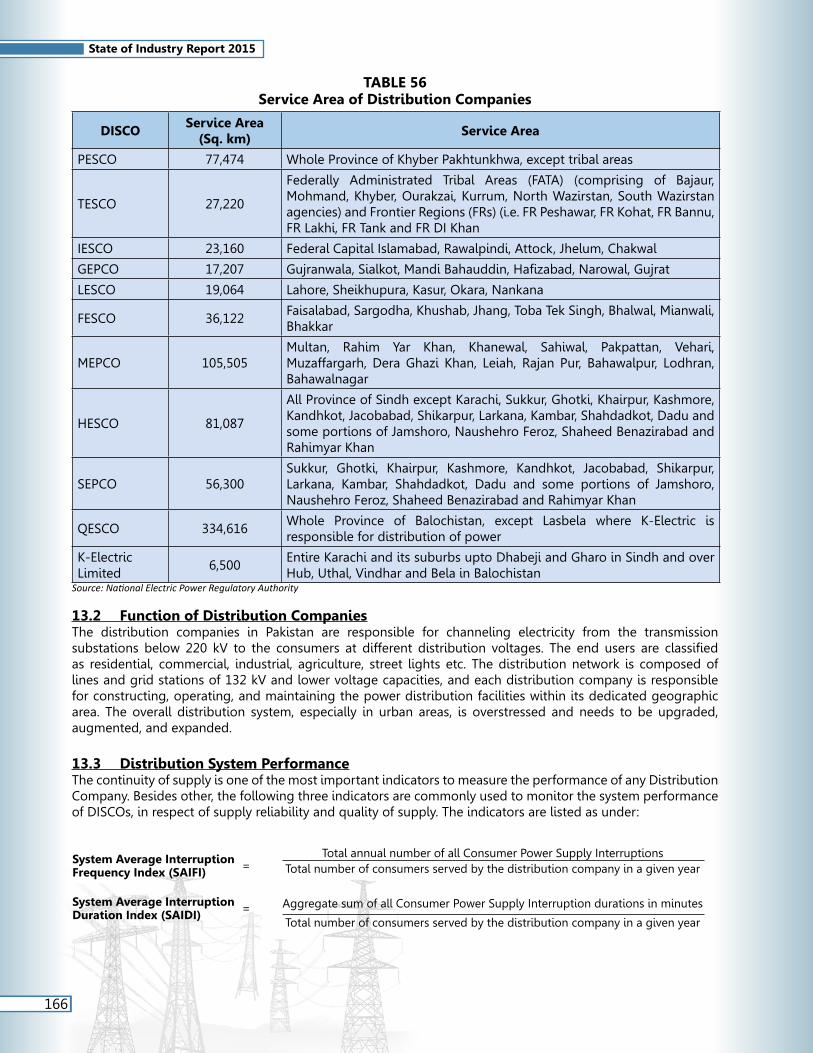
166
State of Industry Report 2015
TABLE 56Service Area of Distribution Companies
DISCOService Area
(Sq. km)Service Area
PESCO 77,474 Whole Province of Khyber Pakhtunkhwa, except tribal areas
TESCO 27,220
Federally Administrated Tribal Areas (FATA) (comprising of Bajaur, Mohmand, Khyber, Ourakzai, Kurrum, North Wazirstan, South Wazirstan agencies) and Frontier Regions (FRs) (i.e. FR Peshawar, FR Kohat, FR Bannu, FR Lakhi, FR Tank and FR DI Khan
IESCO 23,160 Federal Capital Islamabad, Rawalpindi, Attock, Jhelum, Chakwal
GEPCO 17,207 Gujranwala,Sialkot,MandiBahauddin,Hafizabad,Narowal,Gujrat
LESCO 19,064 Lahore, Sheikhupura, Kasur, Okara, Nankana
FESCO 36,122 Faisalabad, Sargodha, Khushab, Jhang, Toba Tek Singh, Bhalwal, Mianwali, Bhakkar
MEPCO 105,505 Multan, Rahim Yar Khan, Khanewal, Sahiwal, Pakpattan, Vehari, Muzaffargarh, Dera Ghazi Khan, Leiah, Rajan Pur, Bahawalpur, Lodhran, Bahawalnagar
HESCO 81,087
All Province of Sindh except Karachi, Sukkur, Ghotki, Khairpur, Kashmore, Kandhkot, Jacobabad, Shikarpur, Larkana, Kambar, Shahdadkot, Dadu and some portions of Jamshoro, Naushehro Feroz, Shaheed Benazirabad and Rahimyar Khan
SEPCO 56,300 Sukkur, Ghotki, Khairpur, Kashmore, Kandhkot, Jacobabad, Shikarpur, Larkana, Kambar, Shahdadkot, Dadu and some portions of Jamshoro, Naushehro Feroz, Shaheed Benazirabad and Rahimyar Khan
QESCO 334,616 Whole Province of Balochistan, except Lasbela where K-Electric is responsible for distribution of power
K-Electric Limited
6,500 Entire Karachi and its suburbs upto Dhabeji and Gharo in Sindh and over Hub, Uthal, Vindhar and Bela in Balochistan
Source: National Electric Power Regulatory Authority
13.2 Function of Distribution CompaniesThe distribution companies in Pakistan are responsible for channeling electricity from the transmission substations below 220 kV to the consumers at different distribution voltages. The end users are classifiedas residential, commercial, industrial, agriculture, street lights etc. The distribution network is composed of lines and grid stations of 132 kV and lower voltage capacities, and each distribution company is responsible for constructing, operating, and maintaining the power distribution facilities within its dedicated geographic area. The overall distribution system, especially in urban areas, is overstressed and needs to be upgraded, augmented, and expanded.
13.3 Distribution System PerformanceThe continuity of supply is one of the most important indicators to measure the performance of any Distribution Company. Besides other, the following three indicators are commonly used to monitor the system performance of DISCOs, in respect of supply reliability and quality of supply. The indicators are listed as under:
System Average Interruption Frequency Index (SAIFI) =
Total annual number of all Consumer Power Supply InterruptionsTotal number of consumers served by the distribution company in a given year
System Average Interruption Duration Index (SAIDI) = Aggregate sum of all Consumer Power Supply Interruption durations in minutes
Total number of consumers served by the distribution company in a given year

167
State of Industry Report 2015
A comparison of SAIFI and SAIDI in respect of all DISCOs of the country, for the year 2010-11 to 2014-15, has been carried out and is included in this report. Pursuant to NEPRA, Performance Standards (Distribution) Rules, 2005 a Distribution Company shall ensure that the SAIFI and SAIDI does not exceed thirteen (13) and fourteen (14) in numbers and minutes, respectively.
TABLE 57Comparison of SAIFI and SAIDI of all Distribution Companies
DISCO 2010-11 2011-12 2012-13 2013-14 2014-15
Total Number of Consumers
(Nos.)
PESCO 2459330 2542747 2530655 2588473 2618779TESCO - - - 390723 384031IESCO 2094299 2206006 2260203 2342241 2423317GEPCO 2500268 2608374 2568859 2736688 2812997LESCO 2959110 3052299 3164986 3286668 3432160FESCO 2996549 3278533 3214275 3288932 2445562MEPCO 4095946 4290373 4535062 4693061 4989020HESCO 1539637 883335 915805 952296 976923SEPCO - 643197 687045 711727 721087QESCO 487620 503158 516327 535145 561280
K-EL 2370738 2388579 2385100 2358357 2317947BTPL 6756 8845 11838 15636 16879Total 21510253 22405446 22790155 23899947 23699982
Total Annual Number of Consumer
Power Supply Interruptions
PESCO 587275327 821123054 864386357 819134634 825967981TESCO - - - 49458 36879IESCO 857621 1305999 1391792 120949 86134GEPCO 63230504 72435349 69726399 28804296 29294902LESCO 116264697 89713568 160058187 256478823 180162181FESCO 115742546 194766923 182579281 116444302 160355190MEPCO 759867592 795001382 678829469 945813581 886095371HESCO 2311912695 680501756 668882208 218961910 197662324SEPCO - 219610030 2870251802 178978331 164384407QESCO 80445210 78537463 79422810 77573236 63193661
K-EL 82737192 77612818 74576586 58293812 51478645BTPL 8291 116 40510 105 81
Aggregate sum of all Consumer Power Supply Interruptions (Duration in
Minutes)
PESCO 48044522020 71677299240 74832413870 72339031400 73155560030TESCO - - - 819028 508279IESCO 47380746 82736301 78663777 3886042 2411513GEPCO 792887713 760565671 676186878 35971518 37129560LESCO 10266206977 7968880969 14608740454 15643260013 10331785985FESCO 63649624760 4331500066 4019965724 3739602394 9243009119MEPCO 65110006031 689654325 58111790700 83088717833 78216126150HESCO 1594389070 21191991580 19419312750 15883027060 10397137520SEPCO - 11727318040 3297761640 1738562122 1544108334QESCO 6543784521 6445823719 6523770172 6351140612 4213425000
K-EL 5195969221 4438509649 4270360371 3526349005 3083517500BTPL 339306 14658 81454 12303 12107Total 201245110365 129314294218 185839047790 202350379330 190224731097
System Average Interruption Frequency
Index (SAIFI), Power Supply
Interruptions per consumer per year
PESCO 238.79 323.00 341.57 316.45 315.40TESCO - - - 0.12 0.10IESCO 0.41 0.59 0.62 0.05 0.04GEPCO 25.29 27.77 27.14 10.53 10.41LESCO 39.29 29.39 50.57 78.04 52.49FESCO 38.63 59.39 56.80 35.40 46.54MEPCO 185.52 185.29 149.68 201.53 177.61HESCO 1501.62 770.28 730.38 229.93 202.33SEPCO - 341.43 4177.68 251.48 227.96QESCO 164.98 156.08 153.82 144.95 112.58
K-EL 34.90 32.49 31.27 24.71 22.21BTPL 1.23 0.01 3.42 0.006 0.0095
System Average Interruption
Duration Index (SAIDI), Power Supply Interruptions
Durations
PESCO 19535.60 28189.00 29570.37 27946.60 27934.98TESCO - - - 2.09 1.32IESCO 22.60 37.49 34.80 1.66 0.10GEPCO 317.10 291.58 263.22 13.14 13.20LESCO 3469.40 2610.78 4615.74 4759.61 3010.29FESCO 21241.00 1320.98 1250.66 1137.02 2682.58MEPCO 15896.20 16073.48 12813.89 17704.58 15677.65HESCO 1035.60 23990.80 21204.64 16678.66 10642.74SEPCO - 18233.00 4799.92 2442.73 2141.36QESCO 13419.80 12810.68 12634.96 11868.07 7506.81
K-EL 2191.70 1857.97 1790.43 1495.25 1330.30BTPL 50.20 1.60 6.90 0.78 1.43
Source: Distribution Companies / NEPRA

168
State of Industry Report 2015
0
500
1000
1500
2000
2500
3000
3500
4000
4500
System Average Interruption Frequency IndexPower Supply Interruptions per Consumer per Year
2010-11 2011-12 2012-13 2013-14 2014-15
0.00
5000.00
10000.00
15000.00
20000.00
25000.00
30000.00
System Average Interruption Duration IndexPower Supply Interruptions Durations
2010-11 2011-12 2012-13 2013-14 2014-15

169
State of Industry Report 2015
TABLE 58Peak Demand of Distribution Companies (MW)
DISCO 2010-11 2011-12 2012-13 2013-14 2014-15
PESCO 2787 3271 2946 2746 2798
Peak Demand Growth Rate over Last Year -3.83 17.37 -9.94 -6.79 1.89
TESCO 895 912 824 653 560
Peak Demand Growth Rate over Last Year 13.72 1.90 -9.65 -20.75 -14.24
IESCO 2087 2095 2325 2565 2347
Peak Demand Growth Rate over Last Year 43.24 0.38 10.98 10.32 -8.50
GEPCO 1870 1994 2029 2190 2386
Peak Demand Growth Rate over Last Year 3.14 6.63 1.76 7.93 8.95
LESCO 4006 4062 4787 4588 5021
Peak Demand Growth Rate over Last Year 2.30 1.40 17.85 -4.16 9.44
FESCO 2538 2812 2747 2959 3091
Peak Demand Growth Rate over Last Year 10.44 10.80 -2.31 7.72 4.46
MEPCO 2949 3022 3360 3570 2892
Peak Demand Growth Rate over Last Year -1.90 2.48 11.18 6.25 -18.99
HESCO 1997 1166 1055 1216 1167
Peak Demand Growth Rate over Last Year 11.13 -41.61 -9.52 15.26 -4.03
SEPCO - 1183 1280 1288 1357
Peak Demand Growth Rate over Last Year - - 8.20 0.63 5.36
QESCO 1430 1480 1530 1650 1762
Peak Demand Growth Rate over Last Year 8.66 3.50 3.38 7.84 6.79
K-Electric Limited 2591 2596 2778 2929 3056
Peak Demand Growth Rate over Last Year 1.13 0.19 7.01 5.44 4.34Source: Distribution Companies / KEL
TABLE 59 Category-wise Number of Consumers
DIS
CO
As on 30th June Domestic Commercial Industrial Agricultural Public
Lighting Bulk Supply Others Total
PES
CO
2011 2281849 264582 23460 26911 843 873 46 2598564
2012 2361837 271688 28156 23190 972 875 46 2686764
2013 2447438 279479 28965 23228 1013 877 46 2781046
2014 2523470 289155 29760 23441 1028 878 46 2867778
2015 2602181 298739 30344 23328 1040 888 47 2956567
TES
CO
2011 399342 28115 4119 8388 0 54 0 440018
2012 399395 28123 4050 8477 0 55 0 440100
2013 400598 28132 4035 8548 0 55 0 441368
2014 400600 28202 4081 8548 0 55 0 441486
2015 400613 28217 4101 8576 0 55 0 441562
IESC
O
2011 1809525 308524 12797 7466 1470 815 131 2140728
2012 1882619 318705 13337 7729 1506 831 138 2224865
2013 1952892 329166 13967 7933 1607 842 144 2306551
2014 2013135 340925 14534 8052 1659 957 40 2379302
2015 2085256 350989 15048 8192 1674 968 40 2462167Continued.....

170
State of Industry Report 2015
DIS
CO
As on 30th June Domestic Commercial Industrial Agricultural Public
Lighting Bulk Supply Others TotalG
EPC
O
2011 2181694 279974 52516 35415 459 131 14 2550203
2012 2258940 287249 54767 37277 477 135 15 2638860
2013 2341686 294733 56838 40645 496 139 15 2734552
2014 2419346 304496 57965 41583 507 141 15 2824053
2015 2506136 313573 60542 42563 514 149 16 2923493
LESC
O
2011 2702503 488264 67895 52025 1853 482 211 3313233
2012 2808748 498334 70341 53750 1909 488 211 3433781
2013 2936951 510604 72699 56140 2076 489 219 3579178
2014 3052697 524702 75006 57313 2154 491 223 3712586
2015 3228511 542738 77277 58382 2227 490 237 3909862
FESC
O
2011 2611050 308637 40591 34581 1380 196 101 2996536
2012 2712234 316577 42099 36692 1410 204 103 3109319
2013 2806555 324089 43836 38048 1432 209 104 3214273
2014 2870418 332675 45120 38921 1470 215 111 3288930
2015 3012756 344642 46602 39522 1500 218 117 3445357
MEP
CO
2011 3707866 403769 45020 67958 1266 401 108 4226388
2012 3888629 416928 46210 70438 1299 407 110 4424021
2013 4116231 433736 48190 74077 1338 411 112 4674095
2014 4278223 455088 49599 75484 1365 420 117 4860296
2015 4508987 476683 51135 77317 1402 428 120 5116072
HES
CO
2011 1243587 246182 23415 26723 876 784 89 1541656
2012 718422 138047 12960 15175 490 310 89 885493
2013 745501 140191 13407 15718 314 494 90 915715
2014 777599 143685 13834 16198 322 533 92 952263
2015 798206 146831 14311 16578 332 533 97 976888
SEP
CO
2012 552110 111196 11152 12169 393 479 58 687557
2013 561212 112391 11489 12295 409 488 18 698302
2014 572945 114072 11846 12408 410 497 18 712196
2015 581305 115574 12094 12484 412 504 19 722392
QES
CO
2011 384136 93177 3254 21136 239 210 4 502156
2012 394843 95830 3321 21390 240 220 4 515848
2013 403848 98291 3423 24483 242 229 4 530520
2014 414231 102089 3549 28630 243 234 4 548980
2015 423876 105721 3662 31139 247 238 4 564887
K-E
lect
ric
Lim
ited
2011 1632604 452667 20595 2233 57 1464 3 2109623
2012 1659766 456537 20537 2536 67 423 3 2139869
2013 1660768 452329 20462 2616 66 367 1 2136609
2014 1650034 438150 20464 2410 74 202 2 2111336
2015 1695782 439130 20613 2488 77 198 2 2158290
Tota
l in
PEP
CO
Sy
stem
2011 17321552 2421224 273067 280603 8386 3946 704 20309482
2012 17977777 2482677 286393 286287 8696 4004 774 21046608
2013 18712912 2550812 296849 301115 8927 4233 752 21875600
2014 19322664 2635089 305294 310578 9158 4421 666 22587870
2015 20147827 2723707 315116 318081 9348 4471 697 23519247Source: Distribution Companies / KEL
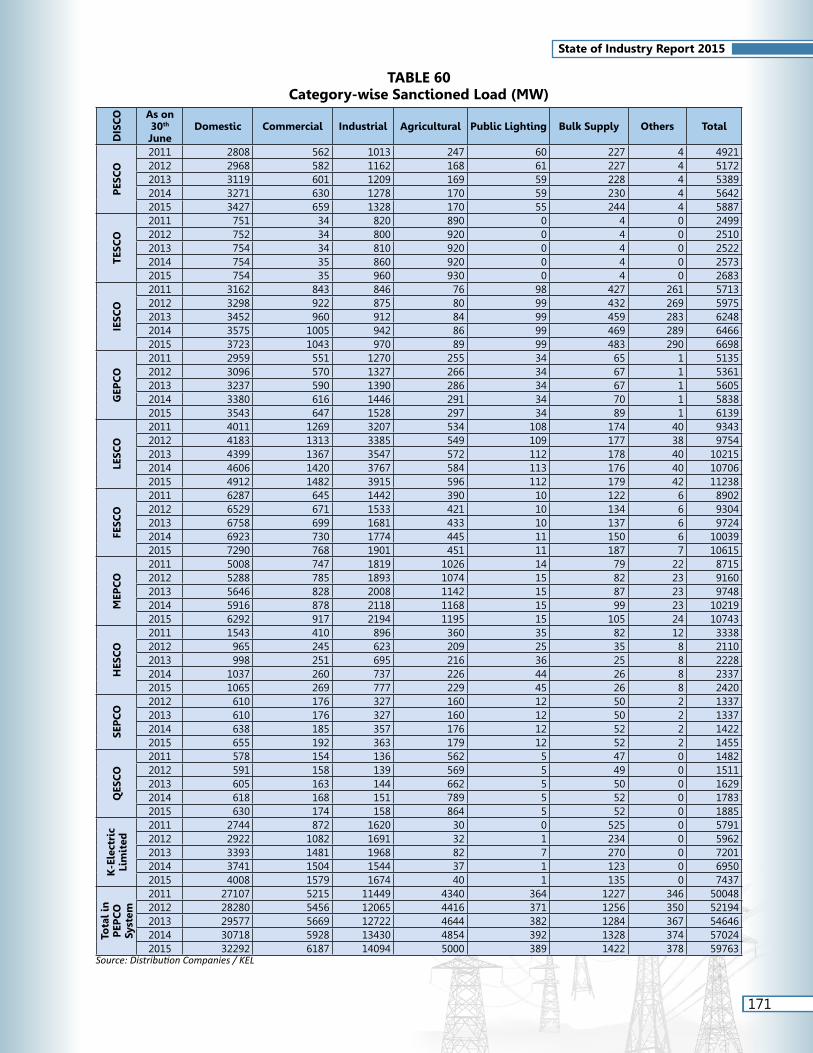
171
State of Industry Report 2015
TABLE 60Category-wise Sanctioned Load (MW)
DIS
CO As on
30th June
Domestic Commercial Industrial Agricultural Public Lighting Bulk Supply Others TotalP
ESC
O
2011 2808 562 1013 247 60 227 4 49212012 2968 582 1162 168 61 227 4 51722013 3119 601 1209 169 59 228 4 53892014 3271 630 1278 170 59 230 4 56422015 3427 659 1328 170 55 244 4 5887
TES
CO
2011 751 34 820 890 0 4 0 24992012 752 34 800 920 0 4 0 25102013 754 34 810 920 0 4 0 25222014 754 35 860 920 0 4 0 25732015 754 35 960 930 0 4 0 2683
IESC
O
2011 3162 843 846 76 98 427 261 57132012 3298 922 875 80 99 432 269 59752013 3452 960 912 84 99 459 283 62482014 3575 1005 942 86 99 469 289 64662015 3723 1043 970 89 99 483 290 6698
GEP
CO
2011 2959 551 1270 255 34 65 1 51352012 3096 570 1327 266 34 67 1 53612013 3237 590 1390 286 34 67 1 56052014 3380 616 1446 291 34 70 1 58382015 3543 647 1528 297 34 89 1 6139
LESC
O
2011 4011 1269 3207 534 108 174 40 93432012 4183 1313 3385 549 109 177 38 97542013 4399 1367 3547 572 112 178 40 102152014 4606 1420 3767 584 113 176 40 107062015 4912 1482 3915 596 112 179 42 11238
FESC
O
2011 6287 645 1442 390 10 122 6 89022012 6529 671 1533 421 10 134 6 93042013 6758 699 1681 433 10 137 6 97242014 6923 730 1774 445 11 150 6 100392015 7290 768 1901 451 11 187 7 10615
MEP
CO
2011 5008 747 1819 1026 14 79 22 87152012 5288 785 1893 1074 15 82 23 91602013 5646 828 2008 1142 15 87 23 97482014 5916 878 2118 1168 15 99 23 102192015 6292 917 2194 1195 15 105 24 10743
HES
CO
2011 1543 410 896 360 35 82 12 33382012 965 245 623 209 25 35 8 21102013 998 251 695 216 36 25 8 22282014 1037 260 737 226 44 26 8 23372015 1065 269 777 229 45 26 8 2420
SEP
CO
2012 610 176 327 160 12 50 2 13372013 610 176 327 160 12 50 2 13372014 638 185 357 176 12 52 2 14222015 655 192 363 179 12 52 2 1455
QES
CO
2011 578 154 136 562 5 47 0 14822012 591 158 139 569 5 49 0 15112013 605 163 144 662 5 50 0 16292014 618 168 151 789 5 52 0 17832015 630 174 158 864 5 52 0 1885
K-E
lect
ric
Lim
ited
2011 2744 872 1620 30 0 525 0 57912012 2922 1082 1691 32 1 234 0 59622013 3393 1481 1968 82 7 270 0 72012014 3741 1504 1544 37 1 123 0 69502015 4008 1579 1674 40 1 135 0 7437
Tota
l in
P
EPC
O
Syst
em
2011 27107 5215 11449 4340 364 1227 346 500482012 28280 5456 12065 4416 371 1256 350 521942013 29577 5669 12722 4644 382 1284 367 546462014 30718 5928 13430 4854 392 1328 374 570242015 32292 6187 14094 5000 389 1422 378 59763
Source: Distribution Companies / KEL

172
State of Industry Report 2015
TABLE 61Category-wise Electricity Sold (GWh)
DIS
CO
Year Domestic Commercial Industrial Agricultural Public Lighting
Bulk Supply Others Total
PES
CO
2010-11 4041 527 1562 291 21 533 2 69762011-12 4048 553 1777 142 21 518 2 70622012-13 4048 550 1889 111 20 541 2 71622013-14 4205 622 1989 100 14 539 3 74712014-15 4297 654 2020 93 14 520 2 7599
TES
CO
2010-11 1536 15 91 84 0 9 0 17352011-12 1295 14 78 72 0 7 0 14662012-13 1185 9 42 52 0 6 0 12942013-14 1225 10 63 59 0 7 0 13642014-15 973 6 63 52 0 7 0 1101
IESC
O
2010-11 3367 896 1561 90 93 636 1031 76742011-12 3294 869 1640 86 76 663 909 75372012-13 3410 862 1656 87 76 1668 4 77632013-14 3681 894 1644 93 78 1798 4 81922014-15 3704 844 1671 93 76 1755 4 8147
GEP
CO
2010-11 3632 429 1783 319 8 268 1 64392011-12 3444 396 1741 328 6 261 1 61782012-13 3281 361 1704 301 6 267 1 59202013-14 3860 399 1966 304 6 292 1 68282014-15 3987 405 2077 285 6 293 1 7055
LESC
O
2010-11 5900 1225 6036 1062 96 416 5 147412011-12 5657 1165 6120 1008 98 415 5 144672012-13 5566 1115 6062 1009 101 427 5 142852013-14 6278 1215 6773 1127 103 446 7 159482014-15 6550 1235 6888 1084 94 469 8 16328
FESC
O
2010-11 3923 499 3079 848 7 236 6 85962011-12 3790 468 3181 857 7 274 4 85802012-13 3787 455 3333 717 7 284 4 85862013-14 4256 483 3804 831 7 296 4 96822014-15 4426 492 3972 788 7 317 4 10006
MEP
CO
2010-11 4982 612 2302 2105 24 159 6 101892011-12 4817 605 2559 1885 19 158 6 100492012-13 4939 579 2628 1588 16 156 7 99132013-14 5518 640 2991 2090 17 173 8 114372014-15 6014 657 3071 1745 16 200 8 11711
HES
CO
2010-11 3128 386 1170 783 101 218 27 58142011-12 1717 230 773 519 56 83 3 33812012-13 1926 237 775 454 82 48 3 35242013-14 2074 260 770 446 85 47 3 36852014-15 2421 271 760 416 105 43 4 4020
SEP
CO
2011-12 1630 164 407 254 73 134 5 26662012-13 1670 168 417 257 74 139 2 27262013-14 1650 168 417 243 78 145 1 27022014-15 1621 181 424 242 71 141 2 2682
QES
CO
2010-11 464 94 114 3265 4 107 0 40482011-12 513 98 122 3260 8 86 0 40862012-13 510 98 136 2974 5 89 0 38122013-14 575 102 134 2837 2 94 0 37442014-15 573 109 140 3068 3 101 0 3994
K-E
lect
ric
Lim
ited
2010-11 4257 1043 3447 125 82 955 163 100722011-12 4564 1128 3342 134 118 806 188 102802012-13 5083 1507 3445 149 111 473 174 109422013-14 5489 1507 3568 160 106 427 197 114542014-15 6161 1589 3648 166 110 411 208 12293
Tota
l in
P
EPC
O
Syst
em
2010-11 30972 4682 17699 8847 353 2581 1078 662132011-12 30203 4562 18399 8410 363 2598 936 654722012-13 30321 4434 18641 7550 387 3623 27 649842013-14 33322 4793 20551 8129 390 3837 31 710532014-15 34566 4853 21085 7866 393 3846 33 72643
Source: Distribution Companies / KEL

173
State of Industry Report 2015
TABLE 62Total Units Purchased, Sold and Losses
DIS
CO
YearUnit Purchased (GWh)
Unit Sold (GWh)
Losses
Through NTDC Through CPPs, SPPs etc.
Total Unit Purchased GWh %age
PES
CO
2010-11 10760 486 11246 6976 4270 37.962011-12 10980 50 11030 7062 3968 35.982012-13 10814 78 10892 7162 3730 34.252013-14 11250 51 11301 7471 3829 33.892014-15 11657 0 11657 7599 4058 34.81
TES
CO
2010-11 2326 0 2326 1735 591 25.412011-12 2071 0 2071 1466 605 29.212012-13 1643 0 1643 1294 349 21.252013-14 1758 0 1758 1364 394 22.412014-15 1406 0 1406 1101 305 21.68
IESC
O
2010-11 8509 0 8509 7674 835 9.812011-12 8330 0 8330 7537 793 9.522012-13 8573 0 8573 7763 810 9.452013-14 9049 0 9049 8192 857 9.472014-15 8993 0 8993 8147 846 9.41
GEP
CO
2010-11 7316 0 7316 6439 877 11.992011-12 6959 0 6959 6178 782 11.232012-13 6633 0 6633 5920 713 10.752013-14 7671 0 7671 6828 844 11.002014-15 7902 0 7902 7055 847 10.72
LESC
O
2010-11 16995 0 16995 14741 2254 13.262011-12 16727 0 16727 14467 2260 13.512012-13 16458 0 16458 14285 2173 13.212013-14 18425 0 18425 15948 2477 13.442014-15 19009 0 19009 16328 2681 14.10
FESC
O
2010-11 7522 2163 9685 8596 1089 11.242011-12 8725 890 9615 8580 1035 10.762012-13 7125 2511 9636 8586 1050 10.892013-14 7811 3099 10910 9682 1228 11.262014-15 11246 0 11246 10006 1240 11.03
MEP
CO
2010-11 7889 4559 12448 10189 2260 18.152011-12 6939 5517 12456 10049 2407 19.322012-13 9157 2790 11947 9913 2034 17.022013-14 13981 81 14062 11437 2625 18.662014-15 13820 39 13859 11711 2148 15.50
HES
CO
2010-11 8699 86 8785 5814 2971 33.822011-12 4431 248 4679 3381 1297 27.732012-13 3924 926 4850 3524 1326 27.332013-14 4605 405 5010 3685 1326 26.462014-15 4965 547 5512 4020 1492 27.08
SEP
CO
2011-12 2996 1403 4398 2666 1732 39.382012-13 4325 181 4506 2726 1780 39.512013-14 4129 269 4398 2702 1696 38.562014-15 4114 231 4346 2682 1664 38.29
QES
CO
2010-11 5093 19 5112 4048 1064 20.812011-12 5147 12 5159 4086 1073 20.802012-13 4670 11 4681 3812 869 18.572013-14 4784 12 4796 3744 1052 21.932014-15 5194 0 5194 3994 1200 23.10
Tota
l in
P
EPC
O
Syst
em
2010-11 75109 7313 82422 66213 16210 19.672011-12 73305 8119 81424 65472 15952 19.592012-13 73322 6497 79819 64984 14835 18.592013-14 83463 3916 87380 71053 16327 18.682014-15 88306 818 89124 72643 16481 18.49
K-E
lect
ric
Lim
ited Year
Unit Purchased (GWh)Unit Sold
(GWh)
Losses
K-EL Own Through NTDC Through CPPs + Others
Total Unit Purchased GWh %age
2010-11 7826 5449 2183 15458 10072 5386 34.842011-12 8029 5684 1546 15259 10280 4979 32.632012-13 8567 5463 1794 15824 10942 4882 30.852013-14 8709 5441 1841 15991 11454 4537 28.372014-15 9319 5427 2069 16815 12293 4522 26.89
Source: Distribution Companies / KEL

174
State of Industry Report 2015
TABLE 63Units Billed and Amount Realized in DISCOs (2014-15)
DISCO Unit Domestic Commercial Industrial Agricultural Public Lighting
Bulk Supply Others Total
PES
CO
* GWh 4297 654 2020 93 14 520 2 7599
** Rs. Mln. 45579 14559 35593 1477 199 8483 43 105933
***Rs. Mln. 36756 14182 35474 1095 195 5394 43 93140
% 80.64 97.41 99.67 74.11 98.08 63.59 100.04 87.92
TES
CO
* GWh 973 6 63 52 0 7 0 1101
** Rs. Mln. 13980 201 734 655 0 90 0 15660
***Rs. Mln. 10106 62 774 447 0 79 0 11468
% 72.29 31.04 105.45 68.21 0.00 0.00 0.00 73.23
IESC
O
* GWh 3704 844 1671 93 76 1755 4 8147
** Rs. Mln. 39306 17821 25337 1340 1158 24929 67 109958
***Rs. Mln. 39104 17714 25210 1333 1158 15381 67 99967
% 99.49 99.40 99.50 99.48 100.00 61.70 100.00 90.91
GEP
CO
* GWh 3987 405 2077 285 6 293 1 7055
** Rs. Mln. 38704 9478 33990 4028 85 4568 19 90872
***Rs. Mln. 38580 9493 32988 4284 110 2714 103 88272
% 99.68 100.16 97.05 106.35 129.11 59.42 539.63 97.14
LESC
O
* GWh 6550 1235 6888 1084 94 469 8 16328
** Rs. Mln. 77033 27315 99382 12270 1479 7875 127 225481
***Rs. Mln. 75073 26964 93738 11015 1433 7792 47 216062
% 97.46 98.72 94.32 89.78 96.87 98.95 37.01 95.82
FESC
O
* GWh 4426 492 3972 788 7 317 4 10006
** Rs. Mln. 43259 11167 58430 10236 154 4861 74 128180
***Rs. Mln. 42812 11083 58163 11049 145 4878 126 128255
% 98.97 99.25 99.54 107.94 94.24 100.34 171.53 100.06
MEP
CO
* GWh 6014 657 3071 1745 16 200 8 11711
** Rs. Mln. 53915 15104 47208 18722 288 3271 139 138646
***Rs. Mln. 53276 15093 46654 22666 333 3407 452 141881
% 98.81 99.92 48.01 1.78 1184.77 13.81 324.64 102.33
HES
CO
* GWh 2421 271 760 416 105 43 4 4020
** Rs. Mln. 17180 5818 13458 6597 1834 793 34 45714
***Rs. Mln. 9556 5553 12657 5792 1443 225 542 35769
% 55.62 95.44 94.05 87.80 78.68 28.39 1612.15 78.24
SEP
CO
* GWh 1621 181 424 242 71 141 2 2682
** Rs. Mln. 18095 4003 7433 3763 1046 2338 28 36706
***Rs. Mln. 7012 3861 6038 2413 204 1681 12 21222
% 38.75 96.46 81.23 64.11 19.54 71.91 43.49 57.81
QES
CO
* GWh 573 109 140 3068 3 101 0 3994
** Rs. Mln. 7147 2529 2628 51015 63 1783 1 65166
***Rs. Mln. 4046 2363 2558 10395 33 1822 1 21217
% 56.60 93.43 97.32 20.38 51.72 102.19 100.00 32.56
K-E
lect
ric
Lim
ited
* GWh 6161 1589 3648 166 110 411 208 12293
** Rs. Mln. 66995 38736 67722 2235 1841 7657 2249 187435
***Rs. Mln. 60990 36563 61029 340 1284 7130 2050 169386
% 91.04 94.39 90.12 15.21 69.74 93.12 0.00 90.37
Tota
l in
P
EPC
O
Syst
em
* GWh 34566 4853 21085 7866 393 3846 33 72643
** Rs. Mln. 354199 107994 324194 110103 6305 58990 532 962317
***Rs. Mln. 316320 106368 314254 70488 5054 43373 1394 857251
% 89.31 98.49 96.93 64.02 80.15 73.53 262.08 89.08* Unit Billed ** Amount of Billed Units *** Amount Realized and %age Recovery to Billed AmountSource: Distribution Companies / KEL

175
State of Industry Report 2015
TABLE 64Average Annual Electricity Consumption per Connection (kWh)
DIS
CO
Year Domestic Commercial Industrial AgriculturalPublic
LightingBulk
SupplyOthers Total
PES
CO
2010-11 1771 1992 66585 10811 24342 610619 50217 26852011-12 1714 2035 63117 6138 21883 592091 48913 26282012-13 1654 1967 65215 4790 19961 616990 42609 25752013-14 1666 2150 66825 4284 13687 614157 56522 26052014-15 1651 2188 66567 3970 13625 585023 50638 2570
TES
CO
2010-11 3846 525 22081 10052 0 166667 0 39432011-12 3242 498 19259 8494 0 127273 0 33312012-13 2958 320 10409 6083 0 109091 0 29322013-14 3058 355 15437 6902 0 127273 0 30902014-15 2429 213 15362 6063 0 127273 0 2493
IESC
O
2010-11 1861 2904 121982 12055 63265 780368 7870229 35852011-12 1750 2727 122966 11127 50465 797834 6586957 33882012-13 1746 2619 118565 10967 47293 1980998 27778 33662013-14 1828 2622 113114 11550 47016 1878788 100000 34432014-15 1776 2405 111045 11353 45400 1813017 100000 3309
GEP
CO
2010-11 1665 1532 33952 9012 16383 2042748 72857 25252011-12 1525 1377 31794 8793 13480 1934444 72000 23412012-13 1401 1224 29982 7401 11571 1918165 63133 21652013-14 1595 1310 33910 7314 11781 2073390 65000 24182014-15 1591 1291 34305 6705 12257 1967221 70375 2413
LESC
O
2010-11 2183 2509 88908 20412 51749 863921 25355 44492011-12 2014 2338 87007 18750 51200 849570 22180 42132012-13 1895 2184 83388 17970 48540 872679 23562 39912013-14 2057 2316 90299 19655 47734 908024 30762 42962014-15 2029 2276 89131 18569 42371 957122 32110 4176
FESC
O
2010-11 1502 1615 75853 24521 4804 1203827 55050 28692011-12 1397 1479 75555 23348 4645 1342941 43204 27602012-13 1349 1405 76029 18857 4756 1356746 34327 26712013-14 1483 1451 84311 21340 5020 1378837 37207 29442014-15 1469 1428 85228 19933 4960 1452110 37265 2904
MEP
CO
2010-11 1344 1515 51136 30968 18973 395312 57037 24112011-12 1239 1450 55382 26757 14296 389066 56727 22712012-13 1200 1335 54544 21433 12123 378832 60536 21212013-14 1290 1407 60295 27688 12637 411024 71538 23532014-15 1334 1379 60048 22572 11526 467804 68333 2289
HES
CO
2010-11 2516 1569 49983 29316 115651 277717 301124 37712011-12 2390 1666 59658 34217 113776 267161 37079 38182012-13 2583 1693 57785 28876 261656 96235 33222 38492013-14 2667 1812 55672 27527 262516 87298 35217 38692014-15 3033 1842 53123 25108 316627 80244 37216 4115
SEP
CO
2011-12 2952 1476 36518 20845 185929 278977 87759 38782012-13 2975 1492 36256 20909 181760 284488 95556 39042013-14 2880 1474 35241 19580 189390 290885 65556 37942014-15 2788 1564 35074 19385 171966 280635 87895 3712
QES
CO
2010-11 1208 1005 35120 154468 16653 510286 12500 80612011-12 1298 1027 36829 152384 31250 389773 12500 79212012-13 1264 992 39623 121486 19959 387991 12500 71852013-14 1389 996 37825 99092 9177 401496 10000 68212014-15 1352 1030 38230 98518 11781 424370 15000 7070
K-E
lect
ric
Lim
ited
2010-11 2607 2304 167371 55979 1438596 652322 54333333 47742011-12 2750 2471 162731 52839 1761194 1905437 62666667 48042012-13 3061 3332 168361 56957 1681818 1288828 174000000 51212013-14 3327 3439 174355 66390 1432432 2113861 98500000 54252014-15 3633 3619 176976 66720 1428571 2075758 104000000 5696
Tota
l in
P
EPC
O
Syst
em
2010-11 1788 1934 64816 31529 42078 654192 1531605 32602011-12 1680 1838 64245 29375 41730 648934 1209483 31112012-13 1620 1738 62798 25075 43362 855881 36140 29712013-14 1725 1819 67315 26175 42575 867801 47140 31462014-15 1716 1782 66913 24730 42074 860120 47369 3089
Source: Distribution Companies / KEL

176
State of Industry Report 2015
TABLE 65Distribution Losses (voltage category-wise)
DISCO Lossesof
2010-11 2011-12 2012-13 2013-14 2014-15
GWh % GWh % GWh % GWh % GWh %
PESCO
* 627.90 5.60 600.10 5.40 391.90 3.60 379.50 3.40 379.50 3.30
** 3514.30 33.50 3368.24 32.30 3338.60 31.80 3450.10 31.60 3681.10 32.60
*** 4269.51 37.96 3968.49 35.98 3730.35 34.25 3829.47 33.89 4058.39 34.81
TESCO
* 224.93 2.94 196.03 2.92 52.03 2.86 98.48 5.60 90.06 4.63
** 239.19 21.10 474.56 24.50 313.45 19.50 305.65 18.30 230.20 17.30
*** 590.96 25.41 604.78 29.21 349.15 21.25 393.98 22.41 304.80 21.68
IESCO
* 170.00 2.00 147.00 1.80 151.00 1.80 151.00 1.67 177.00 1.96
** 659.00 7.90 644.79 7.90 657.00 7.80 705.00 7.93 669.00 7.54
*** 835.00 9.81 793.00 9.52 810.00 9.45 857.00 9.47 846.00 9.41
GEPCO
* 135.22 1.85 114.00 1.64 103.00 1.55 141.00 1.84 127.00 1.61
** 740.56 10.31 667.33 9.75 610.00 9.35 703.00 9.33 720.00 9.25
*** 877.00 11.99 781.56 11.23 713.18 10.75 843.84 11.00 846.99 10.72
LESCO
* 30.70 0.20 178.00 0.80 102.80 0.60 145.90 0.80 273.80 1.14
** 2223.47 13.10 2117.85 12.80 2070.60 12.70 2330.80 12.80 2407.10 12.80
*** 2254.15 13.26 2260.40 13.51 2173.33 13.21 2476.69 13.44 2680.64 14.10
FESCO
* 157.92 1.60 107.84 1.10 137.00 1.30 211.87 1.90 n.p. n.p.
** 931.07 9.80 928.39 9.80 912.46 9.60 1016.30 9.50 n.p. n.p.
*** 1088.63 11.24 1034.59 10.76 1049.76 10.89 1228.29 11.26 1240.13 11.03
MEPCO
* 479.76 3.80 465.43 3.65 309.08 2.62 483.76 3.50 417.14 3.00
** 1802.43 15.00 1769.01 14.76 1724.84 14.82 1937.94 14.50 1933.38 14.20
*** 2259.72 18.15 2406.82 19.32 2033.93 17.02 2624.52 18.66 2147.70 15.50
HESCO
* 360.74 4.13 180.37 3.90 171.87 3.50 163.03 3.30 244.83 4.40
** 2572.06 30.70 1116.96 24.80 1153.82 24.70 1162.06 24.00 1247.29 23.70
*** 2970.78 33.82 1297.38 27.73 1325.71 27.33 1325.50 26.46 1492.44 27.08
SEPCO
* - - 193.35 4.24 179.79 3.99 125.07 2.84 113.82 2.62
** - - 1513.24 35.29 1548.69 36.23 1507.07 35.81 1481.54 35.59
*** - - 1732.02 39.38 1780.39 39.51 1695.85 38.56 1664.08 38.29
QESCO
* 368.77 7.25 335.11 6.50 248.62 5.00 160.48 3.24 75.80 1.40
** 666.64 14.10 737.48 15.30 869.13 18.60 1051.51 21.90 1215.20 23.30
*** 1063.90 20.81 1072.99 20.80 869.31 18.57 1051.52 21.93 1199.70 23.10
K-Electric Limited
* - - - 1.53 189.00 1.25 200.00 1.31 226.00 1.40
** - - - 28.60 4028.00 26.90 3678.00 24.30 3590.00 22.60
*** 5386.41 34.84 4978.71 32.63 4882.00 30.85 4537.00 28.37 4522.00 26.89*132 kV system (including 66 & 33 kV) ** 11 kV and below system ***Overall systemSource: Distribution Companies / KEL

177
State of Industry Report 2015
TABLE 66Status of Distribution Lines (km)
DISCO As on 30th June 132 kV 66 kV 33 kV 11 kV Total HT
Lines
Total LTLines
(0.4 kV)
PESCO
2011 1960 860 311 31698 34829 429322012 2033 861 311 32432 35637 433162013 2080 861 311 33006 36258 435602014 2147 841 171 33337 36496 438012015 2164 841 171 33337 36513 43957
TESCO
2011 259 383 805 7347 8794 63782012 259 383 805 7347 8794 63782013 259 383 805 7363 8810 63802014 259 383 805 7363 8810 63802015 259 383 805 7367 8814 6380
IESCO
2011 2480 581 153 22547 25761 251642012 2605 581 153 23012 26351 254772013 2702 581 153 23409 26845 258002014 2717 581 153 23596 27047 260092015 2772 581 153 24272 27778 26145
GEPCO
2011 1969 509 0 20096 22574 169972012 1969 509 0 20990 23468 173802013 1897 416 0 21971 24284 179552014 2054 332 0 22216 24602 180872015 2233 447 0 22402 25082 18087
LESCO
2011 0 0 0 25522 25522 144872012 0 0 0 25918 25918 145682013 2519 0 0 26297 28816 146472014 2572 0 0 26657 29229 147302015 2252 429 0 26657 29338 14808
FESCO
2011 1588 1298 0 36204 39090 242172012 1658 1296 0 36900 39854 248802013 1705 1292 0 37644 40641 254292014 1844 1260 0 38093 41197 257702015 1865 1260 0 38614 41739 25900
MEPCO
2011 2923 1314 0 66223 70460 445922012 2937 1314 0 67221 71472 451212013 2987 1266 0 68647 72900 459702014 3169 1154 0 69453 73776 462512015 3286 1154 0 71101 75541 46866
0.00
5.00
10.00
15.00
20.00
25.00
30.00
35.00
40.00
PESCO IESCO LESCO MEPCO SEPCO K-Electric
Figure 65: Distribution Losses (%) (2014-15)
132 kV system(including 66 & 33 kV)
11 kV and below system Overall system
PESCO TESCO IESCO GEPCO LESCO FESCO MEPCO HESCO SEPCO QESCO K-Electric
Continued.....

178
State of Industry Report 2015
DISCO As on 30th June 132 kV 66 kV 33 kV 11 kV Total HT
Lines
Total LTLines
(0.4 kV)
HESCO
2011 3876 1725 0 48059 53660 264422012 1900 969 0 25414 28283 137452013 1939 975 0 26196 29110 141322014 2067 975 0 26612 29654 143922015 2133 975 0 26913 30021 14687
SEPCO
2012 1976 756 0 23098 25830 129912013 1887 753 0 23814 26454 132722014 1900 753 0 24277 26930 134712015 1995 753 0 24277 27025 13471
QESCO
2011 3054 636 985 29503 34178 127492012 3985 636 985 31139 36745 136292013 4299 491 985 32153 37928 140422014 4299 491 985 33425 39200 143732015 4299 491 985 33425 39200 14654
K-Electric Limited
2011 761 149 0 n.p. n.p. n.p.2012 761 149 0 n.p. n.p. n.p.2013 761 149 0 8071 8981 n.p.2014 761 149 0 8335 9245 176452015 761 149 0 8834 9744 n.p.
Total in PEPCO System
2011 18109 7306 2254 287199 314868 2139582012 19322 7305 2254 293471 322352 2174852013 22274 7018 2254 300500 332046 2211872014 23028 6770 2114 305029 336941 2232642015 23258 7314 2114 308365 341051 224955
Source: Distribution Companies / KEL
TABLE 67Feeders Outages Statistics of DISCOs (2014-15)
DIS
CO Nature of
Tripping
132 kV Feeders 66 kV Feeders 33 kV Feeders 11 kV Feeders All Feeders
No. of Tripping
Duration (Min.)
No. of Tripping
Duration (Min.)
No. of Tripping
Duration (Min.)
No. of Tripping
Duration (Min.)
No. of Tripping
Duration (Min.)
PES
CO
Planned 1282 136708 414 20926 3 910 165354 7417268 167053 7575812
Forced 285 68070 142 32397 37 1438 36436 2793641 36900 2895546
Total 1567 204778 556 53323 40 2348 201790 10210909 203953 10471358
TES
CO
Planned 33 3805 3900 3410 31 2380 2922 28850 6886 38445
Forced 32 2425 35 2845 27 2690 745 24870 839 32830
Total 65 6230 3935 6255 58 5070 3667 53720 7725 71275
IESC
O
Planned 72 27560 12 1420 21 1016 742160 44529600 742265 44559596
Forced 240 21600 111 9990 241 21690 12782 1046079 13374 1099359
Total 312 49160 123 11410 262 22706 754942 45575679 755639 45658955
GEP
CO Planned 10 3420 3 720 0 0 1458 207440 1471 207453
Forced 3350 545889 258 17892 0 0 7492 200855 11100 764636
Total 3360 545899 3678 17895 720 0 8950 408295 12571 972089
LESC
O
Planned 251 105926 10 3120 0 0 14526 4183920 14787 4292966
Forced 4824 321366 899 72696 0 0 20913 673260 26636 1067322
Total 5075 427292 909 75816 0 0 35439 4857180 41423 5360288
FESC
O
Planned 239 59204 100 24637 0 0 4007 624800 4346 708641
Forced 95 12422 70 5518 0 0 53312 670197 53477 688137
Total 334 71626 170 30155 0 0 57319 1294997 57823 1396778
MEP
CO Planned 838 238233 132 77659 0 0 3000 584167 3970 900059
Forced 2034 660760 2472 878057 0 0 138635 1179900 143141 2718717
Total 2872 898993 2604 955716 0 0 141635 1764067 147111 3618776Continued.....

179
State of Industry Report 2015
DIS
CO Nature of
Tripping
132 kV Feeders 66 kV Feeders 33 kV Feeders 11 kV Feeders All Feeders
No. of Tripping
Duration (Min.)
No. of Tripping
Duration (Min.)
No. of Tripping
Duration (Min.)
No. of Tripping
Duration (Min.)
No. of Tripping
Duration (Min.)
HES
CO
Planned 79 26278 19 5470 0 0 298 72960 396 104708
Forced 516 84995 72 22381 0 0 34040 37440 34628 144816
Total 595 111273 91 27851 0 0 34338 110400 35024 249524
SEP
CO
Planned 230 103501 46 3443 0 0 45091 134795 45367 241739
Forced 163 38951 122 4098 0 0 33234 668776 33519 711825
Total 393 142452 168 7541 0 0 78325 803571 78886 953564
QES
CO
Planned 299 64848 299 64848
Forced 0 0
Total 299 64848 0 0 0 0 0 0 299 64848
K-E
lect
ric
Lim
ited
Planned 12 3662 0 0 12 3662
Forced 39 5190 0 0 39 5190
Total 51 8852 0 0 0 0 0 0 51 8852
Source: Distribution Companies / KEL
TABLE 68Overloaded and Underutilized Distribution Feeders
DISCO YearNumber of Overloaded Feeders
(Above Designed Capacity)Number of Underutilized Feeders (10% Below Designed Capacity)
132 kV 66 kV 33 kV 11 kV 132 kV 66 kV 33 kV 11 kV
PES
CO
2010-11 15 1 1 74 20 4 0 109
2011-12 12 0 0 66 23 3 1 110
2012-13 17 0 0 71 19 2 2 121
2013-14 20 0 0 16 15 0 1 72
2014-15 3 1 1 59 6 0 0 59
TES
CO
2010-11 0 0 0 0 0 0 1 3
2011-12 1 2 0 0 3 2 0 73
2012-13 2 2 0 0 2 2 0 72
2013-14 2 2 0 0 0 2 0 72
2014-15 2 2 0 0 2 1 0 28
IESC
O
2010-11 11 0 0 23 0 0 0 206
2011-12 11 0 0 30 4 0 0 219
2012-13 11 0 0 35 5 0 0 62
2013-14 0 0 0 36 5 0 0 68
2014-15 1 0 0 12 5 0 0 60
GEP
CO
2010-11 3 0 0 2 5 0 0 59
2011-12 9 0 0 4 2 0 0 8
2012-13 3 0 0 58 6 1 0 562
2013-14 5 0 0 45 9 1 0 589
2014-15 2 0 0 2 3 0 0 81Continued.....
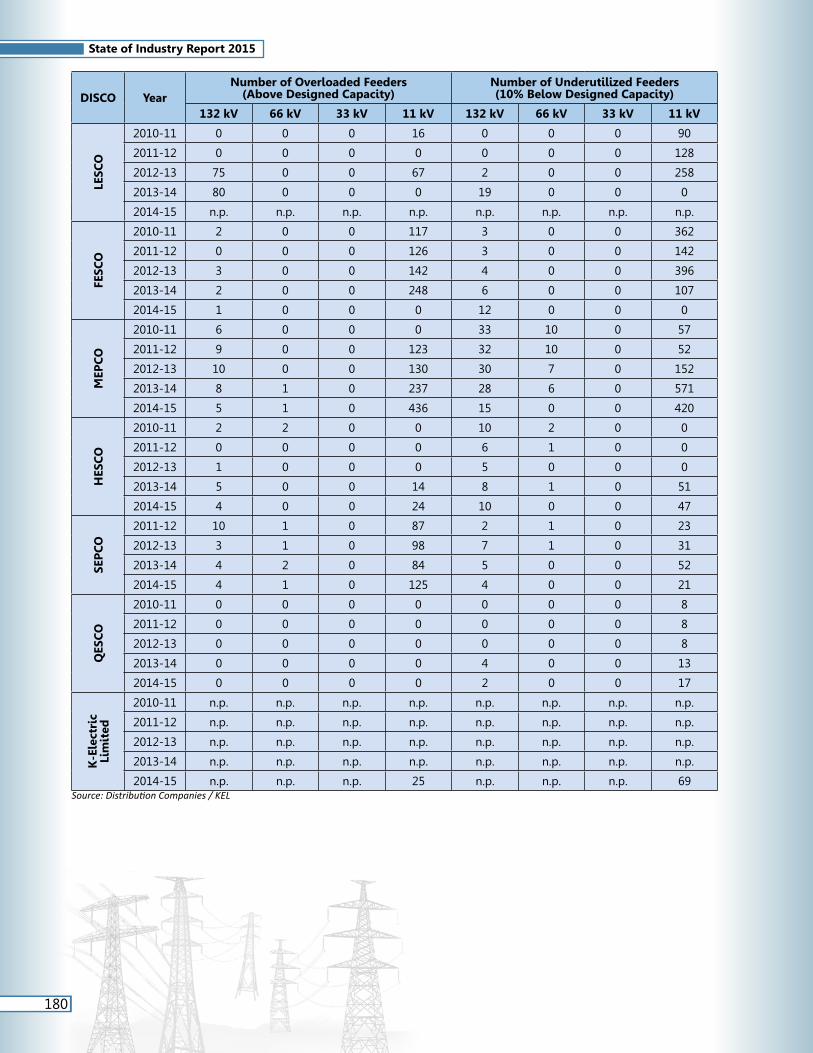
180
State of Industry Report 2015
DISCO YearNumber of Overloaded Feeders
(Above Designed Capacity)Number of Underutilized Feeders (10% Below Designed Capacity)
132 kV 66 kV 33 kV 11 kV 132 kV 66 kV 33 kV 11 kVLE
SCO
2010-11 0 0 0 16 0 0 0 90
2011-12 0 0 0 0 0 0 0 128
2012-13 75 0 0 67 2 0 0 258
2013-14 80 0 0 0 19 0 0 0
2014-15 n.p. n.p. n.p. n.p. n.p. n.p. n.p. n.p.
FESC
O
2010-11 2 0 0 117 3 0 0 362
2011-12 0 0 0 126 3 0 0 142
2012-13 3 0 0 142 4 0 0 396
2013-14 2 0 0 248 6 0 0 107
2014-15 1 0 0 0 12 0 0 0
MEP
CO
2010-11 6 0 0 0 33 10 0 57
2011-12 9 0 0 123 32 10 0 52
2012-13 10 0 0 130 30 7 0 152
2013-14 8 1 0 237 28 6 0 571
2014-15 5 1 0 436 15 0 0 420
HES
CO
2010-11 2 2 0 0 10 2 0 0
2011-12 0 0 0 0 6 1 0 0
2012-13 1 0 0 0 5 0 0 0
2013-14 5 0 0 14 8 1 0 51
2014-15 4 0 0 24 10 0 0 47
SEP
CO
2011-12 10 1 0 87 2 1 0 23
2012-13 3 1 0 98 7 1 0 31
2013-14 4 2 0 84 5 0 0 52
2014-15 4 1 0 125 4 0 0 21
QES
CO
2010-11 0 0 0 0 0 0 0 8
2011-12 0 0 0 0 0 0 0 8
2012-13 0 0 0 0 0 0 0 8
2013-14 0 0 0 0 4 0 0 13
2014-15 0 0 0 0 2 0 0 17
K-E
lect
ric
Lim
ited
2010-11 n.p. n.p. n.p. n.p. n.p. n.p. n.p. n.p.
2011-12 n.p. n.p. n.p. n.p. n.p. n.p. n.p. n.p.
2012-13 n.p. n.p. n.p. n.p. n.p. n.p. n.p. n.p.
2013-14 n.p. n.p. n.p. n.p. n.p. n.p. n.p. n.p.
2014-15 n.p. n.p. n.p. 25 n.p. n.p. n.p. 69Source: Distribution Companies / KEL

181
State of Industry Report 2015
TABLE 69Number of Circles, Divisions, Sub-Divisions and Feeders
DISCO As on 30th June Circles Divisions Sub-Divisions 11 kV
Feeders
PESCO
2012 6 32 145 7202013 6 33 147 7542014 6 33 147 7892015 6 34 149 841
TESCO
2012 1 6 18 1582013 1 6 18 1582014 1 6 18 1732015 1 6 18 188
IESCO
2012 5 19 101 8362013 5 19 105 8862014 5 19 105 9662015 5 19 108 965
GEPCO
2012 4 23 114 6922013 4 23 115 7052014 4 23 115 7252015 5 24 115 745
LESCO
2012 7 33 163 12582013 7 33 164 13412014 7 33 164 14372015 7 33 164 1540
FESCO
2012 4 21 118 8132013 4 21 118 8502014 4 21 118 9002015 4 24 130 937
MEPCO
2012 8 35 152 9252013 8 35 154 9722014 8 35 160 10392015 8 35 160 1104
HESCO
2012 3 14 62 4122013 3 14 62 4422014 3 14 62 410*2015 4 15 67 421
SEPCO
2012 3 13 55 3782013 3 13 55 3982014 3 13 55 4132015 3 16 60 433
QESCO
2012 3 11 41 5282013 4 12 43 5512014 4 13 44 5502015 4 14 46 570
Total in PEPCO System
2012 44 207 969 67202013 45 209 981 70572014 45 210 988 74022015 47 220 1017 7744
As on 30th June IBCs VIBCs Feeders
K-Electric Limited
2012 8 20 13072013 17 11 13212014 28 0 13752015 28 0 1431
* 32 feeders dismantled due to flood and cyclonic effects.Source: Distribution Companies / KEL

182
State of Industry Report 2015
TABLE 70Status of Grid Stations (Nos.)
DIS
CO As on
30th June
132 kV 66 kV 33 kVTotalDISCO
OwnedCons.
OwnedSub-Total
DISCO Owned
Cons. Owned
Sub-Total
DISCO Owned
Cons. Owned
Sub-Total
PES
CO
2011 62 9 71 19 0 19 5 0 5 952012 64 9 73 18 0 18 4 0 4 952013 65 9 74 17 0 17 4 0 4 952014 67 9 76 17 0 17 4 0 4 972015 67 9 76 17 0 17 4 0 4 97
TES
CO
2011 7 0 7 8 1 9 0 0 0 162012 7 0 7 8 0 8 0 0 0 152013 7 0 7 8 0 8 0 0 0 152014 7 0 7 8 0 8 0 0 0 152015 7 0 7 8 0 8 0 0 0 15
IESC
O
2011 58 20 78 10 1 11 5 0 5 942012 62 20 82 9 1 10 5 0 5 972013 66 20 86 7 1 8 5 0 5 992014 73 20 93 7 1 8 3 0 3 1042015 78 22 100 4 1 5 3 0 3 108
GEP
CO
2011 41 0 41 8 0 8 0 0 0 492012 41 0 41 8 0 8 0 0 0 492013 41 0 41 8 0 8 0 0 0 492014 50 0 50 5 0 5 0 0 0 552015 52 0 52 4 0 4 0 0 0 56
LESC
O
2011 81 26 107 8 0 8 0 0 0 1152012 82 25 107 8 0 8 0 0 0 1152013 90 26 116 0 0 0 0 0 0 1162014 85 31 116 8 0 8 0 0 0 1242015 89 34 123 7 0 7 0 0 0 130
FESC
O
2011 55 15 70 26 0 26 0 0 0 962012 55 15 70 26 0 26 0 0 0 962013 58 16 74 24 0 24 0 0 0 982014 60 16 76 23 0 23 0 0 0 992015 62 18 80 23 0 23 0 0 0 103
MEP
CO
2011 78 7 85 27 0 27 0 0 0 1122012 82 7 89 26 0 26 0 0 0 1152013 88 8 96 24 0 24 0 0 0 1202014 92 8 100 22 0 22 0 0 0 1222015 96 8 104 21 0 21 0 0 0 125
HES
CO
2011 89 6 95 34 1 35 0 0 0 1302012 47 4 51 22 0 22 0 0 0 732013 48 5 53 22 0 22 0 0 0 752014 52 6 58 19 0 19 0 0 0 772015 53 6 59 18 0 18 0 0 0 77
SEP
CO
2012 43 0 43 13 0 13 0 0 0 562013 46 1 47 13 1 14 0 0 0 612014 47 1 48 12 1 13 0 0 0 612015 51 1 52 12 1 13 0 0 0 65
QES
CO
2011 52 0 52 10 0 10 26 0 26 882012 55 0 55 10 0 10 26 0 26 912013 56 0 56 10 0 10 26 0 26 922014 56 0 56 10 0 10 26 0 26 922015 58 0 58 10 0 10 25 0 25 93
K-E
lect
ric
Lim
ited
2011 50 5 55 3 0 3 0 0 0 582012 51 8 59 3 0 3 0 0 0 622013 52 9 61 3 0 3 0 0 0 642014 53 9 62 3 0 3 0 0 0 652015 54 9 63 3 0 3 0 0 0 66
Tota
l in
P
EPC
O
Syst
em
2011 523 83 606 150 3 153 36 0 36 7952012 538 80 618 148 1 149 35 0 35 8022013 565 85 650 133 2 135 35 0 35 8202014 589 91 680 131 2 133 33 0 33 8462015 613 98 711 124 2 126 32 0 32 869
Source: Distribution Companies / KEL

183
State of Industry Report 2015
TAB
LE 7
1D
ISC
O’s
Po
wer
Tra
nsf
orm
ers,
Cap
acit
ies
and
Lo
adin
g P
osi
tio
ns
of
Po
wer
Tra
nsf
orm
ers
DIS
CO
Year
No
. of
Po
wer
Tr
ansf
orm
ers
Cap
acit
y o
f P
ow
er
Tran
sfo
rmer
s (M
VA
)N
o. o
f O
ver-
Load
ed P
ow
er
Tran
sfo
rmer
s (a
bo
ve 8
0%)
132
kV66
kV
33 k
VTo
tal
132
kV66
kV
33 k
VTo
tal
132
kV66
kV
33 k
VTo
tal
PES
CO
2014
-15
176
29
7 21
2 4,
558.
90
282.
50
25.5
0 4,
866.
90
95
16
4 11
5
TES
CO
2014
-15
17
17
0 34
34
4.30
18
4.00
0.
00
528.
30
8 10
0
18
IESC
O20
14-1
516
8 10
7
185
4,04
8.30
10
4.30
30
.00
4,18
2.60
65
2
4 71
GEP
CO
2014
-15
149
149
3,80
0.30
3,
800.
30
78
78
LESC
O20
14-1
5
-
-
-
FESC
O20
14-1
514
6 39
0
185
3,98
4.00
42
2.45
0.
00
4,40
6.45
95
20
0
115
MEP
CO
2014
-15
220
36
0 25
6 5,
725.
25
383.
34
0.00
6,
108.
59
107
22
0 12
9
HES
CO
2014
-15
91
23
0 11
4 1,
867.
90
224.
10
0.00
2,
092.
00
61
6 0
67
SEP
CO
2014
-15
90
24
0 11
4 1,
957.
10
237.
40
0.00
2,
194.
50
56
14
0 70
QES
CO
2014
-15
118
14
0 13
2 2,
596.
60
109.
50
0.00
2,
706.
10
63
9 0
72
K-E
lect
ric
Lim
ited
2014
-15
126
3 0
129
4,65
1.50
69
.00
0.00
4,
720.
50
42
0 0
42
Tota
l in
P
EPC
O
Syst
em20
14-1
51,
175
192
14
1,38
1 28
,883
1,
948
56
30,8
85.7
4 62
8 99
8
735
Sour
ce: D
istrib
ution
Com
pani
es /
KEL

184
State of Industry Report 2015
TABLE 72DISCO’s Number of 11 kV Feeders and Loading Positions of 11 kV Feeders
DISCO YearNo. of 11 kV
FeedersLoading Position of 11 kV Feeders (Nos.)
Above 80% Above 90% Above 100%
PESCO 2014-15 841 103 146 194
TESCO 2014-15 188 41 42 -
IESCO 2014-15 965 63 40 12
GEPCO 2014-15 745 206 116 36
LESCO 2014-15 1,540 124 187 62
FESCO 2014-15 937 110 59 23
MEPCO 2014-15 1,104 114 304 9
HESCO 2014-15 421 15 47 24
SEPCO 2014-15 433 40 45 100
QESCO 2014-15 570 23 17 45
K-Electric Limited
2014-15 1,431 156 69 40
Total in PEPCO System
2014-15 7,744 839 1,003 505
Source: Distribution Companies / KEL
TABLE 73DISCO’s Number of Distribution Transformers, Capacities and
Loading Positions of Distribution Transformers
DISCO YearNo. of
Distribution Transformers
Capacity of Distribution Transformers
(kVA)
Loading Position of Distribution Transformers (Nos.)
Above 80% Above 90% Above 100%
PESCO 2014-15 58,458 4,461,200 TESCO 2014-15 15,634 1,200,000 IESCO 2014-15 44,811 3,707,000 1,441 958 34 GEPCO 2014-15 58,193 3,587,000 2,597 2,308 1,731 LESCO 2014-15 96,268 7,501,615 19,254 9,627 9,627 FESCO 2014-15 93,292 5,655,690 2,241 847 399 MEPCO 2014-15 149,368 7,392,855 3,965 1,652 991 HESCO 2014-15 34,443 1,687,795 3,986 2,029 1,207 SEPCO 2014-15 35,818 1,899,210 8,872 3,922 1,979 QESCO 2014-15 51,886 2,571,468 4,125 2,350 1,807
K-Electric Limited 2014-15 20,979 6,047,850 468 185 76 Total in PEPCO
System 2014-15 638,171 39,663,833 46,481 23,693 17,775
Source: Distribution Companies / KEL

185
State of Industry Report 2015
TABLE 74Village Electrification in all Distribution Companies
DISCO Year Total Number of Villages Total Villages Electrified Percentage of Total Electrified
Villages
PESCO
2011 24667 18927 76.732012 25413 19651 77.332013 26017 20274 77.932014 26387 20554 77.892015 n.p. n.p. ......
TESCO
2011 522 522 100.002012 39 38 97.442013 39 38 97.442014 58 38 65.522015 187 93 49.73
IESCO
2011 1176 988 84.012012 1503 1341 89.222013 2717 2109 77.622014 2717 2109 77.622015 3144 2323 73.89
GEPCO
2011 9286 8698 93.672012 6331 6331 100.002013 6804 6804 100.002014 6854 6854 100.002015 6977 6889 98.74
LESCO
2011 2886 812 28.142012 410 406 99.022013 3686 2543 68.992014 3913 2728 69.722015 3913 2859 73.06
FESCO
2011 20893 19166 91.732012 21756 20161 92.672013 22657 21209 93.612014 22930 21505 93.792015 23277 21831 93.79
MEPCO
2011 57358 44937 78.342012 15092 14954 99.092013 21325 19902 93.332014 25055 21240 84.772015 26310 22287 84.71
HESCO
2011 46730 29114 62.302012 46730 30454 65.172013 23803 15961 67.052014 23803 16424 69.002015 23803 17010 71.46
SEPCO
2012 n.p n.p ---2013 22927 15795 68.892014 23263 16189 69.592015 23263 16515 70.99
QESCO
2011 17123 12938 75.562012 17123 14863 86.802013 17123 16016 93.542014 23819 17517 73.542015 23819 18017 75.64
K-Electric Limited
2011 889 510 57.372012 889 563 63.332013 889 636 71.542014 889 661 74.352015 889 702 78.97
Source: Distribution Companies / K-EL

186
State of Industry Report 2015
TABLE 75Applications of New Connections Received, Energized and Pending
DISCO Year Applications Received (Nos.)
Connection Applications Pending (Nos.)Sanctioned (Nos.) Load (kW)
PESCO
2010-11 112499 83456 221989 290432011-12 80824 54701 100239 261232012-13 80374 89626 169208 -92522013-14 106014 82407 188240 236072014-15 102861 100773 217731 2088
TESCO
2010-11 131 63 964 682011-12 38 27 212 112012-13 117 84 1844 332013-14 609 63 258 5462014-15 641 162 2853 479
IESCO
2010-11 92666 80119 n.p. 125472011-12 99516 83992 210900 155242012-13 103609 85909 219208 177002013-14 96265 70856 211278 254092014-15 113855 81831 232254 32024
GEPCO
2010-11 122002 96795 315554 252072011-12 112162 86764 225697 253982012-13 109135 92599 215661 165362013-14 105194 94033 205952 111612014-15 126534 99735 241546 26799
LESCO
2010-11 178611 133856 412901 447552011-12 166193 115206 411911 509872012-13 179170 130407 460486 487632013-14 215984 146229 491192 697552014-15 244111 187150 531864 56961
FESCO
2010-11 120021 123040 405570 -30192011-12 111944 113807 420215 -18632012-13 146542 96499 252400 500432013-14 118884 90352 314228 285322014-15 125998 149562 n.p. -23564
MEPCO
2010-11 241676 160843 613292 808332011-12 271192 217886 473544 533062012-13 265242 238145 506865 270972013-14 258882 181169 389886 777132014-15 271874 249632 517342 22242
HESCO
2010-11 24380 23091 41357 12892011-12 19072 18234 32156 8382012-13 39289 27918 64599 113712013-14 39240 36833 63415 24072014-15 21445 24625 83803 -3180
SEPCO
2011-12 7061 5197 11203 18642012-13 n.p. n.p. n.p. n.p.2013-14 17165 15609 85220 15562014-15 11832 10196 32819 1636
QESCO
2010-11 13958 11381 19208 25772011-12 15113 13449 16737 16642012-13 13619 11846 59604 17732013-14 23848 18460 31048 53882014-15 16455 13762 2693
K-Electric Limited
2010-11 83682 36706 155002 469762011-12 50163 24898 164934 252652012-13 20384 9143 138703 112412013-14 12174 10955 280576 12192014-15 25242 22266 348310 2976
Source: Distribution Companies / KESC

187
State of Industry Report 2015
TABLE 76Province-wise Electricity Consumption by Economic Groups of the Country (GWh)
Category Year Punjab* Sindh** Khyber
Pakhtunkhwa# Balochistan## K-Electric
Limited Total
Domestic
2010-11 21802.99 3128.25 5576.53 464.14 4257.00 35228.91
2011-12 21001.64 3346.56 5342.59 512.50 4564.00 34767.29
2012-13 20982.13 3595.27 5233.49 510.46 5083.00 35404.35
2013-14 23593.56 3723.74 5429.75 575.25 5489.00 38811.30
2014-15 24681.41 4042.02 5269.71 573.16 6161.00 40727.30
Commercial
2010-11 3660.00 386.36 541.79 93.66 1043.00 5724.81
2011-12 3502.84 394.09 566.85 98.40 1128.00 5690.18
2012-13 3372.50 405.01 558.68 97.52 1507.00 5940.71
2013-14 3630.77 428.49 631.54 101.70 1507.00 6299.50
2014-15 3633.69 451.21 659.63 108.93 1589.00 6442.46
Industrial
2010-11 14761.50 1170.36 1653.04 114.28 3447.00 21146.18
2011-12 15241.43 1180.42 1855.12 122.31 3342.00 21741.28
2012-13 15383.60 1191.27 1930.94 135.63 3445.00 22086.44
2013-14 17177.22 1187.62 2051.72 134.24 3568.00 24118.80
2014-15 17678.02 1184.43 2082.91 140.00 3648.00 24733.36
Agricultural
2010-11 4423.61 783.41 375.26 3264.83 125.00 8972.11
2011-12 4163.04 772.90 214.35 3259.50 134.00 8543.79
2012-13 3701.78 710.95 163.26 2974.35 149.00 7699.34
2013-14 4444.24 688.83 159.42 2837.00 160.00 8289.49
2014-15 3995.48 658.24 144.61 3067.74 166.00 8032.07
Public Lighting
2010-11 227.06 101.31 20.52 3.98 82.00 434.87
2011-12 205.29 128.82 21.27 7.50 118.00 480.88
2012-13 205.54 156.50 20.22 4.83 111.00 498.09
2013-14 211.42 162.18 14.07 2.23 106.00 495.90
2014-15 200.26 175.97 14.17 2.91 110.00 503.31
Bulk Supply
2010-11 1714.48 217.73 542.07 107.16 955.00 3536.44
2011-12 1771.05 216.45 525.08 85.75 806.00 3404.33
2012-13 2800.63 186.37 547.10 88.85 473.00 4095.95
2013-14 3005.27 191.10 546.23 93.95 427.00 4263.55
2014-15 3033.89 184.21 526.50 101.00 411.00 4256.60
Traction/ Others
2010-11 1049.09 26.80 2.31 0.05 163.00 1241.25
2011-12 925.45 8.39 2.25 0.05 188.00 1124.14
2012-13 20.46 4.71 1.96 0.05 174.00 201.18
2013-14 24.34 4.42 2.60 0.04 197.00 228.40
2014-15 25.30 5.28 2.38 0.06 208.00 241.02
Total
2010-11 47638.73 5814.22 8711.52 4048.10 10072.00 76284.57
2011-12 46810.74 6047.63 8527.51 4086.01 10280.00 75751.89
2012-13 46466.62 6250.08 8455.65 3811.69 10942.00 75926.04
2013-14 52086.81 6386.38 8835.33 3744.41 11454.00 82506.93
2014-15 53248.05 6701.36 8699.91 3993.80 12293.00 84936.12* Islamabad Capital Territory is included ** Consumption in K-EL Area is not included # FATA is included## Area served by K-EL is excludedSource: National Electric Power Regulatory Authority

188
State of Industry Report 2015
TABLE 77Province-wise Electricity Consumption by Economic Groups of the Country (%)
Category Year Punjab* Sindh** Khyber
Pakhtunkhwa# Balochistan## K-Electric
Limited Total
Domestic
2010-11 45.77 53.80 64.01 11.47 42.27 46.182011-12 44.87 55.34 62.65 12.54 44.40 45.902012-13 45.16 57.52 61.89 13.39 46.45 46.632013-14 45.30 58.31 61.45 15.36 47.92 47.042014-15 46.35 60.32 60.57 14.35 50.12 47.95
Commercial
2010-11 7.68 6.65 6.22 2.31 10.36 7.502011-12 7.48 6.52 6.65 2.41 10.97 7.512012-13 7.26 6.48 6.61 2.56 13.77 7.822013-14 6.97 6.71 7.15 2.72 13.16 7.642014-15 6.82 6.73 7.58 2.73 12.93 7.59
Industrial
2010-11 30.99 20.13 18.98 2.82 34.22 27.722011-12 32.56 19.52 21.75 2.99 32.51 28.702012-13 33.11 19.06 22.84 3.56 31.48 29.092013-14 32.98 18.60 23.22 3.59 31.15 29.232014-15 33.20 17.67 23.94 3.51 29.68 29.12
Agricultural
2010-11 9.29 13.47 4.31 80.65 1.24 11.762011-12 8.89 12.78 2.51 79.77 1.30 11.282012-13 7.97 11.38 1.93 78.03 1.36 10.142013-14 8.53 10.79 1.80 75.77 1.40 10.052014-15 7.50 9.82 1.66 76.81 1.35 9.46
Public Lighting
2010-11 0.48 1.74 0.24 0.10 0.81 0.572011-12 0.44 2.13 0.25 0.18 1.15 0.632012-13 0.44 2.50 0.24 0.13 1.01 0.662013-14 0.41 2.54 0.16 0.06 0.93 0.602014-15 0.38 2.63 0.16 0.07 0.89 0.59
Bulk Supply
2010-11 3.60 3.74 6.22 2.65 9.48 4.642011-12 3.78 3.58 6.16 2.10 7.84 4.492012-13 6.03 2.98 6.47 2.33 4.32 5.392013-14 5.77 2.99 6.18 2.51 3.73 5.172014-15 5.70 2.75 6.05 2.53 3.34 5.01
Traction/ Others
2010-11 2.20 0.46 0.03 0.00 1.62 1.632011-12 1.98 0.14 0.03 0.00 1.83 1.482012-13 0.04 0.08 0.02 0.00 1.59 0.262013-14 0.05 0.07 0.03 0.00 1.72 0.282014-15 0.05 0.08 0.03 0.00 1.69 0.28
Total
2010-11 100.00 100.00 100.00 100.00 100.00 100.002011-12 100.00 100.00 100.00 100.00 100.00 100.002012-13 100.00 100.00 100.00 100.00 100.00 100.002013-14 100.00 100.00 100.00 100.00 100.00 100.002014-15 100.00 100.00 100.00 100.00 100.00 100.00
* Islamabad Capital Territory is included ** Consumption in K-EL Area is not included# FATA is included ## Area served by K-EL is excludedSource: National Electric Power Regulatory Authority

14ELECTRICITY TARIFF


191
State of Industry Report 2015
14. ELECTRICITY TARIFF
The determination of tariff for electric power services is one of the primary responsibilities of NEPRA. NEPRA determineselectricitytariff,keepinginviewtheprinciplesofeconomicefficiencyandservicequalityaccordingto the prescribed Tariff Standards and Procedure Rules, 1998. Under Section 7 (3) of the NEPRA Act, NEPRA has been expressly conferred the power to determine tariff, rates, charges and other terms and conditions for the supply of electric power services by generation, transmission and distribution companies and to recommend thesetotheFederalGovernmentfornotification.
14.1 Tariff SettingTheproceduresand standards inaccordancewithwhich tariffs are required tobedetermined,modifiedorrevised are prescribed in the NEPRA (Tariff Standards and Procedure) Rules, 1998.
14.2 Tariff Standards
i) Tariffs should allows licenses the recovery of any and all costs prudently incurred to meet the demonstrated needs of their customers, provided that assessments of licensees’ prudence may not be required where tariffs are set on other than cost-of-service basis, such as formula-based tariffs that are designed to be in place for more than one year;
ii) Tariffs should generally be calculated by including a depreciation charge and a rate of return on the capital investment of each licensee commensurate to the earned by other investments of comparable risk;
iii) Tariffs should allow licensees a rate of return which promotes continued reasonable investment in equipmentandfacilitiesforimprovedandefficientservice;
iv) Tariffsshould includeamechanismtoallow licenseesabenefit from,andpenalties for failure toachieve,theefficienciesinthecostofprovidingtheserviceandthequalityofservice;
v) Tariffsshouldreflectmarginalcostprinciples totheextent feasible,keeping inviewthefinancialstability of the sector;
vi) The Authority shall have a preference for competition rather than regulation and shall adopt policies and establish tariffs towards that end;
vii) The tariff regime should clearly identify interclass and inter-region subsides and shall provide such subsides transparently if found essential, with a view to minimizing if not eliminating them keeping in view the need for an adequate transition period;
viii) Tariffs may be set below the level of cost of providing the service to consumers consuming electric power below the consumption levels determined for the purpose from time to time by the Authority, aslongassuchtariffsarefinanciallysustainable;
ix) Tariffsshould,totheextentfeasible,reflectthefullcostofservicetoconsumergroupswithsimilarservice requirements;
x) TariffshouldtakeintoaccountGovernmentsubsidiesortheneedforadjustmenttofinanceruralelectrificationinaccordancewiththepoliciesoftheGovernment;
xi) The application of the tariffs should allow reasonable transition periods for the adjustments of tariffs to meet the standards and other requirements pursuant to the Act including the performance standards, industry standards and the uniform codes of conduct;
xii) Tariffs should seek to provide stability and predict ability for customers; andxiii) Tariffs should be comprehensible, free of misinterpretation and shall state explicitly each component
thereof.
NEPRA is required to determine electricity tariff so as to protect the interest of the consumers as well as electric power producers/suppliers. Any raise in tariff requested by the producers/ suppliers of electricity has to be allowed or rejected by NEPRA after analyzing all the costs involved in the proposed sale price. For any determination of tariff, the following points are generally considered by NEPRA in addition to other points on case-to-case basis:

192
State of Industry Report 2015
i) Utility should be able to recover its costs with some surplus for capacity expansion or return on equity.
ii) The average sale rate should provide for reasonable rate of return.
TABLE 78NEPRA’s Monthly Fuel Price Adjustments in respect of DISCOs
MonthPESCO TESCO IESCO GEPCO LESCO FESCO MEPCO HESCO SEPCO QESCO
Increase/(Decrease) Rs./kWh
July, 2014 0.43 0.43 0.43 0.43 0.43 0.43 0.43 0.43 0.43 0.43
August, 2014 (0.30) (0.30) (0.30) (0.30) (0.30) (0.30) (0.30) (0.30) (0.30) (0.30)
September, 2014 0.52 0.52 0.52 0.52 0.52 0.52 0.52 0.52 0.52 0.52
October, 2014 (0.48) (0.48) (0.48) (0.48) (0.48) (0.48) (0.48) (0.48) (0.48) (0.48)
November, 2014 (2.97) (2.97) (2.97) (2.97) (2.97) (2.97) (2.97) (2.97) (2.97) (2.97)
December, 2014 (3.24) (3.24) (3.24) (3.24) (3.24) (3.24) (3.24) (3.24) (3.24) (3.24)
January, 2015 (2.08) (2.08) (2.08) (2.08) (2.08) (2.08) (2.08) (2.08) (2.08) (2.08)
February, 2015 (4.43) (4.43) (4.43) (4.43) (4.43) (4.43) (4.43) (4.43) (4.43) (4.43)
March, 2015 (3.62) (3.62) (3.62) (3.62) (3.62) (3.62) (3.62) (3.62) (3.62) (3.62)
April, 2015 (1.86) (1.86) (1.86) (1.86) (1.86) (1.86) (1.86) (1.86) (1.86) (1.86)
May, 2015 (2.69) (2.69) (2.69) (2.69) (2.69) (2.69) (2.69) (2.69) (2.69) (2.69)
June, 2015 (2.20) (2.20) (2.20) (2.20) (2.20) (2.20) (2.20) (2.20) (2.20) (2.20)Source: National Electric Power Regulatory Authority, Islamabad
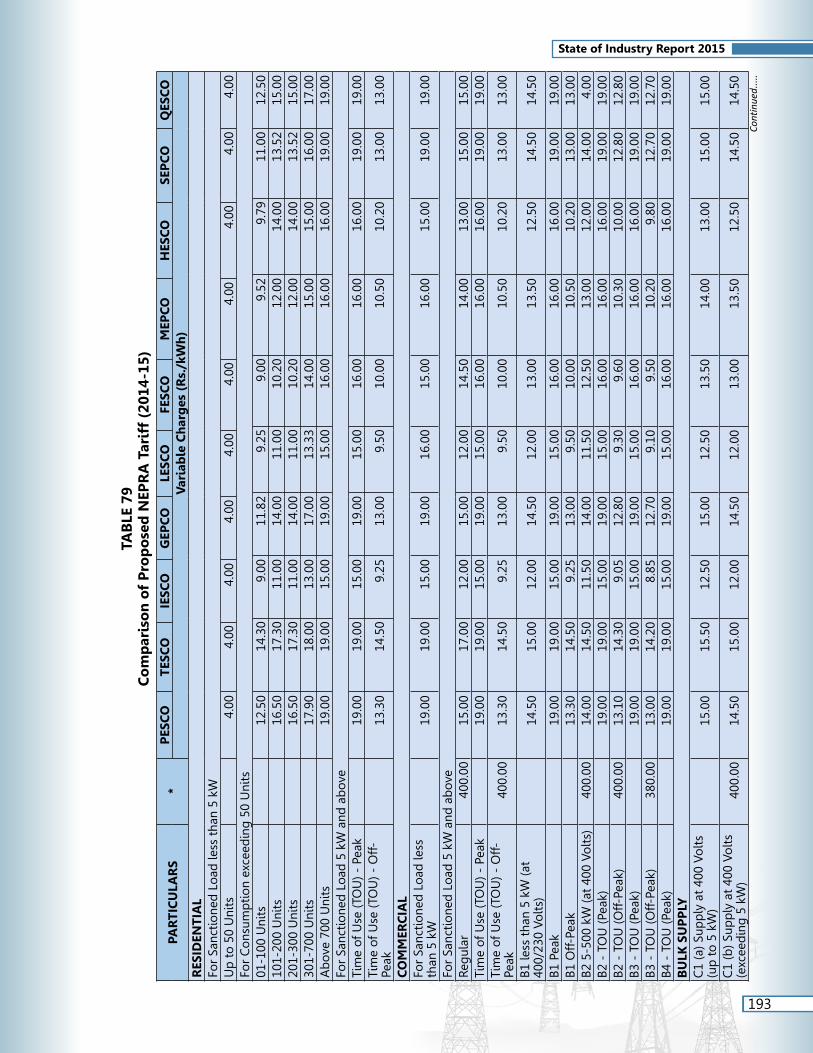
193
State of Industry Report 2015
TAB
LE 7
9C
om
par
iso
n o
f P
rop
ose
d N
EPR
A T
arif
f (2
014-
15)
PAR
TIC
ULA
RS
*P
ESC
OT
ESC
OIE
SCO
GEP
CO
LESC
OFE
SCO
MEP
CO
HES
CO
SEP
CO
QES
CO
Var
iab
le C
har
ges
(R
s./k
Wh
) R
ESID
ENT
IAL
For
Sanc
tio
ned
Loa
d le
ss t
han
5 kW
Up
to
50
Uni
ts4.
00
4.00
4.
00
4.00
4.
00
4.00
4.
00
4.00
4.
00
4.00
Fo
r C
ons
ump
tio
n ex
ceed
ing
50
Uni
ts01
-100
Uni
ts12
.50
14.3
0 9.
00
11.8
2 9.
25
9.00
9.
52
9.79
11
.00
12.5
0 10
1-20
0 U
nits
16.5
0 17
.30
11.0
0 14
.00
11.0
0 10
.20
12.0
0 14
.00
13.5
2 15
.00
201-
300
Uni
ts16
.50
17.3
0 11
.00
14.0
0 11
.00
10.2
0 12
.00
14.0
0 13
.52
15.0
0 30
1-70
0 U
nits
17.9
0 18
.00
13.0
0 17
.00
13.3
3 14
.00
15.0
0 15
.00
16.0
0 17
.00
Ab
ove
700
Uni
ts19
.00
19.0
0 15
.00
19.0
0 15
.00
16.0
0 16
.00
16.0
0 19
.00
19.0
0 Fo
r Sa
ncti
one
d L
oad
5 k
W a
nd a
bo
veTi
me
of U
se (T
OU
) - P
eak
19.0
0 19
.00
15.0
0 19
.00
15.0
0 16
.00
16.0
0 16
.00
19.0
0 19
.00
Tim
e of
Use
(TO
U) -
Off-
Peak
13.3
0 14
.50
9.25
13
.00
9.50
10
.00
10.5
0 10
.20
13.0
0 13
.00
CO
MM
ERC
IAL
For
Sanc
tio
ned
Loa
d le
ss
than
5 k
W19
.00
19.0
0 15
.00
19.0
0 16
.00
15.0
0 16
.00
15.0
0 19
.00
19.0
0
For
Sanc
tio
ned
Loa
d 5
kW
and
ab
ove
Reg
ular
400.
0015
.00
17.0
0 12
.00
15.0
0 12
.00
14.5
0 14
.00
13.0
0 15
.00
15.0
0 Ti
me
of U
se (T
OU
) - P
eak
19.0
0 19
.00
15.0
0 19
.00
15.0
0 16
.00
16.0
0 16
.00
19.0
0 19
.00
Tim
e of
Use
(TO
U) -
Off-
Peak
400.
0013
.30
14.5
0 9.
25
13.0
0 9.
50
10.0
0 10
.50
10.2
0 13
.00
13.0
0
B1 le
ss t
han
5 kW
(at
400/
230
Volt
s)14
.50
15.0
0 12
.00
14.5
0 12
.00
13.0
0 13
.50
12.5
0 14
.50
14.5
0
B1 P
eak
19.0
0 19
.00
15.0
0 19
.00
15.0
0 16
.00
16.0
0 16
.00
19.0
0 19
.00
B1 O
ff-Pe
ak13
.30
14.5
0 9.
25
13.0
0 9.
50
10.0
0 10
.50
10.2
0 13
.00
13.0
0 B2
5-5
00 k
W (a
t 40
0 Vo
lts)
400.
0014
.00
14.5
0 11
.50
14.0
0 11
.50
12.5
0 13
.00
12.0
0 14
.00
4.00
B2
- T
OU
(Pea
k)19
.00
19.0
0 15
.00
19.0
0 15
.00
16.0
0 16
.00
16.0
0 19
.00
19.0
0 B2
- T
OU
(Off-
Peak
)40
0.00
13.1
0 14
.30
9.05
12
.80
9.30
9.
60
10.3
0 10
.00
12.8
0 12
.80
B3 -
TO
U (P
eak)
19.0
0 19
.00
15.0
0 19
.00
15.0
0 16
.00
16.0
0 16
.00
19.0
0 19
.00
B3 -
TO
U (O
ff-Pe
ak)
380.
0013
.00
14.2
0 8.
85
12.7
0 9.
10
9.50
10
.20
9.80
12
.70
12.7
0 B4
- T
OU
(Pea
k)19
.00
19.0
0 15
.00
19.0
0 15
.00
16.0
0 16
.00
16.0
0 19
.00
19.0
0 B
ULK
SU
PP
LYC
1 (a
) Sup
ply
at
400
Volt
s (u
p t
o 5
kW
)15
.00
15.5
0 12
.50
15.0
0 12
.50
13.5
0 14
.00
13.0
0 15
.00
15.0
0
C1
(b) S
upp
ly a
t 40
0 Vo
lts
(exc
eed
ing
5 k
W)
400.
0014
.50
15.0
0 12
.00
14.5
0 12
.00
13.0
0 13
.50
12.5
0 14
.50
14.5
0 Co
ntin
ued.
....

194
State of Industry Report 2015
PAR
TIC
ULA
RS
*P
ESC
OT
ESC
OIE
SCO
GEP
CO
LESC
OFE
SCO
MEP
CO
HES
CO
SEP
CO
QES
CO
Var
iab
le C
har
ges
(R
s./k
Wh
) Ti
me
of U
se (T
OU
) - P
eak
19.0
0 19
.00
15.0
0 19
.00
15.0
0 16
.00
16.0
0 16
.00
19.0
0 19
.00
Tim
e of
Use
(TO
U) -
Off-
Peak
400.
0013
.30
14.5
0 9.
25
13.0
0 9.
50
10.0
0 10
.50
10.2
0 13
.00
13.0
0
C2
Sup
ply
at
11 k
V38
0.00
14.3
0 14
.80
11.8
0 14
.30
11.8
0 12
.80
13.3
0 12
.30
14.3
0 14
.30
Tim
e of
Use
(TO
U) -
Pea
k19
.00
19.0
0 15
.00
19.0
0 15
.00
16.0
0 16
.00
16.0
0 19
.00
19.0
0 Ti
me
of U
se (T
OU
) - O
ff-Pe
ak38
0.00
13.1
0 14
.30
9.05
12
.80
9.30
9.
60
10.3
0 10
.00
12.8
0 12
.80
C3
Sup
ply
ab
ove
11
kV36
0.00
14.2
0 14
.70
11.7
0 14
.20
11.7
0 12
.70
13.2
0 12
.20
14.2
0 14
.20
Tim
e of
Use
(TO
U) -
Pea
k19
.00
19.0
0 15
.00
19.0
0 15
.00
16.0
0 16
.00
16.0
0 19
.00
19.0
0 Ti
me
of U
se (T
OU
) - O
ff-Pe
ak36
0.00
13.0
0 14
.20
8.85
12
.70
9.10
9.
50
10.2
0 9.
80
12.7
0 12
.70
AG
RIC
ULT
UR
AL
SCA
RP
14.5
0 15
.00
12.0
0 14
.50
12.0
0 13
.00
13.5
0 12
.50
15.5
0 15
.20
Tim
e of
Use
(TO
U) -
Pea
k19
.00
19.0
0 15
.00
19.0
0 15
.00
16.0
0 16
.00
16.0
0 19
.00
19.0
0 Ti
me
of U
se (T
OU
) - O
ff-Pe
ak20
0.00
13.0
0 14
.20
8.85
12
.70
9.10
9.
50
10.2
0 9.
80
12.7
0 12
.70
Ag
ricu
ltur
al T
ube-
wel
ls20
0.00
14.0
0 14
.50
11.5
0 14
.00
11.5
0 12
.50
13.0
0 12
.00
15.0
0 14
.70
Tim
e of
Use
(TO
U) -
Pea
k19
.00
19.0
0 15
.00
19.0
0 15
.00
16.0
0 16
.00
16.0
0 19
.00
19.0
0 Ti
me
of U
se (T
OU
) - O
ff-Pe
ak20
0.00
13.0
0 14
.20
8.85
12
.70
9.10
9.
50
10.2
0 9.
80
12.7
0 12
.70
PU
BLI
C L
IGH
TIN
G14
.00
15.0
0 14
.00
14.0
0 14
.00
14.0
0 14
.00
14.0
0 14
.00
14.0
0 R
ESID
ENT
IAL
CO
LON
IES
AT
TAC
HED
. TO
IN
DU
STR
IES
14.0
0 15
.00
14.0
0 14
.00
14.0
0 14
.00
14.0
0 14
.00
14.0
0 14
.00
Rai
lway
Tra
ctio
n
14
.00
14
.00
Sp
ecia
l Co
ntra
cts
- A
J&K
360.
0014
.00
11
.24
14.0
0
Ti
me
of U
se (T
OU
) - P
eak
19.0
0
15.0
0 19
.00
Tim
e of
Use
(TO
U) -
Off-
Peak
360.
0013
.30
8.
85
12.7
0
Spec
ial C
ont
ract
s -
Raw
at
Lab
.*
14
.00
* Fi
xed
Char
ges (
Rs./
kW/M
onth
)So
urce
: Nati
onal
Ele
ctric
Pow
er R
egul
ator
y Au
thor
ity, I
slam
abad
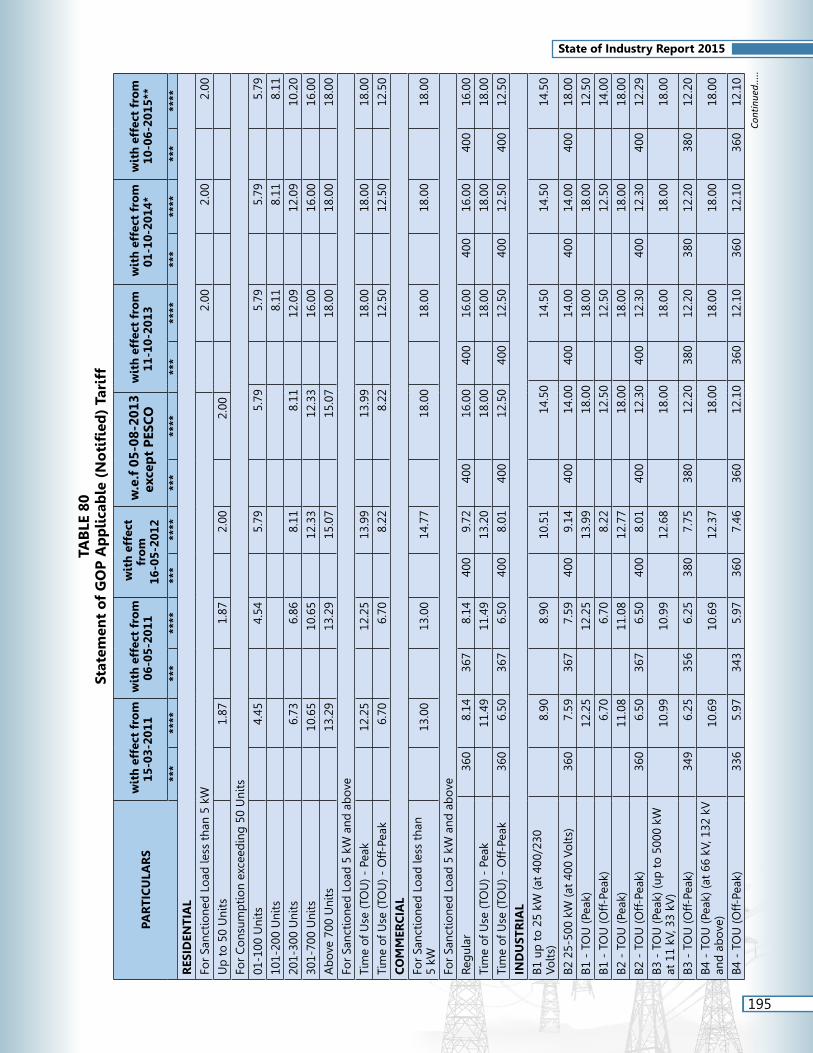
195
State of Industry Report 2015
TAB
LE 8
0St
atem
ent
of
GO
P A
pp
lica
ble
(N
oti
fied
) Ta
riff
PAR
TIC
ULA
RS
wit
h e
ffec
t fr
om
15
-03-
2011
w
ith
eff
ect
fro
m
06-0
5-20
11
wit
h e
ffec
t fr
om
16
-05-
2012
w.e
.f 0
5-08
-201
3 ex
cep
t P
ESC
O
wit
h e
ffec
t fr
om
11
-10-
2013
w
ith
eff
ect
fro
m
01-1
0-20
14*
wit
h e
ffec
t fr
om
10
-06-
2015
**
***
****
***
****
***
****
***
****
***
****
***
****
***
****
RES
IDEN
TIA
L
For
Sanc
tio
ned
Loa
d le
ss t
han
5 kW
2.
00
2.
00
2.00
Up
to
50
Uni
ts
1.87
1.87
2.00
2.00
For
Co
nsum
pti
on
exce
edin
g 5
0 U
nits
01-1
00 U
nits
4.
45
4.
54
5.
79
5.
79
5.
79
5.
79
5.79
101-
200
Uni
ts
8.11
8.11
8.
11
201-
300
Uni
ts
6.73
6.86
8.11
8.11
12.0
9
12.0
9
10.2
0
301-
700
Uni
ts
10.6
5
10.6
5
12.3
3
12.3
3
16.0
0
16.0
0
16.0
0
Ab
ove
700
Uni
ts
13.2
9
13.2
9
15.0
7
15.0
7
18.0
0
18.0
0
18.0
0
For
Sanc
tio
ned
Loa
d 5
kW
and
ab
ove
Tim
e of
Use
(TO
U) -
Pea
k
12.2
5
12.2
5
13.9
9
13.9
9
18.0
0
18.0
0
18.0
0
Tim
e of
Use
(TO
U) -
Off-
Peak
6.
70
6.
70
8.
22
8.
22
12
.50
12
.50
12
.50
CO
MM
ERC
IAL
For
Sanc
tio
ned
Loa
d le
ss t
han
5 kW
13
.00
13
.00
14
.77
18
.00
18
.00
18
.00
18
.00
For
Sanc
tio
ned
Loa
d 5
kW
and
ab
ove
Reg
ular
360
8.14
36
7 8.
14
400
9.72
40
0 16
.00
400
16.0
0 40
0 16
.00
400
16.0
0
Tim
e of
Use
(TO
U) -
Pea
k
11.4
9
11.4
9
13.2
0
18.0
0
18.0
0
18.0
0
18.0
0
Tim
e of
Use
(TO
U) -
Off-
Peak
360
6.50
36
7 6.
50
400
8.01
40
0 12
.50
400
12.5
0 40
0 12
.50
400
12.5
0
IND
UST
RIA
L
B1 u
p t
o 2
5 kW
(at
400/
230
Volt
s)
8.90
8.90
10.5
1
14.5
0
14.5
0
14.5
0
14.5
0
B2 2
5-50
0 kW
(at
400
Volt
s)36
0 7.
59
367
7.59
40
0 9.
14
400
14.0
0 40
0 14
.00
400
14.0
040
0 18
.00
B1 -
TO
U (P
eak)
12
.25
12
.25
13
.99
18
.00
18
.00
18
.00
12
.50
B1 -
TO
U (O
ff-Pe
ak)
6.
70
6.
70
8.
22
12
.50
12
.50
12
.50
14
.00
B2 -
TO
U (P
eak)
11
.08
11
.08
12
.77
18
.00
18
.00
18
.00
18
.00
B2 -
TO
U (O
ff-Pe
ak)
360
6.50
36
7 6.
50
400
8.01
40
0 12
.30
400
12.3
0 40
0 12
.30
400
12.2
9
B3 -
TO
U (P
eak)
(up
to
500
0 kW
at
11
kV, 3
3 kV
)
10.9
9
10.9
9
12.6
8
18.0
0
18.0
0
18.0
0
18.0
0
B3 -
TO
U (O
ff-Pe
ak)
349
6.25
35
6 6.
25
380
7.75
38
0 12
.20
380
12.2
0 38
0 12
.20
380
12.2
0
B4 -
TO
U (P
eak)
(at
66 k
V, 1
32 k
V
and
ab
ove
)
10.6
9
10.6
9
12.3
7
18.0
0
18.0
0
18.0
0
18.0
0
B4 -
TO
U (O
ff-Pe
ak)
336
5.97
34
3 5.
97
360
7.46
36
0 12
.10
360
12.1
0 36
0 12
.10
360
12.1
0 Co
ntin
ued.
....

196
State of Industry Report 2015
PAR
TIC
ULA
RS
wit
h e
ffec
t fr
om
15
-03-
2011
w
ith
eff
ect
fro
m
06-0
5-20
11
wit
h e
ffec
t fr
om
16
-05-
2012
w.e
.f 0
5-08
-201
3 ex
cep
t P
ESC
O
wit
h e
ffec
t fr
om
11
-10-
2013
w
ith
eff
ect
fro
m
01-1
0-20
14*
wit
h e
ffec
t fr
om
10
-06-
2015
****
***
****
***
****
***
****
***
****
***
****
***
****
***
**B
ULK
SU
PP
LY
C1
(a) S
upp
ly a
t 40
0 Vo
lts
- le
ss
than
5 k
W
9.90
9.90
11.5
5
15.0
0
15.0
0
15.0
0
15.0
0
C1
(b) S
upp
ly a
t 40
0 Vo
lts
- 5
kW
and
ab
ove
360
8.75
36
7 8.
75
400
10.3
5 40
0 14
.50
400
14.5
0 40
0 14
.50
400
14.5
0
Tim
e of
Use
(TO
U) -
Pea
k
11.3
1
11.3
1
13.0
1
18.0
0
18.0
0
18.0
0
18.0
0
Tim
e of
Use
(TO
U) -
Off-
Peak
360
6.50
36
7 6.
50
400
8.01
40
0 12
.50
400
12.5
0 40
0 12
.50
400
12.5
0
C2
Sup
ply
at
11 k
V34
9 8.
65
356
8.65
38
0 10
.25
380
14.3
0 38
0 14
.30
380
14.3
038
0 14
.30
Tim
e of
Use
(TO
U) -
Pea
k
10.9
1
10.9
1
12.6
0
18.0
0
18.0
0
18.0
0
18.0
0
Tim
e of
Use
(TO
U) -
Off-
Peak
349
6.25
35
6 6.
25
380
7.75
38
0 12
.30
380
12.3
0 38
0 12
.30
380
12.3
0
C3
Sup
ply
ab
ove
11
kV33
6 8.
51
343
8.51
36
0 10
.10
360
14.2
0 36
0 14
.20
360
14.2
036
0 14
.20
Tim
e of
Use
(TO
U) -
Pea
k
10.5
1
10.5
1
12.1
8
18.0
0
18.0
0
18.0
0
18.0
0
Tim
e of
Use
(TO
U) -
Off-
Peak
336
5.87
34
3 5.
87
360
7.35
36
0 12
.20
360
12.2
0 36
0 12
.20
360
12.2
0
AG
RIC
ULT
UR
AL
SCA
RP
8.
47
8.
47
10
.00
10
.00
13
.01
13
.01
12
.00
Ag
ricu
ltur
al T
ube-
wel
ls10
3 5.
31
105
5.31
12
0 6.
77
200
6.77
20
0 10
.35
200
11.5
120
0 15
.00
SCA
RP
5 k
W a
nd
ab
ove
Tim
e of
Use
(TO
U) -
Pea
k
17.0
0
17.0
0
8.8
5
Tim
e of
Use
(TO
U) -
Off-
Peak
200
10.0
0 20
0 10
.00
200
11.5
0
Ag
ricu
ltu
ral
5 kW
an
d a
bo
ve
Tim
e of
Use
(TO
U) -
Pea
k
10.1
1
10.1
1
13.0
0
13.0
0
10.3
5
10.3
5
10.3
5
Tim
e of
Use
(TO
U) -
Off-
Peak
200
4.55
20
0 4.
55
200
8.00
20
0 8.
00
200
10.3
5 20
0 10
.35
200
8.8
5
PU
BLI
C L
IGH
TIN
G
12.0
0
12.0
0
13.7
3
13.7
3
15.0
0
15.0
0
15.0
0
RES
IDEN
TIA
L C
OLO
NIE
S A
T-
TAC
HED
TO
IN
DU
STR
IES
11
.22
11
.22
12
.92
12
.92
15
.00
15
.00
15
.00
RA
ILW
AY
TR
AC
TIO
N
9.96
9.96
11.0
0
11.0
0
15.0
0
15.0
0
15.0
0
Spec
ial
Co
ntr
acts
- A
J&K
323
4.21
34
3 4.
21
360
5.63
36
0 12
.22
360
12.2
2 36
0 12
.22
360
12.2
2
Tim
e of
Use
(TO
U) -
Pea
k
11.5
9
11.5
9
13.3
0
18.0
0
18.0
0
18.0
0
18.0
0
Tim
e of
Use
(TO
U) -
Off-
Peak
323
6.41
34
3 6.
41
360
7.92
36
0 12
.20
360
12.2
0 36
0 12
.20
360
12.2
0
Spec
ial
Co
ntr
acts
- R
awat
Lab
.
8.75
8.75
11.5
0
11.5
0
15.0
0
15.0
0
15.0
0 *
GO
P Ta
riff w
ith e
ffect
from
01-
10-2
014
also
incl
udes
an
amou
nt o
f sur
char
ge to
be
depo
sited
in U
OF.
**
GO
P Ta
riff w
ith e
ffect
from
10-
06-2
015
also
incl
udes
an
amou
nt o
f Tar
iff
Ratio
naliz
ation
Sur
char
ge.
***
F
ixed
Cha
rges
(Rs.
/kW
/Mon
th)
****
Va
riabl
e Ch
arge
s (Rs
./kW
h)
So
urce
: Nati
onal
Ele
ctric
Pow
er R
egul
ator
y Au
thor
ity, I
slam
abad

197
State of Industry Report 2015
TABLE 81Comparative Tariff Statement of Peshawar Electric Supply Company Limited (PESCO)
PARTICULARS2010-11 2011-12 2012-13 2013-14 2014-15
* ** * ** * ** * ** * **RESIDENTIALFor Sanctioned Load less than 5 kW
Up to 50 Units 2.00 3.00 4.00 4.00 4.00
For Consumption exceeding 50 Units01-100 Units 9.50 11.15 15.00 13.00 12.50 101-200 Units 16.24 16.50 201-300 Units 11.00 15.50 16.50 16.24 16.50 301-700 Units 12.50 17.50 18.50 17.90 17.90 Above 700 Units 14.50 19.50 20.50 19.00 19.00 For Sanctioned Load 5 kW and aboveTime of Use (TOU) - Peak 13.00 19.50 20.50 19.00 19.00 Time of Use (TOU) - Off-Peak 7.50 11.50 15.50 13.30 13.30 COMMERCIALFor Sanctioned Load less than 5 kW 14.50 19.50 20.50 19.00 19.00 For Sanctioned Load 5 kW and aboveRegular 400.00 12.00 400.00 17.00 400.00 19.00 400.00 16.00 400.00 15.00 Time of Use (TOU) - Peak 12.50 19.50 20.50 19.00 19.00 Time of Use (TOU) - Off-Peak 400.00 7.00 400.00 11.50 400.00 15.50 400.00 13.30 400.00 13.30 INDUSTRIALB1 Less than 5 kW (at 400/230 Volts) 10.50 15.50 17.00 15.50 14.50 B1 Peak 19.50 20.50 19.00 19.00 B1 Off-Peak 11.50 15.50 13.30 13.30 B2 5-500 kW (at 400 Volts) 400.00 9.50 400.00 14.50 400.00 16.50 400.00 15.00 400.00 14.00 B2 - TOU (Peak) 12.50 19.50 20.50 19.00 19.00 B2 - TOU (Off-Peak) 400.00 7.00 400.00 11.40 400.00 15.30 400.00 13.10 400.00 13.10 B3 - TOU (Peak) (up to 5000 kW at 11 kV, 33 kV)
12.25 19.50 20.50 19.00 19.00
B3 - TOU (Off-Peak) 380.00 6.75 380.00 11.30 380.00 15.20 380.00 13.00 380.00 13.00 B4 - TOU (Peak) (at 66 kV, 132 kV and above)
12.00 19.50 20.50 19.00 19.00
B4 - TOU (Off-Peak) 360.00 6.50 360.00 11.20 360.00 15.10 360.00 12.90 360.00 12.90 BULK SUPPLYC1 (a) Supply at 400 Volts - less than 5 kW
11.00 16.50 17.50 16.00 15.00
C1 (b) Supply at 400 Volts - 5 kW and above
400.00 10.00 400.00 15.50 400.00 16.50 400.00 15.50 400.00 14.50
Time of Use (TOU) - Peak 12.50 19.50 20.50 19.00 19.00 Time of Use (TOU) - Off-Peak 400.00 7.00 400.00 11.40 400.00 15.50 400.00 13.30 400.00 13.30 C2 Supply at 11 kV 380.00 9.75 380.00 15.25 380.00 16.30 380.00 15.30 380.00 14.30 Time of Use (TOU) - Peak 12.25 19.50 20.50 19.00 19.00 Time of Use (TOU) - Off-Peak 380.00 6.75 380.00 11.30 380.00 15.40 380.00 13.10 380.00 13.10 C3 Supply above 11 kV 360.00 9.50 360.00 15.00 360.00 16.20 360.00 15.20 360.00 14.20 Time of Use (TOU) - Peak 12.00 19.50 20.50 19.00 19.00 Time of Use (TOU) - Off-Peak 360.00 6.50 360.00 11.20 360.00 15.30 360.00 13.00 360.00 13.00 AGRICULTURALSCAPR 11.00 14.30 17.00 15.50 14.50 Time of Use (TOU) - Peak 19.00 19.00 Time of Use (TOU) - Off-Peak 200.00 13.00 200.00 13.00 Agricultural Tube-wells 200.00 8.00 200.00 13.30 200.00 16.50 200.00 15.00 200.00 14.00 Time of Use (TOU) - Peak 12.50 19.50 20.50 19.00 19.00 Time of Use (TOU) - Off-Peak 200.00 6.00 200.00 11.00 200.00 15.30 200.00 13.00 200.00 13.00 PUBLIC LIGHTING 13.00 16.40 15.85 15.00 14.00 RESIDENTIAL COLONIES ATT. TO INDUSTRIES
13.00 16.40 15.00 15.00 14.00
Special Contracts - AJ&K 360.00 9.75 360.00 13.50 360.00 16.16 360.00 14.38 360.00 14.00 Time of Use (TOU) - Peak 12.00 19.50 20.50 19.00 19.00 Time of Use (TOU) - Off-Peak 360.00 6.50 360.00 11.00 360.00 15.30 360.00 13.00 360.00 13.30
* Fixed Charges (Rs./kW/Month) **Variable Charges (Rs./kWh)Source: National Electric Power Regulatory Authority, Islamabad

198
State of Industry Report 2015
TABLE 82Comparative Tariff Statement of Tribal Area Electric Supply Company Limited (TESCO)
PARTICULARS2013-14 2014-15
Fixed* Variable** Fixed* Variable**RESIDENTIALFor Sanctioned Load less than 5 kWUp to 50 Units 4.00 4.00 For Consumption exceeding 50 Units01-100 Units 12.70 14.30
101-200 Units 14.50 17.30
201-300 Units 14.50 17.30 301-700 Units 16.50 18.00 Above 700 Units 17.50 19.00 For Sanctioned Load 5 kW and aboveTime of Use (TOU) - Peak 17.50 19.00 Time of Use (TOU) - Off-Peak 11.50 14.50 COMMERCIALFor Sanctioned Load less than 5 kW 17.50 19.00 For Sanctioned Load 5 kW and aboveRegular 400.00 15.00 400.00 17.00 Time of Use (TOU) - Peak 17.50 19.00 Time of Use (TOU) - Off-Peak 400.00 11.50 400.00 14.50 INDUSTRIALB1 Less than 5 kW (at 400/230 Volts) 14.50 15.00 B1 Peak 17.50 19.00 B1 Off-Peak 11.50 14.50 B2 5-500 kW (at 400 Volts) 400.00 14.00 400.00 14.50 B2 - TOU (Peak) 17.50 19.00 B2 - TOU (Off-Peak) 400.00 11.30 400.00 14.30 B3 - TOU (Peak) (up to 5000 kW at 11 kV, 33 kV) 17.50 19.00 B3 - TOU (Off-Peak) 380.00 11.20 380.00 14.20 B4 - TOU (Peak) (at 66 kV, 132 kV and above) 17.50 19.00 B4 - TOU (Off-Peak) 360.00 11.10 360.00 14.10 BULK SUPPLYC1 (a) Supply at 400 Volts - less than 5 kW 15.00 15.50 C1 (b) Supply at 400 Volts - 5 kW and above 400.00 14.50 400.00 15.00 Time of Use (TOU) - Peak 17.50 19.00 Time of Use (TOU) - Off-Peak 400.00 11.50 400.00 14.50 C2 Supply at 11 kV 380.00 14.30 380.00 14.80 Time of Use (TOU) - Peak 17.50 19.00 Time of Use (TOU) - Off-Peak 380.00 11.30 380.00 14.30 C3 Supply above 11 kV 360.00 14.20 360.00 14.70 Time of Use (TOU) - Peak 17.50 19.00 Time of Use (TOU) - Off-Peak 360.00 11.20 360.00 14.20 AGRICULTURALSCARP 13.50 15.00 Time of Use (TOU) - Peak 17.50 19.00 Time of Use (TOU) - Off-Peak 200.00 11.20 200.00 14.20 Agricultural Tube-wells 200.00 12.97 200.00 14.50 Time of Use (TOU) - Peak 17.50 19.00 Time of Use (TOU) - Off-Peak 200.00 11.20 200.00 14.20 PUBLIC LIGHTING 15.00 15.00 RESIDENTIAL COLONIES ATT. TO INDUSTRIES 15.00 15.00
* Fixed Charges (Rs./kW/Month) ** Variable Charges (Rs./kWh)Source: National Electric Power Regulatory Authority, Islamabad

199
State of Industry Report 2015
TABLE 83Comparative Tariff Statement of Islamabad Electric Supply Company Limited (IESCO)
PARTICULARS2010-11 2011-12 2012-13 2013-14 2014-15
* ** * ** * ** * ** * **RESIDENTIALFor Sanctioned Load less than 5 kWUp to 50 Units 2.00 3.00 4.00 4.00 4.00 For Consumption exceeding 50 Units01-100 Units 6.27 8.70 11.00 10.50 9.00 101-200 Units 12.50 11.00 201-300 Units 7.20 10.20 15.00 12.50 11.00 301-700 Units 10.65 14.00 17.00 15.00 13.00 Above 700 Units 13.30 16.50 18.00 17.50 15.00 For Sanctioned Load 5 kW and aboveTime of Use (TOU) - Peak 12.25 15.50 18.00 17.50 15.00 Time of Use (TOU) - Off-Peak 6.70 9.10 12.50 11.50 9.25 COMMERCIALFor Sanctioned Load less than 5 kW
13.00 16.50 18.00 17.50 15.00
For Sanctioned Load 5 kW and aboveRegular 400.00 8.14 400.00 11.00 400.00 16.00 400.00 15.00 400.00 12.00 Time of Use (TOU) - Peak 11.49 15.00 18.00 17.50 15.00 Time of Use (TOU) - Off-Peak 400.00 6.50 400.00 9.30 400.00 12.50 400.00 11.50 400.00 9.25 INDUSTRIALB1 Less than 5 kW (at 400/230 Volts)
8.90 11.70 14.50 14.50 12.00
B1 Peak 15.50 18.00 17.50 15.00 B1 Off-Peak 9.10 12.50 11.50 9.25 B2 5-500 kW (at 400 Volts) 400.00 7.59 400.00 10.30 400.00 14.00 400.00 14.00 400.00 11.50 B2 - TOU (Peak) 11.08 14.30 18.00 17.50 15.00 B2 - TOU (Off-Peak) 400.00 6.50 400.00 9.00 400.00 12.30 400.00 11.30 400.00 9.05 B3 - TOU (Peak) (up to 5000 kW at 11 kV, 33 kV)
10.99 14.10 18.00 17.50 15.00
B3 - TOU (Off-Peak) 380.00 6.25 380.00 8.90 380.00 12.20 380.00 11.20 380.00 8.85 B4 - TOU (Peak) (at 66 kV, 132 kV and above)
10.69 13.90 18.00 17.50 15.00
B4 - TOU (Off-Peak) 360.00 5.97 360.00 8.80 360.00 12.10 360.00 11.10 360.00 8.75 BULK SUPPLYC1 (a) Supply at 400 Volts - less than 5 kW
9.90 12.50 15.00 15.00 12.50
C1 (b) Supply at 400 Volts - 5 kW and above
400.00 8.75 400.00 11.50 400.00 14.50 400.00 14.50 400.00 12.00
Time of Use (TOU) - Peak 11.31 14.30 18.00 17.50 15.00 Time of Use (TOU) - Off-Peak 400.00 6.50 400.00 9.00 400.00 12.50 400.00 11.50 400.00 9.25 C2 Supply at 11 kV 380.00 8.65 380.00 11.30 380.00 14.30 380.00 14.30 380.00 11.80 Time of Use (TOU) - Peak 10.91 14.10 18.00 17.50 15.00 Time of Use (TOU) - Off-Peak 380.00 6.25 380.00 8.90 380.00 12.30 380.00 11.30 380.00 9.05 C3 Supply above 11 kV 360.00 8.51 360.00 11.10 360.00 14.20 360.00 14.20 360.00 11.70 Time of Use (TOU) - Peak 10.51 13.90 18.00 17.50 15.00 Time of Use (TOU) - Off-Peak 360.00 5.87 360.00 8.80 360.00 12.20 360.00 11.20 360.00 8.85 AGRICULTURAL
SCARP 8.47 11.20 14.50 14.50 12.00
Time of Use (TOU) - Peak 17.50 15.00 Time of Use (TOU) - Off-Peak 200.00 11.20 200.00 8.85 Agricultural Tube-wells 200.00 5.31 200.00 8.00 200.00 14.00 200.00 14.00 200.00 11.50 Time of Use (TOU) - Peak 10.11 13.00 18.00 17.50 15.00 Time of Use (TOU) - Off-Peak 200.00 4.55 200.00 8.00 200.00 12.20 200.00 11.20 200.00 8.85 PUBLIC LIGHTING 12.00 15.00 15.00 15.00 14.00 RESIDENTIAL COLONIES ATT. TO INDUSTRIES
11.22 14.00 15.00 15.00 14.00
Special Contracts - AJ&K 360.00 6.65 360.00 9.60 360.00 12.22 360.00 14.38 360.00 11.24 Time of Use (TOU) - Peak 11.59 15.00 18.00 17.50 15.00 Time of Use (TOU) - Off-Peak 360.00 6.41 360.00 9.00 360.00 12.20 360.00 11.20 360.00 8.85 Special Contract - Rawat Lab. 8.75 11.50 15.00 15.00 14.00
* Fixed Charges (Rs./kW/Month) ** Variable Charges (Rs./kWh)Source: National Electric Power Regulatory Authority, Islamabad

200
State of Industry Report 2015
TABLE 84Comparative Tariff Statement of Gujranwala Electric Power Company Limited (GEPCO)
PARTICULARS2010-11 2011-12 2012-13 2013-14 2014-15
* ** * ** * ** * ** * **RESIDENTIALFor Sanctioned Load less than 5 kWUp to 50 Units 2.00 3.00 4.00 4.00 4.00 For Consumption exceeding 50 Units01-100 Units 8.25 9.50 12.10 13.26 11.82 101-200 Units 16.90 14.00 201-300 Units 10.00 13.55 15.00 16.90 14.00 301-700 Units 11.50 15.50 17.00 17.90 17.00 Above 700 Units 13.70 16.50 19.00 19.00 19.00 For Sanctioned Load 5 kW and aboveTime of Use (TOU) - Peak 12.25 15.00 19.00 19.00 19.00 Time of Use (TOU) - Off-Peak 6.75 9.50 12.50 13.50 13.00 COMMERCIALFor Sanctioned Load less than 5 kW 14.35 17.50 18.00 19.00 19.00
For Sanctioned Load 5 kW and aboveRegular 400.00 11.50 400.00 14.50 400.00 16.00 400.00 16.00 400.00 15.00 Time of Use (TOU) - Peak 12.00 15.00 19.00 19.00 19.00 Time of Use (TOU) - Off-Peak 400.00 6.50 400.00 9.50 400.00 12.50 400.00 13.50 400.00 13.00 INDUSTRIALB1 Less than 5 kW (at 400/230 Volts) 8.90 12.00 15.50 15.50 14.50
B1 Peak 15.00 19.00 19.00 19.00 B1 Off-Peak 9.50 12.50 13.50 13.00 B2 5-500 kW (at 400 Volts) 400.00 7.59 400.00 10.50 400.00 15.00 400.00 15.00 400.00 14.00 B2 - TOU (Peak) 11.08 15.00 19.00 19.00 19.00 B2 - TOU (Off-Peak) 400.00 6.50 400.00 9.30 400.00 12.30 400.00 13.30 400.00 12.80 B3 - TOU (Peak) (up to 5000 kW at 11 kV, 33 kV) 10.99 14.70 19.00 19.00 19.00
B3 - TOU (Off-Peak) 380.00 6.25 380.00 9.20 380.00 12.20 380.00 13.20 380.00 12.70 B4 - TOU (Peak) (at 66 kV, 132 kV and above) 10.69 14.50 19.00 19.00 19.00
B4 - TOU (Off-Peak) 360.00 5.97 360.00 9.10 360.00 12.10 360.00 13.10 360.00 12.60 BULK SUPPLYC1 (a) Supply at 400 Volts - less than 5 kW 9.90 13.00 15.00 16.00 15.00
C1 (b) Supply at 400 Volts - 5 kW and above 400.00 8.75 400.00 11.50 400.00 14.50 400.00 15.50 400.00 14.50
Time of Use (TOU) - Peak 11.31 15.00 19.00 19.00 19.00 Time of Use (TOU) - Off-Peak 400.00 6.50 400.00 9.30 400.00 12.50 400.00 13.50 400.00 13.00 C2 Supply at 11 kV 380.00 8.65 380.00 11.40 380.00 14.40 380.00 15.30 380.00 14.30 Time of Use (TOU) - Peak 10.91 14.70 19.00 19.00 19.00 Time of Use (TOU) - Off-Peak 380.00 6.25 380.00 9.20 380.00 12.30 380.00 13.30 380.00 12.80 C3 Supply above 11 kV 360.00 8.51 360.00 11.30 360.00 14.30 360.00 15.20 360.00 14.20 Time of Use (TOU) - Peak 10.51 14.50 19.00 19.00 19.00 Time of Use (TOU) - Off-Peak 360.00 5.87 360.00 9.10 360.00 12.20 360.00 13.20 360.00 12.70 AGRICULTURALSCARP 8.47 11.00 15.50 15.50 14.50 Time of Use (TOU) - Peak 19.00 19.00 Time of Use (TOU) - Off-Peak 200.00 13.20 200.00 12.70 Agricultural Tube-wells 200.00 5.31 200.00 9.50 200.00 15.00 200.00 15.00 200.00 14.00 Time of Use (TOU) - Peak 10.11 14.50 19.00 19.00 19.00 Time of Use (TOU) - Off-Peak 200.00 4.55 200.00 9.10 200.00 12.20 200.00 13.20 200.00 12.70 PUBLIC LIGHTING 12.00 15.00 15.00 15.00 14.00 RESIDENTIAL COLONIES ATT. TO INDUSTRIES 11.22 14.25 15.00 15.00 14.00
Special Contracts - AJ&K 360.00 8.75 360.00 13.00 360.00 13.33 360.00 15.00 360.00 14.00 Time of Use (TOU) - Peak 11.59 14.50 19.00 19.00 19.00 Time of Use (TOU) - Off-Peak 360.00 6.41 360.00 9.10 360.00 12.20 360.00 13.20 360.00 12.70
* Fixed Charges (Rs./kW/Month) ** Variable Charges (Rs./kWh)Source: National Electric Power Regulatory Authority, Islamabad

201
State of Industry Report 2015
TABLE 85Comparative Tariff Statement of Lahore Electric Supply Company Limited (LESCO)
PARTICULARS2010-11 2011-12 2012-13 2013-14 2014-15
* ** * ** * ** * ** * **For Sanctioned Load less than 5 kWUp to 50 Units 2.00 3.00 4.00 4.00 4.00 For Consumption exceeding 50 Units01-100 Units 6.85 9.27 11.09 10.00 9.25 101-200 Units 12.33 11.00 201-300 Units 8.30 10.50 14.00 12.33 11.00 301-700 Units 10.65 13.50 17.00 15.00 13.33 Above 700 Units 13.29 15.50 18.00 17.50 15.00 For Sanctioned Load 5 kW and aboveTime of Use (TOU) - Peak 12.25 15.00 18.00 17.50 15.00 Time of Use (TOU) - Off-Peak 6.70 9.50 12.50 11.50 9.50 COMMERCIALFor Sanctioned Load less than 5 kW 13.00 15.00 18.00 17.50 16.00
For Sanctioned Load 5 kW and aboveRegular 400.00 10.45 400.00 14.50 400.00 16.00 400.00 15.00 400.00 12.00 Time of Use (TOU) - Peak 11.49 15.00 18.00 17.50 15.00 Time of Use (TOU) - Off-Peak 400.00 6.50 400.00 9.50 400.00 12.50 400.00 11.50 400.00 9.50 INDUSTRIALB1 Less than 5 kW (at 400/230 Volts) 8.90 11.50 14.50 14.50 12.00
B1 Peak 15.00 18.00 17.50 15.00 B1 Off-Peak 9.50 12.50 11.50 9.50 B2 5-500 kW (at 400 Volts) 400.00 7.59 400.00 10.00 400.00 14.00 400.00 14.00 400.00 11.50 B2 - TOU (Peak) 11.08 15.00 18.00 17.50 15.00 B2 - TOU (Off-Peak) 400.00 6.50 400.00 9.30 400.00 12.30 400.00 11.30 400.00 9.30 B3 - TOU (Peak) (up to 5000 kW at 11 kV, 33 kV) 10.99 14.70 18.00 17.50 15.00
B3 - TOU (Off-Peak) 380.00 6.25 380.00 9.20 380.00 12.20 380.00 11.20 380.00 9.10 B4 - TOU (Peak) (at 66 kV, 132 kV and above) 10.69 14.50 18.00 17.50 15.00
B4 - TOU (Off-Peak) 360.00 5.97 360.00 9.10 360.00 12.10 360.00 11.10 360.00 9.00 BULK SUPPLYC1 (a) Supply at 400 Volts - less than 5 kW 9.90 12.00 15.00 15.00 12.50
C1 (b) Supply at 400 Volts - 5 kW and above 400.00 8.75 400.00 11.00 400.00 14.50 400.00 14.50 400.00 12.00
Time of Use (TOU) - Peak 11.31 15.00 18.00 17.50 15.00 Time of Use (TOU) - Off-Peak 400.00 6.50 400.00 9.30 400.00 12.50 400.00 11.50 400.00 9.50 C2 Supply at 11 kV 380.00 8.65 380.00 11.00 380.00 14.30 380.00 14.30 380.00 11.80 Time of Use (TOU) - Peak 10.91 14.70 18.00 17.50 15.00 Time of Use (TOU) - Off-Peak 380.00 6.25 380.00 9.20 380.00 12.30 380.00 11.30 380.00 9.30 Time of Use (TOU) - Peak 10.51 14.50 18.00 17.50 15.00 Time of Use (TOU) - Off-Peak 360.00 5.87 360.00 9.10 360.00 12.20 360.00 11.20 360.00 9.10 AGRICULTURALSCARP 8.47 10.00 14.50 14.50 12.00 Time of Use (TOU) - Peak 17.50 15.00 Time of Use (TOU) - Off-Peak 200.00 11.20 200.00 9.10 Agricultural Tube-wells 200.00 5.31 200.00 8.00 200.00 14.00 200.00 14.00 200.00 11.50 Time of Use (TOU) - Peak 10.11 14.50 18.00 17.50 15.00 Time of Use (TOU) - Off-Peak 200.00 4.55 200.00 9.10 200.00 12.20 200.00 11.20 200.00 9.10 PUBLIC LIGHTING 12.00 14.50 15.00 15.00 14.00 RESIDENTIAL COLONIES ATT. TO INDUSTRIES 11.22 13.50 15.00 15.00 14.00
RAILWAY TRACTION 9.96 12.50 15.00 15.00 14.00 * Fixed Charges (Rs./kW/Month) ** Variable Charges (Rs./kWh)Source: National Electric Power Regulatory Authority, Islamabad
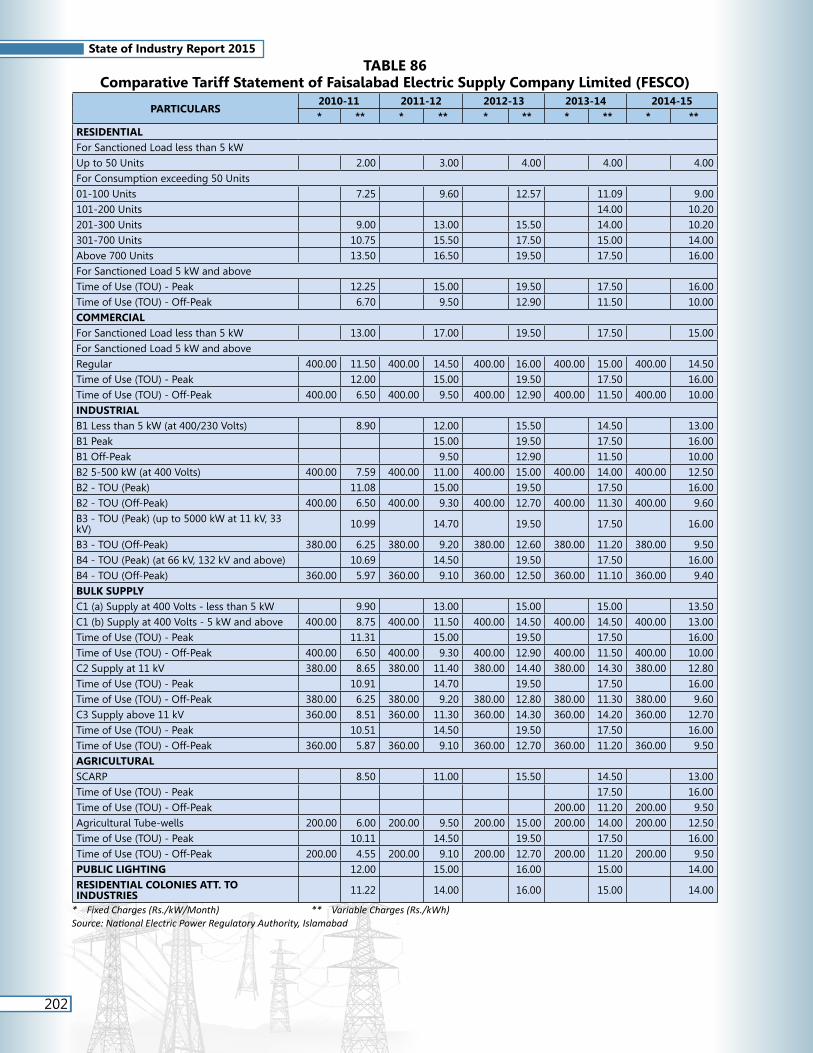
202
State of Industry Report 2015
TABLE 86Comparative Tariff Statement of Faisalabad Electric Supply Company Limited (FESCO)
PARTICULARS2010-11 2011-12 2012-13 2013-14 2014-15* ** * ** * ** * ** * **
RESIDENTIALFor Sanctioned Load less than 5 kWUp to 50 Units 2.00 3.00 4.00 4.00 4.00 For Consumption exceeding 50 Units01-100 Units 7.25 9.60 12.57 11.09 9.00 101-200 Units 14.00 10.20 201-300 Units 9.00 13.00 15.50 14.00 10.20 301-700 Units 10.75 15.50 17.50 15.00 14.00 Above 700 Units 13.50 16.50 19.50 17.50 16.00 For Sanctioned Load 5 kW and aboveTime of Use (TOU) - Peak 12.25 15.00 19.50 17.50 16.00 Time of Use (TOU) - Off-Peak 6.70 9.50 12.90 11.50 10.00 COMMERCIALFor Sanctioned Load less than 5 kW 13.00 17.00 19.50 17.50 15.00 For Sanctioned Load 5 kW and aboveRegular 400.00 11.50 400.00 14.50 400.00 16.00 400.00 15.00 400.00 14.50 Time of Use (TOU) - Peak 12.00 15.00 19.50 17.50 16.00 Time of Use (TOU) - Off-Peak 400.00 6.50 400.00 9.50 400.00 12.90 400.00 11.50 400.00 10.00 INDUSTRIALB1 Less than 5 kW (at 400/230 Volts) 8.90 12.00 15.50 14.50 13.00 B1 Peak 15.00 19.50 17.50 16.00 B1 Off-Peak 9.50 12.90 11.50 10.00 B2 5-500 kW (at 400 Volts) 400.00 7.59 400.00 11.00 400.00 15.00 400.00 14.00 400.00 12.50 B2 - TOU (Peak) 11.08 15.00 19.50 17.50 16.00 B2 - TOU (Off-Peak) 400.00 6.50 400.00 9.30 400.00 12.70 400.00 11.30 400.00 9.60 B3 - TOU (Peak) (up to 5000 kW at 11 kV, 33 kV) 10.99 14.70 19.50 17.50 16.00
B3 - TOU (Off-Peak) 380.00 6.25 380.00 9.20 380.00 12.60 380.00 11.20 380.00 9.50 B4 - TOU (Peak) (at 66 kV, 132 kV and above) 10.69 14.50 19.50 17.50 16.00 B4 - TOU (Off-Peak) 360.00 5.97 360.00 9.10 360.00 12.50 360.00 11.10 360.00 9.40 BULK SUPPLYC1 (a) Supply at 400 Volts - less than 5 kW 9.90 13.00 15.00 15.00 13.50 C1 (b) Supply at 400 Volts - 5 kW and above 400.00 8.75 400.00 11.50 400.00 14.50 400.00 14.50 400.00 13.00 Time of Use (TOU) - Peak 11.31 15.00 19.50 17.50 16.00 Time of Use (TOU) - Off-Peak 400.00 6.50 400.00 9.30 400.00 12.90 400.00 11.50 400.00 10.00 C2 Supply at 11 kV 380.00 8.65 380.00 11.40 380.00 14.40 380.00 14.30 380.00 12.80 Time of Use (TOU) - Peak 10.91 14.70 19.50 17.50 16.00 Time of Use (TOU) - Off-Peak 380.00 6.25 380.00 9.20 380.00 12.80 380.00 11.30 380.00 9.60 C3 Supply above 11 kV 360.00 8.51 360.00 11.30 360.00 14.30 360.00 14.20 360.00 12.70 Time of Use (TOU) - Peak 10.51 14.50 19.50 17.50 16.00 Time of Use (TOU) - Off-Peak 360.00 5.87 360.00 9.10 360.00 12.70 360.00 11.20 360.00 9.50 AGRICULTURALSCARP 8.50 11.00 15.50 14.50 13.00 Time of Use (TOU) - Peak 17.50 16.00 Time of Use (TOU) - Off-Peak 200.00 11.20 200.00 9.50 Agricultural Tube-wells 200.00 6.00 200.00 9.50 200.00 15.00 200.00 14.00 200.00 12.50 Time of Use (TOU) - Peak 10.11 14.50 19.50 17.50 16.00 Time of Use (TOU) - Off-Peak 200.00 4.55 200.00 9.10 200.00 12.70 200.00 11.20 200.00 9.50 PUBLIC LIGHTING 12.00 15.00 16.00 15.00 14.00 RESIDENTIAL COLONIES ATT. TO INDUSTRIES 11.22 14.00 16.00 15.00 14.00
* Fixed Charges (Rs./kW/Month) ** Variable Charges (Rs./kWh)Source: National Electric Power Regulatory Authority, Islamabad

203
State of Industry Report 2015
TABLE 87Comparative Tariff Statement of Multan Electric Power Company Limited (MEPCO)
PARTICULARS2010-11 2011-12 2012-13 2013-14 2014-15
* ** * ** * ** * ** * **RESIDENTIALFor Sanctioned Load less than 5 kWUp to 50 Units 2.00 3.00 4.00 4.00 4.00 For Consumption exceeding 50 Units01-100 Units 8.00 10.00 13.50 13.00 9.52 101-200 Units 16.90 12.00 201-300 Units 10.25 14.50 15.65 16.90 12.00 301-700 Units 12.50 16.40 17.65 17.90 15.00 Above 700 Units 14.00 18.00 19.50 19.00 16.00 For Sanctioned Load 5 kW and aboveTime of Use (TOU) - Peak 13.50 17.00 19.50 19.00 16.00 Time of Use (TOU) - Off-Peak 7.50 10.00 14.00 13.30 10.50 COMMERCIALFor Sanctioned Load less than 5 kW 15.50 18.50 19.50 19.00 16.00 For Sanctioned Load 5 kW and aboveRegular 400.00 12.00 400.00 16.00 400.00 16.00 400.00 16.00 400.00 14.00 Time of Use (TOU) - Peak 13.00 17.00 19.50 19.00 16.00 Time of Use (TOU) - Off-Peak 400.00 7.00 400.00 10.00 400.00 14.00 400.00 13.30 400.00 10.50 INDUSTRIALB1 Less than 5 kW (at 400/230 Volts) 10.00 13.00 15.50 15.50 13.50 B1 Peak 17.00 19.50 19.00 16.00 B1 Off-Peak 10.00 14.00 13.30 10.50 B2 5-500 kW (at 400 Volts) 400.00 8.50 400.00 11.50 400.00 15.00 400.00 15.00 400.00 13.00 B2 - TOU (Peak) 13.00 16.00 19.50 19.00 16.00 B2 - TOU (Off-Peak) 400.00 7.00 400.00 9.70 400.00 13.80 400.00 13.10 400.00 10.30 B3 - TOU (Peak) (up to 5000 kW at 11 kV, 33 kV) 12.75 15.70 19.50 19.00 16.00
B3 - TOU (Off-Peak) 380.00 6.75 380.00 9.60 380.00 13.70 380.00 13.00 380.00 10.20 B4 - TOU (Peak) (at 66 kV, 132 kV and above) 12.50 15.50 19.50 19.00 16.00
B4 - TOU (Off-Peak) 360.00 6.50 360.00 9.50 360.00 13.60 360.00 12.90 360.00 10.10 BULK SUPPLYC1 (a) Supply at 400 Volts - less than 5 kW 10.50 14.00 15.00 16.00 14.00 C1 (b) Supply at 400 Volts - 5 kW and above 400.00 9.50 400.00 12.50 400.00 14.50 400.00 15.50 400.00 13.50 Time of Use (TOU) - Peak 13.00 16.00 19.50 19.00 16.00 Time of Use (TOU) - Off-Peak 400.00 7.00 400.00 9.70 400.00 14.00 400.00 13.30 400.00 10.50 C2 Supply at 11 kV 380.00 9.25 380.00 12.40 380.00 14.40 380.00 15.30 380.00 13.30 Time of Use (TOU) - Peak 12.75 15.70 19.50 19.00 16.00 Time of Use (TOU) - Off-Peak 380.00 6.75 380.00 9.60 380.00 13.90 380.00 13.10 380.00 10.30 C3 Supply above 11 kV 360.00 9.00 360.00 12.30 360.00 14.30 360.00 15.20 360.00 13.20 Time of Use (TOU) - Peak 12.50 15.50 19.50 19.00 16.00 Time of Use (TOU) - Off-Peak 360.00 6.50 360.00 9.50 360.00 13.80 360.00 13.00 360.00 10.20 AGRICULTURALSCARP 10.50 12.00 15.50 15.50 13.50 Time of Use (TOU) - Peak 19.00 16.00 Time of Use (TOU) - Off-Peak 200.00 13.00 200.00 10.20 Agricultural Tube-wells 200.00 7.00 200.00 10.00 200.00 15.00 200.00 15.00 200.00 13.00 Time of Use (TOU) - Peak 13.00 15.50 19.50 19.00 16.00 Time of Use (TOU) - Off-Peak 200.00 6.00 200.00 9.50 200.00 13.80 200.00 13.00 200.00 10.20 PUBLIC LIGHTING 13.00 15.50 16.00 15.00 14.00 RESIDENTIAL COLONIES ATT. TO INDUSTRIES 13.00 15.00 16.00 15.00 14.00
RAILWAY TRACTION 10.00 11.00 16.00 15.00 14.00 * Fixed Charges (Rs./kW/Month) ** Variable Charges (Rs./kWh)Source: National Electric Power Regulatory Authority, Islamabad

204
State of Industry Report 2015
TABLE 88Comparative Tariff Statement of Hyderabad Electric Supply Company Limited (HESCO)
PARTICULARS 2010-11 2011-12 2012-13 2013-14 2014-15* ** * ** * ** * ** * **
RESIDENTIALFor Sanctioned Load less than 5 kWUp to 50 Units 2.00 3.00 4.00 4.00 4.00 For Consumption exceeding 50 Units01-100 Units 9.00 10.00 15.00 11.06 9.79 101-200 Units 12.50 14.00 201-300 Units 12.75 15.00 17.24 12.50 14.00 301-700 Units 14.00 17.00 18.50 15.50 15.00 Above 700 Units 15.00 19.00 20.50 17.50 16.00 For Sanctioned Load 5 kW and aboveTime of Use (TOU) - Peak 14.00 19.00 20.50 17.50 16.00 Time of Use (TOU) - Off-Peak 7.50 11.00 15.50 11.50 10.20 COMMERCIALFor Sanctioned Load less than 5 kW 15.00 16.00 20.50 17.50 15.00
For Sanctioned Load 5 kW and aboveRegular 14.00 400.00 15.00 400.00 19.00 400.00 15.00 400.00 13.00 Time of Use (TOU) - Peak 14.00 19.00 20.50 17.50 16.00 Time of Use (TOU) - Off-Peak 7.50 400.00 11.00 400.00 15.50 400.00 11.50 400.00 10.20 INDUSTRIALB1 Less than 5 kW (at 400/230 Volts) 10.00 14.00 17.00 14.50 12.50
B1 Peak 19.00 20.50 17.50 16.00 B1 Off-Peak 11.00 15.50 11.50 10.20 B2 5-500 kW (at 400 Volts) 400.00 9.50 400.00 13.00 400.00 16.50 400.00 14.00 400.00 12.00 B2 - TOU (Peak) 14.00 19.00 20.50 17.50 16.00 B2 - TOU (Off-Peak) 400.00 7.50 400.00 10.50 400.00 15.30 400.00 11.30 400.00 10.00 B3 - TOU (Peak) (up to 5000 kW at 11 kV, 33 kV) 13.90 19.00 20.50 17.50 16.00
B3 - TOU (Off-Peak) 380.00 7.00 380.00 10.25 380.00 15.20 380.00 11.20 380.00 9.80 B4 - TOU (Peak) (at 66 kV, 132 kV and above) 13.80 19.00 20.50 17.50 16.00
B4 - TOU (Off-Peak) 360.00 6.50 360.00 10.00 360.00 15.10 360.00 11.10 360.00 9.70 BULK SUPPLYC1 (a) Supply at 400 Volts - less than 5 kW 10.75 14.50 17.50 15.00 13.00
C1 (b) Supply at 400 Volts - 5 kW and above 400.00 10.25 400.00 13.50 400.00 16.50 400.00 14.50 400.00 12.50
Time of Use (TOU) - Peak 14.00 19.00 20.50 17.50 16.00 Time of Use (TOU) - Off-Peak 400.00 7.50 400.00 10.50 400.00 15.50 400.00 11.50 400.00 10.20 C2 Supply at 11 kV 380.00 10.15 380.00 13.25 380.00 16.30 380.00 14.30 380.00 12.30 Time of Use (TOU) - Peak 13.90 19.00 20.50 17.50 16.00 Time of Use (TOU) - Off-Peak 380.00 7.40 380.00 10.25 380.00 15.40 380.00 11.30 380.00 10.00 C3 Supply above 11 kV 360.00 10.05 360.00 13.00 360.00 16.20 360.00 14.20 360.00 12.20 Time of Use (TOU) - Peak 13.80 19.00 20.50 17.50 16.00 Time of Use (TOU) - Off-Peak 360.00 7.30 360.00 10.00 360.00 15.30 360.00 11.20 360.00 9.80 AGRICULTURALSCARP 12.00 14.00 17.00 14.50 12.50 Time of Use (TOU) - Peak 17.50 16.00 Time of Use (TOU) - Off-Peak 200.00 11.20 200.00 9.80 Agricultural Tube-wells 200.00 7.50 200.00 10.10 200.00 16.50 200.00 14.00 200.00 12.00 Time of Use (TOU) - Peak 14.00 19.00 20.50 17.50 16.00 Time of Use (TOU) - Off-Peak 200.00 5.00 200.00 8.00 200.00 15.30 200.00 11.20 200.00 9.80 PUBLIC LIGHTING 13.00 16.50 17.00 15.00 14.00 RESIDENTIAL COLONIES ATT. TO INDUSTRIES 13.00 16.50 17.00 15.00 14.00
* Fixed Charges (Rs./kW/Month) ** Variable Charges (Rs./kWh)Source: National Electric Power Regulatory Authority, Islamabad

205
State of Industry Report 2015
TABLE 89Comparative Tariff Statement of Sukkur Electric Supply Company Limited (SEPCO)
PARTICULARS2011-12 2012-13 2013-14 2014-15
* ** * ** * ** * **RESIDENTIALFor Sanctioned Load less than 5 kWUp to 50 Units 3.00 4.00 4.00 4.00 For Consumption exceeding 50 Units01-100 Units 11.13 15.00 10.50 11.00
101-200 Units 12.50 13.52
201-300 Units 15.00 16.00 12.50 13.52 301-700 Units 17.00 17.00 15.50 16.00 Above 700 Units 19.00 20.00 17.50 19.00 For Sanctioned Load 5 kW and aboveTime of Use (TOU) - Peak 19.00 20.00 17.50 19.00
Time of Use (TOU) - Off-Peak 11.50 15.50 11.50 13.00
COMMERCIALFor Sanctioned Load less than 5 kW 16.00 20.00 17.50 19.00 For Sanctioned Load 5 kW and aboveRegular 400.00 15.00 400.00 19.00 400.00 15.00 400.00 15.00 Time of Use (TOU) - Peak 19.00 20.00 17.50 19.00 Time of Use (TOU) - Off-Peak 400.00 11.50 400.00 15.50 400.00 11.50 400.00 13.00 INDUSTRIALB1 Less than 5 kW (at 400/230 Volts) 14.00 17.00 14.50 14.50 B1 Peak 19.00 20.00 17.50 19.00 B1 Off-Peak 11.50 15.50 11.50 13.00 B2 5-500 kW (at 400 Volts) 400.00 13.00 400.00 16.50 400.00 14.00 400.00 14.00 B2 - TOU (Peak) 19.00 20.00 17.50 19.00 B2 - TOU (Off-Peak) 400.00 11.00 400.00 15.30 400.00 11.30 400.00 12.80 B3 - TOU (Peak) (up to 5000 kW at 11 kV, 33 kV) 19.00 20.00 17.50 19.00 B3 - TOU (Off-Peak) 380.00 10.50 380.00 15.20 380.00 11.20 380.00 12.70 B4 - TOU (Peak) (at 66 kV, 132 kV and above) 19.00 20.00 17.50 19.00 B4 - TOU (Off-Peak) 360.00 10.25 360.00 15.10 360.00 11.10 360.00 12.60 BULK SUPPLYC1 (a) Supply at 400 Volts - less than 5 kW 14.50 17.50 15.00 15.00 C1 (b) Supply at 400 Volts - 5 kW and above 400.00 13.50 400.00 16.50 400.00 14.50 400.00 14.50 Time of Use (TOU) - Peak 19.00 20.00 17.50 19.00 Time of Use (TOU) - Off-Peak 400.00 11.00 400.00 15.50 400.00 11.50 400.00 13.00 C2 Supply at 11 kV 380.00 13.25 380.00 16.30 380.00 14.30 380.00 14.30 Time of Use (TOU) - Peak 19.00 20.00 17.50 19.00 Time of Use (TOU) - Off-Peak 380.00 10.50 380.00 15.40 380.00 11.30 380.00 12.80 C3 Supply above 11 kV 360.00 13.00 360.00 16.20 360.00 14.20 360.00 14.20 Time of Use (TOU) - Peak 19.00 20.00 17.50 19.00 Time of Use (TOU) - Off-Peak 360.00 10.25 360.00 15.30 360.00 11.20 360.00 12.70 AGRICULTURALSCARP 14.00 17.00 13.60 15.50 Time of Use (TOU) - Peak 17.50 19.00 Time of Use (TOU) - Off-Peak 200.00 11.20 200.00 12.70 Agricultural Tube-wells 200.00 10.50 200.00 16.50 200.00 13.00 200.00 15.00 Time of Use (TOU) - Peak 19.00 20.00 17.50 19.00 Time of Use (TOU) - Off-Peak 200.00 8.00 200.00 15.30 200.00 11.20 200.00 12.70 PUBLIC LIGHTING 16.50 15.90 15.00 14.00 RESIDENTIAL COLONIES ATT. TO INDUSTRIES 16.50 15.90 15.00 14.00
* Fixed Charges (Rs./kW/Month) ** Variable Charges (Rs./kWh)Source: National Electric Power Regulatory Authority, Islamabad

206
State of Industry Report 2015
TABLE 90Comparative Tariff Statement of Quetta Electric Supply Company Limited (QESCO)
PARTICULARS2010-11 2011-12 2012-13 2013-14 2014-15* ** * ** * ** * ** * **
RESIDENTIALFor Sanctioned Load less than 5 kWUp to 50 Units 2.00 3.00 4.00 4.00 4.00 For Consumption exceeding 50 Units01-100 Units 9.50 10.00 11.00 10.50 12.50 101-200 Units 12.50 15.00 201-300 Units 11.90 13.20 14.00 12.50 15.00 301-700 Units 13.25 14.30 16.00 15.00 17.00 Above 700 Units 15.25 16.50 18.00 17.50 19.00 For Sanctioned Load 5 kW and aboveTime of Use (TOU) - Peak 15.50 16.00 18.00 17.50 19.00 Time of Use (TOU) - Off-Peak 7.50 9.00 12.50 11.50 13.00 COMMERCIALFor Sanctioned Load less than 5 kW 15.25 17.00 18.00 17.50 19.00 For Sanctioned Load 5 kW and aboveRegular 400.00 14.00 400.00 15.00 400.00 16.00 400.00 15.00 400.00 15.00 Time of Use (TOU) - Peak 15.50 16.50 18.00 17.50 19.00 Time of Use (TOU) - Off-Peak 400.00 7.00 400.00 8.00 400.00 12.50 400.00 11.50 400.00 13.00 INDUSTRIALB1 Less than 5 kW (at 400/230 Volts) 10.00 11.50 14.50 14.50 14.50 B1 Peak 16.00 18.00 17.50 19.00 B1 Off-Peak 9.00 12.50 11.50 13.00 B2 5-500 kW (at 400 Volts) 400.00 9.00 400.00 10.50 400.00 14.00 400.00 14.00 400.00 14.00 B2 - TOU (Peak) 15.50 16.60 18.00 17.50 19.00 B2 - TOU (Off-Peak) 400.00 7.00 400.00 8.60 400.00 12.30 400.00 11.30 400.00 12.80 B3 - TOU (Peak) (up to 5000 kW at 11 kV, 33 kV) 15.40 16.50 18.00 17.50 19.00
B3 - TOU (Off-Peak) 380.00 6.90 380.00 8.40 380.00 12.20 380.00 11.20 380.00 12.70 B4 - TOU (Peak) (at 66 kV, 132 kV and above) 15.30 16.40 18.00 17.50 19.00
B4 - TOU (Off-Peak) 360.00 6.80 360.00 8.20 360.00 12.10 360.00 11.10 360.00 12.60 BULK SUPPLYC1 (a) Supply at 400 Volts - less than 5 kW 10.50 11.50 15.00 15.00 15.00
C1 (b) Supply at 400 Volts - 5 kW and above 400.00 9.50 400.00 10.50 400.00 14.50 400.00 14.50 400.00 14.50
Time of Use (TOU) - Peak 15.50 16.60 18.00 17.50 19.00 Time of Use (TOU) - Off-Peak 400.00 7.00 400.00 8.60 400.00 12.50 400.00 11.50 400.00 13.00 C2 Supply at 11 kV 380.00 9.40 380.00 10.40 380.00 14.30 380.00 14.30 380.00 14.30 Time of Use (TOU) - Peak 15.40 16.50 18.00 17.50 19.00 Time of Use (TOU) - Off-Peak 380.00 6.90 380.00 8.40 380.00 12.30 380.00 11.30 380.00 12.80 C3 Supply above 11 kV 360.00 9.30 360.00 10.30 360.00 14.20 360.00 14.20 360.00 14.20 Time of Use (TOU) - Peak 15.30 16.40 18.00 17.50 19.00 Time of Use (TOU) - Off-Peak 360.00 6.80 360.00 8.20 360.00 12.20 360.00 11.20 360.00 12.70 AGRICULTURALSCARP 12.00 13.00 13.01 14.00 15.20 Time of Use (TOU) - Peak 17.50 19.00 Time of Use (TOU) - Off-Peak 200.00 11.20 200.00 12.70 Agricultural Tube-wells 200.00 10.65 200.00 11.50 200.00 11.51 200.00 13.61 200.00 14.70 Time of Use (TOU) - Peak 15.50 16.50 17.00 17.50 19.00 Time of Use (TOU) - Off-Peak 200.00 7.00 200.00 8.00 200.00 10.00 200.00 11.20 200.00 12.70 PUBLIC LIGHTING 13.00 14.00 15.00 15.00 14.00 RESIDENTIAL COLONIES ATT. TO INDUSTRIES 13.00 14.00 15.00 15.00 14.00
* Fixed Charges (Rs./kW/Month) ** Variable Charges (Rs./kWh)Source: National Electric Power Regulatory Authority, Islamabad

207
State of Industry Report 2015
TAB
LE 9
1M
on
thly
So
urc
e-w
ise
Po
wer
Sen
t O
ut
and
Fu
el C
ost
(20
14-1
5)
July
Au
g.
Sep
t.O
ct.
No
v.D
ec.
Jan
.Fe
b.
Mar
chA
pri
lM
ayJu
ne
Tota
l
Hydel
Gen
erat
ion
GW
h 3,
790.
63
4,28
2.93
3,
532.
44
3,20
2.84
2,
891.
91
1,90
7.41
8
09.8
7 1,
957.
18
1,36
4.16
1,
472.
75
3,37
7.71
3,
972.
81
32,5
62.6
4 %
3
6.61
41
.42
38.7
1 3
8.47
4
3.45
28
.11
13.0
9 33
.40
20.8
6 20
.06
35.3
5 4
0.02
3
3.57
Fuel
Co
st
Mln
.Rs.
-
- -
-
- -
-
-
-
-
-
-
-
Rs.
/kW
h -
- -
-
- -
-
-
-
-
-
-
-
Coal
Gen
erat
ion
GW
h 10
.11
4.70
7.
85
0.1
2 1
5.34
14
.47
1.56
18
.35
7.58
13
.12
-
9.0
8 1
02.2
7 %
0
.10
0.05
0.
09
0.0
0 0
.23
0.21
0.
03
0.31
0.
12
0.18
-
0
.09
0.1
1
Fuel
Co
st
Mln
.Rs.
45
.47
21.1
4 35
.34
0.5
6 6
9.03
65
.09
7.02
82
.55
34.1
2 59
.03
-
40.
84
460
.21
Rs.
/kW
h 4
.50
4.50
4.
50
4.5
0 4
.50
4.50
4.
50
4.50
4.
50
4.50
-
4
.50
4.5
0
HSD
Gen
erat
ion
GW
h 38
5.50
3
03.5
8 3
20.1
7 2
45.4
8 5
.07
52.7
0 5
82.8
7 1
05.6
4 3
02.8
4 3
71.2
0 1
14.2
4 12
6.95
2,
916.
25
%
3.7
2 2.
94
3.51
2
.95
0.0
8 0.
78
9.42
1.
80
4.63
5.
06
1.20
1
.28
3.0
1
Fuel
Co
st
Mln
.Rs.
8,
047.
33
6,25
4.31
6,
467.
64
4,98
4.67
-
1,00
5.68
8,
695.
44
1,6
40.0
7 4,
184.
18
5,14
4.20
1,
586.
45
1,98
3.77
49
,993
.74
Rs.
/kW
h 20
.87
20.6
0 20
.20
20.
31
- 19
.08
14.9
2 15
.53
13.8
2 13
.86
13.8
9 1
5.63
1
7.14
RFO
Gen
erat
ion
GW
h 3,
445.
24
3,23
6.65
2,
779.
77
2,78
0.61
1,
394.
06
2,65
8.56
2,
806.
66
1,93
3.36
2,
540.
72
2,88
0.22
2,
740.
55
2,48
4.22
3
1,68
0.62
%
3
3.28
31
.30
30.4
6 3
3.40
2
0.94
39
.18
45.3
7 33
.00
38.8
4 39
.23
28.6
8 2
5.03
3
2.66
Fuel
Co
st
Mln
.Rs.
54
,942
.94
50,9
33.0
1 43
,518
.28
43,4
89.6
7 19
,319
.19
32,4
36.8
5 28
,822
.30
16,2
36.4
7 24
,709
.88
28,4
17.8
2 27
,205
.92
27,1
47.0
6 39
7,17
9.39
R
s./k
Wh
15.
95
15.7
4 15
.66
15.
64
13.
86
12.2
0 10
.27
8.40
9.
73
9.87
9.
93
10.
93
12.
54
Gas
Gen
erat
ion
GW
h 2,
135.
88
1,88
9.98
1,
876.
14
1,52
3.65
1,
766.
01
1,57
5.33
1,
442.
89
1,25
2.60
1,
669.
67
1,96
4.31
2,
659.
95
2,72
2.00
22
,478
.42
%
20.
63
18.2
8 20
.56
18.
30
26.
53
23.2
2 23
.32
21.3
8 25
.53
26.7
6 27
.84
27.
42
23.
17
Fuel
Co
st
Mln
.Rs.
10
,646
.17
9,23
3.57
8,
069.
95
6,84
1.71
7,
349.
69
5,76
5.88
6,
168.
47
6,13
3.95
7,
622.
82
10,1
78.8
0 14
,823
.07
15,5
17.2
4 10
8,35
1.31
R
s./k
Wh
4.9
8 4.
89
4.30
4
.49
4.1
6 3.
66
4.28
4.
90
4.57
5.
18
5.57
5
.70
4.8
2
Nuclear
Gen
erat
ion
GW
h 38
6.12
4
35.9
3 4
32.0
3 4
03.4
2 43
3.65
3
84.9
2 3
49.5
8 4
09.4
9 4
51.9
6 4
31.9
8 4
45.3
3 43
0.99
4
,995
.40
%
3.7
3 4.
22
4.73
4
.85
6.5
2 5.
67
5.65
6.
99
6.91
5.
88
4.66
4
.34
5.1
5
Fuel
Co
st
Mln
.Rs.
50
6.78
5
14.7
1 5
10.5
4 4
78.1
9 51
2.48
4
55.0
8 4
10.0
2 4
84.0
1 5
34.2
2 5
10.4
4 5
26.4
6 50
9.26
5
,952
.19
Rs.
/kW
h 1
.31
1.18
1.
18
1.1
9 1
.18
1.18
1.
17
1.18
1.
18
1.18
1.
18
1.1
8 1
.19
Import Iran
Gen
erat
ion
GW
h 4
5.62
43
.26
40.2
1 4
0.75
3
4.44
31
.31
29.9
7 28
.12
32.8
1 38
.44
42.7
4 3
4.87
4
42.5
6 %
0
.44
0.42
0.
44
0.4
9 0
.52
0.46
0.
48
0.48
0.
50
0.52
0.
45
0.3
5 0
.46
Fuel
Co
st
Mln
.Rs.
44
7.10
4
23.9
7 3
94.0
8 4
03.4
4 34
0.98
3
19.4
1 3
05.7
3 2
86.8
7 3
34.6
5 3
92.0
5 4
35.9
3 35
5.72
4
,439
.90
Rs.
/kW
h 9
.80
9.80
9.
80
9.9
0 9
.90
10.2
0 10
.20
10.2
0 10
.20
10.2
0 10
.20
10.
20
10.
03
Mixed
Gen
erat
ion
GW
h 10
6.06
1
06.4
8 1
05.4
5 1
18.0
8 10
1.61
1
30.0
5 1
30.0
5 1
17.5
2 1
38.0
7 1
16.9
6 84
.40
79.
14
1,3
33.8
7 %
1
.02
1.03
1.
16
1.4
2 1
.53
1.92
2.
10
2.01
2.
11
1.59
0.
88
0.8
0 1
.38
Fuel
Co
st
Mln
.Rs.
95
0.98
9
54.9
3 9
59.5
8 1
,075
.53
985.
54
1,12
4.56
1,
068.
98
979
.12
1,08
7.23
7
48.4
7 5
45.8
2 49
3.88
10
,974
.64
Rs.
/kW
h 8
.97
8.97
9.
10
9.1
1 9
.70
8.65
8.
22
8.33
7.
87
6.40
6.
47
6.2
4 8
.23
Wind Power
Gen
erat
ion
GW
h 4
7.84
37
.21
31.5
9 1
1.41
1
3.85
29
.97
32.9
7 36
.81
33.2
9 52
.54
77.4
9 5
2.89
4
57.8
4 %
0
.46
0.36
0.
35
0.1
4 0
.21
0.44
0.
53
0.63
0.
51
0.72
0.
81
0.5
3 0
.47
Fuel
Co
st
Mln
.Rs.
-
- -
-
- -
-
-
-
-
-
-
-
Rs.
/kW
h -
- -
-
- -
-
-
-
-
-
-
-
Solar Power
Gen
erat
ion
GW
h -
- -
-
- -
-
-
-
-
11.9
8 1
3.95
2
5.93
%
-
- -
-
- -
-
-
-
-
0.13
0
.14
0.0
3
Fuel
Co
st
Mln
.Rs.
-
- -
-
- -
-
-
-
-
-
-
-
Rs.
/kW
h -
- -
-
- -
-
-
-
-
-
-
-
Sour
ce: N
ation
al E
lect
ric P
ower
Reg
ulat
ory
Auth
ority
, Isla
mab
ad

208
State of Industry Report 2015
TAB
LE 9
2K
-Ele
ctri
c -
Sum
mar
y o
f M
on
thly
Fu
el C
ost
Ad
just
men
t (2
014-
15)
Des
crip
tio
nJu
lyA
ug
.Se
pt.
Oct
.N
ov.
Dec
.Ja
n.
Feb
.M
arch
Ap
ril
May
Jun
eFu
el C
ost
- F
urna
ce O
il (R
s./M
/To
n)64
,882
64
,359
68
,499
65
,632
54
,578
47
,146
3
7,24
2 36
,571
41
,618
38
,765
41
,890
4
4,52
8 Fu
el C
ost
- G
as (R
s./M
MBT
u)48
8.23
48
8.23
48
8.23
48
8.23
48
8.23
48
8.23
4
88.2
3 48
8.23
48
8.23
48
8.23
48
8.23
4
88.2
3 B
in Q
asim
Po
wer
Pla
nt
Wei
ght
ed A
vera
ge
Fuel
Co
st (R
s./k
Wh)
(Ref
.) 1
2.29
1
2.29
1
2.29
1
2.54
1
2.54
1
2.54
1
0.04
1
0.04
1
0.04
8
.80
8.8
0 8
.80
Wei
ght
ed A
vera
ge
Fuel
Co
st (R
s./k
Wh)
Act
ual)
11.
89
10.
26
12.
54
9.4
2 9
.56
10.
04
7.5
5 6
.76
8.8
0 8
.47
8.2
9 9
.51
Diff
eren
ce (R
s./k
Wh)
(0.4
0)(2
.03)
0.2
4 (3
.12)
(2.9
7)(2
.50)
(2.4
9)(3
.28)
(1.2
4)(0
.33)
(0.5
1) 0
.70
Num
ber
of
Uni
ts S
ent
Out
(Mln
./kW
h)46
2.28
38
0.16
37
3.62
29
0.76
17
9.46
13
8.13
9
9.88
18
9.19
23
1.80
38
5.15
47
1.09
4
99.8
4 Fu
el C
ost
Var
iati
on
(Mln
./R
s.)
(184
.93)
(772
.29)
90.
65
(907
.61)
(533
.86)
(344
.88)
(248
.56)
(621
.19)
(287
.08)
(127
.03)
(240
.31)
351
.84
Ko
ran
gi
Th
erm
al P
ow
er S
tati
on
Wei
ght
ed A
vera
ge
Fuel
Co
st (R
s./k
Wh)
(Ref
.)-
- -
- -
- -
- -
- -
-
Wei
ght
ed A
vera
ge
Fuel
Co
st (R
s./k
Wh)
Act
ual)
- -
- -
- -
- -
- -
- -
D
iffer
ence
(Rs.
/kW
h)-
- -
- -
- -
- -
- -
-
Num
ber
of
Uni
ts S
ent
Out
(Mln
./kW
h)(0
.06)
(0.0
7)(0
.07)
(0.0
7)(0
.07)
(0.0
7)(0
.07)
(0.0
7)(0
.07)
(0.0
5)(0
.07)
-
Fuel
Co
st V
aria
tio
n (M
ln./
Rs.
)-
- -
- -
- -
- -
- -
-
Ko
ran
gi
Gas
-II
Wei
ght
ed A
vera
ge
Fuel
Co
st (R
s./k
Wh)
(Ref
.) 4
.89
4.8
9 4
.89
4.6
4 4
.64
4.6
4 4
.64
4.6
4 4
.64
4.6
4 4
.64
4.6
4 W
eig
hted
Ave
rag
e Fu
el C
ost
(Rs.
/kW
h) A
ctua
l) 4
.64
4.6
4 4
.64
4.6
4 4
.64
4.6
4 4
.64
4.6
4 4
.64
4.6
4 4
.64
4.6
4 D
iffer
ence
(Rs.
/kW
h)(0
.26)
(0.2
6)(0
.26)
- -
- -
- -
- -
-
Num
ber
of
Uni
ts S
ent
Out
(Mln
./kW
h) 5
7.28
5
1.04
4
8.12
4
8.57
3
6.30
1
0.50
9
.99
22.
15
14.
50
33.
25
45.
63
46.
55
Fuel
Co
st V
aria
tio
n (M
ln./
Rs.
)(1
4.69
)(1
3.09
)(1
2.34
)-
- -
- -
- -
- -
SI
TE
Gas
-II
Wei
ght
ed A
vera
ge
Fuel
Co
st (R
s./k
Wh)
(Ref
.) 4
.89
4.8
9 4
.89
4.6
4 4
.64
4.6
4 4
.64
4.6
4 4
.64
4.6
4 4
.64
4.6
4 W
eig
hted
Ave
rag
e Fu
el C
ost
(Rs.
/kW
h) A
ctua
l) 4
.64
4.6
4 4
.64
4.6
4 4
.64
4.6
4 4
.64
4.6
4 4
.64
4.6
4 4
.64
4.6
4 D
iffer
ence
(Rs.
/kW
h)(0
.26)
(0.2
6)(0
.26)
- -
- -
- -
- -
-
Num
ber
of
Uni
ts S
ent
Out
(Mln
./kW
h) 3
4.70
2
6.70
1
8.26
2
4.28
1
0.03
0
.52
1.4
8 2
.96
0.3
3 1
.54
9.6
7 2
1.68
Fu
el C
ost
Var
iati
on
(Mln
./R
s.)
(8.
90)
(6.
85)
(4.
68)
- -
- -
- -
- -
-
Ko
ran
gi
CC
PP
Wei
ght
ed A
vera
ge
Fuel
Co
st (R
s./k
Wh)
(Ref
.) 4
.69
4.6
9 4
.69
4.4
5 4
.45
4.4
5 4
.45
4.4
5 4
.45
4.4
5 4
.45
4.4
5 W
eig
hted
Ave
rag
e Fu
el C
ost
(Rs.
/kW
h)(A
ctua
l) 4
.45
4.4
5 4
.45
4.4
5 4
.45
4.4
5 4
.45
4.4
5 4
.45
4.4
5 4
.45
4.4
5 D
iffer
ence
(Rs.
/kW
h)(0
.25)
(0.2
5)(0
.25)
- -
- -
- -
- -
-
Num
ber
of
Uni
ts S
ent
Out
(Mln
./kW
h) 7
8.47
8
3.19
7
9.52
8
4.13
6
6.92
1
9.62
1
2.46
5
4.82
3
6.13
9
6.66
9
3.12
1
12.0
8 Fu
el C
ost
Var
iati
on
(Mln
./R
s.)
(19.
30)
(20.
46)
(19.
56)
- -
- -
- -
- -
-
Fuel
Co
st V
aria
tio
n o
f O
wn
Gen
. (M
il./
Rs.
)(2
27.8
2)(8
12.6
9) 5
4.06
(9
07.6
1)(5
33.8
6)(3
44.8
8)(2
48.5
6)(6
21.1
9)(2
87.0
8)(1
27.0
3)(2
40.3
1) 3
51.8
4 Po
wer
Pu
rch
ases
Wei
ght
ed A
vera
ge
Fuel
Co
st (R
s./k
Wh)
(Ref
.) 9
.21
9.2
1 9
.21
8.6
7 8
.67
8.6
7 7
.12
7.1
2 7
.12
6.6
0 6
.60
6.6
0 W
eig
hted
Ave
rag
e Fu
el C
ost
(Rs.
/kW
h) (A
ctua
l) 9
.25
8.5
1 8
.67
8.3
9 6
.11
7.1
2 8
.96
5.2
7 6
.60
7.3
5 6
.37
6.1
5 D
iffer
ence
(Rs.
/kW
h) 0
.04
(0.7
0)(0
.55)
(0.2
7)(2
.56)
(1.5
4) 1
.84
(1.8
6)(0
.52)
0.7
5 (0
.23)
(0.4
5)U
nits
Pur
chas
ed62
4.55
64
7.79
63
5.55
62
5.45
59
7.57
57
3.77
5
77.4
3 57
8.81
65
0.69
65
5.41
67
7.77
6
51.9
0 Fu
el C
ost
Var
iati
on
of
Po
wer
Pu
r. (
Mil
./R
s.)
23.
14
(454
.45)
(346
.90)
(171
.81)
(1,5
30.3
4)(8
85.6
0)1,
062.
78
(1,0
74.8
4)(3
40.3
3)49
2.96
(1
54.1
5)(2
95.5
8)To
tal F
uel C
ost
Var
iati
on
(Ow
n G
en.+
Pow
er
Pur.)
(204
.69)
(1,2
67.1
4) (2
92.8
4)(1
,079
.42)
(2,0
64.1
9)(1
,230
.49)
814
.22
(1,6
96.0
3) (6
27.4
2)36
5.93
(3
94.4
7) 5
6.26
Tota
l Uni
ts S
ent
out
(Ow
n G
en.+
Pow
er P
ur.)
1,59
1.83
1,
511.
13
1,48
3.59
1,
422.
75
1,21
6.84
1,
061.
60
1,01
0.82
99
0.45
1,
217.
87
1,46
0.41
1,
627.
66
1,65
1.61
Fu
el C
ost
Var
iati
on
(P
s./k
Wh
)(1
2.86
)(8
3.85
)(1
9.74
)(7
5.87
)(1
69.6
4)(1
15.9
1) 8
0.55
(1
71.2
4)(5
1.52
) 2
5.06
(2
4.24
)3.
41
Sour
ce: N
ation
al E
lect
ric P
ower
Reg
ulat
ory
Auth
ority
, Isla
mab
ad

209
State of Industry Report 2015
TAB
LE 9
3K
-Ele
ctri
c -
Sou
rce-
wis
e O
wn
Gen
erat
ion
an
d F
uel
Co
sts
(201
4-15
)
July
Au
g.
Sep
t.O
ct.
No
v.D
ec.
Jan
.Fe
b.
Mar
chA
pri
lM
ayJu
ne
Bin Qasim
Gen
erat
ion
GW
h46
2.28
380.
1637
3.62
290.
7617
9.46
138.
1399
.88
189.
1923
1.80
385.
1547
1.09
499.
842
%47
.79
44.0
344
.06
36.4
728
.98
28.3
123
.05
45.9
640
.87
47.8
549
.59
50.0
0
Fuel
Co
stM
ln.R
s.54
98.3
539
01.4
146
84.0
327
37.5
617
15.9
613
86.7
575
4.24
1278
.20
2040
.18
3262
.84
3905
.92
4751
.12
Rs.
/kW
h11
.89
10.2
612
.54
9.42
9.56
10.0
47.
556.
768.
808.
478.
299.
51
Bin Qasim-II
Gen
erat
ion
GW
h33
4.61
322.
3232
8.59
349.
6432
6.63
319.
1330
9.64
142.
5928
4.50
288.
4433
0.44
319.
55%
34.5
937
.33
38.7
543
.85
52.7
465
.42
71.4
534
.64
50.1
635
.83
34.7
931
.96
Fuel
Co
stM
ln.R
s.0.
000.
000.
000.
000.
000.
000.
000.
000.
000.
000.
000.
00R
s./k
Wh
0.00
0.00
0.00
0.00
0.00
0.00
0.00
0.00
0.00
0.00
0.00
0.00
Korangi Thermal
Gen
erat
ion
GW
h-0
.06
-0.0
7-0
.07
-0.0
7-0
.07
-0.0
7-0
.07
-0.0
7-0
.07
-0.0
5-0
.07
0.00
%-0
.01
-0.0
1-0
.01
-0.0
1-0
.01
-0.0
1-0
.02
-0.0
2-0
.01
-0.0
1-0
.01
0.00
Fuel
Co
stM
ln.R
s.-0
.42
-0.4
7-0
.50
-0.4
6-0
.45
-0.4
6-0
.47
-0.4
6-0
.49
-0.3
1-0
.49
0.00
Rs.
/kW
h6.
716.
716.
716.
716.
716.
716.
716.
716.
716.
716.
710.
00
Korangi Gas-II
Gen
erat
ion
GW
h57
.28
51.0
448
.12
48.5
736
.30
10.5
09.
9922
.15
14.5
033
.25
45.6
346
.55
%5.
925.
915.
676.
095.
862.
152.
315.
382.
564.
134.
804.
66
Fuel
Co
stM
ln.R
s.26
5.67
236.
7422
3.17
225.
2716
8.38
48.6
946
.34
102.
7267
.25
154.
2421
1.66
215.
93R
s./k
Wh
4.64
4.64
4.64
4.64
4.64
4.64
4.64
4.64
4.64
4.6
4.6
4.64
SITE Gas-II
Gen
erat
ion
GW
h34
.70
26.7
018
.26
24.2
810
.03
0.52
1.48
2.96
0.33
1.54
9.67
21.6
8%
3.59
3.09
2.15
3.04
1.62
0.11
0.34
0.72
0.06
0.19
1.02
2.17
Fuel
Co
stM
ln.R
s.16
0.95
123.
8684
.71
112.
6046
.53
2.42
6.87
13.7
31.
547.
1444
.84
100.
58R
s./k
Wh
4.64
4.64
4.64
4.64
4.64
4.64
4.64
4.64
4.64
4.64
4.64
4.64
Korangi CCPP
Gen
erat
ion
GW
h78
.47
83.1
979
.52
84.1
366
.92
19.6
212
.46
54.8
236
.13
96.6
693
.12
112.
08%
8.11
9.64
9.38
10.5
510
.81
4.02
2.88
13.3
26.
3712
.01
9.80
11.2
1
Fuel
Co
stM
ln.R
s.34
9.03
370.
0135
3.67
374.
1829
7.64
87.2
955
.44
243.
8516
0.70
429.
9141
4.18
498.
51R
s./k
Wh
4.45
4.45
4.45
4.45
4.45
4.45
4.45
4.45
4.45
4.45
4.45
4.45
Total
Gen
erat
ion
GW
h96
7.28
863.
3584
8.04
797.
3061
9.27
487.
8343
3.39
411.
6356
7.19
805.
0094
9.88
999.
71%
100.
0010
0.00
100.
0010
0.00
100.
0010
0.00
100.
0010
0.00
100.
0010
0.00
100.
0010
0.00
Fuel
Co
stM
ln.R
s.62
73.5
846
31.5
653
45.0
934
49.1
522
28.0
515
24.6
986
2.42
1638
.03
2269
.18
3853
.82
4576
.11
5566
.13
Rs.
/kW
h9.
928.
5610
.29
7.70
7.61
9.04
6.97
6.09
8.03
7.46
7.39
8.18
*Ene
rgy
figur
es o
f eac
h po
wer
stati
on a
re w
orke
d ou
t on
the
basis
set t
arge
t of W
hole
Gen
erati
on F
leet
’s Au
xilia
ry C
onsu
mpti
on.
**Fu
el C
ost o
f eac
h po
wer
stati
on is
wor
ked
out o
n th
e ba
sis o
f Hea
t Rat
es a
s spe
cifie
d by
the
Auth
ority
.**
*Fue
l Cos
t of B
in Q
asim
-II is
not
refle
cted
as t
he H
eat R
ate
of th
is Po
wer
Sta
tion
is in
pro
cess
with
the
Auth
ority
. **
**En
ergy
figu
res o
f Bin
Qas
im-II
are
not
acc
ount
ed fo
r whi
le c
alcu
latin
g th
e to
tal F
uel C
ost d
ue to
non
-fina
lizati
on o
f its
Hea
t Rat
e.So
urce
: Nati
onal
Ele
ctric
Pow
er R
egul
ator
y Au
thor
ity, I
slam
abad

210
State of Industry Report 2015
TAB
LE 9
4K
-Ele
ctri
c -
Sou
rce-
wis
e P
ow
er P
urc
has
es a
nd
Fu
el C
ost
s (2
014-
15)
Ju
lyA
ug
.Se
pt.
Oct
.N
ov.
Dec
.Ja
n.
Feb
.M
arch
Ap
ril
May
Jun
e
NTDC
Purc
hase
sG
Wh
459.
1146
1.18
452.
6145
2.47
447.
4844
2.65
450.
0041
7.73
466.
2745
0.54
467.
8445
8.79
%73
.51
71.1
971
.22
72.3
474
.88
77.1
577
.93
72.1
771
.66
68.7
469
.03
70.3
8
Fuel
Co
stM
ln.R
s.34
41.1
331
24.0
130
62.6
031
97.4
619
91.0
827
84.3
441
74.3
619
09.5
228
04.3
631
84.6
325
31.4
821
24.6
1
Rs.
/kW
h7.
506.
776.
777.
074.
456.
299.
284.
576.
017.
075.
414.
63
Tapal Energy
Purc
hase
sG
Wh
78.4
874
.79
74.1
959
.48
58.0
950
.15
48.4
755
.69
66.0
478
.16
80.2
083
.11
%12
.57
11.5
511
.67
9.51
9.72
8.74
8.39
9.62
10.1
511
.93
11.8
312
.75
Fuel
Co
stM
ln.R
s.11
34.4
910
52.2
310
46.9
084
6.62
748.
8756
9.58
443.
9640
4.44
546.
1962
9.03
699.
0684
1.27
Rs.
/kW
h14
.46
14.0
714
.11
14.2
312
.89
11.3
69.
167.
268.
278.
058.
7210
.12
Gul Ahmed
Purc
hase
sG
Wh
70.2
366
.10
68.6
647
.50
43.3
240
.36
36.8
658
.95
58.5
575
.30
74.9
277
.60
%11
.25
10.2
010
.80
7.60
7.25
7.03
6.38
10.1
89.
0011
.49
11.0
511
.90
Fuel
Co
stM
ln.R
s.10
54.9
498
3.49
1057
.09
742.
7758
8.19
463.
7132
0.44
459.
2155
6.10
669.
4872
1.43
811.
01
Rs.
/kW
h15
.02
14.8
815
.40
15.6
413
.58
11.4
98.
697.
799.
508.
899.
6310
.45
KANUPP
Purc
hase
sG
Wh
1.46
30.9
921
.96
44.6
129
.44
24.6
026
.93
32.1
044
.70
37.4
641
.51
17.6
1
%0.
234.
783.
467.
134.
934.
294.
665.
556.
875.
716.
122.
70
Fuel
Co
stM
ln.R
s.12
.25
231.
2118
5.22
293.
5617
9.30
151.
3814
0.92
186.
7028
7.99
245.
8527
4.50
127.
64
Rs.
/kW
h8.
407.
468.
436.
586.
096.
155.
235.
826.
446.
566.
617.
25
PASMIC
Purc
hase
sG
Wh
0.29
0.18
3.79
7.17
4.57
0.64
0.11
1.19
1.13
0.96
0.24
0.81
%0.
050.
030.
601.
150.
760.
110.
020.
210.
170.
150.
040.
12
Fuel
Co
stM
ln.R
s.2.
411.
3531
.98
47.1
727
.84
3.93
0.55
6.91
7.29
6.31
1.61
5.86
Rs.
/kW
h8.
407.
468.
436.
586.
096.
155.
235.
826.
446.
566.
617.
25
Anoud Power
Purc
hase
sG
Wh
8.67
7.31
8.04
8.28
8.39
9.19
9.01
7.56
7.91
7.42
7.09
6.63
%1.
391.
131.
261.
321.
401.
601.
561.
311.
211.
131.
051.
02
Fuel
Co
stM
ln.R
s.95
.90
80.2
488
.71
87.6
577
.96
79.2
961
.53
49.8
058
.36
52.0
357
.35
55.2
0
Rs.
/kW
h11
.06
10.9
811
.04
10.5
99.
298.
636.
836.
597.
387.
018.
098.
33
IIL
Purc
hase
sG
Wh
6.32
7.23
6.30
5.94
6.28
6.18
6.05
5.61
6.09
5.57
5.98
7.35
%1.
011.
120.
990.
951.
051.
081.
050.
970.
940.
850.
881.
13
Fuel
Co
stM
ln.R
s.35
.37
40.3
635
.23
33.1
735
.06
34.5
133
.85
31.2
533
.97
31.0
533
.44
41.1
2
Rs.
/kW
h5.
595.
585.
595.
585.
585.
585.
605.
575.
585.
585.
595.
59
Total
Purc
hase
sG
Wh
624.
5564
7.79
635.
5562
5.45
597.
5757
3.77
577.
4357
8.81
650.
6965
5.41
677.
7765
1.90
%10
0.00
100.
0010
0.00
100.
0010
0.00
100.
0010
0.00
100.
0010
0.00
100.
0010
0.00
100.
00
Fuel
Co
stM
ln.R
s.57
76.4
955
12.9
055
07.7
352
48.4
036
48.3
040
86.7
451
75.6
230
47.8
242
94.2
648
18.3
843
18.8
740
06.7
1
Rs.
/kW
h9.
258.
518.
678.
396.
117.
128.
965.
276.
607.
352
6.37
26.
146
Sour
ce: N
ation
al E
lect
ric P
ower
Reg
ulat
ory
Auth
ority
, Isla
mab
ad

211
State of Industry Report 2015
TAB
LE 9
5K
-Ele
ctri
c -
Fuel
-wis
e O
wn
Gen
erat
ion
an
d F
uel
Co
sts
(201
4-15
)
July
Au
g.
Sep
t.O
ct.
No
v.D
ec.
Jan
.Fe
b.
Mar
chA
pri
lM
ayJu
ne
Gas
Gen
erat
ion
GW
h70
7.86
700.
1163
5.27
696.
2353
4.26
395.
5838
2.68
345.
5342
2.93
554.
6770
1.33
671.
44%
73.1
881
.09
74.9
187
.32
86.2
781
.09
88.3
083
.94
74.5
768
.90
73.8
767
.16
Fuel
Co
stM
ln.R
s.18
30.0
018
58.0
714
97.4
516
97.9
110
03.2
037
6.46
363.
8899
9.82
684.
2212
92.0
618
27.3
517
07.1
1R
s./k
Wh
4.90
4.92
4.88
4.90
4.83
4.92
4.98
4.93
4.94
4.85
4.93
4.85
RFO
Gen
erat
ion
GW
h25
9.42
163.
2321
2.77
101.
0785
.01
92.2
550
.71
66.1
014
4.26
250.
3224
8.03
328.
27%
26.8
218
.91
25.0
912
.68
13.7
318
.91
11.7
016
.06
25.4
331
.10
26.1
332
.84
Fuel
Co
stM
ln.R
s.44
43.5
827
73.4
938
47.6
317
51.2
412
24.8
511
48.2
349
8.54
638.
2115
84.9
725
61.7
627
46.2
438
54.2
4R
s./k
Wh
17.1
316
.99
18.0
817
.33
14.4
112
.45
9.83
9.65
10.9
910
.23
11.0
711
.74
Total Generation
Gen
erat
ion
GW
h96
7.28
863.
3584
8.04
797.
3061
9.27
487.
8343
3.39
411.
6356
7.19
805.
0094
9.36
999.
71%
100.
0010
0.00
100.
0010
0.00
100.
0010
0.00
100.
0010
0.00
100.
0010
0.00
100.
0010
0.00
Fuel
Co
stM
ln.R
s.62
73.5
846
31.5
653
45.0
934
49.1
522
28.0
515
24.6
986
2.42
1638
.03
2269
.18
3853
.82
4573
.59
5561
.35
Rs.
/kW
h9.
928.
5610
.29
7.70
7.61
9.04
6.97
6.09
8.03
7.46
7.39
8.18
*Ene
rgy
Fig
ures
of
Bin
Qas
im-I
I are
no
t ac
coun
ted
fo
r w
hile
cal
cula
ting
the
Fue
l Co
st a
s th
e H
eat
Rat
e of
the
sai
d P
ow
er S
tati
on
is in
pro
cess
wit
h th
e A
utho
rity
.So
urce
: Nati
onal
Ele
ctric
Pow
er R
egul
ator
y Au
thor
ity, I
slam
abad
TAB
LE 9
6K
-Ele
ctri
c -
Fuel
-wis
e Po
wer
Pu
rch
ases
an
d F
uel
Co
sts
(201
4-15
)
July
Au
g.
Sep
t.O
ct.
No
v.D
ec.
Jan
.Fe
b.
Mar
chA
pri
lM
ayJu
ne
NTDC
Purc
hase
sG
Wh
459.
1146
1.18
452.
6145
2.47
447.
4844
2.65
450.
0041
7.73
466.
2745
0.54
467.
8445
8.79
%73
.51
71.1
971
.22
72.3
474
.88
77.1
577
.93
72.1
771
.66
68.7
469
.03
70.3
8
Fuel
Co
stM
ln.R
s.34
41.1
331
24.0
130
62.6
031
97.4
619
91.0
827
84.3
441
74.3
619
09.5
228
04.3
631
84.6
325
31.4
821
24.6
1R
s./k
Wh
7.50
6.77
6.77
7.07
4.45
6.29
9.28
4.57
6.01
7.07
5.41
4.63
Coal
Purc
hase
sG
Wh
- -
- -
- -
-
-
- -
-
- %
- -
- -
- -
-
-
- -
-
-
Fuel
Co
stM
ln.R
s.-
- -
- -
-
-
- -
-
- -
Rs.
/kW
h-
- -
- -
-
-
- -
-
- -
RFO
Purc
hase
sG
Wh
155.
0114
6.20
148.
6911
3.00
107.
5197
.19
91.8
812
0.13
130.
3415
8.86
160.
2716
5.54
%24
.82
22.5
723
.40
18.0
717
.99
16.9
415
.91
20.7
520
.03
24.2
423
.65
25.3
9
Fuel
Co
stM
ln.R
s.22
59.1
520
94.0
621
68.4
916
53.1
113
93.7
410
90.9
380
9.13
899.
8511
44.7
213
36.3
414
62.1
816
92.4
1R
s./k
Wh
14.5
714
.32
14.5
814
.63
12.9
611
.22
8.81
7.49
8.78
8.41
9.12
10.2
2
Gas
Purc
hase
sG
Wh
8.98
9.41
12.2
815
.37
13.1
49.
338.
628.
869.
388.
558.
169.
97%
1.44
1.45
1.93
2.46
2.20
1.63
1.49
1.53
1.44
1.31
1.20
1.53
Fuel
Co
stM
ln.R
s.63
.96
63.6
291
.42
104.
2784
.18
60.0
851
.20
51.7
557
.19
51.5
750
.70
62.0
4R
s./k
Wh
7.12
6.76
7.44
6.78
6.40
6.44
5.94
5.84
6.10
6.03
6.22
6.22
Nuclear
Purc
hase
sG
Wh
1.46
30.9
921
.96
44.6
129
.44
24.6
026
.93
32.1
044
.70
37.4
641
.51
17.6
1%
0.23
4.78
3.46
7.13
4.93
4.29
4.66
5.55
6.87
5.71
6.12
2.70
Fuel
Co
stM
ln.R
s.12
.25
231.
2118
5.22
293.
5617
9.30
151.
3814
0.92
186.
7028
7.99
245.
8527
4.50
127.
64R
s./k
Wh
8.40
7.46
8.43
6.58
6.09
6.15
5.23
5.82
6.44
6.56
6.61
7.25
Total
Purc
hase
sG
Wh
624.
5564
7.79
635.
5562
5.45
597.
5757
3.77
577.
4357
8.81
650.
6965
5.41
677.
7765
1.90
%10
0.00
100.
0010
0.00
100.
0010
0.00
100.
0010
0.00
100.
0010
0.00
100.
0010
0.00
100.
00
Fuel
Co
stM
ln.R
s.57
76.4
955
12.9
055
07.7
352
48.4
036
48.3
040
86.7
451
75.6
230
47.8
242
94.2
648
18.3
843
18.8
740
06.7
1R
s./k
Wh
9.25
8.51
8.67
8.39
6.11
7.12
8.96
5.27
6.60
7.35
6.37
6.15
Sour
ce: N
ation
al E
lect
ric P
ower
Reg
ulat
ory
Auth
ority
, Isla
mab
ad

212
State of Industry Report 2015
TAB
LE 9
7K
-Ele
ctri
c -
Sou
rce-
wis
e G
ener
atio
n a
nd
Po
wer
Pu
rch
ases
(20
14-1
5)
July
Au
g.
Sep
t.O
ct.
No
v.D
ec.
Jan
.Fe
b.
Mar
chA
pri
lM
ayJu
ne
Pow
er P
urc
has
ed a
t B
us
Bar
(G
Wh
)
KAN
UPP
1.46
30.9
921
.96
44.6
129
.44
24.6
026
.93
32.1
044
.70
37.4
641
.51
17.6
1
PASM
IC0.
290.
183.
797.
174.
570.
640.
111.
191.
130.
960.
240.
81Ta
pal E
nerg
y78
.48
74.7
974
.19
59.4
858
.09
50.1
548
.47
55.6
966
.04
78.1
680
.20
83.1
1G
ul A
hmed
70.2
366
.10
68.6
647
.50
43.3
240
.36
36.8
658
.95
58.5
575
.30
74.9
277
.60
NTD
C/W
APD
A45
9.11
461.
1845
2.61
452.
4744
7.48
442.
6545
0.00
417.
7346
6.27
450.
5446
7.84
458.
79A
noud
Po
wer
8.67
7.31
8.04
8.28
8.39
9.19
9.01
7.56
7.91
7.42
7.09
6.63
DH
A C
og
en.
0.00
0.00
0.00
In
tern
atio
nal I
ndus
trie
s Li
mit
ed6.
327.
236.
305.
946.
286.
186.
055.
616.
095.
575.
987.
35
Tota
l Po
wer
Pu
r. a
t B
us
Bar
(G
Wh
)62
4.55
647.
7963
5.55
625.
4559
7.57
573.
7757
7.43
578.
8165
0.69
655.
4167
7.77
651.
90
Ow
n G
ener
atio
nU
nit
s Se
nt
Ou
t -
FO (
GW
h)
Bin
Qas
im-I
259.
4216
3.23
212.
7710
1.07
85.0
192
.25
50.7
166
.10
144.
2625
0.32
248.
5532
8.27
Un
its
Sen
t O
ut
- G
as (
GW
h)
Bin
Qas
im-I
202.
8521
6.92
160.
8618
9.69
94.4
545
.87
49.1
812
3.08
87.5
513
4.83
222.
5117
1.57
Bin
Qas
im-I
I33
4.61
322.
3232
8.59
349.
6432
6.63
319.
1330
9.64
142.
5928
4.50
288.
4433
0.44
319.
55Ko
rang
i The
rmal
-0.0
6-0
.07
-0.0
7-0
.07
-0.0
7-0
.07
-0.0
7-0
.07
-0.0
7-0
.05
-0.0
50.
00Ko
rang
i Gas
-I0.
000.
000.
000.
000.
000.
000.
000.
000.
000.
000.
000.
00Ko
rang
i Gas
-II
57.2
851
.04
48.1
248
.57
36.3
010
.50
9.99
22.1
514
.50
33.2
545
.63
46.5
5SI
TE G
as-I
0.00
0.00
0.00
0.00
0.00
0.00
0.00
0.00
0.00
0.00
0.00
0.00
SITE
Gas
-II
34.7
026
.70
18.2
624
.28
10.0
30.
521.
482.
960.
331.
549.
6721
.68
Kora
ngi C
CPP
78.4
783
.19
79.5
284
.13
66.9
219
.62
12.4
654
.82
36.1
396
.66
93.1
211
2.08
Tota
l U
nit
s S/
Ou
t -
Gas
(G
Wh
)70
7.86
700.
1163
5.27
696.
2353
4.26
395.
5838
2.68
345.
5342
2.93
554.
6770
1.33
671.
44
Tota
l U
nit
s S/
Ou
t -
FO
(GW
h)
259.
4216
3.23
212.
7710
1.07
85.0
192
.25
50.7
166
.10
144.
2625
0.32
248.
5532
8.27
Tota
l U
nit
s S/
Ou
t (G
Wh
) O
wn
Gen
.96
7.28
863.
3584
8.04
797.
3061
9.27
487.
8343
3.39
411.
6356
7.19
805.
0094
9.88
999.
71
Gra
nd
To
tal
(GW
h)
1591
.83
1511
.13
1483
.59
1422
.75
1216
.84
1061
.60
1010
.82
990.
4512
17.8
714
60.4
116
27.6
616
51.6
1%
of
NT
DC
in
To
tal
Un
its
Sen
t O
ut
28.8
430
.52
30.5
131
.80
36.7
741
.70
44.5
242
.18
38.2
930
.85
28.7
427
.78
% o
f O
wn
Gen
. in
To
tal
Un
its
S/O
ut
60.7
757
.13
57.1
656
.04
50.8
945
.95
42.8
741
.56
46.5
755
.12
58.3
660
.53
% o
f P
ow
er P
ur.
in
To
tal
Un
its
S/O
ut
39.2
342
.87
42.8
443
.96
49.1
154
.05
57.1
358
.44
53.4
344
.88
41.6
439
.47
Sour
ce: N
ation
al E
lect
ric P
ower
Reg
ulat
ory
Auth
ority
, Isla
mab
ad

213
State of Industry Report 2015
LIST OF TABLES
TABLE 1 Primary Energy Supplies by Source (MTOE) TABLE 2 Final Energy Consumption by Source (MTOE) TABLE 3 Fuel Consumption for Thermal Power Generation (TOE) TABLE 4 Installed Generation Capacity by Type (MW) TABLE 5 Plant-wise Installed Generation Capacity (MW) as on 30th June TABLE 6 Installed Generation Capacity by Systems and by Sectors (MW) TABLE 7 Electricity Generation by Type (GWh) TABLE 8 Plant-wise Electricity Generation (GWh)TABLE 9 Electricity Generation by Systems and by Sectors (GWh) TABLE 10 Electricity Statistics of K-Electric Limited TABLE 11 Thermal Electricity Generation by Fuel (GWh)TABLE 12 Fuel Cost in GENCOs and K-Electric LimitedTABLE 13 Fuel Consumption and Cost of Electricity Generation in GENCOs TABLE 14 Fuel Consumption and Cost of Generation Data - GENCOs TABLE 15 Fuel Consumption and Cost of Generation Data - K-Electric Limited TABLE 16 Fuel Consumption and Cost of Generation Data – IPPs TABLE 17 Auxiliary Consumption and other Factors of Hydel Power StationsTABLE 18 Auxiliary Consumption and other Factors of Public Sector Thermal Power Stations TABLE 19 Auxiliary Consumption and other Factors of K-Electric and Other Thermal Power StationsTABLE 20 Auxiliary Consumption and other Factors of Private Sector Thermal Power StationsTABLE 21 Main Electricity Statistics of the CountryTABLE 22 Category-wise Energy Sales in PEPCO and K-Electric System (GWh)TABLE 23 Category-wise Consumers and their Electricity Consumption (%) TABLE 24 Hourly System Demand (MW) TABLE 25 Maximum Electricity Demand in the Country (MW)TABLE 26 Annual Growth Rate of Electricity Consumption TABLE27 Surplus/DeficitinDemandandSupplyduringNTDC’sSystemPeakHoursTABLE28 Surplus/DeficitinDemandandSupplyduringK-Electric’sSystemPeakHoursTABLE 29 Energy Generation by Sector and Source (GWh) TABLE 30 Thermal Electricity Generation by Sector and by Fuel (GWh) TABLE 31 Monthly Variation in Maximum Hydel Generating Capability (July, 2010 to June, 2015) (MW) TABLE 32 Nuclear Power Statistics TABLE 33 Installed and Available Capacity (MW) TABLE 34 Ongoing Projects and Expansion Plan of Hydel Power Generation TABLE 35 Investment Plan for Public Sector Power Generation Projects (as per approved PC-I) TABLE 36 Investment Plan for Power Generation Projects (KEL) (2015-16 to 2016-17) TABLE 37 Investment Plan for Private Sector Power Generation Projects TABLE 38 Detail of Renewable Energy ProjectsTABLE 39 Merit Order for Power Generation Plants (PEPCO System) (16-06-2014) TABLE 40 Merit Order for Power Generation Plants (K-Electric System) TABLE 41-A List of Generation Licensees (Hydel + Nuclear) TABLE 41-B List of Generation Licensees (Wind + Solar + Bagasse/Biomass) TABLE 41-C List of Generation Licensees (SPPs, CPPs, IGCs, N-CPPs, DGPs, STIPPs and other IPPs) TABLE 41-D List of Public and Private Sector Power Generation Licensees TABLE 41-E List of Generation Licensees (IPPs under Power Policy 1994) TABLE 41-F List of Generation Licensees (IPPs under Power Policy 2002) TABLE 41-G List of Transmission and Distribution Licensees TABLE 42 Electricity Import and Export by NTDC (GWh) TABLE 43 Transmission Lines and Grid Stations with NTDCTABLE 44 Unit Received, Delivered and Transmission Losses in NTDC System (GWh) TABLE 45 Utilization of Transmission Lines and Power Transformers in NTDC System TABLE 46 Transmission Lines Tripping in PEPCO and K-Electric System TABLE 47 Grid Station Expansion Plan of NTDCTABLE 48 Power Sector Investment Plan for NTDC Transmission Lines TABLE 49 Interconnection Arrangement to Evacuate Power from up-coming Power Projects
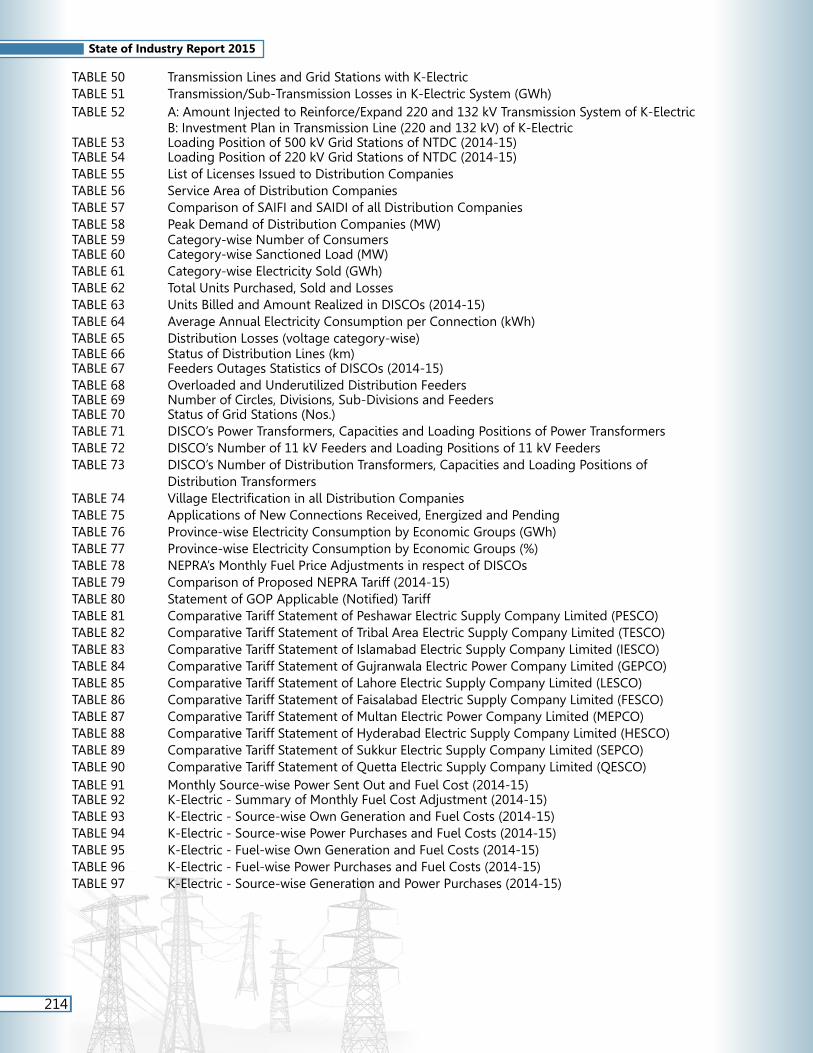
214
State of Industry Report 2015
TABLE 50 Transmission Lines and Grid Stations with K-ElectricTABLE 51 Transmission/Sub-Transmission Losses in K-Electric System (GWh)TABLE 52 A: Amount Injected to Reinforce/Expand 220 and 132 kV Transmission System of K-Electric B: Investment Plan in Transmission Line (220 and 132 kV) of K-ElectricTABLE 53 Loading Position of 500 kV Grid Stations of NTDC (2014-15)TABLE 54 Loading Position of 220 kV Grid Stations of NTDC (2014-15)TABLE 55 List of Licenses Issued to Distribution CompaniesTABLE 56 Service Area of Distribution CompaniesTABLE 57 Comparison of SAIFI and SAIDI of all Distribution CompaniesTABLE 58 Peak Demand of Distribution Companies (MW)TABLE 59 Category-wise Number of ConsumersTABLE 60 Category-wise Sanctioned Load (MW)TABLE 61 Category-wise Electricity Sold (GWh)TABLE 62 Total Units Purchased, Sold and LossesTABLE 63 Units Billed and Amount Realized in DISCOs (2014-15)TABLE 64 Average Annual Electricity Consumption per Connection (kWh)TABLE 65 Distribution Losses (voltage category-wise)TABLE 66 Status of Distribution Lines (km)TABLE 67 Feeders Outages Statistics of DISCOs (2014-15)TABLE 68 Overloaded and Underutilized Distribution FeedersTABLE 69 Number of Circles, Divisions, Sub-Divisions and FeedersTABLE 70 Status of Grid Stations (Nos.)TABLE 71 DISCO’s Power Transformers, Capacities and Loading Positions of Power TransformersTABLE 72 DISCO’s Number of 11 kV Feeders and Loading Positions of 11 kV FeedersTABLE 73 DISCO’s Number of Distribution Transformers, Capacities and Loading Positions of Distribution TransformersTABLE 74 Village Electrification in all Distribution CompaniesTABLE 75 Applications of New Connections Received, Energized and PendingTABLE 76 Province-wise Electricity Consumption by Economic Groups (GWh)TABLE 77 Province-wise Electricity Consumption by Economic Groups (%)TABLE 78 NEPRA’s Monthly Fuel Price Adjustments in respect of DISCOsTABLE 79 Comparison of Proposed NEPRA Tariff (2014-15)TABLE 80 Statement of GOP Applicable (Notified) TariffTABLE 81 Comparative Tariff Statement of Peshawar Electric Supply Company Limited (PESCO)TABLE 82 Comparative Tariff Statement of Tribal Area Electric Supply Company Limited (TESCO)TABLE 83 Comparative Tariff Statement of Islamabad Electric Supply Company Limited (IESCO)TABLE 84 Comparative Tariff Statement of Gujranwala Electric Power Company Limited (GEPCO)TABLE 85 Comparative Tariff Statement of Lahore Electric Supply Company Limited (LESCO)TABLE 86 Comparative Tariff Statement of Faisalabad Electric Supply Company Limited (FESCO)TABLE 87 Comparative Tariff Statement of Multan Electric Power Company Limited (MEPCO)TABLE 88 Comparative Tariff Statement of Hyderabad Electric Supply Company Limited (HESCO)TABLE 89 Comparative Tariff Statement of Sukkur Electric Supply Company Limited (SEPCO)TABLE 90 Comparative Tariff Statement of Quetta Electric Supply Company Limited (QESCO)TABLE 91 Monthly Source-wise Power Sent Out and Fuel Cost (2014-15)TABLE 92 K-Electric - Summary of Monthly Fuel Cost Adjustment (2014-15)TABLE 93 K-Electric - Source-wise Own Generation and Fuel Costs (2014-15)TABLE 94 K-Electric - Source-wise Power Purchases and Fuel Costs (2014-15)TABLE 95 K-Electric - Fuel-wise Own Generation and Fuel Costs (2014-15)TABLE 96 K-Electric - Fuel-wise Power Purchases and Fuel Costs (2014-15)TABLE 97 K-Electric - Source-wise Generation and Power Purchases (2014-15)

215
State of Industry Report 2015
ACRONYMS AND ABBREVIATIONS
ADB Asian Development BankAEDB Alternative Energy Development BoardAJKHEB Azad Jammu and Kashmir Hydel Electricity BoardAMRS Automated Meter Reading SystemBPC Bulk Power ConsumerBQCCPP Bin Qasim Combined Cycle Power PlantBQTPS Bin Qasim Thermal Power StationBTPL Bahira Town (Pvt.) LimitedCCPP Combined Cycle Power PlantCDP Common Delivery PointCHASNUPP Chashma Nuclear Power PlantCkt CircuitCOD Commercial Operation DateCPGCL Central Power Generation Company LimitedCPI Consumer Price IndexCPP Captive Power PlantCPPA Central Power Purchasing AgencyDISCO Distribution CompanyDOP Development of PowerECC Economic Coordination CommitteeECNEC Executive Committee of the National Economic CouncilEHV Extra High VoltageELR Energy Loss ReductionFBC Fluidized Bed CombustionFDI Foreign Direct InvestmentFESCO Faisalabad Electric Supply Company LimitedGDP Gross Domestic ProductGENCO Generation CompanyGEPCO Gujranwala Electric Power Company LimitedGEs Gas EnginesGOP Government of PakistanGST General Sales TaxGTPS Gas Thermal Power StationGWh Giga Watt – hourHESCO Hyderabad Electric Supply Company LimitedHFO Heavy Furnace OilHPP Hydropower ProjectHSD High Speed DieselHVDC High Voltage Direct CurrentIA Implementation AgreementIBC Integrated Business CentreICB International Competitive BiddingIESCO Islamabad Electric Supply Company LimitedIPP Independent Power ProducersJPCL Jamshoro Power Company LimitedKANUPP Karachi Nuclear Power PlantKCCPP Korangi Combined Cycle Power PlantKEL K-Electric Limitedkm KilometerKTGTPS Korangi Town Gas Turbine Power StationKTPS Korangi Thermal Power StationkV Kilo VoltKVA Kilovolt AmperekWh Kilowatt – hours

216
State of Industry Report 2015
LESCO Lahore Electric Supply Company LimitedLPGCL Lakhra Power Generation Company LimitedLtr. LitreMEPCO Multan Electric Power Company LimitedMMBTU Million British Thermal UnitMMCFT Million Cubic FeetMTOE Million Tonees of Oil EquivalentMVA Megavolt AmpereMW MegawattMWh Megawatt – hourMYT Multi-year Tariffn.a. & n.p. Not available and not providedNCPP New Captive Power PlantNEPRA National Electric Power Regulatory AuthorityNGC National Grid CompanyNGPS Natural Gas Power StationNPCC National Power Control CentreNPGCL Northern Power Generation Company LimitedNTDC National Transmission and Dispatch Company LimitedO&M Operation and MaintenanceOCPP Open Cycle Power PlantPAEC Pakistan Atomic Energy CommissionPASMIC Pakistan Steel Mills CorporationPEPCO Pakistan Electric Power Company LimitedPESCO Peshawar Electric Supply Company LimitedPNRA Pakistan Nuclear Regulatory AuthorityPPA Power Purchase AgreementPPDB Punjab Power Development BoardPPIB Private Power and Infrastructure BoardPPP Power Purchase PricePSDP Public Sector Development ProjectQESCO Quetta Electric Supply Company LimitedRFO Residue Furnace OilSCADA Supervisory Control and Data AcquisitionSCARP Salinity Control and Reclamation ProjectSEPCO Sukkur Electric Power Company LimitedSGTPS Site Gas Turbine Power StationPHYDO Pakhtunkhwa Hydel Development OrganizationSPP Small Power ProducerSPS Steam Power StationSTG Secondary Transmission and GridST Steam TurbineSVC Static Var CompensatorsT&D Transmission and DistributionTCEB Thar Coal and Energy BoardTESCO Tribal Area Electricity Supply Company LimitedTOD Time of DayTOU Time of UseTPS Thermal Power StationUNDP United Nations Development ProgramUSAID United States Agency for International DevelopmentVIBC Virtual Integrated Business CentreWB World BankWPPO WAPDA Power Privatisation Organization

217
State of Industry Report 2015
SOURCE OF INFORMATION
The following sources of information have been used in the compilation of this State of Industry Report 2015:
i) Distribution Companies
ii) K-Electric Limited
iii) National Power Control Centre, NTDC
iv) National Transmission and Dispatch Company Limited
v) Pakistan Energy Yearbook, Hydrocarbon Development Institute of Pakistan
vi) Private Power and Infrastructure Board
vii) Alternative Energy Development Board
viii) Power System Statistics, Planning Power, NTDC
ix) Pakhtunkhwa Energy Development Organization
x) Tariff Petitions submitted to NEPRA by Distribution Companies
xi) Water and Power Development Authority
xii) Others

218
State of Industry Report 2015


Des
igni
ng &
Pri
ntin
g: S
tren
ght
s In
nova
tio
ns-I
slam
abad