state of michigan deparn~ent of transportation · cell concrete box girder with vertical webs. the...
TRANSCRIPT

r I
STATE OF MICHIGAN DEPARn~ENT OF TRANSPORTATION
CONTROL SECTION B03 OF 73112
FEDERAL PROJECT NO. 1-75-2(206)147
I-75 CROSSING THE SAGINAW RIVER
NEAR ZILWAUKEE, MICHIGAN
INVESTIGATION OF CONSTRUCTION FAILURE
IN SPANS 11 AND 12
BY
HOWARD flEEDLES TA~1MEN & BERGENDOFF
JANUARY, 1983

11 l l l 1 l i
I I i
I i i I
I !
I
.1 .... __ .._,_____;J ____ ) . ___ .] ·-· _j

i '·
{-__.
( '·
(
l I ' L
Control Section 803 of 73112 Federal Project No. 1-75-2(206) 147
I-75 Crossing the Saginaw River Near Zilwaukee, Michigan Investigation of Construction Failure in Spans 11 and 12
I. INTRODUCTION
Shortly after midnight on August 28, 1982, large displacements
occurred during the placement of a segment of the 1-75 bridge over the
Saginaw River near Zilwaukee, Michigan. The end of nearly completed
cantil ever llNS deflected downward, the expansion joint in Span 12, between
Piers llN and 12N, deflected upward and the top of Pier 11N moved laterally
to the north. No personal injuries were reported because of this event but
the Pier llN foeti ng fai 1 ed and severe crushing of the superstructure
concrete occurred at the expansion joint in Span 12. Construction of the
bridge was stopped until the reason for the large displacements could be
determined and until remedial measures could be implemented. A view of the
bridge after the above event occurred is shown on the frontispiece.
The purpose of this report is to present the results of an
investigation as to the cause of the distress currently existing in Spans
11 and 12 and at Pier llN. Included in the report is a summary of the
conditions which existed at the time of the failure, a summary of the
analyses that were made to investigate the failure and the results of those
analyses.
The structural displacements were due to loads on Cantilever llNS
which produced 1 arge bending moments in Span 12. These bending moments
were greater than the capacity of temporary continuity measures applied to
the hinged expansion joint in Span 12. The moments produced tension in the
top temporary spacer blocks which exceeded the temporary prestress
compression force in these blocks and the spacer blocks ceased functioning
1
~, .-.
. ( (
L
structura 11 y. The moments at the expansion joint were therefore resisted
by a couple composed of the prestress tendons in tension and the bottom
spacer block in compression. This arrangement resulted in a very flexible
. structure as the prestress tendons were ungrouted and therefore free to
stretch over their entire length.
The stretching of the prestress strands all owed 1 arge rotations to
occur at the Span 12 expansion joint. These rotations created bottom
spacer block edge 1 oadi ng conditions which exceeded the crushing strength
of the concrete in both the spacer block and adjacent segments. The
rotations also allowed the expansion joint to deflect upward and the free
end of the cantilever to deflect downward.
The changing geometry of the superstructure, as the expansion joint
rotated, placed large horizontal loads on the pier top. Large moments were
produced in the footing by the horizontal forces at the top of the pier.
These moments produced pile 1 cads 1 arge enough to fail the foeti ng in
shear.
II. DESCRIPTION OF PROJECT
The proposed I-75 crossing of the Sagina~l River near Zilwaukee will
replace an existing low-level bascule span with a high-level crossing. The
new bridge will allow vehicular traffic to cross the Saginaw River with no
interruptions due to navigation on the river. The location of the bridge
is shown in Figure 1.
The new crossing consists of parallel four-lane structures with full
width shoulders. The northbound bridge is 8066 feet long and the
southbound bridge is 8090 feet long. Each roadway is supported by a single
cell concrete box girder with vertical webs. The box girder depth varies
from a maxi mum at the piers to a mini mum at midspan. The typkal box
girder section consists of a 73'-6" wide top flange, to provide a 70'-10"
2

I
I ! . .'L--
MIDLAND COUNTY
_j
SAGINAw· BAY
VICINITY MAP
0
SCALE IN MILES
FIGURE 1 -- VICINITY MAP
3
TUSCOLA COUNTY

. \
roadway section, and a 36' -0" wide bottom flange. The roadway section
cantilevers 18'-9" from each web of the box girder section.
Piers for each roadway consist of two octagonal shaped, hollow shafts
spaced 27' -0" on centers with a rectangular strut at the top. Steel
H-piles driven to rock support the structure.
Design Criteria
A copy of the project design criteria is included as Appendix A of
this report. This design criteria was reproduced from the plan documents
for the construction of the bridge.
The bridge was designed using the 1973 Edition of the "Standard
Specifications for Highway Bridges" by the American Association of State
Highway Officials plus the 1974 through 1977 Interim Specifications. The
American Concrete Institute Building Code (ACI 318-71) plus the 1975
supplement were also used as a design criteria.
The bridge plans specified the following design loads:
Live Load
Dead Load
Earthquake Load
Construction Load
HS25-44
A concrete weight of 156 pounds per cubic foot. A wearing surface of 1.37 kip/foot per roadway. A future wearing surface of 2.52 kip/ft. per roadway. A curb 1 oad of 0. 781 k/ft ..
6 percent of total dead load.
Working load of 20 kip at the end of a canti 1 ever. Launching girder reaction of 500 kip on top of a pier. Launching girder reaction of 500 kip, 18 feet from the end of a cantilever after the cantilever is connected to completed structure.
Material properties were specified in the criteria as follows.
Concrete
Prestressing Steel
fci = 5,500 psi and 6,000 psi
Longitudinal tendons consist of 12-0.5 inch diameter 7-wire, low relaxation strands with an ultimate strength of 270 ksi.
4

Reinforcement Grade 60
Substructure Concrete Footings fci - 3,500 psi Columns fci - 4,000 psi
The special provisions also placed limitations of liveload on the
structure during construction. These limitations are included in Appendix
A. The limitations on the cantilever longitudinal moment were changed to
read "Max. concentrated load on cantilever SOOK at 167.5' from pier or 18'
from end, whichever controls."
Construction Procedure
The bridges are being constructed as precast concrete box girders
erected by the free cantilever method. A launching girder was used to
place the segments and to hold the segments for the application of epoxy
grout and temporary prestress force. See frontispiece and Appendix C for
photos of the Launching Girder.
Segment placement started on the Northbound Roadway in Span 25 at
Abutment B and progressed southward toward Abutment A. The segments were
cast at a yard near Abutment B and hauled over the completed bridge by a
specially built truck, Noteboom, to the launching girder. A gantry on the
launching girder picked the segments from the truck and then traveled on
rails, attached to the top of the launching girder, to place the segments
in their proper position.
This construction procedure required adjacent cantil ever spans to be
made continuous as soon as they were constructed. Continuity was achieved
by an in situ joint between adjacent spans and by continuity prestress
tendons in the bottom slabs of the adjacent cantilevers. This continuity
allowed the Noteboom to travel over the completed cantilever and was
required by the Design Criteria for support and advancement of the
launching girder.
5

r~
I
'
I ( .....
r I j
The construction method also required temporary continuity across the
expansion joints. The design plans required expansion joints in Spans 4,
7, 9, 12, 14, 17, 19 and 22. In the completed structure these joints allow
temperature movement and are designed to transfer only vertical reactions
or shears across the joint. Si nee the joints act as hinges, temporary
restraints were required to provide stability during construction. The
hinges were made continuous by placing temporary concrete spacer blocks and
prestress tendons in the joints. This temporary fix allowed the hinge to
transfer both shear and moment across the expansion joint.
For the expansion joints constructed to date (Spans 22, 19, 17, 14 and
12) all except the joint in Span 12 were 1 ocated near the third point in
the span away from the direction of erection. The expansion joint which
failed (Span 12) was located near the third point in the span toward the
direction of erection. This location required the expansion joint in Span
12 to sustain significantly greater moments due to construction loads on
the free cantilever than did the previously constructed expansion joints.
An erection procedure was prepared by the Contractor for the
construction of the bridge. This erection procedure located the launching
girder and girder supports for the placement of each segment. Schematic
diagrams, for the canti 1 ever construction at Piers 8, 9, 10 and 11 are
shown in Figure 2. This figure was reproduced from the Launching Girder
Handling Manual, parts of which are reproduced in Appendix B.
As-Built Condition
Construction of the Northbound Roadway had advanced from Span 25 to
Span 9. Construction of the Southbound roadway was also underway using
cranes to erect the segments. On August 28th the 1 aunchi ng girder was
supported on the cantilevers erected at Piers 9N, lON and 11N, see Line 137
6

,I ,
Figure 2. Leg B was directly over Pier 9N, Leg A was 65 feet South of Pier
1DN, Leg E was 66 feet north of Pier 1DN and Leg C was 69.5 feet south of
Pier 11N. See Exhibit 1 for a graphic position of the launching girder.
The actual position of the 1 aunchi ng girder supports at Pier llN
differ from the position proposed in the Handling Manual as tabulated
below:
LAUNCHING GIRDER SUPPORTS AT PIER UN
Leg Distance from Pier lHl
Manual Actual F 140 Feet 142 Feet H 112 Feet 116 Feet c 65.25 69.5
The bridge superstructure was constructed as shown in Exh~bit 1. The
Pier 9N cantilevers were in a ba 1 anced position with Segments P and Q in
place. The Pier 1DN cantilevers were in a balanced position with Segments
T through H in place. The Pier llN cantilevers were in place except for
Segment llNSB. The insitu joint between cantilevers llNN and 12NS was in
place and 40 continuity tendons were stressed. An additional 14 continuity
tendons were stressed after the failure occurred. None of the prestress
tendons beyond Pier 14 had been grouted. See Exhibit 3 for the location of
segments in Cantilevers 11 and 12.
The hinge in Span 12, between Piers llN and 12N, was made continuous
by placing six 18-inch wide by 24-inch deep spacer blocks across the joint
between the top slabs; by placing an 8-inch deep full-width spacer block
across the joint between the bottom slabs; and by placing twenty-four
12-strand 0.5-inch diameter tendons in the top slab through the joint. The
twenty-four tendons placed through the joint were a change from the design
plans, which required thirty 12-strand 0.5-inch diameter tendons across the
joint. Continuity details for the expansion joint are sh~wn on Exhibit 2.
7

136
137
I~B
00
140
_®-.r-s ___ 3,.,.c!.s._' ___ (_S)9.r---,-. -~m'
Ito'
I
·I 11\o'
I
FIGURE 2. Schematic of construction at Piers 8, 9, 10 and 11. Copied from launching Girder Handling Manual
r: 1~ em

Accardi ng to data furnished by Department of Transportation field
personnel, the actual erection sequence for Piers 9N and lDN was slightly
out of schedule. The Segments H at Pier lON were to have been placed prior
to the 1 aunchi ng girder's 1 ast move but were reported to be placed after
the launching. girder was moved to its present position. The following
segments were reported to be placed with the launching girder in its
present position.
Segments lONSH and lONNH Segments 9NNQ,9NSP and 9NNP
At the time the failure occurred the Noteboom had just delivered
Segment lONSG to the launching girder. With the gantry at the north end of
the 1 aunchi ng girder, the segment was pi eked from the truck and the truck
departed. The position of the truck when the cantilever deflected was not
available.
Fal sework bents at Pier llN were used to support the segments as
cantilever construction continued. At the time of the failure, the
falsework bents had been removed but were reinstalled after the failure had
occurred.
Concrete cylinder strength tests were made by the Department of
Transportation. Twenty-eight day cylinder strengths for segment concrete
and for the spacer blocks in the expansion joint were as follows:
Segment 11 NNG 6230 psi 6440 psi 6080 psi
Segment lHINF 6260 psi 6100 psi 5840 psi
Spacer Blocks 6190 psi 6330 psi 6260 ·psi
9

~:
I
\: ..
\ ) I I~
These cylinder strengths indicate the superstructure concrete met the
design criteria strength requirements. Cylinder strengths for the concrete
in the footing at Pier llN were not available.
Loading Conditions at Time of Failure
As part of the investigation all loads on the structure were
determined. The dead 1 oad of the superstructure, 1 aunchi ng girder, girder
supports and construction loads on the bridge were verified.
An independent analysis was made of the segment reaction on the piers.
Tests made by the Michigan Department of Transportation indicate the
concrete density to be 144.4 pounds per cubic foot. Reinforcing steel and
prestressing steel would increase the density to about 150 pounds per cubic
foot. The design criteria indicated the bridge was designed for a density
of 156 pounds per cubic foot. This value of 156 pounds per cubic foot is a
reasonable density to use for calculating dead loads when form tolerances
are considered.
The cantil ever reaction from Segment llNSC to Segment llNNB was
compared based on plan segment weights and reactions computed from plan
dimensions. The plan weights yield 10,981 kips as compared to a computed
weight of 10,900 kips. The computed weight was calculated internally by
the computer based on member area and a member density of 156 pounds per
cubic foot.
The weights of the launching girder and supports were calculated from
the shop drawings for these items. A comparison of these weights with the
weights supplied by the Department of Transportation is shown below:
10
i
r '-
I ' .
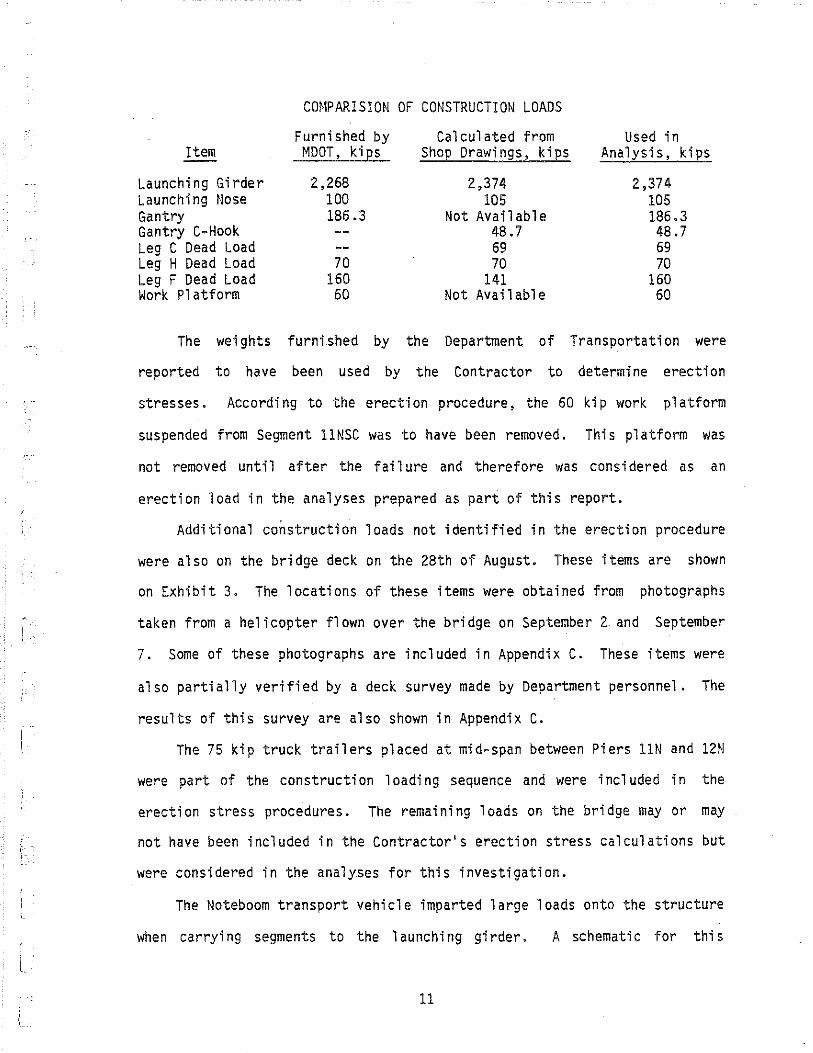
C0~1PARISION OF CONSTRUCTION LOADS
Furnished by Calculated from Used in Item HOOT, kiES Shop Drawings, kips Analysis, kips
Launching Girder 2,268 2,374 2,374 Launching Nose 100 105 105 Gantry 186.3 Not Available 186.3 Gantry C-Hock 48.7 48.7 Leg C Dead Load 69 69 Leg H Dead Load 70 70 70 Leg F Dead Load 160 141 160 Work Platform 60 Not Available 60
The weights furnished by the Department of Transportation were
reported to have been used by the Contractor to determine erection
stresses. According to the erection procedure, the 60 kip work platform
suspended from Segment llNSC was to have been removed. This platform was
not removed until after the failure and therefore was considered as an
erection load in the analyses prepared as part of this report.
Additional construction loads not identified in the erection procedure
were also on the bridge deck on the 28th of August. These items are shown
on Exhibit 3. The locations of these items were obtained from photographs
taken from a helicopter flown over the bridge on September 2 and September
7. Some of these photographs are included in Appendix c. These items were
also partially verified by a deck survey made by Department personnel. The
results of this survey are also shown in Appendix c. The 75 kip truck trailers placed at mid-span between Piers llN and 12N
were part of the construction loading sequence and were included in the
erection stress procedures. The remaining loads on the bridge may or may
not have been included in the Contractor's erection stress calculations but
were considered in the analyses for this investigation.
The Noteboom transport vehicle imparted large loads onto the structure
when carrying segments to the 1 aunchi ng girder. A schematic for this
11

truck's reactions is shown in Figure 3. This investigation assumed loads
as shown on this figure for determining live load stresses in the structure
due to transporting segments to the launching girder.
The possibility of temperature variations affecting the completed
structure was also considered. The temperatures shown below for the site
were obtained from the Saginaw Consumers Power Company which records only
the high and 1 ow readings for the day. The times of day when these highs
and lows occur are not recorded.
Date
August 26, 1982
August 27, 1982
August 28, 1982
Hourly temperatures for August 27th were obtai ned from the National
Weather Service in Flint, Michigan. These temperatures were somewhat
cooler than the Saginaw temperatures but the Flint records indicate the low
temperature for the 27th occurred at 11:50 p.m. and a 13°F drop in
temperature occurred from noon on the 27th to midnight.
Survey Position
Several profiles of the top of the segments were run by Department of
Transportation personnel on the 28th of August. These surveys are
presented in Appendix D along with top of segment elevations along the plan
profile gradeline. A comparison of the plan top of segment elevation with
two of the surveys is presented in Table 1. The elevations in the table
are along the west bolt line or 17 feet left of centerline of box. Survey
No. 2 was run between 7:30 AM and 9:00 Af.l on August 28th. Survey No. 5 was
run at 8:30 PM on the 28th of August. Segment 1 ocati ons are shown in
Exhibit 3.
12

----'
FIGURE 3 SCHEMATIC OF TRANSPORT VEHICLE FOR HAULING SEGMENTS (NOTEBOOM)
• 4x19* 4 I( 6. 75*
" u 1.6' 117.2' 11/.6'
! l 11 2.8· II 9.8· 11~8
5.8' 5.8' 43.8' 5.8' 5.8' 14.0' 5.8' 13.5'

1'-
L I
The expansion joint in Span 12 is most nearly represented by Segment
llNNG. This segment went up about 3.83 feet above theoretical gra.de.
Segment llNSC is the end segment of Cantil ever lHJS and dropped 5.46 feet
due to the August 28th failure.
Top of footing elevations were also surveyed which indicate the top of
footing for Pier llN is at Elevation 588.84 compared to a plan Elevation
589.0. Pier lON top of footing was surveyed at Elevation 582.0 compared to
a plan Elevation 582 .00. Survey el evati ens prior to August 28th are not
available and Pier llN top of footing elevations may represent as built
conditions rather than settlement.
III. DESCRIPTION OF FAILURE
The failure of the I-75 bridge occurred early on the morning of August
28, 1982. The fai 1 ure resulted in 1 arge di sp 1 a cements in the structure
which were reportedly accompanied by vibrations felt by workers on the
bridge. The end of Segment llNSC moved downward 5.46 feet and; the top of
Pier lHI moved horizontally to the north 8 inches.'
These large displacements resulted from or produced considerable
physical damage to the bridge. The spacer block between the bottom slabs
at the Span 12 expansion joint was severely crushed. Shearing or crushing
of the bottom fiber concrete in the supporting and supported segments of
the expansion joint occurred where the segments bottom slab was in bearing
against the spacer block. The spacer block appears to be split
horizontally at its midsection due to the crushing action of the joint
closing and rotating. See Figure 4 for a photo of this area.
Figures 5 and 6 are photographs of the crushing of the spacer blocks
between the top slabs at the expansion joint. The crushing of these blocks
also was caused by the rotation of the segments on either side of the
14

Table 1
TOP OF SEGt4ENT ELEVATIONS
Segment Plan El ev Survey #2 Diff Survey #5 Diff
13 N Pier 717 .61 717.78 +0.17 13 NSL 717.89 717.96 +0.07 13 NSG 718.03 717.91 -0.12 13 NSC 718 .12 717.71 -0.41 12 NNA 718.14 717.66 -0.48 12 NNE 718.17 717.91 -0.26 12 NNJ 718.13 717 .86 -0.27 12 NNP 718.02 718 .10 +0.08 12 N Pier 717.91 718.07 +0.16 718.07 +0.16 12 NSP 717.66 718.28 +0.62 12 NSL 717 .49 718.52 +1.03 12 NSG 717.18 718.71 +1.53 12 NSG 716.81 719 .61 +2.80 11 NNB 716.60 719 . 55 +2.95 11 NNE 716.31 719.92 +3.61 11 NNF 716.20 720.14 +3.94 11 NNG 716.07 719 .90 +3.83 719.65 +3.58 11 NNL 715.60 718 .29 +2.69 11 NNP 715.21 716 .88 +1.67 11 NN Pier 714.63 714.65 +0.02 11 NSP 714.00 712.7 3 -1.27 11 NSN 713.76 712.02 -1.74 11 NSL 713.53 711.32 -2.21 11 NSJ 713.15 710 .20 -2.45
( 11 NSG 712.77 709.21 -3.56 11 NSF 712.55 707.70 -4.85 11 NSC 711.94 706.48 -5.46 706.84 -5.10 10 NNH 709 .95 710.39 +0.44 10 NNM 709.02 709.41 +0.39 10 NNQ 708.30 708.63 +0.33 10 NNS 707.94 708.22 +0.28 10 N Pier 707 .44 707.71 +0.27 10 ~ISS 706.93 707 .28 +0.35 10 NSQ 706.54 706.97 +0.43 10 t!St1 705.74 706.39 +0.65 10 NSH 704.61 705 .50 +0.89
15

i L.
r' I
r·· i I
\
- r·
I
r--· (
n I
I' L
n I
(' I L
{ · FIGURE 4. View of bottom slab expansion joint showing
crushing at spacer block.

L
i
i-
I I Lt..
{
c
FIGURE 5. Crushing ~f spreader beam at top slab expansion joint.
FIGURE 6. Crushing of spreader beam at top slab expansion joint.

1·-·.
( ...•
r . j.
L.
' i L_
L L
joint. The top slab adjacent to the spacer blocks was badly spalled and
cracked. Sounding of the top slab with a heavy bar produced hollow sounds
in the vicinity of the spacer blocks, indicating the cracking extended some
distance beyond the joint. The photo in Figure 7 shows large cracked areas
in the top slab adjacent to the joint which extend several feet beyond the
joint. Figure 7 also indicates the rotation of the joint exceeded the
bearings capacity to rotate. This excess rotation probably has caused the
piston of the pot bearing to become wedged in the bearing cylinder and has
severely limited the ability of the bearing to function.
Damage to the footing of Pier llN was severe. A large crack in the top
of the footing occurred between the two columns. See Figure 8. This crack
extended at a slight incline into the footing. Sonic testing of the
footing indicated the crack extended several feet on the incline and then
dipped sharply towards the bottom of the footing. This crack exhibited the
characteristics of a diagonal tension failure. Large diagonal cracks
appeared at the end of the footing, these cracks started at the bottom of
the footing and ran diagonally toward the top of the footing centerline.
See Figure 9. Sonic testing also indicated that these cracks were full
depth of the footing and more concentrated around the columns.
Large cracks and spalling occurred along the top of the footing-side of
the column interface as shown in Figure 10. Tension cracks opened in the
top of footing on the side of the column away from the direction of pier
movement. Uplift of the footing was evidenced by seperation of the footing
and footing pad.
No apparent damage occurred to the pier above the top of footing.
Cracking of the column concrete above the footing was not apparent. The
condition of the bearings at the top of the pier was not determined in the
18

---~-- -------------- ----------~-~----------. ----- --------------·---------~---~----~·---
- I
I . I
FIGURE 7. Expansion joint bearing. Note cracking of top slab
FIGURE 8. Crack between Pier llN columns -- looking north toward the river.

l.
..
[~
r t
,-l .
r l_
l_ i .
L

I I.
r
l
I.
l r i L.
r I
r
L
f~
r L
-- ----~----~---~----- ------~-~
FIGURE 11. Pier llN -- Footing cracks on south side of column.
-~~ ~--*·~-----· -~~-~~J .. ~-----~~-~-~~~---~~-~~~-·~- ----- -·-~--- '""""-----""-"~=~~~~""'--·-.
FIGURE 10. Footing spal1 along face of column Pier llN.

initial field investigation because of lack of access. Damage to these
bearings has been reported.
Distress was also evident in the supported portion of Span 12. The
segment joints opened up in many of the segments from Pier 12N to the
expansion joint. The opening of the joints was more pronounced in the
bottom slab joints but did occur in the web joints and in some cases the
web joint opening extended to the top slab. In the joints with the more
severe opening, cracking of the web shear key also occurred. The cracking
of the key occurred as an extension of the web joint through the key.
IV. DESCRIPTION OF STRUCTURAL ANALYSIS
General
The stress history of the structure was first determined using a plane
frame computer analysis. The results of this analysis indicated the
construction 1 oads waul d produce stresses which exceeded the capacity of
the temporary continuity measures placed at the expansion joint. The
reduced effectiveness of these continuity measures to resist moments due to
the construction loads resulted in the partial development of a hinge at
the expansion joint.
A plane truss computer program was then used for further analysis of
the structure. The truss analysis allowed a simulation of the expansion
joint conditions indicated to exist by the plane frame analysis. Different
member properties were used for the top and bottom chord at the expansion
joint to model the partial hinged condition. The truss analysis yielded
deflections similar to those measured in the real structure and produced
horizontal forces on the pier of sufficient magnitude to demonstrate
failure of the footing could occur. Once footing failure was demonstrated,
further analyses were not meaningful due to the uncertainty of predicting
22
I.
i
the combined structural response of the fai 1 ed expansion joint and the
failed footing at Pier llN.
Comparison of results between the plane frame and the plane truss
ana 1 yses is not pass i b 1 e. The p 1 ane frame ana 1 ysi s computed forces and
deflections on a structure with full continuity across the expansion joint.
The plane truss analysis computed forces and deflections on a structure
with reduced continuity across the expansion joint. The p 1 ane truss
analysis modeled the moment capacity of the expansion joint as being
between a hinged condition with no moment capacity and the full moment
capacity assumed in the plane frame analysis. Both the plane frame and the
plane truss· would give similar results if used to analyze the same
structure.
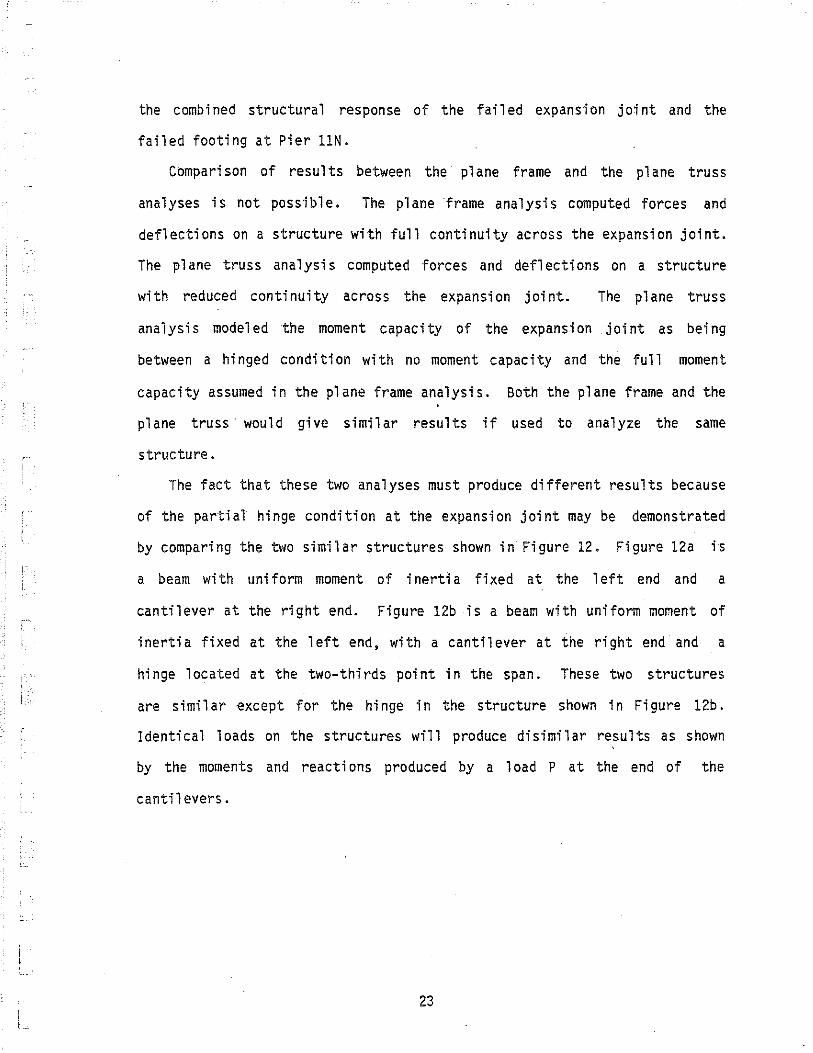
The fact that these two analyses must produce different results because
of the partial hinge condition at the expansion joint may be demonstrated
by comparing the two similar structures shown in Figure 12. Figure 12a is
a beam with uniform moment of inertia fixed at the left end and a
cantilever at the right end. Figure 12b is a beam with uniform moment of
inertia fixed at the 1 eft end, with a cantil ever at the right end and a
hinge 1 ocated at the two-thirds point in the span. These two structures
are similar except for the hinge in the structure shown in Figure 12b.
Identical loads on the structures will produce disimilar results as shown
by the moments and reactions produced by a 1 oad P at the end of the
cantilevers.
23

I z L/3 L/,: uz . I r ~ E
Moments -f- Pl./4 PL./2
Reactions -JP r figure 12a Continuous Spon
Z L/3 L/3 I
L/2 I . p
Momerm - PL 0 PL/2
Reactions - J. p ~p z figure 12b Hinged Span
FIGURE 12 STRUCTURE TY!"E COM!"ARISON
Segment Erection Model
The portion of the structure containing Spans 11 and 12 was first
analyzed by a plane frame computer program, referred to in this report as
the segment erection analysis. Input geometry for the frame analysis was
based on the center of gravity of the segments adjusted for profile grade
alignment. Section properties were calculated using an HNTB computer
program which utilizes input cross sectional dimensions obtained from the
plans. Conditions at the expansion joint were modeled based on the
assumption the top and bottom spacer blocks were fully effective in
resisting all moment loads. Detailed tendon profiles were input to enable
the computer to calculate tendon stresses and losses at each specified time
increment. Concrete casting and placement schedules were obtained and
incorporated into the model to account for time-dependent creep and
shrinkage effects. These ·schedules were obtained from the Department of
Transportation and are shown in Appendix E.
24

I.
Construction loads were determined as previously described. The actual
locations and/or magnitudes of the construction loads differed slightly
from those prescribed in the erection procedure handling manual. Stresses
were computed for both proposed and actual locations.
Once the structure had been modeled and construction loads determined,
the erection portion of the program was run to recreate the stress history
of the structure. In this regard cantilevers llN and 12N were analyzed by
the computer and the effect of closing Span 11N-12N was added to the
analysis. Those continuity tendons that were placed in this span before
fai 1 ure were then considered stressed by the computer. Stresses due to
construction 1 oads on the structure at the time of fai 1 ure were also
computed. In addition, the 1 i ve 1 oad portion of the program was used to
simulate the Noteboom hauling segments across Span 1Hl-12N. All stresses
at the expansion joint were computed on the basis of a cross-sectional area
consisting of the top and bottom slab spacer blocks.
Since the design plans indicated 30 tendons were to be placed through
the joint instead of the actual 24 tendons, a similar analysis was
performed for the case of 30 tendons in lieu of the 24 tendons.
The results of the segment erection analysis are summarized in Tables 2
through 5; Table 2 summarizes the stresses at the expansion joint after
the Noteboom had departed and Segment lOtlSG was suspended from the
launching girder gantry. This critical loading condition is shown in
Exhibit 5. Symbols used in Table 2 are as follows:
P = axial load in member M = bending moment in member ft = stress in top fiber } tensile stresses are positive fb = stress in bottom fiber compressive stresses are negative
25

(
I ' I~ ,
L I L_
L /· i ' L
Stresses at the expansion joint are based upon the following gross concrete
section properties:
Area = 6,065 in2 Section tlodul us Top = 207 ,360 i n3
3 Section t~odul us Bottom = 308,448 in
Table 2
SUMMARY OF EXPANSION JOINT STRESSES 24-Strands Actual Construction Loads Segment lONSG Suspended from Gantry
Loads and Stresses at Expansion Joint
p M ft fb Load Cases ( k) ( ft-k) ( ps 1 ) ( ps1 )
Dead Load and Prestress -6,620. 17,300 -2,090 -420
vJork Platform ll. -5,230 +300 -200
Leg F 24. -11,330 +660 -440
Leg H 9. -4,010 +230 -160
Leg C 100. -46 ,200 2,690 -1,780
Counterweights -32. 5,960 -350 +230
t~i scell aneous Construction Loads -12. 2,700 -160 +100
TOTAL +1,280 -2,670
These results indicate that significant tension was developed in the
top of the expansion joint under the action of dead load and prestress
forces combined with construction 1 oads on the structure. These 1 oadi ng
conditions, based on the assumed expansion joint member properties,
produced over 1,200 psi tension in the top slab spacer blocks.
It should be noted that the computed prestress force was based upon
the assumption that the coupled cantilever tendons behaved as single
26

j __ _
continuous tendons and that the anchor set 1 ass was distributed over the
entire length of the coupled tendons. Depending upon the exact stressing
sequence, it is possible that the anchor set loss was distributed over the
much shorter length of th~ temporary cantilever tendons beyond the
expansion joint. This would result in additional losses, reduced prestress
force, and even higher tensile stresses in the top of the joint than the
1,280 psi indicated in Table 2.
It should also be noted that the .stresses in Table 2 are based upon
the assumption that the temporary falsework system at Pier llN was
continuously in place during the erection of the Pier llN cantilevers and
that the system was removed after closure of Span 1HI-12N and stressing of
the Group I continuity tendons.
The top slab spacer blocks consisted of six 18-inch by 24-inch precast
concrete blocks. These blocks bore directly on the ends of the adjacent
slabs. No provision was made for transferring tension through the spacer
blocks to the adjacent slabs. When the tensile force in the spacer blocks
exceeded the dead load plus prestress precompression force of 2,090 psi the
spacer blocks ceased to function structurally. At this time the continuity
measures resisting forces through the expansion joint were reduced to the
8-inch thick bottom slab spacer block and the twenty-four 12-strand
tendons. When this occurred the segment erection analysis ceased to
accurately model the existing structural conditions. Stresses in Tables 2
through 5, produced by loading conditions which produced tension in the top
slab spacer blocks, are therefore not representative of actual conditions.
These stresses are presented for informational purposes only as they were
used as a basis for further refinement of the structural analysis.
27

i ·~ -
L I ' I' l;_.:;
r
\ L
Table 3 summarizes the stresses calculated at the expansion joint due
to the actual construction loads plus the live load stresses due to the
1 oaded Noteboom traveling across Span 11N-12N. Page 3a of the handling
manual required Leg F to be snugged to the rail of the launching girder
when the loaded Noteboom traveled over Span 11N-12N. Stresses were
computed for the case of Leg F made active prior to advancing the Noteboom
as well as the case of Leg F remaining inactive. Positive stresses
indicate tension and negative stresses indicate compression.
Load
Table 3
SUMMARY OF EXPANSION JOINT STRESSES 24-strands Actual Construction Loads
Segment 10NSG Loaded on Noteboom
Stresses at Expansion Joint
ft fb Cases (psi) (psi)
Dead Load and Prestress -2,090 -420 Work Platform +300 -200 Leg F +660 -440 Leg H +230 -160 Leg C +1,870 -1,240 Counterweights -350 +230 Miscellaneous Construction Loads -160 +100
( 1 ) Tot a 1 Construction Lo.ads +460 -2,130
( 2) Maximum Positive LL ~1oment -1,540 + 1 ,060 (Leg F Inactive)
( 3) Maximum Negative LL Moment -420 +289 (Leg F Active)
TOTAL ( 1) + ( 2) -1,080 -1,070
TOTAL ( 1) + ( 3) +40 -1,841
28

'-___j-
The results of Table 3 indicate that the stress levels at the
expansion joint due to the loaded Noteboom on Span 125-11~1 (Total (1)+(3))
were not as great as those computed for the segment suspended from the
gantry.
Table 4 repeats the stresses calculated at the expansion joint due to
the actual construction loads (see Table 2) and compares these stresses
with those that would have existed had there been:
(a) 24 and 30 tendons across the joint, with the actual
construction loads
(b) 24 and 30 tendons across the joint, with the handling manual
construction loads
(c) 30 tendons across the joint, with the design criteria
construction loads (20 kips at end of cantilever, plus 500 kips
located 18 feet from the end of the cantilever).
Load Cases
Table 4
SUMt·1ARY OF EXPANSION JOINT STRESSES ALTERNATE CONSTRUCTION LOAD CASES
Segment 10NSG Suspended from Gantry
24 strands-Actual Construction Loads 24 strands-Handling ~1anua1 Construction Loads 30 strands-Actual Construction Loads 30 strands-Handling Manual Construction Loads 30 strands-Design Criteria Construction Loads
Stresses at Expansion Joint ft fb
\pSi} \pSi}
+1,280 +1 ,160
+590 +460 -430
-2,670 -2,580 -2,630 -2,540 -1,990
The results of Table 4 indicate that the variations in the erection
procedure from those prescribed in the Handling Manual made little
difference in the computed expansion joint stresses. The results do
29

I 1 ••
!
L
l
indicate that the original design, consisting of 30 strands across the
expansion joint, combined with the design criteria construction loads would
not have produced a tensile stress fai 1 ure condition at the expansion
joint.
Table 5 summarizes the loads to the bottom of footing for the critical
construction load case.
Table 5
SUMMARY OF LOADS TO BOTT0~1 OF FOOTING PIER llN
Vertical Load Horizontal Shear Moment Load Cases (kips) ( k i ES) ( ft-kiEsl
Dead Load and Prestress 12,927 -32.7 -3,415
Work Platform 97 17.4 1 ,813
Leg F 240 37.7 3,931
Leg H 99 13.3 1,391
Leg C 1,652 153.8 15,042
Counterweights 54 -24.0 -2,511
~1i scell aneous Construction Loads 62 -11.0 -1,143
Footing Weight 1 312 0 0
Total (both columns) 16,443 154.5 16,108
The maximum and minimum pile loads computed on the basis of the segment
erection analysis are:
16,443 ± 16,108 52 456 = +352
+281 kips kips
Pile loads are based on the footing properties shown on Exhibit 4.
These 1 oads are not of sufficient magnitude to produce failure of the
30

l I •·
I L_
' I L
footing. As mentioned previously these pile 1 oads are not representative
of the existing conditions because of expansion joint modeling
characteristics.
Analogous Truss Model
As stated earlier the segment erection analysis did not accurately
model the existing conditions once initiation of the expansion joint
failure occurred. A truss analysis, referred to in this report as the
analogous truss analysis, was next used to analyze the structure. The
truss analysis allowed a more accurate modeling of conditions at the Span
12 expansion joint after failure of the joint was initiated.
In the analogous truss analysis the structure was modeled as a truss
using the top slab as the top chord, the webs as the diagonals and
verticals, and the bottom slab as the bottom chord. Truss joints were
placed at the intersection of the vertical joint between segments and the
center of the slabs. Input geometry for the truss joints was established
by depth of segment and profile grade alignment. See Exhibit 6 for a
computer plot of the input geometry.
This analysis allowed the use of different material properties across
the expansion joint in Span 12. The top chord member at the joint was
modeled based on the continuity tendons through the joint. The input
tendon area was mathematically reduced to account for the actual length of
the ungrouted tendons. The bottom chord member was modeled based on the
spacer block between the bottom slabs of the expansion joint.
Time dependent loads were not included in the truss analysis. Stresses
and displacements for the prestress loads would not be correctly calculated
using the truss analysis because of the member properties used at the Span
12 expansion joint. These properties represent the structure after the
31

failure at the expansion joint and are not representative of the structure
at the time the prestress force was applied to the structure.
An accurate analysis of the structure was difficult to obtain because
of the action of the tendons through the expansion joint. At the
i ni ti ati on of failure these tendons, which were in ungrouted ducts, were
free to elongate over their entire 1 ength. As the expansion joint moved
upward an angle break occurred in the structure at the expansion joint and
the tendons began to bear on the walls of the ducts. Large friction forces
were created which altered the length over which tendon elongation could
occur. To correct'for these friction forces the tendons were assumed to be
free to stretch over 75 percent of their length. The top chord area of the
truss at the expansion joint was calculated as an equivalent area which
would yield similar elongations to the adjusted tendon length.
The first truss analysis produced deflections similar to those observed
in the existing structure but did not produce footing stresses large enough
to indicate failure of the footing. The input geometry for the truss was
based on the actua 1 depth of structure and p 1 an verti ca 1 a 1 i gnment. The
truss analysis calculated member forces and joint displacements based on
the input geometry. This generally produces satisfactory results since
displacements are assumed to be small enough that the geometrical shape of
the loaded structure is very close to the geometrical shape of the unloaded
structure. In the case of Spans 11 and 12 with large displacements where
the 1 oads alter the final geometric position, the truss analysis does not
accurately calculate member forces and corrective measures were made to
obtain more accurate results.
To correct for the 1 oaded geometric position the ana 1 ogous truss was
reanalyzed using the displaced position of the 1 oaded structure for the
32

L
I I . I
input geometry. The results of this analysis again produced displacements
of the magnitude observed in the failed structure. This analysis also
produced loads on the footing of sufficient magnitude that failure of the
footing was indicated.
The results of the two analogous truss models are summarized in Tables
5 and 7. Table 6A summarizes the deflected position of the structure
resulting from the critical construction load case. A plot of the computed
deflected position due to construction loads is shown on Exhibit 6.
Table 6A
SUMMARY OF CONSTRUCTION LOAD DEFLECTIONS ANALOGOUS TRUSS MODEL
Cantilever Exp. Jt. Load Cases (ft.) (ft.)
Work Platform -0.5 +0.3 Leg F -1.1 +0.7 Leg H -0.4 +0.3 Leg C -4.5 +2.9 Counterweights +0.6 -0.4 Miscellaneous Construction Loads +0.2 -0.2
Total - Construction Loads -5.7 +3.6
Top of Pier (ft.)
+0.1 +0.1 0.0
+0.5 -0.1 0.0
+0.6
llN
The development of the computer model to accurately represent the
structural behavior of the partially failed expansion joint depended upon
several variables which were difficult to determine precisely. As a
result, the deflections obtained were somewhat sensitive to the model used
for the expansion joint. However, all of the construction load deflections
fell within a reasonable range of the observed deflections. The results
presented in Table 6A are .based upon the following assumptions:
(a) Equivalent top tendon properties assumed free to stretch over 75 percent of their length.
(b) Full gross section properties of the bottom spacer block present throughout.
33

(c) The geometry of rotation of the expansion joint as shown in Exhibit 6.
Table 6B
FINAL COMPUTED DEFLECTIONS
Cantilever Exp. Jt. Top of Pier llN Load Cases (ft.) (ft.) (ft.)
Construction Loads -5.7 +3.6 +0.6 Dead Load -0.4 +0.3 +0.3
Total -6 .1 +3.9 +0.9 ( t~easured) (-5.5) ( +3. 8) (+0.7)
In Table 6B, the addi tiona 1 deflections due to the dead 1 cad acting
through the 1 arge displacements are added to the construction load
deflections to obtain the final deflected position. These additional
defl ecti ens were obtained by applying the structure dead load to the
displaced truss. As no prestress force was applied to the truss the
vertical deflections were obtained as a result of the rotation of Pier 11N
due to the additional 0.3 foot horizontal displacement.
Once the displaced pes i ti on of the structure had been verified, the
loads to the footing were obtained by applying the construction 1 oads to
the structure in the deflected position. The results of this analysis
appear in Table 7.
Table 7
SUM~1ARY OF LOADS TO BOTTOM OF FOOTING llN
Axial Load Shear t·loment Load Cases {kips) {kips) (ft.-kips)
Dead Load and Prestress 12,927 502.0 53,815 Work Platform 126 85.9 9,216 Leg F 309 187.6 20,132 Leg H 123 67 .1 7,203 Leg C 1,927 762.3 81,834 Counterweights 20 -95.2 -10,210 Miscellaneous Construction Loads 46 -41.7 -4,466 Footing Weight 1,312 0 0
Total 16,792 1,468.0 157,524
34

I . I
c-•..
' ) L.
1·~-
I
i
1 L __
The maximum and minimum pile loads are:
16,792 + 157,524 Ppile = 52 - 456 = +668 kips
-22 kips (uplift)
A pile load of 668 kips per pile will produce a punching shear stress
of 277 psi in the footing. The ultimate shear stress for the foeti ng
using AASHTO criteria is 201 psi for 3,500 psi concrete. The strength of
the footing concrete was reported to be 5,000 psi. This concrete strength
yields an ultimate shear strength of 240 psi. The calculated stress of 277
psi is above the AASHTO ultimate strength for both 3,000 and 5,000 psi
concrete strengths.
V. CONCLUSIONS
Summary
The failure that occurred in Span 12 and at Pier llN was caused by the
insufficient strengtp of the expansion joint in Span 12 to resist moments
resulting from the construction 1 oads on Cantil ever llNS. These 1 cads
produced large tensile forces in the top of the temporary "fix" at the Span
12 expansion joint. The tensile forces exceeded the prestress compression
force in the top slab spacer blocks and the blocks became ineffective in
transferring moments across the expansion joint. The construction moments
were therefore resisted by a couple consisting of the prestress tendons in
tension and the bottom slab spacer block in compression.
As indicated by the analogous truss analysis, the large flexibility of
the ungrouted tendons, free to stretch over their entire 1 ength, all owed
the superstructure to rotate on the pier. The resultant of the vertical
1 oads, due to superstructure self weight and construction 1 oads, acting
through the inclined superstructure, produced 1 arge horizontal components
of force on the pier. The horizontal force acting through the pier height
35

\_
'.
L--
i L
I [_
( ..
I \:.
in turn produced large moments on the footing. These moments produced pile
loads which exceeded the shear capacity of the footing, resulting in
failure of the footing.
Temperature stresses alone were not found to be of sufficient magnitude
to cause fa i1 ure. The actua 1 erection procedure was in genera 1 agreement
with the handling manual except for the following discrepancies: placement
of the support legs for the launching girder was not in conformance with
the manual and the work platform at the end of Cantilever llNS was not to
have remained on the structure. These items increased the moments in the
structure and contributed to the failure, but the failure would have
occurred with the location of the support legs.and the work platform placed
as outlined in the handling manual •
Construction 1 oads placed according to the handling manual produced
1 arger cantil ever moments than waul d have been produced by 1 oadi ng
conditions assumed in the design criteria. Had the construction loads been
restricted to those outlined in the design criteria (see Appendix A), and
had 30 tendons been placed across the expansion joint no tension would have
developed in the top slab spacer blocks at the expansion joint and failure
would not have resulted.
Span 12 Expansion Joint
The plane frame segmental analysis yielded construction 1 cad stresses
in the bottom slab spacer block near the crushing strength of the concrete.
These computations assumed the full depth of the spacer block was effective
in resisting the compressive forces. The rotation of the expansion joint
segments as the structure 'rlefl ected resulted in a non-uniform app 1 i cation
of the compressive force on the spacer block. The spacer block was bolted
to the supported segment and the supporting segment was free to rotate away
36

from the top of the spacer b 1 ock (Refer to Ex hi bit 2 and Figure 4). This
rotation yielded large edge loadings at the bottom of the segment and the
spacer block. Failure due to this loading was evidenced by crushing of
both the segment and the spacer block along their bottom edges. Evidence
of more crushing along the segment edge (supporting segment) free to rotate
with respect to the spacer block than the segment edge (supported segment)
fixed or bolted to the spacer block is shown in Figure 4.
Crushing of the top slab and spacer blocks was a more complicated
sequence of events. This crushing was due to a combination of the rotation
of the expansion joint and the horizontal force of the inclined
superstructure. Part of the horizontal force resisted by the pier was
transferred through the expansion joint when failure of the Pier llN
foeti ng occurred. This force together with the edge 1 oadi ng conditions
caused by rotation of the expansion joint segments contributed to the
crushing of the joint.
The expansion joints in Spans 14, 17, 19 and 22 were also temporarily
restrained, similar to the continuity measures installed in the joint in
Span 12. These temporarily restrained joints performed satisfactorily due
to their location in the span with respect to the free cantilever. These
joints were located in the span third point away from the free cantilever.
Moments at these expansion joints, due to construction loads on the free
cantil ever, were not 1 arge enough to produce tension in the top spacer
blocks.
The Southbound roadway Span 12 expansion joint will also fail if
similar erection procedures were to be used for Spans 12S, llS and lOS. It
is recommended that a revised handling manual be developed for the erection
of these spans and the continued erection of Span llN. The erection
37

] .. '
'
i '
\ L
I [__
procedure for Spans 10 and 11 should limit the tensile stress in the top
slab spacer blocks to zero.
Replacement of the expansion bearings in Span 12N is also recommended.
The Cantilevers llNN and llNS should be supported on a fal sework bent at
Pier llN. This support will allow removal of the temporary fix at the
expansion joint. No repair of the expansion joint should be started until
the superstructure has been rotated back into position. It is recommended
that completion of Span 11 be accomplished with Cantilevers llNN - llNS
supported on the fal sework and the temporary restraints removed from the
expansion joint.
Pier llN Footing
The resultant force of the superstructure vertical loads acting through
the displaced or inclined structure produced a large horizontal force
component on the top of the pier. The analogous truss analysis, loaded in
the displaced position, indicated a horizontal load of 1,468 kips was
exerted on the columns. This value was based on the assumption that the
footing had adequate strength to resist the moment due to the horizontal
force. It is probable that failure of the footing occurred at lower
stresses than those produced by the 1,468 kips indicated by the analysis.
The failure of the footing resulted from shear stresses larger than the
shear capacity of the footing. These shear stresses were due to the large
pile loads produced by the column bending moments resulting from the
horizontal load at the top of the pier. These moments increased the pile
load from 352 kips due to dead load plus construction loads to a total
maximum pile load of 668 kips. This pile load produced a footing shear
stress of 277 psi which was greater than the design ultimate shear strength
of 240 psi for a concrete strength of 5,000 psi.
38

The actual failure of the footing was difficult to quantify. Failure
of the footing was evidenced by the cracked conditions shown in Figures 8
through 11. Figure 9 shows considerable horizontal cracking of the footing
had occurred in the area of the piles. Sounding of the footing also
indicated that bond failure of the main reinforcing steel had occurred. It
is probable that the footing cracks initiated in the bottom of the footing
at shear stresses less than the ultimate shear strength. These cracks then
propagated upward until they encountered compressive stresses that arrested
their further growth and' allowed the footing to develop additional shear
strength. These compressive forces were supplied by the axial loads from
the columns. Between the columns the cracks did not encounter compressive
forces and were free to continue growing. This crack growth resulted in
the large crack between the columns which exhibited the characteristics of
a diagonal tension failure.
Column lHI
Failure of the footing was assumed to have occurred at 1 esser pi 1 e
loads then the loads determined from the computer analysis. Failure at
lesser loads would have partially relieved the column bending moment and
thus column stresses. This assumption was based on the fact that no column
distress was noted either visually or by the sounding of the concrete even
though column loads were calculated to be above the ultimate strength of
the column.
Loads on the column were assumed to be at least 7,740 kips axial load
and 76,336 foot kips bending moment. An axial load-uniaxial bending
moment interaction diagram for a single pier column is presented on Exhibit
4 for Pier llN. This interaction diagram has been adjusted for a ~ factor
of 0.7. With no moment magnification factor applied for column slenderness
39

I I i c
I c.--
I l..
l. L
effects, this diagram indicates a single column with an applied axial load
of 7,740 kips could safely resist an applied bending moment of 65,000
foot-kips. Using a computed magnification factor of 38 percent for the
column bending moment due to slenderness yields a magnified moment of
105,344 foot kips. This moment is 62 percent greater than the computed
ultimate capacity of the column. These calculations, therefore, lead to
the above assumption that the footing had less capacity than the column and
the foeti ng failure relieved the moment in the column, thus preventing a
column failure.
Span 12
The displacement of Canti 1 evers llNN and llNS produced 1 arge tensi 1 e
stresses in the bottom fibers of the supported segments of Span 12, Pier
12N to the expansion joint. The magnitude of these forces was evidenced by
the opening of the bottom slab joint between segments and the cracking of
the web shear keys at several segment joints.
Bottom fiber stresses were calculated for the 12NS segments due to the
critical construction load case, and tensile stresses as much as 923 psi
were found in the bottom of several segments. The results of the computer
analysis indicated the 1 argest of these tensi 1 e stresses occurred between
segments 12NSB and 12NSF, which corresponds with the field observations of
the largest openings of the segment joints.
It is recommended that all of the bottom slab continuity tendons in
Span 12 be replaced and stainless steel pins be grouted in the segment web
joints to provide additional shear capacity.
Pier lON and Cantilevers lONN and lONS
Analysis of the load on Cantilvers lONN and lONS resulting from the
expansion joint fai.lure was not made. Calculation of the launching girder
40

I ·~
I '
I I L .
'-·
l I l..--
support reactions would require an analysis of the launching girder, which
was beyond the scope of this report. Evidence of the fact that unbalanced
loading of the cantilevers occurred was noted by the unsymmetrical
deflection of the cantilevers in Table I. This table indicates Segment
lONNH is 0.44 feet higher than theoretical grade and Segment lONSH is 0.89
feet higher than theoretical grade. The fact that launching Girder Support
C has settled over three feet means Support E would carry more 1 oad and
Support A 1 ess 1 oad. This 1 oadi ng condition would tend to rotate the
cantilevers in a manner evidenced by the deck survey.
No specific recommendations for the. repair of Canti 1 evers lONN-lONS are
made at this time. After the Cantilvers llNN-llNS have been returned to
their proper position and the launching girder supports adjusted the
cantilevers should be resurveyed. Remedial measures, if required, can then
be determined.
Launching Girder
An analysis of the stresses in the launching girder is beyond the scope
of this report. It must be noted that the 1 aunchi ng girder had been
subjected to a large displacement of one of its supports. Engineering
judgement would indicate significant stresses may have been produced in the
1 aunchi ng girder due to settlement of Support C. It is recommended that
the contractor be advised of the possibility of these stresses.
41