state of minnesota comparison of budget and actual
TRANSCRIPT

Comparison of Budget and Actual Revenues,
Expenditures, and Changesin Fund Balances
State of Minnesota
For the Year Ended June 30, 2009
Supplement to the Comprehensive Annual
Financial Report
Legal Level ofBudgetary ControlAll Budgeted Funds

On the cover
Minnesota Seasons
From snow laden branches to lush vegetation, with bursts of color in between, the trees of Minnesota reflect the spectacular extremes of the state's seasons.
Cover, top to bottom: Lilac bush in winter, autumn maple leaf, wooded banks of Lake Pepin near Lake City, spring apple tree blossoms Divider page image: Minnesota's state tree, the Norway or Red Pine, stays evergreen in all seasons.

STATE OF MINNESOTA
State of Minnesota
Prepared by Minnesota Management and Budget Tom J. Hanson, Commissioner 400 Centennial Office Building
658 Cedar Street Saint Paul, Minnesota 55155
Supplement to the Comprehensive Annual
Financial Report
Legal Level of Budgetary Control – All
Budgeted Funds
Minnesota Comparison of Budget and Actual
Revenues, Expenditures, and Changes in
Fund Balances
For the Year Ended June 30, 2009
The State of Minnesota Comparison of Budget and Actual Revenues, Expenditures, and Changes in Fund Balances can be made available in alternative formats upon request, to ensure that it is accessible to people with disabilities. To obtain this document in an alternate format, contact: Minnesota Management and Budget 400 Centennial Office Building 658 Cedar Street Saint Paul, Minnesota 55155‐1489 651‐201‐8000 The Minnesota Relay service phone number is 1‐800‐627‐3529. The State of Minnesota Comparison of Budget and Actual Revenues, Expenditures, and Changes in Fund Balances is available at the following web site:
http://www.mmb.state.mn.us/
Comprehensive Annual Financial Report
to the 2009 Supplement
STATE OF MINNESOTA

iii
STATE OF MINNESOTA 2009 Comparison of Budget and Actual Revenues, Expenditures, and and Changes in Fund Balances Changes in Fund Balances
Table of Contents Table of Contents
Page Page Introduction ............................................................................................................................. 1 Introduction ............................................................................................................................. 1
Auditor’s Opinion ...................................................................................................................... 3 Auditor’s Opinion ...................................................................................................................... 3
Summary of Reporting Policy.................................................................................................... 5 Summary of Reporting Policy.................................................................................................... 5
Schedules of Revenues, Expenditures, and Changes in Fund Balance – Budget and Actual – Schedules of Revenues, Expenditures, and Changes in Fund Balance – Budget and Actual –
Budgetary Basis and Notes: Budgetary Basis and Notes:
General Fund ....................................................................................................................... 7 General Fund ....................................................................................................................... 7
State Government Fund ..................................................................................................... 28 State Government Fund ..................................................................................................... 28
Transit Assistance Fund ...................................................................................................... 31 Transit Assistance Fund ...................................................................................................... 31
Trunk Highway Fund ........................................................................................................... 32 Trunk Highway Fund ........................................................................................................... 32
Highway User Tax Distribution Fund .................................................................................. 34 Highway User Tax Distribution Fund .................................................................................. 34
State Airports Fund ............................................................................................................. 35 State Airports Fund ............................................................................................................. 35
Petroleum Tank Cleanup Fund ........................................................................................... 36 Petroleum Tank Cleanup Fund ........................................................................................... 36
Natural Resources Fund ...................................................................................................... 37 Natural Resources Fund ...................................................................................................... 37
Game and Fish Fund ........................................................................................................... 40 Game and Fish Fund ........................................................................................................... 40
Environmental Fund ............................................................................................................ 42 Environmental Fund ............................................................................................................ 42
Remediation Fund ............................................................................................................... 44 Remediation Fund ............................................................................................................... 44
Special Compensation Fund ................................................................................................ 46 Special Compensation Fund ................................................................................................ 46
Health Care Access Fund ..................................................................................................... 47 Health Care Access Fund ..................................................................................................... 47
Workforce Development Fund ........................................................................................... 49 Workforce Development Fund ........................................................................................... 49


STATE OF MINNESOTA 2009 Comparison of Budget and Actual Revenues, Expenditures, and and Changes in Fund Balances Changes in Fund Balances Introduction Introduction This report is a supplement to the State of Minnesota Comprehensive Annual Financial Report (CAFR), prepared by Minnesota Management and Budget. Minnesota Management and Budget is responsible for the accuracy and completeness of the CAFR, as well as this report.
This report is a supplement to the State of Minnesota Comprehensive Annual Financial Report (CAFR), prepared by Minnesota Management and Budget. Minnesota Management and Budget is responsible for the accuracy and completeness of the CAFR, as well as this report.
Generally accepted accounting principles require budgetary reporting at the legal level of control. As a supplement to the CAFR, this report provides the required level of detail in budgetary reporting. Generally accepted accounting principles require budgetary reporting at the legal level of control. As a supplement to the CAFR, this report provides the required level of detail in budgetary reporting.
The purpose of this report is to demonstrate that spending by state agencies was within the authorized limits and in compliance with appropriation laws. These schedules provide a more detailed version of the budget and actual statements included in the state’s CAFR.
The purpose of this report is to demonstrate that spending by state agencies was within the authorized limits and in compliance with appropriation laws. These schedules provide a more detailed version of the budget and actual statements included in the state’s CAFR.
The detail in the schedules provided is at the legal level of budgetary control, which is the level beyond which agency heads have no authority to further modify the budget. In many cases, agencies have authority to modify budgets by spending dedicated receipts, moving amounts between fiscal years, or moving budgeted amounts from one program to another. The legal level of control for programs that an agency has the authority to transfer budgeted amounts between programs is defined as the aggregate of the budgets for those programs.
The detail in the schedules provided is at the legal level of budgetary control, which is the level beyond which agency heads have no authority to further modify the budget. In many cases, agencies have authority to modify budgets by spending dedicated receipts, moving amounts between fiscal years, or moving budgeted amounts from one program to another. The legal level of control for programs that an agency has the authority to transfer budgeted amounts between programs is defined as the aggregate of the budgets for those programs.
Scope Scope
The scope of this report covers only those funds for which annual spending limits are established in law. The following funds are included: The scope of this report covers only those funds for which annual spending limits are established in law. The following funds are included:
General Fund General Fund Special Revenue Funds: Special Revenue Funds:
State Government State Government Game and Fish Game and Fish
Transit Assistance Transit Assistance Environmental Environmental Trunk Highway Trunk Highway Remediation Remediation Highway User Tax Distribution Highway User Tax Distribution Special Compensation Special Compensation State Airports State Airports Health Care Access Health Care Access Petroleum Tank Cleanup Petroleum Tank Cleanup Workforce Development Workforce Development Natural Resources Natural Resources
The State Government and Transit Assistance funds are not reported as separate funds in the CAFR, but are included in the General Fund. The State Government and Transit Assistance funds are not reported as separate funds in the CAFR, but are included in the General Fund.
Basis Basis
This report is prepared on the budgetary basis of accounting. The budgetary basis is essentially a cash basis of accounting except that encumbrances are recognized as expenditures of the year appropriated. However, encumbrances associated with ongoing appropriations are not recognized as expenditures.
This report is prepared on the budgetary basis of accounting. The budgetary basis is essentially a cash basis of accounting except that encumbrances are recognized as expenditures of the year appropriated. However, encumbrances associated with ongoing appropriations are not recognized as expenditures.
1

2
The summary of reporting policies preceding the schedules explains the basis for the budget amounts, budget adjustments, and actual amounts in the schedules. Other information common to all funds and necessary to an understanding of the reported schedules is also presented in the summary. The notes presented with each fund provide additional information unique to the fund.
This report closely follows other budget reports1 prepared by Minnesota Management and Budget. However, because of its different purpose, timing, and level of detail, some differences between the schedules in this report and other Minnesota Management and Budget budgetary reports are necessary. These differences are explained in the notes to the schedules.
Audit
This report is prepared as a supplement to the state’s Comprehensive Annual Financial Report. All funds rolling into the CAFR General Fund are included in the scope of the audit conducted by Office of the Legislative Auditor. Their opinion follows.
1 Other budget reports prepared by Minnesota Management and Budget include:
General Fund ‐ Fund Balance Analysis, dated June 24, 2008.
Consolidated Fund Statement, Budgetary Basis, dated June 24, 2008.
Consolidated Fund Statement, Budgetary Basis, dated July 17, 2009.

OFFICE OF THE LEGISLATIVE AUDITOR STATE OF MINNESOTA • James Nobles, Legislative Auditor
Independent Auditor’s Report Members of the Minnesota State Legislature The Honorable Tim Pawlenty, Governor Mr. Tom Hanson, Commissioner, Minnesota Management and Budget We have audited the basic financial statements of the State of Minnesota as of and for the year ended June 30, 2009, and have issued our report thereon dated December 11, 2009. Those basic financial statements are the responsibility of the state’s management. Our responsibility is to express an opinion on those basic financial statements based on our audit. We conducted our audit in accordance with auditing standards generally accepted in the United States of America and the standards applicable to financial audits contained in Government Auditing Standards, issued by the Comptroller General of the United States. Those standards require that we plan and perform the audit to obtain reasonable assurance about whether the basic financial statements are free of material misstatement. An audit includes examining, on a test basis, evidence supporting the amounts and disclosures in the basic financial statements. An audit also includes assessing the accounting principles used and significant estimates made by management, as well as evaluating the overall financial statement presentation. We believe that our audit provides a reasonable basis for our opinion. Our audit was conducted for the purpose of forming an opinion on the basic financial statements taken as a whole. The accompanying supplementary Schedules of Revenues, Expenditures, and Changes in Fund Balance-Budget and Actual-Budgetary Basis (and Summary of Reporting Policy), as listed in the Table of Contents, are presented for the purpose of additional analysis and are not a required part of the basic financial statements. Only the information in the General Fund Schedule of Revenues, Expenditures, and Changes in Fund Balance-Budget and Actual-Budgetary Basis has been subjected to the auditing procedures applied in the examination of the basic financial statements and, in our opinion, is fairly stated in all material respects in relation to the basic financial statements taken as a whole. The remaining information on pages 32 to 49, marked unaudited, has not been subjected to the auditing procedures applied in the audit of the basic financial statements and, accordingly, we express no opinion on it.
James R. Nobles Cecile M. Ferkul, CPA Legislative Auditor Deputy Legislative Auditor December 11, 2009
3 Room 140 Centennial Building, 658 Cedar Street, St. Paul, Minnesota 55155-1603 • Tel: 651-296-4708 • Fax: 651-296-4712
E-mail: [email protected] • Web Site: www.auditor.leg.state.mn.us • Through Minnesota Relay: 1-800-627-3529 or 7-1-1
O L A


STATE OF MINNESOTA
5
2009 Comparison of Budget and Actual Revenues, Expenditures, and and Changes in Fund Balances Changes in Fund Balances Summary of Reporting Policies Summary of Reporting Policies
The following notes provide general policies relevant to preparing this report. The following notes provide general policies relevant to preparing this report.
Budget Budget
Revenues Revenues
Original Budget Original Budget
The budget amounts reported for revenues and transfers‐in are the resource estimates used at the start of the fiscal year to determine allowable spending. In some cases, primarily the General Fund, these amounts were used in determining the amount available for appropriation by the 2008 Legislature and are from the Consolidated Fund Statement, Budgetary Basis, dated June 24, 2008, prepared by Minnesota Management and Budget.
The budget amounts reported for revenues and transfers‐in are the resource estimates used at the start of the fiscal year to determine allowable spending. In some cases, primarily the General Fund, these amounts were used in determining the amount available for appropriation by the 2008 Legislature and are from the Consolidated Fund Statement, Budgetary Basis, dated June 24, 2008, prepared by Minnesota Management and Budget.
Revenue categories in this report closely follow the Consolidated Fund Statement, Budgetary Basis report. The categories used are not consistent across funds because revenues are not estimated at the same level of detail for all revenue categories in all funds. For example, revenues for the General Fund do not include specific estimates of federal revenues even though such revenues are received. The special revenue funds include revenue budgets for federal revenues, as amounts are significant to those funds.
Revenue categories in this report closely follow the Consolidated Fund Statement, Budgetary Basis report. The categories used are not consistent across funds because revenues are not estimated at the same level of detail for all revenue categories in all funds. For example, revenues for the General Fund do not include specific estimates of federal revenues even though such revenues are received. The special revenue funds include revenue budgets for federal revenues, as amounts are significant to those funds.
Budget Budget
The budget amounts reported for revenues and transfers‐in are the latest resource estimates used in determining allowable spending. These amounts represent the relevant agency’s estimate of resources, made at the same point that expenditures were last estimated prior to fiscal year‐end, and are taken from the Consolidated Fund Statement, Budgetary Basis report, dated July 17, 2009, prepared by Minnesota Management and Budget.
The budget amounts reported for revenues and transfers‐in are the latest resource estimates used in determining allowable spending. These amounts represent the relevant agency’s estimate of resources, made at the same point that expenditures were last estimated prior to fiscal year‐end, and are taken from the Consolidated Fund Statement, Budgetary Basis report, dated July 17, 2009, prepared by Minnesota Management and Budget.
For Dedicated Receipts, revenue received determines the spending limits. If these receipts are significant to the fund, the Budget is adjusted to reflect the final spending authority of revenues received.
For Dedicated Receipts, revenue received determines the spending limits. If these receipts are significant to the fund, the Budget is adjusted to reflect the final spending authority of revenues received.
Expenditures Expenditures
Original Budget Original Budget
The original budgets, with the exception of open appropriations, are comprised of the amounts specified in appropriation laws prior to the start of the fiscal year, actual appropriation amounts automatically carried over from previous years, transfers between programs, as authorized, and any other legally authorized legislative or executive changes before the beginning of the fiscal year. For open appropriations, the estimated expenditures were taken from the General Fund ‐ Fund Balance Analysis, dated June 24, 2008, prepared by Minnesota Management and Budget.
The original budgets, with the exception of open appropriations, are comprised of the amounts specified in appropriation laws prior to the start of the fiscal year, actual appropriation amounts automatically carried over from previous years, transfers between programs, as authorized, and any other legally authorized legislative or executive changes before the beginning of the fiscal year. For open appropriations, the estimated expenditures were taken from the General Fund ‐ Fund Balance Analysis, dated June 24, 2008, prepared by Minnesota Management and Budget.

6
Budget
The budget, except for open appropriations, are comprised of the amount specified in appropriation laws, including subsequent appropriations for the same purpose, and any other legally authorized legislative or executive changes made during the fiscal year. For open appropriations, actual amounts spent are used because the law authorizes spending at levels necessary to fulfill the obligation.
Adjustments to Budgets
The budget is adjusted to reflect changes to the appropriated amounts as permitted (or required) in statute or appropriation laws. Budget adjustments include, but are not limited to, transfers between programs as authorized, and actual dedicated receipts available to fund expenditures, encumbrances, and transfers.
Actual
Actual revenues and transfers‐in included are those attributable to fiscal year 2009. These primarily represent the amounts received during the fiscal year, net of refunds. In some instances, usually for dedicated revenues, amounts received after year‐end, through the close of the books in August, may be included, if related to fiscal year 2009.
Actual expenditures include disbursements and encumbrances for fiscal year 2009. Except for the Trunk Highway Fund, the only instance encumbrances are not included as expenditures is in ongoing appropriations. These encumbrances are not included since liquidation may occur over several years. In the Trunk Highway Fund encumbrances are included as expenditures in all appropriation types.
Actual transfers‐out are transfers to other funds for 2009, including transfers made after year‐end, through the close of the books in August, if related to fiscal year 2009. These transfers are included as a part of expenditures.
Variances
Revenues and transfers‐in variances represent the differences between the forecasted revenues to be received and the amount actually received.
Expenditure and transfer‐out variances are the primary focus of this report, especially negative variances. Negative variances represent spending in excess of the amount allowed in law and are explained in fund notes, if significant. Spending did not exceed authorized limits in fiscal year 2009.
SCHEDULE OF REVENUES, EXPENDITURESAND CHANGES IN FUND BALANCE ‐ BUDGET AND ACTUAL
Budget Actual Variance
BUDGETARY BASISYEAR ENDED JUNE 30, 2009(IN THOUSANDS)
STATE OF MINNESOTA
Original Budget
GENERAL FUND
Net Revenues and Transfers‐In
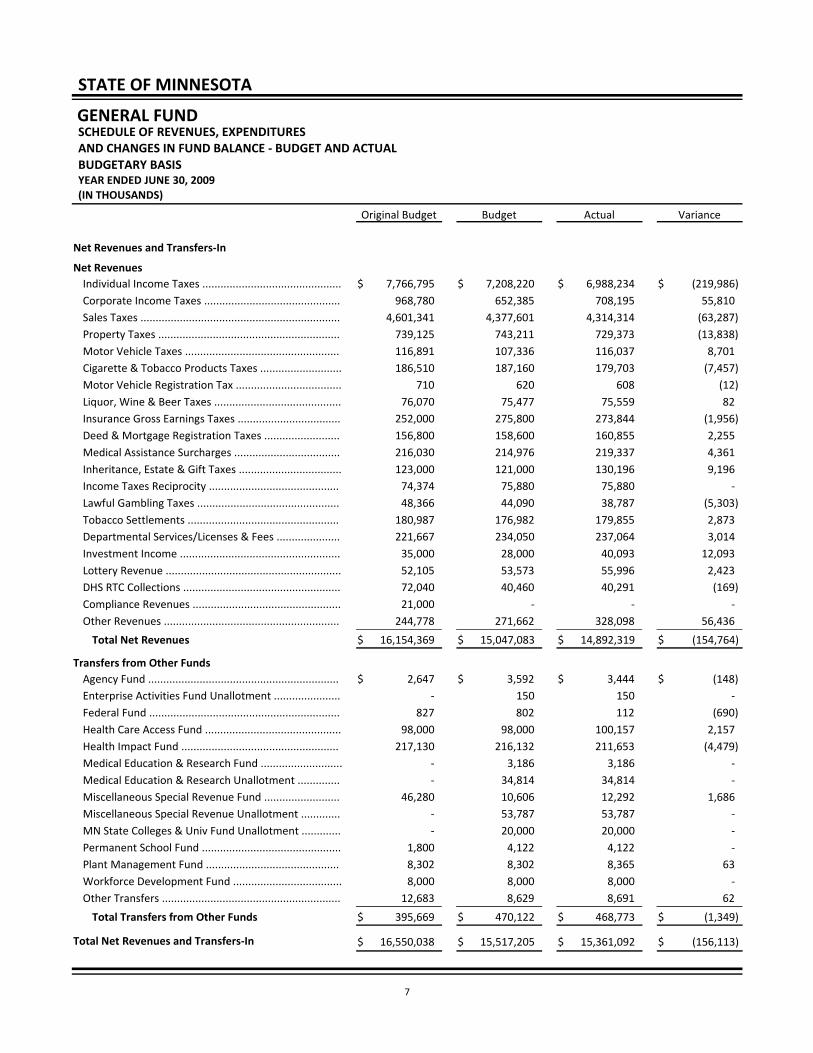
Net RevenuesIndividual Income Taxes .............................................. 7,208,220 6,988,234 (219,986)$ $ $7,766,795$Corporate Income Taxes ............................................. 652,385 708,195 55,810968,780Sales Taxes .................................................................. 4,377,601 4,314,314 (63,287)4,601,341Property Taxes ............................................................ 743,211 729,373 (13,838)739,125Motor Vehicle Taxes ................................................... 107,336 116,037 8,701116,891Cigarette & Tobacco Products Taxes ........................... 187,160 179,703 (7,457)186,510Motor Vehicle Registration Tax ................................... 620 608 (12)710Liquor, Wine & Beer Taxes .......................................... 75,477 75,559 8276,070Insurance Gross Earnings Taxes .................................. 275,800 273,844 (1,956)252,000Deed & Mortgage Registration Taxes ......................... 158,600 160,855 2,255156,800Medical Assistance Surcharges ................................... 214,976 219,337 4,361216,030Inheritance, Estate & Gift Taxes .................................. 121,000 130,196 9,196123,000Income Taxes Reciprocity ........................................... 75,880 75,880 ‐74,374Lawful Gambling Taxes ............................................... 44,090 38,787 (5,303)48,366Tobacco Settlements .................................................. 176,982 179,855 2,873180,987Departmental Services/Licenses & Fees ..................... 234,050 237,064 3,014221,667Investment Income ..................................................... 28,000 40,093 12,09335,000Lottery Revenue .......................................................... 53,573 55,996 2,42352,105DHS RTC Collections .................................................... 40,460 40,291 (169)72,040Compliance Revenues ................................................. ‐ ‐ ‐21,000Other Revenues .......................................................... 271,662 328,098 56,436244,778
15,047,083 14,892,319 (154,764)Total Net Revenues $ $ $16,154,369$
Transfers from Other FundsAgency Fund ............................................................... 3,592 3,444 (148)$ $ $2,647$Enterprise Activities Fund Unallotment ...................... 150 150 ‐ ‐Federal Fund ............................................................... 802 112 (690)827Health Care Access Fund ............................................. 98,000 100,157 2,15798,000Health Impact Fund .................................................... 216,132 211,653 (4,479)217,130Medical Education & Research Fund ........................... 3,186 3,186 ‐ ‐Medical Education & Research Unallotment .............. 34,814 34,814 ‐ ‐Miscellaneous Special Revenue Fund ......................... 10,606 12,292 1,68646,280Miscellaneous Special Revenue Unallotment ............. 53,787 53,787 ‐ ‐MN State Colleges & Univ Fund Unallotment ............. 20,000 20,000 ‐ ‐Permanent School Fund .............................................. 4,122 4,122 ‐1,800Plant Management Fund ............................................ 8,302 8,365 638,302Workforce Development Fund .................................... 8,000 8,000 ‐8,000Other Transfers ........................................................... 8,629 8,691 6212,683
470,122 468,773 (1,349)Total Transfers from Other Funds $ $ $395,669$
16,550,038 15,517,205 15,361,092 (156,113)Total Net Revenues and Transfers‐In $ $ $$
7

SCHEDULE OF REVENUES, EXPENDITURESAND CHANGES IN FUND BALANCE ‐ BUDGET AND ACTUAL
Budget Actual Variance
BUDGETARY BASISYEAR ENDED JUNE 30, 2009(IN THOUSANDS)
STATE OF MINNESOTA
Original Budget
GENERAL FUND
Expenditures and Transfers‐Out
Accountancy BoardDepartmental Appropriations ..................................... 595 431 164$ $ $595$
AdministrationAdministrative Management Services ........................ 4,535 4,514 21$ $ $4,790$Census 2010 ................................................................ 230 214 16230DDC / Self‐Advocacy Network ..................................... 134 134 ‐134Developmental Disability Council ............................... 74 74 ‐74EQB Rulemaking Regarding DNR ................................. 57 57 ‐57Genetic Information Work Group ............................... 25 25 ‐33Hubert H Humphrey Memorial ................................... 141 31 110114Land Management Information Center ...................... 829 812 17806Land Sale Revolving Loan ............................................ 148 28 120148Legislative in Lieu of Rent ........................................... 7,888 7,888 ‐7,888LMIC‐Township Acreage ............................................. 60 60 ‐60MPR Equipment Grants .............................................. 190 190 ‐190Office of Grants Management .................................... 49 49 ‐50Office of State Archaeologist ...................................... 206 206 ‐196Public Education Radio Comm Service Grants ............ 253 253 ‐287Public Education Radio Equipment Grants .................. 64 64 ‐100Public TV Equipment Grants ....................................... 167 167 ‐200Public TV Matching Grants .......................................... 1,811 1,811 ‐1,811Real Property Portfolio Management ......................... 2,107 2,100 71,336Small Agency Resource Team ..................................... 319 258 61339State & Community Services ....................................... 1,387 1,375 121,424State Facilities Services ............................................... 13,679 4,668 9,01113,839Targeted Group Disparity Study .................................. 500 500 ‐500Twin Cities Regional Cable Grants ............................... 17 17 ‐17Washington County Veterans Camp ........................... 5 5 ‐5WCRA Insurance ......................................................... 886 886 ‐532Workers Memorial ...................................................... 40 ‐ 4040
35,801 26,386 9,415Total Administration $ $ $35,200$
Administrative HearingsDepartmental Appropriations ..................................... 387 382 5$ $ $388$
AgricultureAdministration & Financial Assistance ........................ 4,404 4,378 26$ $ $4,406$Agricultural BMP Loan Program .................................. 413 300 113678Clean Water Legacy Assistance ................................... 193 91 102193Clean Water Legacy Research ..................................... 1,097 872 2251,097Dairy Development Program ....................................... 1,013 998 151,006Electronic Inspection System ...................................... 232 232 ‐232Emergency Planning .................................................... 127 127 ‐127
8

SCHEDULE OF REVENUES, EXPENDITURESAND CHANGES IN FUND BALANCE ‐ BUDGET AND ACTUAL
Budget Actual Variance
BUDGETARY BASISYEAR ENDED JUNE 30, 2009(IN THOUSANDS)
STATE OF MINNESOTA
Original Budget
GENERAL FUND
Ethanol Development ................................................. 14,858 14,858 ‐14,858Grants Ag Societies & Association ............................... 465 465 ‐465Horticulture Society Grants ......................................... 18 18 ‐18Livestock Investment Grant Program .......................... 1,000 985 151,000Livestock Premise ....................................................... 158 158 ‐158Livestock Siting ........................................................... 105 105 ‐105Mental Health Grants ................................................. 100 100 ‐100Minnesota Ag Education Leadership Council .............. 250 250 ‐250Minnesota Ag Fertilizer Research Education ............... 25 23 223Minnesota Grown Program ......................................... 186 186 ‐186Minnesota Livestock Breeders Association ................. 19 19 ‐19Nextgen Energy Board Projects ................................... 2,696 2,694 22,996Northern Crops Institute ............................................. 50 50 ‐50Organic Cost Share ...................................................... 104 102 2104Promotion & Marketing .............................................. 4,780 4,764 165,167Protection Service ....................................................... 13,190 13,179 1113,187Second Harvest Milk Grants ........................................ 500 500 ‐500Sustainable Ag & IMP Demonstration Grants ............. 142 119 23160Turf Grass Research Grants ......................................... 65 65 ‐65
46,190 45,638 552Total Agriculture $ $ $47,150$
Agriculture Utilization ResearchDepartmental Appropriations ..................................... 2,400 2,400 ‐$ $ $2,400$Ag Utilization Research Institute ................................. 700 700 ‐700
3,100 3,100 ‐Total Agriculture Utilization Research $ $ $3,100$
Amateur Sports CommissionDepartmental Appropriations ..................................... 307 304 3$ $ $307$Target Center Lease Agreement ................................. 750 750 ‐750
1,057 1,054 3Total Amateur Sports Commission $ $ $1,057$
Animal Health BoardAvian Pneumovirus Disease ........................................ 80 80 ‐$ $ $80$Bovine TB Eradication ................................................. 2,625 2,617 82,625BTB Buyout/ Fencing ................................................... 3,350 3,350 ‐3,350Chronic Wasting Disease ............................................. 409 409 ‐410Indemnity .................................................................... 84 12 7284Johne's Disease Control Program ............................... 223 221 2223Livestock & Poultry Health .......................................... 2,455 2,436 192,473North Central Grants ................................................... 150 150 ‐150
9,376 9,275 101Total Animal Health Board $ $ $9,395$
Architecture Engineering BoardDepartmental Appropriations ..................................... 869 693 176$ $ $870$
Arts BoardGrant Programs ........................................................... 6,793 6,780 13$ $ $6,792$
9

SCHEDULE OF REVENUES, EXPENDITURESAND CHANGES IN FUND BALANCE ‐ BUDGET AND ACTUAL
Budget Actual Variance
BUDGETARY BASISYEAR ENDED JUNE 30, 2009(IN THOUSANDS)
STATE OF MINNESOTA
Original Budget
GENERAL FUND
Operations & Services ................................................. 734 730 4734Region Arts Fiscal Agent .............................................. 2,959 2,959 ‐2,959
10,486 10,469 17Total Arts Board $ $ $10,485$
Asian‐Pacific CouncilDepartmental Appropriations ..................................... 296 296 ‐$ $ $297$
Attorney GeneralDepartmental Appropriations ..................................... 34,089 34,011 78$ $ $35,243$Copy Reimbursement ................................................. 9 9 ‐10Medicare Fraud Income .............................................. 29 29 ‐28
34,127 34,049 78Total Attorney General $ $ $35,281$
Barber/Cosmetologist ExaminersDepartmental Appropriations ..................................... 872 872 ‐$ $ $864$
Black Minnesotans CouncilDepartmental Appropriations ..................................... 347 347 ‐$ $ $345$
Campaign Finance BoardDepartmental Appropriations ..................................... 4,455 4,441 14$ $ $2,062$
Capitol Area ArchitectCAAPB Decennial Expenses ......................................... 58 50 8$ $ $28$Capitol Area Architect Planning Board ........................ 406 349 57406Hubert H Humphrey Memorial ................................... 13 ‐ 1313
477 399 78Total Capitol Area Architect $ $ $447$
Center for Arts EducationDepartmental Appropriations ..................................... 7,082 7,080 2$ $ $7,090$
Chicano Latino Affairs CouncilDepartmental Appropriations ..................................... 331 331 ‐$ $ $331$
Combative Sports CommissionDepartmental Appropriations ..................................... 80 80 ‐$ $ $80$
CommerceAdministrative Services ............................................... 5,144 4,745 399$ $ $5,284$Energy & Telecommunications ................................... 10,764 5,593 5,1719,667Financial Examinations ................................................ 8,916 5,800 3,1167,057Market Assurance ....................................................... 6,330 5,708 6226,440Solar Rebate Program ................................................. 200 87 113200
31,354 21,933 9,421Total Commerce $ $ $28,648$
CorrectionsClaims ......................................................................... 14 14 ‐$ $ $14$Community Services ................................................... 114,600 113,901 699114,852Correctional Institutions ............................................. 339,356 338,247 1,109338,694Domestic Abuse Re‐Entry Grants ................................ 200 200 ‐200Employment Services‐Ex‐Offenders ............................ 200 200 ‐200
10

SCHEDULE OF REVENUES, EXPENDITURESAND CHANGES IN FUND BALANCE ‐ BUDGET AND ACTUAL
Budget Actual Variance
BUDGETARY BASISYEAR ENDED JUNE 30, 2009(IN THOUSANDS)
STATE OF MINNESOTA
Original Budget
GENERAL FUND
ISR Agents‐Conditional Release Program .................... 314 208 106314Mentoring Grants ....................................................... 375 375 ‐375Offender Re‐Entry ....................................................... 1,360 1,357 31,360Offender Re‐Entry Grants ........................................... 550 550 ‐550Operations Support .................................................... 19,156 19,139 1719,151Probation ‐ Caseload Reduction .................................. 2,352 2,082 2702,348Re‐Entry Productive Day Grants .................................. 150 150 ‐150Sex Offender Civil Commit & Tracking ........................ 482 215 267482
479,109 476,638 2,471Total Corrections $ $ $478,690$
Court of AppealsDepartmental Appropriations ..................................... 8,736 8,689 47$ $ $8,969$CCA Case Load Increase .............................................. 1,907 1,901 61,903
10,643 10,590 53Total Court of Appeals $ $ $10,872$
Disability CouncilDepartmental Appropriations ..................................... 582 580 2$ $ $571$Assistive Tech Collaborative ........................................ 27 27 ‐27
609 607 2Total Disability Council $ $ $598$
EducationAbatement Aid ............................................................ 1,407 1,407 ‐$ $ $1,629$Academy of Science .................................................... 41 41 ‐41Adult Basic Education Aid ........................................... 41,749 41,737 1241,712Adults With Disabilities Program ................................. 709 709 ‐710Adv Place Intl Baccalaureate Conc Enroll .................... 4,601 4,597 44,601Advance Placement .................................................... 3,762 3,756 63,754After School Community Learning .............................. 2,600 2,567 332,600Agriculture Market Value ............................................ 5,776 5,776 ‐5,777Alternative Facilities Bonding ...................................... 19,287 19,287 ‐19,287APIB Summer Workshops ........................................... 543 414 129543Board of School Administrators .................................. 173 165 8173Board of Teaching ....................................................... 674 674 ‐675Border City Disparity ................................................... 837 837 ‐830Career & Technology Rulemaking ............................... 7 4 37Charter School Lease ................................................... 36,605 36,605 ‐37,527Charter School Startup ................................................ 1,982 1,982 ‐1,987Children With Disability Aid ........................................ 1,556 1,556 ‐2,282College Level Examination Program ............................ 479 109 3701,279College Urban Education Concordia ............................ 216 216 ‐212College Urban Education Hamline .............................. 179 179 ‐179College Urban Education St Thomas ........................... 225 225 ‐223Community Education Aid .......................................... 785 785 ‐796Compliance Revenue ISD 11 ....................................... 1,500 1,500 ‐1,500Compliance Revenue ISD 279 ..................................... 210 210 ‐210
11
SCHEDULE OF REVENUES, EXPENDITURESAND CHANGES IN FUND BALANCE ‐ BUDGET AND ACTUAL
Budget Actual Variance
BUDGETARY BASISYEAR ENDED JUNE 30, 2009(IN THOUSANDS)
STATE OF MINNESOTA
Original Budget
GENERAL FUND
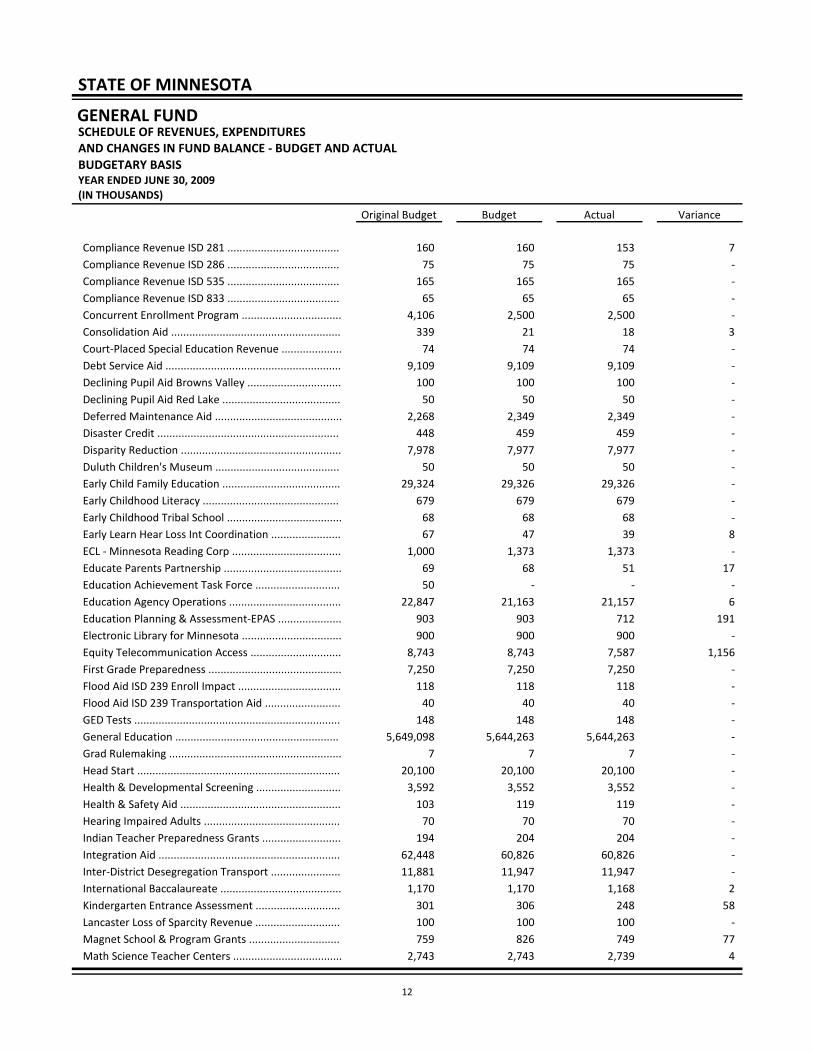
Compliance Revenue ISD 281 ..................................... 160 153 7160Compliance Revenue ISD 286 ..................................... 75 75 ‐75Compliance Revenue ISD 535 ..................................... 165 165 ‐165Compliance Revenue ISD 833 ..................................... 65 65 ‐65Concurrent Enrollment Program ................................. 2,500 2,500 ‐4,106Consolidation Aid ........................................................ 21 18 3339Court‐Placed Special Education Revenue .................... 74 74 ‐74Debt Service Aid .......................................................... 9,109 9,109 ‐9,109Declining Pupil Aid Browns Valley ............................... 100 100 ‐100Declining Pupil Aid Red Lake ....................................... 50 50 ‐50Deferred Maintenance Aid .......................................... 2,349 2,349 ‐2,268Disaster Credit ............................................................ 459 459 ‐448Disparity Reduction ..................................................... 7,977 7,977 ‐7,978Duluth Children's Museum ......................................... 50 50 ‐50Early Child Family Education ....................................... 29,326 29,326 ‐29,324Early Childhood Literacy ............................................. 679 679 ‐679Early Childhood Tribal School ...................................... 68 68 ‐68Early Learn Hear Loss Int Coordination ....................... 47 39 867ECL ‐ Minnesota Reading Corp .................................... 1,373 1,373 ‐1,000Educate Parents Partnership ....................................... 68 51 1769Education Achievement Task Force ............................ ‐ ‐ ‐50Education Agency Operations ..................................... 21,163 21,157 622,847Education Planning & Assessment‐EPAS ..................... 903 712 191903Electronic Library for Minnesota ................................. 900 900 ‐900Equity Telecommunication Access .............................. 8,743 7,587 1,1568,743First Grade Preparedness ............................................ 7,250 7,250 ‐7,250Flood Aid ISD 239 Enroll Impact .................................. 118 118 ‐118Flood Aid ISD 239 Transportation Aid ......................... 40 40 ‐40GED Tests .................................................................... 148 148 ‐148General Education ...................................................... 5,644,263 5,644,263 ‐5,649,098Grad Rulemaking ......................................................... 7 7 ‐7Head Start ................................................................... 20,100 20,100 ‐20,100Health & Developmental Screening ............................ 3,552 3,552 ‐3,592Health & Safety Aid ..................................................... 119 119 ‐103Hearing Impaired Adults ............................................. 70 70 ‐70Indian Teacher Preparedness Grants .......................... 204 204 ‐194Integration Aid ............................................................ 60,826 60,826 ‐62,448Inter‐District Desegregation Transport ....................... 11,947 11,947 ‐11,881International Baccalaureate ........................................ 1,170 1,168 21,170Kindergarten Entrance Assessment ............................ 306 248 58301Lancaster Loss of Sparcity Revenue ............................ 100 100 ‐100Magnet School & Program Grants .............................. 826 749 77759Math Science Teacher Centers .................................... 2,743 2,739 42,743
12
SCHEDULE OF REVENUES, EXPENDITURESAND CHANGES IN FUND BALANCE ‐ BUDGET AND ACTUAL
Budget Actual Variance
BUDGETARY BASISYEAR ENDED JUNE 30, 2009(IN THOUSANDS)
STATE OF MINNESOTA
Original Budget
GENERAL FUND
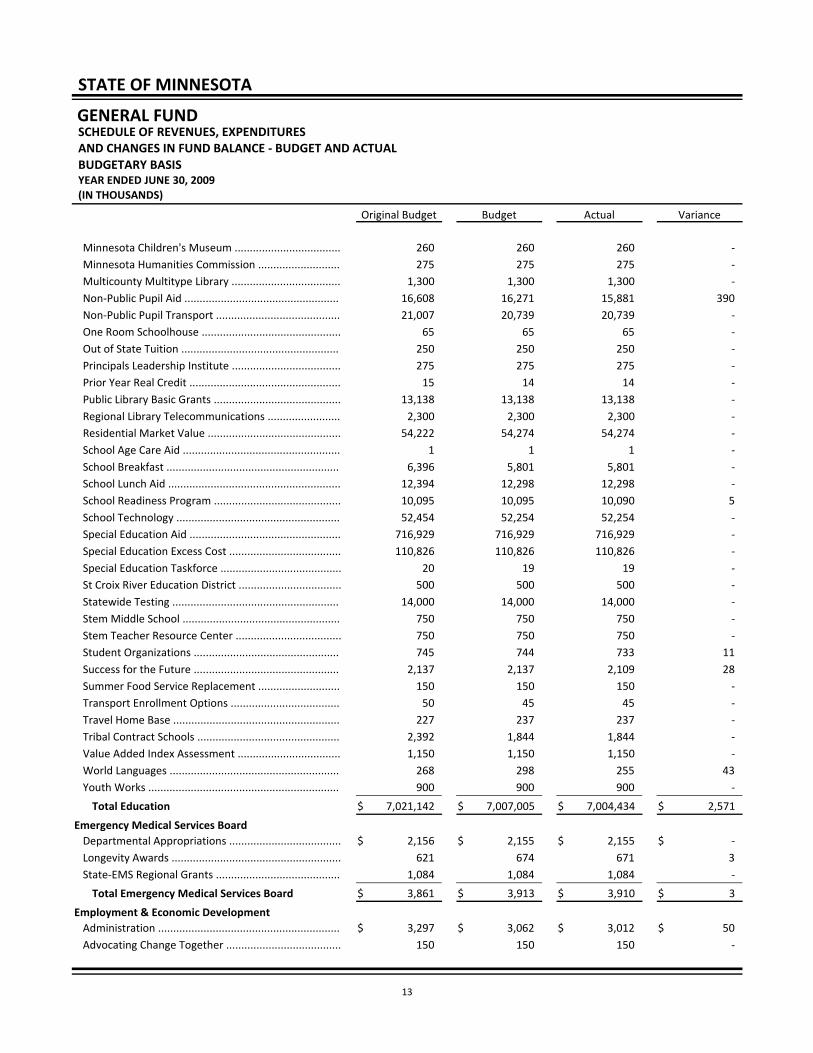
Minnesota Children's Museum ................................... 260 260 ‐260Minnesota Humanities Commission ........................... 275 275 ‐275Multicounty Multitype Library .................................... 1,300 1,300 ‐1,300Non‐Public Pupil Aid ................................................... 16,271 15,881 39016,608Non‐Public Pupil Transport ......................................... 20,739 20,739 ‐21,007One Room Schoolhouse .............................................. 65 65 ‐65Out of State Tuition .................................................... 250 250 ‐250Principals Leadership Institute .................................... 275 275 ‐275Prior Year Real Credit .................................................. 14 14 ‐15Public Library Basic Grants .......................................... 13,138 13,138 ‐13,138Regional Library Telecommunications ........................ 2,300 2,300 ‐2,300Residential Market Value ............................................ 54,274 54,274 ‐54,222School Age Care Aid .................................................... 1 1 ‐1School Breakfast ......................................................... 5,801 5,801 ‐6,396School Lunch Aid ......................................................... 12,298 12,298 ‐12,394School Readiness Program .......................................... 10,095 10,090 510,095School Technology ...................................................... 52,254 52,254 ‐52,454Special Education Aid .................................................. 716,929 716,929 ‐716,929Special Education Excess Cost ..................................... 110,826 110,826 ‐110,826Special Education Taskforce ........................................ 19 19 ‐20St Croix River Education District .................................. 500 500 ‐500Statewide Testing ....................................................... 14,000 14,000 ‐14,000Stem Middle School .................................................... 750 750 ‐750Stem Teacher Resource Center ................................... 750 750 ‐750Student Organizations ................................................ 744 733 11745Success for the Future ................................................ 2,137 2,109 282,137Summer Food Service Replacement ........................... 150 150 ‐150Transport Enrollment Options .................................... 45 45 ‐50Travel Home Base ....................................................... 237 237 ‐227Tribal Contract Schools ............................................... 1,844 1,844 ‐2,392Value Added Index Assessment .................................. 1,150 1,150 ‐1,150World Languages ........................................................ 298 255 43268Youth Works ............................................................... 900 900 ‐900
7,007,005 7,004,434 2,571Total Education $ $ $7,021,142$
Emergency Medical Services BoardDepartmental Appropriations ..................................... 2,155 2,155 ‐$ $ $2,156$Longevity Awards ........................................................ 674 671 3621State‐EMS Regional Grants ......................................... 1,084 1,084 ‐1,084
3,913 3,910 3Total Emergency Medical Services Board $ $ $3,861$
Employment & Economic DevelopmentAdministration ............................................................ 3,062 3,012 50$ $ $3,297$Advocating Change Together ...................................... 150 150 ‐150
13
SCHEDULE OF REVENUES, EXPENDITURESAND CHANGES IN FUND BALANCE ‐ BUDGET AND ACTUAL
Budget Actual Variance
BUDGETARY BASISYEAR ENDED JUNE 30, 2009(IN THOUSANDS)
STATE OF MINNESOTA
Original Budget
GENERAL FUND
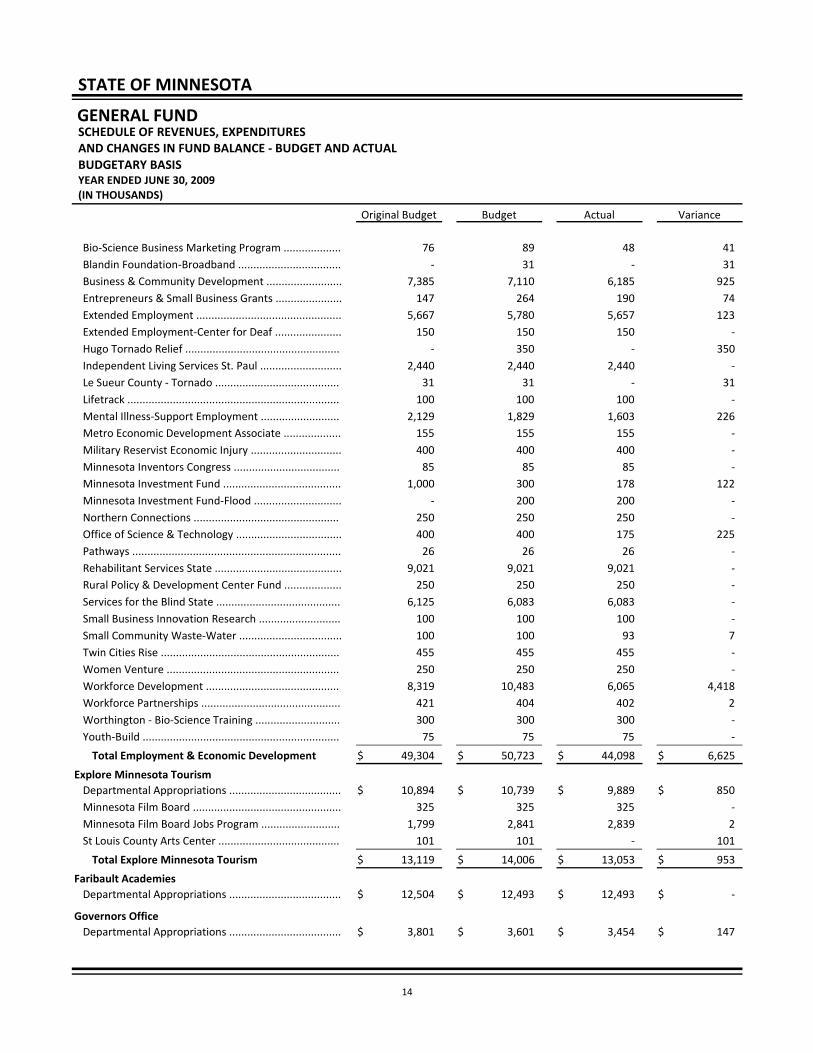
Bio‐Science Business Marketing Program ................... 89 48 4176Blandin Foundation‐Broadband .................................. 31 ‐ 31 ‐Business & Community Development ......................... 7,110 6,185 9257,385Entrepreneurs & Small Business Grants ...................... 264 190 74147Extended Employment ................................................ 5,780 5,657 1235,667Extended Employment‐Center for Deaf ...................... 150 150 ‐150Hugo Tornado Relief ................................................... 350 ‐ 350 ‐Independent Living Services St. Paul ........................... 2,440 2,440 ‐2,440Le Sueur County ‐ Tornado ......................................... 31 ‐ 3131Lifetrack ...................................................................... 100 100 ‐100Mental Illness‐Support Employment .......................... 1,829 1,603 2262,129Metro Economic Development Associate ................... 155 155 ‐155Military Reservist Economic Injury .............................. 400 400 ‐400Minnesota Inventors Congress ................................... 85 85 ‐85Minnesota Investment Fund ....................................... 300 178 1221,000Minnesota Investment Fund‐Flood ............................. 200 200 ‐ ‐Northern Connections ................................................ 250 250 ‐250Office of Science & Technology ................................... 400 175 225400Pathways ..................................................................... 26 26 ‐26Rehabilitant Services State .......................................... 9,021 9,021 ‐9,021Rural Policy & Development Center Fund ................... 250 250 ‐250Services for the Blind State ......................................... 6,083 6,083 ‐6,125Small Business Innovation Research ........................... 100 100 ‐100Small Community Waste‐Water .................................. 100 93 7100Twin Cities Rise ........................................................... 455 455 ‐455Women Venture ......................................................... 250 250 ‐250Workforce Development ............................................ 10,483 6,065 4,4188,319Workforce Partnerships .............................................. 404 402 2421Worthington ‐ Bio‐Science Training ............................ 300 300 ‐300Youth‐Build ................................................................. 75 75 ‐75
50,723 44,098 6,625Total Employment & Economic Development $ $ $49,304$
Explore Minnesota TourismDepartmental Appropriations ..................................... 10,739 9,889 850$ $ $10,894$Minnesota Film Board ................................................. 325 325 ‐325Minnesota Film Board Jobs Program .......................... 2,841 2,839 21,799St Louis County Arts Center ........................................ 101 ‐ 101101
14,006 13,053 953Total Explore Minnesota Tourism $ $ $13,119$
Faribault AcademiesDepartmental Appropriations ..................................... 12,493 12,493 ‐$ $ $12,504$
Governors OfficeDepartmental Appropriations ..................................... 3,601 3,454 147$ $ $3,801$
14

SCHEDULE OF REVENUES, EXPENDITURESAND CHANGES IN FUND BALANCE ‐ BUDGET AND ACTUAL
Budget Actual Variance
BUDGETARY BASISYEAR ENDED JUNE 30, 2009(IN THOUSANDS)
STATE OF MINNESOTA
Original Budget
GENERAL FUND
HealthDepartmental Appropriations ..................................... 1,005 991 14$ $ $1,320$Administrative Support Service ................................... 9,290 9,290 ‐9,326Community & Family Health Promotion ..................... 39,992 39,828 16440,671Federal Qualified Health Center .................................. 649 649 ‐649Floods 2007 ................................................................. 53 2 5116Health Protection ........................................................ 9,753 9,741 129,811Hearing Aid Loan Bank ................................................ 69 66 369Lead Abatement Grants .............................................. 381 381 ‐381Medical Education & Research Costs .......................... 4,250 4,250 ‐4,250Minority & Multicultural Health .................................. 4,932 4,932 ‐4,943Pandemic Influenza MDH ............................................ 2 2 ‐2Pandemic Influenza Stockpile ..................................... 49 49 ‐20PFC Water Treatment Study ....................................... 40 35 540Policy Quality & Compliance ....................................... 6,943 6,850 937,047Suicide Prevention ...................................................... 184 161 23161
77,592 77,227 365Total Health $ $ $78,706$
Historical SocietyDepartmental Appropriations ..................................... 23,658 23,658 ‐$ $ $24,258$FarmAmerica ............................................................... 128 128 ‐128Minnesota International Center ................................. 43 43 ‐43Minnesota Sesquicentennial‐Comm 2008 .................. 575 575 ‐575
24,404 24,404 ‐Total Historical Society $ $ $25,004$
Housing Finance AgencyDepartmental Appropriations ..................................... 47,934 47,934 ‐$ $ $45,234$
Human RightsCase Management System .......................................... 1,219 1,007 212$ $ $1,394$Human Rights Enforcement ........................................ 3,558 3,545 133,681
4,777 4,552 225Total Human Rights $ $ $5,075$
Human ServicesDepartmental Appropriations ..................................... 1,066,798 1,027,651 39,147$ $ $1,011,140$Adopt/Relative Custody Assistance Grants ................. 38,298 35,160 3,13844,298Aging & Adult Services Grants ..................................... 14,336 14,336 ‐14,390CD Non‐Entitlement Grants ........................................ 3,989 3,760 2293,772Child & Community Services Grants ............................ 67,863 67,863 ‐67,863Child Care Development Grants .................................. 6,018 5,401 6176,018Child Support Enforce Grants ...................................... 5,252 5,252 ‐5,252Children Services Grants ............................................. 30,124 28,302 1,82231,589Deaf & Hard of Hearing Grants ................................... 1,964 1,935 291,964Medical Assistance Grants .......................................... 3,085,522 3,022,989 62,5333,510,145Mental Health Grants ................................................. 71,345 70,595 75075,729Minnesota Food Assistance Program Grants .............. 505 386 119505
15
SCHEDULE OF REVENUES, EXPENDITURESAND CHANGES IN FUND BALANCE ‐ BUDGET AND ACTUAL
Budget Actual Variance
BUDGETARY BASISYEAR ENDED JUNE 30, 2009(IN THOUSANDS)
STATE OF MINNESOTA
Original Budget
GENERAL FUND
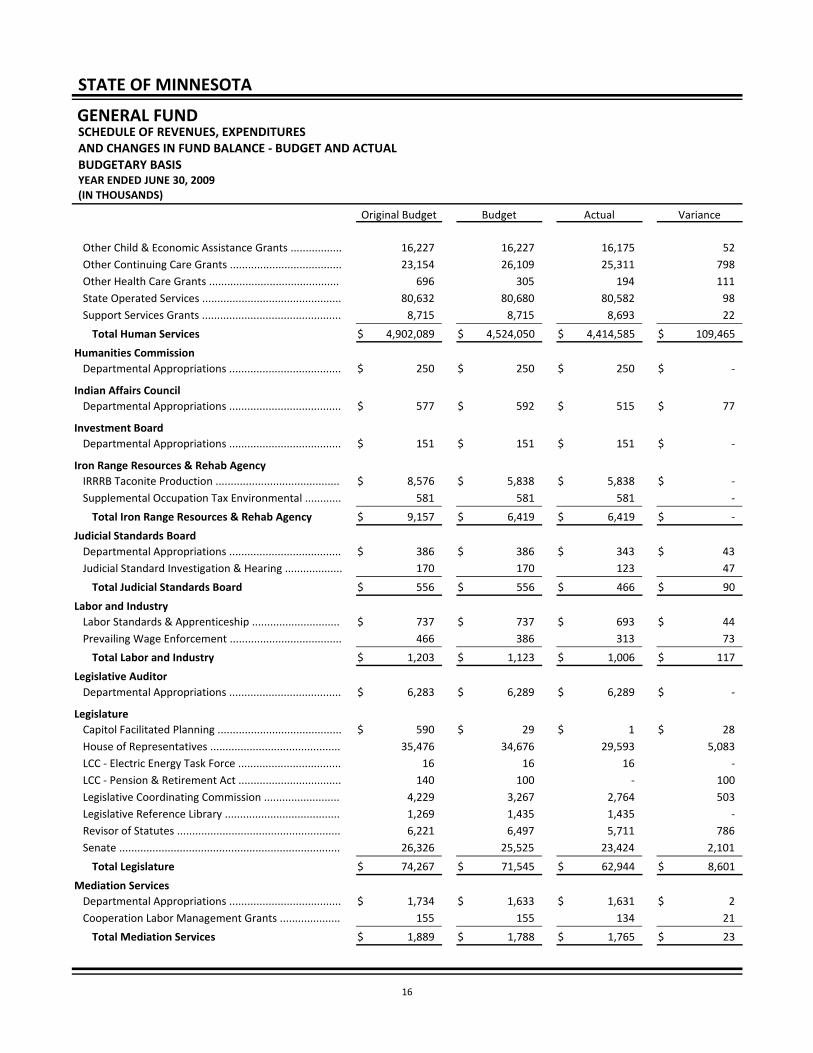
Other Child & Economic Assistance Grants ................. 16,227 16,175 5216,227Other Continuing Care Grants ..................................... 26,109 25,311 79823,154Other Health Care Grants ........................................... 305 194 111696State Operated Services .............................................. 80,680 80,582 9880,632Support Services Grants .............................................. 8,715 8,693 228,715
4,524,050 4,414,585 109,465Total Human Services $ $ $4,902,089$
Humanities CommissionDepartmental Appropriations ..................................... 250 250 ‐$ $ $250$
Indian Affairs CouncilDepartmental Appropriations ..................................... 592 515 77$ $ $577$
Investment BoardDepartmental Appropriations ..................................... 151 151 ‐$ $ $151$
Iron Range Resources & Rehab AgencyIRRRB Taconite Production ......................................... 5,838 5,838 ‐$ $ $8,576$Supplemental Occupation Tax Environmental ............ 581 581 ‐581
6,419 6,419 ‐Total Iron Range Resources & Rehab Agency $ $ $9,157$
Judicial Standards BoardDepartmental Appropriations ..................................... 386 343 43$ $ $386$Judicial Standard Investigation & Hearing ................... 170 123 47170
556 466 90Total Judicial Standards Board $ $ $556$
Labor and IndustryLabor Standards & Apprenticeship ............................. 737 693 44$ $ $737$Prevailing Wage Enforcement ..................................... 386 313 73466
1,123 1,006 117Total Labor and Industry $ $ $1,203$
Legislative AuditorDepartmental Appropriations ..................................... 6,289 6,289 ‐$ $ $6,283$
LegislatureCapitol Facilitated Planning ......................................... 29 1 28$ $ $590$House of Representatives ........................................... 34,676 29,593 5,08335,476LCC ‐ Electric Energy Task Force .................................. 16 16 ‐16LCC ‐ Pension & Retirement Act .................................. 100 ‐ 100140Legislative Coordinating Commission ......................... 3,267 2,764 5034,229Legislative Reference Library ...................................... 1,435 1,435 ‐1,269Revisor of Statutes ...................................................... 6,497 5,711 7866,221Senate ......................................................................... 25,525 23,424 2,10126,326
71,545 62,944 8,601Total Legislature $ $ $74,267$
Mediation ServicesDepartmental Appropriations ..................................... 1,633 1,631 2$ $ $1,734$Cooperation Labor Management Grants .................... 155 134 21155
1,788 1,765 23Total Mediation Services $ $ $1,889$
16
SCHEDULE OF REVENUES, EXPENDITURESAND CHANGES IN FUND BALANCE ‐ BUDGET AND ACTUAL
Budget Actual Variance
BUDGETARY BASISYEAR ENDED JUNE 30, 2009(IN THOUSANDS)
STATE OF MINNESOTA
Original Budget
GENERAL FUND
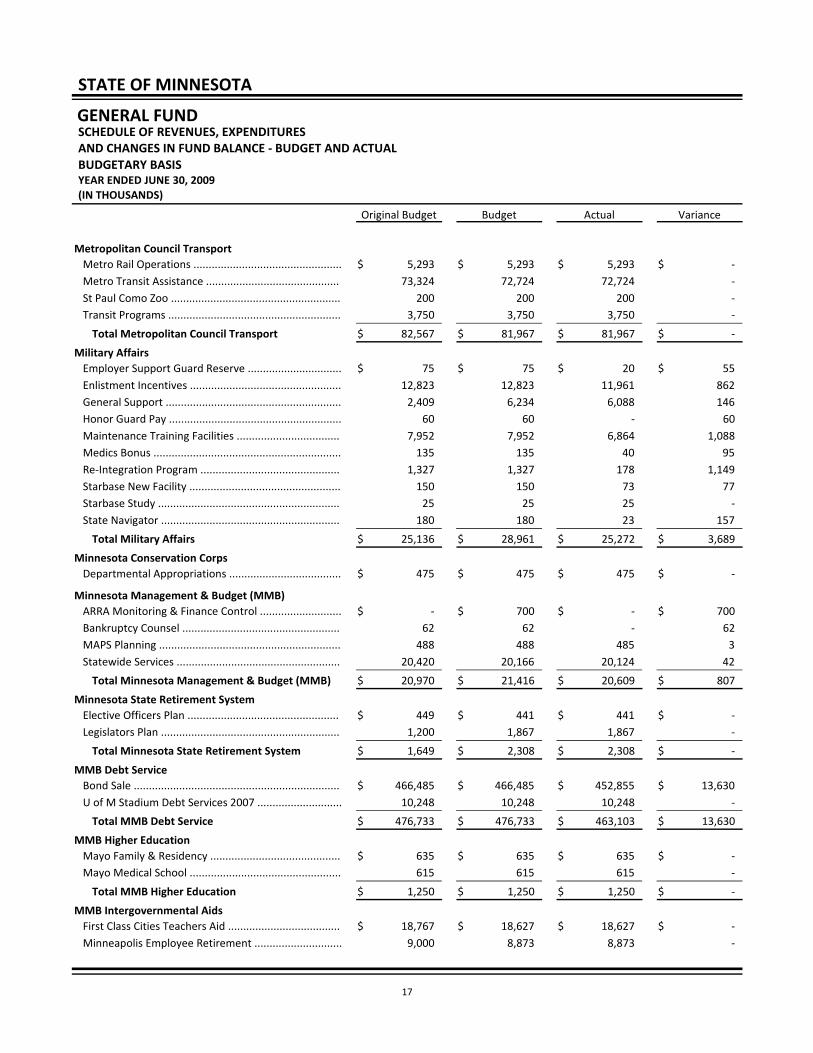
Metropolitan Council TransportMetro Rail Operations ................................................. 5,293 5,293 ‐$ $ $5,293$Metro Transit Assistance ............................................ 72,724 72,724 ‐73,324St Paul Como Zoo ........................................................ 200 200 ‐200Transit Programs ......................................................... 3,750 3,750 ‐3,750
81,967 81,967 ‐Total Metropolitan Council Transport $ $ $82,567$
Military AffairsEmployer Support Guard Reserve ............................... 75 20 55$ $ $75$Enlistment Incentives .................................................. 12,823 11,961 86212,823General Support .......................................................... 6,234 6,088 1462,409Honor Guard Pay ......................................................... 60 ‐ 6060Maintenance Training Facilities .................................. 7,952 6,864 1,0887,952Medics Bonus .............................................................. 135 40 95135Re‐Integration Program .............................................. 1,327 178 1,1491,327Starbase New Facility .................................................. 150 73 77150Starbase Study ............................................................ 25 25 ‐25State Navigator ........................................................... 180 23 157180
28,961 25,272 3,689Total Military Affairs $ $ $25,136$
Minnesota Conservation CorpsDepartmental Appropriations ..................................... 475 475 ‐$ $ $475$
Minnesota Management & Budget (MMB)ARRA Monitoring & Finance Control ........................... 700 ‐ 700$ $ $ ‐$Bankruptcy Counsel .................................................... 62 ‐ 6262MAPS Planning ............................................................ 488 485 3488Statewide Services ...................................................... 20,166 20,124 4220,420
21,416 20,609 807Total Minnesota Management & Budget (MMB) $ $ $20,970$
Minnesota State Retirement SystemElective Officers Plan .................................................. 441 441 ‐$ $ $449$Legislators Plan ........................................................... 1,867 1,867 ‐1,200
2,308 2,308 ‐Total Minnesota State Retirement System $ $ $1,649$
MMB Debt ServiceBond Sale .................................................................... 466,485 452,855 13,630$ $ $466,485$U of M Stadium Debt Services 2007 ............................ 10,248 10,248 ‐10,248
476,733 463,103 13,630Total MMB Debt Service $ $ $476,733$
MMB Higher EducationMayo Family & Residency ........................................... 635 635 ‐$ $ $635$Mayo Medical School .................................................. 615 615 ‐615
1,250 1,250 ‐Total MMB Higher Education $ $ $1,250$
MMB Intergovernmental AidsFirst Class Cities Teachers Aid ..................................... 18,627 18,627 ‐$ $ $18,767$Minneapolis Employee Retirement ............................. 8,873 8,873 ‐9,000
17

SCHEDULE OF REVENUES, EXPENDITURESAND CHANGES IN FUND BALANCE ‐ BUDGET AND ACTUAL
Budget Actual Variance
BUDGETARY BASISYEAR ENDED JUNE 30, 2009(IN THOUSANDS)
STATE OF MINNESOTA
Original Budget
GENERAL FUND
Public Defender Costs ................................................. 500 495 5500
28,000 27,995 5Total MMB Intergovernmental Aids $ $ $28,267$
MMB Non‐OperatingDepartmental Appropriations ..................................... 682,417 682,417 ‐$ $ $682,417$Carryforward from Technology 2007 .......................... 146 ‐ 146128General Purposes Contingent ..................................... 434 ‐ 434434I‐35W Bridge Administrative Expenses ....................... 681 681 ‐681I‐35W Bridge Compensation Fund .............................. 24,000 24,000 ‐24,000I‐35W Bridge Supplement Payments .......................... 12,640 12,640 ‐12,640I‐35W Bridge Waite House Grants .............................. 305 305 ‐305PSA DNR Public Safety ................................................. 5,446 1,199 4,2475,446Refund of Erroneous Deposits .................................... 1,251 1,251 ‐ ‐Tort Claims .................................................................. 160 117 43160
727,480 722,610 4,870Total MMB Non‐Operating $ $ $726,211$
MMB Treasury Non‐OperatingPublic Defender Co‐Pay ............................................... 518 ‐ 518$ $ $504$Re‐Instated Public Defender Co‐Pay ........................... 474 ‐ 474450
992 ‐ 992Total MMB Treasury Non‐Operating $ $ $954$
Natural ResourcesDepartmental Appropriations ..................................... 210 210 ‐$ $ $210$1837 Population Survey‐Fish ....................................... 130 127 31311854 Indian Treaty Payments ..................................... 5,254 5,254 ‐5,254Eco‐Clean Water Act ................................................... 1,033 985 481,268Ecological Services ...................................................... 3,583 3,352 2314,080Eco‐Prairie Seed Harvest ............................................. 45 31 1495Eco‐Project Wild ......................................................... 41 41 ‐42Eco‐St Paul Steam Facility Study ................................. 440 282 158440Emergency Deterrent Assistance ................................ ‐ ‐ ‐33Emergency Fire Fighting Account ................................ 7,488 7,391 977,419Enforce Wetland Conservation‐BWSR ........................ 371 365 6371Enforcement NR Laws & Rules .................................... 3,094 3,068 263,067Fish & Wildlife Management ...................................... 1,892 1,845 471,914Fish & Wildlife‐Let's Go Fishing Grants ....................... 175 175 ‐175Fish & Wildlife‐Prairie Wetlands ................................. 547 524 23695Forest Inventory Format U of M ................................. 197 197 ‐197Forest Management ................................................... 26,807 26,455 35226,807Forestry‐Firewood Information Campaign .................. 55 55 ‐105Forestry‐Forist ............................................................ 350 350 ‐350Forestry‐Land Asset Management .............................. 213 213 ‐343Forestry‐NIPF Landowner Assistance .......................... 1,667 1,667 ‐1,506FRC‐Fragmentation Forest Land .................................. 53 53 ‐53Harmful Invasive Species ............................................ 2,345 2,029 3162,443
18

SCHEDULE OF REVENUES, EXPENDITURESAND CHANGES IN FUND BALANCE ‐ BUDGET AND ACTUAL
Budget Actual Variance
BUDGETARY BASISYEAR ENDED JUNE 30, 2009(IN THOUSANDS)
STATE OF MINNESOTA
Original Budget
GENERAL FUND
Iron Ore Cooperative Agreement ................................ 204 204 ‐226Lake Superior Zoo Grants ............................................ 33 ‐ 3333Land & Minerals Land Asset Management ................. 549 516 33549Land & Minerals Land Record System ......................... 500 500 ‐500Land & Minerals Resource Management .................... 4,959 4,681 2785,590Leech Lake Band Grants .............................................. 5 5 ‐5Leech Lake Reservation Payments .............................. 2,523 2,523 ‐2,446Mineral Coop Environmental Research ....................... 121 107 14135Minnesota Forest Resources Council .......................... 864 857 7857Mississippi Headwaters Grants ................................... 65 65 ‐65MR Flood DR‐1717 Lidar Project ................................. 621 621 ‐621OMB‐Carbon Sequestration MGS ............................... 3 3 ‐3Operations Support .................................................... 2,201 2,169 322,282Parks & Recreation Management ............................... 20,433 20,418 1531,804Parks‐Interpretive Services ......................................... 256 256 ‐257Pine Grove Zoo Grants ................................................ 33 33 ‐33Red River Flood Damage Grants ................................. 280 275 5280Re‐Invest in Minnesota‐Eco Service ............................ 445 355 90557SE Flood Disaster 1717 Match ..................................... 55 55 ‐55Trails & Waterways Management ............................... 1,938 1,938 ‐2,239Trails & Waterways‐Non‐Motorized Trails .................. 319 314 5444Trails & Waterways‐Wild & Scenic Rivers ................... 150 150 ‐150Water Resources Management .................................. 11,610 11,565 4512,312Waters DR‐1717 Flood Buyouts .................................. 5,991 5,991 ‐5,991Waters‐Clean Water Act ............................................. 1,208 1,173 351,356Waters‐Water Supply .................................................. 274 274 ‐342Wl Health ‐ Bovine TB ................................................. 132 125 7132
111,762 109,842 1,920Total Natural Resources $ $ $126,262$
Office of Enterprise TechnologyCCN‐County Grants‐Financial System ENHN ............... 180 180 ‐$ $ $180$Enterprise E‐Licensing System .................................... 4,461 4,450 114,619Enterprise IT Security .................................................. 7,503 7,451 528,109Enterprise Planning & Management ........................... 2,230 2,196 342,240Small Agency Technology Projects .............................. 380 378 2408
14,754 14,655 99Total Office of Enterprise Technology $ $ $15,556$
Office of Higher EducationAchieve Scholarship Program ...................................... 8,643 3,726 4,917$ $ $9,210$Agency Loan Administration ....................................... 2,626 2,594 322,863American Indian School Administration ...................... 85 85 ‐85College in Schools for MnSCU ..................................... 200 200 ‐200Fiscal Policy & Research .............................................. 90 90 ‐90Grants to Increase Service Learning ............................ 301 290 11280
19

SCHEDULE OF REVENUES, EXPENDITURESAND CHANGES IN FUND BALANCE ‐ BUDGET AND ACTUAL
Budget Actual Variance
BUDGETARY BASISYEAR ENDED JUNE 30, 2009(IN THOUSANDS)
STATE OF MINNESOTA
Original Budget
GENERAL FUND
Libraries & Technology ............................................... 10,834 10,834 ‐10,834Minnesota GI Bill Program .......................................... 704 704 ‐4,089Other Small Programs ................................................. 319 319 ‐318Safety Officer Survivors ............................................... 152 57 95152State Grant Re‐Write .................................................. 90 ‐ 9090Student Financial Aid‐Outreach .................................. 2,460 2,398 622,424Student Information & Financial Aid ........................... 166,018 164,318 1,700165,600Teach Program ............................................................ 250 250 ‐250Unclaimed Settlement Escrow .................................... 4 ‐ 44United Family Practice ................................................ 431 431 ‐431
193,207 186,296 6,911Total Office of Higher Education $ $ $196,920$
Ombudsman for MH/MRDepartmental Appropriations ..................................... 1,744 1,635 109$ $ $1,744$
Ombudsperson for FamiliesDepartmental Appropriations ..................................... 265 265 ‐$ $ $265$
Pollution Control AgencyAdministrative Support ............................................... 1,272 1,272 ‐$ $ $1,512$Air Emissions Study ..................................................... 294 226 68294Clean Water Partnership Grants ................................. 2,729 2,688 412,909Community Technical Assistance ................................ 349 349 ‐347County Feedlot Grant Program ................................... 2,199 2,199 ‐2,324CWLA TMDL Development .......................................... 9,373 9,272 1018,972CWLA WQ Assessment ................................................ 7,390 7,378 127,284Endocrine Disruptors Report ....................................... 33 33 ‐34Environmental Assistance Program ............................ 20 20 ‐20Environmental Health & Bio‐Monitoring .................... 176 69 107176Multimedia ................................................................. 1,860 1,860 ‐2,156Subsurface Sewage Treatment Systems Program ....... 420 420 ‐418Water .......................................................................... 1,959 1,959 ‐2,238
28,074 27,745 329Total Pollution Control Agency $ $ $28,684$
Private Detectives BoardDepartmental Appropriations ..................................... 149 126 23$ $ $149$
Public Defense BoardDepartmental Appropriations ..................................... 68,906 68,473 433$ $ $68,820$
Public Safety3304 EM Red River Flood 09 97.036 ........................... 66 66 ‐$ $ $ ‐$Administration & Related Services .............................. 410 400 10410Administration Theft Reimbursement ........................ 792 792 ‐792Auto Theft Emergency Grants ..................................... 75 73 275Body Armor Reimbursement ...................................... 508 508 ‐508Capitol Security Contracts ........................................... 1,416 1,416 ‐1,416
20

SCHEDULE OF REVENUES, EXPENDITURESAND CHANGES IN FUND BALANCE ‐ BUDGET AND ACTUAL
Budget Actual Variance
BUDGETARY BASISYEAR ENDED JUNE 30, 2009(IN THOUSANDS)
STATE OF MINNESOTA
Original Budget
GENERAL FUND
Child Advocacy Center Grants ..................................... 50 50 ‐50Children at Risk Grants ................................................ 251 251 ‐252Cops Grants ................................................................. 1,009 1,001 81,009Crime Victim Reparation Increase ............................... 252 252 ‐252Crime Victim Services Increase ................................... 1,711 1,711 ‐1,711Crime Victim Support Grants ...................................... 100 100 ‐100Criminal Apprehension ............................................... 42,547 42,456 9142,259Criminal Justice Data Network .................................... 1,448 1,448 ‐1,449Crimnet Justice Information ........................................ 3,070 3,062 83,070Defibrillator Grants ..................................................... 50 50 ‐50Defibrillators ‐ Patrol ................................................... 1 ‐ 11DR 1175 ‐ Flooding 1997 ............................................. 239 ‐ 239239DR 1569 Hazard Mitigation Match .............................. 14 5 914DR 1717 Hazard Mitigation State Match ..................... 17 6 11 ‐DR 1717 Individual Assistance .................................... 9 3 69DR 1717 State Match .................................................. 1,821 109 1,7121,815DR 1830 IFG State Match ............................................ 26 ‐ 26 ‐DR 1830 PA State Match ............................................. 5,188 18 5,170 ‐Emergency 3278 I‐35W Bridge Match ......................... 907 8 899907Emergency Assistance Grants ..................................... 99 99 ‐100Emergency Management ............................................ 3,848 3,685 1632,748Equipment Sales ......................................................... 14 14 ‐14Forensic Scientists ....................................................... 1,411 1,411 ‐1,411Gambling Enforcement ............................................... 1,745 1,706 391,734Gambling Enforcement Backgrounds .......................... 14 14 ‐14Gambling‐Sales Proceeds ............................................ 8 8 ‐8Gang & Drug Task Force Grants .................................. 1,900 1,884 161,900Ham Lake Fire 2007 ..................................................... 500 500 ‐500Homeless Outreach Grants ......................................... 154 154 ‐154IT Security & Disaster Recovery .................................. 2,091 2,056 352,091Legal Advocacy for Trafficking ..................................... 151 147 4151Office of Justice Programs ........................................... 34,121 34,116 534,120Pandemic Influenza Preparation ................................. 83 83 ‐83Parenting Time Center Grants ..................................... 200 200 ‐200Peace Officer Benefit Account .................................... 1,985 1,790 1951,985Security Coordinator‐RNC ........................................... 34 ‐ 3434Squad Car Camera Grants ........................................... 449 445 4449State Patrol ................................................................. 3,358 3,358 ‐3,359Victim Notification System .......................................... 503 503 ‐503Youth Intervention Program Grants ............................ 750 747 3750
115,395 106,705 8,690Total Public Safety $ $ $108,696$
21

SCHEDULE OF REVENUES, EXPENDITURESAND CHANGES IN FUND BALANCE ‐ BUDGET AND ACTUAL
Budget Actual Variance
BUDGETARY BASISYEAR ENDED JUNE 30, 2009(IN THOUSANDS)
STATE OF MINNESOTA
Original Budget
GENERAL FUND
Public Utilities CommissionDepartmental Appropriations ..................................... 6,078 5,679 399$ $ $6,078$
Revenue2009 Tax Compliance Initiative ................................... 6,925 6,800 125$ $ $7,000$Accounts Receivable Initiative .................................... 3,111 3,109 23,111Accounts Receivable Management ............................. 19,328 19,282 4619,287Assessment Assistance 976 ......................................... 100 96 4100Bank Match ................................................................. 360 313 47360Integrated Tax System ................................................ 5,729 5,729 ‐2,228Outstate Collection Delinquent Tax ............................ 576 576 ‐900Property Tax Exemption 977 ....................................... 15 15 ‐15Property Tax Refund Assistance 105 ........................... 100 86 14100Revenue Administration ............................................. 88,588 88,227 36190,591Revenue Recording Fee .............................................. 257 257 ‐300Seized Property ........................................................... 2 2 ‐700Taxpayer Assistance Services ...................................... 75 75 ‐75TSM Initiative .............................................................. 8,842 8,751 919,032VOSS Tax Database ..................................................... 199 199 ‐200
134,207 133,517 690Total Revenue $ $ $133,999$
Revenue Intergovernmental PaymentsAdditional Amortization Aid ........................................ 1,600 1,152 448$ $ $1,600$Agricultural Market Value Credits ............................... 19,273 19,273 ‐19,275Amortization State Aid ................................................ 1,890 1,888 21,640Beltrami County Out of Home Aid .............................. 500 500 ‐500Border City Reimbursement ........................................ 13 13 ‐5Browns Valley Flood Aid ............................................. 100 100 ‐100County Program Aid .................................................... 160,970 160,970 ‐204,919Crookston Flood Aid .................................................... 200 200 ‐200Disaster Credit ............................................................ 676 676 ‐566Disparity Reduction Aid ............................................... 10,974 10,116 85810,974Disparity Reduction Credit .......................................... 4,711 4,466 2454,711DNR ‐ PILT Payments ................................................... 21,026 21,017 921,026Fire State Aid ............................................................... 25,555 24,401 1,15425,555Firefighter Relief Association ...................................... 609 609 ‐563Forest Land Tax Credit ................................................ 6,118 6,095 234,850Indian Casino Aid ........................................................ 720 669 51644Insurance Surcharge ................................................... 2,250 2,250 ‐2,100Iron Ore Production Replacement Aid ........................ 2,738 2,689 49 ‐Local Government Aids ............................................... 430,639 430,557 82484,149Local Option Disaster Abatement ............................... 116 116 ‐650Mahnomen Property Tax Reimbursement .................. 600 600 ‐600PERA Rate Increase Aid ............................................... 14,534 14,520 1414,534
22

SCHEDULE OF REVENUES, EXPENDITURESAND CHANGES IN FUND BALANCE ‐ BUDGET AND ACTUAL
Budget Actual Variance
BUDGETARY BASISYEAR ENDED JUNE 30, 2009(IN THOUSANDS)
STATE OF MINNESOTA
Original Budget
GENERAL FUND
Police State Aid ........................................................... 58,309 55,380 2,92963,755Political Contribution Refund ...................................... 6,500 5,715 7856,500Prior Year Credit (Real & Mfg) ..................................... 422 36 386422Prior Year Market Value Credits .................................. 929 862 67893Property Tax Refunds .................................................. 252,250 252,191 59238,900Property Tax Targeting Refund ................................... 8,789 7,581 1,2087,600Renters Property Tax Refund ...................................... 171,860 171,799 61158,400Residential Market Value Credits (MH) ....................... 1,900 1,847 531,900Residential Market Value Credits (Real) ...................... 196,496 196,496 ‐208,000Senior Citizen Deferral ................................................ 504 504 ‐471Supplemental Amortization State Aid ......................... 572 572 ‐573Supplemental TAC Homestead Credit ......................... 5,795 5,772 235,795Tax Refund Interest ..................................................... 17,000 8,026 8,97417,000TIF Market Value Credit .............................................. 3,900 3,585 3153,900Wetland Credits .......................................................... 10 8 210
1,431,048 1,413,251 17,797Total Revenue Intergovernmental Payments $ $ $1,513,280$
Science MuseumDepartmental Appropriations ..................................... 1,250 1,250 ‐$ $ $1,250$
Secretary of StateDepartmental Appropriations ..................................... 6,506 6,506 ‐$ $ $6,717$
Sentencing Guidelines CommissionDepartmental Appropriations ..................................... 672 596 76$ $ $672$
State AuditorDepartmental Appropriations ..................................... 10,015 8,623 1,392$ $ $10,216$Special Investigation Stimulus ..................................... 384 ‐ 384 ‐Tax Increment Financing ............................................. 3,263 648 2,6153,161
13,662 9,271 4,391Total State Auditor $ $ $13,377$
Supreme CourtCivil Legal Services ...................................................... 12,346 12,346 ‐$ $ $12,467$Family Law Legal Services ........................................... 877 877 ‐877Supreme Court Contingency ....................................... 8 3 58Supreme Court Operations ......................................... 33,305 32,786 51934,109
46,536 46,012 524Total Supreme Court $ $ $47,461$
Tax CourtDepartmental Appropriations ..................................... 849 805 44$ $ $849$
TransportationDepartmental Appropriations ..................................... 23,150 23,139 11$ $ $20,927$Northstar Rail Extension Planning ............................... 250 250 ‐250Port Development Assistance ..................................... 500 500 ‐500Town Road Sign Replacement ..................................... 2,289 2,289 ‐2,289
23

SCHEDULE OF REVENUES, EXPENDITURESAND CHANGES IN FUND BALANCE ‐ BUDGET AND ACTUAL
Budget Actual Variance
BUDGETARY BASISYEAR ENDED JUNE 30, 2009(IN THOUSANDS)
STATE OF MINNESOTA
Original Budget
GENERAL FUND
UPA Technology, Telecommunications, Outreach ...... 3,200 1,626 1,5743,500
29,389 27,804 1,585Total Transportation $ $ $27,466$
Trial CourtsDepartmental Appropriations ..................................... 228,477 226,748 1,729$ $ $227,127$Mandated Costs .......................................................... 23,926 22,761 1,16525,161New Judge Units ......................................................... 3,477 3,140 3373,475Specialty Courts .......................................................... 2,413 1,980 4332,413Trial Courts .................................................................. 8 8 ‐9
258,301 254,637 3,664Total Trial Courts $ $ $258,185$
Uniform Laws CommissionDepartmental Appropriations ..................................... 55 55 ‐$ $ $55$
University of MinnesotaBovine TB Research ..................................................... 80 80 ‐$ $ $80$College in the Schools ................................................. 200 200 ‐200Maintenance & Operations ......................................... 674,716 674,716 ‐694,716Mesothelioma Study ................................................... 4,900 2,500 2,4004,900Scholarship Matching .................................................. 2,000 2,000 ‐2,000St Cloud Hospital Residency ........................................ 346 346 ‐346
682,242 679,842 2,400Total University of Minnesota $ $ $702,242$
Veterans AffairsDepartmental Appropriations ..................................... 44,906 44,906 ‐$ $ $44,906$Administration Services .............................................. 1,860 1,838 221,859Case Workers‐Statewide ............................................. 500 461 39500Claims & Outreach ...................................................... 1,332 1,300 321,331CVSO Grants ................................................................ 1,613 1,493 1201,606Depleted Uranium Testing .......................................... 199 199 ‐200Higher Education Assistance ....................................... 1,179 1,177 21,176Honor Guard Reimbursement ..................................... 127 117 10127Information Technology Services ................................ 100 100 ‐100Marketing Outreach .................................................... 204 194 10200Minnesota Assistance Council for Veterans ................ 1,000 1,000 ‐1,000Minnesota State Veterans Cemetery .......................... 318 318 ‐316Outreach Program ...................................................... 299 283 16302Peer to Peer Counseling .............................................. 25 25 ‐25Spousal Education Benefits ......................................... 52 ‐ 5252State Soldiers Assistance Program .............................. 6,092 6,079 136,083Strategic Planning ....................................................... 200 190 10200Tribal Service Office .................................................... 1,152 1,051 1011,150Veteran Counseling Hotline ........................................ 243 216 27233Veteran Counseling Study ........................................... 16 ‐ 1616Veterans Service Organizations .................................. 353 353 ‐353
61,770 61,300 470Total Veterans Affairs $ $ $61,735$
24
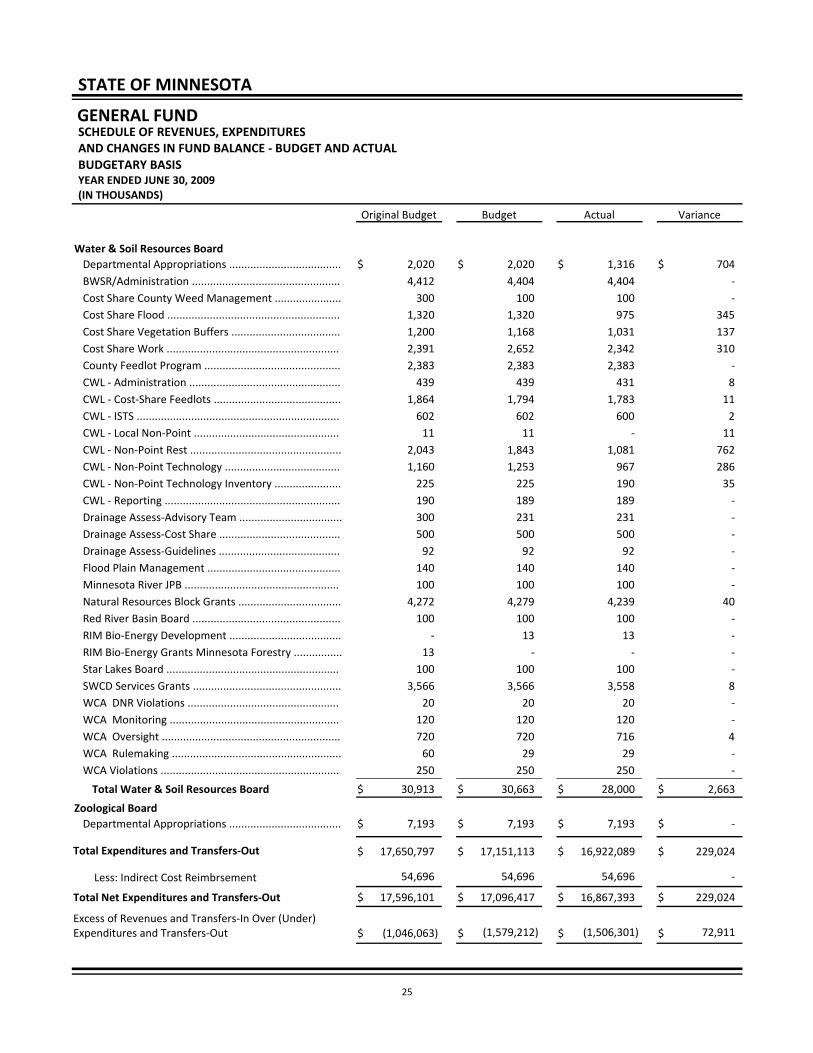
SCHEDULE OF REVENUES, EXPENDITURESAND CHANGES IN FUND BALANCE ‐ BUDGET AND ACTUAL
Budget Actual Variance
BUDGETARY BASISYEAR ENDED JUNE 30, 2009(IN THOUSANDS)
STATE OF MINNESOTA
Original Budget
GENERAL FUND
Water & Soil Resources BoardDepartmental Appropriations ..................................... 2,020 1,316 704$ $ $2,020$BWSR/Administration ................................................. 4,404 4,404 ‐4,412Cost Share County Weed Management ...................... 100 100 ‐300Cost Share Flood ......................................................... 1,320 975 3451,320Cost Share Vegetation Buffers .................................... 1,168 1,031 1371,200Cost Share Work ......................................................... 2,652 2,342 3102,391County Feedlot Program ............................................. 2,383 2,383 ‐2,383CWL ‐ Administration .................................................. 439 431 8439CWL ‐ Cost‐Share Feedlots .......................................... 1,794 1,783 111,864CWL ‐ ISTS ................................................................... 602 600 2602CWL ‐ Local Non‐Point ................................................ 11 ‐ 1111CWL ‐ Non‐Point Rest .................................................. 1,843 1,081 7622,043CWL ‐ Non‐Point Technology ...................................... 1,253 967 2861,160CWL ‐ Non‐Point Technology Inventory ...................... 225 190 35225CWL ‐ Reporting .......................................................... 189 189 ‐190Drainage Assess‐Advisory Team .................................. 231 231 ‐300Drainage Assess‐Cost Share ........................................ 500 500 ‐500Drainage Assess‐Guidelines ........................................ 92 92 ‐92Flood Plain Management ............................................ 140 140 ‐140Minnesota River JPB ................................................... 100 100 ‐100Natural Resources Block Grants .................................. 4,279 4,239 404,272Red River Basin Board ................................................. 100 100 ‐100RIM Bio‐Energy Development ..................................... 13 13 ‐ ‐RIM Bio‐Energy Grants Minnesota Forestry ................ ‐ ‐ ‐13Star Lakes Board ......................................................... 100 100 ‐100SWCD Services Grants ................................................. 3,566 3,558 83,566WCA DNR Violations .................................................. 20 20 ‐20WCA Monitoring ........................................................ 120 120 ‐120WCA Oversight ........................................................... 720 716 4720WCA Rulemaking ........................................................ 29 29 ‐60WCA Violations ........................................................... 250 250 ‐250
30,663 28,000 2,663Total Water & Soil Resources Board $ $ $30,913$
Zoological BoardDepartmental Appropriations ..................................... 7,193 7,193 ‐$ $ $7,193$
17,650,797 17,151,113 16,922,089 229,024Total Expenditures and Transfers‐Out $ $ $$
16,867,393
Excess of Revenues and Transfers‐In Over (Under) Expenditures and Transfers‐Out (1,579,212) (1,506,301) 72,911$ $(1,046,063)$
54,696 54,696 ‐54,696Less: Indirect Cost Reimbrsement
Total Net Expenditures and Transfers‐Out 17,096,417 229,024$ $17,596,101$
$
$
25
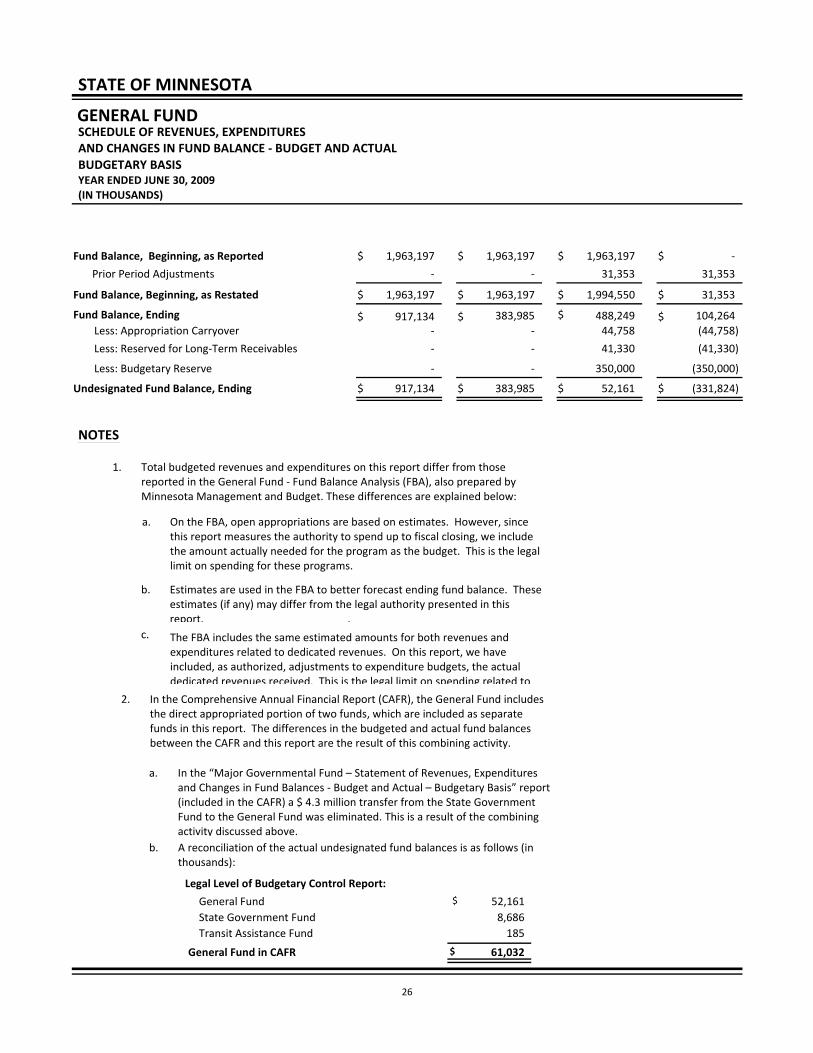
SCHEDULE OF REVENUES, EXPENDITURESAND CHANGES IN FUND BALANCE ‐ BUDGET AND ACTUALBUDGETARY BASISYEAR ENDED JUNE 30, 2009(IN THOUSANDS)
STATE OF MINNESOTA
GENERAL FUND
Fund Balance, Beginning, as Reported 1,963,197 1,963,197
Prior Period Adjustments
‐ 41,330
Fund Balance, Beginning, as Restated
Less: Reserved for Long‐Term Receivables
Less: Budgetary Reserve
Undesignated Fund Balance, Ending
‐
‐ 350,000
1,963,197 1,994,550
‐
‐31,353
31,353
(41,330)
(350,000)
383,985 52,161 (331,824)
$ $ $
$ $ $
31,353
1,963,197
‐‐
1,963,197$
‐
‐
917,134$
NOTES
1. Total budgeted revenues and expenditures on this report differ from those reported in the General Fund ‐ Fund Balance Analysis (FBA), also prepared by Minnesota Management and Budget. These differences are explained below:
a. On the FBA, open appropriations are based on estimates. However, since this report measures the authority to spend up to fiscal closing, we include the amount actually needed for the program as the budget. This is the legal limit on spending for these programs.
b. Estimates are used in the FBA to better forecast ending fund balance. These estimates (if any) may differ from the legal authority presented in this report. .
c. The FBA includes the same estimated amounts for both revenues and expenditures related to dedicated revenues. On this report, we have included, as authorized, adjustments to expenditure budgets, the actual dedicated revenues received. This is the legal limit on spending related to
2. In the Comprehensive Annual Financial Report (CAFR), the General Fund includes the direct appropriated portion of two funds, which are included as separate funds in this report. The differences in the budgeted and actual fund balances between the CAFR and this report are the result of this combining activity.
Legal Level of Budgetary Control Report:
General Fund 52,161$
General Fund in CAFR 61,032$
Fund Balance, Ending 917,134 383,985 488,249 104,264$ $ $
a. In the “Major Governmental Fund – Statement of Revenues, Expenditures and Changes in Fund Balances ‐ Budget and Actual – Budgetary Basis” report (included in the CAFR) a $ 4.3 million transfer from the State Government Fund to the General Fund was eliminated. This is a result of the combining activity discussed above.
b. A reconciliation of the actual undesignated fund balances is as follows (in thousands):
$ $ $$
$‐ 44,758Less: Appropriation Carryover (44,758)‐
Transit Assistance Fund 185State Government Fund 8,686
26

SCHEDULE OF REVENUES, EXPENDITURESAND CHANGES IN FUND BALANCE ‐ BUDGET AND ACTUALBUDGETARY BASISYEAR ENDED JUNE 30, 2009(IN THOUSANDS)
STATE OF MINNESOTA
GENERAL FUND
3. Under the provisions of Minnesota Statutes, Section 16A.152, in December 2008, the Commissioner of Minnesota Management and Budget acted to balance the budget by reducing fiscal year 2009 state spending through unallotments. Fiscal Year 2009 unallotments are as follows (in thousands):
Fiscal Year 2009 Unallotments
General Fund 248,932$
* Unallotments from other funds were transferred to the General Fund.
271,055$Total Unalotments
Other Funds * 22,123
27

SCHEDULE OF REVENUES, EXPENDITURESAND CHANGES IN FUND BALANCE ‐ BUDGET AND ACTUAL
Budget Actual Variance
BUDGETARY BASISYEAR ENDED JUNE 30, 2009(IN THOUSANDS)
STATE OF MINNESOTA
Original Budget
STATE GOVERNMENT FUND
Net Revenues and Transfers‐In
Net RevenuesDepartmental Services/Licenses & Fees ...................... 56,471 56,471 ‐$ $ $56,471$Other Revenues .......................................................... 5,391 2,544 (2,847)4,649
61,862 59,015 (2,847)Total Net Revenues $ $ $61,120$
Transfers from Other FundsMiscellaneous Special Revenue Fund .......................... 44 28 (16)$ $ $ ‐$
61,120 61,906 59,043 (2,863)Total Net Revenues and Transfers‐In $ $ $$
Expenditures and Transfers‐Out
Attorney GeneralDepartmental Appropriations ..................................... 2,648 1,829 819$ $ $2,042$
Behavioral Health & Therapy BoardDepartmental Appropriations ..................................... 618 473 145$ $ $640$
Chiropractic Examiners BoardDepartmental Appropriations ..................................... 654 459 195$ $ $653$
Dentistry BoardDepartmental Appropriations ..................................... 1,135 1,122 13$ $ $1,135$
Dietetics & Nutrition PracticeDepartmental Appropriations ..................................... 196 92 104$ $ $196$
Emergency Medical Services BoardDepartmental Appropriations ..................................... 790 790 ‐$ $ $790$
HealthDepartmental Appropriations ..................................... 3,371 3,364 7$ $ $3,625$Community & Family Health Promotion ..................... 1,466 1,306 1601,466County‐Based Purchasing Plans .................................. 261 241 20261Disease Surveillance Modernization ........................... 1,889 1,780 1091,889Health Protection ........................................................ 29,502 27,124 2,37829,407Interpreter Services .................................................... 32 15 1732Naturopathy Work Group ........................................... 25 4 2125Oral Practitioner Work Group ..................................... 82 82 ‐82Policy Quality & Compliance ....................................... 16,807 13,708 3,09915,966Pool Safety .................................................................. 210 168 42210
53,645 47,792 5,853Total Health $ $ $52,963$
Human ServicesDepartmental Appropriations ..................................... 728 378 350$ $ $617$
Marriage and Family Therapy BoardDepartmental Appropriations ..................................... 182 164 18$ $ $182$
28

SCHEDULE OF REVENUES, EXPENDITURESAND CHANGES IN FUND BALANCE ‐ BUDGET AND ACTUAL
Budget Actual Variance
BUDGETARY BASISYEAR ENDED JUNE 30, 2009(IN THOUSANDS)
STATE OF MINNESOTA
Original Budget
STATE GOVERNMENT FUND
Medical Practice BoardDepartmental Appropriations ..................................... 4,877 3,536 1,341$ $ $5,484$Naturopathic Operations ............................................ 8 ‐ 88
4,885 3,536 1,349Total Medical Practice Board $ $ $5,492$
MMB Non‐OperatingDepartmental Appropriations ..................................... 3,219 3,219 ‐$ $ $3,219$State Gov't Special Revenue Contingent ..................... 750 ‐ 750750
3,969 3,219 750Total MMB Non‐Operating $ $ $3,969$
Nursing BoardDepartmental Appropriations ..................................... 4,767 4,486 281$ $ $4,767$
Nursing Home Administrative BoardDepartmental Appropriations ..................................... 647 292 355$ $ $647$Administrative Services Unit ....................................... 452 440 12452
1,099 732 367Total Nursing Home Administrative Board $ $ $1,099$
Optometry BoardDepartmental Appropriations ..................................... 126 111 15$ $ $126$
Pharmacy BoardDepartmental Appropriations ..................................... 1,536 1,467 69$ $ $1,528$
Physical Therapy BoardDepartmental Appropriations ..................................... 355 350 5$ $ $355$
Podiatric Medicine BoardDepartmental Appropriations ..................................... 74 69 5$ $ $74$
Pollution Control AgencyAdministrative Support ............................................... 2 2 ‐$ $ $2$Water .......................................................................... 47 47 ‐48
49 49 ‐Total Pollution Control Agency $ $ $50$
Psychology BoardDepartmental Appropriations ..................................... 1,030 823 207$ $ $1,023$
Public SafetyFamily Visitation Centers ............................................ 96 96 ‐$ $ $96$Vulnerable Adults Report ............................................ 14 ‐ 1414
110 96 14Total Public Safety $ $ $110$
Social Work BoardDepartmental Appropriations ..................................... 1,464 992 472$ $ $1,463$
Veterinary Medicine BoardDepartmental Appropriations ..................................... 310 191 119$ $ $310$
79,584 80,370 69,220 11,150Total Expenditures and Transfers‐Out $ $ $$
Excess of Revenues and Transfers‐In Over (Under) Expenditures and Transfers‐Out (18,464) (10,177) 8,287$ $(18,464)$ $
29

SCHEDULE OF REVENUES, EXPENDITURESAND CHANGES IN FUND BALANCE ‐ BUDGET AND ACTUAL
Budget Actual Variance
BUDGETARY BASISYEAR ENDED JUNE 30, 2009(IN THOUSANDS)
STATE OF MINNESOTA
Original Budget
STATE GOVERNMENT FUND
Fund Balance, Beginning, as Reported 18,464 18,464
Prior Period Adjustments
Fund Balance, Beginning, as Restated
Undesignated Fund Balance, Ending
‐
18,464 19,286
‐
‐822
822
‐ 8,686 8,686
$ $ $
$ $ $
822
18,464
‐‐
18,464$
‐$
Fund Balance, Ending ‐ ‐ 9,109 9,109$ $ $
$ $ $$
$
‐ 423Less: Appropriation Carryover (423)‐
30

SCHEDULE OF REVENUES, EXPENDITURESAND CHANGES IN FUND BALANCE ‐ BUDGET AND ACTUAL
Budget Actual Variance
BUDGETARY BASISYEAR ENDED JUNE 30, 2009(IN THOUSANDS)
STATE OF MINNESOTA
Original Budget
TRANSIT ASSISTANCE FUND
Net Revenues and Transfers‐In
Net RevenuesMotor Vehicle Taxes ................................................... 130,333 130,333 ‐$ $ $131,364$
131,364 130,333 130,333 ‐Total Net Revenues and Transfers‐In $ $ $$
Expenditures and Transfers‐Out
Metropolitan Council TransportMetro Area Transit Account ........................................ 122,602 122,602 ‐$ $ $124,000$
TransportationGreater Minnesota Transit Administration ................. 415 415 ‐$ $ $416$Greater Minnesota Transit Grants .............................. 6,918 6,918 ‐6,922
7,333 7,333 ‐Total Transportation $ $ $7,338$
131,338 129,935 129,935 ‐Total Expenditures and Transfers‐Out $ $ $$
Excess of Revenues and Transfers‐In Over (Under) Expenditures and Transfers‐Out 398 398 ‐
Fund Balance, Beginning, as Reported 250 250
Undesignated Fund Balance, Ending
‐
648 185 (463)
$ $
$ $ $
26$
250
276$
Fund Balance, Ending 276 648 648 ‐$ $ $
$ $ $$
$
‐ 463Less: Appropriation Carryover (463)‐
$
31

SCHEDULE OF REVENUES, EXPENDITURESAND CHANGES IN FUND BALANCE ‐ BUDGET AND ACTUAL
Budget Actual Variance
BUDGETARY BASISYEAR ENDED JUNE 30, 2009(IN THOUSANDS)
STATE OF MINNESOTA
TRUNK HIGHWAY FUND
UNAUDITED
Net Revenues and Transfers‐In
Net Revenues
813,186 583,370 (229,816)Federal Revenue ....................................................................... $ $ $10,252 17,176 6,924Departmental Services/Licenses & Fees ...................................9,250 8,066 (1,184)Investment Income ...................................................................80,758 53,256 (27,502)Other Revenues ........................................................................
913,446 661,868 (251,578)Total Net Revenues $ $ $
Transfers from Other Funds
15,330 15,330 ‐County State Aid Highway Fund ................................................ $ $ $3,924 792 (3,132)General Fund ............................................................................
830,666 835,400 4,734Highway User Tax Distribution Fund .........................................2,175 660 (1,515)Miscellaneous Special Revenue Fund .......................................1,307 1,307 ‐Plant Management Fund ..........................................................
853,402 853,489 87Total Transfers from Other Funds $ $ $
1,766,848 1,515,357 (251,491)Total Net Revenues and Transfers‐In $ $ $
Expenditures and Transfers‐Out
MMB Non‐Operating400 ‐ 400General Purposes Contingent ................................................... $ $ $600 154 446Tort Claims ................................................................................
1,000 154 846Total MMB Non‐Operating $ $ $
Public Safety6,628 6,518 110Administration & Related Services ............................................ $ $ $399 399 ‐Criminal Apprehension .............................................................
2 ‐ 2Driver & Vehicle Services ..........................................................1,137 1,137 ‐Fuel Costs‐Patrolling Highways .................................................198 198 ‐Fuel Costs‐Vehicle Enforcement ...............................................575 547 28Office Pupil Transportation Safety ............................................
2 2 ‐Patrol Photo Processing ............................................................215 102 113Planning & Administration Matching Funds ..............................
2 2 ‐Sale of Used Equipment ............................................................75,731 75,503 228State Patrol ...............................................................................3,653 3,653 ‐State Patrol New Troopers ........................................................382 252 130Traffic Safety .............................................................................
88,924 88,313 611Total Public Safety $ $ $
Transportation721,853 679,889 41,964Departmental Appropriations ................................................... $ $ $52,829 52,782 47Certified Req Highway IWP .......................................................71,007 63,732 7,275Debt Service ‐ Trunk Highway ...................................................
132 132 ‐Excess R/W Rent .......................................................................525 525 ‐Federal Aid ‐ I‐35W Bridge Local ...............................................
623,947 623,602 345Highway Improvement .............................................................
32

SCHEDULE OF REVENUES, EXPENDITURESAND CHANGES IN FUND BALANCE ‐ BUDGET AND ACTUAL
Budget Actual Variance
BUDGETARY BASISYEAR ENDED JUNE 30, 2009(IN THOUSANDS)
STATE OF MINNESOTA
TRUNK HIGHWAY FUND
UNAUDITED
1,807 1,807 ‐Highway Sign Revolving Account ..............................................200 200 ‐Hubert H Humphrey Institute ...................................................25 ‐ 25Inspection Access Equipment ...................................................
266 266 ‐MPO Grants ..............................................................................3,794 3,794 ‐Pavement Stripe Revenue Account ...........................................1,931 1,902 29Rail Service Plan & Program ......................................................600 600 ‐RDCS Grants ..............................................................................249 248 1Sale of Surplus Material ............................................................
5,126 5,126 ‐Statewide Indirect Costs ...........................................................2,332 2,332 ‐Tower Leases ............................................................................43,541 43,541 ‐UPA Federal Grant Appropriation .............................................
864 864 ‐UPA Federal Grant Program Delivery ........................................
1,531,028 1,481,342 49,686Total Transportation $ $ $
1,620,952 1,569,809 51,143Total Expenditures and Transfers‐Out $ $ $
‐ 1,289 ‐
143,518 143,518 ‐Fund Balance, Beginning, as Reported
Excess of Revenues and Transfers‐In Over (Under) Expenditures and Transfers‐Out 145,896 (54,452) (200,348)
Prior Period Adjustments
Fund Balance, Beginning, as Restated
Undesignated Fund Balance, Ending
143,518 144,807 1,289
289,414 40,065 (249,349)
$ $
$ $ $
$ $ $
Fund Balance, Ending 289,414 90,355 (199,059)$ $ $
‐ 50,290Less: Appropriation Carryover (50,290)
$
NOTES
1. Federal Revenues include Federal Aid Agreement amounts that will be collected in the future upon completion of the agreement terms. The revenue is included to match encumbrance reserves established in accordance with the agreements.
$ $ $
1,289
33
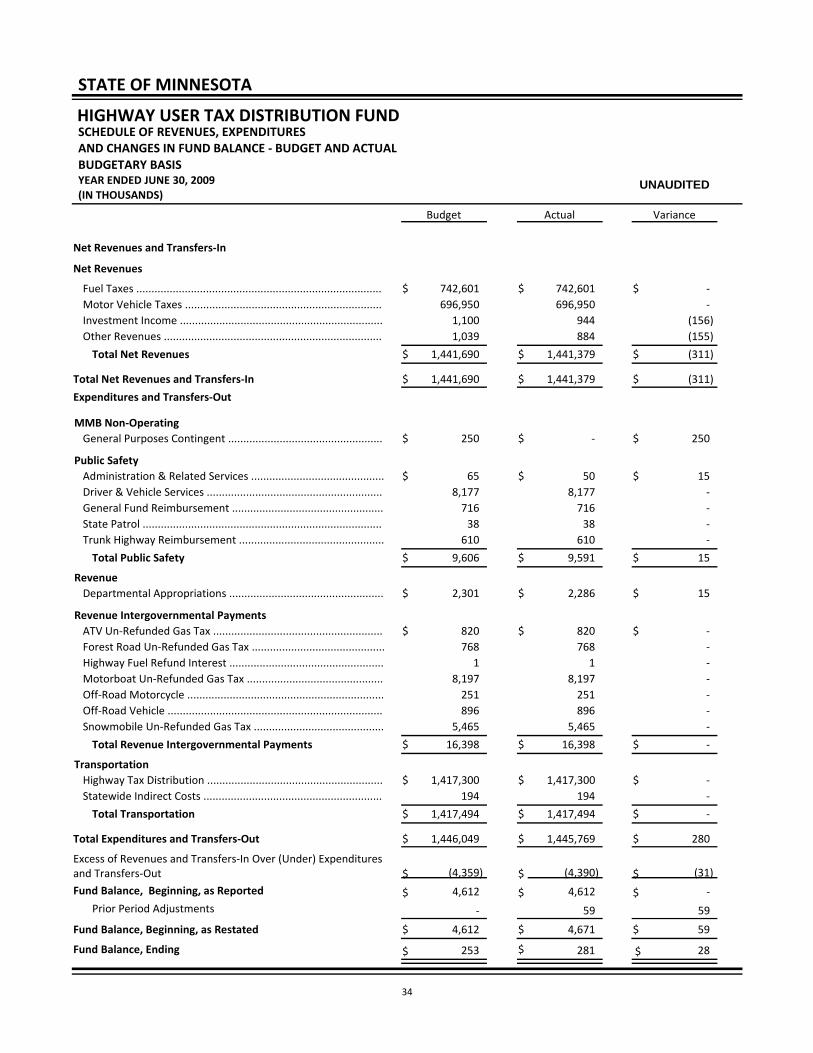
SCHEDULE OF REVENUES, EXPENDITURESAND CHANGES IN FUND BALANCE ‐ BUDGET AND ACTUAL
Budget Actual Variance
BUDGETARY BASISYEAR ENDED JUNE 30, 2009(IN THOUSANDS)
STATE OF MINNESOTA
HIGHWAY USER TAX DISTRIBUTION FUND
UNAUDITED
Net Revenues and Transfers‐In
Net Revenues
742,601 742,601 ‐Fuel Taxes ................................................................................. $ $ $696,950 696,950 ‐Motor Vehicle Taxes .................................................................1,100 944 (156)Investment Income ...................................................................1,039 884 (155)Other Revenues ........................................................................
1,441,690 1,441,379 (311)Total Net Revenues $ $ $
1,441,690 1,441,379 (311)Total Net Revenues and Transfers‐In $ $ $
Expenditures and Transfers‐Out
MMB Non‐Operating250 ‐ 250General Purposes Contingent ................................................... $ $ $
Public Safety65 50 15Administration & Related Services ............................................ $ $ $
8,177 8,177 ‐Driver & Vehicle Services ..........................................................716 716 ‐General Fund Reimbursement ..................................................38 38 ‐State Patrol ...............................................................................
610 610 ‐Trunk Highway Reimbursement ................................................
9,606 9,591 15Total Public Safety $ $ $
Revenue2,301 2,286 15Departmental Appropriations ................................................... $ $ $
Revenue Intergovernmental Payments820 820 ‐ATV Un‐Refunded Gas Tax ........................................................ $ $ $768 768 ‐Forest Road Un‐Refunded Gas Tax ............................................
1 1 ‐Highway Fuel Refund Interest ...................................................8,197 8,197 ‐Motorboat Un‐Refunded Gas Tax .............................................251 251 ‐Off‐Road Motorcycle .................................................................896 896 ‐Off‐Road Vehicle .......................................................................
5,465 5,465 ‐Snowmobile Un‐Refunded Gas Tax ...........................................
16,398 16,398 ‐Total Revenue Intergovernmental Payments $ $ $
Transportation1,417,300 1,417,300 ‐Highway Tax Distribution .......................................................... $ $ $
194 194 ‐Statewide Indirect Costs ...........................................................
1,417,494 1,417,494 ‐Total Transportation $ $ $
1,446,049 1,445,769 280Total Expenditures and Transfers‐Out $ $ $
‐ 59 ‐
4,612 4,612 ‐Fund Balance, Beginning, as Reported
Excess of Revenues and Transfers‐In Over (Under) Expenditures and Transfers‐Out (4,359) (4,390) (31)
Prior Period Adjustments
Fund Balance, Beginning, as Restated 4,612 4,671 59
$ $
$ $ $
Fund Balance, Ending 253 281 28$ $ $
$
$ $ $
59
34
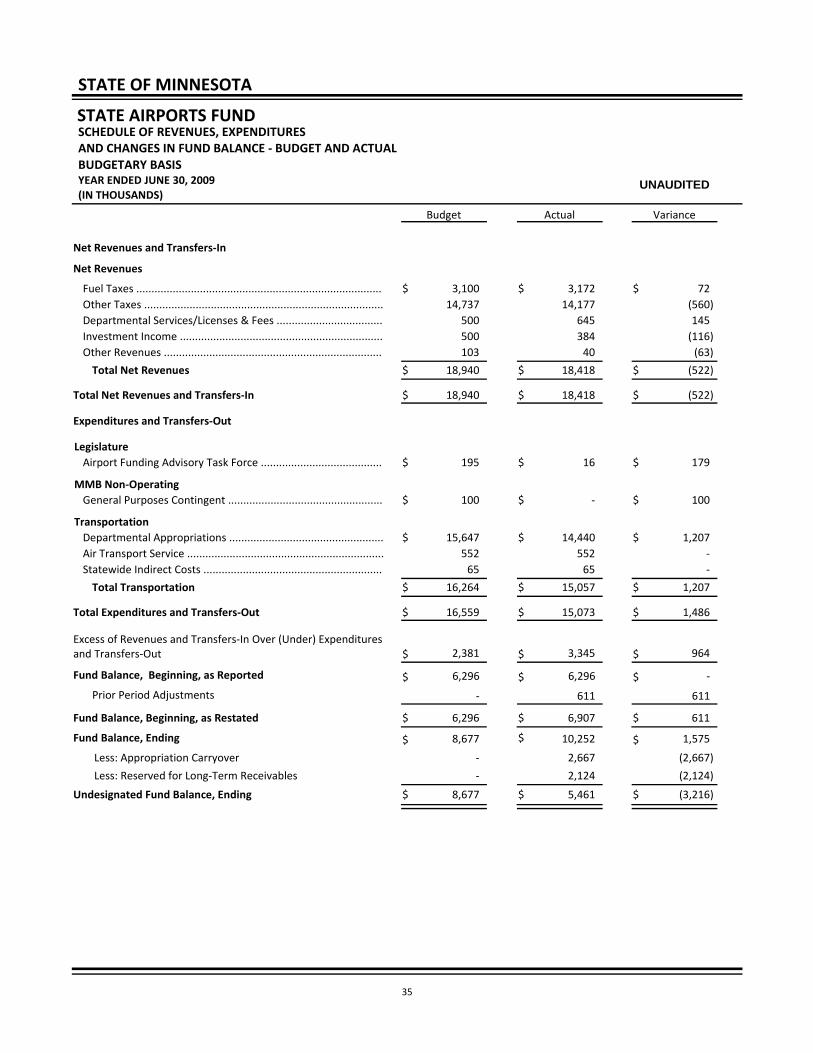
SCHEDULE OF REVENUES, EXPENDITURESAND CHANGES IN FUND BALANCE ‐ BUDGET AND ACTUAL
Budget Actual Variance
BUDGETARY BASISYEAR ENDED JUNE 30, 2009(IN THOUSANDS)
STATE OF MINNESOTA
STATE AIRPORTS FUND
UNAUDITED
Net Revenues and Transfers‐In
Net Revenues
3,100 3,172 72Fuel Taxes ................................................................................. $ $ $14,737 14,177 (560)Other Taxes ...............................................................................
500 645 145Departmental Services/Licenses & Fees ...................................500 384 (116)Investment Income ...................................................................103 40 (63)Other Revenues ........................................................................
18,940 18,418 (522)Total Net Revenues $ $ $
18,940 18,418 (522)Total Net Revenues and Transfers‐In $ $ $
Expenditures and Transfers‐Out
Legislature195 16 179Airport Funding Advisory Task Force ........................................ $ $ $
MMB Non‐Operating100 ‐ 100General Purposes Contingent ................................................... $ $ $
Transportation15,647 14,440 1,207Departmental Appropriations ................................................... $ $ $
552 552 ‐Air Transport Service .................................................................65 65 ‐Statewide Indirect Costs ...........................................................
16,264 15,057 1,207Total Transportation $ $ $
16,559 15,073 1,486Total Expenditures and Transfers‐Out $ $ $
‐ 611 ‐
6,296 6,296 ‐Fund Balance, Beginning, as Reported
‐ 2,124Less: Reserved for Long‐Term Receivables (2,124)
Excess of Revenues and Transfers‐In Over (Under) Expenditures and Transfers‐Out 2,381 3,345 964
Prior Period Adjustments
Fund Balance, Beginning, as Restated
Undesignated Fund Balance, Ending
6,296 6,907 611
8,677 5,461 (3,216)
$ $
$ $ $
$ $ $
Fund Balance, Ending 8,677 10,252 1,575$ $ $
‐ 2,667Less: Appropriation Carryover (2,667)
$
$ $ $
611
35

SCHEDULE OF REVENUES, EXPENDITURESAND CHANGES IN FUND BALANCE ‐ BUDGET AND ACTUAL
Budget Actual Variance
BUDGETARY BASISYEAR ENDED JUNE 30, 2009(IN THOUSANDS)
STATE OF MINNESOTA
PETROLEUM TANK CLEANUP FUND
UNAUDITED
Net Revenues and Transfers‐In
Net Revenues
26,756 22,890 (3,866)Departmental Services/Licenses & Fees .................................... $ $ $900 697 (203)Investment Income ...................................................................73 52 (21)Other Revenues ........................................................................
27,729 23,639 (4,090)Total Net Revenues $ $ $
Transfers from Other Funds
1,511 1,511 ‐Remediation Fund ..................................................................... $ $ $
29,240 25,150 (4,090)Total Net Revenues and Transfers‐In $ $ $
Expenditures and Transfers‐Out
Commerce3,616 3,616 ‐Departmental Appropriations ................................................... $ $ $15,463 14,812 651Petroleum Tank Cleanup ...........................................................
19,079 18,428 651Total Commerce $ $ $
Employment & Economic Development158 158 ‐Business & Community Development ....................................... $ $ $
4,557 4,557 ‐Contaminated Grants ................................................................
4,715 4,715 ‐Total Employment & Economic Development $ $ $
Pollution Control Agency1,000 ‐ 1,000Petroleum Flood 2007 ............................................................... $ $ $
24,794 23,143 1,651Total Expenditures and Transfers‐Out $ $ $
‐ 170 ‐
20,221 20,221 ‐Fund Balance, Beginning, as Reported
‐ 6Less: Reserved for Long‐Term Receivables (6)
Excess of Revenues and Transfers‐In Over (Under) Expenditures and Transfers‐Out 4,446 2,007 (2,439)
Prior Period Adjustments
Fund Balance, Beginning, as Restated
Undesignated Fund Balance, Ending
20,221 20,391 170
24,667 20,079 (4,588)
$ $
$ $ $
$ $ $
Fund Balance, Ending 24,667 22,398 (2,269)$ $ $
‐ 2,313Less: Appropriation Carryover (2,313)
$
$ $ $
170
36

SCHEDULE OF REVENUES, EXPENDITURESAND CHANGES IN FUND BALANCE ‐ BUDGET AND ACTUAL
Budget Actual Variance
BUDGETARY BASISYEAR ENDED JUNE 30, 2009(IN THOUSANDS)
STATE OF MINNESOTA
NATURAL RESOURCES FUND
UNAUDITED
Net Revenues and Transfers‐In
Net Revenues
11,369 11,400 31Sales Taxes ................................................................................ $ $ $416 401 (15)Federal Revenue .......................................................................
42,511 42,189 (322)Departmental Services/Licenses & Fees ...................................586 519 (67)Investment Income ...................................................................
1,719 1,705 (14)Other Revenues ........................................................................
56,601 56,214 (387)Total Net Revenues $ $ $
Transfers from Other Funds
40 40 ‐Agency Fund ............................................................................. $ $ $585 620 35Game & Fish Fund .....................................................................309 309 ‐General Fund ............................................................................
16,043 15,629 (414)Highway User Tax Distribution Fund .........................................2,743 1,875 (868)Miscellaneous Special Revenue Fund .......................................5,181 5,181 ‐Permanent School Fund ............................................................
24,901 23,654 (1,247)Total Transfers from Other Funds $ $ $
81,502 79,868 (1,634)Total Net Revenues and Transfers‐In $ $ $
Expenditures and Transfers‐Out
Metropolitan Council Transport5,550 4,870 680Departmental Appropriations ................................................... $ $ $
Minnesota Conservation Corps490 490 ‐Departmental Appropriations ................................................... $ $ $
Natural Resources3,331 3,037 294Departmental Appropriations ................................................... $ $ $
99 39 60Canoe Routes Marking‐WRA .....................................................2,712 1,961 751Eco‐Invasive Species .................................................................2,547 2,347 200Ecological Services ....................................................................226 135 91Ecological Services‐ATV .............................................................38 34 4Eco‐Project Wild‐NGWL ............................................................
498 498 ‐Enforce CHV Grants‐ATV ...........................................................10 10 ‐Enforce OHV Grants‐OHM ........................................................1 1 ‐Enforce OHV Grants‐ORV ..........................................................
250 118 132Enforce‐ATV Safety Grants ........................................................4,352 4,156 196Enforcement NR Laws & Rules ..................................................1,082 1,079 3Enforcement WRA Grants .........................................................
3 3 ‐Expand OHV Recreation Facility‐ATV ........................................4 ‐ 4Expand OHV Recreation Facility‐OHM ......................................2 ‐ 2Expand OHV Recreation Facility‐ORV ........................................
1,928 1,029 899Fish & Wildlife Management .....................................................692 527 165Forest Management .................................................................
15,010 14,328 682Forest Management Invest‐Timber Sale ...................................
37

SCHEDULE OF REVENUES, EXPENDITURESAND CHANGES IN FUND BALANCE ‐ BUDGET AND ACTUAL
Budget Actual Variance
BUDGETARY BASISYEAR ENDED JUNE 30, 2009(IN THOUSANDS)
STATE OF MINNESOTA
NATURAL RESOURCES FUND
UNAUDITED
1,444 1,444 ‐Forest Resource Assess Prod & Serv .........................................1,096 201 895Forestry‐FMIA Eco‐Class System ...............................................1,093 450 643Forestry‐FMIA Enhance Timber Sales .......................................1,424 401 1,023Forestry‐FMIA Forest Improvements ........................................1,447 285 1,162Forestry‐FMIA Forest Road Maintenance .................................613 101 512Forestry‐FMIA Invasive Species .................................................686 162 524Forestry‐FMIA Re‐Inventory for Lands ......................................649 ‐ 649Forestry‐FMIA Relief Payments Timber ....................................556 ‐ 556Iron Range OHV Recreation Area ..............................................52 ‐ 52Iron Range OHV Recreation Area‐ATV ......................................
400 ‐ 400Iron Range OHV Recreation Area‐Virginia ATV ..........................75 ‐ 75Iron Range OHV Recreation Area‐Virginia OHM ........................
125 ‐ 125Iron Range OHV Recreation Area‐Virginia ORV .........................100 ‐ 100Iron Range OHV Recreation Area‐Virginia Snow .......................688 ‐ 688Land & Minerals Land Record System‐FMIA .............................22 22 ‐Land & Minerals Land Record System‐Snow .............................40 40 ‐Land & Minerals Land Record System‐WRA ..............................
178 118 60Land & Minerals Resource Management ..................................400 298 102Land & Minerals‐Iron Ore Co‐op Resource‐MMA .....................
6 6 ‐Land ACQ Fisheries ...................................................................788 506 282Licensing ‐ WRA ........................................................................35 5 30Local Trail Grant LIL‐ILST ‐ 2005 ................................................
833 690 143Local Trail Grant LIL‐ILST ‐ 2007 ................................................3,190 3,162 28Minerals Management Account ................................................200 200 ‐Mining Administration Ferrous Permits ....................................569 569 ‐Mississippi Whitewater Park .....................................................100 100 ‐Moose Trail Grants ....................................................................300 300 ‐New ATV Trail Maintenance ......................................................
1,207 1,147 60Non‐Game Wildlife Program .....................................................251 239 12Operations Support ...................................................................750 750 ‐Park‐Maint, Resource Mgmt, Consv Education .........................
10,127 10,113 14Parks & Recreation Management .............................................100 89 11Public Waters Structure Rules ...................................................272 264 8Safe Harbor Lake Superior ........................................................271 3 268Snow Trail Connect‐Hermantown .............................................315 315 ‐Snowmobile Enforcement Grants .............................................
8,694 8,299 395Snowmobile Grants in Aid Snow ...............................................3,902 3,856 46State Park Operations‐Lottery ..................................................894 796 98State Trails‐Lottery ILST ............................................................
14,699 13,993 706Trails & Waterways Management .............................................291 75 216Trails & Waterways‐ATV Training & Education .........................250 ‐ 250Trails & Waterways‐ATV/OHM 70 Mile Trail .............................118 35 83Trails & Waterways‐Canoe Routes Marking 2007 .....................
1,176 671 505Trails Off‐Highway Vehicle GIA‐ATV ..........................................250 55 195Trails Off‐Highway Vehicle GIA‐OHM ........................................
38

SCHEDULE OF REVENUES, EXPENDITURESAND CHANGES IN FUND BALANCE ‐ BUDGET AND ACTUAL
Budget Actual Variance
BUDGETARY BASISYEAR ENDED JUNE 30, 2009(IN THOUSANDS)
STATE OF MINNESOTA
NATURAL RESOURCES FUND
UNAUDITED
296 5 291Trails Off‐Highway Vehicle GIA‐ORV .........................................3,870 3,870 ‐Transfer ‐ School / University ....................................................330 327 3Water Resources Management ................................................270 270 ‐Zoo Grants‐Lottery ILST ............................................................
98,227 83,534 14,693Total Natural Resources $ $ $
Zoological Board138 138 ‐Departmental Appropriations ................................................... $ $ $
104,405 89,032 15,373Total Expenditures and Transfers‐Out $ $ $
‐ 1,343 ‐
34,221 34,221 ‐Fund Balance, Beginning, as Reported
Excess of Revenues and Transfers‐In Over (Under) Expenditures and Transfers‐Out (22,903) (9,164) 13,739
Prior Period Adjustments
Fund Balance, Beginning, as Restated
Undesignated Fund Balance, Ending
34,221 35,564 1,343
11,318 18,413 7,095
$ $
$ $ $
$ $ $
Fund Balance, Ending 11,318 26,400 15,082$ $ $
‐ 7,987Less: Appropriation Carryover (7,987)
$
$ $ $
1,343
39

SCHEDULE OF REVENUES, EXPENDITURESAND CHANGES IN FUND BALANCE ‐ BUDGET AND ACTUAL
Budget Actual Variance
BUDGETARY BASISYEAR ENDED JUNE 30, 2009(IN THOUSANDS)
STATE OF MINNESOTA
GAME AND FISH FUND
UNAUDITED
Net Revenues and Transfers‐In
Net Revenues
11,370 11,400 30Sales Taxes ................................................................................ $ $ $56,277 58,455 2,178Departmental Services/Licenses & Fees ...................................25,243 25,262 19Federal Revenue .......................................................................
954 790 (164)Investment Income ...................................................................303 391 88Other Revenues ........................................................................
94,147 96,298 2,151Total Net Revenues $ $ $
Transfers from Other Funds
886 886 ‐General Fund ............................................................................ $ $ $
95,033 97,184 2,151Total Net Revenues and Transfers‐In $ $ $
Expenditures and Transfers‐Out
Natural Resources4,920 4,920 ‐Departmental Appropriations ................................................... $ $ $289 253 361837 Population Survey‐Fish .....................................................102 70 32Aquaculture Best Management Practice ...................................652 586 66Deer Bear Management ............................................................
1,429 1,361 68Deer Habitat Improvement .......................................................4,434 3,940 494Ecological Services ....................................................................
41 41 ‐Eco‐Project Wild‐G&F ...............................................................85 54 31Enforce Advanced Hunter Education ........................................
18,804 18,345 459Enforcement NR Laws & Rules ..................................................54,586 54,185 401Fish & Wildlife Management .....................................................
45 45 ‐Fish & Wildlife‐Budget Oversight‐Fish .......................................45 45 ‐Fish & Wildlife‐Budget Oversight‐Wildlife .................................
134 2 132Fish & Wildlife‐Fishing Contest Permits ....................................1,756 1,744 12Fish & Wildlife‐Prairie Wetlands‐Heritage ................................185 185 ‐Fish & Wildlife‐Roadsides for Habitat .......................................10 ‐ 10Fish Master Angler Program .....................................................
913 907 6Fish Trout & Salmon Management ...........................................291 284 7Heritage ‐ ECS Forest Landscape ...............................................
1,167 1,126 41Heritage Enhance‐Enforcement ................................................2,833 2,716 117Heritage Enhance‐Wildlife ........................................................300 300 ‐Improve, Enhance F&W Resources ...........................................652 5 647Land & Minerals Land Record System‐G&F ...............................
1,168 1,168 ‐Land & Minerals Resource Management ..................................620 620 ‐License Surcharge‐Invasive Species ..........................................306 306 ‐License Surcharge‐Venison Program .........................................296 10 286Licensing ‐ Computerized License .............................................
1,194 1,078 116Operations Support ...................................................................35 ‐ 35Operations Support‐Wild Rice Study .........................................
994 989 5Pheasant Habitat Improvement ................................................
40

SCHEDULE OF REVENUES, EXPENDITURESAND CHANGES IN FUND BALANCE ‐ BUDGET AND ACTUAL
Budget Actual Variance
BUDGETARY BASISYEAR ENDED JUNE 30, 2009(IN THOUSANDS)
STATE OF MINNESOTA
GAME AND FISH FUND
UNAUDITED
300 5 295Shooting Facility 7 County Metro ..............................................205 203 2Trails & Waterways Management .............................................128 128 ‐Walleye Stocking .......................................................................
2,889 2,883 6Water Access G&F .....................................................................829 770 59Waterfowl Habitat Improvement ..............................................228 165 63Wild Turkey Management ........................................................
2,022 1,379 643Wildlife Land Acquisition Surcharge 2007 .................................
104,887 100,818 4,069Total Natural Resources $ $ $
104,887 100,818 4,069Total Expenditures and Transfers‐Out $ $ $
‐ 870 ‐
31,355 31,355 ‐Fund Balance, Beginning, as Reported
Excess of Revenues and Transfers‐In Over (Under) Expenditures and Transfers‐Out (9,854) (3,634) 6,220
Prior Period Adjustments
Fund Balance, Beginning, as Restated
Undesignated Fund Balance, Ending
31,355 32,225 870
21,501 24,622 3,121
$ $
$ $ $
$ $ $
Fund Balance, Ending 21,501 28,591 7,090$ $ $
‐ 3,969Less: Appropriation Carryover (3,969)
$
$ $ $
870
41

SCHEDULE OF REVENUES, EXPENDITURESAND CHANGES IN FUND BALANCE ‐ BUDGET AND ACTUAL
Budget Actual Variance
BUDGETARY BASISYEAR ENDED JUNE 30, 2009(IN THOUSANDS)
STATE OF MINNESOTA
ENVIRONMENTAL FUND
UNAUDITED
Net Revenues and Transfers‐In
Net Revenues
49,777 48,551 (1,226)Taxes ......................................................................................... $ $ $33,315 32,206 (1,109)Departmental Services/Licenses & Fees ...................................
807 647 (160)Investment Income ...................................................................930 685 (245)Other Revenues ........................................................................
84,829 82,089 (2,740)Total Net Revenues $ $ $
84,829 82,089 (2,740)Total Net Revenues and Transfers‐In $ $ $
Expenditures and Transfers‐Out
Attorney General278 3 275Departmental Appropriations ................................................... $ $ $
Pollution Control Agency25,009 25,009 ‐Departmental Appropriations ................................................... $ $ $
288 288 ‐Administrative Support .............................................................10,035 10,030 5Air .............................................................................................
200 200 ‐Air Monitoring ...........................................................................126 126 ‐Air Monitoring ‐ Metro ..............................................................241 241 ‐Electronic Waste .......................................................................
7,076 7,053 23Environmental Assistance Program ..........................................139 139 ‐Environmental Loans & Grants .................................................
2,151 2,151 ‐Ethanol, Mining, Economic Development .................................1,244 1,244 ‐Ethanol, Mining, Economic Development Water ......................1,200 1,200 ‐Green Fleets, Fuels, Energy .......................................................7,112 7,108 4Land ..........................................................................................286 286 ‐Metro Landfill Administration ...................................................
1,815 1,815 ‐Metro Landfill Grants ITC ..........................................................5 5 ‐Metro Landfill IDC .....................................................................
2,118 2,112 6Multimedia ...............................................................................14,000 14,000 ‐Score Grants .............................................................................
483 480 3Subsurface Sewage Treatment Systems Program .....................18,669 18,669 ‐Water ........................................................................................
92,197 92,156 41Total Pollution Control Agency $ $ $
Public Safety69 69 ‐Emergency Management‐Environment .................................... $ $ $
Revenue339 332 7Departmental Appropriations ................................................... $ $ $
92,883 92,560 323Total Expenditures and Transfers‐Out $ $ $
Excess of Revenues and Transfers‐In Over (Under) Expenditures and Transfers‐Out (8,054) (10,471) (2,417)$ $$
42
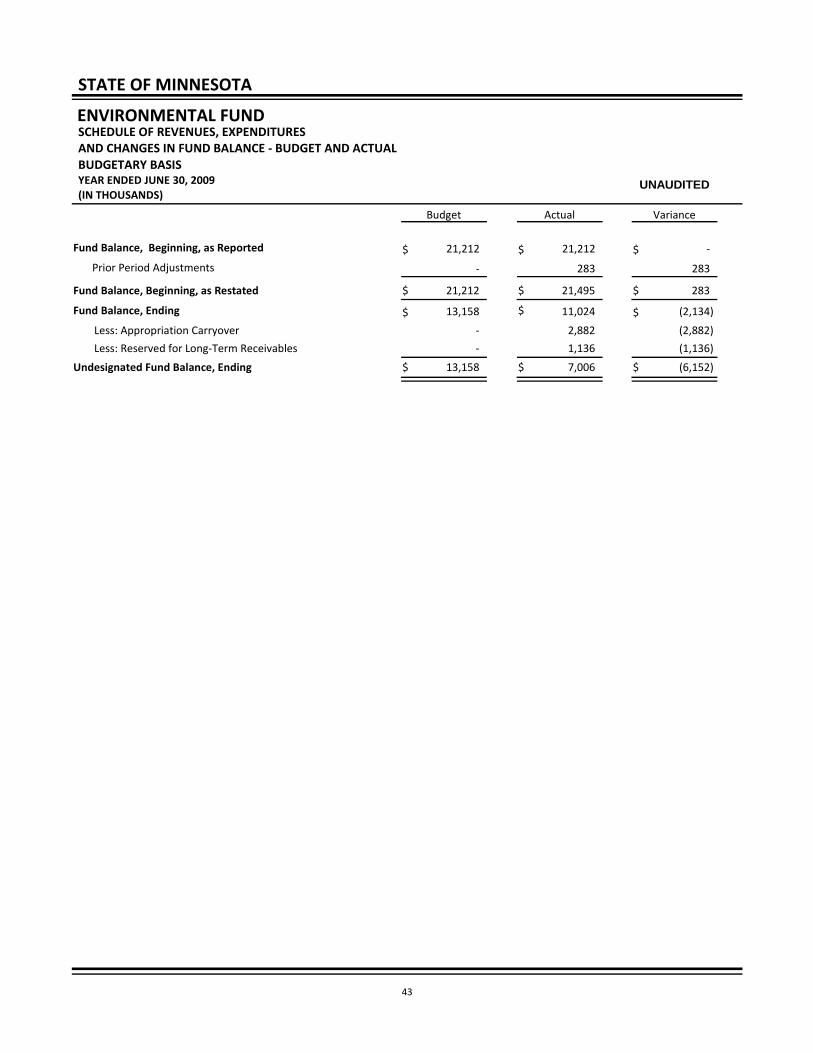
SCHEDULE OF REVENUES, EXPENDITURESAND CHANGES IN FUND BALANCE ‐ BUDGET AND ACTUAL
Budget Actual Variance
BUDGETARY BASISYEAR ENDED JUNE 30, 2009(IN THOUSANDS)
STATE OF MINNESOTA
ENVIRONMENTAL FUND
UNAUDITED
‐ 283 ‐
21,212 21,212 ‐Fund Balance, Beginning, as Reported
‐ 1,136Less: Reserved for Long‐Term Receivables (1,136)
Prior Period Adjustments
Fund Balance, Beginning, as Restated
Undesignated Fund Balance, Ending
21,212 21,495 283
13,158 7,006 (6,152)
$ $ $
$ $ $
Fund Balance, Ending 13,158 11,024 (2,134)$ $ $
‐ 2,882Less: Appropriation Carryover (2,882)
$ $ $
283
43

SCHEDULE OF REVENUES, EXPENDITURESAND CHANGES IN FUND BALANCE ‐ BUDGET AND ACTUAL
Budget Actual Variance
BUDGETARY BASISYEAR ENDED JUNE 30, 2009(IN THOUSANDS)
STATE OF MINNESOTA
REMEDIATION FUND
UNAUDITED
Net Revenues and Transfers‐In
Net Revenues
712 682 (30)Taxes ......................................................................................... $ $ $742 683 (59)Departmental Services/Licenses & Fees ...................................576 299 (277)Investment Income ...................................................................
7,521 14,210 6,689Other Revenues ........................................................................
9,551 15,874 6,323Total Net Revenues $ $ $
Transfers from Other Funds
26,516 25,009 (1,507)Environmental Fund .................................................................. $ $ $ ‐ 4 4General Fund ............................................................................
9,416 8,763 (653)Petroleum Tank Cleanup Fund ..................................................
35,932 33,776 (2,156)Total Transfers from Other Funds $ $ $
45,483 49,650 4,167Total Net Revenues and Transfers‐In $ $ $
Expenditures and Transfers‐Out
Agriculture397 397 ‐MERLA Administration .............................................................. $ $ $
1,126 1,126 ‐Protection Service .....................................................................
1,523 1,523 ‐Total Agriculture $ $ $
Attorney General372 134 238Departmental Appropriations ................................................... $ $ $
Employment & Economic Development2,111 2,111 ‐Departmental Appropriations ................................................... $ $ $
Health281 281 ‐Health Protection ...................................................................... $ $ $
Natural Resources34 34 ‐Departmental Appropriations ................................................... $ $ $
101 53 48Enforcement Field Citation .......................................................
135 87 48Total Natural Resources $ $ $
Pollution Control Agency2,008 2,008 ‐Departmental Appropriations ................................................... $ $ $142 142 ‐Administrative Support .............................................................
38,081 36,907 1,174Land ..........................................................................................3,650 3,650 ‐Petroleum Remediation Administration ...................................
43,881 42,707 1,174Total Pollution Control Agency $ $ $
48,303 46,843 1,460Total Expenditures and Transfers‐Out $ $ $
Excess of Revenues and Transfers‐In Over (Under) Expenditures and Transfers‐Out (2,820) 2,807 5,627$ $$
44

SCHEDULE OF REVENUES, EXPENDITURESAND CHANGES IN FUND BALANCE ‐ BUDGET AND ACTUAL
Budget Actual Variance
BUDGETARY BASISYEAR ENDED JUNE 30, 2009(IN THOUSANDS)
STATE OF MINNESOTA
REMEDIATION FUND
UNAUDITED
‐ 4,246 ‐
8,044 8,044 ‐Fund Balance, Beginning, as Reported
Prior Period Adjustments
Fund Balance, Beginning, as Restated
Undesignated Fund Balance, Ending
8,044 12,290 4,246
5,224 3,521 (1,703)
$ $ $
$ $ $
Fund Balance, Ending 5,224 15,097 9,873$ $ $
‐ 11,576Less: Appropriation Carryover (11,576)
$ $ $
4,246
45

SCHEDULE OF REVENUES, EXPENDITURESAND CHANGES IN FUND BALANCE ‐ BUDGET AND ACTUAL
Budget Actual Variance
BUDGETARY BASISYEAR ENDED JUNE 30, 2009(IN THOUSANDS)
STATE OF MINNESOTA
SPECIAL COMPENSATION FUND
UNAUDITED
Net Revenues and Transfers‐In
Net Revenues
92,845 91,658 (1,187)Taxes ......................................................................................... $ $ $846 3,964 3,118Departmental Services/Licenses & Fees ...................................
4,199 2,139 (2,060)Penalties & Fines .......................................................................2,927 1,346 (1,581)Investment Income ...................................................................1,050 1,821 771Other Revenues ........................................................................
101,867 100,928 (939)Total Net Revenues $ $ $
101,867 100,928 (939)Total Net Revenues and Transfers‐In $ $ $
Expenditures and Transfers‐Out
Administrative Hearings7,926 7,358 568Departmental Appropriations ................................................... $ $ $
Commerce842 739 103Departmental Appropriations ................................................... $ $ $
Labor and Industry72,814 72,814 ‐Departmental Appropriations ................................................... $ $ $6,380 5,863 517General Support Division ..........................................................
65 65 ‐Patient Safe Handling Grants ....................................................7,818 7,621 197Safety Codes & Services ............................................................200 200 ‐Vinland Grants ..........................................................................
10,798 10,474 324Workers Compensation Division ...............................................
98,075 97,037 1,038Total Labor and Industry $ $ $
MMB Non‐Operating200 ‐ 200Workers Compensation Contingent .......................................... $ $ $
Workers Comp Court of Appeals1,807 1,634 173Departmental Appropriations ................................................... $ $ $
108,850 106,768 2,082Total Expenditures and Transfers‐Out $ $ $
‐ 7 ‐
32,342 32,342 ‐Fund Balance, Beginning, as Reported
Excess of Revenues and Transfers‐In Over (Under) Expenditures and Transfers‐Out (6,983) (5,840) 1,143
Prior Period Adjustments
Fund Balance, Beginning, as Restated
Undesignated Fund Balance, Ending
32,342 32,349 7
25,359 23,410 (1,949)
$ $
$ $ $
$ $ $
Fund Balance, Ending 25,359 26,509 1,150$ $ $
‐ 3,099Less: Appropriation Carryover (3,099)
$
$ $ $
7
46

SCHEDULE OF REVENUES, EXPENDITURESAND CHANGES IN FUND BALANCE ‐ BUDGET AND ACTUAL
Budget Actual Variance
BUDGETARY BASISYEAR ENDED JUNE 30, 2009(IN THOUSANDS)
STATE OF MINNESOTA
HEALTH CARE ACCESS FUND
UNAUDITED
Net Revenues and Transfers‐In
Net Revenues
519,900 513,985 (5,915)Taxes ......................................................................................... $ $ $16,963 15,510 (1,453)Departmental Services/Licenses & Fees ...................................5,718 6,552 834Investment Income ...................................................................7,372 10,050 2,678Other Revenues ........................................................................
549,953 546,097 (3,856)Total Net Revenues $ $ $
Transfers from Other Funds
365 365 ‐Miscellaneous Special Revenue Fund ....................................... $ $ $
550,318 546,462 (3,856)Total Net Revenues and Transfers‐In $ $ $
Expenditures and Transfers‐Out
Health346 346 ‐Departmental Appropriations ................................................... $ $ $153 150 3Administrative Uniformity Committee ......................................
1,188 788 400Community & Family Health Promotion ...................................77 77 ‐Community Benefit Standards ..................................................
3,500 3,500 ‐E‐Health Matching Grants .........................................................6,300 6,300 ‐E‐Health Revolving Loans ..........................................................382 382 ‐E‐Health Technology Support ...................................................
1,824 1,824 ‐Federally Qualified Health Centers ...........................................15 15 ‐Health Care Transformation Task ..............................................
152 152 ‐Health Savings & Measurement ................................................710 710 ‐Loan Forgivness ........................................................................350 350 ‐Open Door Health Center .........................................................596 554 42Pediatric Medical Home Project ................................................
6,855 6,772 83Policy Quality & Compliance .....................................................
22,448 21,920 528Total Health $ $ $
Human Services401,118 390,735 10,383Departmental Appropriations ................................................... $ $ $
750 750 ‐Mental Health Grants ...............................................................
401,868 391,485 10,383Total Human Services $ $ $
Legislature178 178 ‐Departmental Appropriations ................................................... $ $ $
MMB Non‐Operating98,000 98,000 ‐Departmental Appropriations ................................................... $ $ $
Revenue1,809 1,739 70Departmental Appropriations ................................................... $ $ $
Revenue Intergovernmental Payments566 566 ‐MNcare Interest on Refunds ..................................................... $ $ $
47

SCHEDULE OF REVENUES, EXPENDITURESAND CHANGES IN FUND BALANCE ‐ BUDGET AND ACTUAL
Budget Actual Variance
BUDGETARY BASISYEAR ENDED JUNE 30, 2009(IN THOUSANDS)
STATE OF MINNESOTA
HEALTH CARE ACCESS FUND
UNAUDITED
University of Minnesota2,157 2,157 ‐Departmental Appropriations ................................................... $ $ $
527,026 516,045 10,981Total Expenditures and Transfers‐Out $ $ $
‐ 268 ‐
261,211 261,211 ‐Fund Balance, Beginning, as Reported
Excess of Revenues and Transfers‐In Over (Under) Expenditures and Transfers‐Out 23,292 30,417 7,125
Prior Period Adjustments
Fund Balance, Beginning, as Restated
Undesignated Fund Balance, Ending
261,211 261,479 268
284,503 286,714 2,211
$ $
$ $ $
$ $ $
Fund Balance, Ending 284,503 291,896 7,393$ $ $
‐ 5,182Less: Appropriation Carryover (5,182)
$
$ $ $
268
48

SCHEDULE OF REVENUES, EXPENDITURESAND CHANGES IN FUND BALANCE ‐ BUDGET AND ACTUAL
Budget Actual Variance
BUDGETARY BASISYEAR ENDED JUNE 30, 2009(IN THOUSANDS)
STATE OF MINNESOTA
WORKFORCE DEVELOPMENT FUND
UNAUDITED
Net Revenues and Transfers‐In
Net Revenues
43,357 41,394 (1,963)Taxes ......................................................................................... $ $ $1,000 756 (244)Investment Income ...................................................................
44,357 42,150 (2,207)Total Net Revenues $ $ $
Transfers from Other Funds
1,450 1,450 ‐Miscellaneous Special Revenue Fund ....................................... $ $ $
45,807 43,600 (2,207)Total Net Revenues and Transfers‐In $ $ $
Expenditures and Transfers‐Out
Employment & Economic Development1,000 1,000 ‐Boys/Girls Club‐WDF ................................................................. $ $ $175 175 ‐Deaf/Hard Hearing‐WDF ...........................................................
7,263 7,061 202Extended Employment‐WDF .....................................................350 350 ‐Interpreters Program‐WDF .......................................................250 250 ‐Lifetrack‐WDF ...........................................................................
1,402 1,376 26Minnesota Youth Program ‐ MPLS‐Learn to Earn ......................3,500 3,500 ‐Minnesota Youth‐WDF ..............................................................1,375 1,375 ‐OIC‐WDF ...................................................................................599 599 ‐St Paul Summer Youth‐WDF .....................................................
45,764 45,764 ‐Workforce Development Fund/ITC ...........................................999 999 ‐Youth‐Build‐WDF ......................................................................
62,677 62,449 228Total Employment & Economic Development $ $ $
Labor and Industry670 670 ‐Labor Standards & Apprenticeship ........................................... $ $ $100 100 ‐Leap Grants ...............................................................................
770 770 ‐Total Labor and Industry $ $ $
63,447 63,219 228Total Expenditures and Transfers‐Out $ $ $
‐ 2,566 ‐
17,730 17,730 ‐Fund Balance, Beginning, as Reported
Excess of Revenues and Transfers‐In Over (Under) Expenditures and Transfers‐Out (17,640) (19,619) (1,979)
Prior Period Adjustments
Fund Balance, Beginning, as Restated
Undesignated Fund Balance, Ending
17,730 20,296 2,566
90 111 21
$ $
$ $ $
$ $ $
Fund Balance, Ending 90 677 587$ $ $
‐ 566Less: Appropriation Carryover (566)
$
$ $ $
2,566
49

50
50