state of new jersey. quick context lawsuit in 2004, revised in 2006 to msa reporting on 250...
Post on 19-Dec-2015
216 views
TRANSCRIPT

State of New Jersey

Quick Context
• Lawsuit in 2004, revised in 2006 to MSA
• Reporting on 250 measures, including placement stability
• Started by “focusing on fundamentals”– Manageable Caseload Size – 1 to 5 ratio of supervisors to staff– Revised training for workers and supervisors– Board rate comparable to USDA cost of living– Resource Family Workers to provide more support to Resource Families

Case Practice Model
• Implementation of the “case practice model” in 2007
• Immersion training in each of our offices
• A focus on family engagement and a strength-based approach to our work
• Staying focused on safety, permanency & well-being
• More info at www.state.nj.us/dcf

“Placement Stability”
• One of many metrics focusing on improving the experience of children in out of home placement
• But can’t separate it from also thinking about keeping more children home, safely, when possible
• So lets look at what has happened to NJ’s out of home placement population
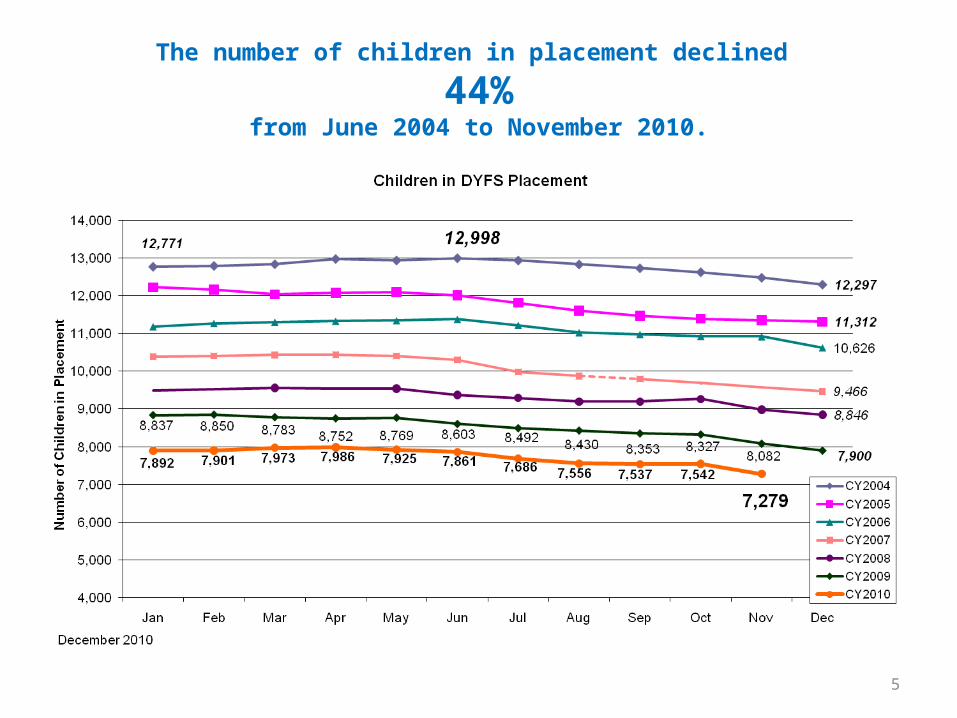
The number of children in placement declined
44%from June 2004 to November 2010.
5


Placement Population• Decreased initial entrances to placement
• 2003 – 2.8 per 1,000 5,981 children• 2009 – 1.9 per 1,000 3,989 children
• Reduced the median time in placement• 2003 – 12.4 months 2009 – 9.6 months
• Increased exits to reunification as well as adoption
• Decreased re-entry rates2009 – 12% re-entering within 6 months2003 --16% re-entering within 6 months
• Decreased use of shelters

Decreasing Lengths of Stay in Placement
Age Entry Median LOS Change
Under 1CY2003 21.0
-17%CY2009 17.4
1 to 5CY2003 11.9
-28%CY2009 8.6
6 to 12CY2003 12.2
-22%CY2009 9.5
13 to 17CY2003 7.1
-27%CY2009 5.2

And our data capacity allows us to look locally. Initial placement rates in Essex (Newark & surrounding
communities) have declined significantly - 49%.

Increasing the Pool of Resource Families helped…..
• Increased use of family based settings• In 2003, 83% of initial placements• In 2009, 87% of initial placements
• Increased our ability to keep sibs together
• Kept our maltreatment rate in foster care low2003 – 0.52% 2009 – 0.16%
• Kept our placement stability high – 85%

We now place siblings together much more often – a combination of improved placement practice & targeted
resource home recruitment

Supporting our Resource Homes
• Board rates tied to cost of living– Base rate in 2006 was $497-$609– Base rate today is $713-$838
• Child Health Units– Preplacement exams– Comprehensive exams within 60 days– Follow up care coordinated

Placement Stability
• The number of children initially entering placement in a year has dropped:
2003 - 5,981 2009 – 3,989
• The percentage having 2 or less placements in the first year has increased:
2003 - 82% 2009 – 85%
• The number and percent having 3 or more placements in the first year:
2003 – 1,077 children/ 17 % 2009 – 596 children/15%

What does the future hold
• We are concerned about the counter-balancing of measures
• Will having “right-sized” our out-of-home population mean that some measures will start to go in opposite direction because…
• Children in placement are those who really need to be there, and thus the model, services, expectations need to re-focus???

On a local level, you can see that as the population in care concentrates to the children at highest risk, outcomes can
change. Bergen’s infant placement rate has dropped but the length of stay
for infants in care has increased.

DCF Office on Quality
• We need to continue to monitor our data – Use it to know if we are sustaining good practice– Use it to know where further examination is warranted– Set targets for future performance
• Use tools to dig deep for analyzing what is happening– Qualitative Reviews– Child Stat on System Issues– CFSR